1. Introduction
Intermagnet is a global network of stations observing the Earth's magnetic field for more than 30 years. The aim of the Intermagnet project is to provide the global scientific community with high-quality magnetic field observation evidence in different geographical locations of the Earth, for the possibility of different magnetic observatories data joint processing. The network of magnetic observatories providing Intermagnet with data is expanding.
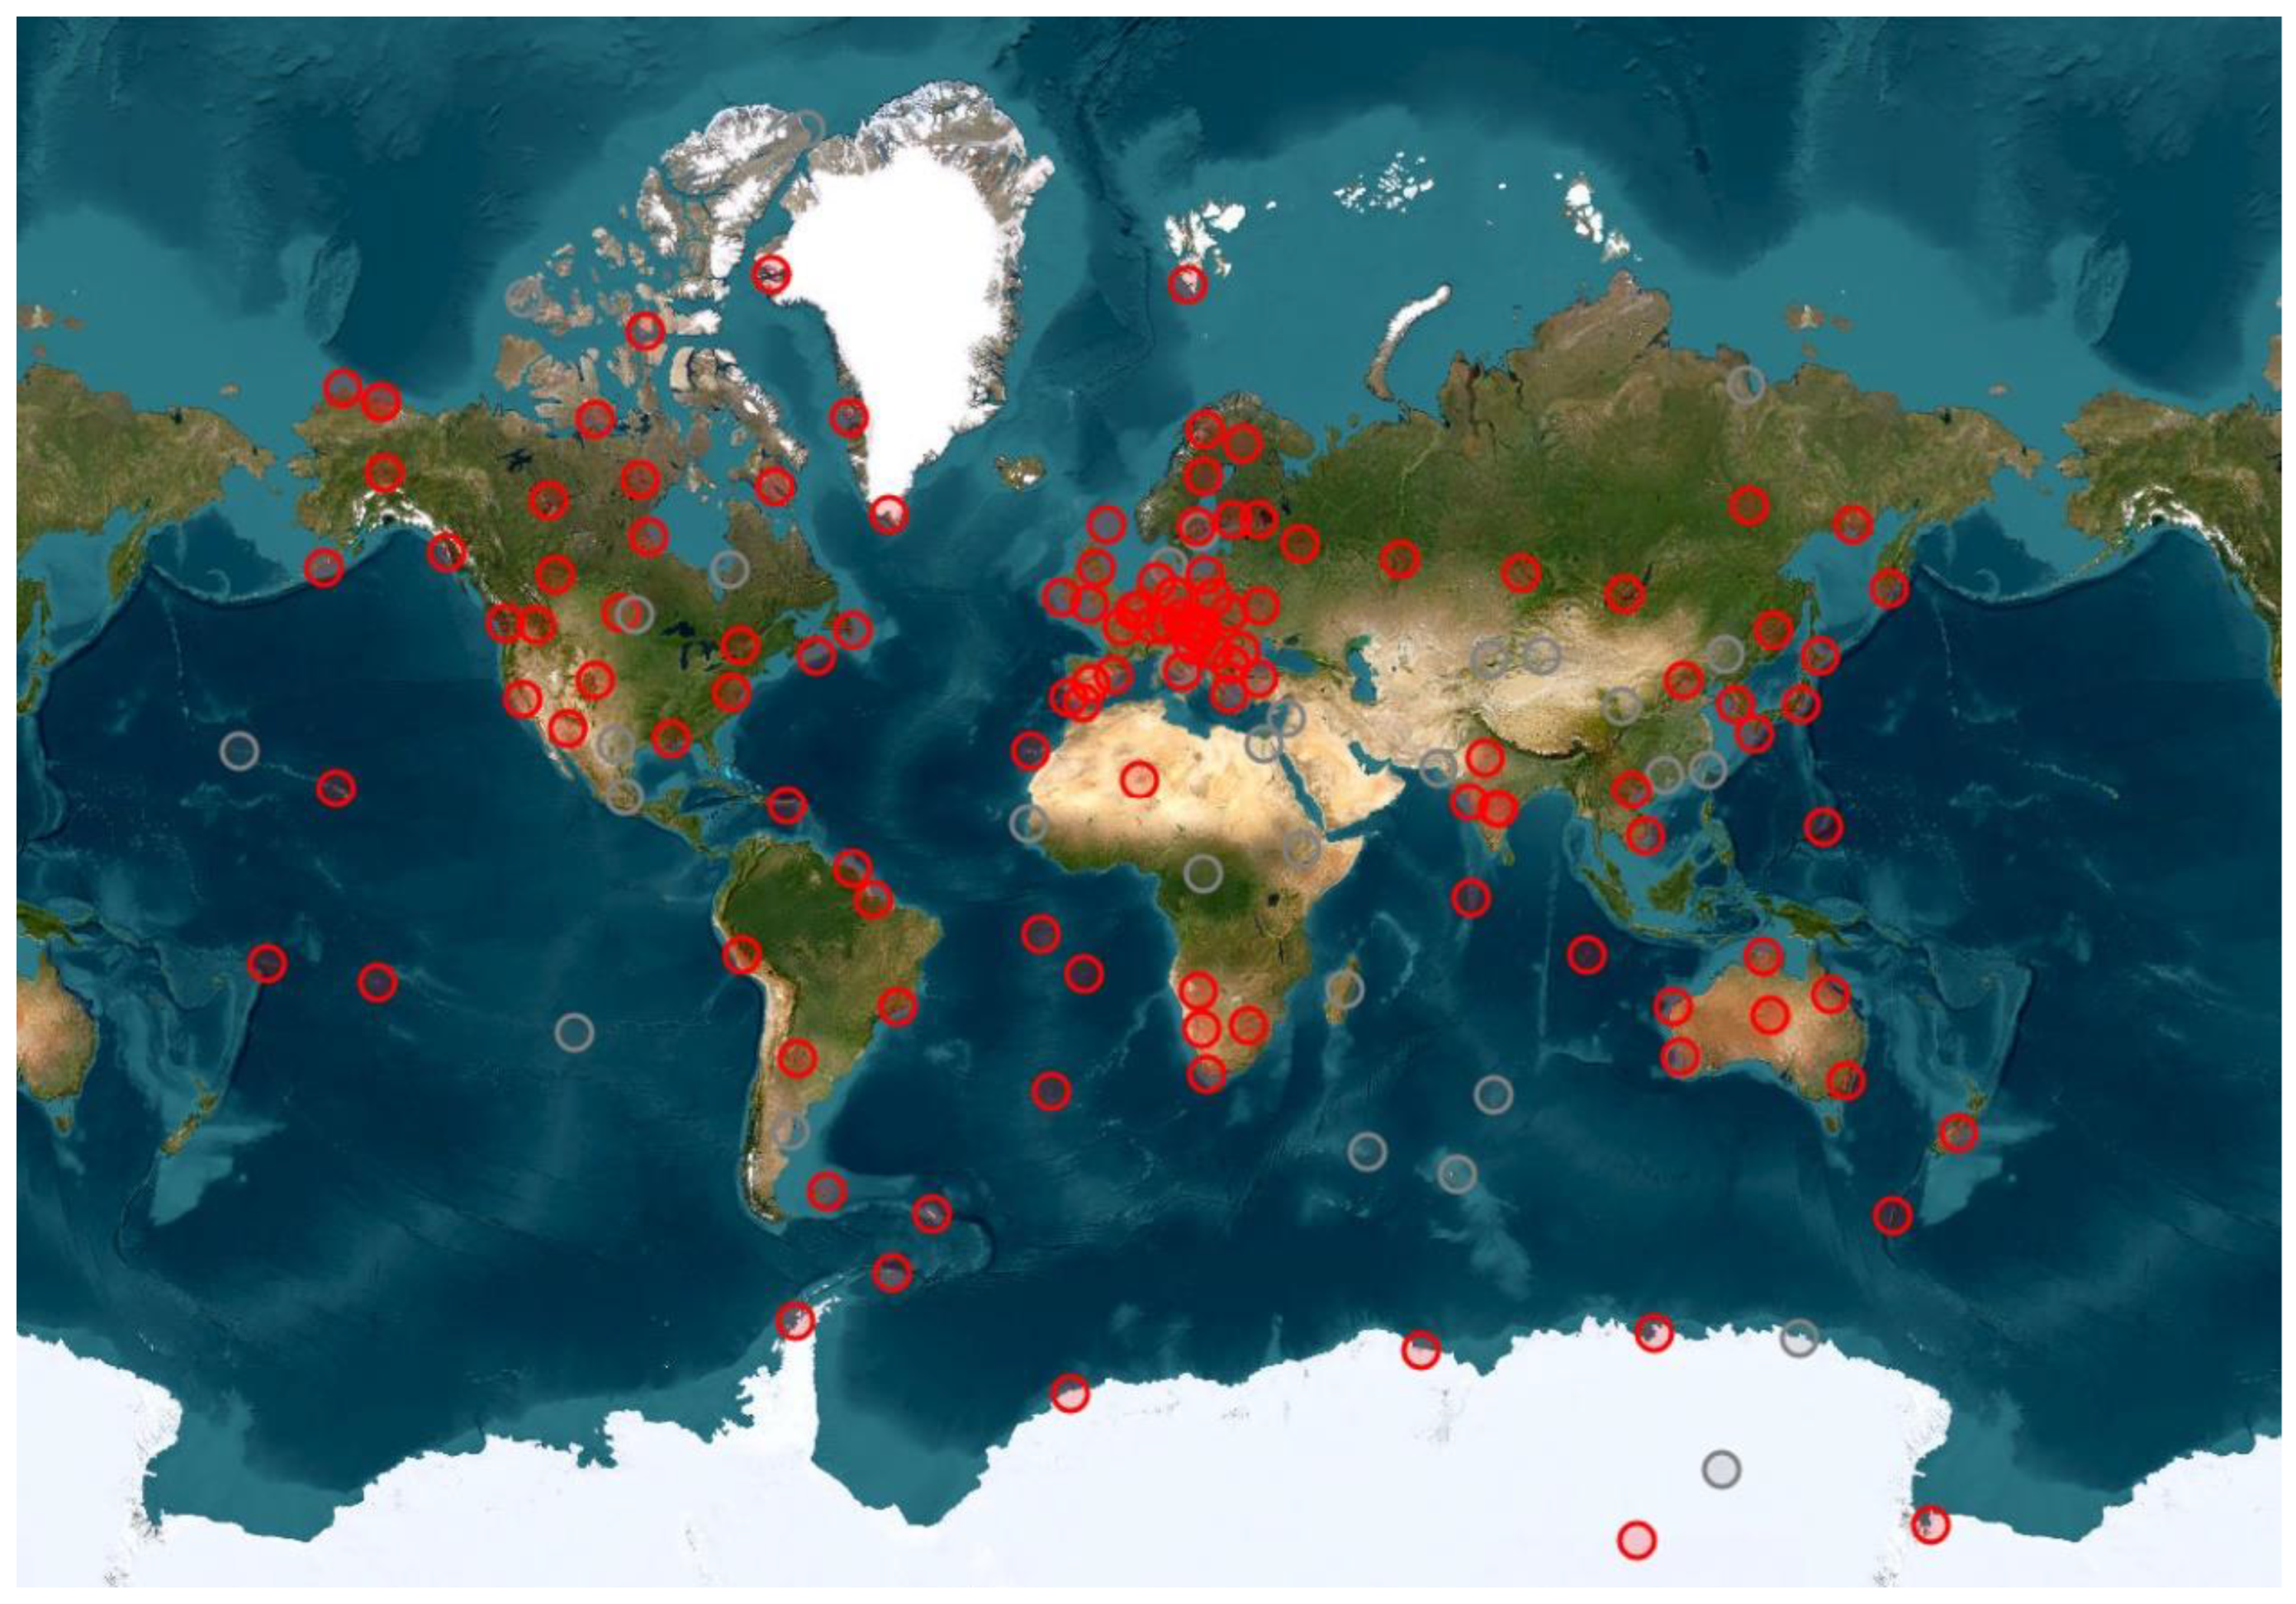
Figure 1 shows the current geolocation of magnetic observatories [
1], covering the entire surface of the globe from the Arctic to Antarctica.
Intermagnet is attentive to the quality of the data received from the observatories involved in the project. There is a three-step data quality control procedure before this data is published. But not all data quality indicators can be verified. In particular, it is difficult to verify the accuracy of linking the measured data to a unified time.
Article [
2] reports the case, that occurred on March 7, 2013 at the Lanzhou Magnetic Observatory, China, of pulse per-second oscillator failing, controlled by GPS which remained unnoticed for a long time. Log file clocks was slowly shifting in time and was 27 seconds behind in 6 months. After adjusting the time on April 2, 2014, the lag accelerated to 2 seconds daily. The operation of the GPS-controlled oscillator was restored only on July 8, 2014.
During the joint postprocessing of data from magnetic observatories of the Intermagnet network in the time interval preceding the magnetic storm commencement authors [
3] revealed the fact of mutual desynchronization of data from a number of observatories which negatively affected the results of data processing. The results of the joint processing of data of 84 magnetic observatories transformed to a unified ecliptic coordinate system have been reported on EGU24 conference. The aim of the work was the investigation of the initial stages of magnetic storms development.
There are different ways of joint data processing of magnetic observatories to investigate different phenomena. Presentation has been reported [
4], that in order to determine the intensity and strength of solar influences, it is important to deduce geomagnetic baselines that extract part of solar effect from the other overlapping sources in geomagnetic field signals. A derivation method based on standard algorithms for determining the geomagnetic baseline for data recorded at mid-latitudes has been described. In more detail the method is described in the article [
5].
In [
6], the effect of interplanetary coronal mass ejection on the Earth's magnetic tail was investigated. The effects of current sheet stretching were considered both after the SSC phase and during the main phase, which is necessary for an accurate description of the behavior of the magnetosphere during geomagnetic activity at solar events.
In order to assess the effectiveness of observations of auroral kilometer radiation (AKR) [
7], as an indicator of the dynamics of sub-storms, data from the Wind satellite were jointly processed with data on sub-storms obtained from a network of ground magnetometers.
To solve the problem of predicting the aurora and its location [
8], machine learning based joint processing has been proposed. A search was carried out for the dominant periodicity in the recordings of the Earth's magnetic field from the SuperMAG magnetometer station network. Also, the use of machine learning has been proposed for the purpose of predicting changes in the geomagnetic main field and its secular variations [
9]. As test datasets for machine learning the hourly averaging of magnetic observatory data was used.
Presentation [
10] has been reported on the proposition for using spectral processing (Singular Spectrum Analysis) to detect and reconstruct very weak geomagnetic signals hidden in noise. For this purpose, geomagnetic field quasi-periodic variations were investigated using records of geomagnetic observatory in the time interval from 1960 to 2009.
In a work close to the direction of this research [
11], the question of how solar wind energy flows through the Earth's magnetosphere, how it is transformed and how it is distributed was considered. The paper notes that ground magnetometers are an addition to satellite instruments, providing high resolution in time and space.
2. Materials and Methods
Intermagnet network magnetic observatories continuously register three components of the geomagnetic field in the directions: true north (X), east (Y) and the center of the Earth (Z). Magnetic observatories local coordinate systems are individual for each geographical location. In order to better understand the events occurring in the magnetosphere, various transformations of the coordinate systems of local observatories were attempted during their joint processing.
In [
12], eight different orthogonal and non-orthogonal magnetic coordinate systems used in joint data processing are described in detail: centered dipole; eccentric dipole; solar magnetic; geocentric solar magnetic; corrected geomagnetic; Quasi-Dipole; Modified Apex coordinates; dip latitude. For the purpose of analyzing ionospheric currents with magnetometers, it was proposed [
13] to transform the components of the geomagnetic field into an adjusted geomagnetic system.
Since the Sun is the main source of disturbance of the magnetosphere, for a detailed study of the effect of the solar wind and coronal mass ejections (CME) on the magnetosphere, it was proposed to transform the local coordinate system of each magnetic observatory into a unified ecliptic coordinate system in the direction towards the Sun. The local coordinate systems of the magnetic observatories were transformed into an ecliptic coordinate system as follows. The Z axis was directed towards the Sun, the X axis was directed towards the north pole of the ecliptic plane, and the Y axis, located in the plane of the ecliptic, was directed tangentially to the orbit of the Earth around the Sun (
Figure 2). Thus, ground magnetic observatories were combined like antennas in phased antenna arrays to monitor the dynamics of magnetic variations and determine the directions of the sources of disturbances. At the same time, the constant component of the magnetic field, individual for each local observatory, was removed before the coordinate transformation in order to extract only common variations of magnetic field that is of cosmic origin.
The constant components were calculated using the moving average method, for each component of the magnetic field separately, according to 1440 minute measurements for the previous day. These average values were subtracted from the original data series. After the constant components were excluded from the magnetograms, in order to increase the signal-to-noise ratio, the magnetograms of various magnetic observatories were averaged. This method makes it possible to increase the reliability, stability and informativeness of the measurement results, since, in fact, a coherent integration of weak signals of cosmic origin was performed with their representation in the form of a single magnetogram. An improvement in the signal-to-noise ratio was expected by a factor of M, where M is the number of observatories whose data were summarized and averaged.
For the research we used the Intermagnet network database for 2005. The choice of the year was not fundamental, but the research group of authors simultaneously investigated the issue of the mutual relationship of variations in the Earth's magnetic field with the seismicity of the Northern Tien Shan region, data on which were available for 2005. From the database of Intermagnet network for 2005, data of 90 magnetic observatories were chosen, including the observatory of Almaty (Alma-Ata “aaa”), where the research was carried out.
Because of found data missing in the files of 6 observatories, significantly distorting the averaged results, the decision was made to not carry out averaging for all observatories.
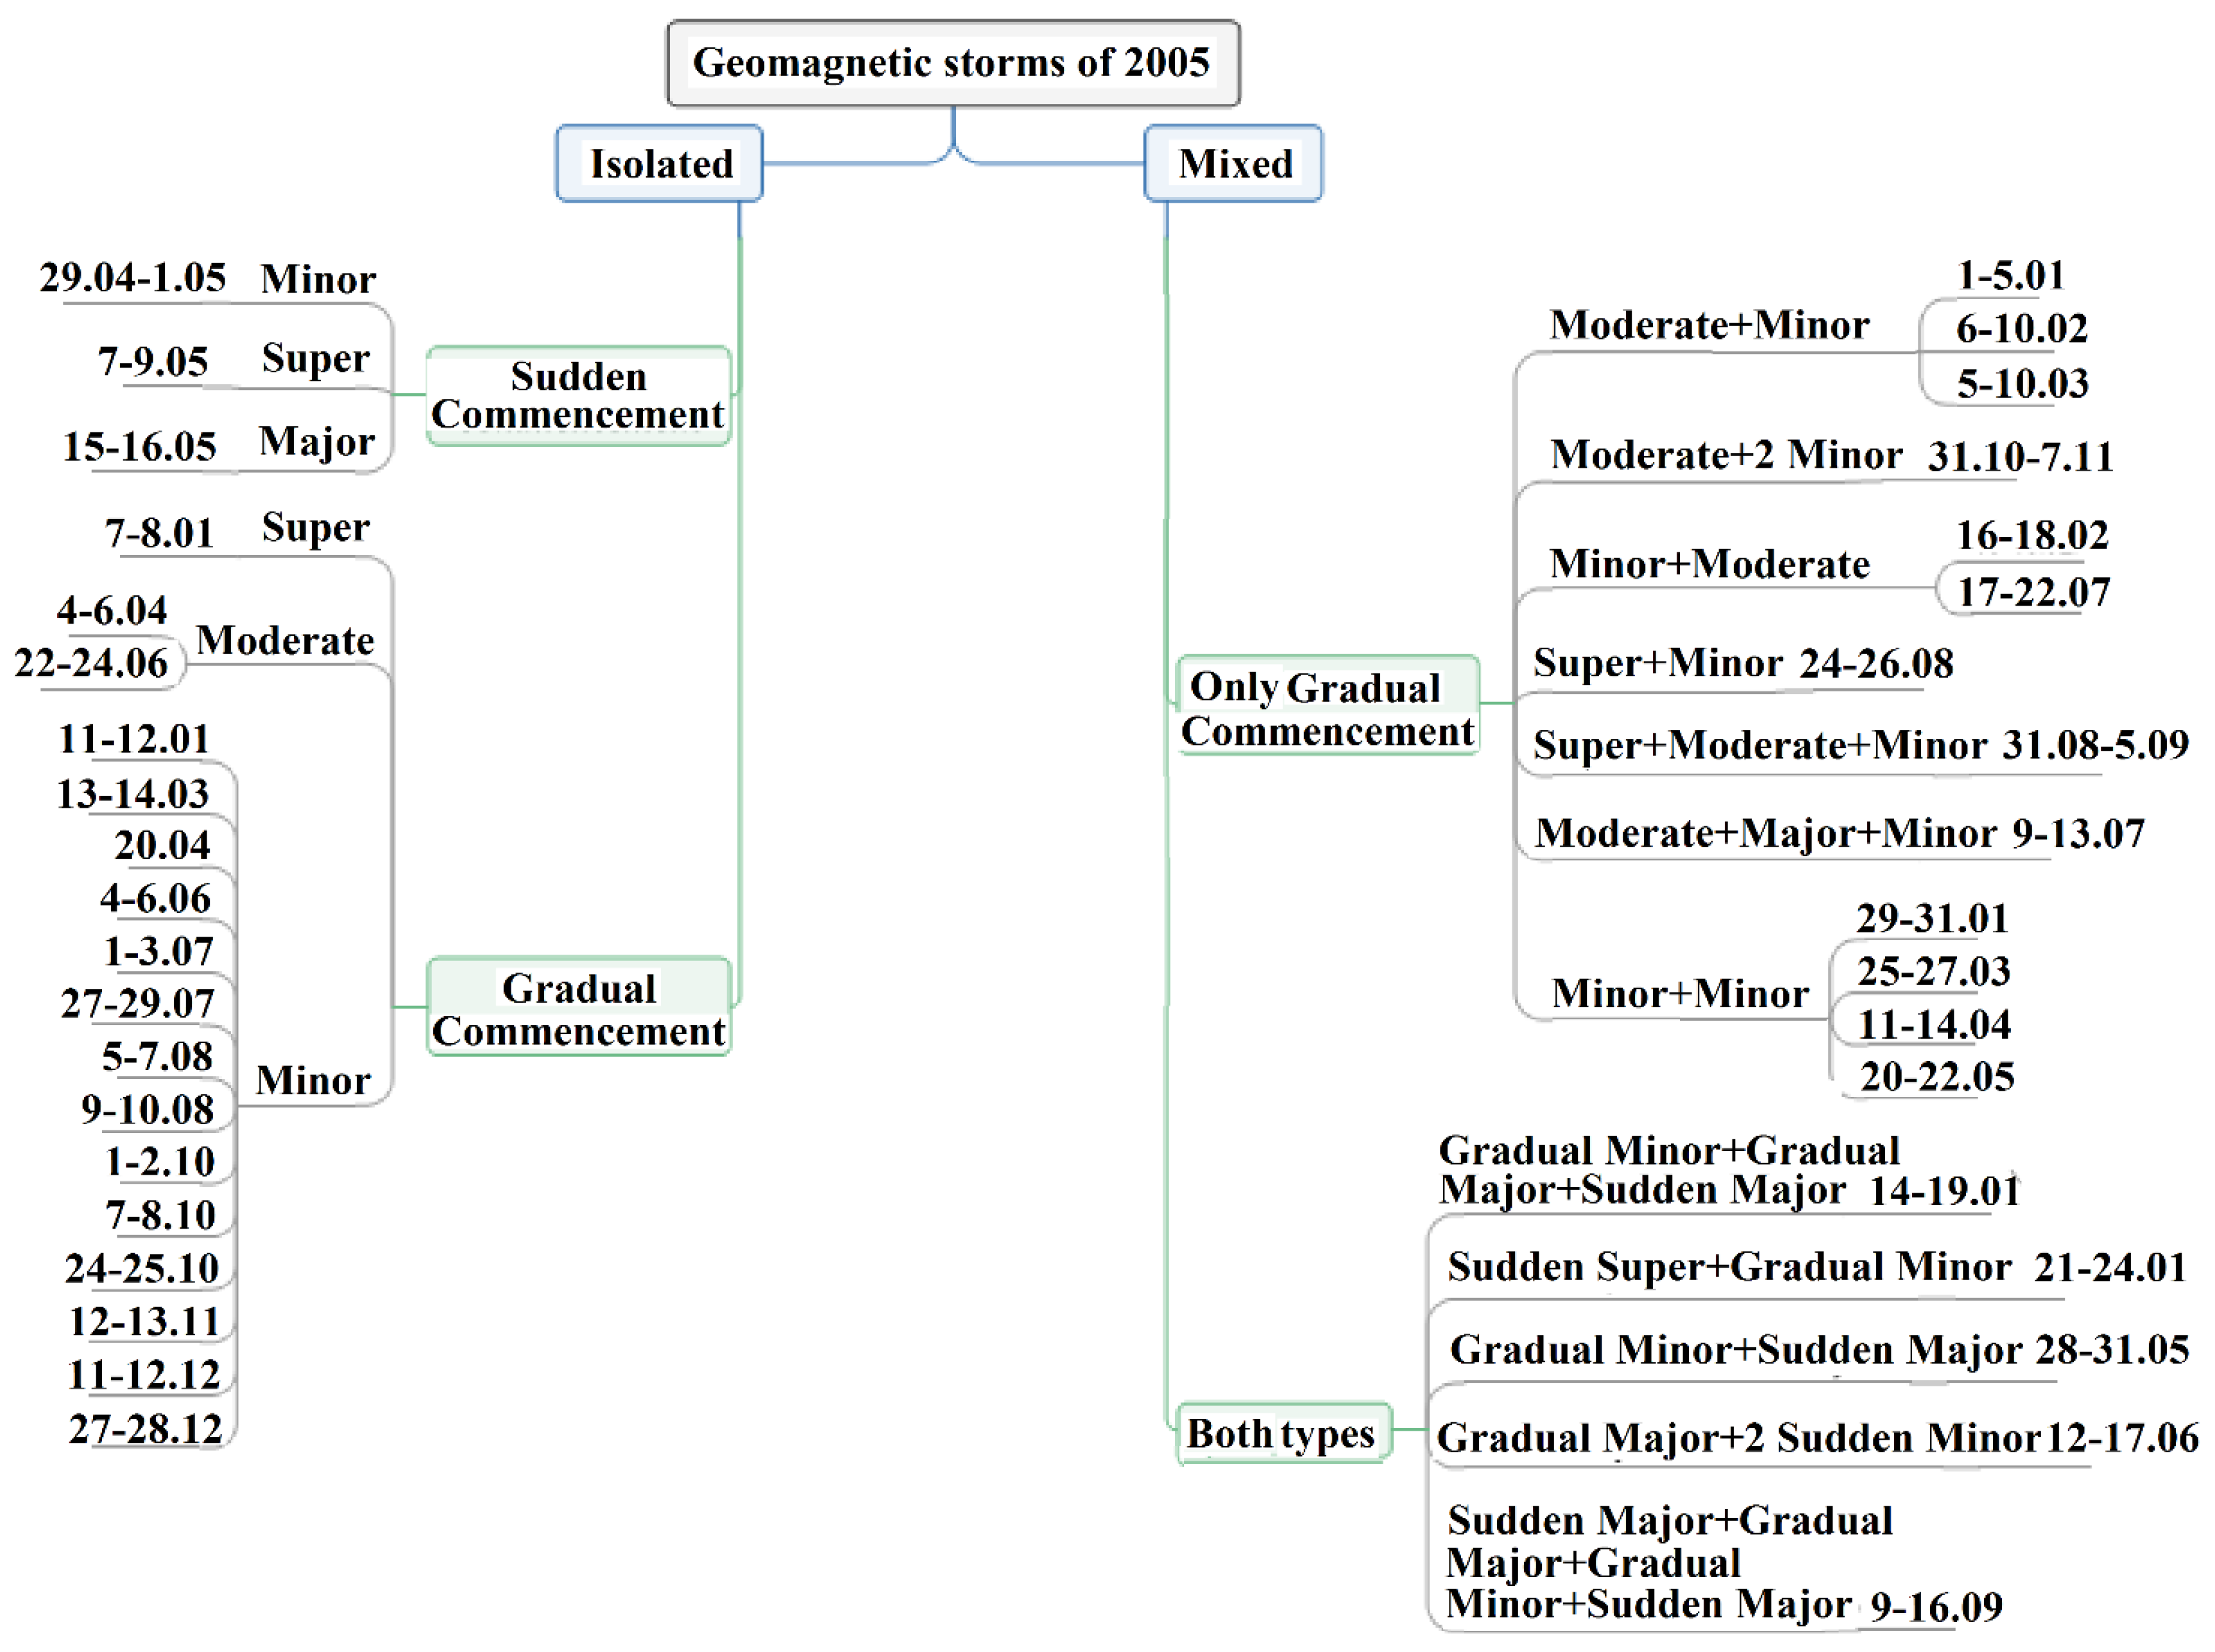
The increased informativeness of the averaged magnetograms of 84 stations after converting the local coordinates of the magnetic observatories into a unified ecliptic coordinate system allows us to reveal the features of various magnetic storms that were inaccessible before the conversion. Different types of magnetic storms for 2005 were considered.
Figure 3 outlines the investigated magnetic storms.
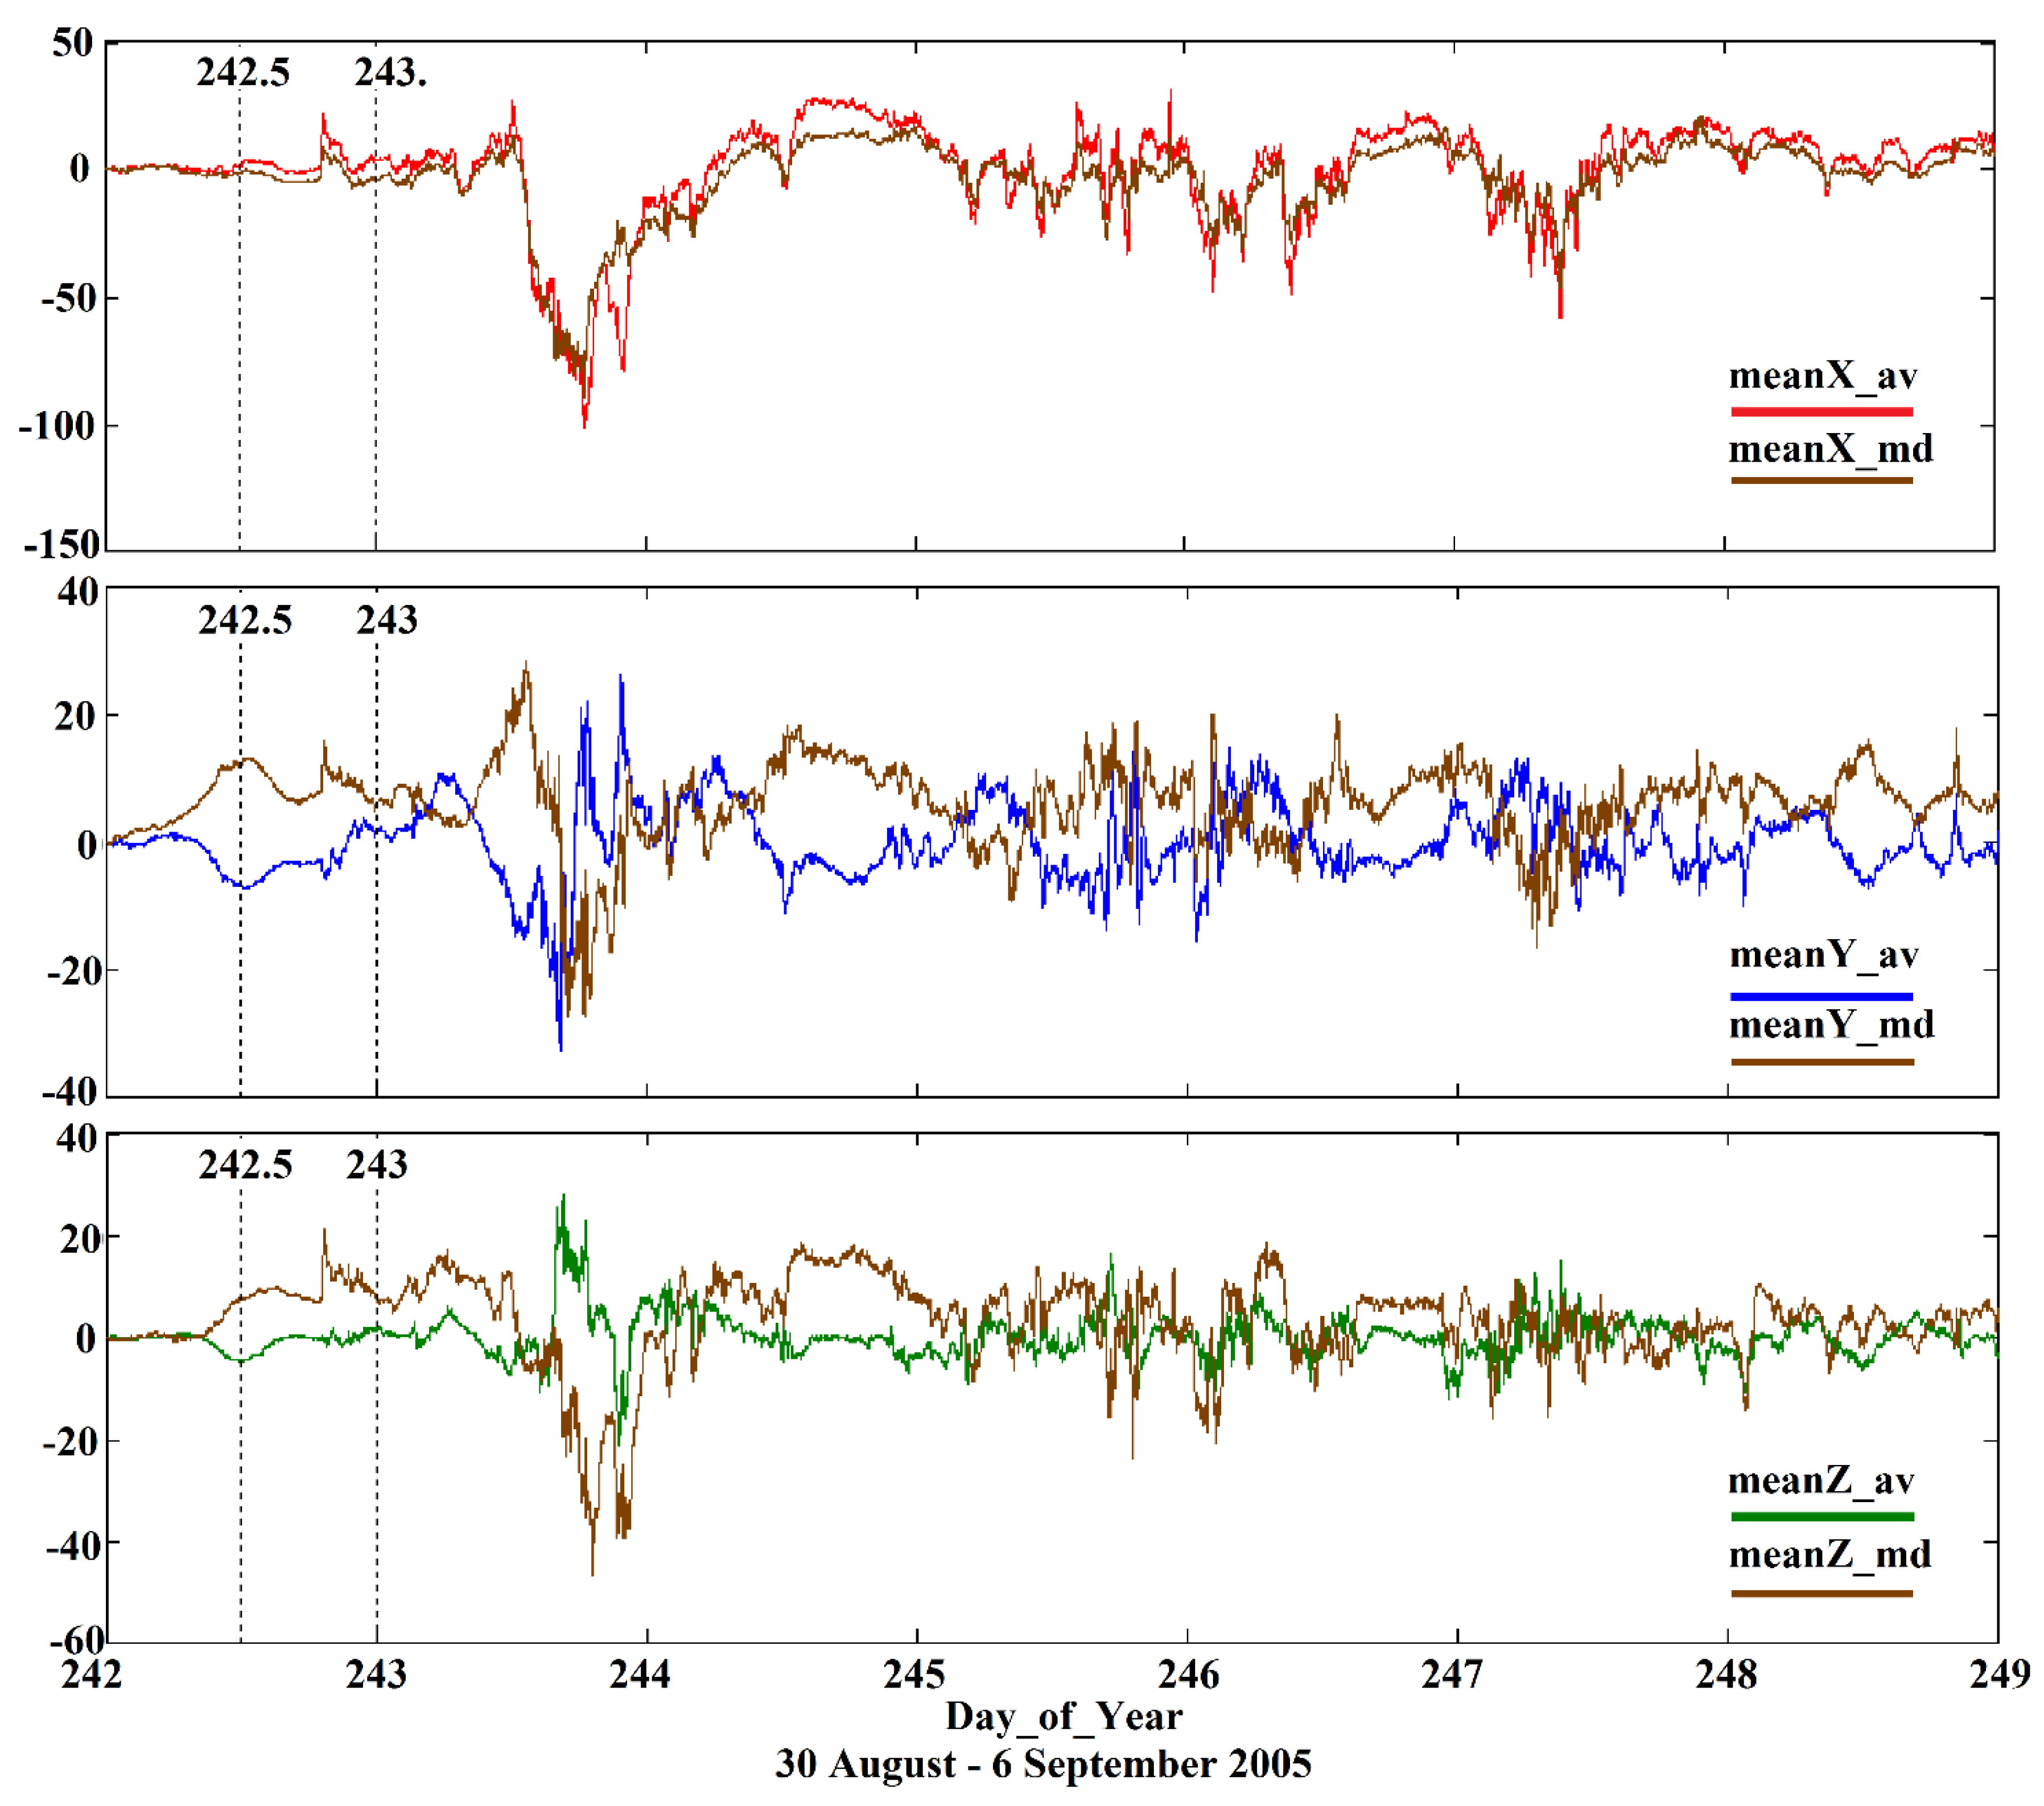
Figure 4 shows magnetograms of variations of the magnetic storm that took place from August 31 to September 5, 2005, averaged over 84 magnetic observatories before (mean_av) and after (mean_md) coordinate system transformation. The dates below the graphs represented in days relative to January 1, 2005.
After the coordinate transformation, a sharp increase in field intensity was clearly highlighted in the second half of 242 days of 2005 (August 31). Most observatories registered a magnetic event, the vector of which (in converted coordinates) was the same, despite the fact that the observatories are located in very different geographical locations from the Arctic to Antarctica. This means, most likely, that it was an external magnetic field, the source of which was quite far away, compared with the diameter of the Earth.
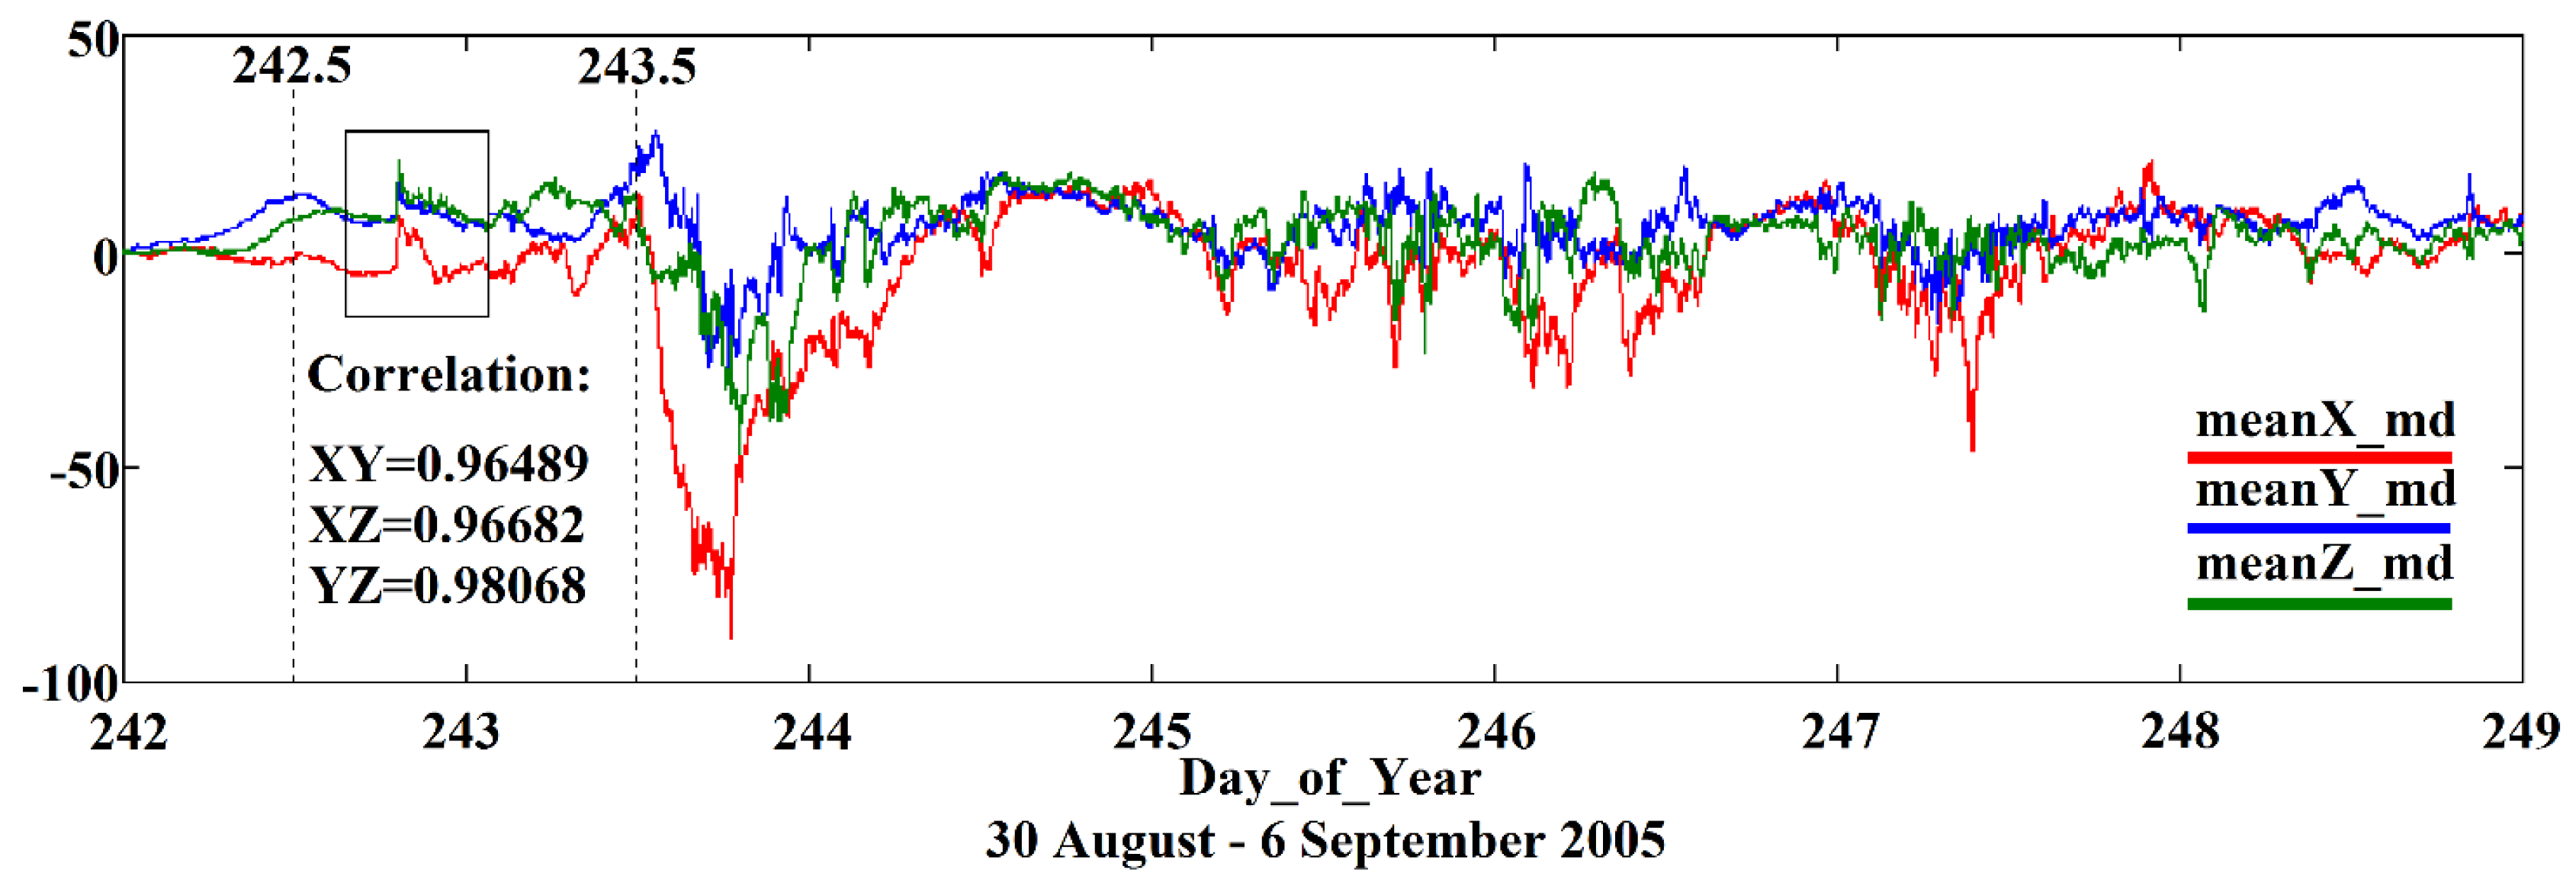
Changing the initial time by 1 hour time interval, mutual correlation coefficient between the magnetograms of the X, Y and Z components of the averaged variations of the magnetic field was calculated. The duration of the correlation interval also varied with increments of 1 hour. In a 2-hour time interval, starting at 18:00 UTC on August 31, the cross-correlation coefficients reached their maximum values (
Table 1). The highlighted correlation interval is shown in
Figure 5.
Taking the selected data interval of the Alma-Ata observatory (“aaa”) as a reference and shifting the reference interval within ± 15 minutes, the calculation of the mutual correlation coefficients with similar data intervals of other observatories was performed. At positions where the correlation coefficient reached its maximum value a time shift was revealed between the data from different observatories.
3. Results
The results of the correlation analysis are presented in
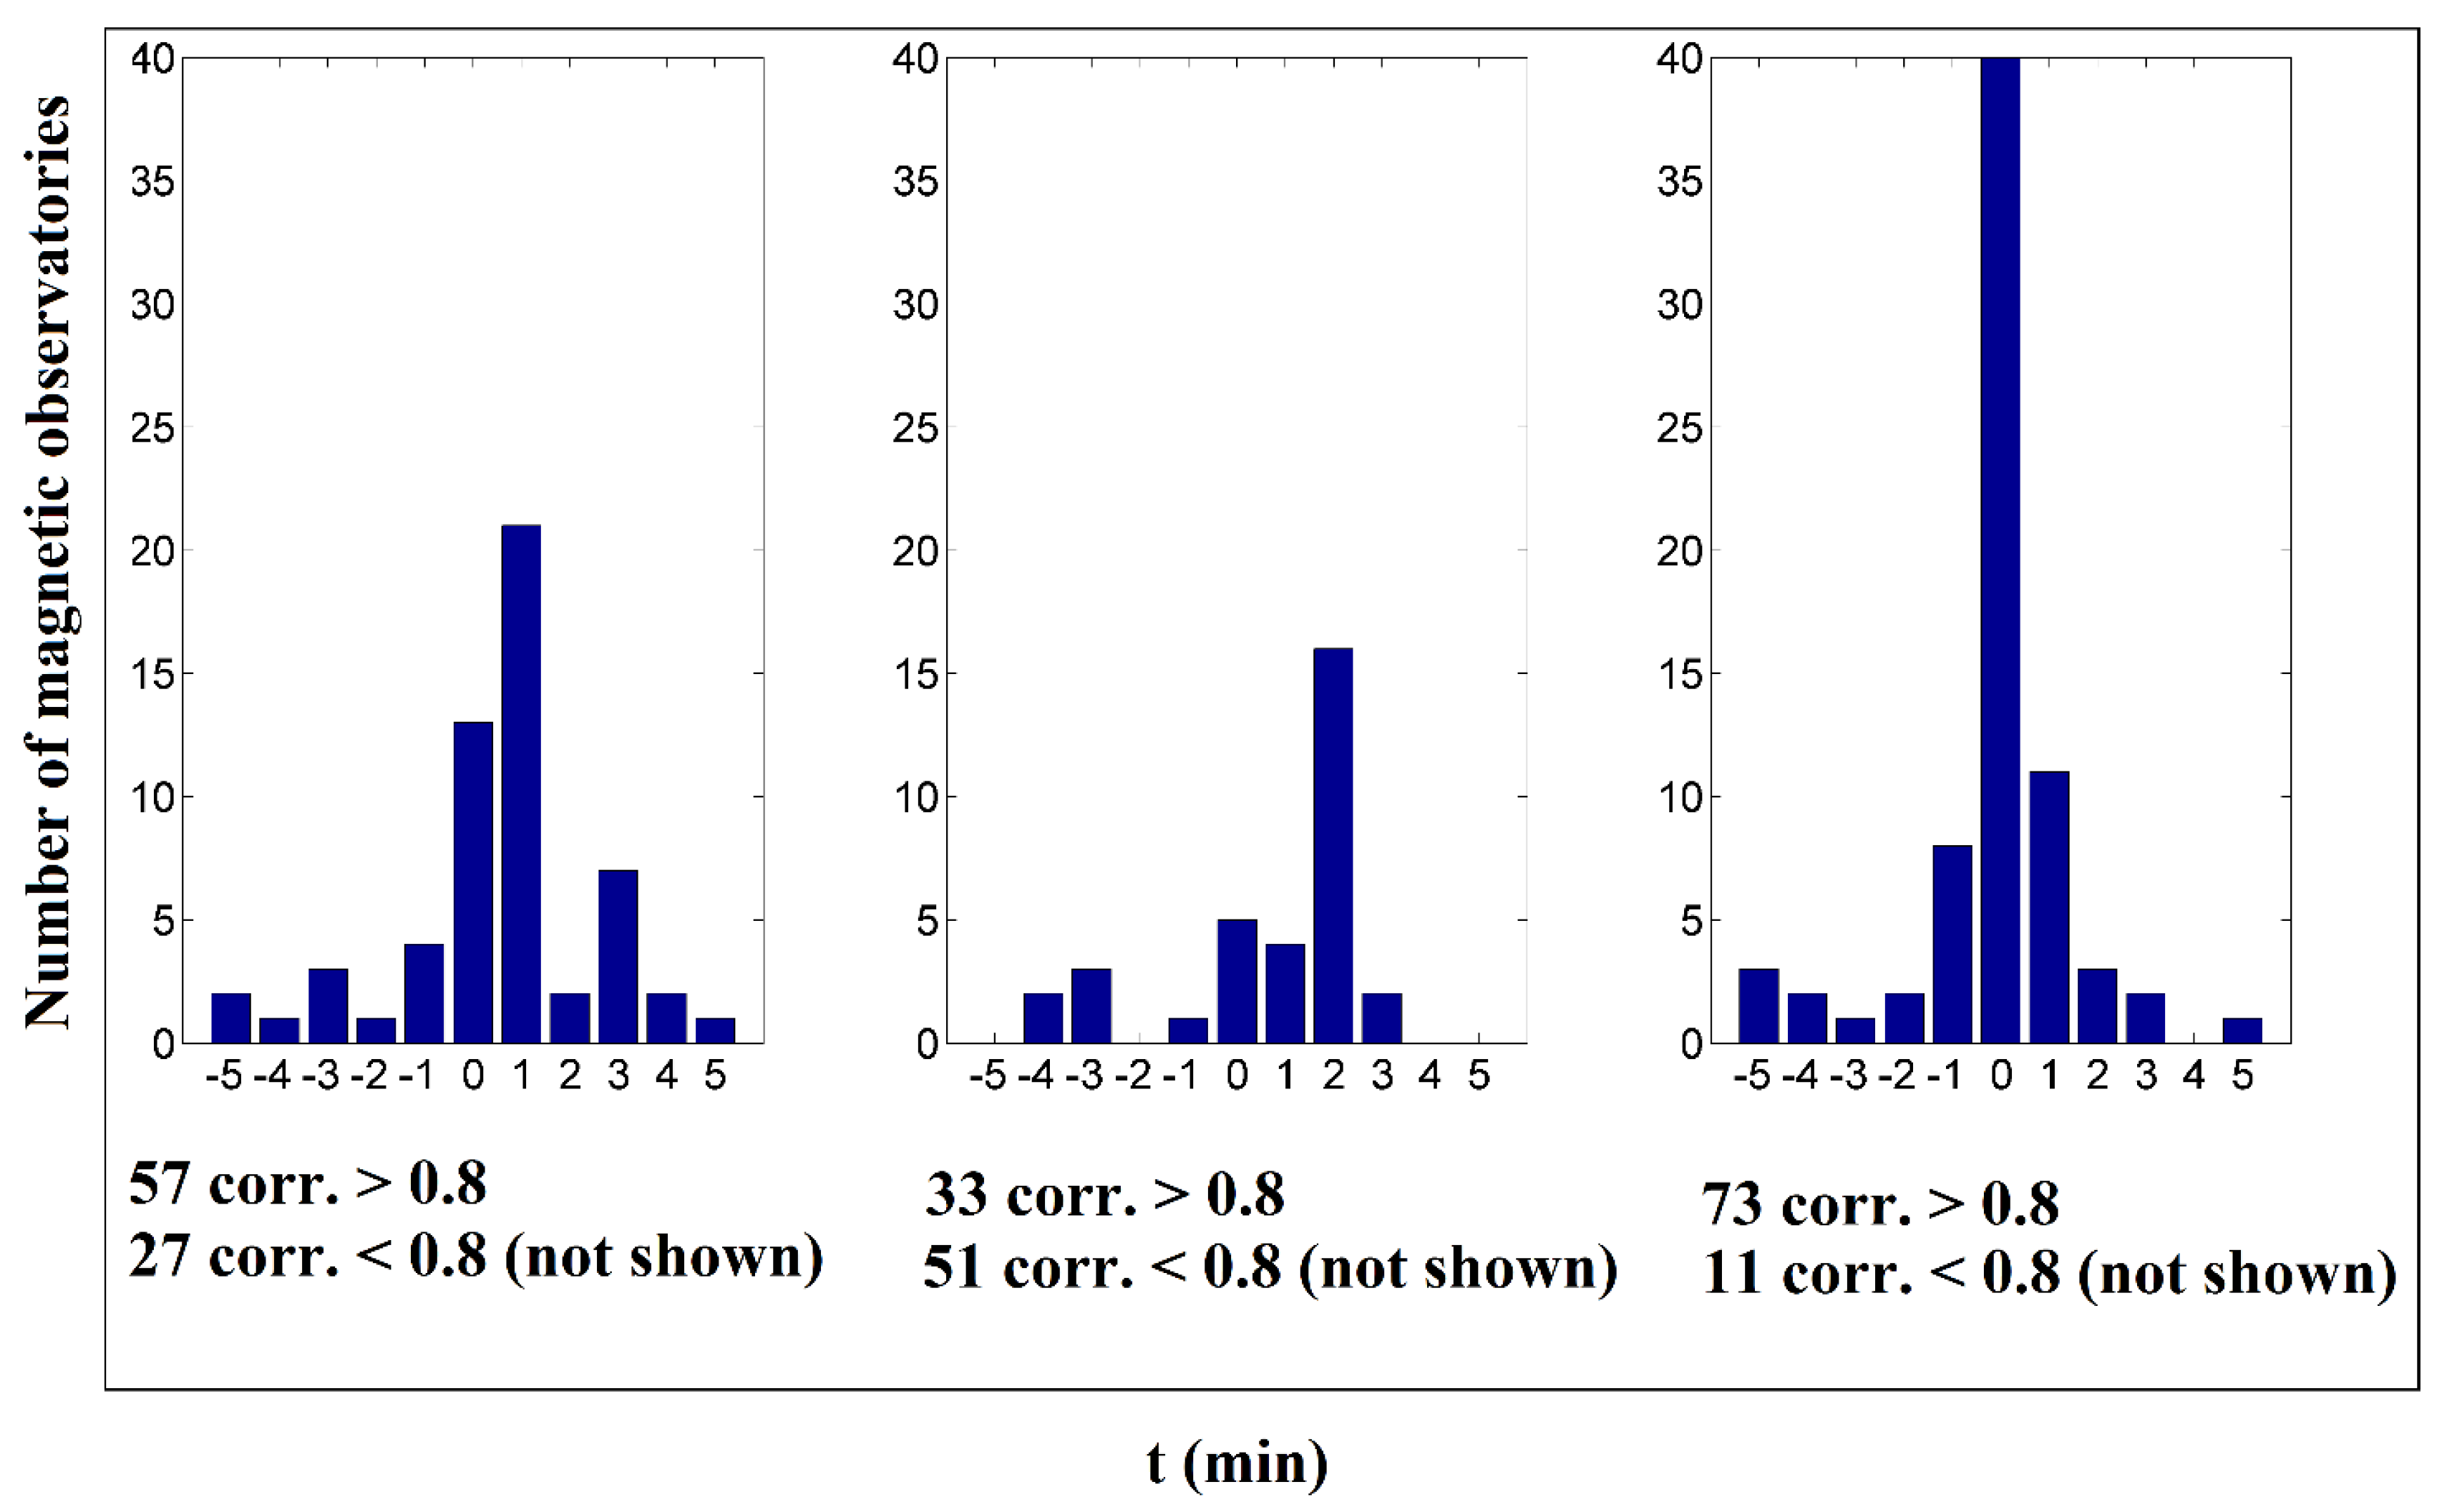
Figure 6 in the form of histogram. The figure shows the number of observatories where the correlation coefficient reached values above 0,8 within an interval of ± 5 minutes. 57 stations with a correlation above 0,8 out of 84 observatories were revealed for the X component, 33 stations with a correlation above 0,8 out of 84 observatories were revealed for the Y component, and 73 stations with a correlation above 0,8 out of 84 observatories were revealed for the Z component. A relatively large number of observatories whose correlation coefficient with the reference (observatory "aaa") did not reach 0,8 for the Y component can be explained by a smaller amount of variation along this coordinate (
Figure 5) and some difference in the form of variation for the Y component of the observatory "aaa" from the average value (the reason of unlucky choice of reference). Due to the best signal-to-noise ratio with the reference variation, for the purpose of revealing discrepancy between the series of recorded data over time the Z component was selected.
The fact that there is a time shift in the operation of magnetic observatories has revealed a problem that may cause errors in the interpretation of the joint processing of magnetic field registration results of different observatories.
Table 2 lists the location coordinates of 41 observatories, whose correlation coefficient was higher than 0,9 for the Z component with a time shift of ± 0 minutes relative to the Alma-Ata observatory. A time shift in the range ± 1 minute for the Z component was found for 52 observatories out of 84 (that is 62% of the total) with a correlation coefficient above 0,9.
It should be noted that the observatories of both the northern hemisphere and the southern hemisphere are presented in the table data list.
Table 3 lists the correlation coefficients for magnetic observatories, the data of which are used to calculate the Dst index. There were data missing in the San Juan Observatory (sju) data for this month, and this data was not used for joint processing.
As follows from the data listed in
Table 2 and
Table 3, the observatories that recorded the event on August 31, 2005 in the same way were located in very different geographical locations, which confirms the assumption that the source of the registered variation of the magnetic field was in space, far enough from Earth. With a more careful approach at choosing a reference, the correlation coefficients would be slightly different, but this would not affect the conclusion about the interval of the time shift.
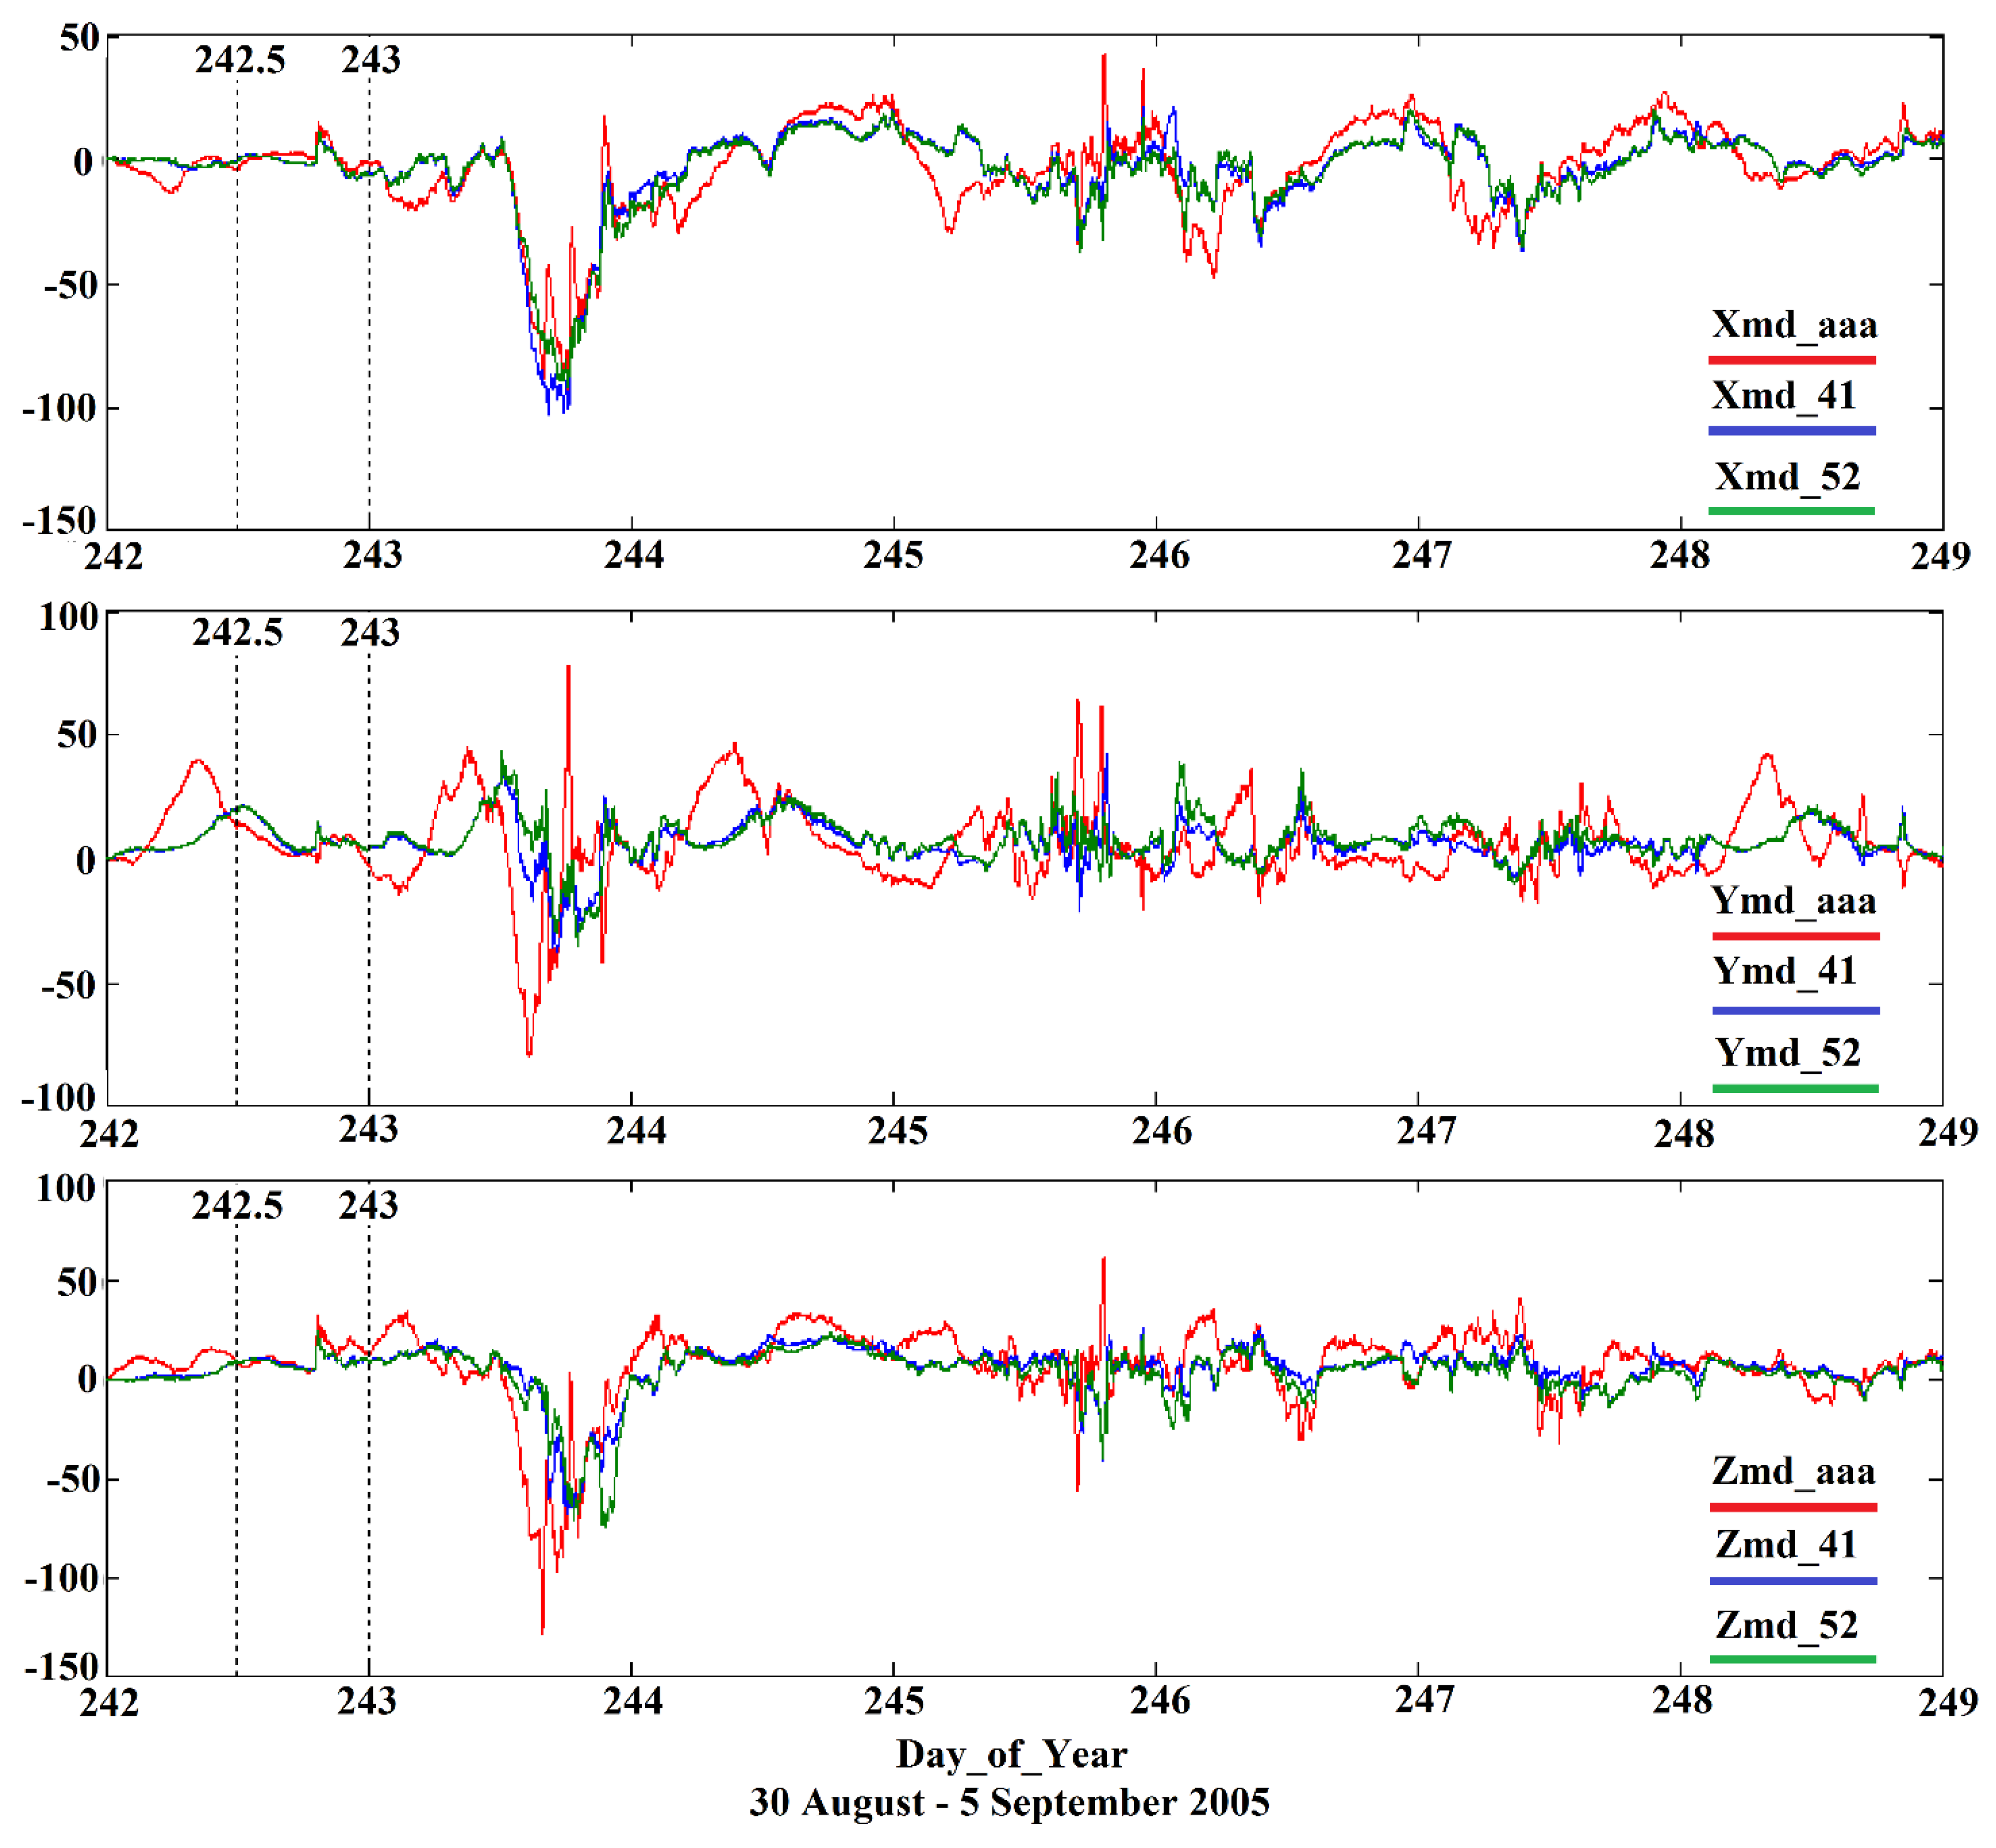
Figure 7 shows the result of averaging the data of the observatories selected by time shift criterion. The blue line represents the average magnetic records of 41 magnetic observatories with zero time deviation with a correlation above 0,9, shown in
Table 2. The green line represents the average magnetic records of 52 magnetic observatories with a time deviation of no more than a minute with a correlation above 0,9. The red line represents the magnetic records for the “aaa” station.
The obtained results show that the proposed method of averaging magnetic observatory data in ecliptic coordinates allows for more efficient joint data processing of the Intermagnet observatory network, revealing trends in magnetic field intensity variations several hours before the storms themselves commencement, which was the topic of the report [
3] at the EGU international conference in Vienna.
4. Discussion
The results of postprocessing the data obtained in 2005 have been presented in paper. It is possible that this aspect of the violation of the quality of the recorded data has already been eliminated, but probably, taking into account given the published data [
2], this problem may exist. The presence of shifts in the time series could possibly lead to an incorrect interpretation of the data obtained by other researchers earlier, for example, when calculating the coordinates of the virtual magnetic pole [
14]. Nevertheless, the data from previous years can be corrected, since the described method allows to determine the amount of time discrepancy in the data files recorded by different magnetic observatories. In the near future, authors plan to test the method of correcting data over time, and evaluate the effect of the adjustment.
Another problem that requires a logical explanation is the fact that there are a number of stations where the described event was not registered. A more thorough analysis of this situation is required. As one of the versions, authors consider the presence of some data noise due to industrial interference, which does not affect the registration of the common field, but prevents the registration of small variations.
The described method was tested on with per-minute averaged data. Testing the method on per-second registration data will allow for more accurate determination of the available time shifts in the data of various magnetic observatories and, possibly, will give a "boost" to new research.
Probably, the proposed method could become the basis for a new methodology for calculating the Dst index based on data from a larger set of observatories than is currently being done, although this proposal is debatable.
In any case, the proposed method for revealing time discrepancies can be used by the Intermagnet network as a tool for quality control of the data provided.
5. Conclusions
Results of the investigation on the international Intermagnet magnetic observatories data joint processing in a unified coordinate system have been presented in this paper which revealed the presence of time discrepancies in data from various magnetic observatories.
In order to observe magnetic field sources of cosmic origin the procedure of transforming initial magnetic recordings of the Intermagnet network observatories into a single magnetogram has been presented.
In order to check the quality of magnetic observatory data on time shifts a method for extracting magnetic variations has been proposed, which can be used as a reference.
Improvement in the signal-to-noise ratio, owing to the joint processing of data from many observatories has been demonstrated.
Author Contributions
1) Vassilyev Ivan Veniaminovich, Ph.D. (Phys. and Math.), Special Design and Technology Bureau “Granit”, Director of the Department, Almaty, Republic of Kazakhstan, e-mail: iv@granit.kz and
https://orcid.org/0000-0002-6216-0443 2) Mendakulov Zhassulan Korabayevich, PhD (Radio Engineering and Telecommunications), “Institute of Ionosphere”, Leading Scientific Researcher, Almaty, Republic of Kazakhstan, e-mail: m_m_zhas@mail.ru and
https://orcid.org/0000-0002-3818-404X; 3) Fedulina Inna Nikolaevna, Ph.D. (Phys. and Math.), “Institute of Ionosphere”, Leading Scientific Researcher, Almaty, Republic of Kazakhstan, e-mail: innafedulina@yandex.ru and
https://orcid.org/0009-0008-3956-2306 4) Zhumabayev Beibit Tenelovich, PhD (Phys. and Math.), “Institute of Ionosphere”, Chief Researcher, Almaty, Republic of Kazakhstan, e-mail: beibit.zhu@mail.ru and
http://orcid.org/0000-0002-8402-7934
Funding
This research was funded by the Science Committee of the Ministry of Science and Higher Education of the Republic of Kazakhstan (Grant No. AP19679336 - “Development of methods for increasing the efficiency of using geomagnetic variations as earthquake precursors”).
Data Availability Statement
The necessary data are available from the corresponding author upon reasonable request.
Conflicts of Interest
The authors declare no conflicts of interest.
References
- Map of Observatories. https://intermagnet.org/metadata/#/map.
- Coïsson, P., Telali, K., Heumez, B., Lesur, V., Lalanne, X., and Xin, C. J.: Time-stamp correction of magnetic observatory data acquired during unavailability of time-synchronization services, Geosci. Instrum. Method. Data Syst., 6, 311–317, 2017 . [CrossRef]
- Zhumabayev, B., Vassilyev, I., Mendakulov, Z., Fedulina, I., and Kapytin, V.: Results of joint processing of magnetic observatory data of international Intermagnet network in a unified coordinate system, EGU General Assembly 2024, Vienna, Austria, 14–19 Apr 2024, EGU24-11897, 2024 . [CrossRef]
- Haberle, V., Marchaudon, A., Chambodut, A., and Blelly, P.-L.: An operational geomagnetic baseline derivation for ground magnetometer data located in mid-latitudinal regions, EGU General Assembly 2024, Vienna, Austria, 14–19 Apr 2024, EGU24-3363, 2024 . [CrossRef]
- Haberle, V., Marchaudon, A., Chambodut, A., & Blelly, P.-L. (2022). Direct determination of geomagnetic baselines during quiet periods for low- and mid-latitude observatories. Journal of Geophysical Research: Space Physics, 127, e2022JA030407. [CrossRef]
- Alqeeq, S., Fontaine, D., Le Contel, O., Akhavan-Tafti, M., Cazzola, E., and Atilaw, T.: Impact of Interplanetary Coronal Mass Ejections (ICME) on the geomagnetic tail from THEMIS observations, EGU General Assembly 2024, Vienna, Austria, 14–19 Apr 2024, EGU24-17375, 2024 . [CrossRef]
- Waters, J., Lamy, L., and Coxon, J.: Remote, long-term auroral kilometric radiation observations as a geomagnetic indicator of substorm onset, EGU General Assembly 2024, Vienna, Austria, 14–19 Apr 2024, EGU24-16718, 2024 . [CrossRef]
- Gilmore, K. R., Bentley, S. N., and Smith, A. W.: Magnetospheric time history: How much do we need for forecasting?, EGU General Assembly 2024, Vienna, Austria, 14–19 Apr 2024, EGU24-6065, 2024 . [CrossRef]
- Sato, S. and Toh, H.: A machine-learning-based approach for predicting the geomagnetic secular variation, EGU General Assembly 2024, Vienna, Austria, 14–19 Apr 2024, EGU24-16981, 2024 . [CrossRef]
- Paolo Giovanni, P. and Lucia, S.: Discrimination of geomagnetic quasi-periodic signals by using SSA Transform, EGU General Assembly 2024, Vienna, Austria, 14–19 Apr 2024, EGU24-19601, 2024 . [CrossRef]
- Branduardi-Raymont, G., Berthomier, M., Bogdanova, Y.V. et al. Exploring solar-terrestrial interactions via multiple imaging observers. Exp Astron 54, 361–390 (2022). [CrossRef]
- Laundal, K.M., Richmond, A.D. Magnetic Coordinate Systems. Space Sci Rev 206, 27–59 (2017). [CrossRef]
- K.M. Laundal, J.W. Gjerloev, What is the appropriate coordinate system for magnetometer data when analyzing ionospheric currents? J. Geophys. Res. (2014). [CrossRef]
- Newitt, L.R., Chulliat, A. & Orgeval, J.J. Location of the North Magnetic Pole in April 2007. Earth Planet Sp 61, 703–710 (2009). [CrossRef]
|
Disclaimer/Publisher’s Note: The statements, opinions and data contained in all publications are solely those of the individual author(s) and contributor(s) and not of MDPI and/or the editor(s). MDPI and/or the editor(s) disclaim responsibility for any injury to people or property resulting from any ideas, methods, instructions or products referred to in the content. |
© 2024 by the authors. Licensee MDPI, Basel, Switzerland. This article is an open access article distributed under the terms and conditions of the Creative Commons Attribution (CC BY) license (http://creativecommons.org/licenses/by/4.0/).
