Preprint
Brief Report

Molecular Biomarkers in Lymphangioleiomyomatosis (LAM)

Altmetrics

Downloads

111

Views

72

Comments

0

This version is not peer-reviewed

Submitted:

16 May 2024

Posted:

17 May 2024

You are already at the latest version

Alerts
Abstract
Lymphangioleiomyomatosis (LAM) is a cystic pulmonary disorder that has been known to primarily affect women of childbearing age. The disorder can develop with mutations in the tuberous sclerosis (TSC) genes TSC1 & TSC2 but may arise by other irregular cases in the lack of these mutations. LAM can manifest in a wide variety of ways and generally compounded in symptoms of other lung disorders such as bronchitis, emphysema, & asthma. However, due to lack of effective diagnostic methods, biomarkers of LAM leading to a treatment for the disorder are currently unmet. Using integrative dating analytics and bioinformatics approaches; this study used publicly available microarray data to identify biomarkers in LAM. The results showed important differential expressed genes (DEGs) including: CDH2, CXCL6, ANXA10, MFAP5, RPS4Y1, DCBLD2, PAPPA, TFPI2, SERPINE1, LOX, MYH11, RGS1, SEPP1, TMOD1, ID1, SFTPB, CDH1, HTR2B, OGN, and IGLC1. Furthermore, gene – network and gene ontology (GO) analysis were conducted to show the importance of these genes from a molecular understanding. Taken together, the results revealed could serve as diagnostic and prognostic biomarkers with LAM patients.
Keywords: 
Subject: Medicine and Pharmacology  -   Pulmonary and Respiratory Medicine

Introduction

Lymphangioleiomyomatosis (LAM) is a rare disease that affects approximately 3.4 to 7.8 per million women worldwide. It is characterized by the intrusion and proliferation of abnormal smooth muscle – like LAM cells which leads to the destruction of lung parenchyma and formation of cysts on the lung [1,2]. LAM can be connected with the tuberous sclerosis complex (TSC-LAM) or sporadic (S-LAM) in which patients do not have TSC gene mutations or its clinical manifestations. Estrogen may play an important role in LAM cell survival, destructive, and proliferation potential [1,2,3]. Estrogen regulated gene transcription may modulate signaling to activate mTOR. Various studies have shown that estrogen and estrogen disruptors may promote various transcriptional regulators such as ID proteins to be involved in various molecular activities such as vascular remodeling, stem cell differentiation, and pulmonary dysfunction [3,4,5,6,7,8,9,10,11]. While genes such as TSC1 and TSC2 are known to be involved with LAM development [1,2,3,4,5], very little is known about other genes that are associated with the disorder. Through this integrative study, we explore important genes and gene – networks that may open up opportunities to explore LAM development. Overall, this data can be used to focus on novel diagnostic and therapeutic areas.

Methods

Publicly accessible data was used from NCBI Gene Expression Omnibus (GEO) for this study [12]. Dataset GSE12027 [13] consists of 14 LAM and 11 controls samples (25 total samples). The Limma-Voom R package was used to identify differentially expressed mRNAs from the featureCounts output [14]. The level for statistical significance was set at p < 0.05 and Log2 fold change values were calculated by comparing expression levels in patient samples to those in control samples for each mRNA [15,16]. String, a database used for predicted gene – gene/protein - protein interactions was used to show the gene-network for the top 20 DEGs. The gene interactions originate from data collected from supplementary databases, computational predictions, and data transfer between organisms [17]. Furthermore, gene ontology was used to show important molecular processes connected to the genes. ChEA3 is a web – based TF enrichment analysis (TFEA) tool that outputs enrichment results and helped show important molecular functions within the 20 DEGs and associated genes [18].

Results

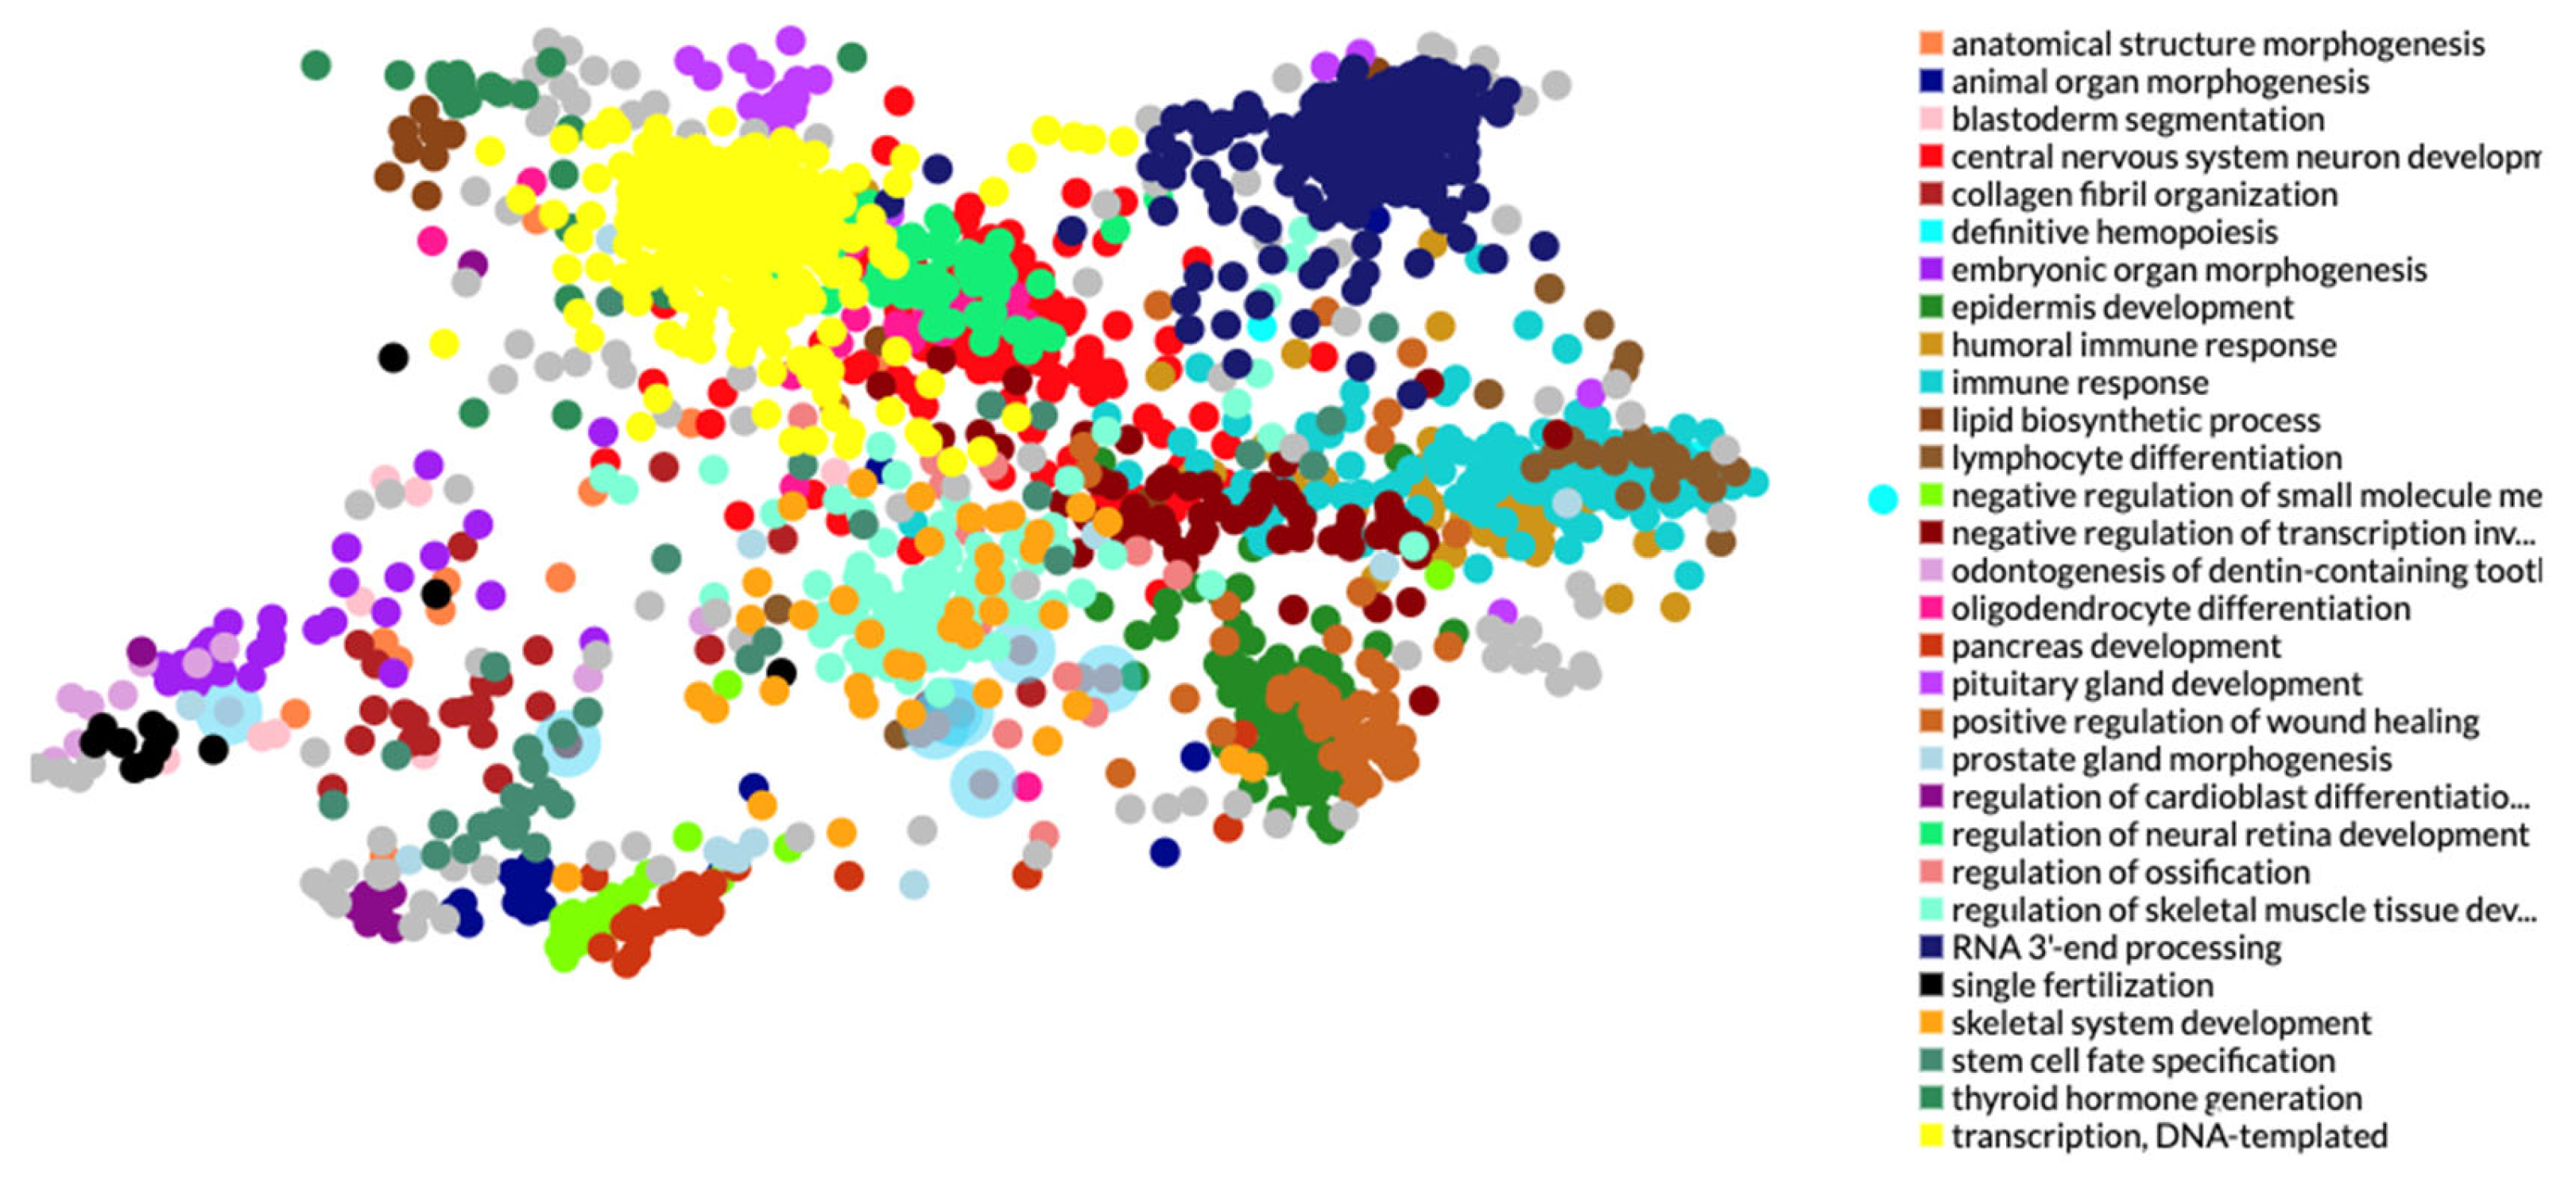
We acquired NCBI GEO dataset GSE12027 [13] and used the Limma-Voom R package [14] to examine key DEGs and their roles in LAM. The top up – and down – regulated genes in LAM are shown in Table 1 and include: CDH2, CXCL6, ANXA10, MFAP5, RPS4Y1, DCBLD2, PAPPA, TFPI2, SERPINE1, LOX, MYH11, RGS1, SEPP1, TMOD1, ID1, SFTPB, CDH1, HTR2B, OGN, and IGLC1. We also showed the expression fold changes and p - values for each gene. Figure 1 and Figure 2 show the important gene networks and gene ontology with connected molecular processes.

Discussion

The integrative analysis allowed us to map out key gene – networks, DEGs, and gene ontology of LAM. By using NCBI GEO, the R – package, String, and ChEA3; we discovered valuable information in the gene and molecular processes involved in LAM. It has been previously determined that genes such as TSC1 and TSC2 have been involved in LAM [1,2,3], but these new results can help add to the growing amounts of information. Limitations in our study includes a small sample size, which can be addressed by conducting studies with much larger sample sizes.

Conclusions

Through the combination of bioinformatics and data analytics, we have shown significant DEGs, gene networks, and gene ontology components within LAM. Key genes highlighted in the study include: CDH2, CXCL6, ANXA10, MFAP5, RPS4Y1, DCBLD2, PAPPA, TFPI2, SERPINE1, LOX, MYH11, RGS1, SEPP1, TMOD1, ID1, SFTPB, CDH1, HTR2B, OGN, and IGLC1. Overall, further gene expression and gene network analysis on LAM should be conducted to open up more opportunities for improved diagnostic and preventative tools.

Author Contributions

V. A. conceptualized, designed, conducted, and wrote the manuscript.

Funding

This study was not supported by any sponsor or funder.

Data Availability Statement

The data used for the analysis is deposited at NCBI GEO (GSE12027). Further inquiries can be directed to the corresponding author.

Conflicts of Interest

The author has no conflict of interest to declare.

Statement of Ethics

An ethics statement was not required because this study is based on publicly deposited and accessible data.

References

  1. O'Mahony, A.M.; Lynn, E.; Murphy, D.J.; Fabre, A.; McCarthy, C. Lymphangioleiomyomatosis: a clinical review. Breathe 2020, 16, 200007. [Google Scholar] [CrossRef] [PubMed]
  2. Koslow, M.; Lynch, D.A.; Cool, C.D.; Groshong, S.D.; Downey, G.P. Lymphangioleiomyomatosis and Other Cystic Lung Diseases. Immunol. Allergy Clin. North Am. 2023, 43, 359–377. [Google Scholar] [CrossRef]
  3. Kundu, N.; Holz, M.K. Lymphangioleiomyomatosis: a metastatic lung disease. Am. J. Physiol. Physiol. 2023, 324, C320–C326. [Google Scholar] [CrossRef] [PubMed]
  4. Yu, J.J.; Robb, V.A.; Morrison, T.A.; Ariazi, E.A.; Karbowniczek, M.; Astrinidis, A.; Wang, C.; Hernandez-Cuebas, L.; Seeholzer, L.F.; Nicolas, E.; et al. Estrogen promotes the survival and pulmonary metastasis of tuberin-null cells. Proc. Natl. Acad. Sci. 2009, 106, 2635–2640. [Google Scholar] [CrossRef] [PubMed]
  5. Prizant, H.; Sen, A.; Light, A.; Cho, S.-N.; DeMayo, F.J.; Lydon, J.P.; Hammes, S.R. Uterine-Specific Loss of Tsc2 Leads to Myometrial Tumors in Both the Uterus and Lungs. Mol. Endocrinol. 2013, 27, 1403–1414. [Google Scholar] [CrossRef] [PubMed]
  6. Avecilla, V.; Doke, M.; Das, M.; Alcazar, O.; Appunni, S.; Tondin, A.R.; Watts, B.; Ramamoorthy, V.; Rubens, M.; Das, J.K. Integrative Bioinformatics–Gene Network Approach Reveals Linkage between Estrogenic Endocrine Disruptors and Vascular Remodeling in Peripheral Arterial Disease. Int. J. Mol. Sci. 2024, 25, 4502. [Google Scholar] [CrossRef] [PubMed]
  7. Avecilla, V. Effect of Transcriptional Regulator ID3 on Pulmonary Arterial Hypertension and Hereditary Hemorrhagic Telangiectasia. Int. J. Vasc. Med. 2019, 2019, 1–8. [Google Scholar] [CrossRef] [PubMed]
  8. Avecilla, V.; Doke, M.; Felty, Q. Contribution of Inhibitor of DNA Binding/Differentiation-3 and Endocrine Disrupting Chemicals to Pathophysiological Aspects of Chronic Disease. BioMed Res. Int. 2017, 2017, 6307109–22. [Google Scholar] [CrossRef] [PubMed]
  9. Doke, M.; Avecilla, V.; Felty, Q. Inhibitor of Differentiation-3 and Estrogenic Endocrine Disruptors: Implications for Susceptibility to Obesity and Metabolic Disorders. BioMed Res. Int. 2018, 2018, 1–16. [Google Scholar] [CrossRef] [PubMed]
  10. Avecilla, V.E. ID3, Estrogenic Chemicals, and the Pathogenesis of Tumor-Like Proliferative Vascular Lesions. (2017). FIU Electronic Theses and Dissertations. 3519. Available online: https://digitalcommons.fiu.edu/etd/3519.
  11. Avecilla, A.; Doke, M.; Jovellanos, J.; Avecilla, V. Contribution of Inhibitor of Differentiation and Estrogenic Endocrine Disruptors to Neurocognitive Disorders. Med Sci. 2018, 6, 61. [Google Scholar] [CrossRef] [PubMed]
  12. Barrett, T.; Wilhite, S.E.; Ledoux, P.; Evangelista, C.; Kim, I.F.; Tomashevsky, M.; Marshall, K.A.; Phillippy, K.H.; Sherman, P.M.; Holko, M.; et al. NCBI GEO: archive for functional genomics data sets—update. Nucleic Acids Res. 2012, 41, D991–D995. [Google Scholar] [CrossRef] [PubMed]
  13. Pacheco-Rodriguez, G.; Kumaki, F.; Steagall, W.K.; Zhang, Y.; Ikeda, Y.; Lin, J.-P.; Billings, E.M.; Moss, J. Chemokine-Enhanced Chemotaxis of Lymphangioleiomyomatosis Cells with Mutations in the Tumor Suppressor TSC2 Gene. J. Immunol. 2009, 182, 1270–1277. [Google Scholar] [CrossRef] [PubMed]
  14. Ritchie, M.E.; Phipson, B.; Wu, D.; Hu, Y.; Law, C.W.; Shi, W.; Smyth, G.K. limma powers differential expression analyses for RNA-sequencing and microarray studies. Nucleic Acids Res. 2015, 43, e47. [Google Scholar] [CrossRef] [PubMed]
  15. Law, C.W.; Chen, Y.; Shi, W.; Smyth, G.K. Voom: Precision weights unlock linear model analysis tools for RNA-seq read counts. Genome Biol. 2014, 15, R29. [Google Scholar] [CrossRef] [PubMed]
  16. Phipson, B.; Lee, S.; Majewski, I.J.; Alexander, W.S.; Smyth, G.K. Robust hyperparameter estimation protects against hypervariable genes and improves power to detect differential expression. Ann. Appl. Stat. 2016, 10, 946–963. [Google Scholar] [CrossRef] [PubMed]
  17. Szklarczyk, D.; Kirsch, R.; Koutrouli, M.; Nastou, K.; Mehryary, F.; Hachilif, R.; Gable, A.L.; Fang, T.; Doncheva, N.T.; Pyysalo, S.; et al. The STRING database in 2023: protein-protein association networks and functional enrichment analyses for any sequenced genome of interest. Nucleic Acids Res. 2023, 51, D638–D646. [Google Scholar] [CrossRef] [PubMed]
  18. Keenan, A.B.; Torre, D.; Lachmann, A.; Leong, A.K.; Wojciechowicz, M.L.; Utti, V.; Jagodnik, K.M.; Kropiwnicki, E.; Wang, Z.; Ma’ayan, A. ChEA3: transcription factor enrichment analysis by orthogonal omics integration. Nucleic Acids Res. 2019, 47, W212–W224. [Google Scholar] [CrossRef] [PubMed]
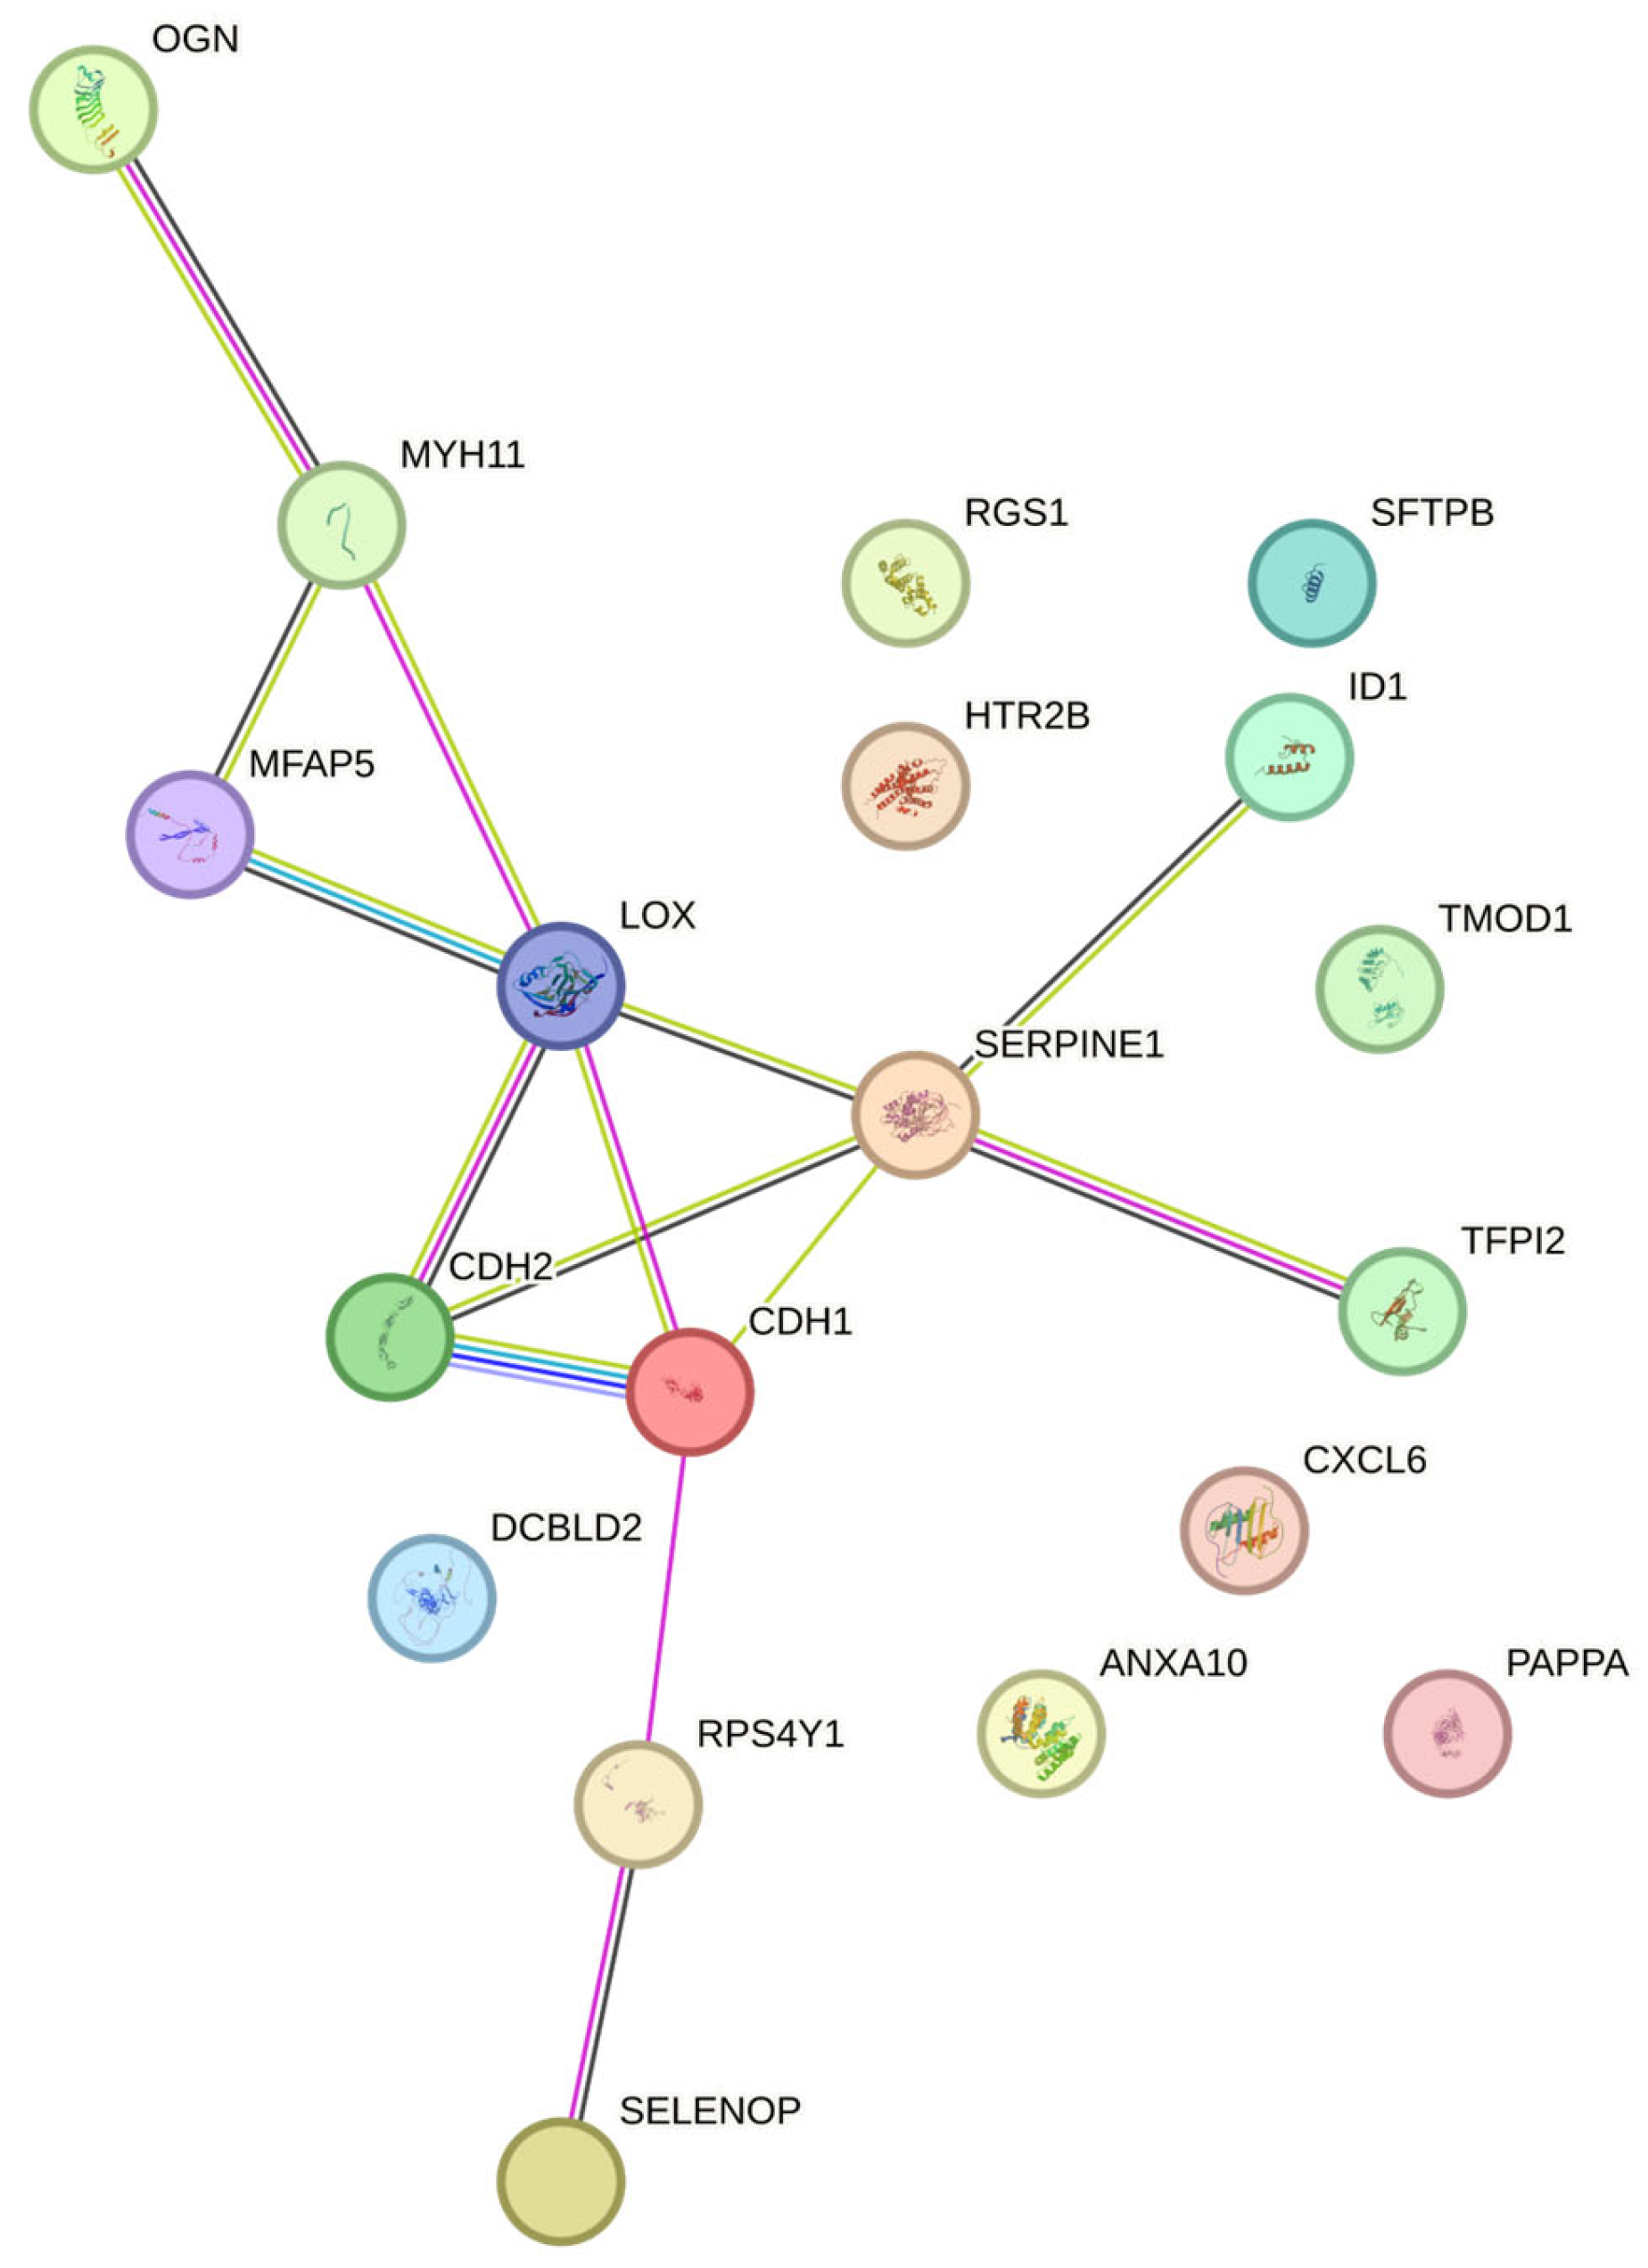
Figure 1. Gene-networks between the top 20 DEGs. The interactions include direct (physical) and indirect (functional) associations.
Preprints 106731 g001
Figure 2. Gene enrichment (GO) of the top 20 up – and down – regulated genes. The dots represent the top 20 DEGs from Table 1 and important associated genes. Molecular processes are listed corresponding to each of the different color-coded dots (genes).
Preprints 106731 g002
Table 1. Top 20 up – and down – regulated genes in LAM.
Gene Symbol Gene Title Log2 (Fold Change) p – value
CDH2 cadherin 2 7.6295995 3.73E-12
CXCL6 C-X-C motif chemokine ligand 6 7.2061993 3.26E-14
ANXA10 annexin A10 6.7952473 5.57E-13
MFAP5 microfibrillar associated protein 5 5.7810303 5.57E-13
RPS4Y1 ribosomal protein S4, Y-linked 1 5.6284047 1.57E-15
DCBLD2 discoidin, CUB and LCCL domain containing 2 5.5517299 9.99E-13
PAPPA pappalysin 1 5.5260289 1.43E-11
TFPI2 tissue factor pathway inhibitor 2 5.4304952 2.63E-13
SERPINE1 serpin family E member 1 5.3529649 3.70E-11
LOX lysyl oxidase 5.0978044 2.85E-12
MYH11 myosin heavy chain 11 -12.0887684 1.11E-17
RGS1 regulator of G-protein signaling 1 -9.9510615 4.09E-13
SEPP1 selenoprotein P, plasma, 1 -9.5071713 2.18E-14
TMOD1 tropomodulin 1 -9.2792733 1.57E-15
ID1 Inhibitor of differentiation - 1 -9.126583 1.32E-06
SFTPB surfactant protein B -8.471653 4.91E-08
CDH1 cadherin 1 -8.3548182 2.27E-13
HTR2B 5-hydroxytryptamine receptor 2B -7.6577741 4.34E-13
OGN osteoglycin -7.6373228 1.53E-12
IGLC1 immunoglobulin lambda constant 1 -7.6012966 1.12E-07
Disclaimer/Publisher’s Note: The statements, opinions and data contained in all publications are solely those of the individual author(s) and contributor(s) and not of MDPI and/or the editor(s). MDPI and/or the editor(s) disclaim responsibility for any injury to people or property resulting from any ideas, methods, instructions or products referred to in the content.
Copyright: This open access article is published under a Creative Commons CC BY 4.0 license, which permit the free download, distribution, and reuse, provided that the author and preprint are cited in any reuse.
Prerpints.org logo

Preprints.org is a free preprint server supported by MDPI in Basel, Switzerland.

Subscribe

© 2024 MDPI (Basel, Switzerland) unless otherwise stated