1. Introduction
Liver fibrosis is the common endpoint of various chronic liver injuries and critically determines the prognosis of chronic liver diseases. Despite its significance, the mechanisms driving liver fibrogenesis remain incompletely understood, as evidenced by the current lack of effective anti-fibrotic treatments. Myofibroblasts are central to the fibrotic process in all fibrotic diseases, functioning as matrix-producing cells with contractile properties and expressing proteins common to smooth muscle cells, such as alpha-smooth muscle actin (SMA) [
1,
2]. Hepatic stellate cells (HSC) and portal myofibroblasts (PMF) are the two primary myofibroblast sources in the liver [
3,
4,
5]. While the role of HSC in fibrogenesis has been studied more extensively, the importance of PMF has only more recently come to attention [
6]. PMF have been proposed to deposit matrix specifically in biliary fibrosis and to have a role in place of, or in addition to, hepatic stellate cell-derived myofibroblasts [
5,
7]. Therefore, PMF and HSC are supposed to responding uniquely to specific stimuli and performing distinct functions. However, the role of PMFs remains poorly defined because of a lack of markers clearly distinguishing this cell population from HSCs at the stage of myofibroblasts [
1,
6,
8,
9].
Thymocyte differentiation antigen 1 (Thy-1, or CD90), known for its presence on various cell types and its diverse roles in cellular biology, emerges as a pivotal molecule in fibrogenesis. Its presence or absence has significant effects on cellular biology, including the control of many core functions of fibroblasts relevant to fibrogenesis, including the deposition of extracellular matrix, proliferation, apoptosis, cytokine and growth factor expression and responsiveness, cell adhesion, migration, and myofibroblast differentiation [
10]. However, the effects vary between cell types, tissues and organs, and between similar tissues in different species [
11], with pro-fibrogenic functions of Thy1+ fibroblasts observed in some studies [
12] and anti-fibrogenic effects in others [
13,
14].
Within the context of liver fibrogenesis, Thy-1 has been identified as a marker for liver PMF, particularly in the periportal area, distinguishing them from HSC [
1,
15,
16,
17], and has been identified as a gene that is overexpressed in PMFs [
15], pointing to its relevance in liver fibrogenesis. On the other hand, a more recent study investigated the role of mesothelin and Thy-1 in the activation of fibroblasts across multiple organs and demonstrated that mesothelin -/- mice were protected from cholestatic fibrosis but Thy-1 -/- mice were more susceptible to fibrosis, suggesting that the mesothelin-Thy-1 signaling complex is critical for tissue fibroblasts [
18]. Whether these findings translate to in vivo circumstances in humans is yet to be seen.
The shedding of Thy-1 from fibroblasts surfaces, correlating with a shift towards a profibrogenic myofibroblast phenotype, has been a focus of recent studies [
19,
20]. An enzyme-linked-immunosorbent-assay (ELISA) for detecting soluble Thy-1 (sThy-1) has revealed elevated levels in systemic fibrotic diseases, correlating with disease severity [
21]. However, the relevance of sThy-1 in liver diseases remains unexplored.
Primary biliary cholangitis (PBC) and metabolic dysfunction-associated steatotic liver disease (MASLD) offer unique insights into liver fibrosis. PBC, a rare chronic inflammation of small biliary ducts, shows periportal fibrosis that expands to sinusoids with disease progression [
22].
MASLD, a complex metabolic disorder characterized by excessive hepatocyte fat accumulation leading to steatohepatitis with a hepatocellular pattern of liver injury, shows perisinusoidal fibrosis that expands to portal fields with disease progression [
23]. It has become a leading cause of cirrhosis in the western world. In the context of PBC and MASLD, two diseases with distinct fibrosis patterns, this study aims to elucidate Thy-1’s presence in liver histology and serum across different fibrosis stages, seeking new insights into mechanisms of liver fibrogenesis.
4. Discussion
Our study reveals a significant expansion of Thy-1 positive cells in liver fibrogenesis, notably in biliary liver injuries, underscoring the nuanced roles of these cells across different liver diseases.
Patients with PBC more often were females, showed a more pronounced cholestasis as well as elevated immunoglobulin M levels than patients with MASLD, all of which are typical demographic and laboratory features of PBC [
22]. As we matched the healthy controls regarding age and sex to the PBC controls, there is a significantly higher proportion of females in the healthy controls in comparison to the MASLD group, with no difference, however, regarding age at baseline. As expected, patients with MASLD had a significantly higher body mass index at baseline as well as higher ferritin levels, which is an indicator of liver inflammation in MASLD [
28]. Importantly, there was no significant difference between the level of apoptosis, fibrosis and portal hypertension between PBC and MASLD patients. These findings indicate that we had two typical disease groups with similar fibrosis stages, which is central to the interpretation of the results.
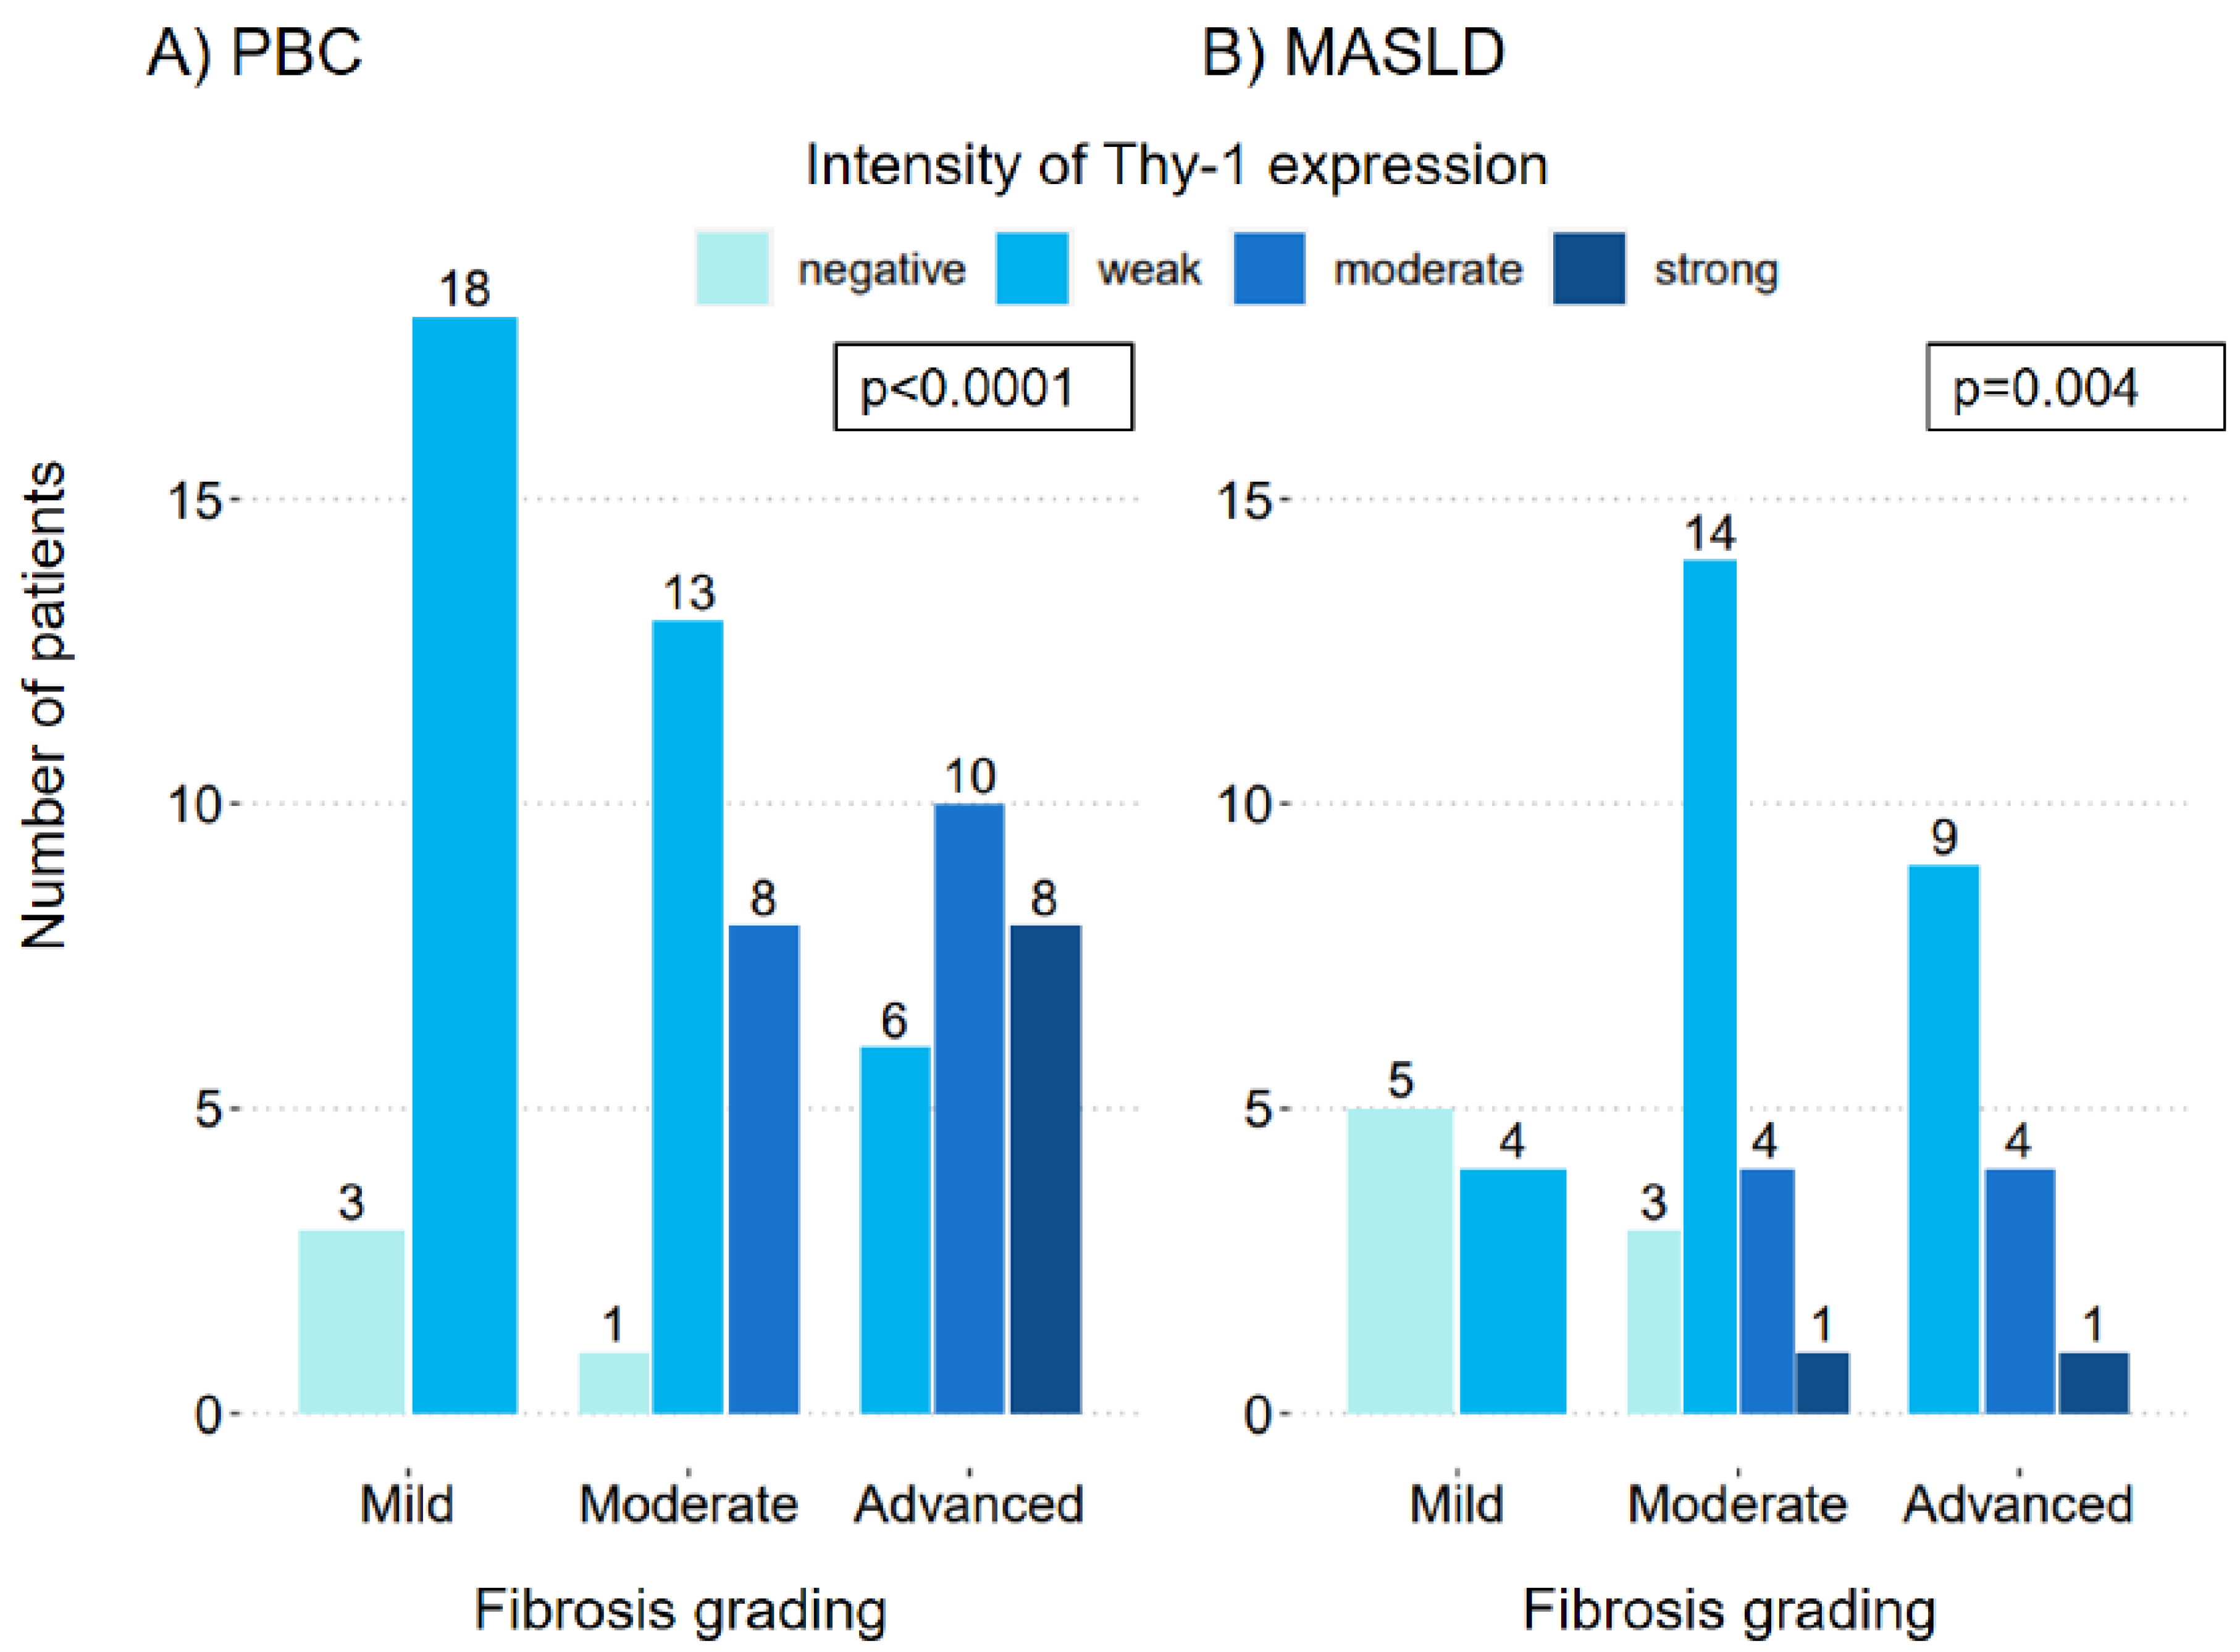
Despite PBC being a disease with a biliary type of injury and MASLD a disease with a hepatocellular type of injury, the correlation between an increase in fibrosis grading and an increase in the intensity of Thy-1 expression on liver histology was significant in both diseases. Our findings corroborate those of Dezsὅ et al. (34), who identified Thy-1 decorated myofibroblasts in models of cholangiofibrosis and hepatotoxic cirrhosis, and extended these observations by demonstrating the significant involvement of Thy-1-positive cells even in the early stages of liver fibrogenesis [
29]. Complementing Lemoinne et al. [
1], who emphasized the role of PMFs in fibrogenesis without using Thy-1 as a marker, our study not only confirms the increase of PMFs as fibrosis progresses but also establishes Thy-1 expression as a distinct marker for these cells in liver tissue samples from PBC and MASLD patients.
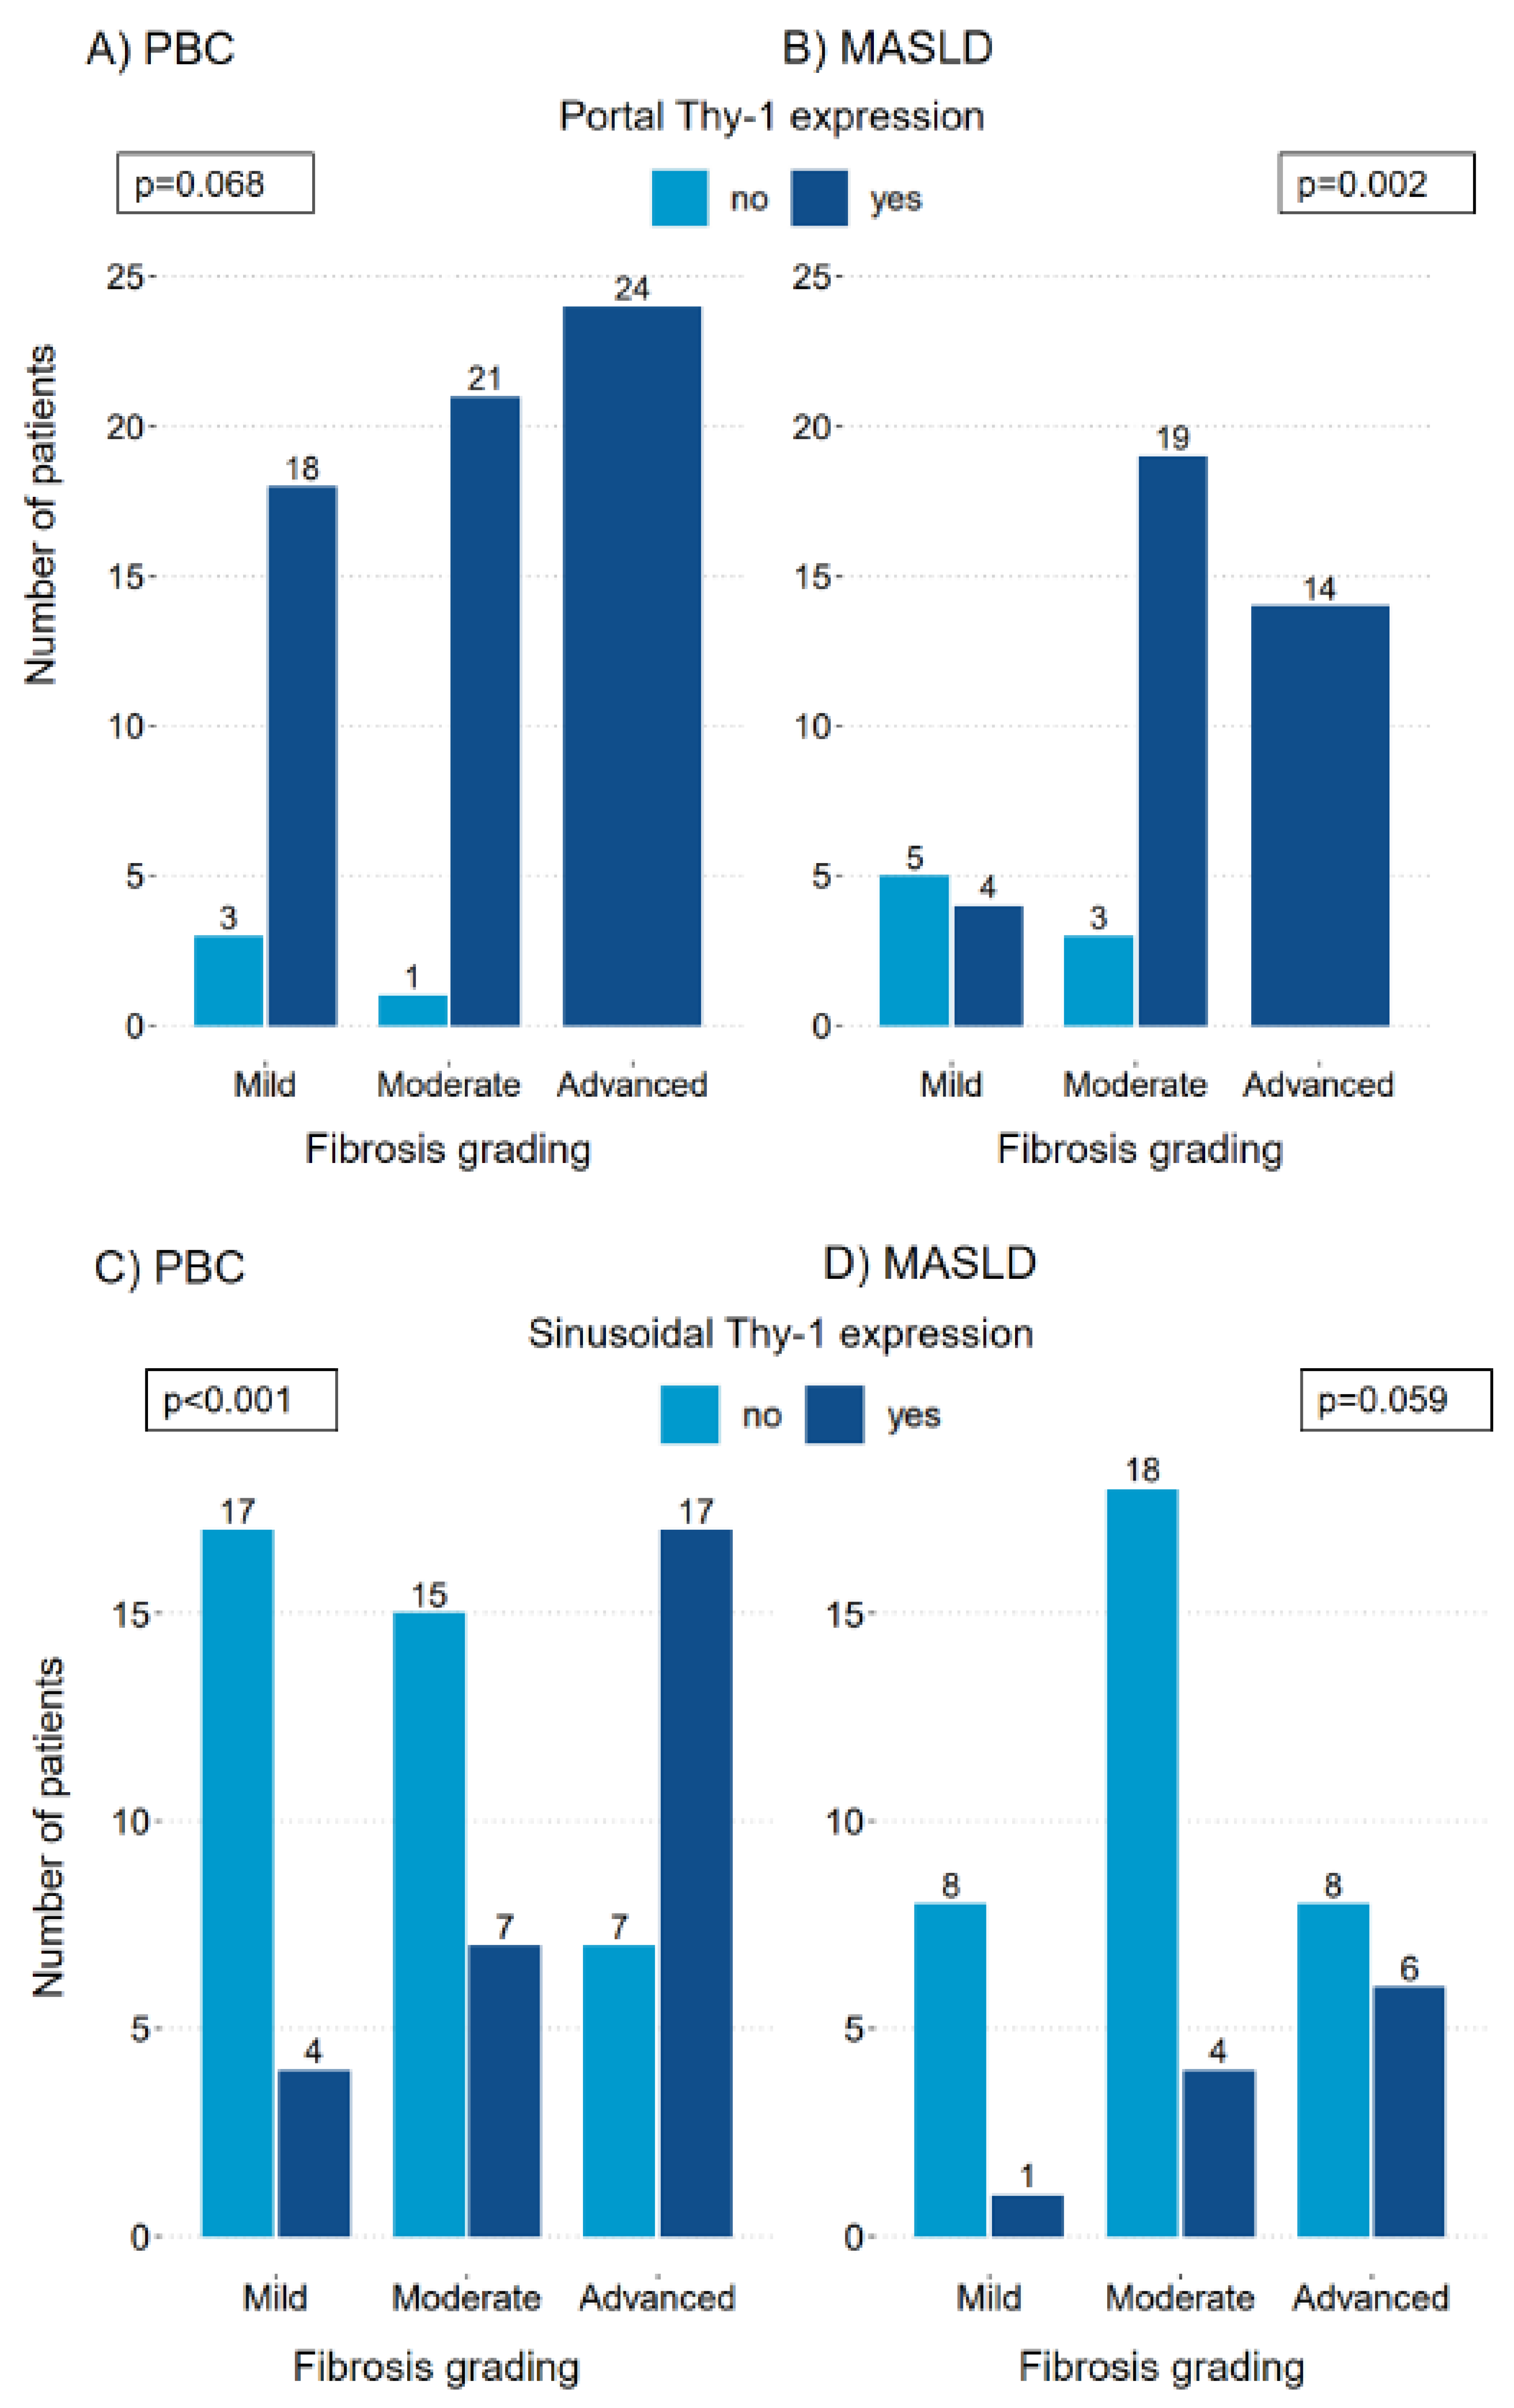
In patients with PBC the Thy-1 expression was portal in almost all patients, regardless of fibrosis grading. In patients with MASLD, however, the portal expression of Thy-1 significantly increased with fibrosis progression. This might indicate that portal Thy-1 positive cells are activated earlier in the context of a biliary type of injury, even in situations, where fibrosis is not yet pronounced.
The sinusoidal presence of Thy-1 positive cells was clearly associated with the severity of fibrosis in patients with PBC, indicating, that Thy-1 positive cells are expanding in the liver during fibrogenesis. This is in line with the data from rat models by Dudas et al., which suggest, that Thy-1 may induce myofibroblast migration along the liver sinusoids [
15]. In MASLD patients, although the sinusoidal presence of Thy-1 expressing cells increased with fibrosis progression, this was observed in a smaller proportion of patients and did not reach statistical significance. Dudas et al. had similar findings in a CCL
4-induced liver injury model in rats, where Thy-1 reaction was seen primarily in the periportal area and not significantly sinusoidal [
15]. These findings are furthermore in line with the observation from Iwaisako et al., who found that activated PMFs were shown to comprise 70% of myofibroblasts at the onset of the bile duct ligation mouse model of cholestatic fibrosis, while HSCs were increasingly activated with fibrosis progression [
9]. Our findings might therefore indicate that also in humans the Thy-1 positive fibroblasts are more specifically activated and involved in the process of fibrogenesis in patients with a biliary type of liver injury. Given that Thy-1 expression correlates with fibrosis severity, targeting the Thy-1 signaling pathways or modulating Thy-1 expression could offer new strategies for fibrosis treatment. However, the exact regulatory capacities of Thy-1 positive cells, whether fibrotic or anti-fibrotic [
11], remain to be fully understood. Our findings underscore the urgency for further research to explore these pathways, potentially leading to targeted therapies that can mitigate fibrosis in liver diseases.
SMA was present portal and sinusoidal in all patients and all fibrosis stages, with the exception of one sinusoidal area. Thy-1 however, was present portal and sinusoidal depending on fibrosis grading and disease subgroup. These results are in line with previous findings by Dezsὅ [
29] and Dudas and colleagues [
15], who described SMA staining exceeding Thy-1 staining. In the work from Lemoinne et al. described above [
1] the COL15A1 positive cells, identified as PMFs, also expressed SMA in cirrhotic livers, but not in normal livers, with SMA staining largely exceeding that of COL15A1, which is in line with our findings, with the limitation, that we used another marker for PMFs. This only partial co-localization with SMA indicates that Thy-1 positive cells are only a subpopulation of myofibroblasts in the liver, which is consistent with previous findings, that HSC are the major contributors to the entire population of hepatic myofibroblasts [
6].
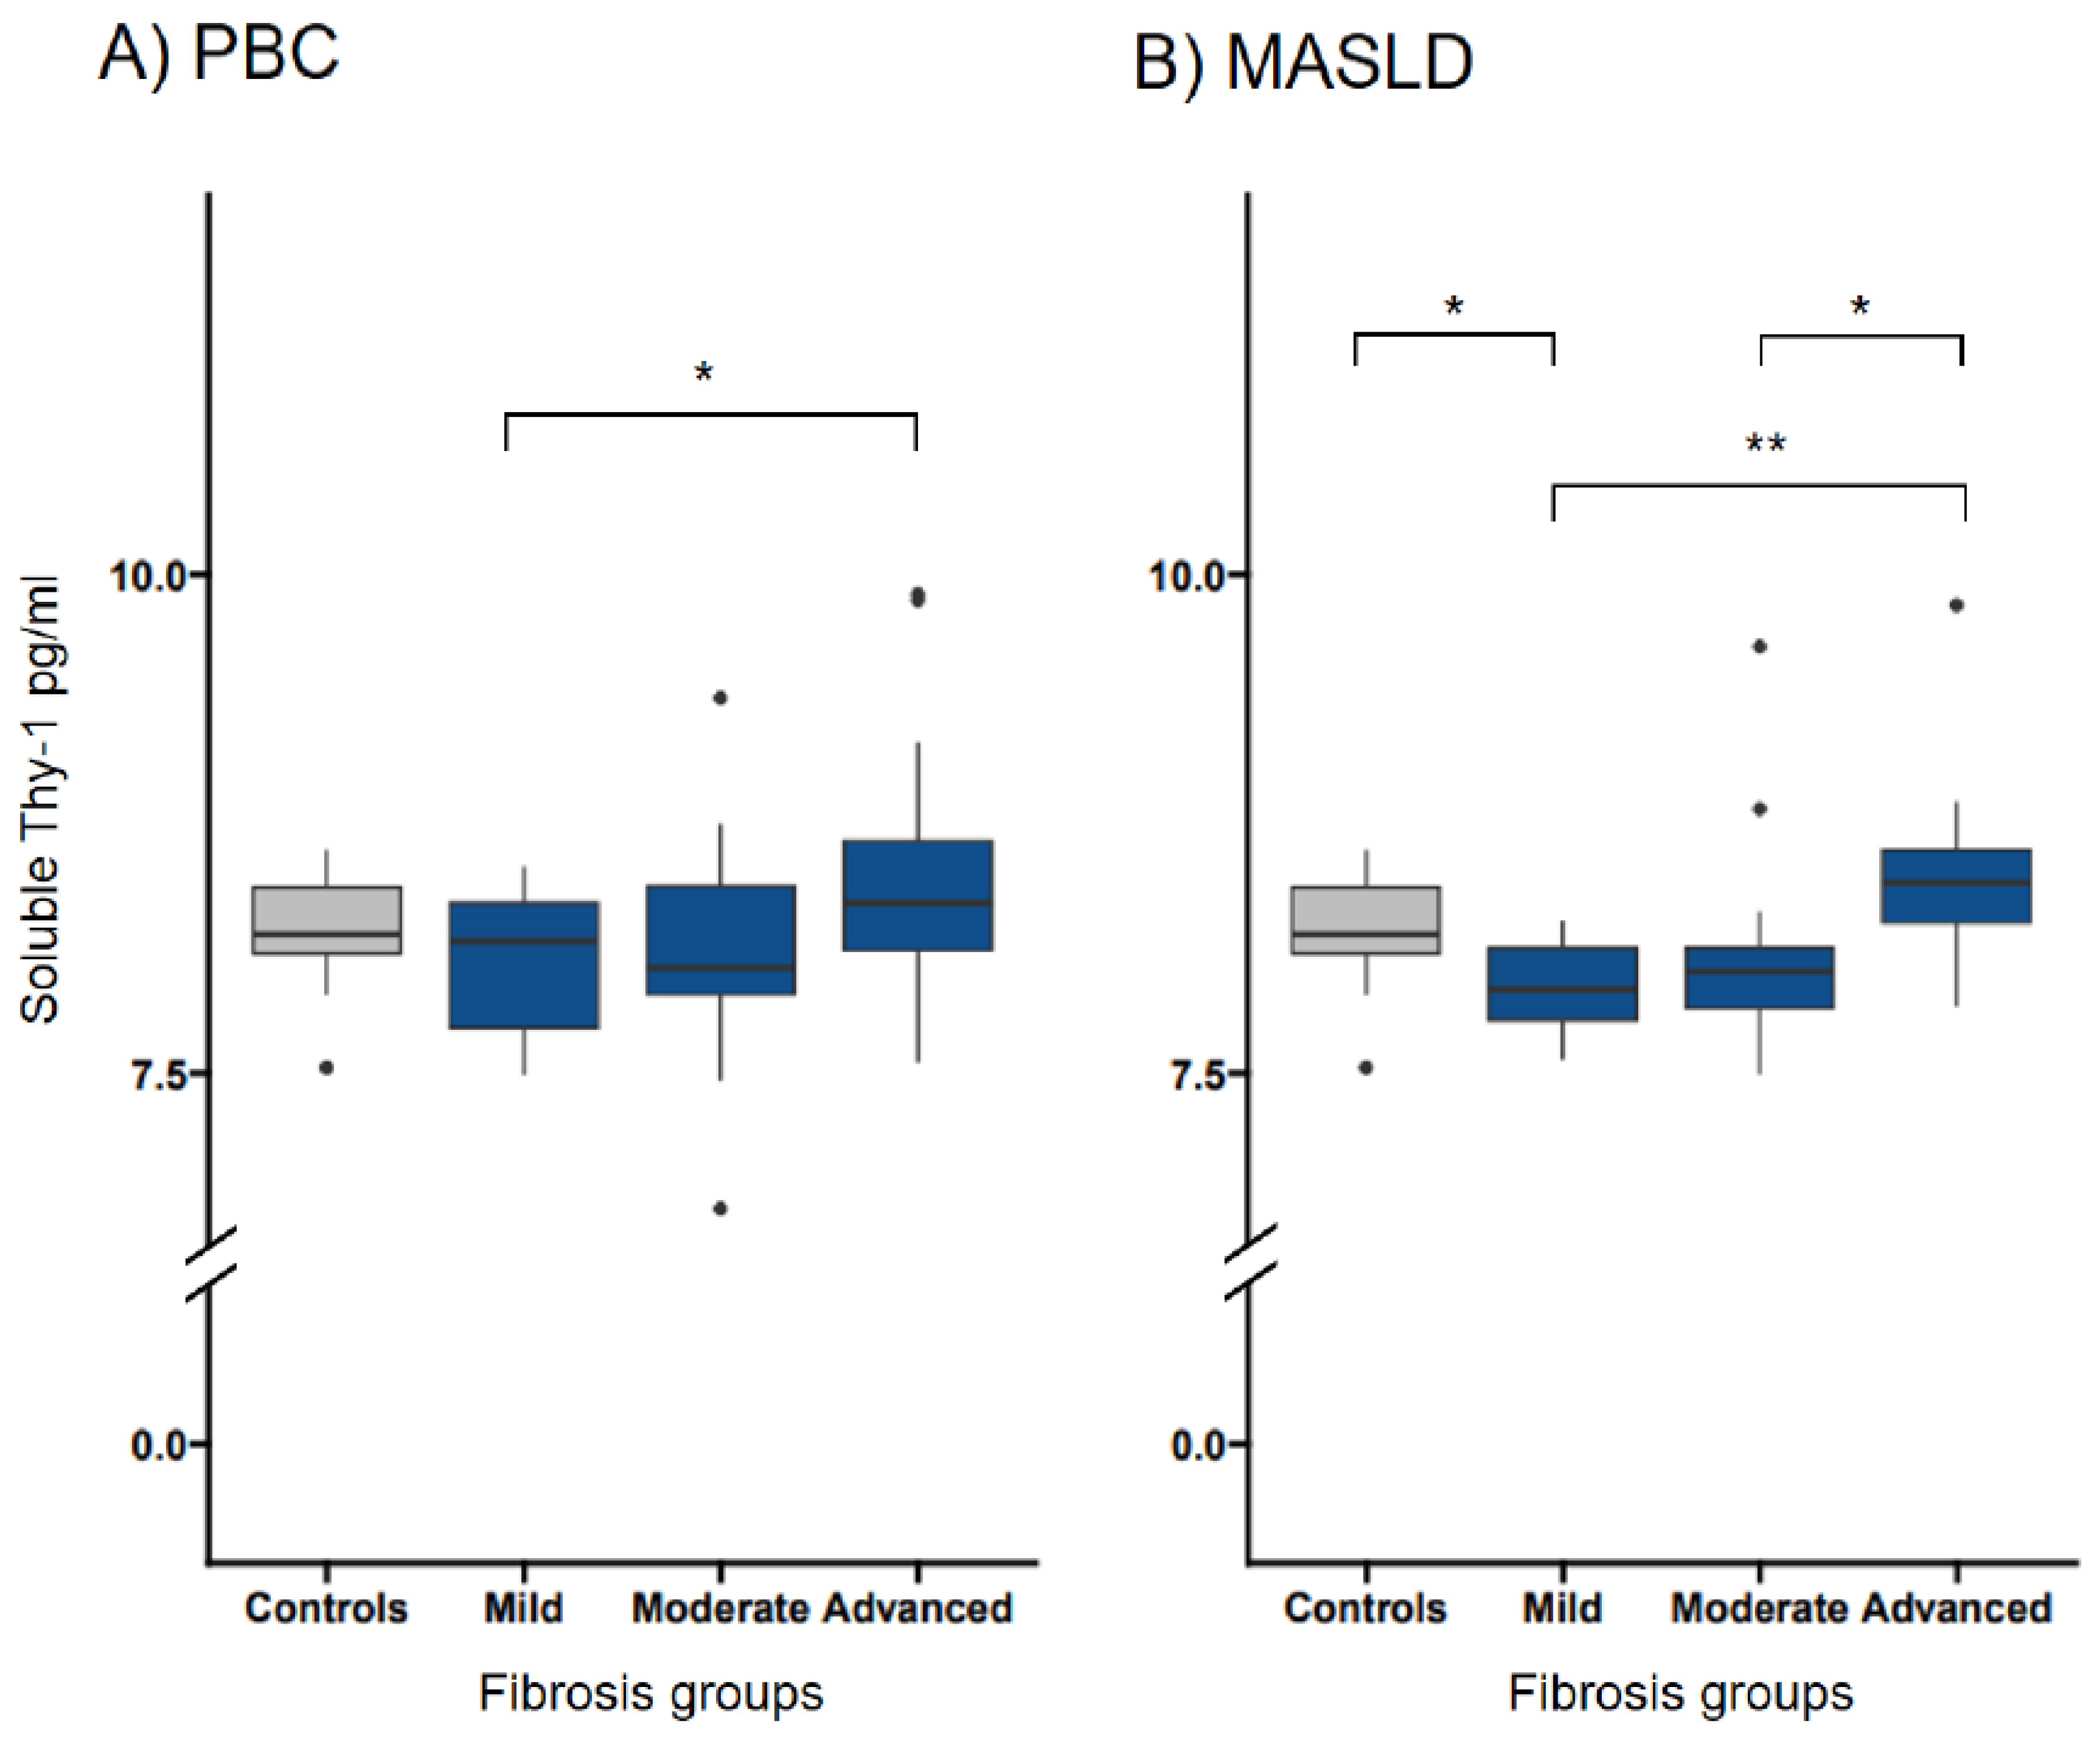
Soluble Thy-1 measurements significantly differed between early and advanced fibrosis in both diseases, with, interestingly, a higher significance level in patients with MASLD. The mechanism of shedding of Thy-1 is not yet understood well [
11] and it can be hypothesized, that it is influenced by different types of inflammatory activities in the liver and therefore might be more pronounced in MASLD. Of note, despite the observed association between sThy-1 levels and fibrosis grading, the variability of sThy-1 levels suggests limitations in its utility as a non-invasive surrogate marker for liver fibrosis. Several factors could contribute to this variability, including the heterogeneous nature of liver diseases and the complex biology of Thy-1, which may have differential expression patterns and shedding mechanisms under varying pathological conditions [
11]. Further research is necessary to elucidate these mechanisms and evaluate the potential of sThy-1 in a broader spectrum of liver diseases.
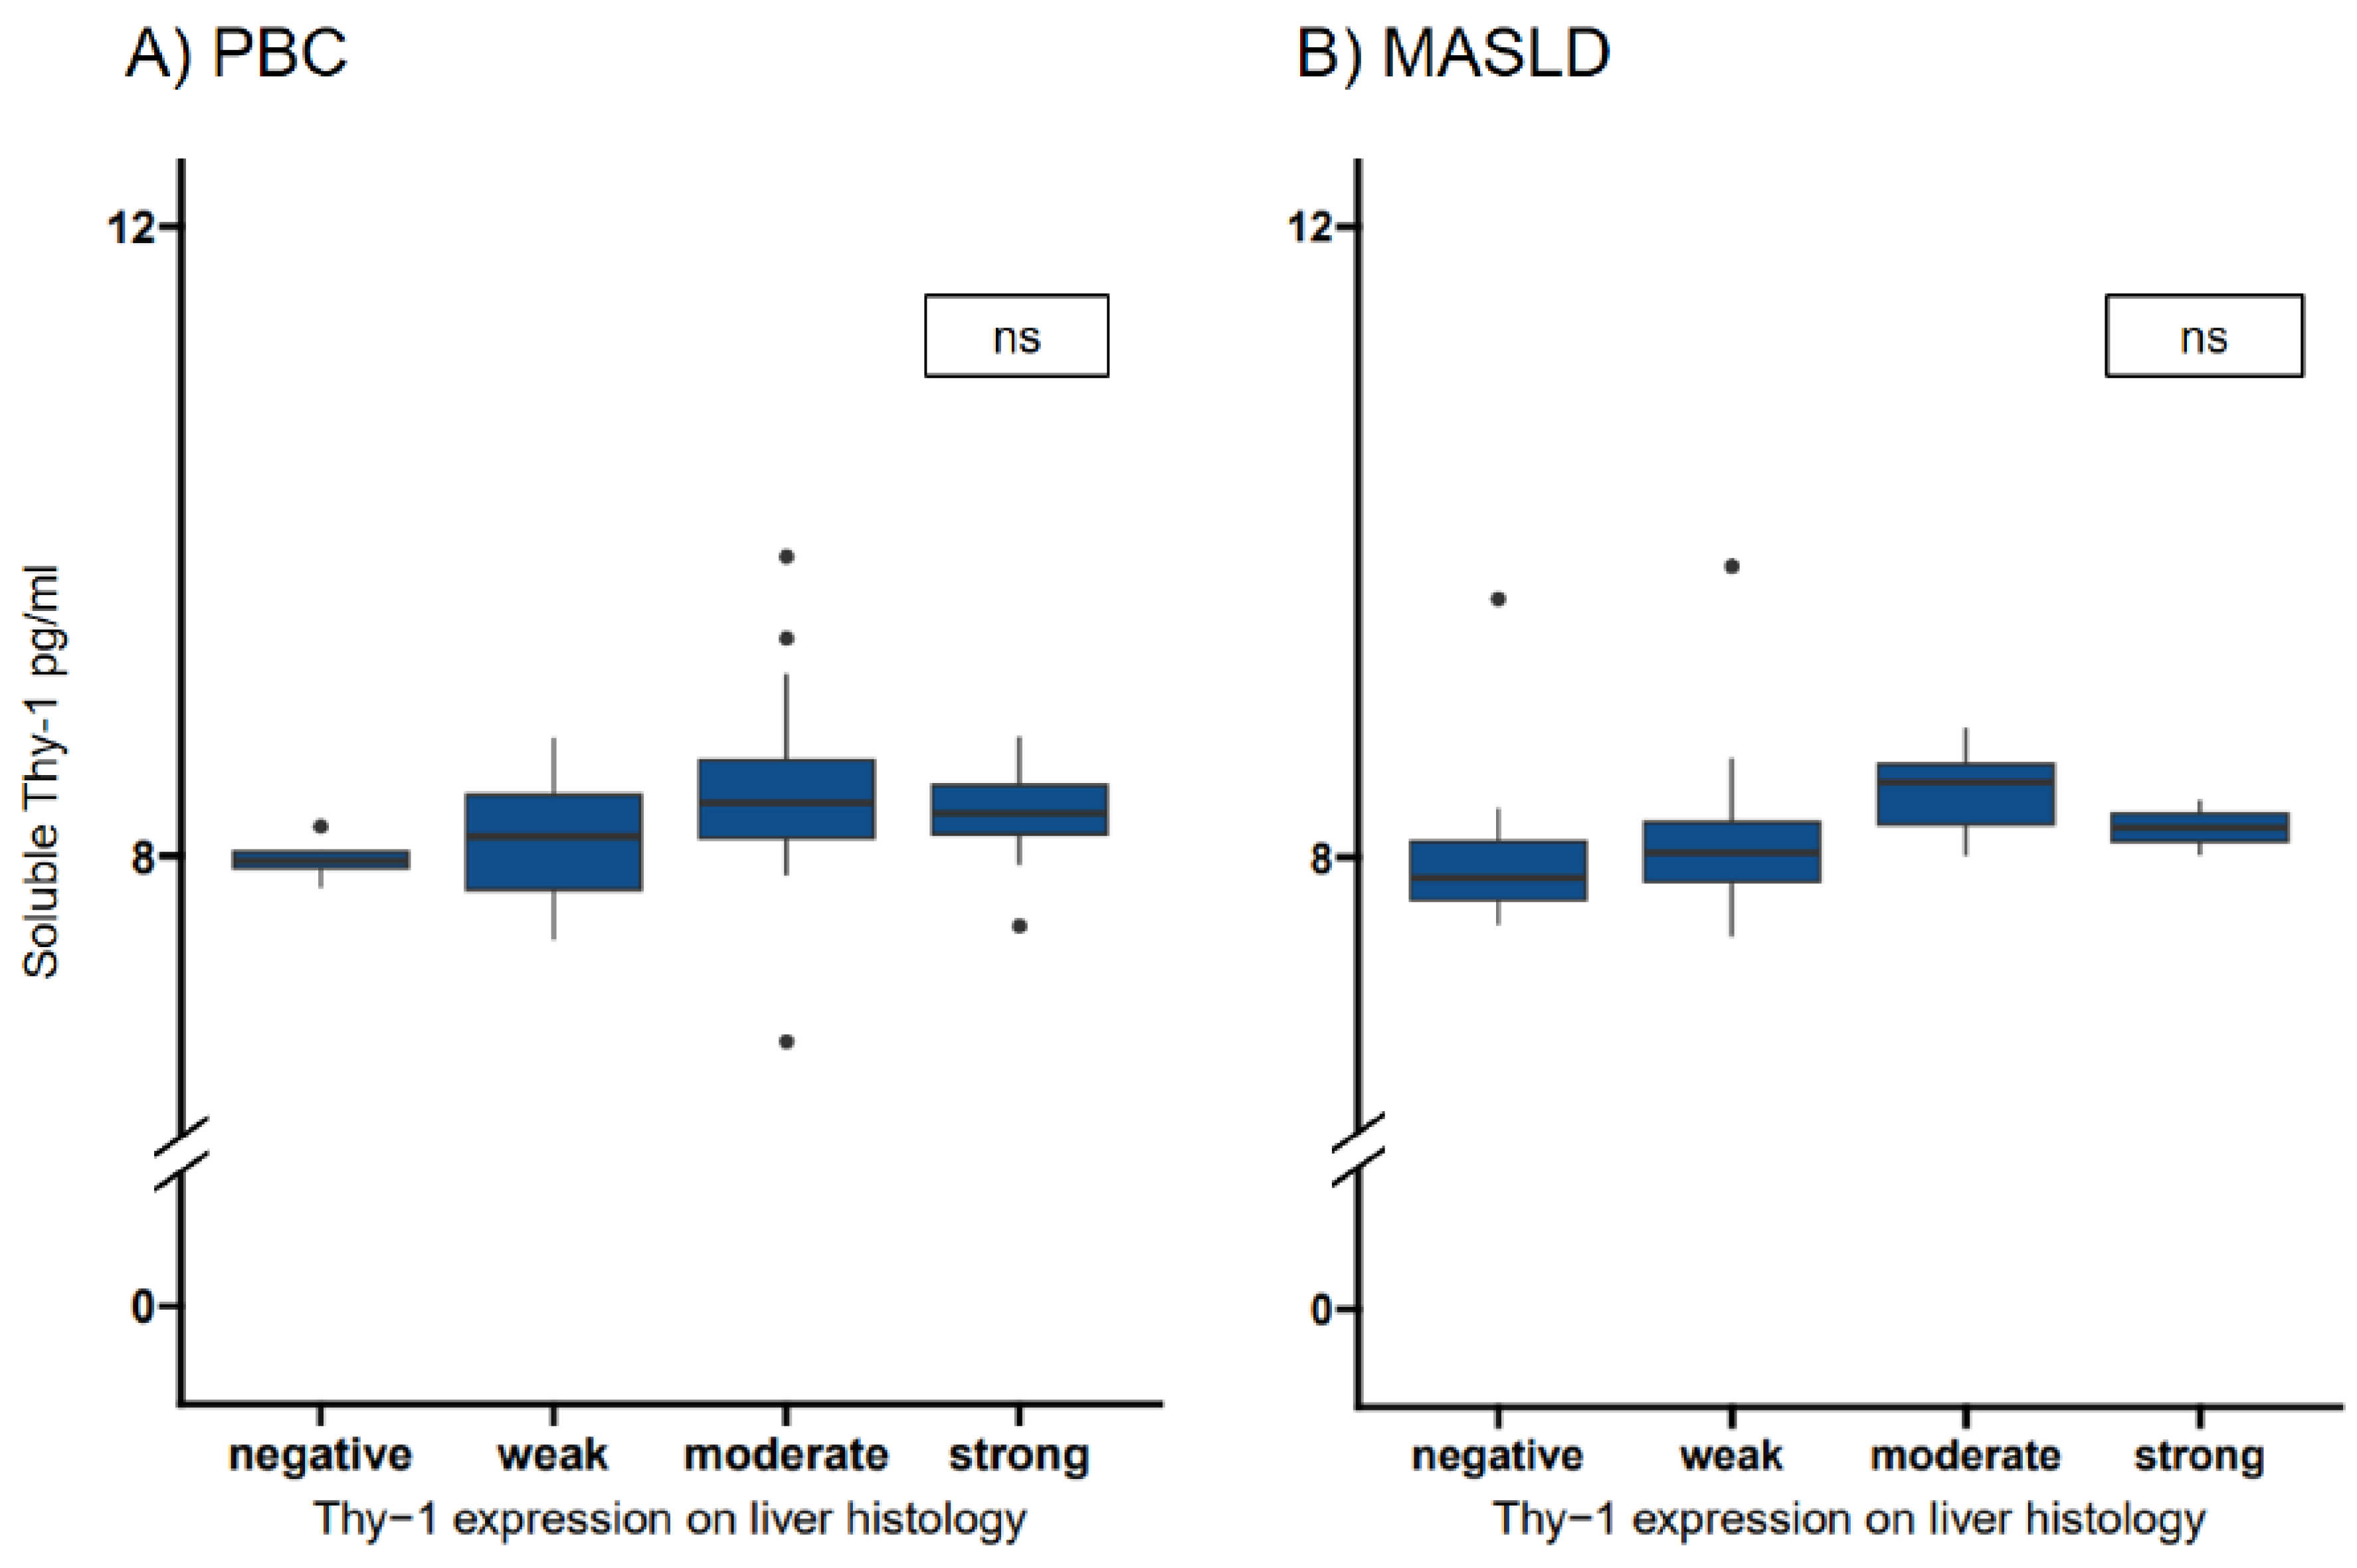
In the correlation between the intensity of Thy-1 seen in liver histology and the sThy-1 levels, we could not find significant differences between the staining intensities and the sThy-1 levels in MASLD and PBC patients with, however a significant association in the regression in patients with PBC.
Our data indicates that Thy-1 positive cells are expanding in the liver during fibrogenesis, more significantly in patients with a biliary type of liver injury, but also in patients with a hepatocellular type of liver injury. Furthermore, we have shown that the release of sThy-1 from Thy-1 positive cells is present but our data suggests that it is not relevant enough for it to be a non-invasive surrogate marker for liver fibrosis.
Thus, our research not only aligns with existing findings regarding the role in fibrogenesis of Thy-1-positive cells but also advances our understanding by delineating their activity across different liver disease contexts and its correlation to sThy-1.
Strengths and Limitations of the Study
Our study enhances the understanding of Thy-1’s role in liver fibrosis through comprehensive analysis of Thy-1 expression in liver histologies and sThy-1 levels, providing novel insights across various stages of liver fibrosis. To our knowledge, this represents the largest study of patients with PBC and MASLD analyzed for Thy-1 expression in the liver and the first study where histological Thy-1 expression and soluble Thy-1 measurements were conducted simultaneously in humans.
The significance of our study is further underscored by the rarity of PBC as a liver disease and the challenges inherent in measuring sThy-1 in experimental models. Enzymatic digestion during cell isolation can lead to the detachment of the Thy-1 molecule, potentially reassociating with other cells and yielding misleading results in cell suspension [
29].
A limitation of our study is the absence of further characterization of Thy-1 positive cells with additional markers to deepen our understanding of these cells’ roles in fibrogenesis. Additionally, the observed variability in sThy-1 measurements underscores the need for further validation of sThy-1 as a biomarker. However, these limitations pave the way for future research directions, including the detailed study of Thy-1 signaling pathways and the exploration of sThy-1 in a wider array of liver conditions. Embracing these opportunities can significantly advance our understanding and treatment of liver fibrosis.
Figure 1.
Intensity of Thy-1 expression on liver histology in patients with PBC and MASLD. Significant correlation between the Thy-1 intensity and the fibrosis grading in A) patients with PBC (OR 10.37, 95% CI 4.30-30.36, p <0.0001) and B) patients with MASLD (OR 3.8, 95% CI 1.63-10.02, p=0.004). MASLD, metabolic dysfunction-associated steatotic liver disease; PBC, primary biliary cholangitis.
Figure 2.
Localization of Thy-1 expression on liver histology. Portal Thy-1 expression was present in most patients with PBC (OR 8.36, CI 1.01-171.78, p=0.068) (A) and MASLD (OR 15.78, CI 3.10-103.73, p=0.002) (B) even in patients with mild fibrosis. Sinusoidal expression of Thy-1 was significantly more present in patients with advanced fibrosis in patients with PBC (OR 6.05, CI 2.30-17.11, p<0.001) (C), but not significantly correlated in patients with MASLD (OR 3.73, CI 0.98-15.55, p=0.059) (D). MASLD, metabolic dysfunction-associated steatotic liver disease; PBC, primary biliary cholangitis; SMA, smooth muscle actin antibody.
Figure 3.
Transformed soluble Thy-1 measurements in relation to fibrosis groups in patients with PBC and MASLD. The median (IQR25-IQR75) sThy-1 measurements according to fibrosis groups in patients with PBC (A) and MASLD (B). Significant differences between groups are indicated. ns indicates a value ≥0.05, * indicates a p-value of <0.05, ** indicates a p-value <0.01, *** indicates a p-value <0.001. HC, healthy controls; MASLD, metabolic dysfunction-associated steatotic liver disease; ns, not significant; PBC, primary biliary cholangitis.
Figure 4.
Transformed soluble Thy-1 measurements in relation to Thy-1 intensities in patients with PBC and MASLD. The median (IQR25-IQR75) sThy-1 measurements according to Thy-1 intensities in patients with PBC (A) and MASLD (B). Significant differences between groups are indicated. ns indicates a value ≥0.05,* indicates a p-value of <0.05, ** indicates a p-value <0.01, *** indicates a p-value <0.001. HC, healthy controls; MASLD, metabolic dysfunction-associated steatotic liver disease; ns, not significant; PBC, primary biliary cholangitis.
Table 1.
Baseline characteristics from patients with primary biliary cholangitis, metabolic dysfunction-associated steatotic liver disease and healthy controls at the time point of sample acquisition.
Table 1.
Baseline characteristics from patients with primary biliary cholangitis, metabolic dysfunction-associated steatotic liver disease and healthy controls at the time point of sample acquisition.
| |
PBC
n=69 |
MASLD
n=49 |
Healthy controls
n=20 |
Missing values
PBC/MASLD/HC |
p-value |
| Demographics |
|
|
|
|
|
| Female sex, n (%) |
57 (82.6) |
19 (38.8) |
18 (90) |
0(0)/0(0)/0(0) |
<0.001* |
| Age at baseline, years |
59 (46-66) |
55.0 (44.0-60.0) |
53.5 (49.5-56.3) |
0(0)/0(0)/0(0) |
0.091 |
| Body mass index, kg/m2
|
26.3 (23-30) |
30.7 (27.8-35.0) |
|
0(0)/0(0)/20(100) |
<0.001* |
| Liver assessment |
|
|
|
|
|
| ALT, x ULN |
1.7 (1-2.5) |
1.3 (0.9-2.0) |
|
0(0)/0(0)/20(100) |
0.203 |
| Alkaline phosphatase, x ULN |
1.7 (1.1-2.8) |
0.7 (0.5-1.0) |
|
0(0)/0(0)/20(100) |
<0.001* |
| gGT, x ULN |
5.5 (3.2-9.5) |
1.5 (0.9-3.5) |
|
0(0)/0(0)/20(100) |
<0.001* |
| Bilirubin total, μmol/l (<17 μmol/l) |
11 (8-16) |
11 (7.75-14) |
|
0(0)/1(2)/20(100) |
0.541 |
| INR (<1.2) |
1 (1-1.04) |
1.03 (1-1.1) |
|
0(0)/0(0)/20(100) |
0.008* |
| Immunoglobulin M g/l (0.4-2.3 g/l) |
3.18 (2-4.87) |
1.42 (0.76-1.75) |
|
2(2.9)/23(47)/20(100) |
<0.001* |
| Ferritin µg/l (10-120 µg/l) |
109 (65.5-202) |
286 (130-547) |
|
26(37.7)/4(8.2)/20(100) |
0.002* |
| M30-Apoptosens, U/L (<200) |
287 (183-423) |
280.5 (172-567.8) |
|
48(69.6)/17(34.7)/20(100) |
0.848 |
| Fibroscan at baseline, kPa |
7.95 (4.95-14.8) |
8.8 (6.4-15.38) |
|
3(4.4)/5(10.2)/20(100) |
0.273 |
| Signs of portal hypertension, n (%) |
15 (21.7) |
11 (22.4) |
|
0(0)/0(0)/20(100) |
1.000 |
| Histological fibrosis grading |
|
|
|
|
|
| Mild fibrosis, n (%) |
21 (30.4) |
12 (24.5) |
|
0(0)/0(0)/20(100) |
0.616 |
| Moderate fibrosis, n (%) |
22 (31.9) |
22 (44.9) |
|
0(0)/0(0)/20(100) |
0.212 |
| Advanced fibrosis, n (%) |
26 (37.6) |
15 (30.6) |
|
0(0)/0(0)/20(100) |
0.550 |
Table 2.
Assessment of the correlation between fibrosis grading and Thy-1 intensity using ordinal logistic regression.
Table 2.
Assessment of the correlation between fibrosis grading and Thy-1 intensity using ordinal logistic regression.
| |
Odds ratio |
p-value |
CI |
| Primary biliary cholangitis |
| Association between fibrosis grading and the following parameters |
| Thy-1 expression overall |
10.37 |
<0.001* |
4.30-30.36 |
| Thy-1 expression overall adjusted |
10.78 |
<0.001* |
4.42-32.04 |
| Thy-1 expression portal |
8.36 |
0.068 |
1.01-171.78 |
| Thy-1 expression portal adjusted |
8.42 |
0.071 |
1.07-175.40 |
| Thy-1 expression sinusoidal |
6.05 |
<0.001* |
2.30-17.11 |
| Thy-1 expression sinusoidal adjusted |
6.48 |
<0.001* |
2.42-18.67 |
|
Metabolic dysfunction-associated steatotic liver disease
|
| Association between fibrosis grading and the following parameters |
| Thy-1 expression overall |
3.8 |
0.004* |
1.63-10.02 |
| Thy-1 expression overall adjusted |
3.46 |
0.008* |
1.45-9.32 |
| Thy-1 expression portal |
15.78 |
0.002* |
3.10-103.73 |
| Thy-1 expression portal adjusted |
16.84 |
0.002* |
3.12-118.61 |
| Thy-1 expression sinusoidal |
3.73 |
0.059 |
0.98-15.55 |
| Thy-1 expression sinusoidal adjusted |
3.06 |
0.148 |
0.69-14.86 |


