Submitted:
17 May 2024
Posted:
17 May 2024
You are already at the latest version
Abstract

Keywords:
1. Introduction
2. Material and Methods
2.1. Animal Procurement and Maintenance
2.2. Experimental Design
| Sl. No. | Groups | Treatment | No. of animals | Duration |
|---|---|---|---|---|
| 1. | Control (CON) | Normal saline | 06 | 21 days |
| 2. | Dexamethasone (DEX) | 70 µg/100 g body weights dexamethasone | 06 | |
| 3. | Dexamethasone (DEX) + Melatonin (MEL) | 70 µg/100 g body weights DEX and 200µg/100g body weight MEL | 06 | |
| 4. | Melatonin (MEL) | 200µg/100g body weight MEL | 06 |
2.3. Drugs and Treatment
2.4. Tissue Collection and Processing
2.5. Parameters
2.5.1. q RT-PCR
| Sl. No. | Primer | Forward & Reverse | 5ꞌ – 3ꞌ sequence |
|---|---|---|---|
| 1. | AR | Forward | AGGAACTTGATCGCATCATTGC |
| Reverse | CTGCCATCATTTCAGGAA | ||
| 2. | MT1 | Forward | CAGTACGACCCCCGGATCTA |
| Reverse | GGCAATCGTGTACGCCG | ||
| 3. | MT2 | Forward | ATGTTCGCAGTGTTTGTGGTTT |
| Reverse | ACTGCAAGGCCAATACAGTTGA | ||
| 4. | GAPDH | Forward | CCTCAAGATTGTCAGCAATG |
| Reverse | CAGTCTTCTGAGTGGCAGTG |
2.5.2. Hormonal Assay
2.5.3. Histological Preparation
2.5.4. Single-Cell Gel Electrophoresis (Comet Assay)
2.5.5. Biochemical Parameters
Lipid Peroxidation Assay
Analysis of Protein
Superoxide Dismutase (SOD) Assay
Estimation of Catalase (CAT) Activity
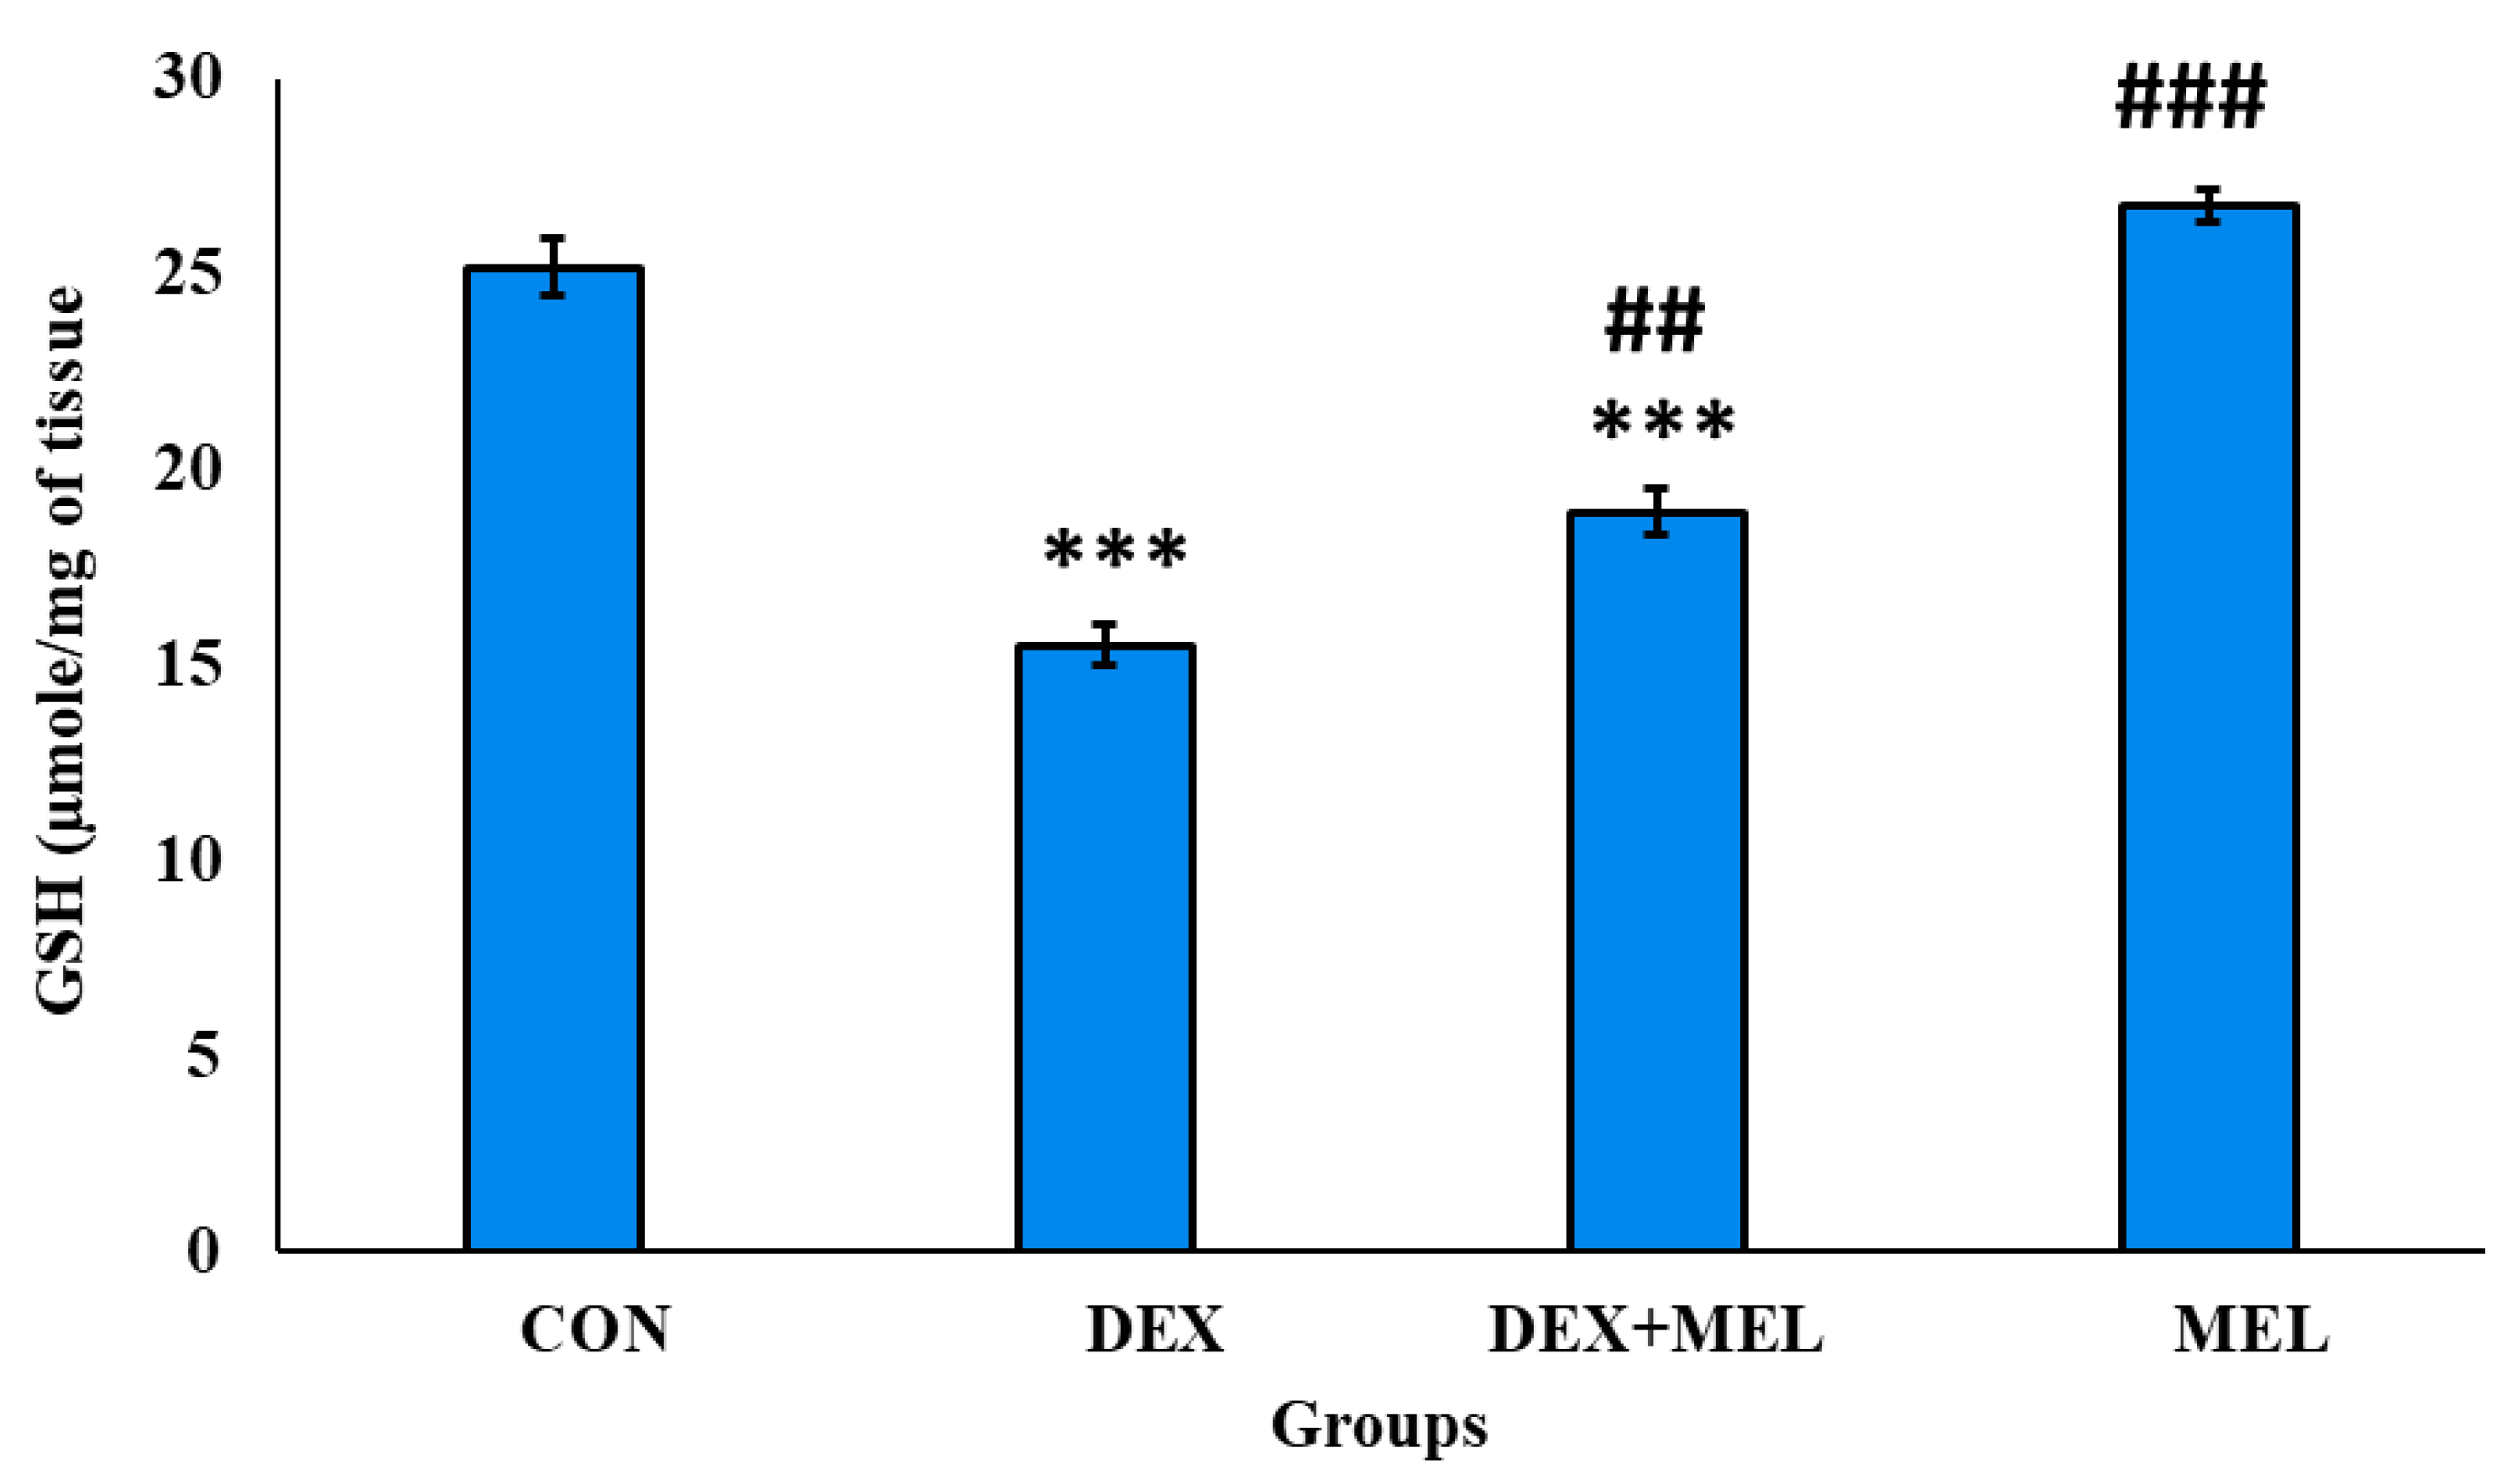
Reduced Glutathione (GSH) Assay
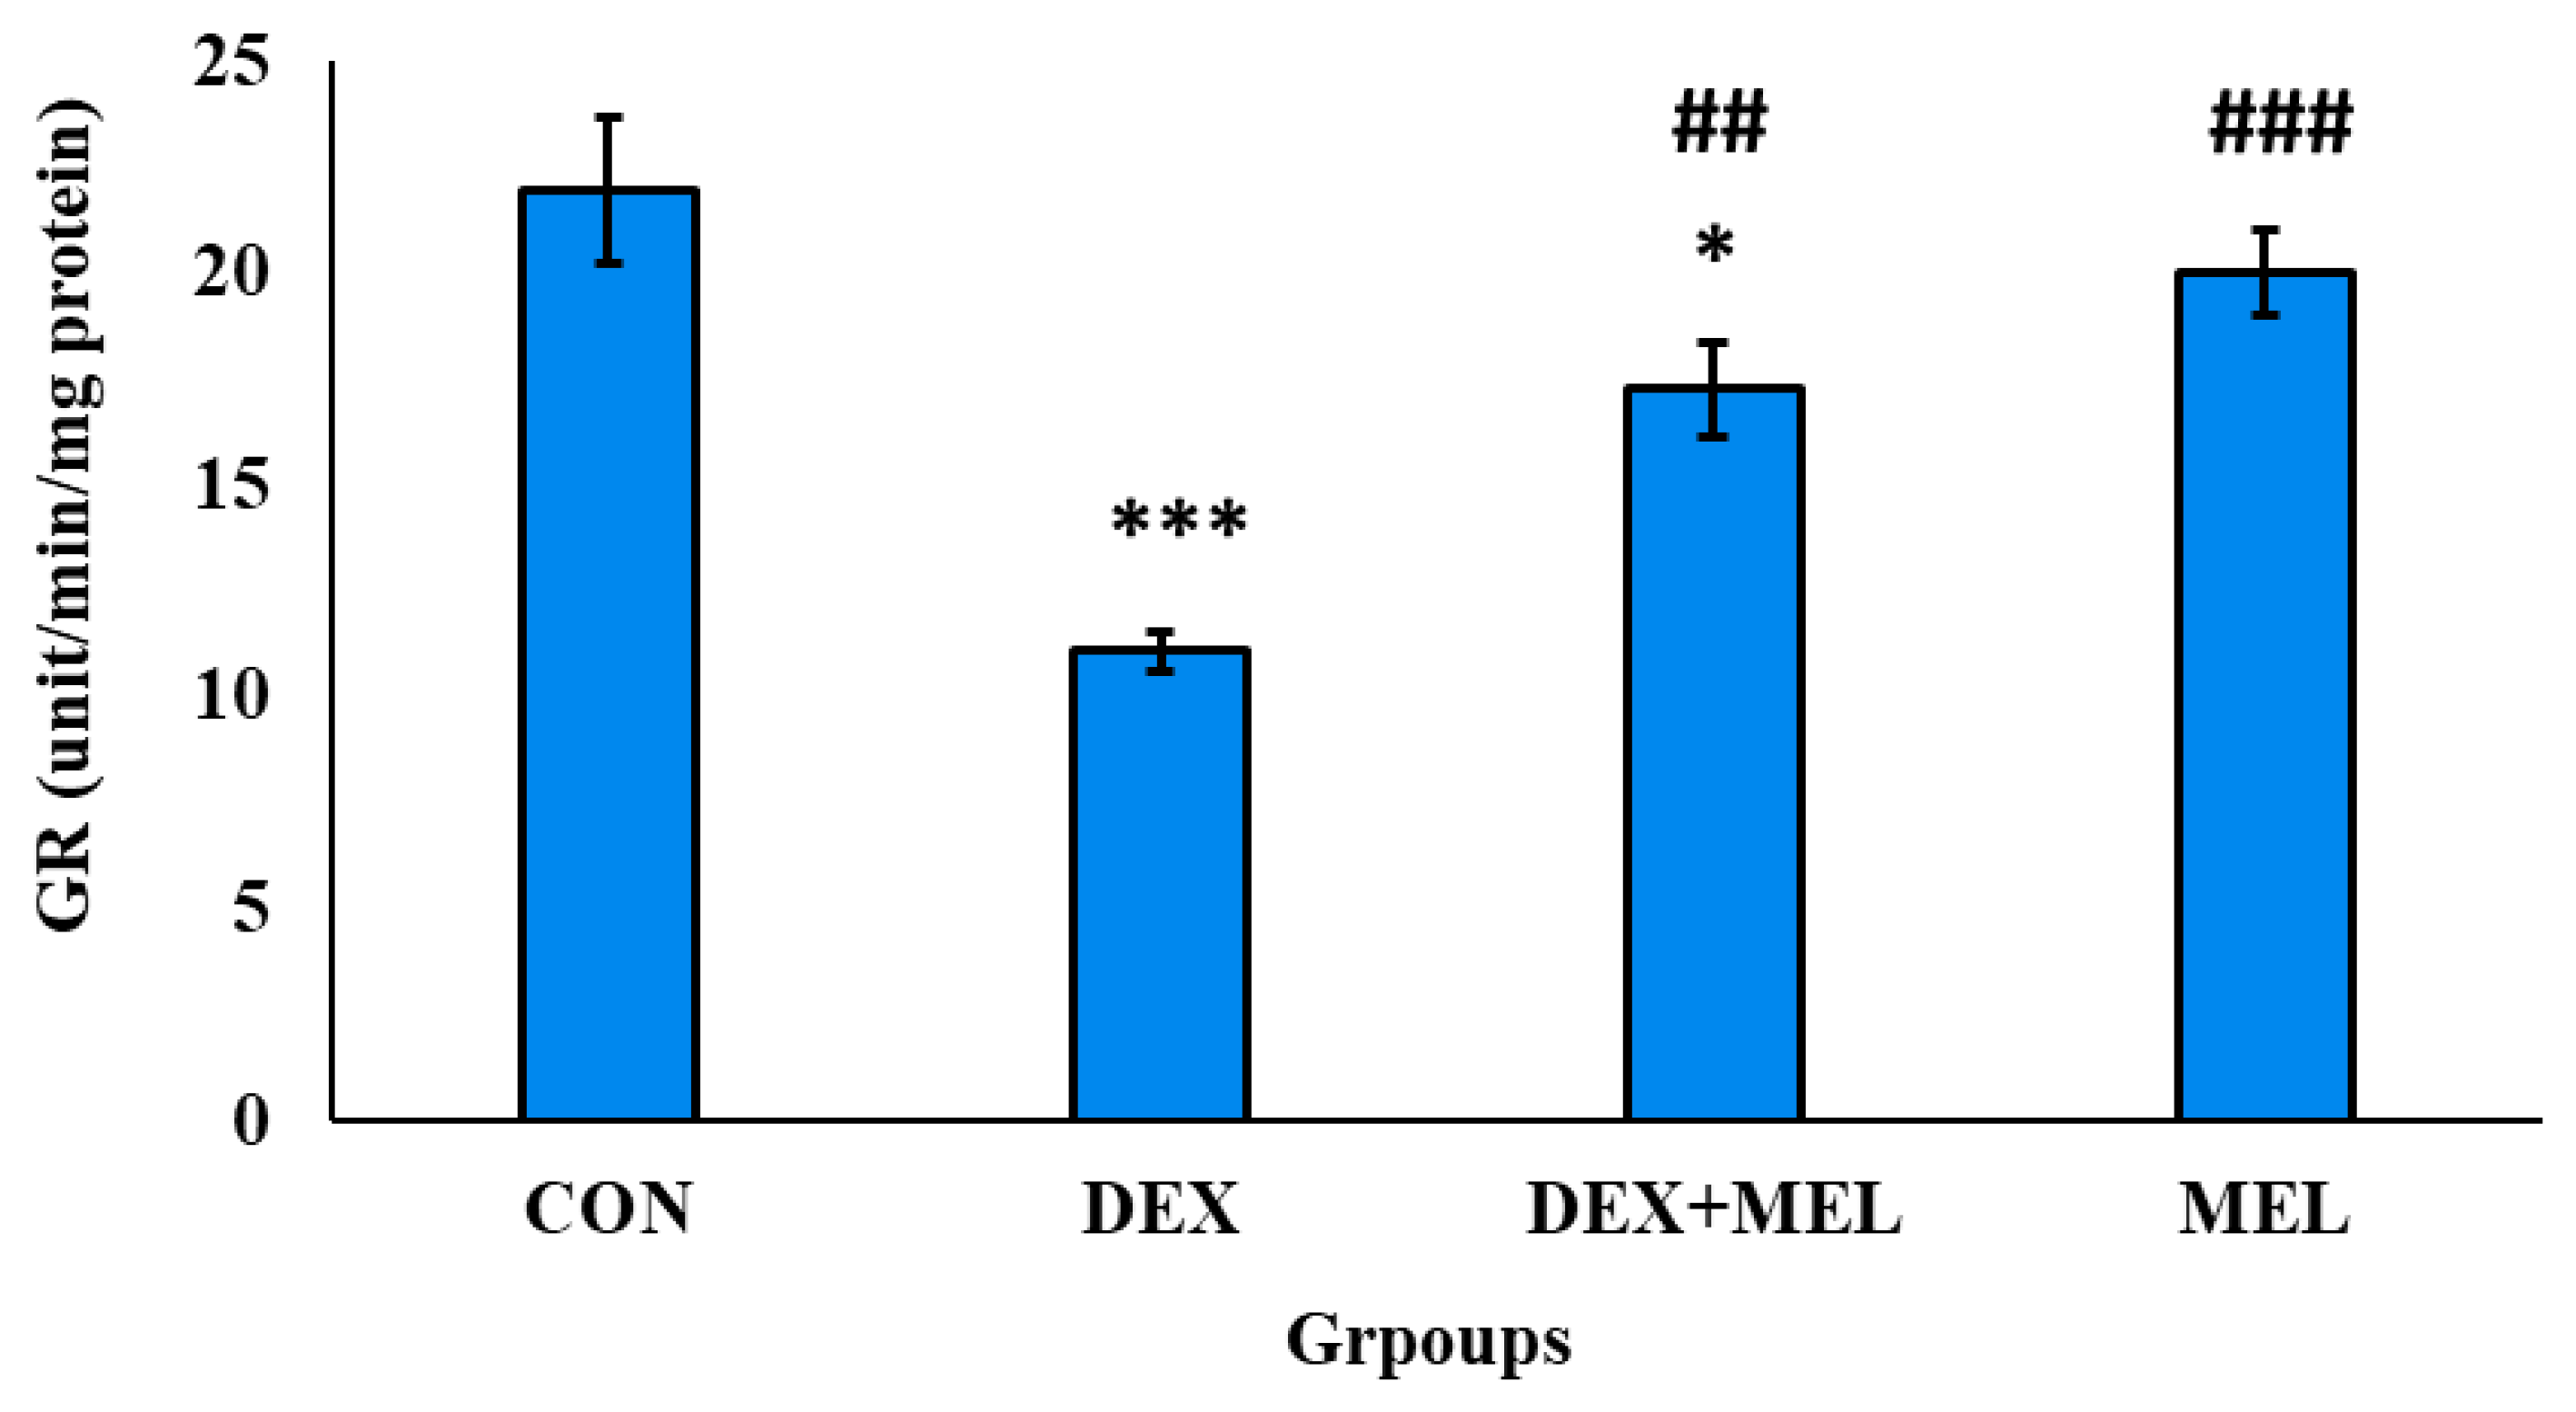
Glutathione Reductase (GR) Assay
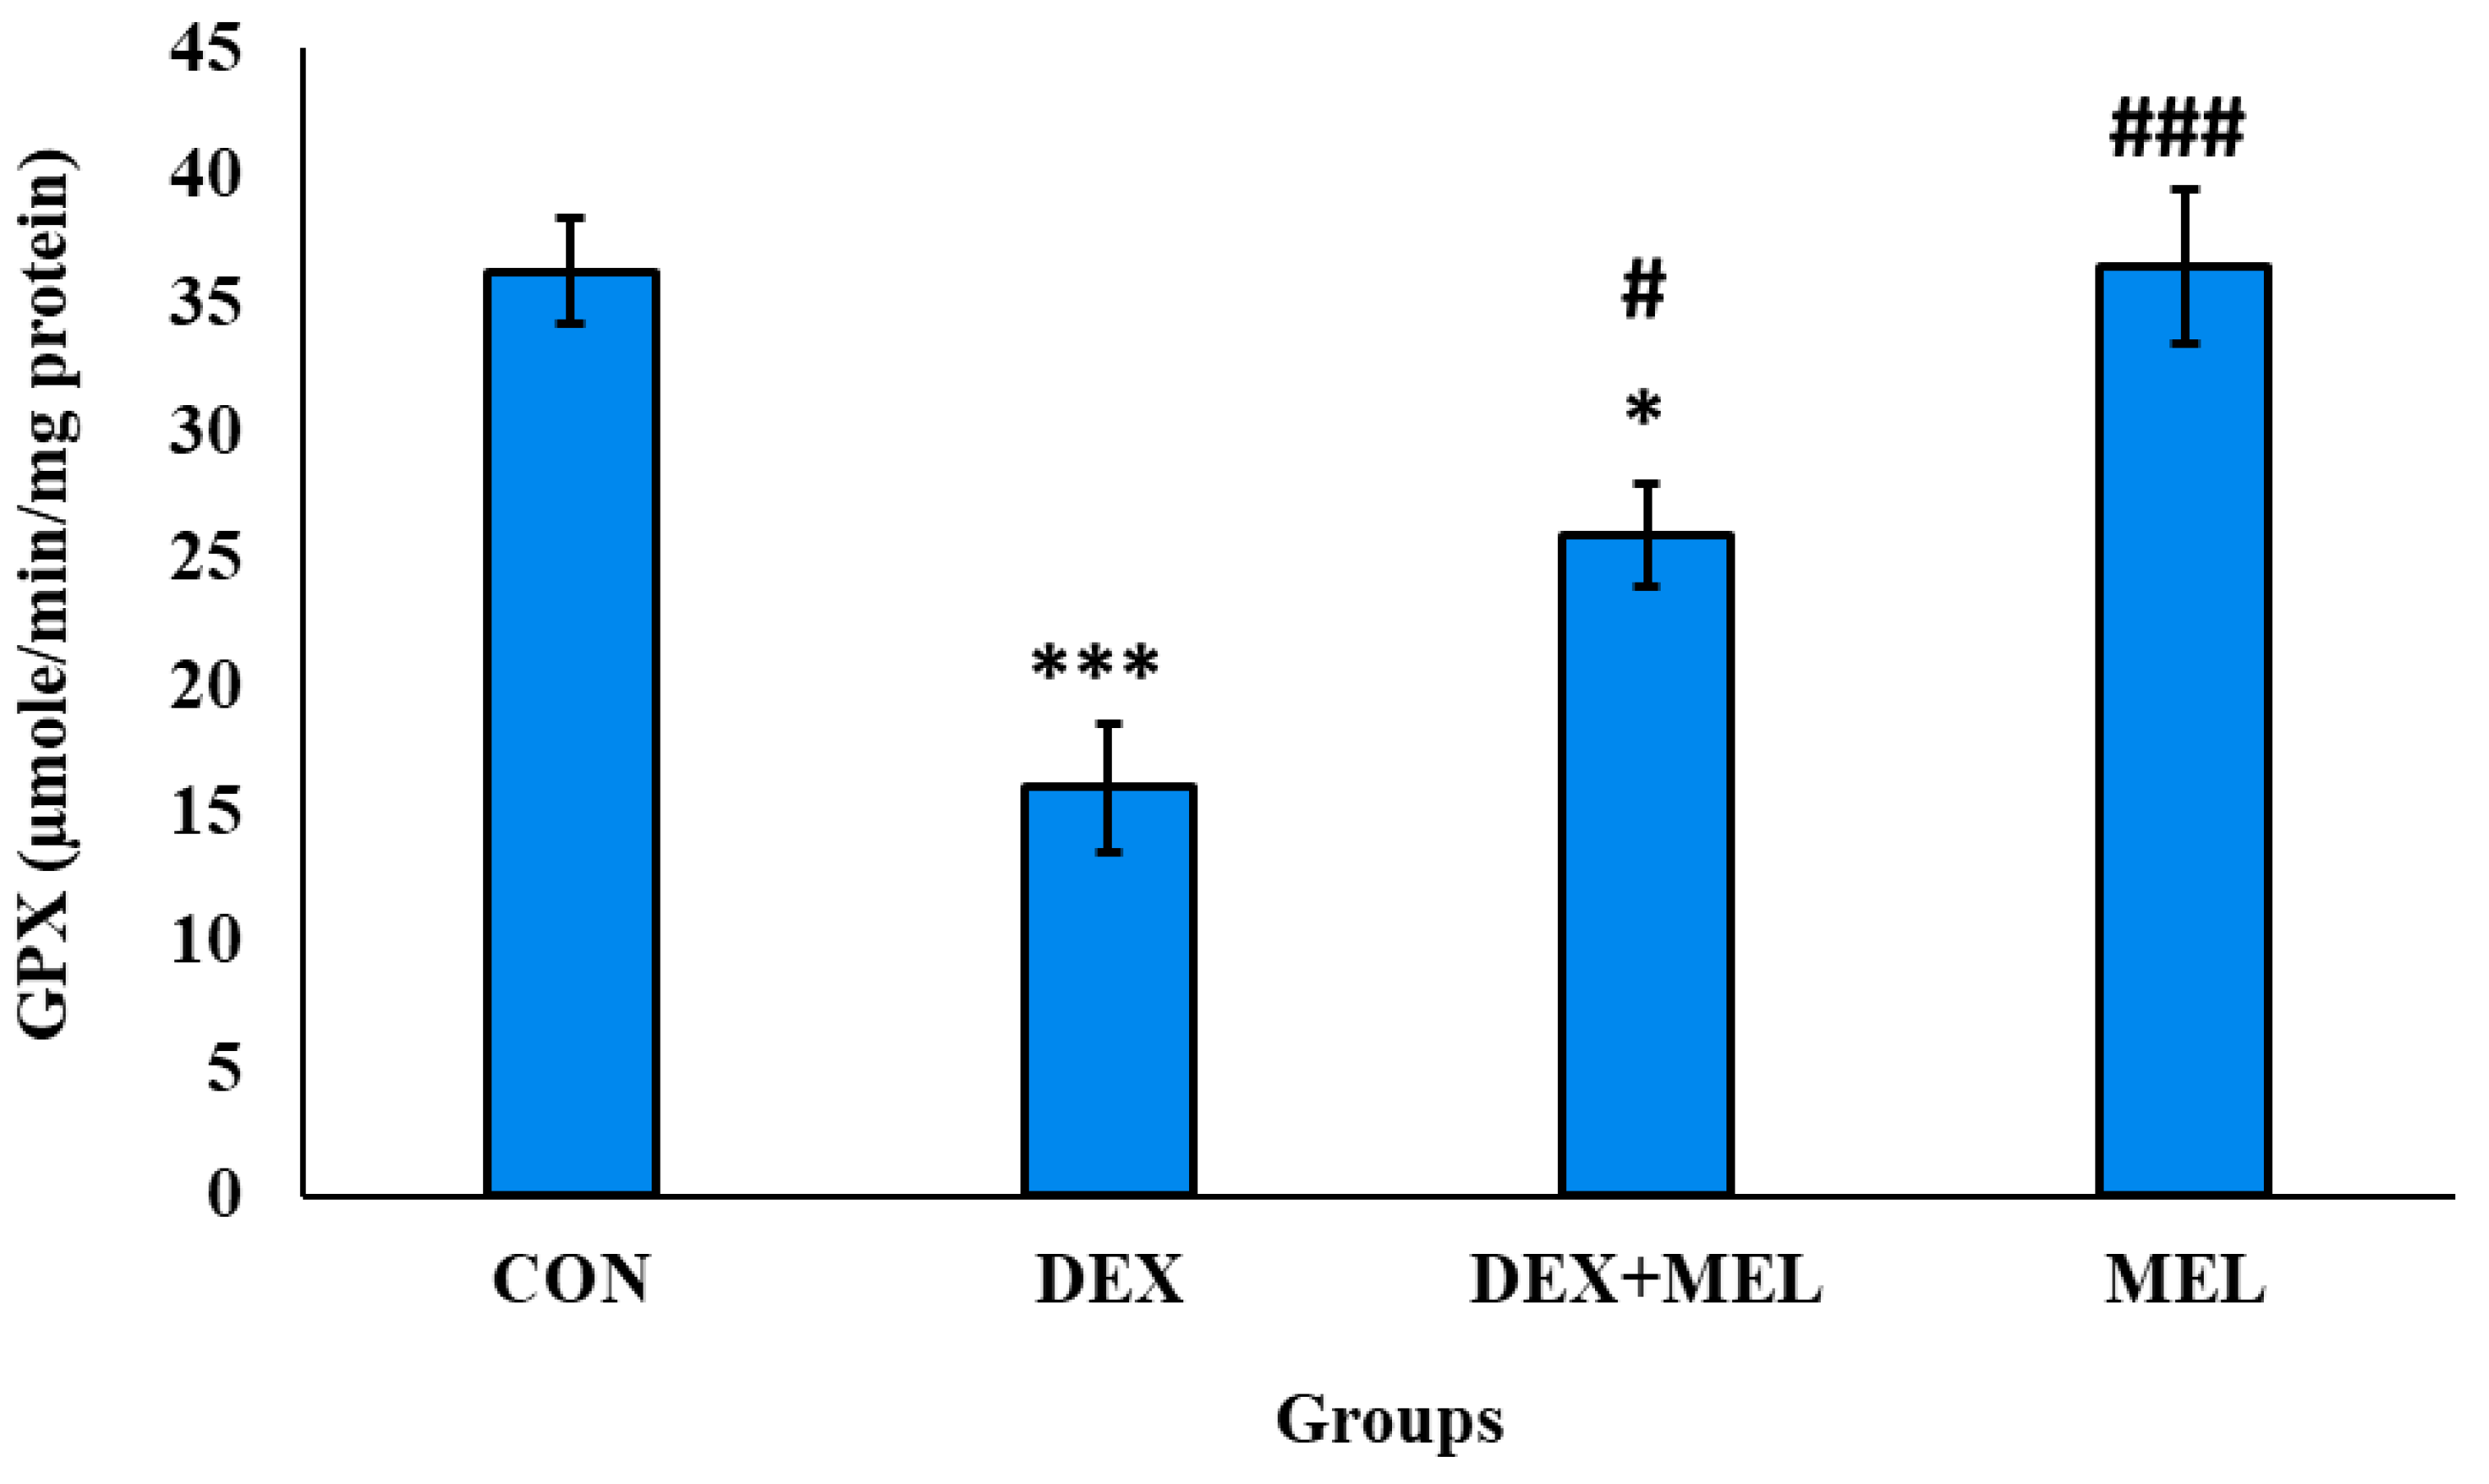
Glutathione Peroxidase (GPX) Assay
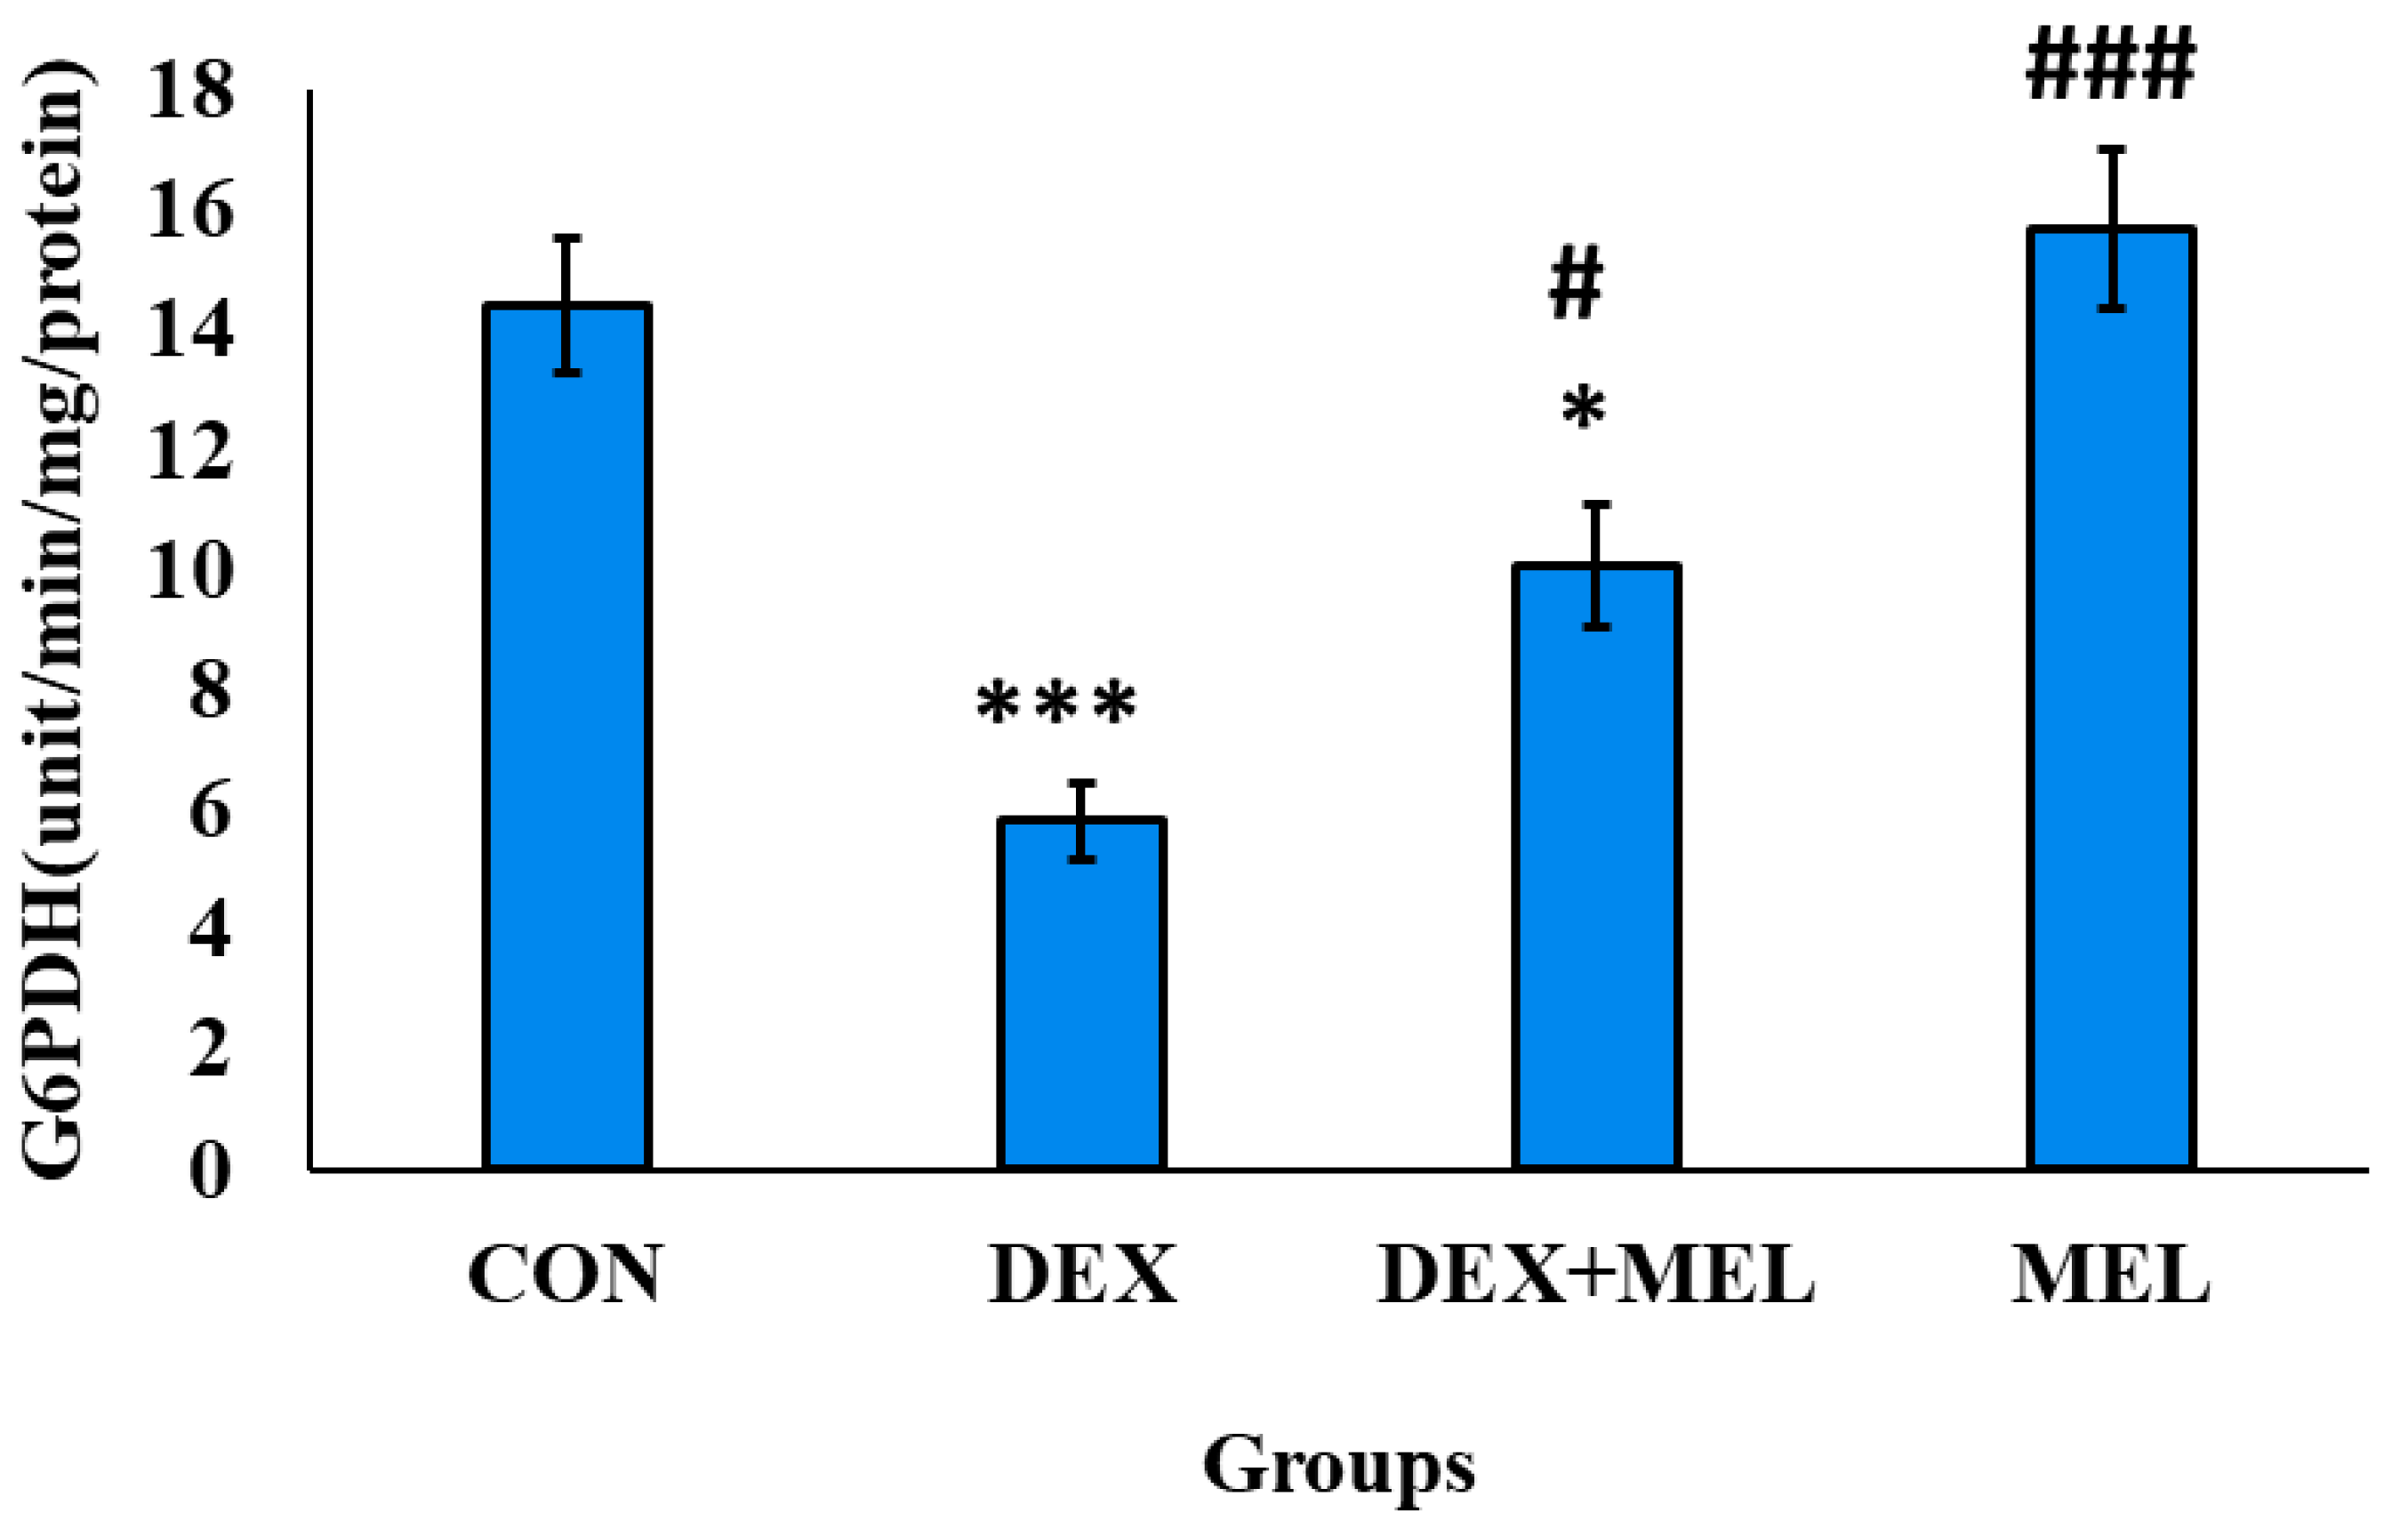
Glutathione-6- Peroxidase (G6PDH) Assay
Glutathione- S-Transferase (GST) Assay
2.6. Analysis of Data
3. Results
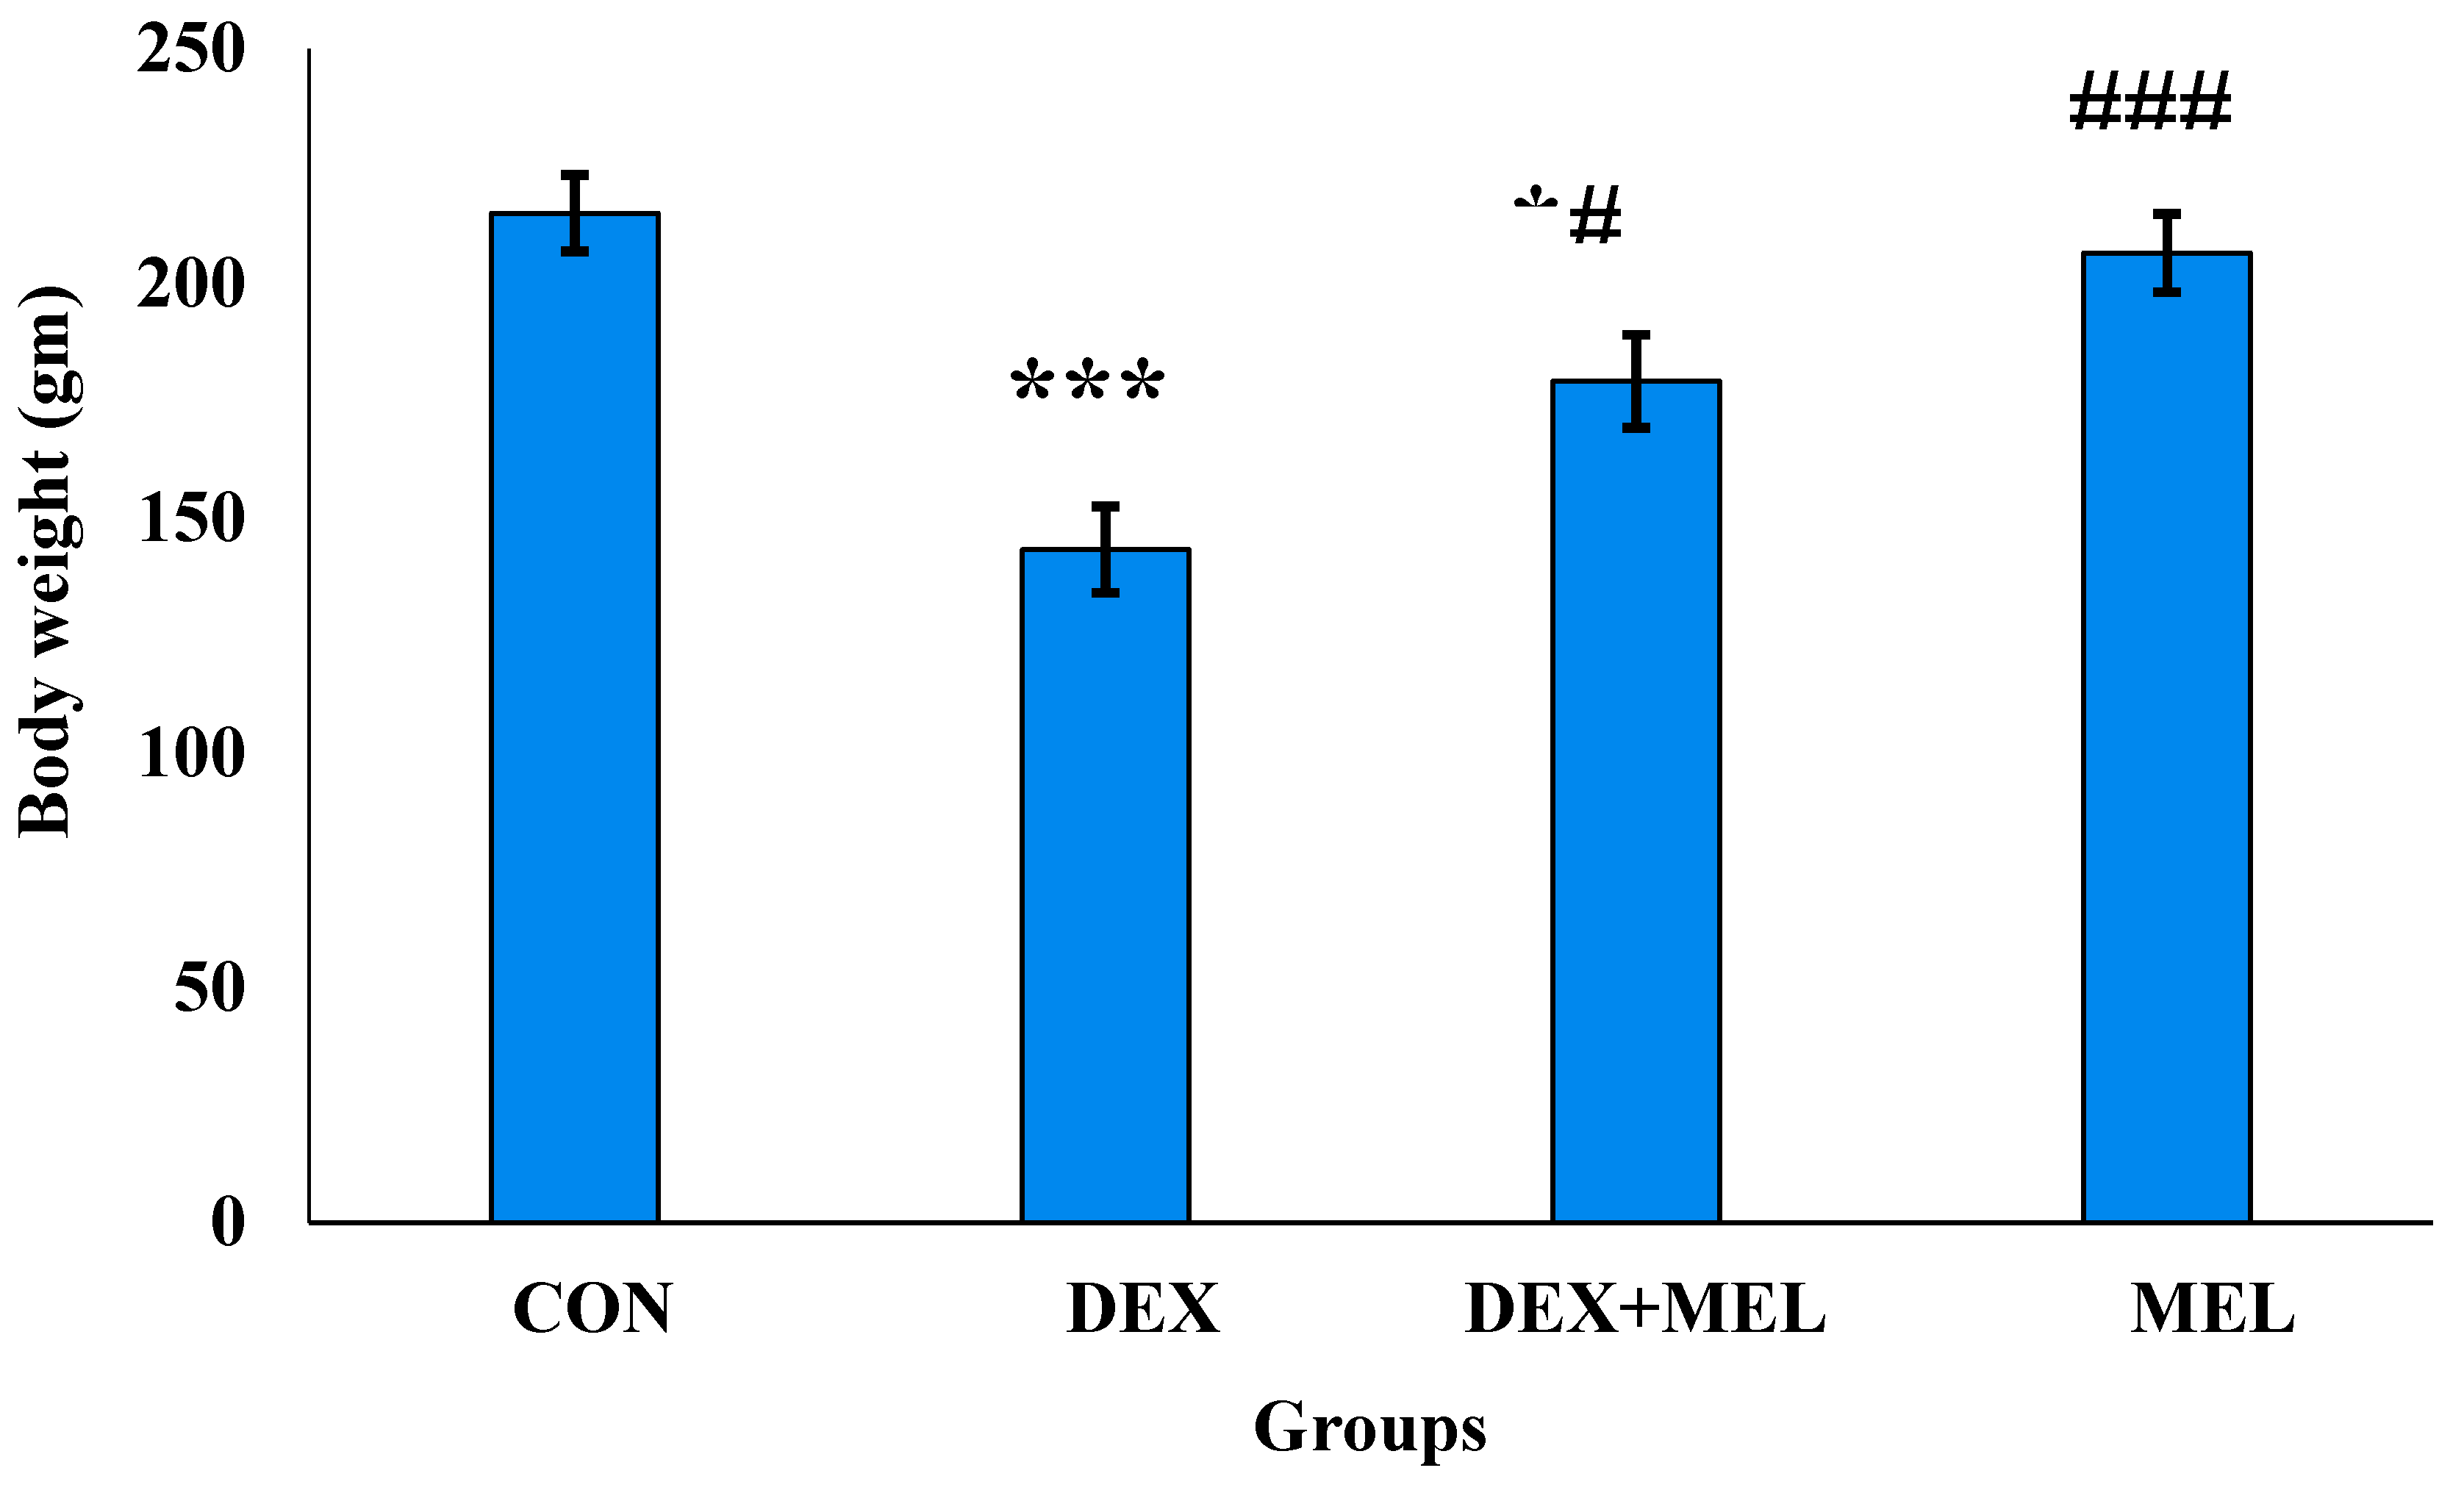
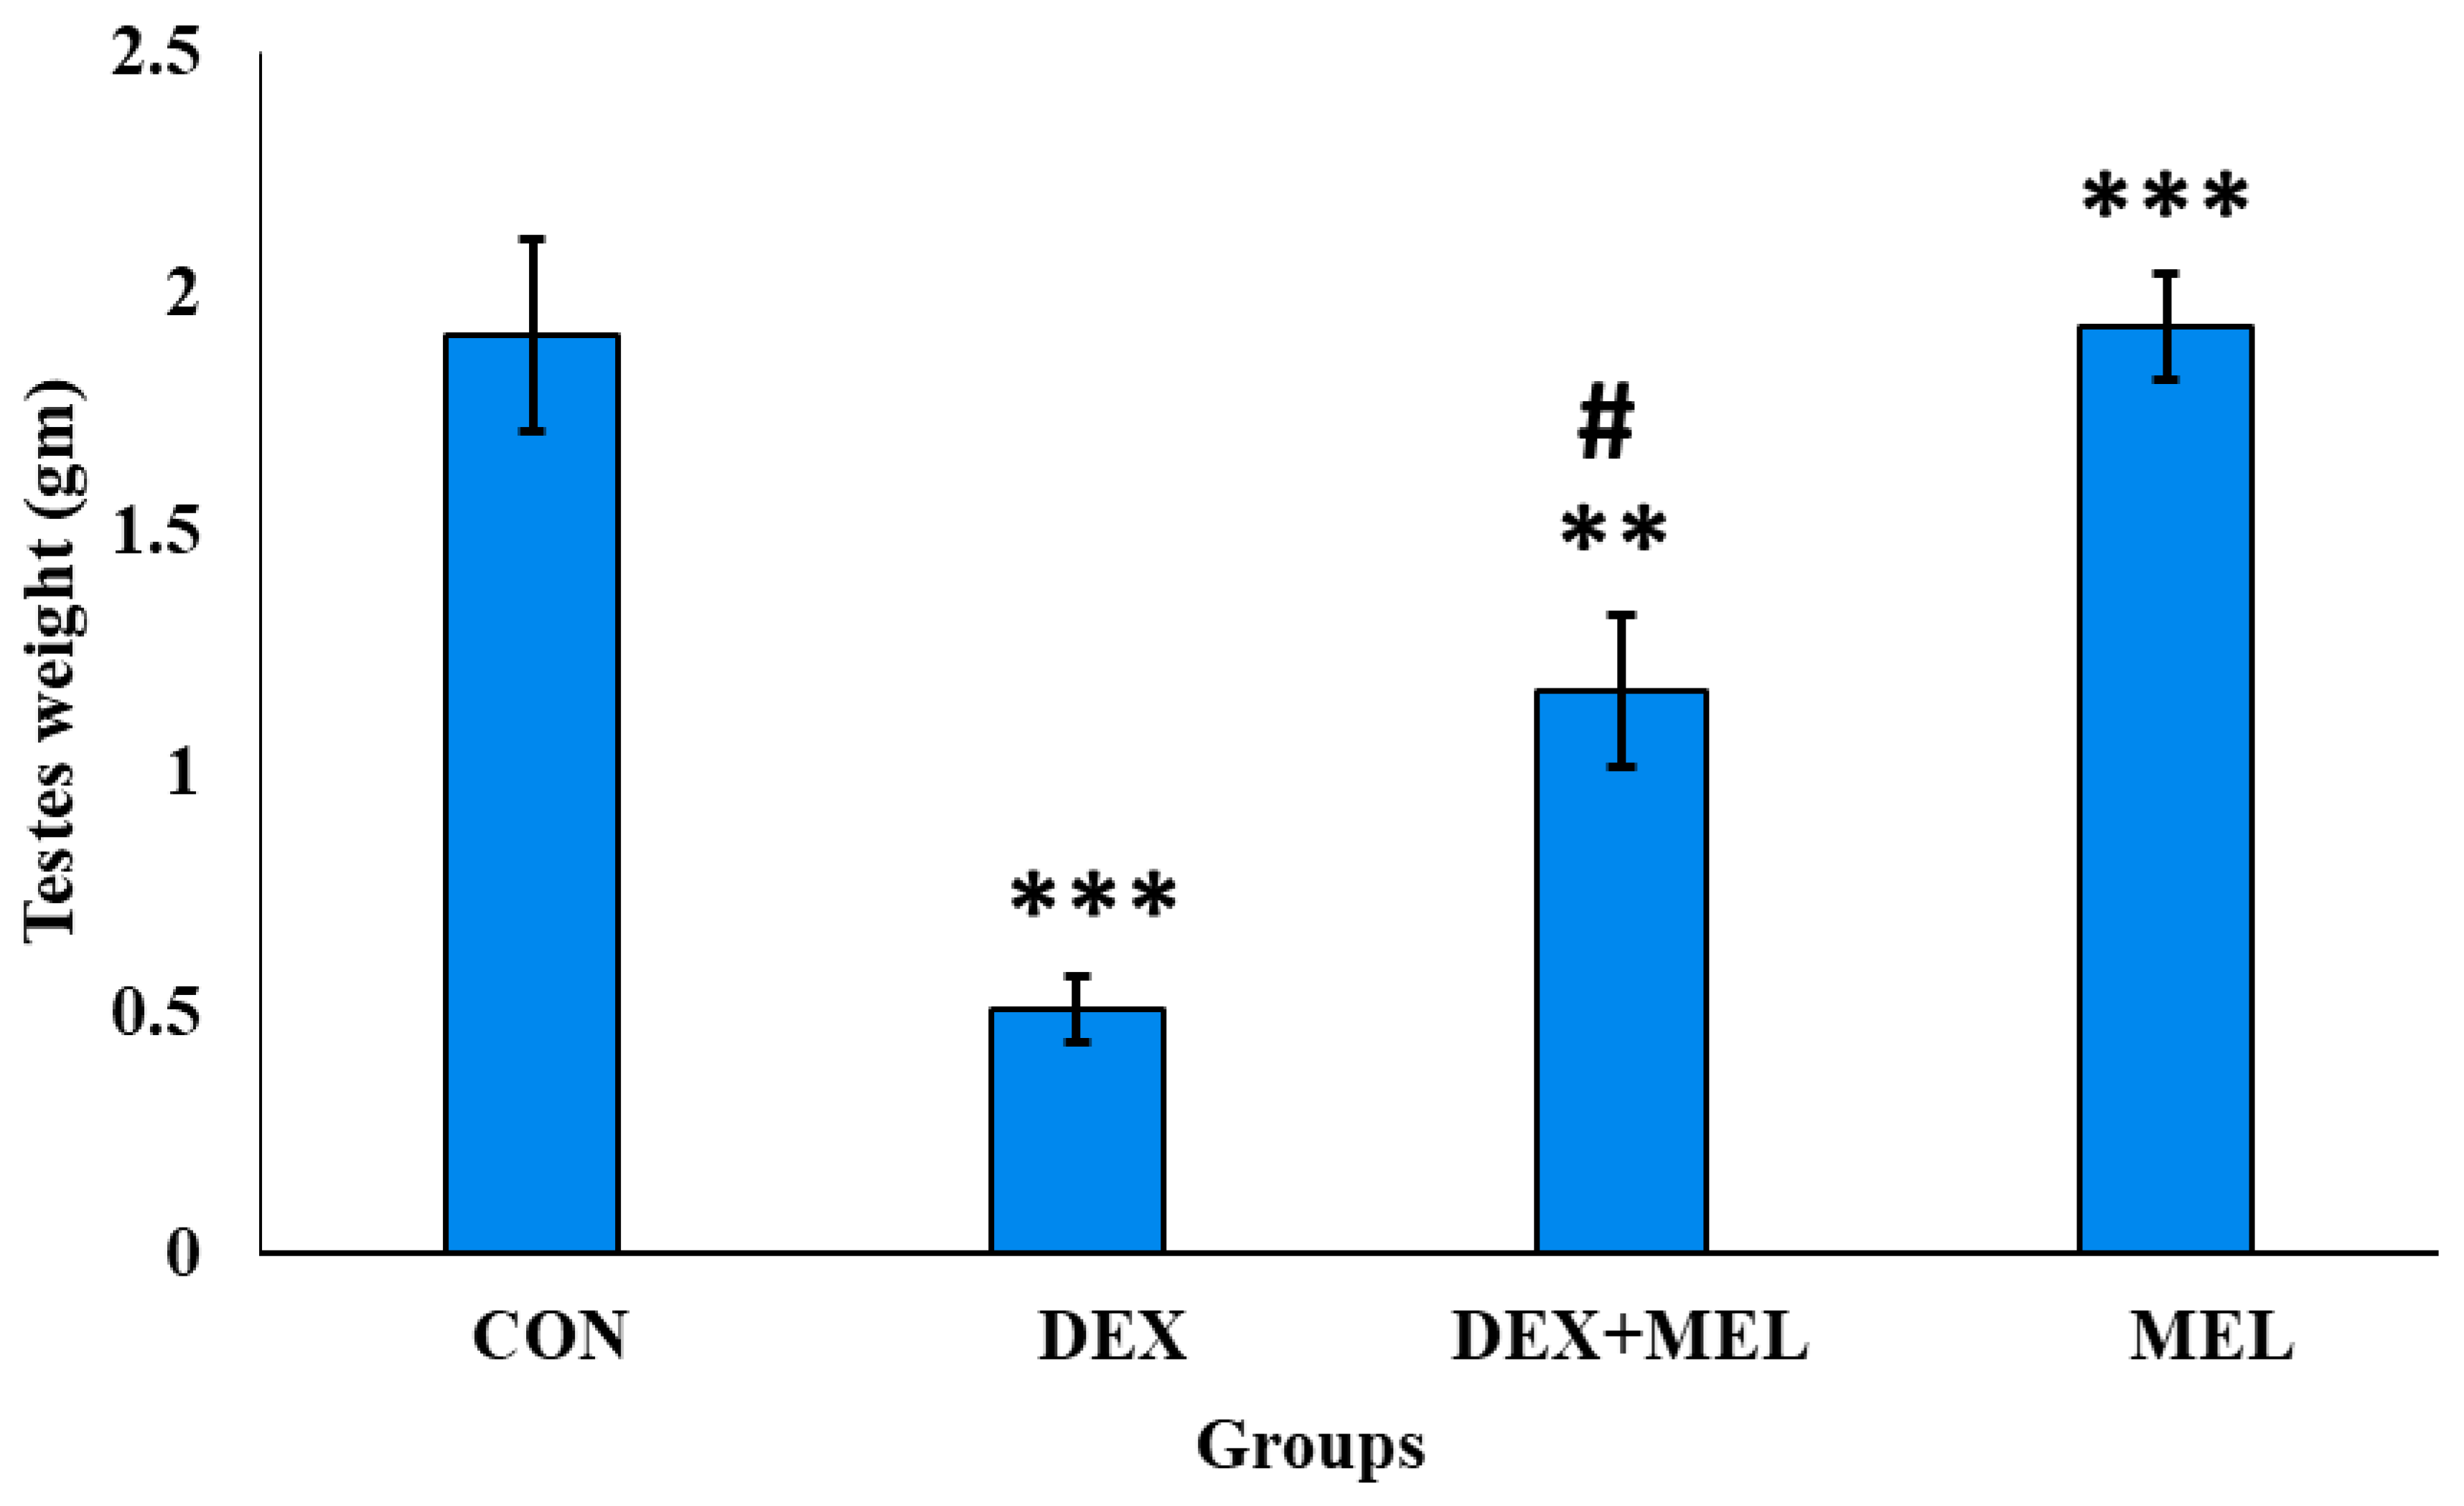
3.1. Effect of Dexamethasone (DEX) and Melatonin (MEL) on the Body and Organ Weight
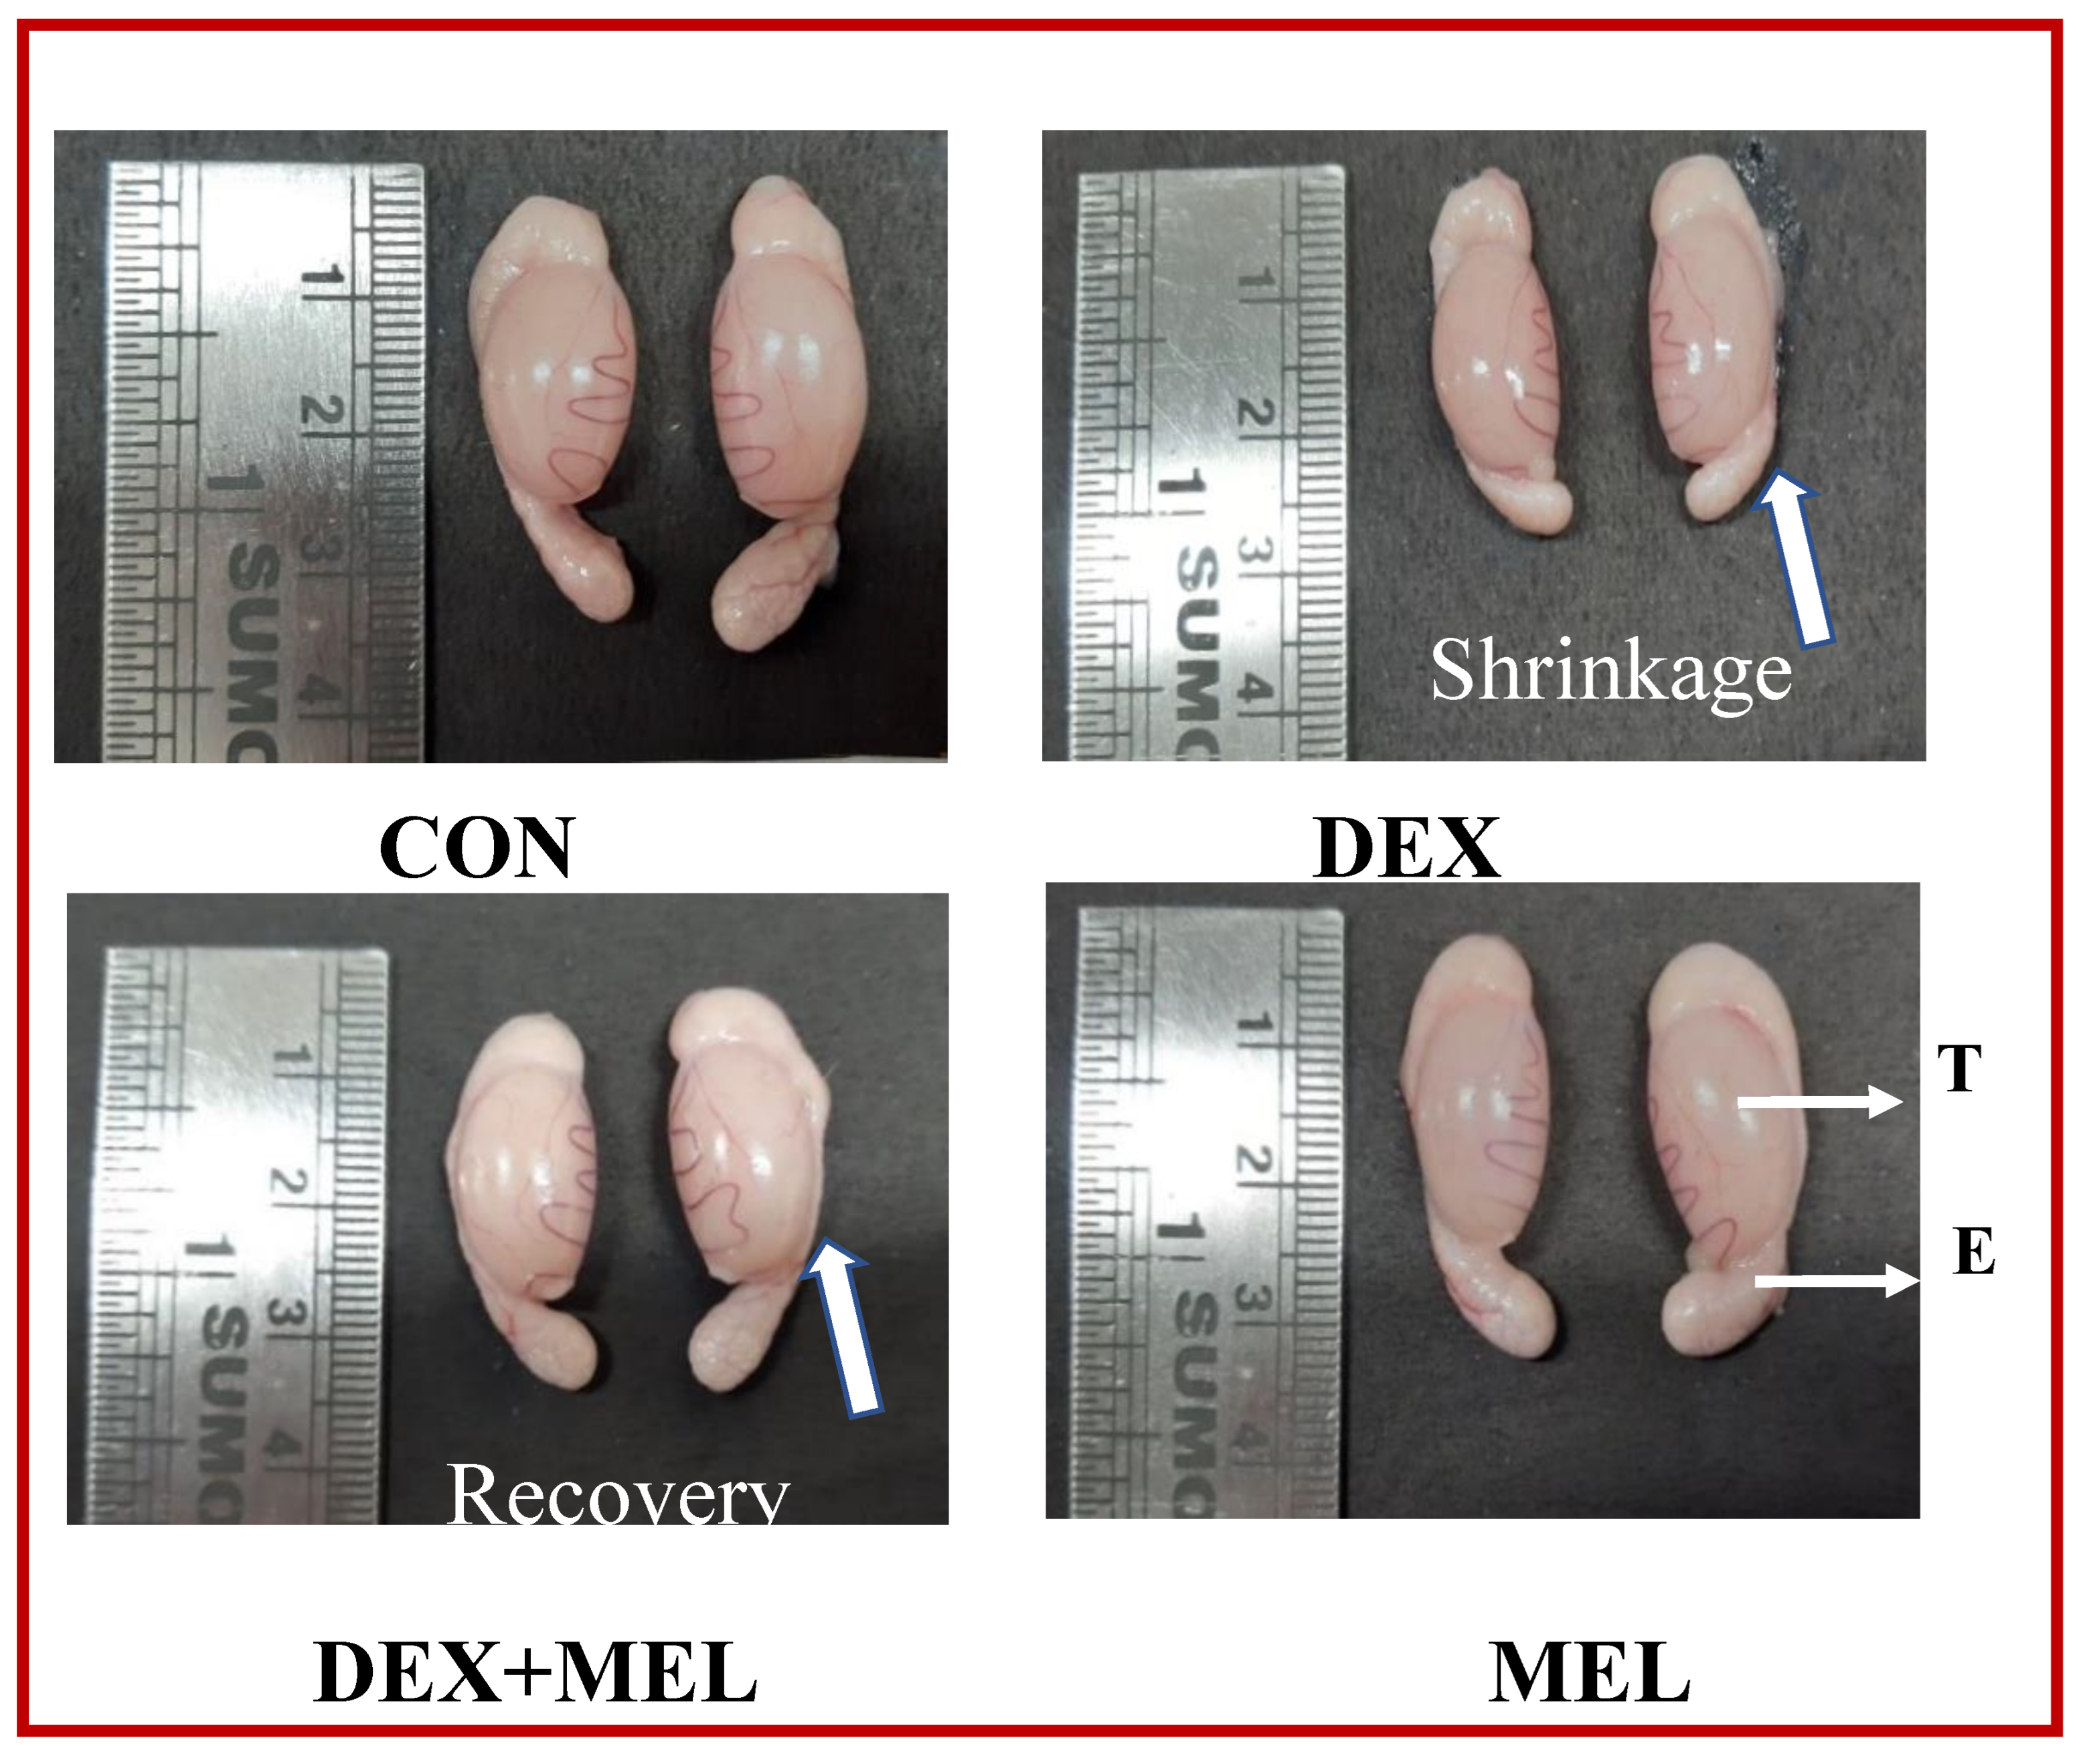
3.2. Effect of Dexamethasone (DEX) and Melatonin (MEL) on the Morphological Changes
3.3. Effect of Dexamethasone (DEX) and Melatonin (MEL) on Receptor Expression
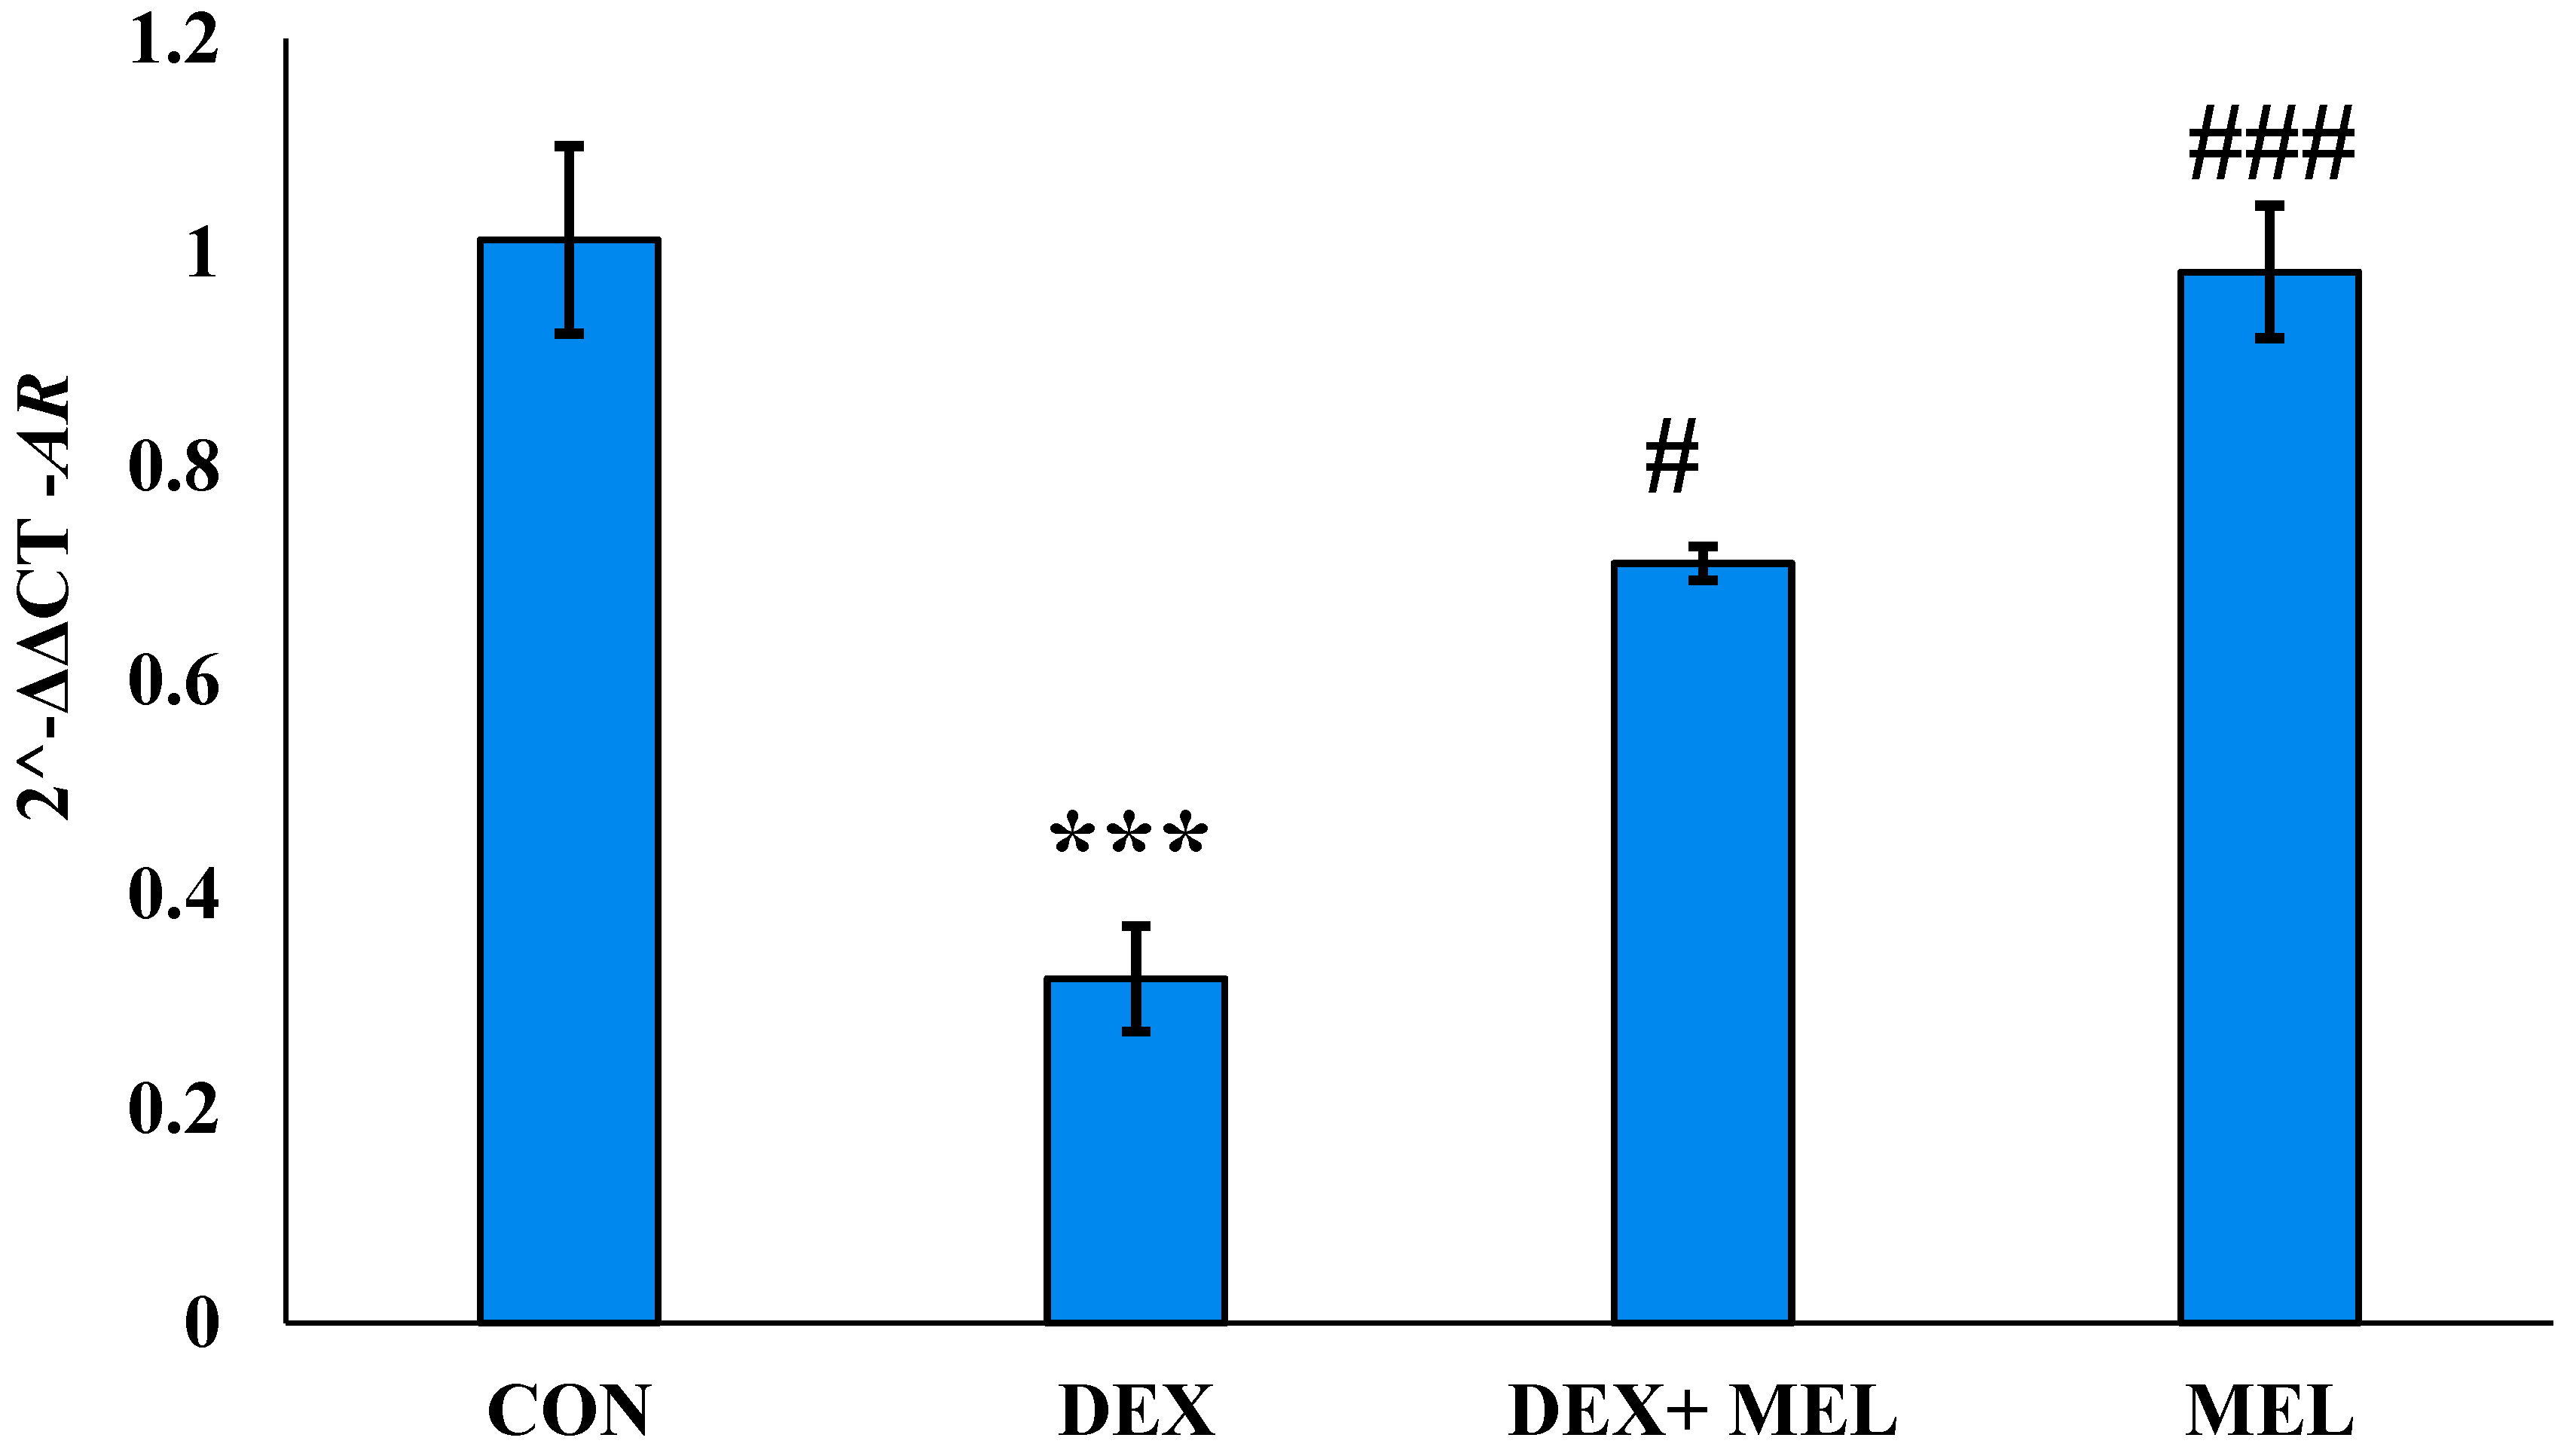
3.3.1. Effect of Dexamethasone (DEX) and Melatonin (MEL) on AR Receptor Expression
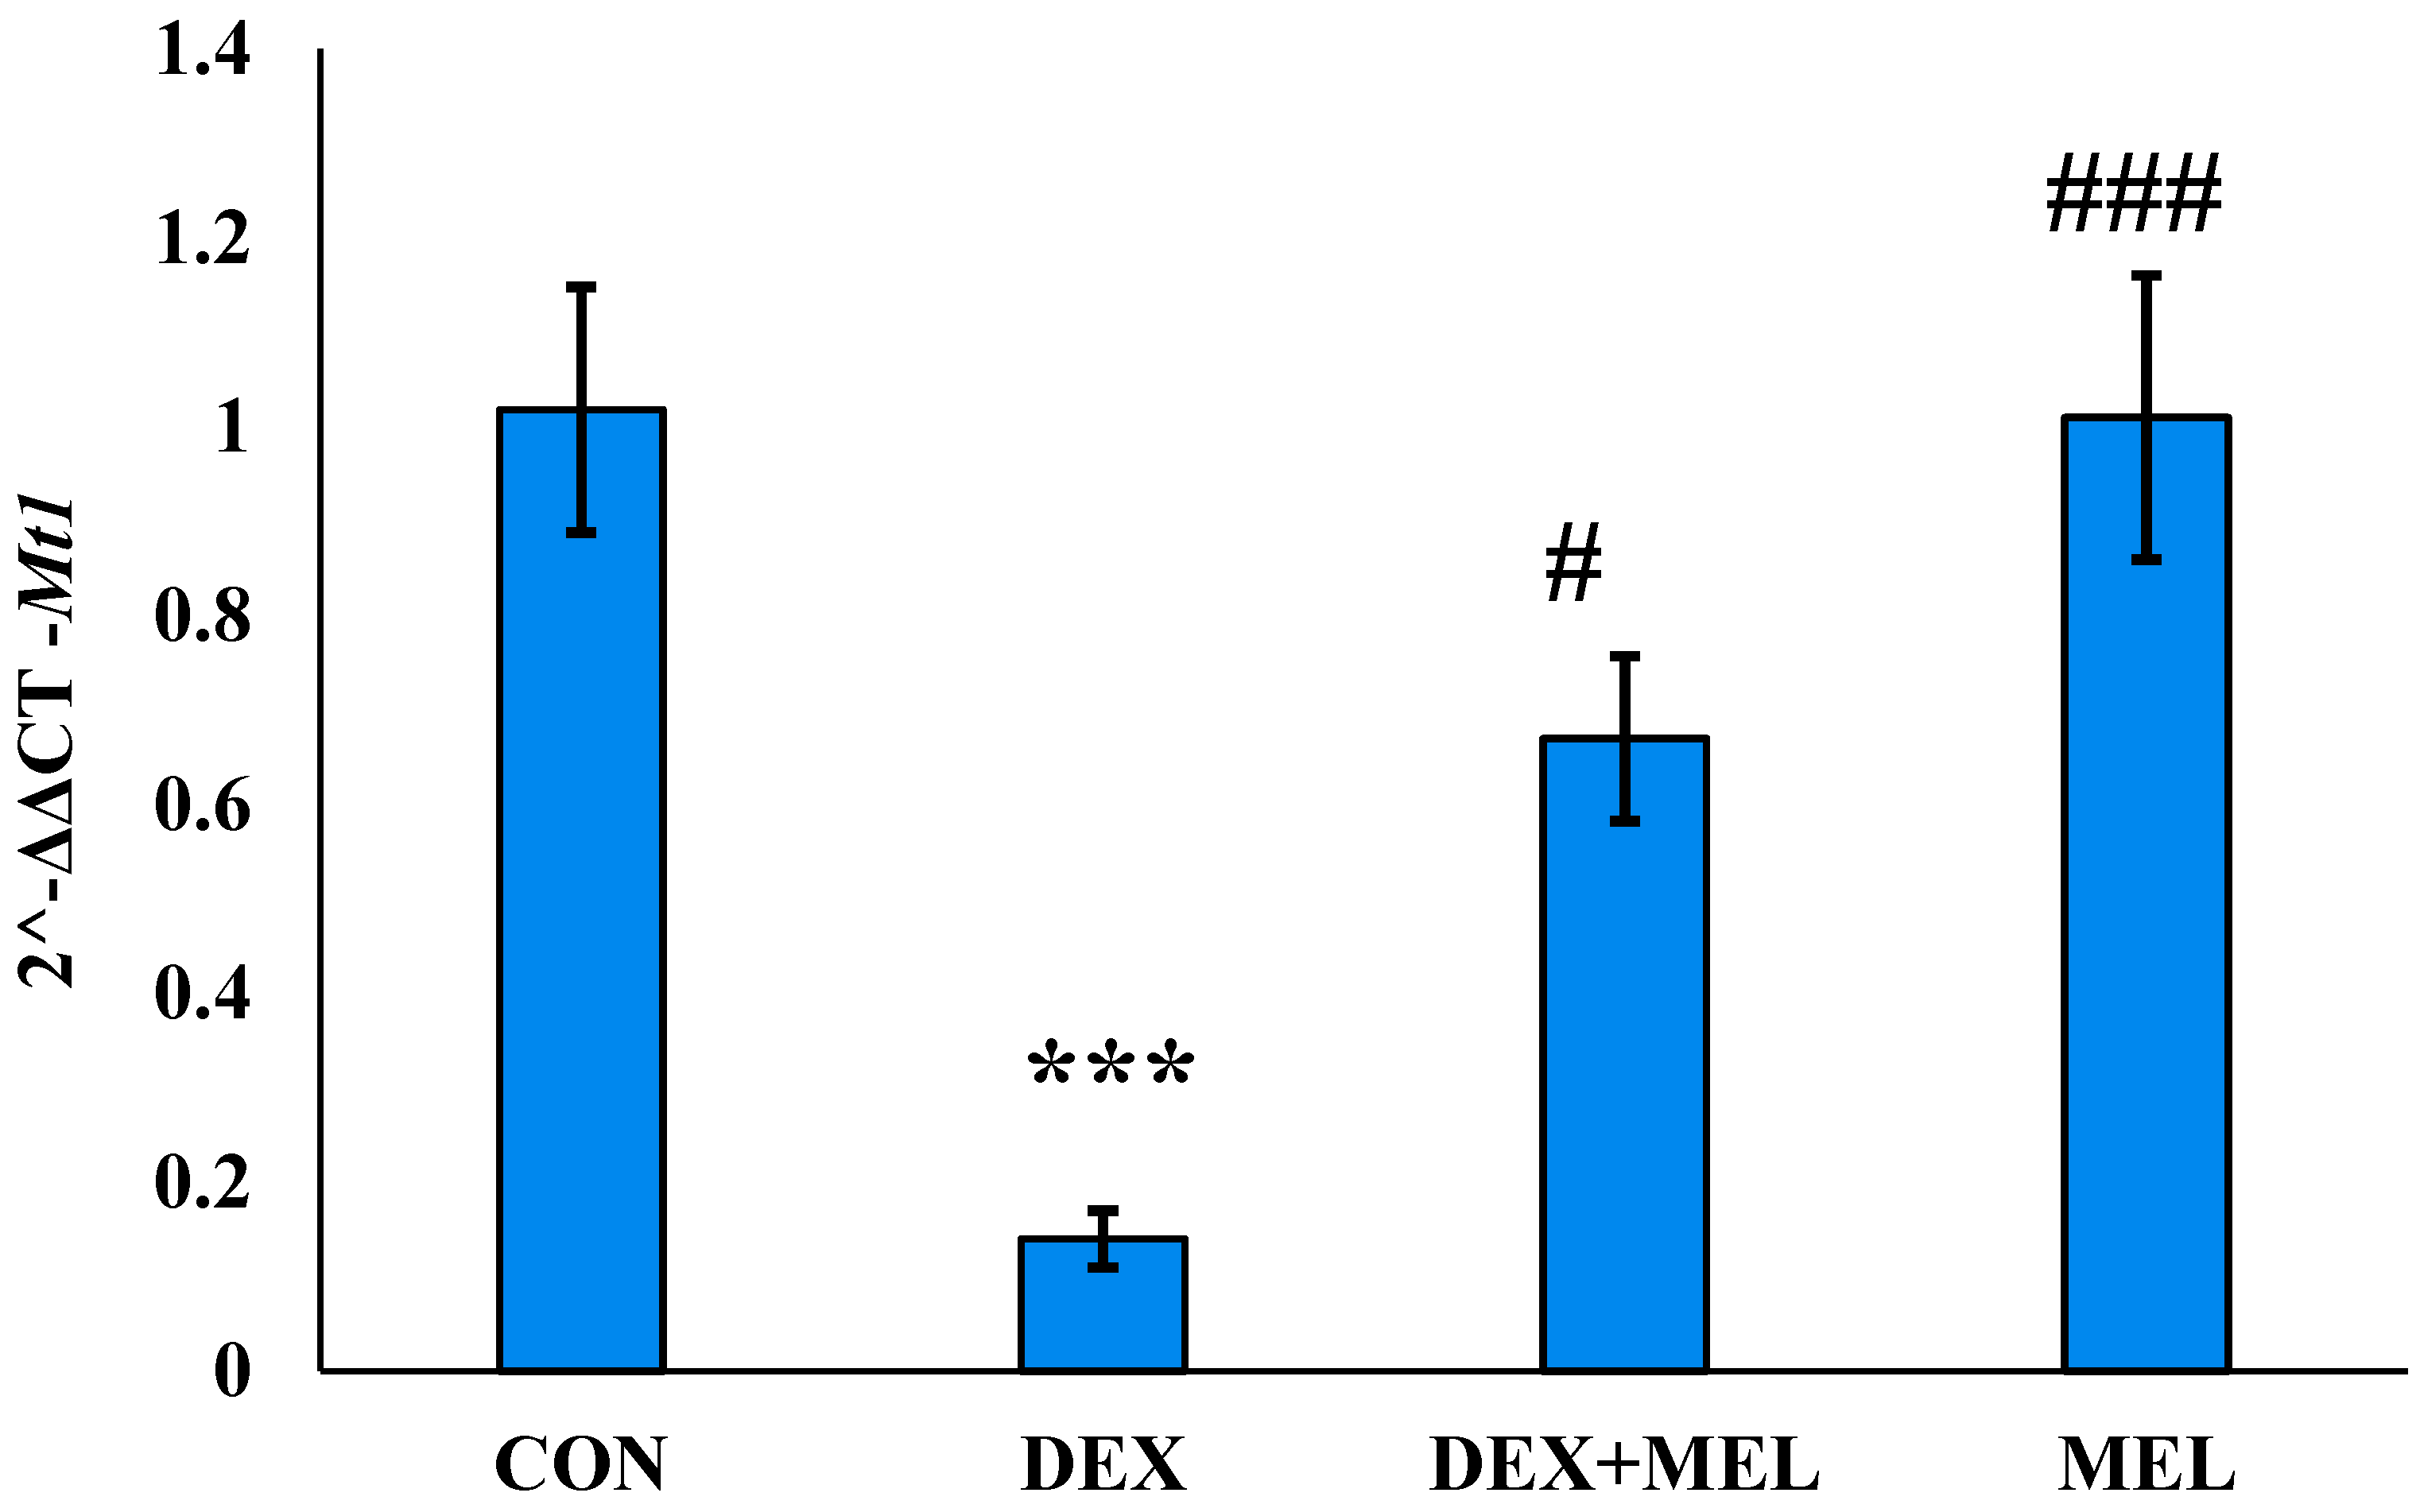
3.3.2. Effect of Dexamethasone (DEX) and Melatonin (MEL) on Mt1 Receptor Expression
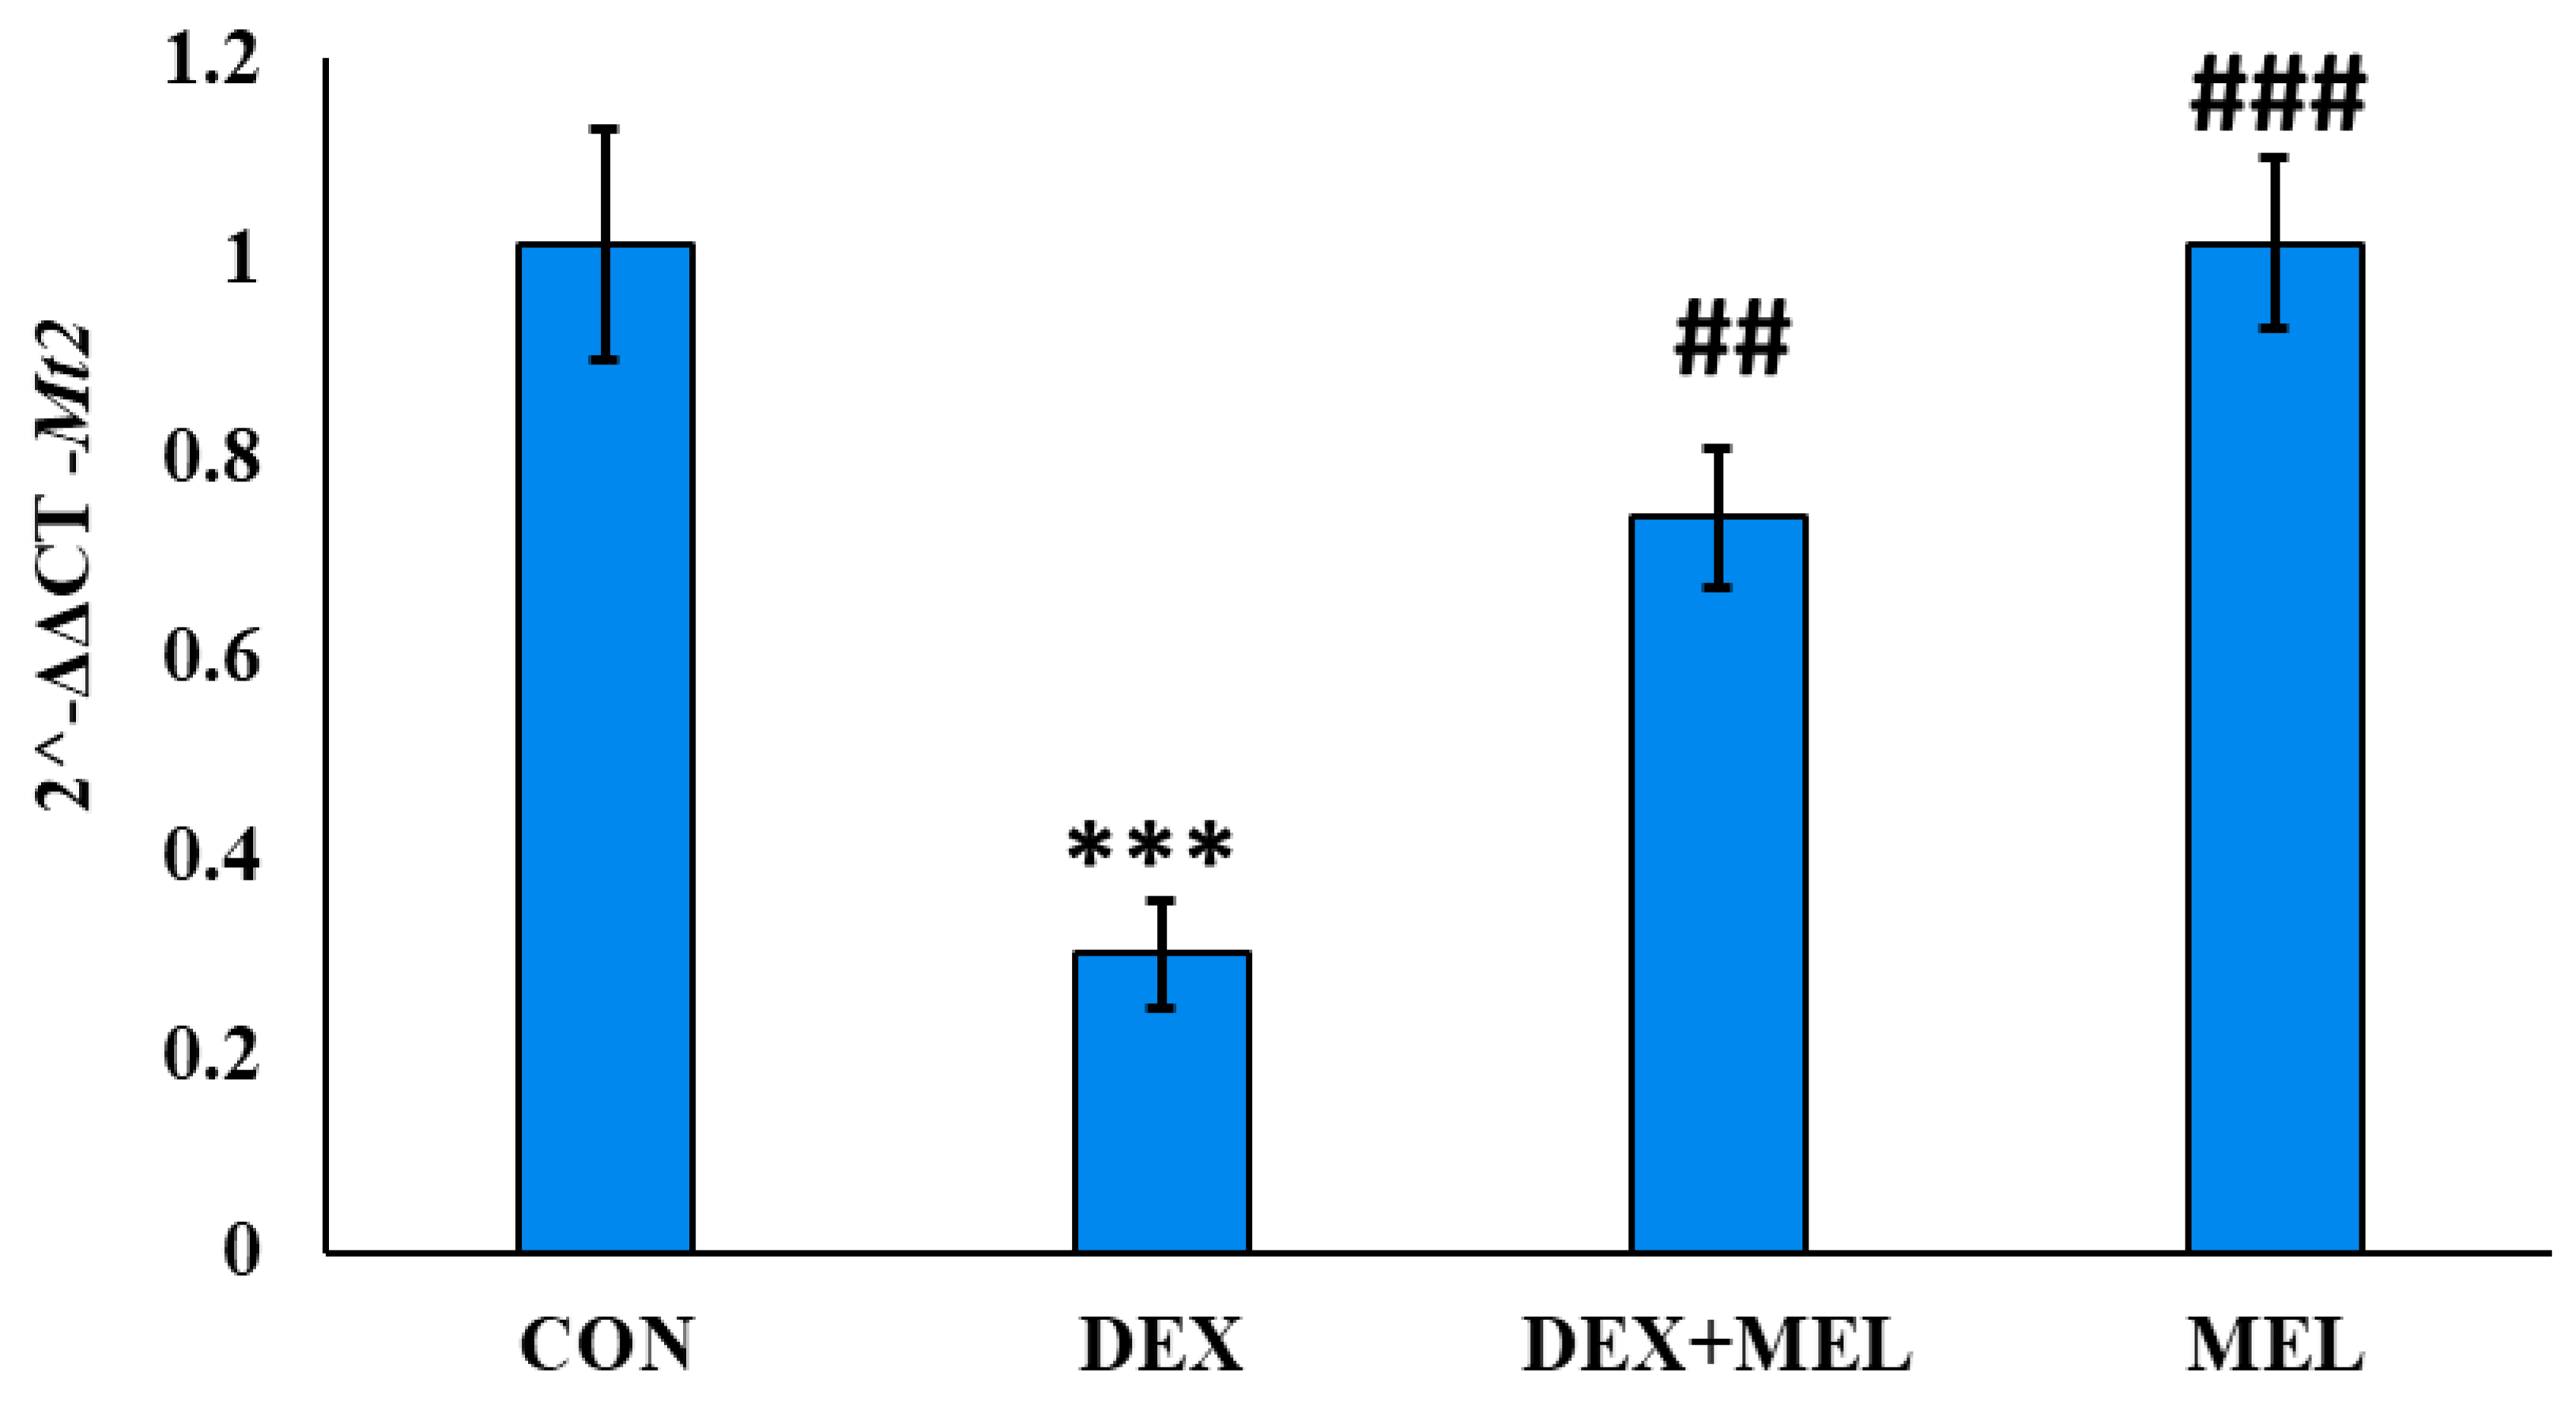
3.3.3. Effect of Dexamethasone (DEX) and Melatonin (MEL) on Mt2 Receptor Expression
3.4. Effect of Dexamethasone (DEX) and Melatonin (MEL) on the Hormonal Assay
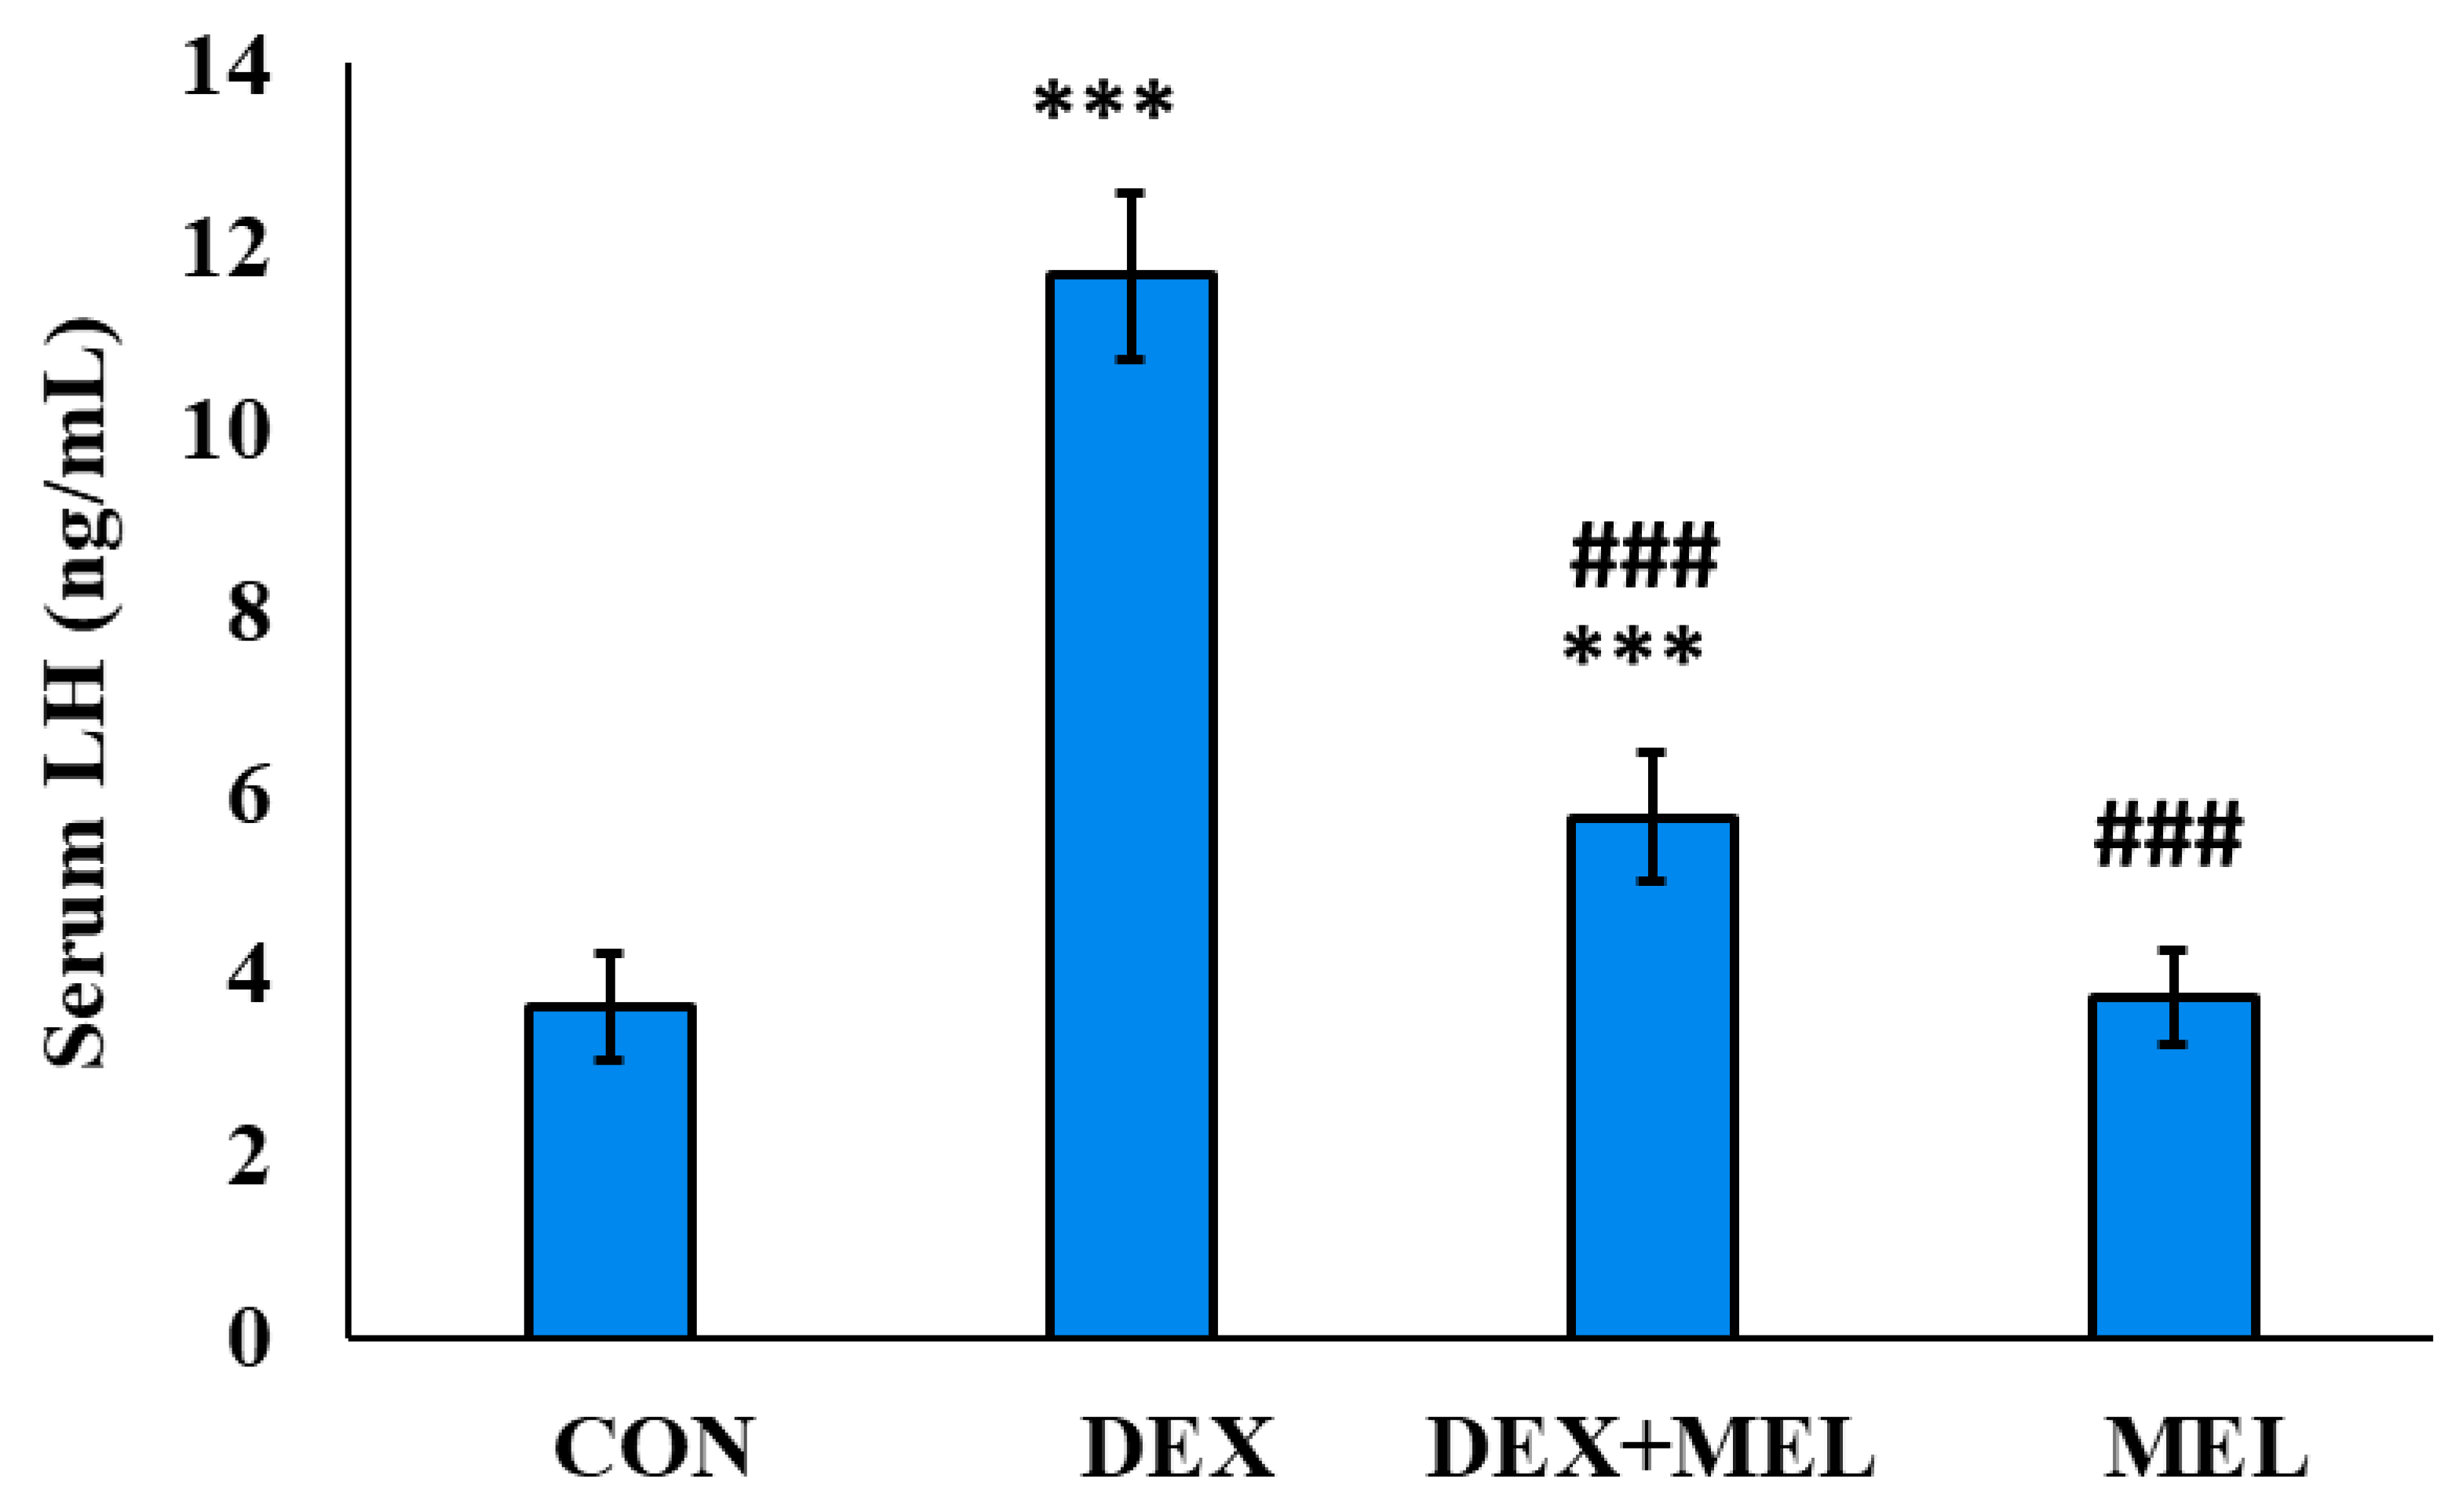
3.4.1. Effect of Dexamethasone (DEX) and Melatonin (MEL) on the Circulatory Level of LH
3.4.2. Effect of Dexamethasone (DEX) and Melatonin (MEL) on the Circulatory Level of FSH
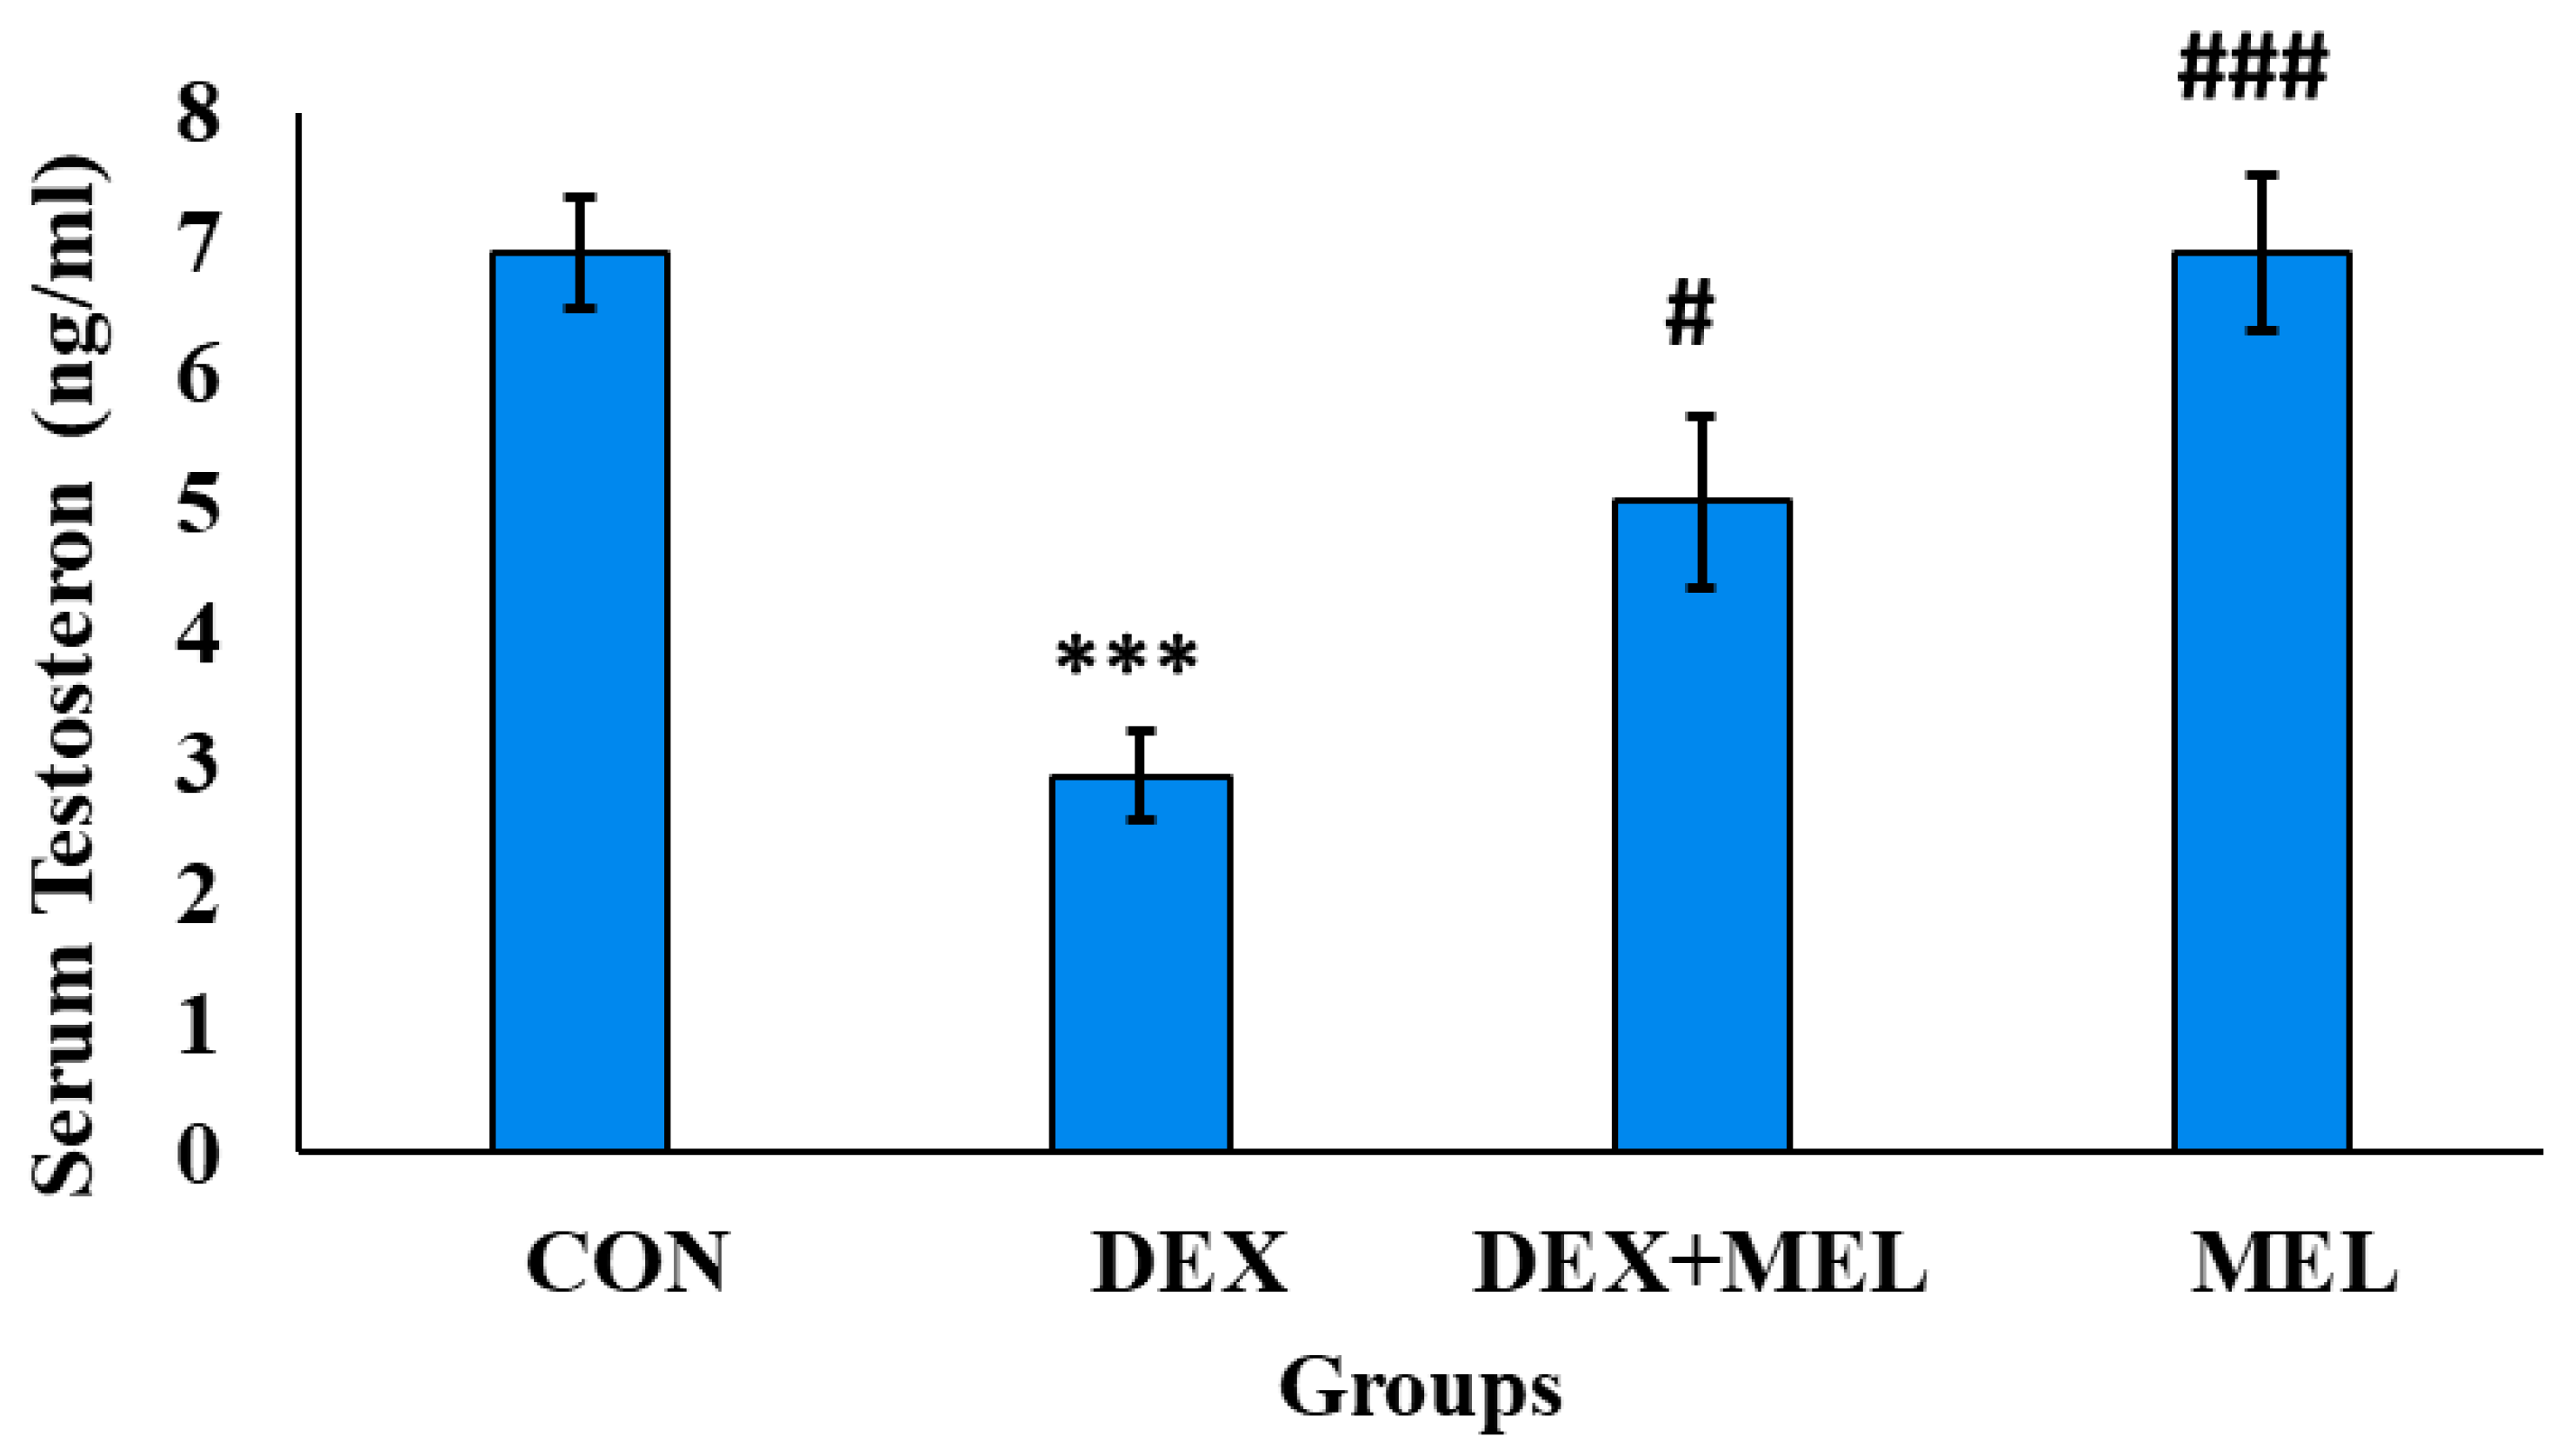
3.4.3. Effect of Dexamethasone (DEX) and Melatonin (MEL) on the Serum Level of Testosterone
3.4.4. Effect of Dexamethasone (DEX) and Melatonin (MEL) on the Circulatory Level of Corticosterone
3.4.5. Effect of Dexamethasone (DEX) and Melatonin (MEL) on the Circulatory Level of Melatonin
3.5. Effect of Dexamethasone (DEX) and Melatonin (MEL) on the Histological Changes
3.6. Effect of Dexamethasone (DEX) and Melatonin (MEL) on Comet Assay
3.7. Markers of Oxidative Stress and Tissue Biochemical Status
3.7.1. Effect of Dexamethasone (DEX) and Melatonin (MEL) on Lipid Peroxidation (TBARS level)
3.7.2. Effect of Dexamethasone (DEX) and Melatonin (MEL) on Protein Content
3.7.3. Effect of Dexamethasone (DEX) and Melatonin (MEL) on the Antioxidant Status
SOD Enzyme Activity
Catalase Enzyme Activity
Reduced Glutathione Level (GSH)
Glutathione Reductase (GR) Level
Glutathione Peroxidase (GPX) Level
Glutathione Peroxidase (G6PDH) Level
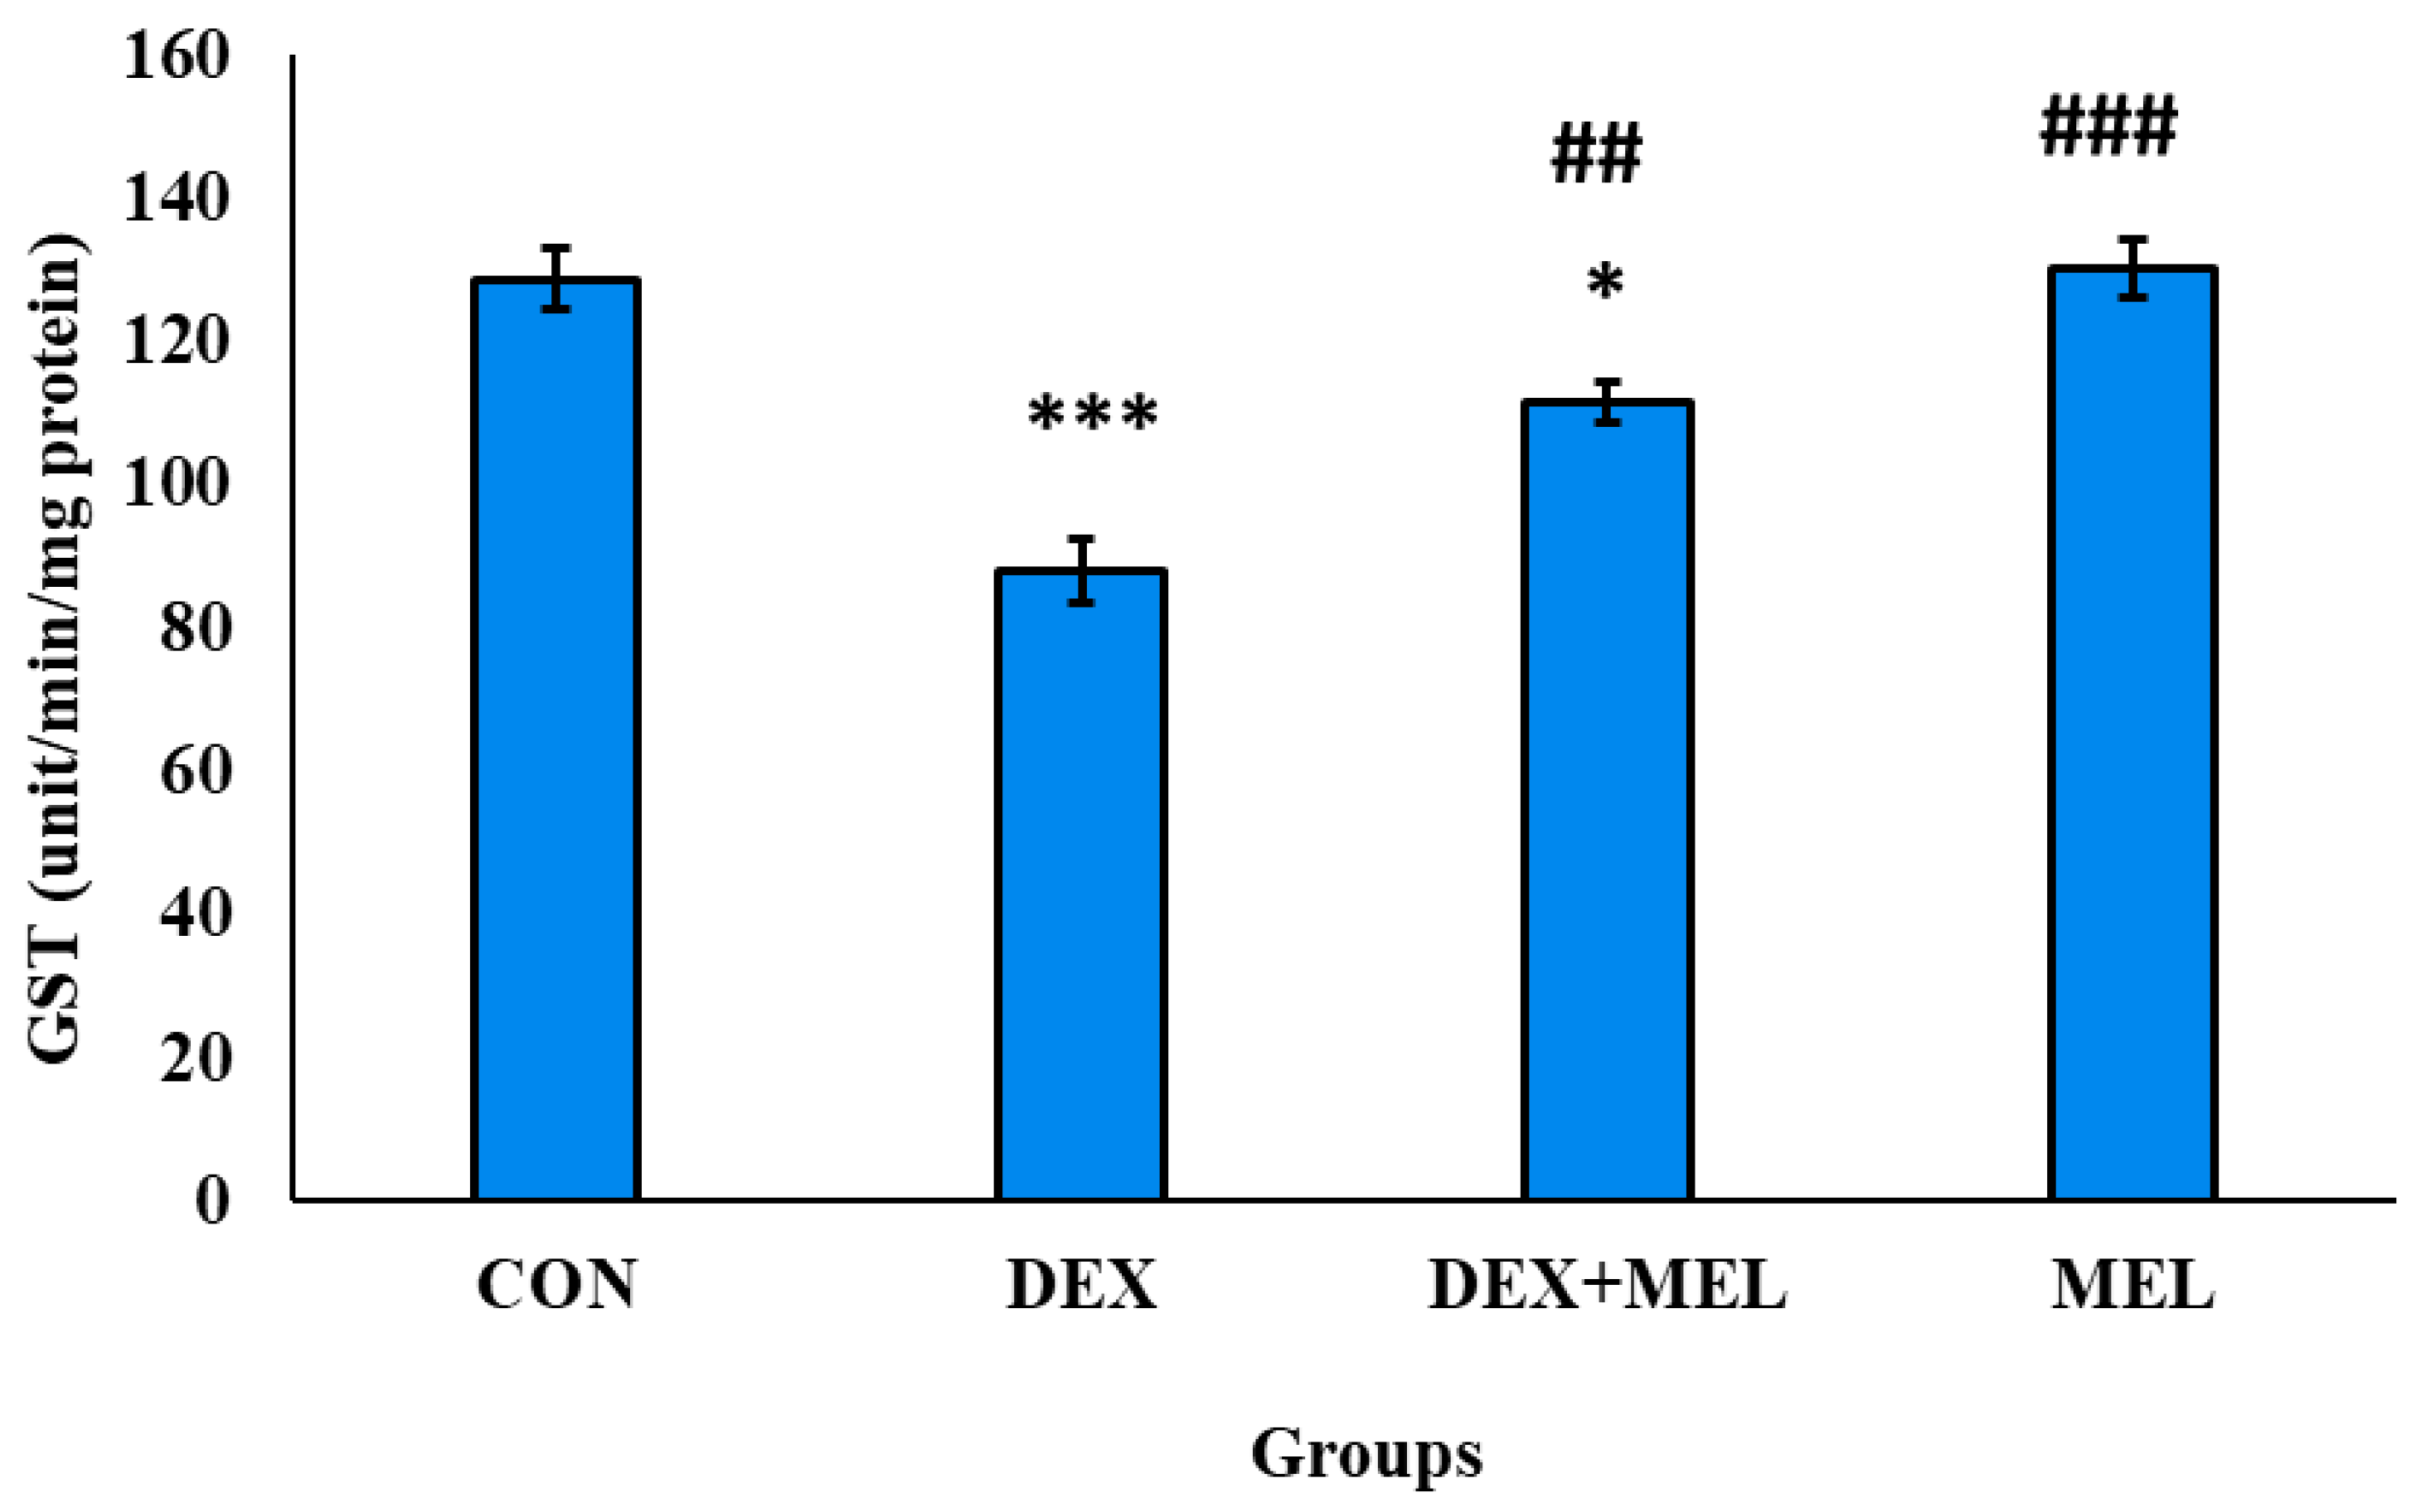
Glutathione S Transferase (GST) Level
4. Discussion
5. Conclusions
Conflicts of Interest and Disclosure Statement
Author Contributions
Funding
Acknowledgments
References
- Galano A: Reiter, RJ. Melatonin and its metabolites vs oxidative stress: From individual actions to collective protection. Journal of Pineal Research. 2018 Aug;65(1):e12514.
- Singh, M. and Jadhav, H.R., 2014. Melatonin: functions and ligands. Drug discovery today, 19(9), pp.1410-1418.
- Tan DX, Manchester LC, Reiter RJ et al. Melatonin directly scavenges hydrogen peroxide: a potentially new metabolic pathway of melatonin biotransformation. Free Radic Biol Med 2000; 29:1177–1185.
- Tan DX, Manchester LC, Terron MP et al. Melatonin as a naturally occurring co-substrate of quinone reductase-2, the putative melatonin membrane receptor: hypothesis and significance. J Pineal Res 2007; 43:317–320.
- Kurutas EB, Senoglu M, Yuksel KZ, Unsal V, Altun I. Oxidative/nitrosative stress in patients with modic changes: preliminary controlled study. Spine. 2015 Jul 15;40(14):1101-7.
- Saleh, S.R.; Manaa, A.; Sheta, E.; Ghareeb, D.A.; Abd-Elmonem, N.M. The Synergetic. Effect of Egyptian Portulaca oleracea L. (Purslane) and Cichorium intybus L. (Chicory) Extracts against Glucocorticoid-Induced Testicular Toxicity in Rats through Attenuation of Oxidative Reactions and Autophagy. Antioxidants 2022, 11, 1272. [Google Scholar] [CrossRef] [PubMed]
- Ventimiglia, E.; Pozzi, E.; Capogrosso, P.; Boeri, L.; Alfano, M.; Cazzaniga, W.; Matloob, R.; Abbate, C.; Viganò, P.; Montorsi, F.; et al. Extensive Assessment of Underlying Etiological Factors in Primary Infertile Men Reduces the Proportion of Men With Idiopathic Infertility. Front. Endocrinol. 2021, 12, 801125 [PubMed]. [Google Scholar] [CrossRef]
- Sharma, A. Male infertility; evidences, risk factors, causes, diagnosis and management in human. Ann. Clin. Lab. Res. 2017, 5, 188. [Google Scholar] [CrossRef]
- Lettieri, G.; D’Agostino, G.; Mele, E.; Cardito, C.; Esposito, R.; Cimmino, A.; Giarra, A.; Trifuoggi, M.; Raimondo, S.; Notari, T.; et al. Discovery of the Involvement in DNA Oxidative Damage of Human Sperm Nuclear Basic Proteins of Healthy Young Men Living in Polluted Areas. Int. J. Mol. Sci. 2020, 21, 4198. [Google Scholar] [CrossRef] [PubMed]
- Orazizadeh, M.; Khorsandi, L.; Hashemitabar, M. Toxic effects of dexamethasone on mouse testicular germ cells. Andrologia 2010, 42, 247–253. [Google Scholar] [CrossRef] [PubMed]
- Hanafy AM, Khalil HA. Influence of Chronic Dexamethasone Administration on Reproductive Parameters and Semen Traits in Male of Japanese Quail. Asian J Poultry Sci. 2015;9(4):223-232. [CrossRef]
- Sadi-Guettaf, H.; Bekkouche, F.H. Dexamethasone: Impact on testicular activity. Int. J. Med. Health Sci. 2014, 8, 759–762. [Google Scholar]
- Buckingham, JC. Glucocorticoids: exemplars of multi-tasking. British journal of pharmacology. 2006; 147(S1):S258-S68.
- Hashemitabar M, Orazizadeh M, Khorsandi L. Effect of Dexamethasone on Fas Ligand Expression in Mouse Testicular Germ Cells. ZUMS Journal. 2008;16(62):17-26.
- Danek, J. , 2008. Effect of dexamethasone on the changes of semen quality induced by endotoxin in stallion. Bulletin of the Veterinary Institute in Puawy, 52, 581–589.
- Gametchu B, Watson CS. Correlation of membrane glucocorticoid receptor levels with glucocorticoid-induced apoptotic competence using mutant leukemic and lymphoma cells lines. Journal of cellular biochemistry. 2002;87(2):133-46.
- Chang CS, Chen YT, Yeh SD, Xu QQ, Wang RS, Guillou F (2004) Infertility with defective spermatogenesis and hypotestosteronemia in male mice lacking the androgen receptor in Sertoli cells. Proc Natl Acad Sci 101:6876–6881.
- Tice RR, Agurell E, Anderson D, Burlinson B, Hartmann A, Kobayashi H, Miyamae Y, Rojas E, Ryu JC, Sasaki YF. Single cell gel/comet assay: guidelines for in vitro and in vivo genetic toxicology testing. Environ Mol Mutagen 2000; 35: 206-221.
- Singh NP, McCoy MT, Tice RR, Schneider EL. A simple technique for quantitation of low levels of DNA damage in individual cells. Exp Cell Res 1988; 175(1):184-191.
- H. Ohkawa, N. H. Ohkawa, N. Ohishi, K. Yagi, Assay for lipid peroxides in animal tissues by thiobarbituric acid reaction. Anal. Biochem. 95 (1979) 351-358.
- Lowry, N.J. Rosebrough, AL. Farr, J. Rose, Randall, Protein measurement with the Folin phenol reagent, J. Biol. Chem. 193 (1951) 265-275.
- P. Kakkar, B. P. Kakkar, B. Das, P.N.Viswanathan, A modified spectrophotometric assay of superoxide dismutase. Indian J. Biochem. Biophys. 21 (1983) 192-205.
- R.F. Beers, I.W. R.F. Beers, I.W. Sizer, A spectrophotometric method for measuring the breakdown of hydrogen peroxide by catalase, J, Biol. Chem. 195 (1952) 133-140.
- Sedlak J, Lindsay RH. Estimation of total, protein-bound, and nonprotein sulfhydryl groups in tissue with Ellman's reagent. Anal Biochem. 1968; 25:192-205. [CrossRef]
- Goldberg, D. M. (1984). Glutathione reductase. Methods of enzymatic analysis, 3, 258-265.
- Paglia, D. E., & Valentine, W. N. (1967). Studies on the quantitative and qualitative characterization of erythrocyte glutathione peroxidase. The Journal of laboratory and clinical medicine, 70(1), 158-169.
- H.A. Ells, H.N. H.A. Ells, H.N. Kirkman, A colorimetric method for assay of erythrocytic glucose-6-phosphate dehydrogenase. Proc. Soc. Exp. Biol. Med. 106 (1961) 607-609.
- Habig, W. H. , Pabst, M. J., & Jakoby, W. B. (1974). Glutathione S-transferases: the first enzymatic step in mercapturic acid formation. Journal of biological Chemistry, 249(22), 7130-7139.
- <b>29. </b>H. Jia, T. H. Jia, T. Yamashita, X. Li, H. Kato, Laurel attenuates dexamethasone-induced skeletal muscle atrophy in vitro and in a rat model, Nutrients 14 (2022) 2029.
- S.P. Kamani, J.K. S.P. Kamani, J.K. Waguia, D. Miaffo, M. Nchouwet, C.D. Kadji, M.W. Kamgaing, R. D. Djimeli, J.M. Ngnitedem, A. Kamanyi, S.W. Ngnokam, Efficacy of Emilia coccinea aqueous extract on inhibition of α-amylase enzyme activity and insulin resistance in dexamethasone treated-rats, Metab. Open (2022), 100193.
- Santos CL, Rafacho A, Bosqueiro JR (2007) Efeitos da administração de dexametasona in vivo sobre glicemia, insulinemia e substrates circulantes são dependentes do tempo de tratamento. Biosci J 23(3):101–110.
- Rafacho A, Giozzet VA, Boschero AC, Bosqueiro JR (2008) Functional alterations in endocrine pancreas of rats with diVerent degrees of dexamethasone-induced insulin resistance. Pancreas 36(3):284–293.
- V.S. Kumar, M.N. V.S. Kumar, M.N. Inamdar, G.L. Viswanatha, Protective effect of lemongrass oil against dexamethasone induced hyperlipidemia in rats: possible role of decreased lecithin cholesterol acetyl transferase activity, Asian Pac. J. Trop. Med. 4 (2012) 658–660.
- Hasona, N.A. , 2018. Grape seed extract attenuates dexamethasone-induced testicular and thyroid dysfunction in male albino rats. Andrologia, 50(5), p.e13002.
- Khorsandi L, Mirhoseini M, Mohamadpour M, Orazizadeh M, Khaghani S. Effect of curcumin on dexamethasone induced testicular toxicity in mice. Pharm Biol. 2013;51(2):206-212. [CrossRef]
- Nkono, B. L. N. Y., Sokeng, S. D., Désiré, D. D. P., & Kamtchouing, P. (2014). Antihyperglycemic and antioxydant properties of alstonia boonei De wild. (Apocynaceae) stem bark aqueous extract in dexamethasone-induced hyperglycemic rats. Int. J. Diabetes Res, 3(3), 27-35.
- Patel, S. , & Rai, S. (2023). Glucocorticoid-Induced Dose-Dependent Reproductive Impairments in Male Albino Rat. Journal of Endocrinology and Reproduction, 27(2), 99–108. [CrossRef]
- Gao HB, Tong MH, Hu YQ, et al. Mechanisms of glucocorticoid-induced Leydig cell apoptosis. Mol Cell Endocrinol. 2003;199(1-2):153-163. [CrossRef]
- Ing, N. H., Brinsko, S. P., Curley, K. O., Forrest, D. W., Love, C. C., Hinrichs, K., … Welsh, T. H. (2015). Dexamethasone acutely regulates endocrine parameters in stallions and subsequently affects gene expression in testicular germ cells. Animal Reproduction Science, 152, 47–54. [CrossRef] [PubMed]
- Chen, Y., Wang, Q., Wang, F. F., Gao, H. B., & Zhang, P. (2012). Stress induces glucocorticoid-mediated apoptosis of rat Leydig cells in vivo. Stress, 15, 74–84.
- Jeje SO, Akindele OO, Balogun ME, Raji Y. Maternal treatment with dexamethasone during lactation delays male puberty and disrupts reproductive functions via hypothalamic-pituitary-gonadal axis alterations. Pathophysiology. 2016;23(1):43-49.
- Yun, H. J., Ji-Yeon, L., & Myoung, H. K. (2016). Prenatal exposure to dexamethasone disturbs sex-determining gene expression and fetal testosterone production in male embryos. Biochemical and Biophysical Research Communications, 471, 149–155.
- Hu GX, Lian QQ, Lin H, et al. Rapid mechanisms of glucocorticoid signaling in the Leydig cell. Steroids 2008; 73(9–10): 1018–1024.
- Arab Dolatabadi A, Rezaei Zarchii S. The effect of prescription of different Dexamethasone doses on reproductive system. Biomed Res. 2015;26(4):656-660.
- Mohamadpour M, Mollajani R, Sarabandi F, Hosseini F, Mohsenkia M, Erfanizadeh M, Soleimani A, Kargar E, Mosallaei H, Yavarahmadi M. Protective effect of grape seed extract on dexamethasone-induced testicular toxicity in mice. Crescent Journal of Medical and Biological Sciences. 2020;7(1):59-65.
- Wang FF, Wang Q, Chen Y, Lin Q, Gao HB, Zhang P. Chronic stress induces ageing-associated degeneration in rat Leydig cells. Asian J Androl. 2012;14(4):643-648. [CrossRef]
- Sadeghzadeh, F.; Mehranjani, M.S.; Mahmoodi, M. Vitamin C ameliorates the adverse effects of dexamethasone on sperm motility, testosterone level, and spermatogenesis indexes in mice. Hum. Exp. Toxicol. 2019, 38, 409–418. [Google Scholar] [CrossRef] [PubMed]
- El-Sokkary GH, Abdel-Rahman GH, Kamel ES (2005) Melatonin protects against lead-induced hepatic and renal toxicity in male rats. Toxicology 213: 25–33.
- Kumi-Diaka J, Townsend J. Effects of genistein isoflavone (4′, 5′, 7-trihydroxyisoflavone) and dexamethasone on functional characteristics of spermatozoa. J Med Food. 2001;4(1):39-47. [CrossRef]
- Mukherjee A, Haldar C, Vishwas DK. Melatonin prevents dexamethasone-induced testicular oxidative stress and germ cell apoptosis in golden hamster, M esocricetus auratus. Andrologia. 2015 Oct;47(8):920-31.
- Tang HY, Ho HY, Wu PR, Chen SH, Kuypers FA, Cheng ML, Chiu DT. Inability to maintain GSH pool in G6PD-deficient red cells causes futile AMPK activation and irreversible metabolic disturbance. Antioxid Redox Signal. 2015 Mar 20;22(9):744-59. [CrossRef] [PubMed]
- Rizk SM, Zaki HF, Mina MA. Propolis attenuates doxorubicin-induced testicular toxicity in rats. Food and chemical toxicology. 2014 May 1;67:176-86.
- Othman AI, Edrees GM, El-Missiry MA, Ali DA, Aboel-Nour M, Dabdoub BR. Melatonin controlled apoptosis and protected the testes and sperm quality against bisphenol A-induced oxidative toxicity. Toxicology and Industrial Health. 2016 Sep;32(9):1537-49.
- Reiter RJ, Tan DX, Osuna C, et al. (2000) Actions of melatonin in the reduction of oxidative stress. Journal of Biomedical Science 7: 444–458.
- Zhu LJ, Hardy MP, Inigo IV, Huhtaniemi I, Bardin CW, Moo-Young AJ (2000) Effects of androgen-on-androgen receptor expression in rat testicular and epididymal cells: a quantitative immunohistochemical study. Biol Reprod 63:368–376.
- Wang L, Su DZ, Wang WS (1994) Studies on the aluminum content in wheat flour products. Biomed Environ Sci 7(1):91–99.
- Blok LJ, Themmen AP, Peters AH, Trapman J, Baarends WM, Hoogerbrugge JW, Grootegoed JA (1992) Transcriptional regulation of androgen receptor gene expression in Sertoli cells and other cell types. Mol Cell Endocrinol 88:153–164.
- Sun H, Hu C, Jia L, Zhu Y, Zhao H, Shao B, Wang N, Zhang Z, Li Y. Effects of aluminum exposure on serum sex hormones and androgen receptor expression in male rats. Biological trace element research. 2011 Dec;144:1050-8.
- Dubocovich ML, Markowska M. Functional MT 1 and MT 2 melatonin receptors in mammals. Endocrine. 2005 Jul;27:101-10.
- Izzo, G.; Francesco, A.; Ferrara, D.; Campitiello, M.R.; Serino, I.; Minucci, S.; d’Istria, M. Expression of melatonin (MT1, MT2) and melatonin-related receptors in the adult rat testes and during development. Zygote 2010, 3, 257–264 [CrossRef] [PubMed]. [Google Scholar] [CrossRef] [PubMed]
- Rocha, C.S.; Martins, A.D.; Rato, L.; Silva, B.M.; Oliveira, P.F.; Alves, M.G. Melatonin alters the glycolytic profile of Sertoli cells: Implications for male fertility. Mol. Hum. Reprod. 2014, 20, 1067–1076. [Google Scholar] [CrossRef] [PubMed]
- McLachlan, R.I.; Wreford, N.G.; O’Donnell, L.; de Kretser, D.M.; Robertson, D.M. The endocrine regulation of spermatogenesis: Independent roles for testosterone and FSH. J. Endocrinol. 1996, 148, 1–9. [Google Scholar] [CrossRef] [PubMed]
- Heindel, J.J.; Jackson, F.L.; Berkowitz, A.S. Role of the pineal in the alteration of hamster Sertoli cell responsiveness to FSH during testicular regression. J. Androl. 1984, 5, 211–215 [PubMed]. [Google Scholar] [CrossRef] [PubMed]
- Zhang H, Zhang Y. Melatonin: a well-documented antioxidant with conditional pro-oxidant actions. Pineal Res 2014; 57: 131-146.
- Gupta S, Haldar C. Nycthemeral variation in melatonin receptor expression in the lymphoid organs of a tropical seasonal breeder Funambulus pennanti. Journal of Comparative Physiology A. 2014 Dec; 200:1045-55.

Disclaimer/Publisher’s Note: The statements, opinions and data contained in all publications are solely those of the individual author(s) and contributor(s) and not of MDPI and/or the editor(s). MDPI and/or the editor(s) disclaim responsibility for any injury to people or property resulting from any ideas, methods, instructions or products referred to in the content. |
© 2024 by the authors. Licensee MDPI, Basel, Switzerland. This article is an open access article distributed under the terms and conditions of the Creative Commons Attribution (CC BY) license (http://creativecommons.org/licenses/by/4.0/).


