Introduction
The G-protein coupled estrogen receptor (GPER) was initially named GPR30 and was characterized as an orphan receptor [
1,
2]. In 2006, a selective agonist of GPR30 named G1 was synthesized by molecular screening and computational testing [
3]. Finally, the receptor was renamed GPER by IUPHAR (
International Union of Basic and Clinical Pharmacology) in 2007 [
4,
5]. As G1 is a non-steroidal compound with high selectivity to GPER and not to ERs [
3], it represents a useful strategy to investigate the implications of GPER activation.
It is well known that E2 activates complex pathways involving both genomic and non-genomic pathways within different cell types. In the heart, while the genomic mechanisms are well characterized, being mediated by the classical estrogen receptor [
6,
7], GPER present non-genomics effects, either with E2 or G1 [
8,
9]. The selective activation of GPER triggers several intracellular pathways like ERK, PI3K, cAMP, PKA, eNOS, sGC, and AKT [
8,
9,
10,
11,
12,
13]. In 2015 we demonstrated that G1 binding to GPER can transactivate to the epidermal growth receptor (EGFR), leading to the activation of the PI3K-AKT pathway, which finally activates the electrogenic isoform of the sodium/bicarbonate cotransporter (eNBC) in isolated ventricular myocytes [
14].
It was fully demonstrated that GPER activation affords cardioprotection. Chronic GPER activation decreases blood pressure [
15], prevents diastolic dysfunction [
16,
17], and also the progression to heart failure in rats treated with isoproterenol [
18]. Moreover, GPER activation prevents ischemic reperfusion injury with less myocardial inflammation [
19], reducing infarct size with the activation of PI3K-AKT and MEK1/2-Erk1/2-GSK-3β pathways to inhibit mPTP opening [
20] and by reducing mitochondrial dysfunction, mitophagy and regulation of the mPTP opening [
21]. Accordingly, our laboratory recently demonstrated, in a rat ovariectomy model, that the chronic administration of G1 enhanced cardiac mitochondrial function, improved cardiac function, and reduced infarct size after ischemia [
22].
Interestingly, another possibility to prevent cardiac dysfunction after ischemic/reperfusion damage is L-type calcium channel (LTCC) inhibition [
23,
24,
25]. LTCC is located in cardiac T tubules [
26,
27,
28], and calcium influx activates ryanodine receptors (RyR) of the sarcoplasmic reticulum (SR), triggering calcium-induced calcium-release (CICR) mechanism. This calcium transient is responsible for activating the contractile apparatus in the cardiomyocyte (excitation-contraction coupling, ECC). Modification in LTCC activity could induce changes in ECC, triggering pathologic events like cardiac arrhythmias, heart failure, and cardiac hypertrophy [
29,
30]. Several studies demonstrated that LTCC function decreases after treatment with high concentration of estrogen [
31,
32] and in OVX model [
33]. Even with deletion of classics ERs, E2 decreases calcium current [
34], indicating that another receptor acts in the presence of E2. The activation of GPER prevents the effect of isoproterenol on calcium current with E2 or G1, decreasing it [
32,
35]. However, the signaling behind the effect of GPER on LTCC remains unclear.
We have previously demonstrated that GPER is present in T tubules of cardiomyocytes [
36], suggesting that their signaling can be relevant to ECC. Thus, in the present study, we tested the hypothesis that the activation of GPER and its downstream intracellular pathway PI3K and NOS, alters calcium handling by inhibiting LTCC and subsequently affecting ECC.
Discussion
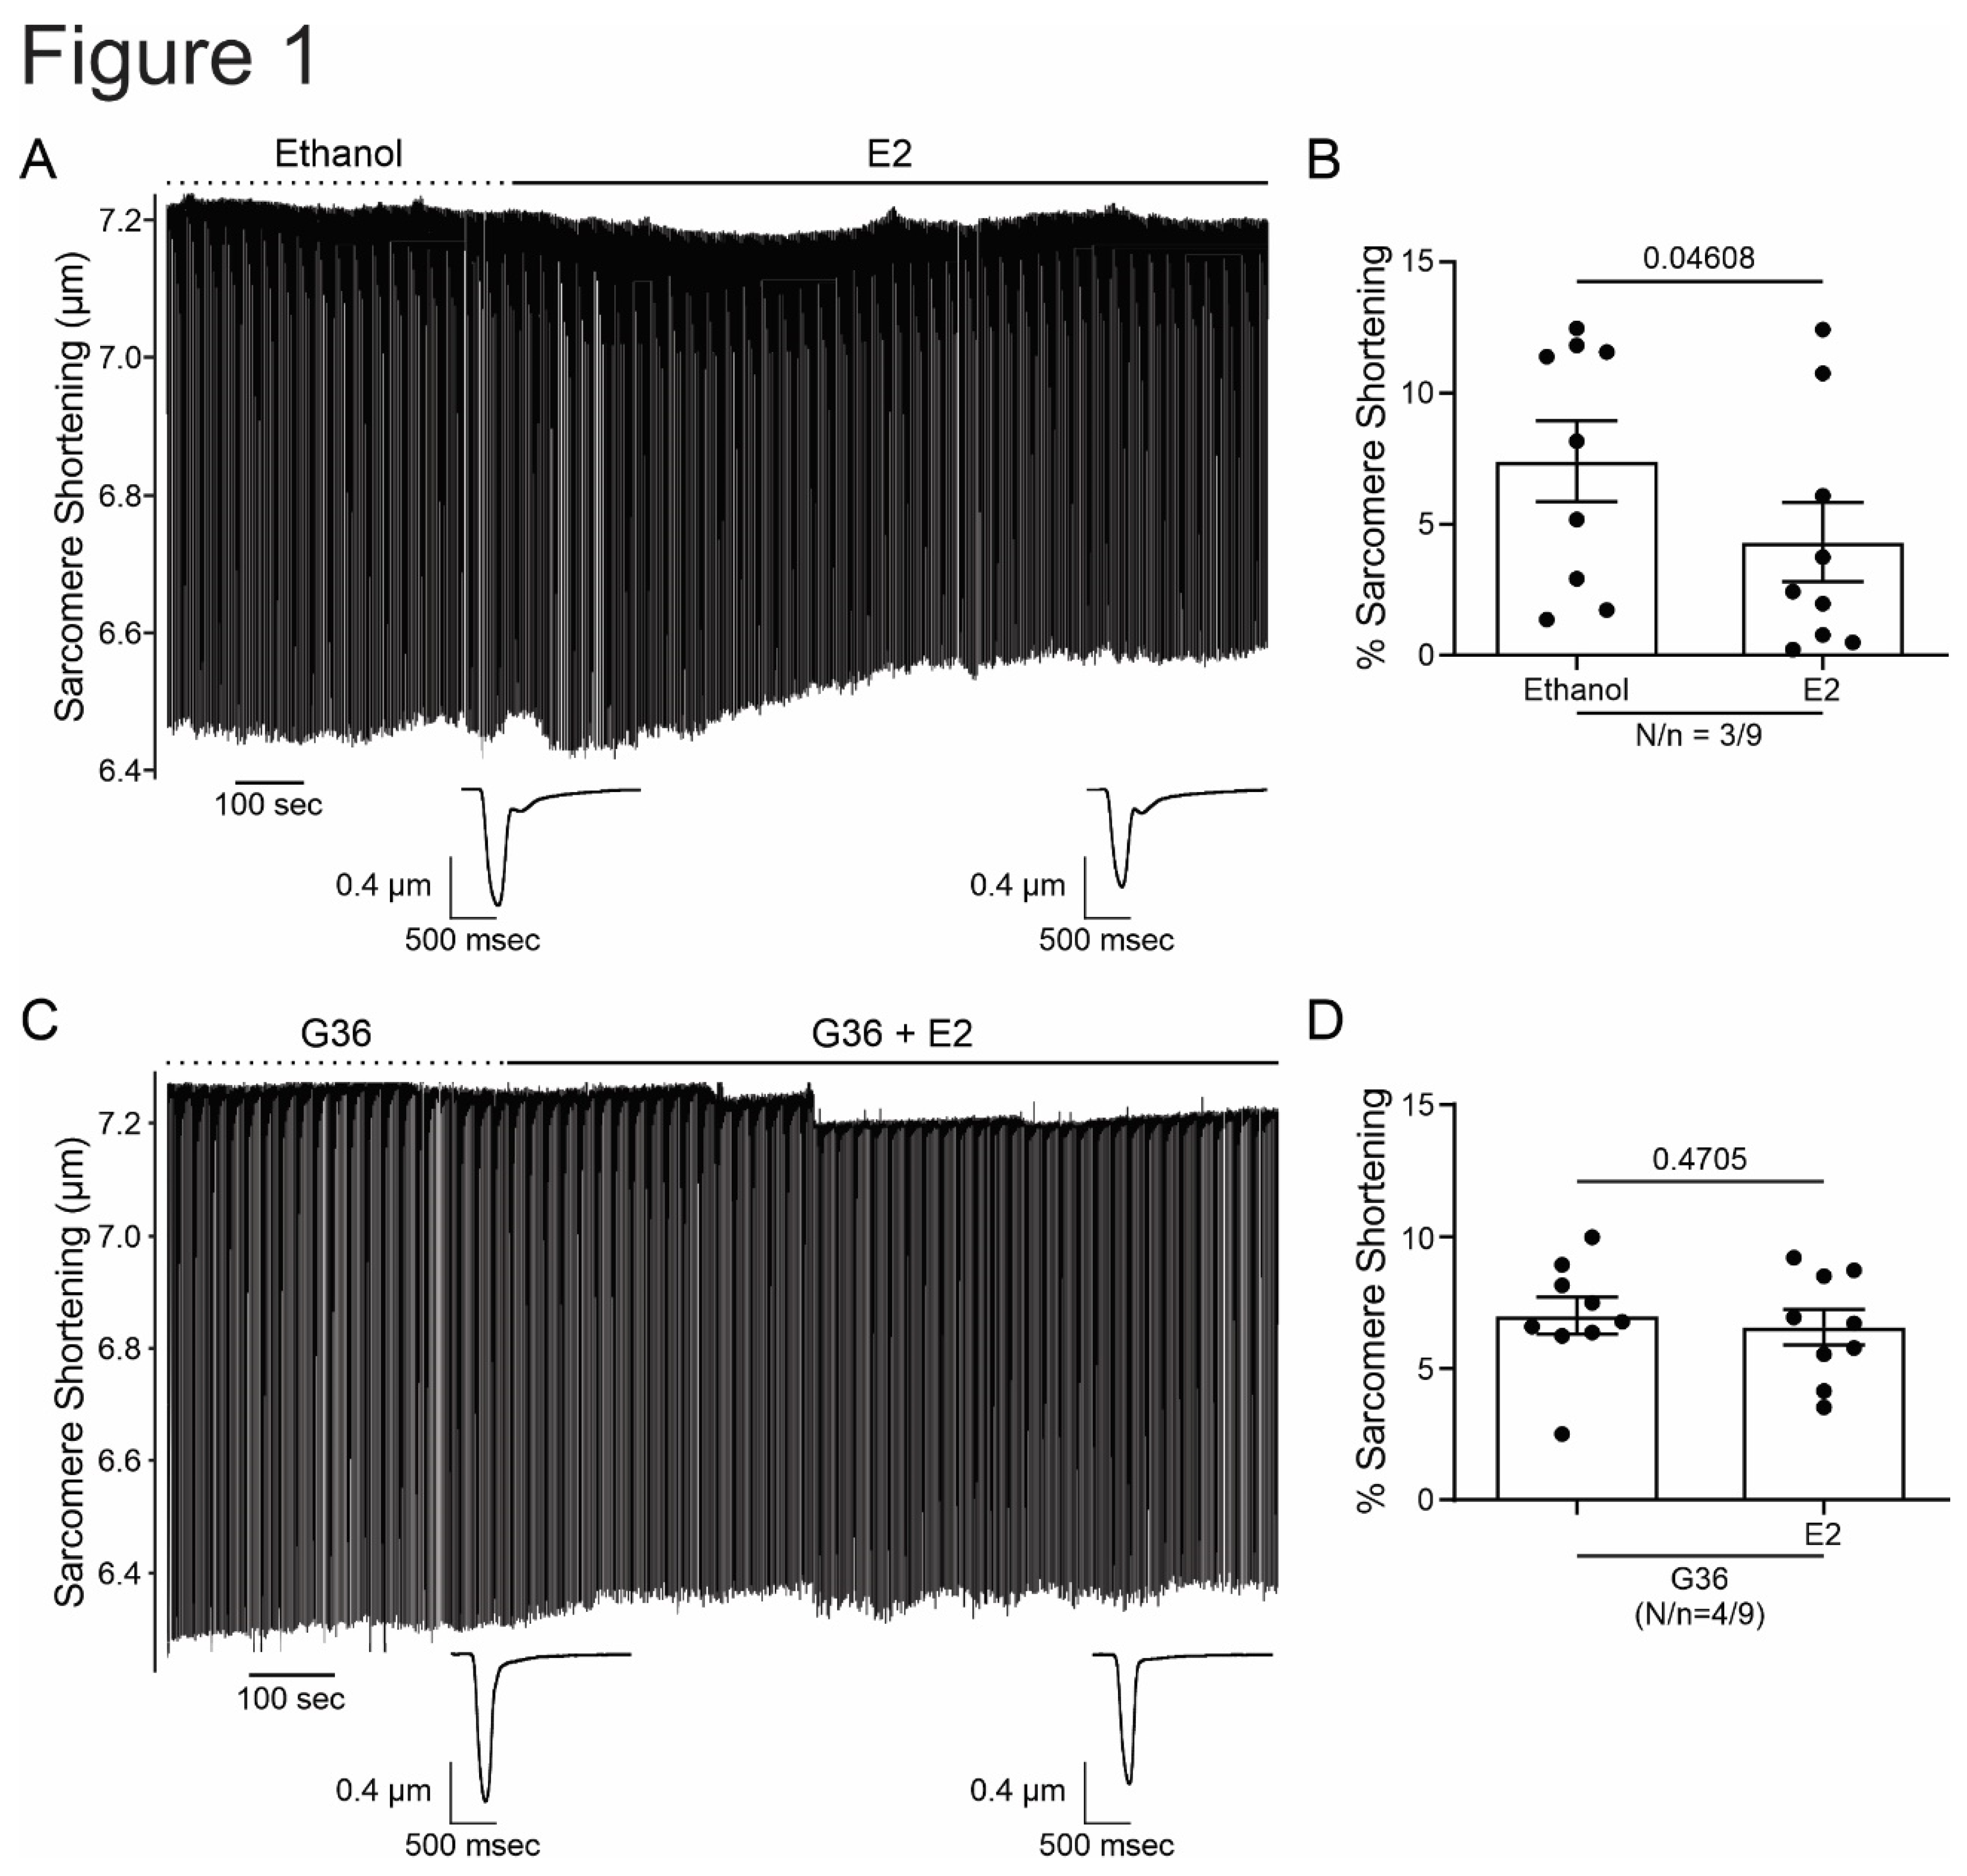
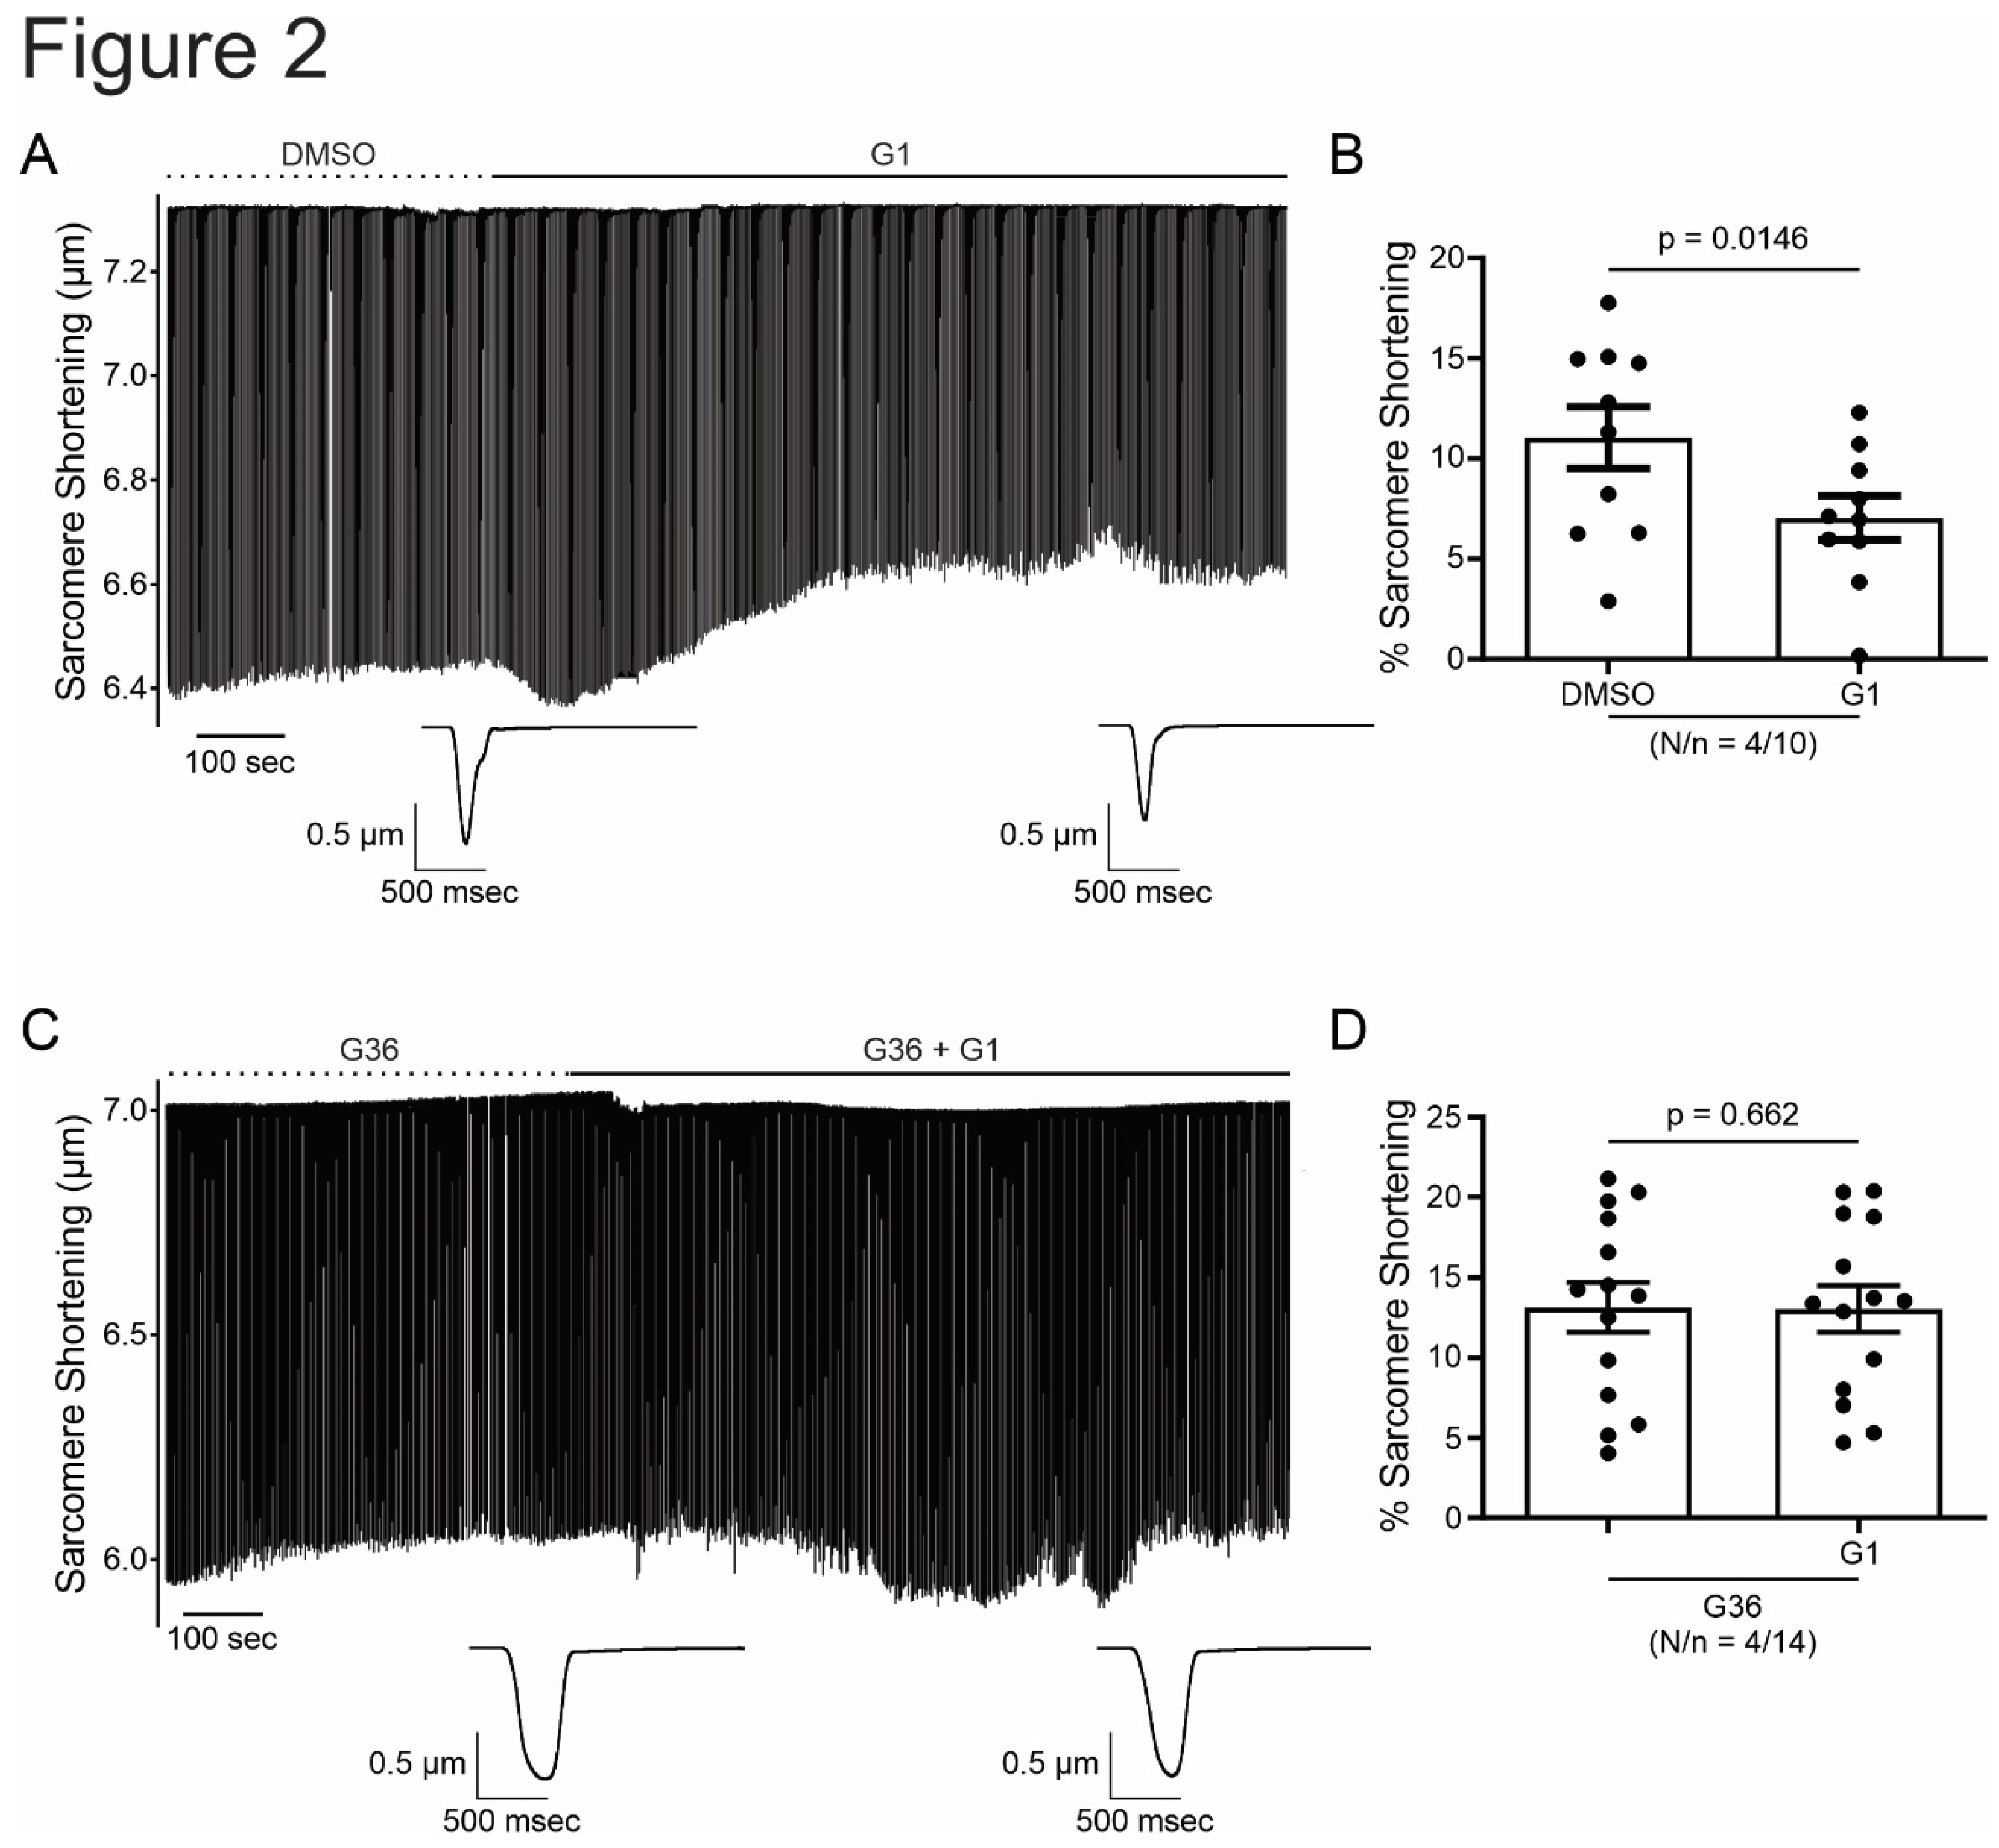
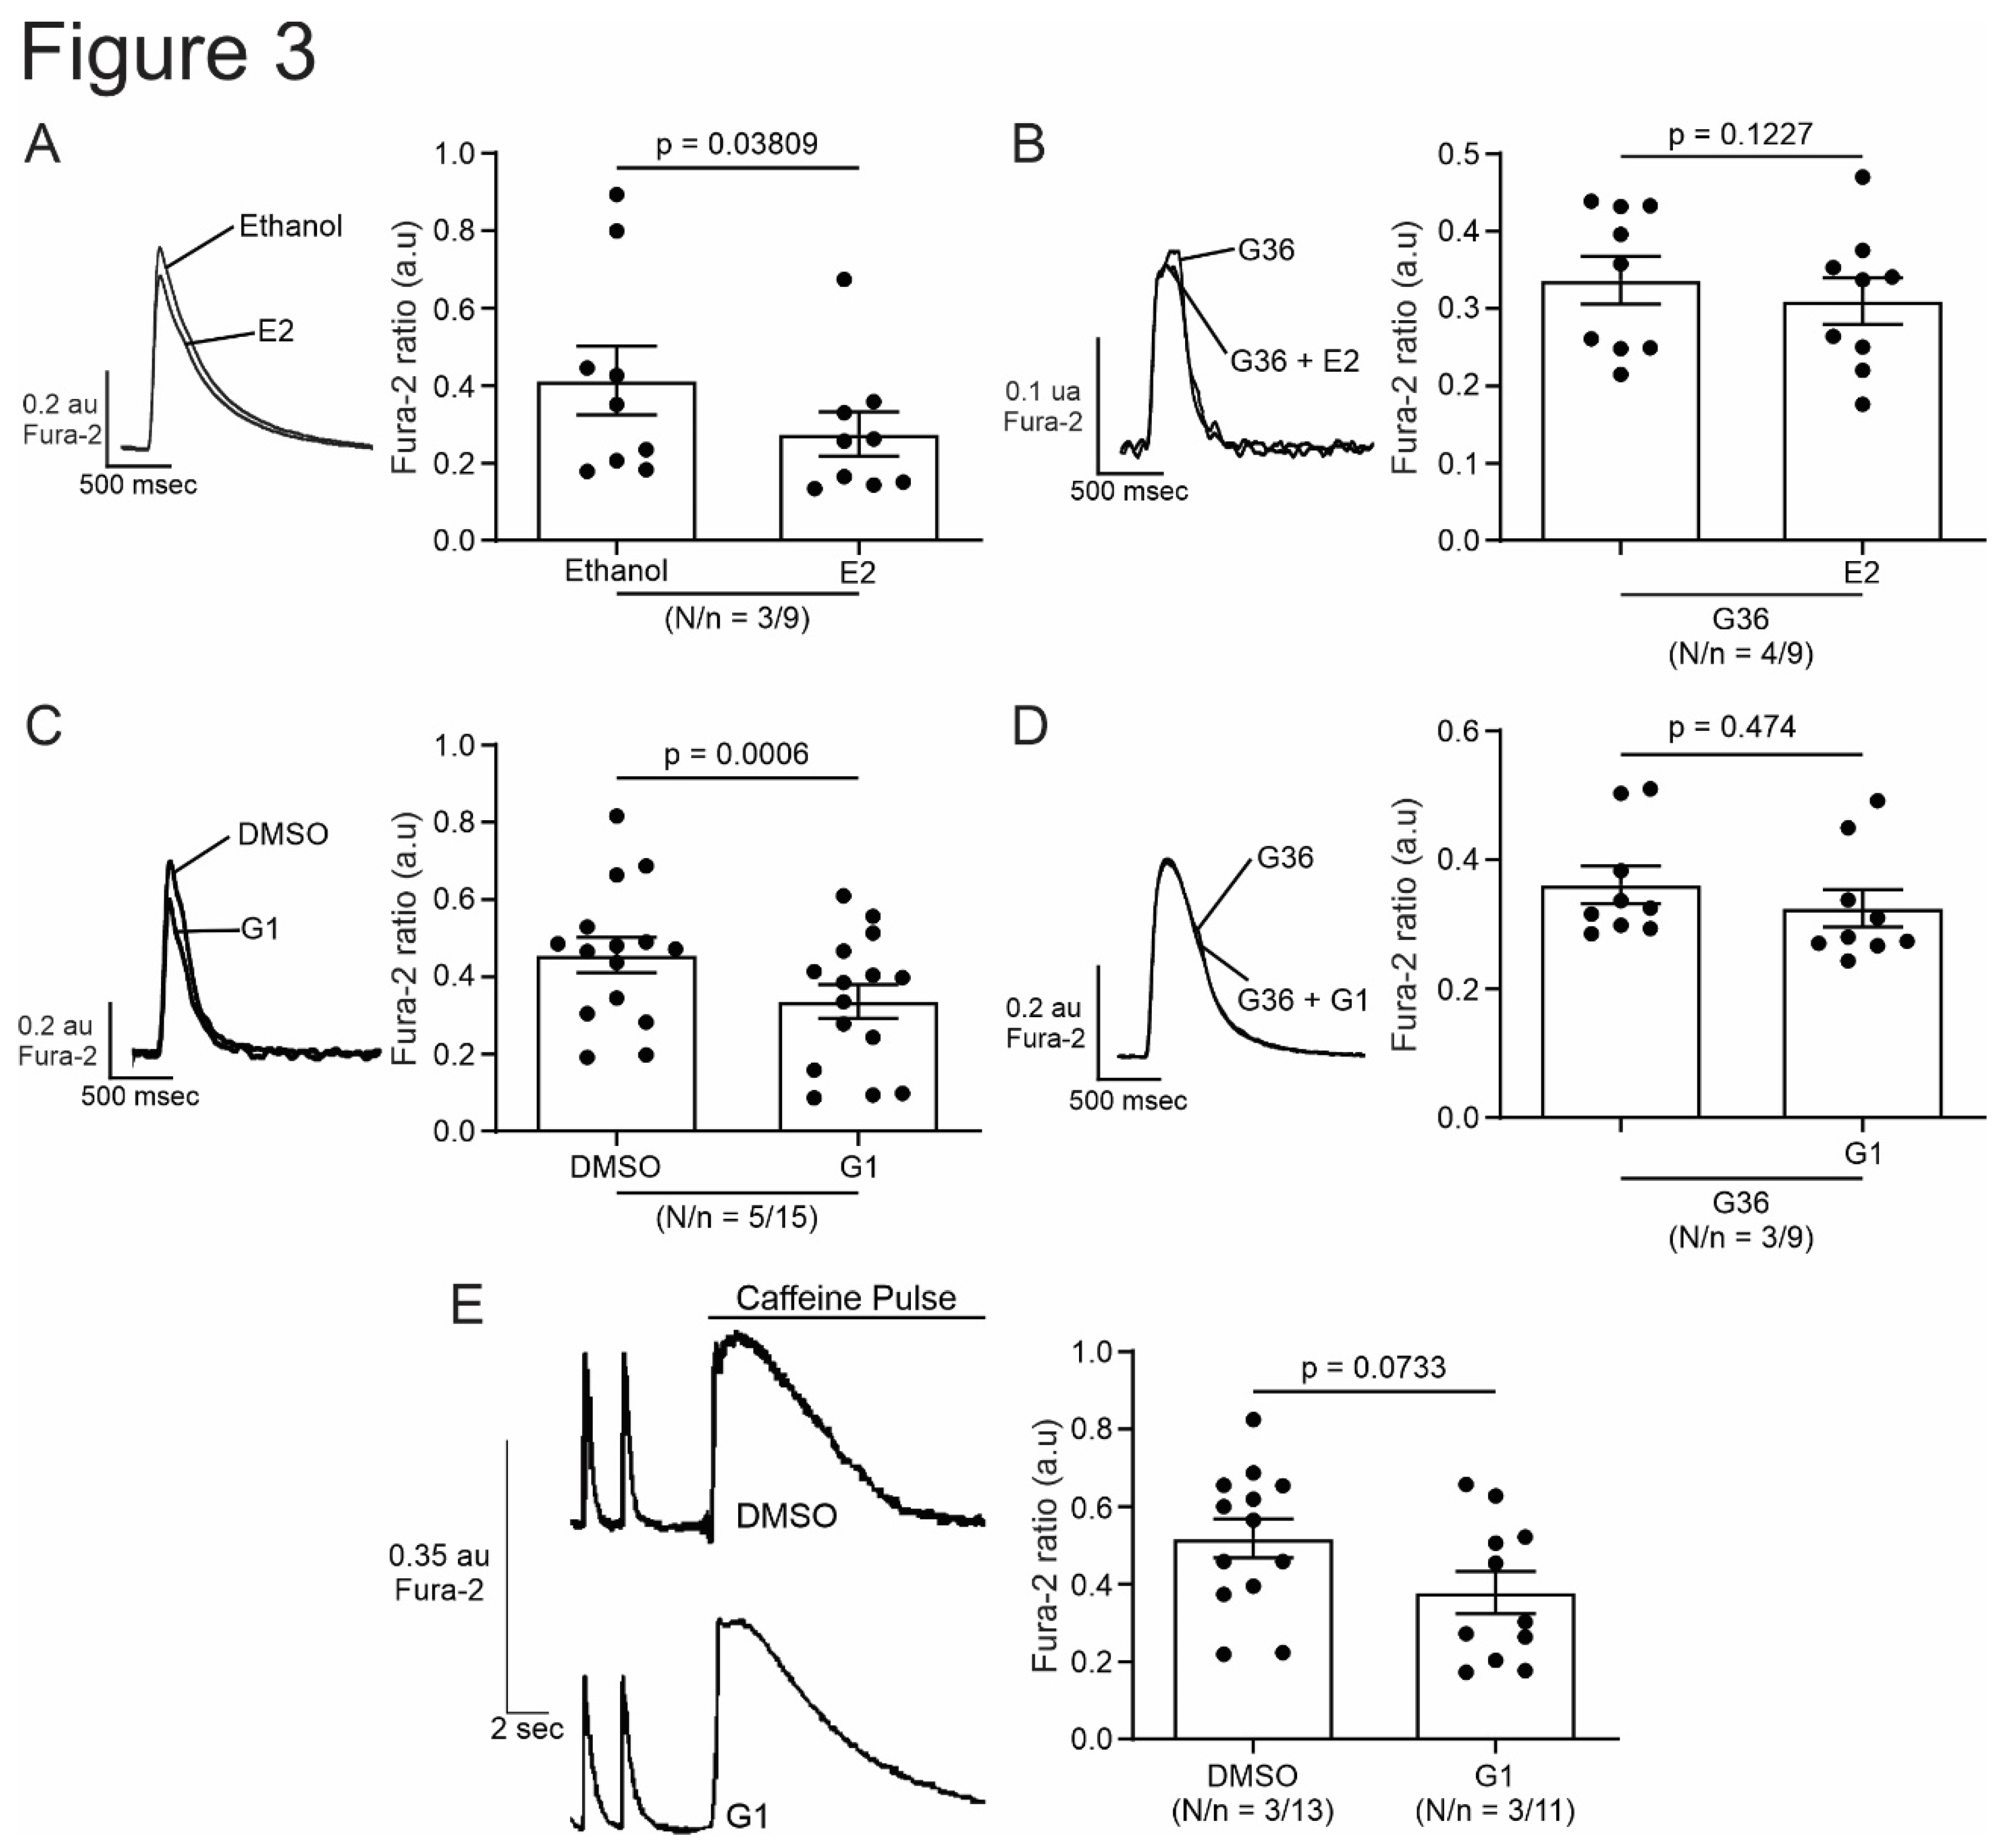
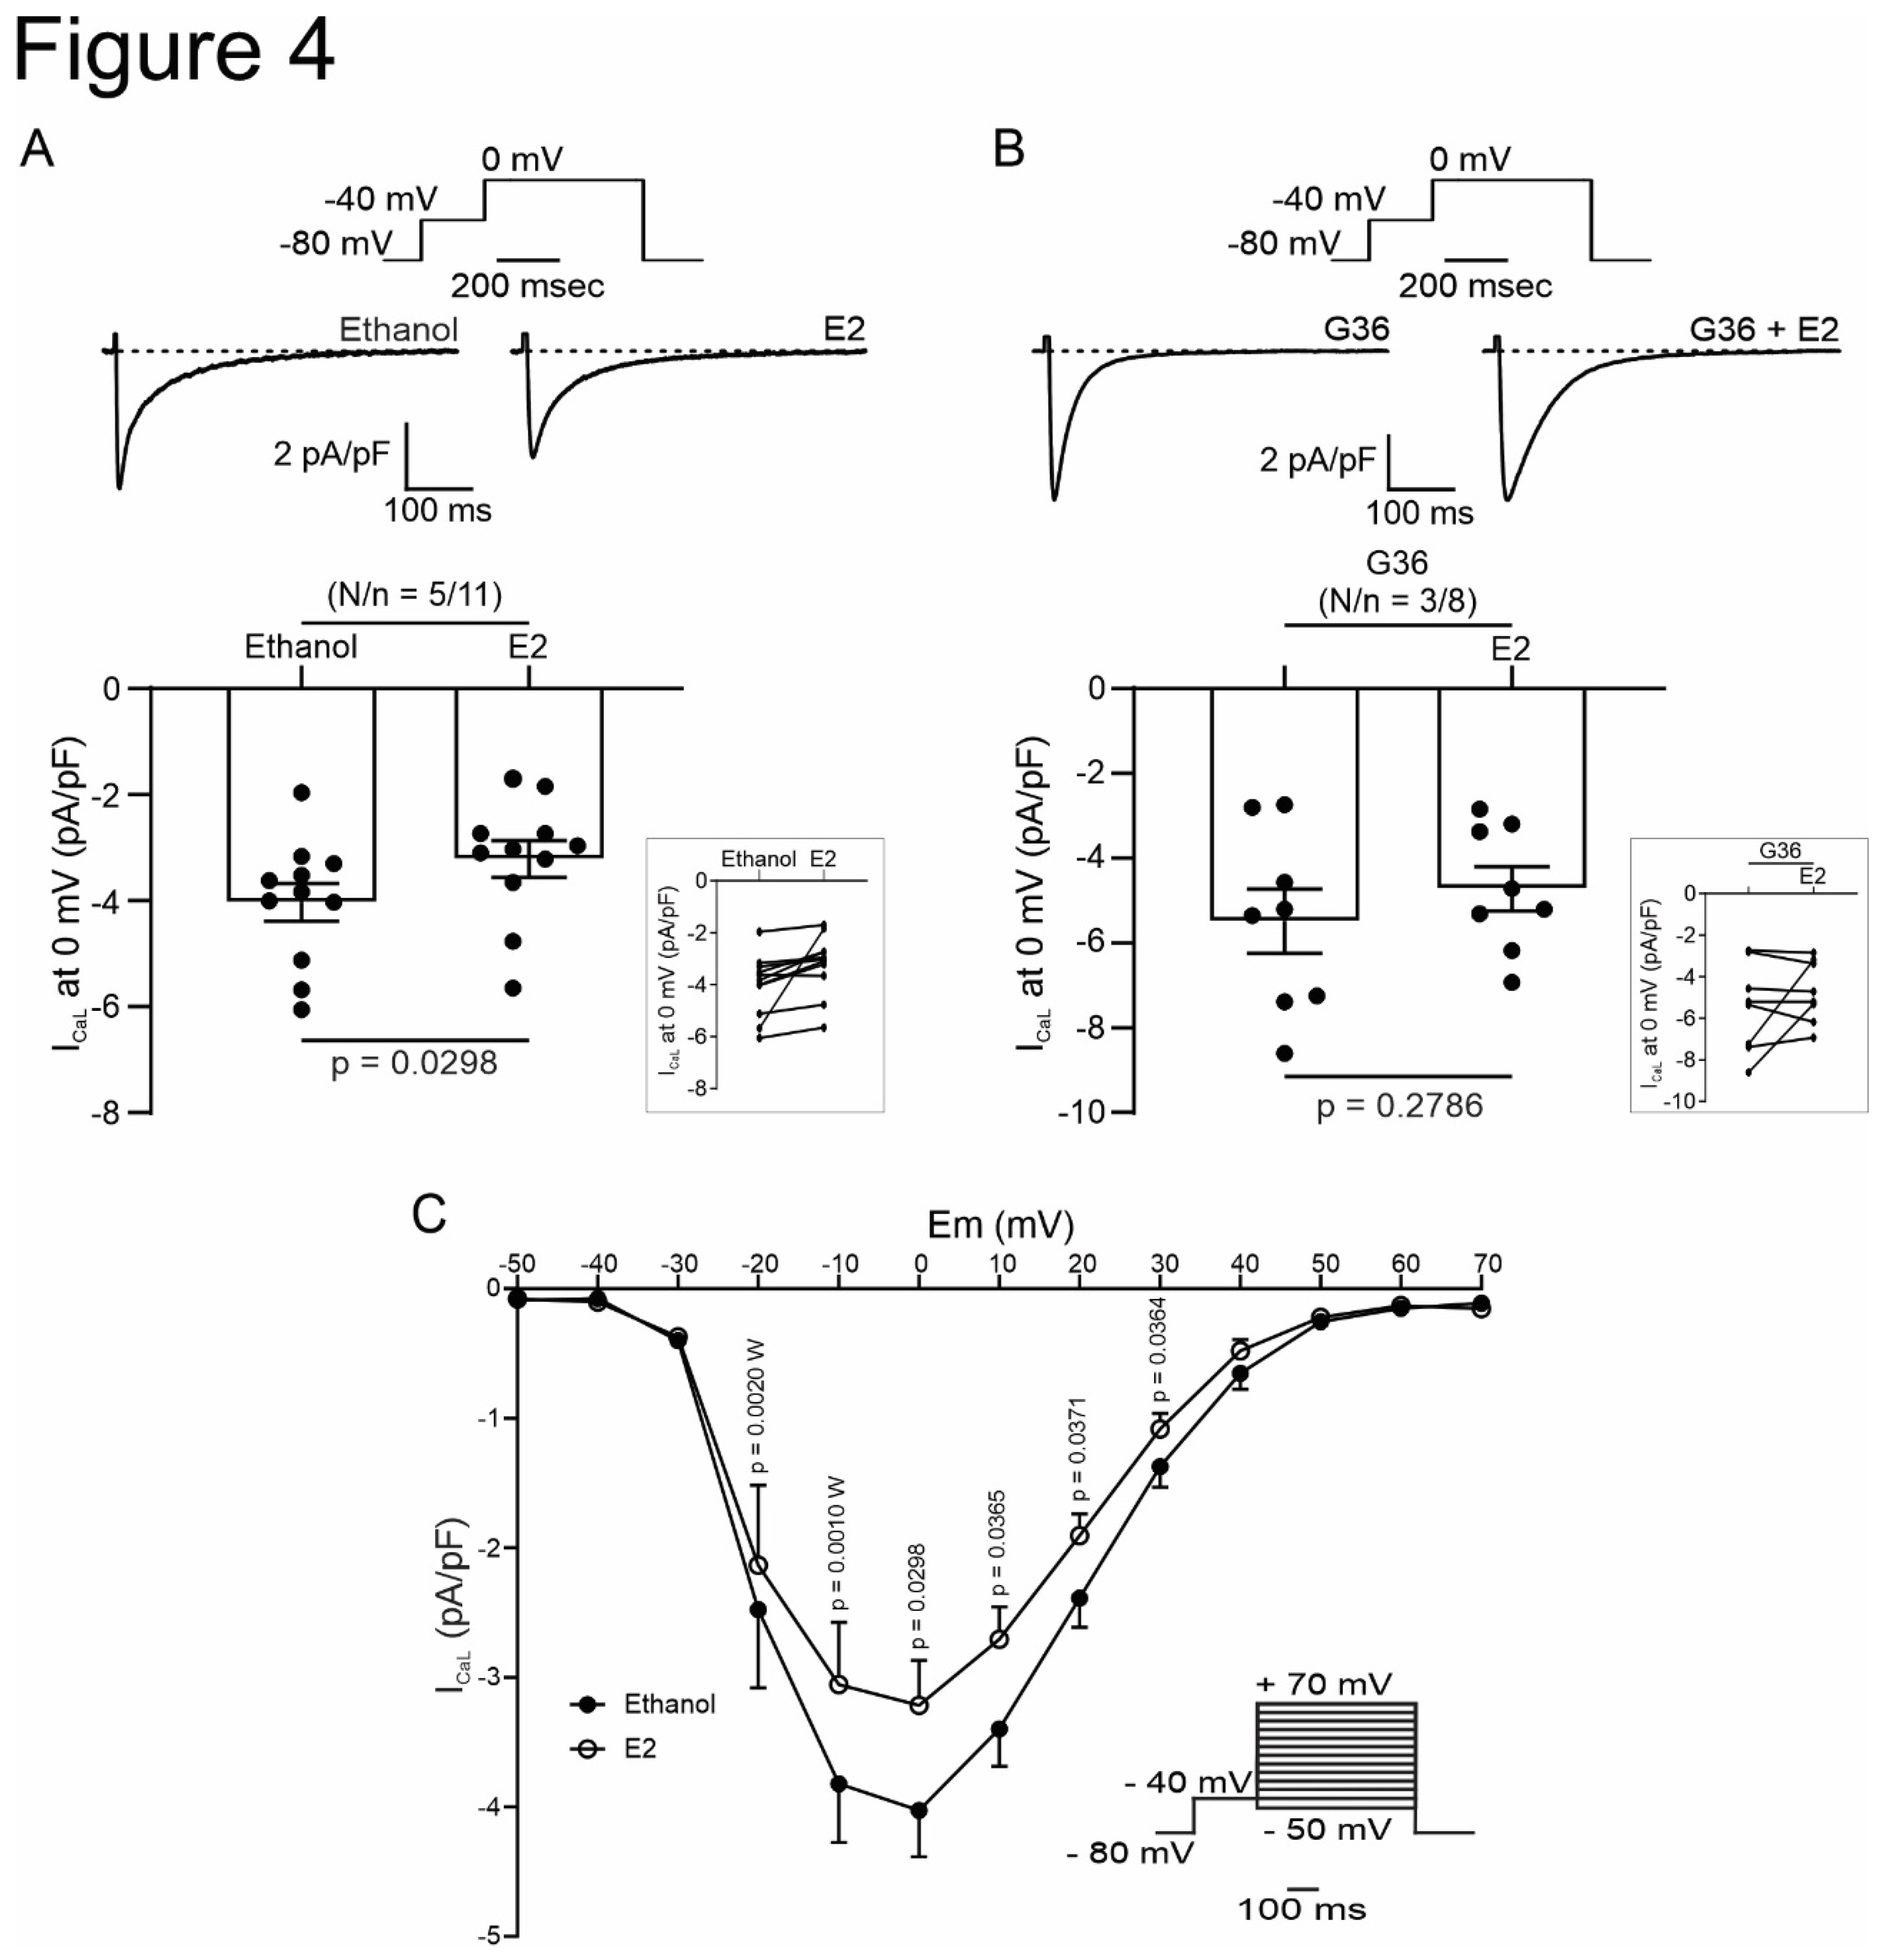
In the present paper, we demonstrated for the first time that cardiac GPER activation with E2 or G1 induced a rapid negative inotropic effect through downregulation of LTCC, which decreases I
CaL and CaT, subsequently reducing cardiomyocyte contractility. In association with this mechanism, a previous report from our laboratory has demonstrated that GPER is located in T tubules of cardiomyocytes, suggesting that its signaling could be relevant for ECC [
36]. Although it is not clear at this time whether this effect of GPER activation and decrease in Ca
2+ is cardioprotective, it could be speculated that in certain conditions, for example reperfusion following an ischemia where there is a sudden intracellular Ca
2+ overload, our proposed mechanism protects the cardiomyocyte. Accordingly, previous studies have demonstrated favorable results using different LTCC blockers [
23,
24,
25], suggesting the important contribution of Ca
2+ influx across these channels during reperfusion.
The idea of using GPER as a therapeutic target to prevent the development and progression of several cardiovascular diseases is still under investigation and needs further research. Different works have demonstrated that chronic activation of GPER produces cardiovascular protection like blood pressure reduction in an ovariectomy (OVX) model [
15]; improvement of heart function after ischemia-reperfusion injury, independently of animal sex [
10], and prevention of diastolic dysfunction in salt-induced hypertension [
16]; among other publications. Consistently, we have recently reported that OVX rats exert a deteriorated mechanical response after ischemia and reperfusion injury and bigger infarct size, possibly due to an impaired mitochondrial function, which was successfully prevented with the chronic treatment with G1 [
22]. Interestingly, acute application of E2 during reperfusion after ischemia has also been demonstrated as a cardioprotective alternative [
21]. In this case, the authors proposed that GPER activation, increasing NO production and activating ERK 1/2 kinase can prevent mitochondrial transition pore aperture. This acute cardioprotective effect of GPER activation was also reported by
Rocca et al., when identified PI3K-AKT-eNOS pathway to improve mitochondrial survival [
37]. Nevertheless, the GPER-induced modulation of ECC reported herein might represent a novel non-genomic cardioprotective pathway that deserves future elucidation.
Several publications have demonstrated that the activation of GPER involves the increased activity of PI3K and NOS [
8,
10,
13,
14]. To determine whether this pathway is responsible for contractility and Ca
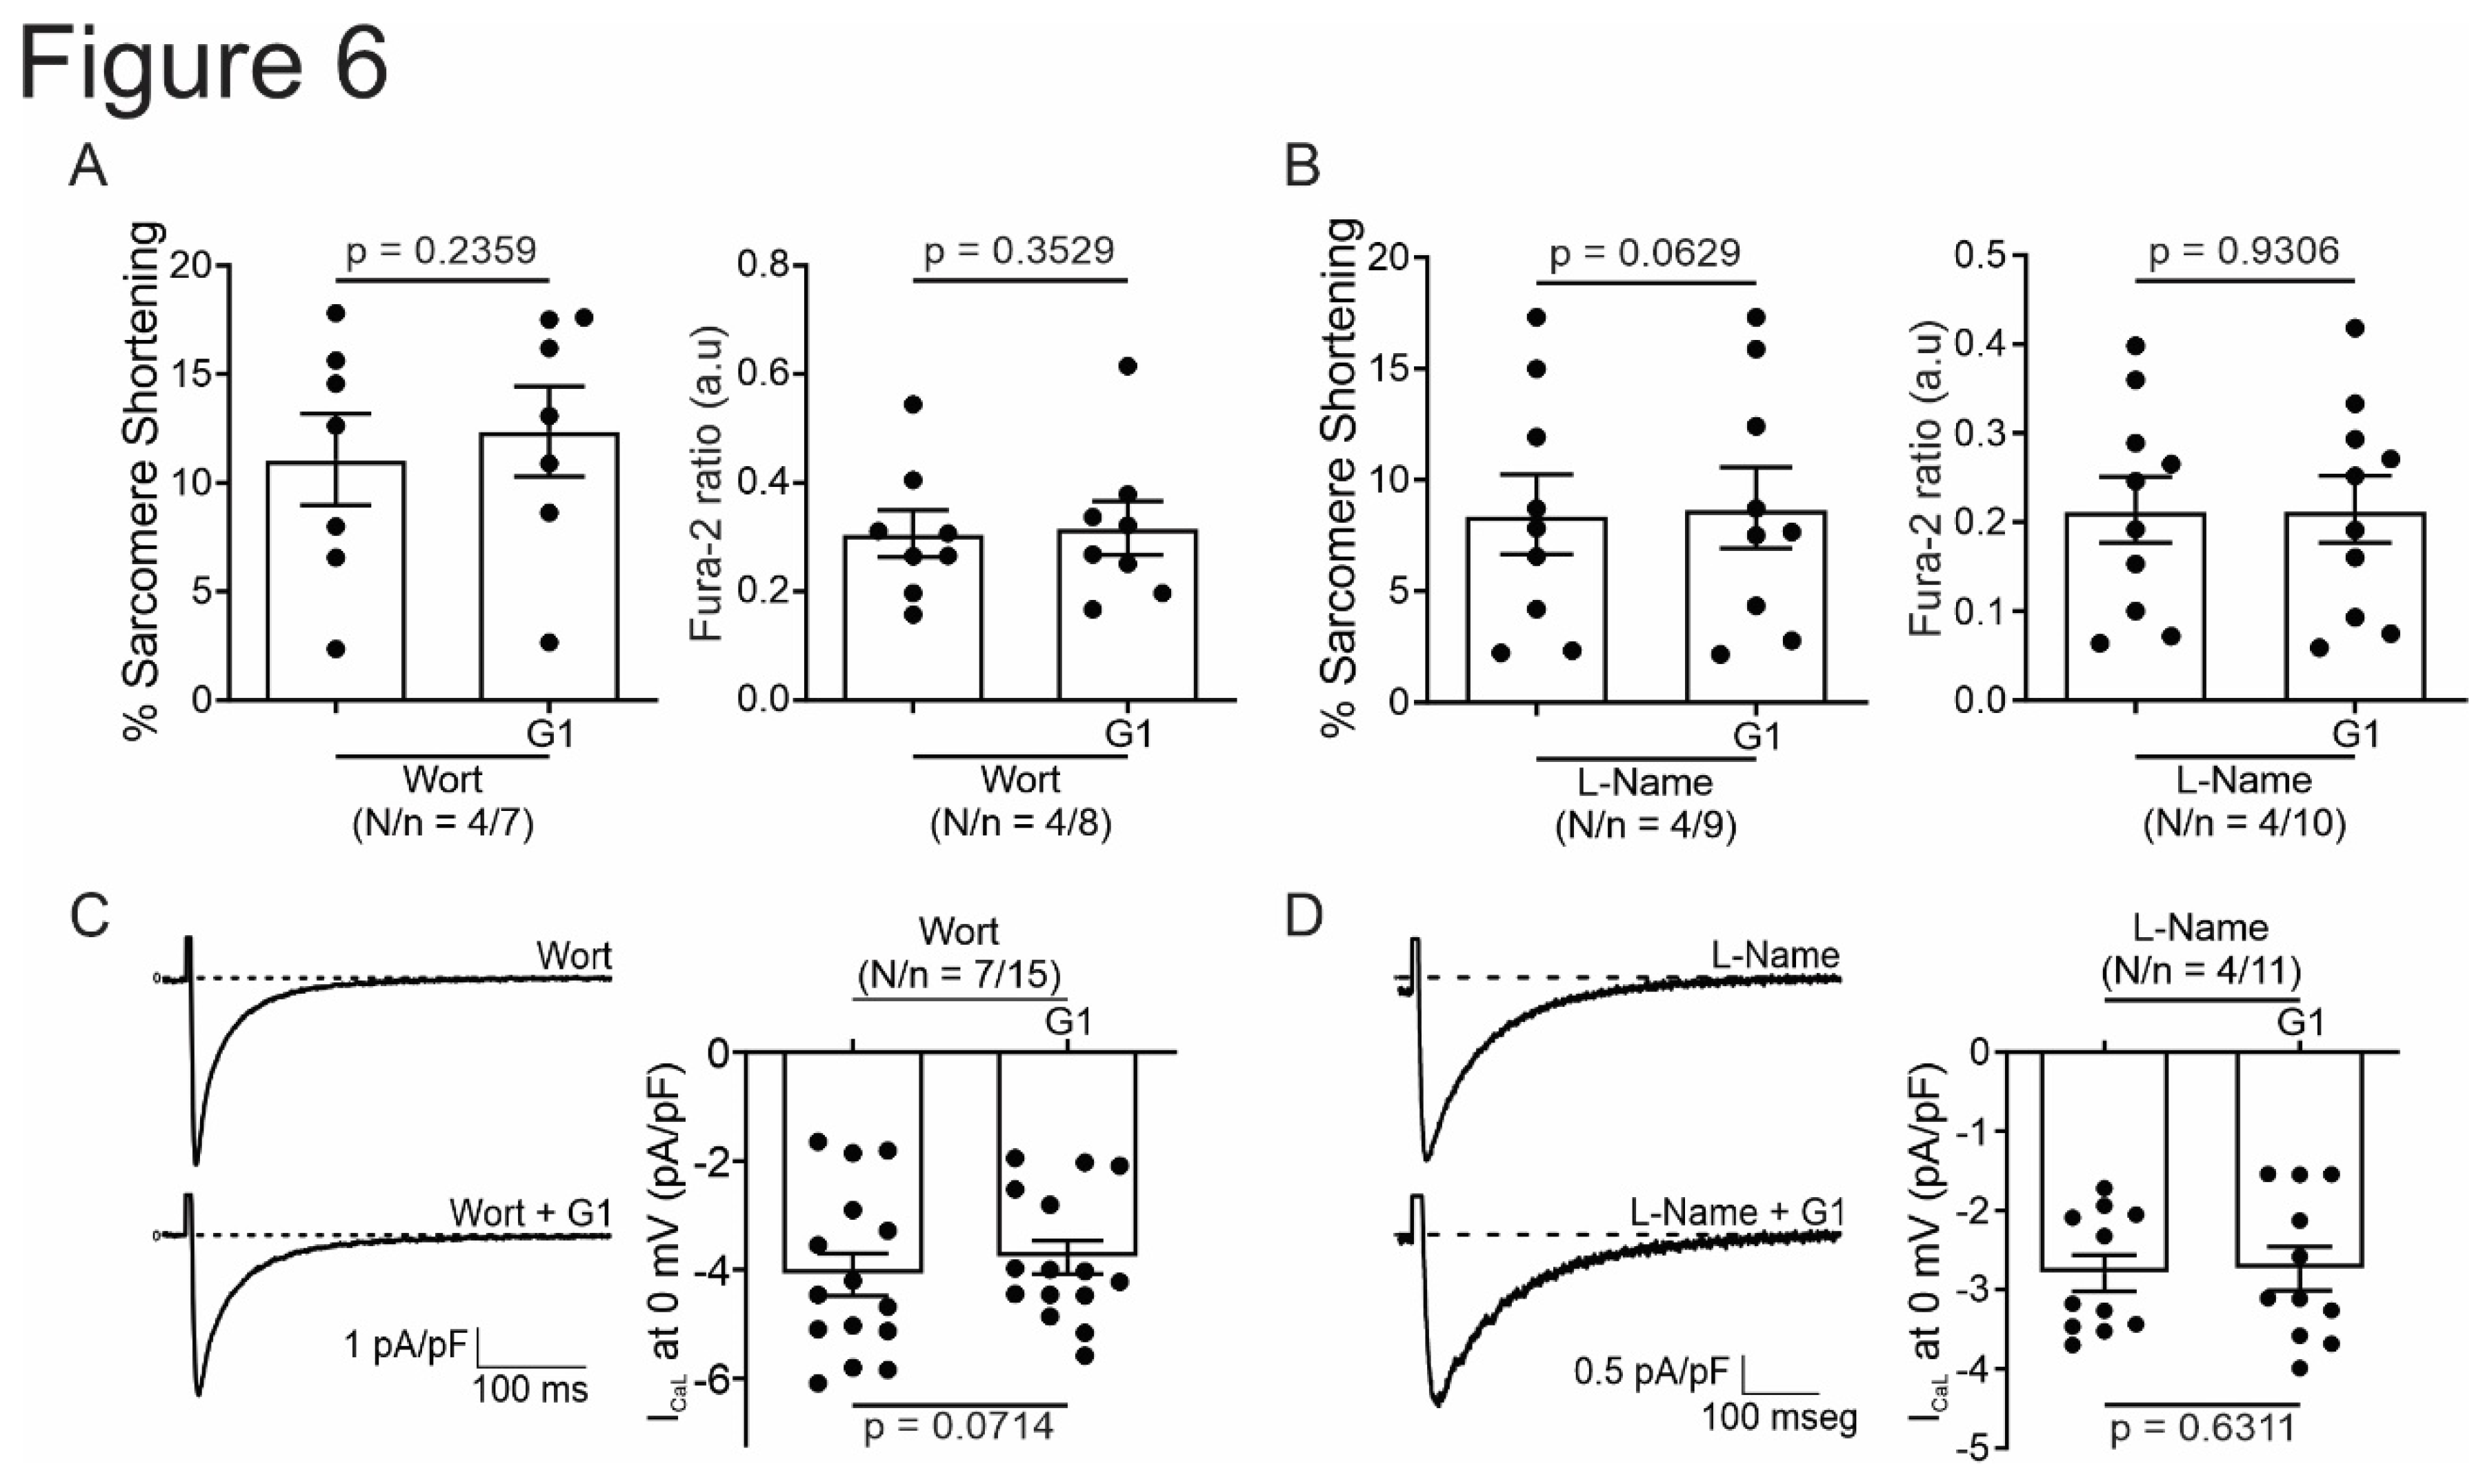
2+ handling, we use inhibitors for each possible candidate. When we used L-Name to inhibit NOS GPER did not generate an effect on ECC, indicating that NOS represents one actor in GPER actions. However, since L-Name is a general blocker of NO production, we cannot elucidate which NOS is implicated in this effect. Several reports have described that the activity of Ca
2+ channels could be modulated by NO [
38,
39]. Consistently with our results, α1C subunit have nitrosylation sites that negatively modulate channel activity [
38]. In addition, previous reports have shown that specific inhibition of nNOS induced increment of CaL activity [
40]. Moreover, transgenic mice overexpressing nNOS evidenced a negative inotropic effect associated with CaL block [
41]. However, another study described that NO donors increase calcium current [
42]. One possibility to explain this controversy is that the final effect of NO on the channel depends on the dose of this gas. Nevertheless, we can speculate that the pathway involved herein could be mediated by a possible nitrosylation of the channel, with the subsequent depression of its activity. However, we cannot discard the NO-induced activation of the guanylate cyclase-cGMP-PKG pathway, as this kinase was also shown that phosphorylate the channel and then inhibit it [
42]. Thus, more experiments with blockers of this pathway are necessary to give new insights into this issue.
Recently, Francis et al. have described an anti-arrhythmic effect of GPER activation on OVX guinea pigs, without changes in ICaL [
43]. The difference with the present work, in addition to the animal model, is the time that the cells were exposed to G1. In Francis’s paper, the cells were exposed for 2 hours to G1 1 μmol/L. It might be possible that our time exposition was sufficient to induce a rapid effect of GPER and after this time this effect disappeared due to modifications of GPER expression in the cell membrane by desensitization, like occurs in the regulation of other G-protein coupled receptors [
44,
45,
46].
Finally, PI3K was another actor on the pathway studied. Using wortmannin during experiments of SS, CaT, and ICaL, we obtained that inhibition of PI3K avoided the effect of the selective activation of GPER. Since is known that PI3K phosphorylates AKT and this kinase stimulated NOS [
14,
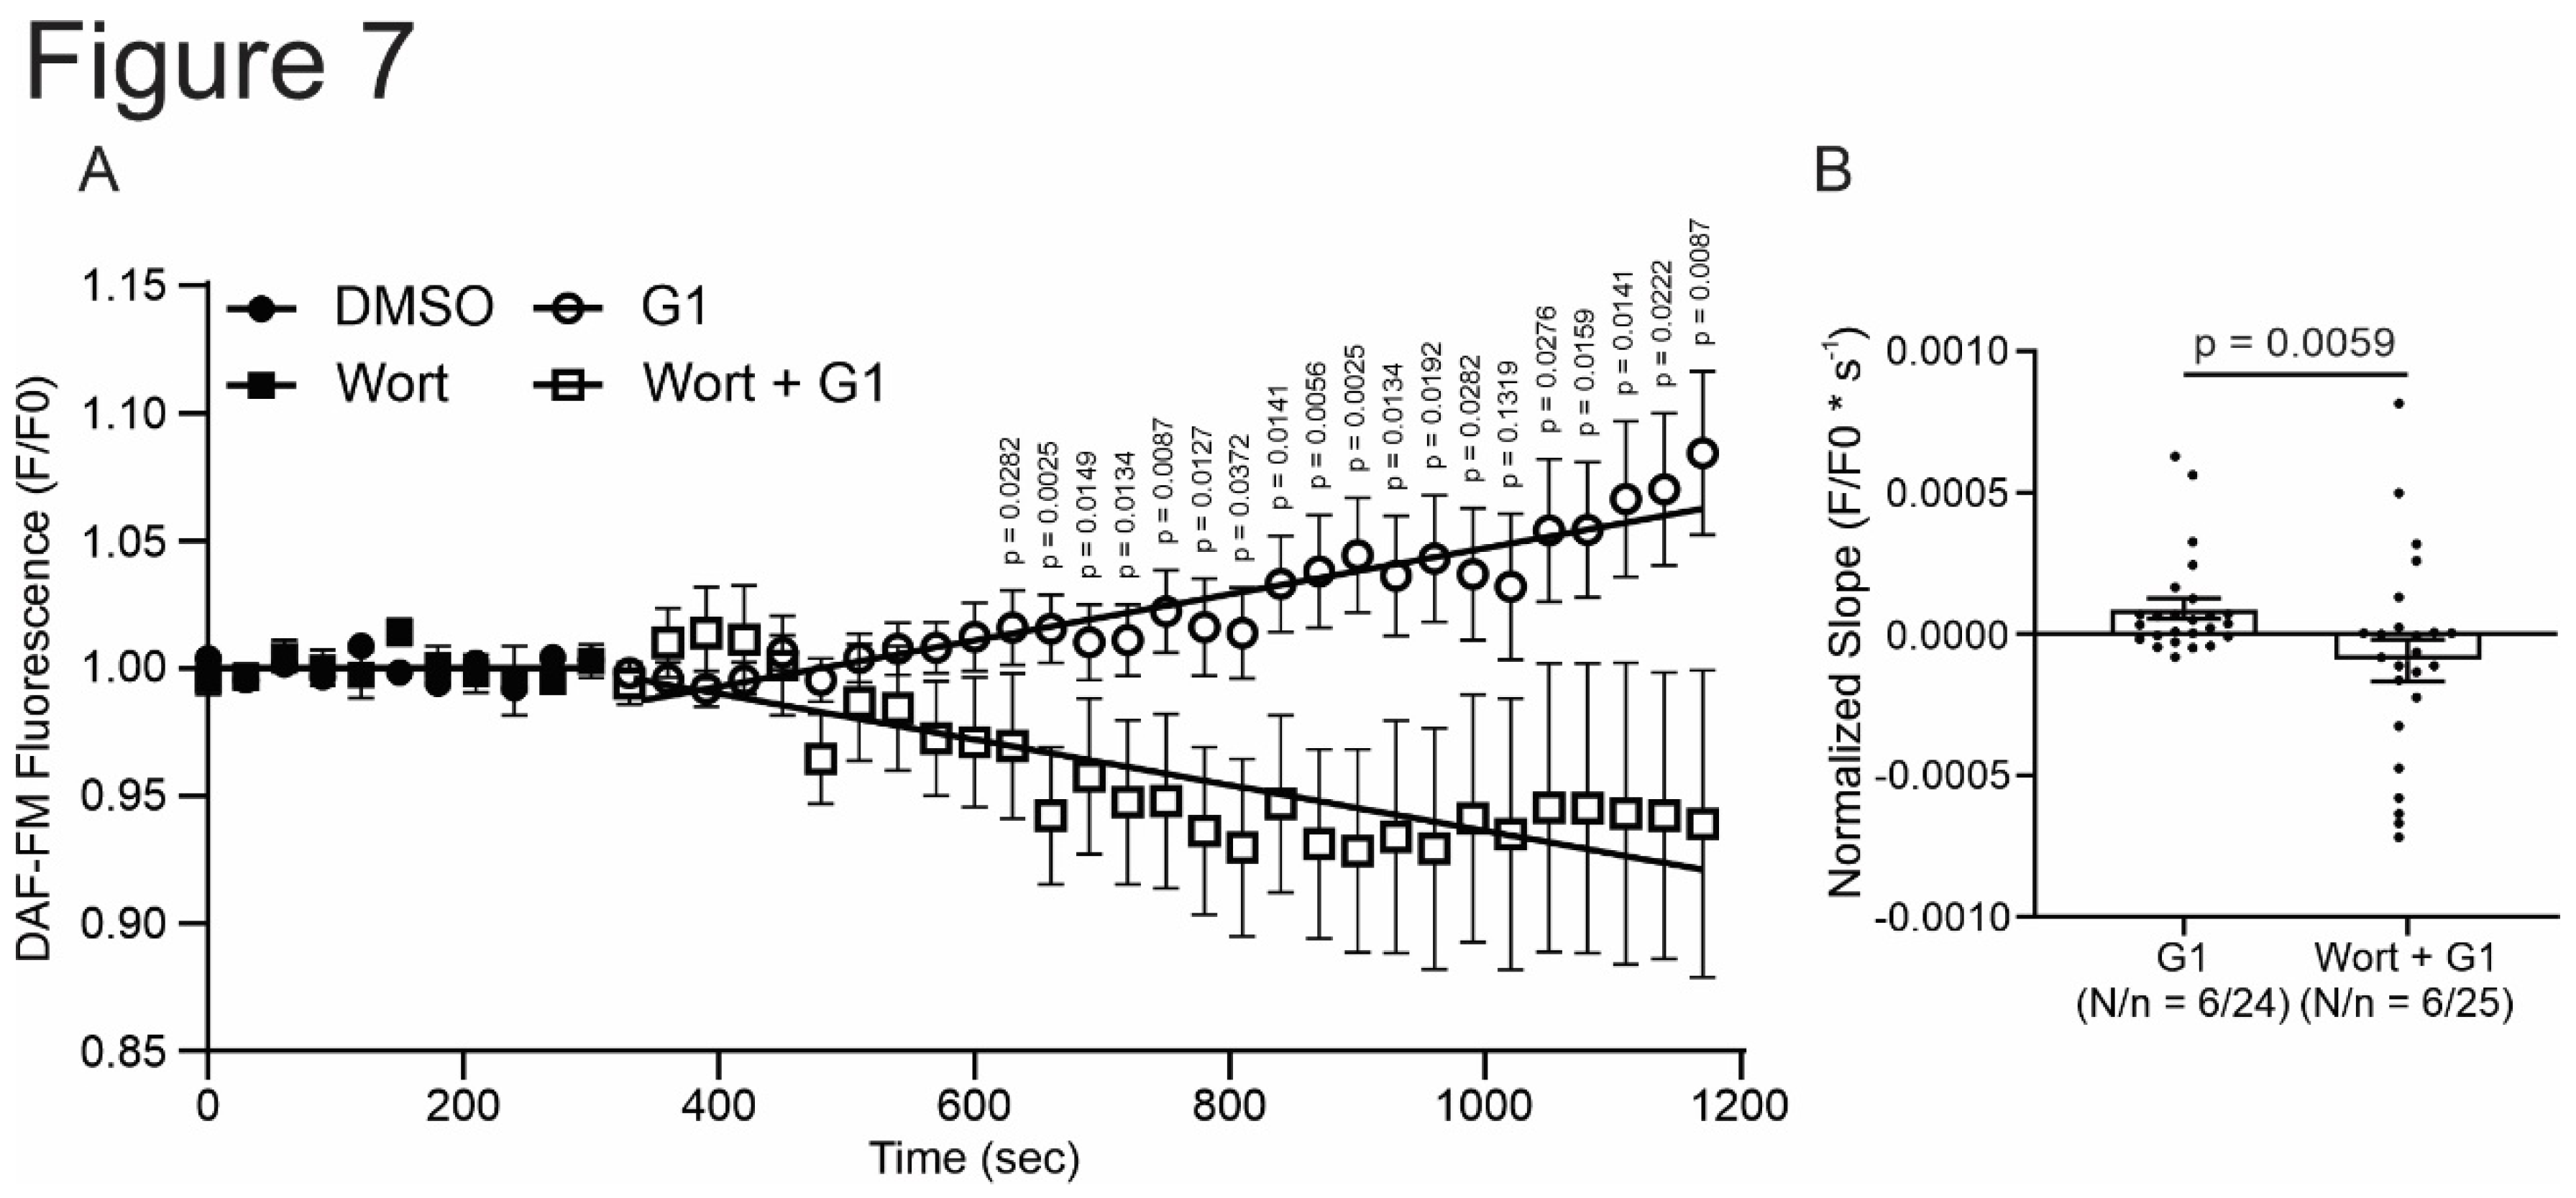
47], we propose to evaluate if this sequence of events is triggered after the activation of GPER. Thus, we determined NO production using DAF-FM diacetate with or without wortmannin. G1 increased NO production and the inhibition of PI3K prevented this effect. These results indicate that the pathway triggered by GPER activation is PI3K/NOS/NO.
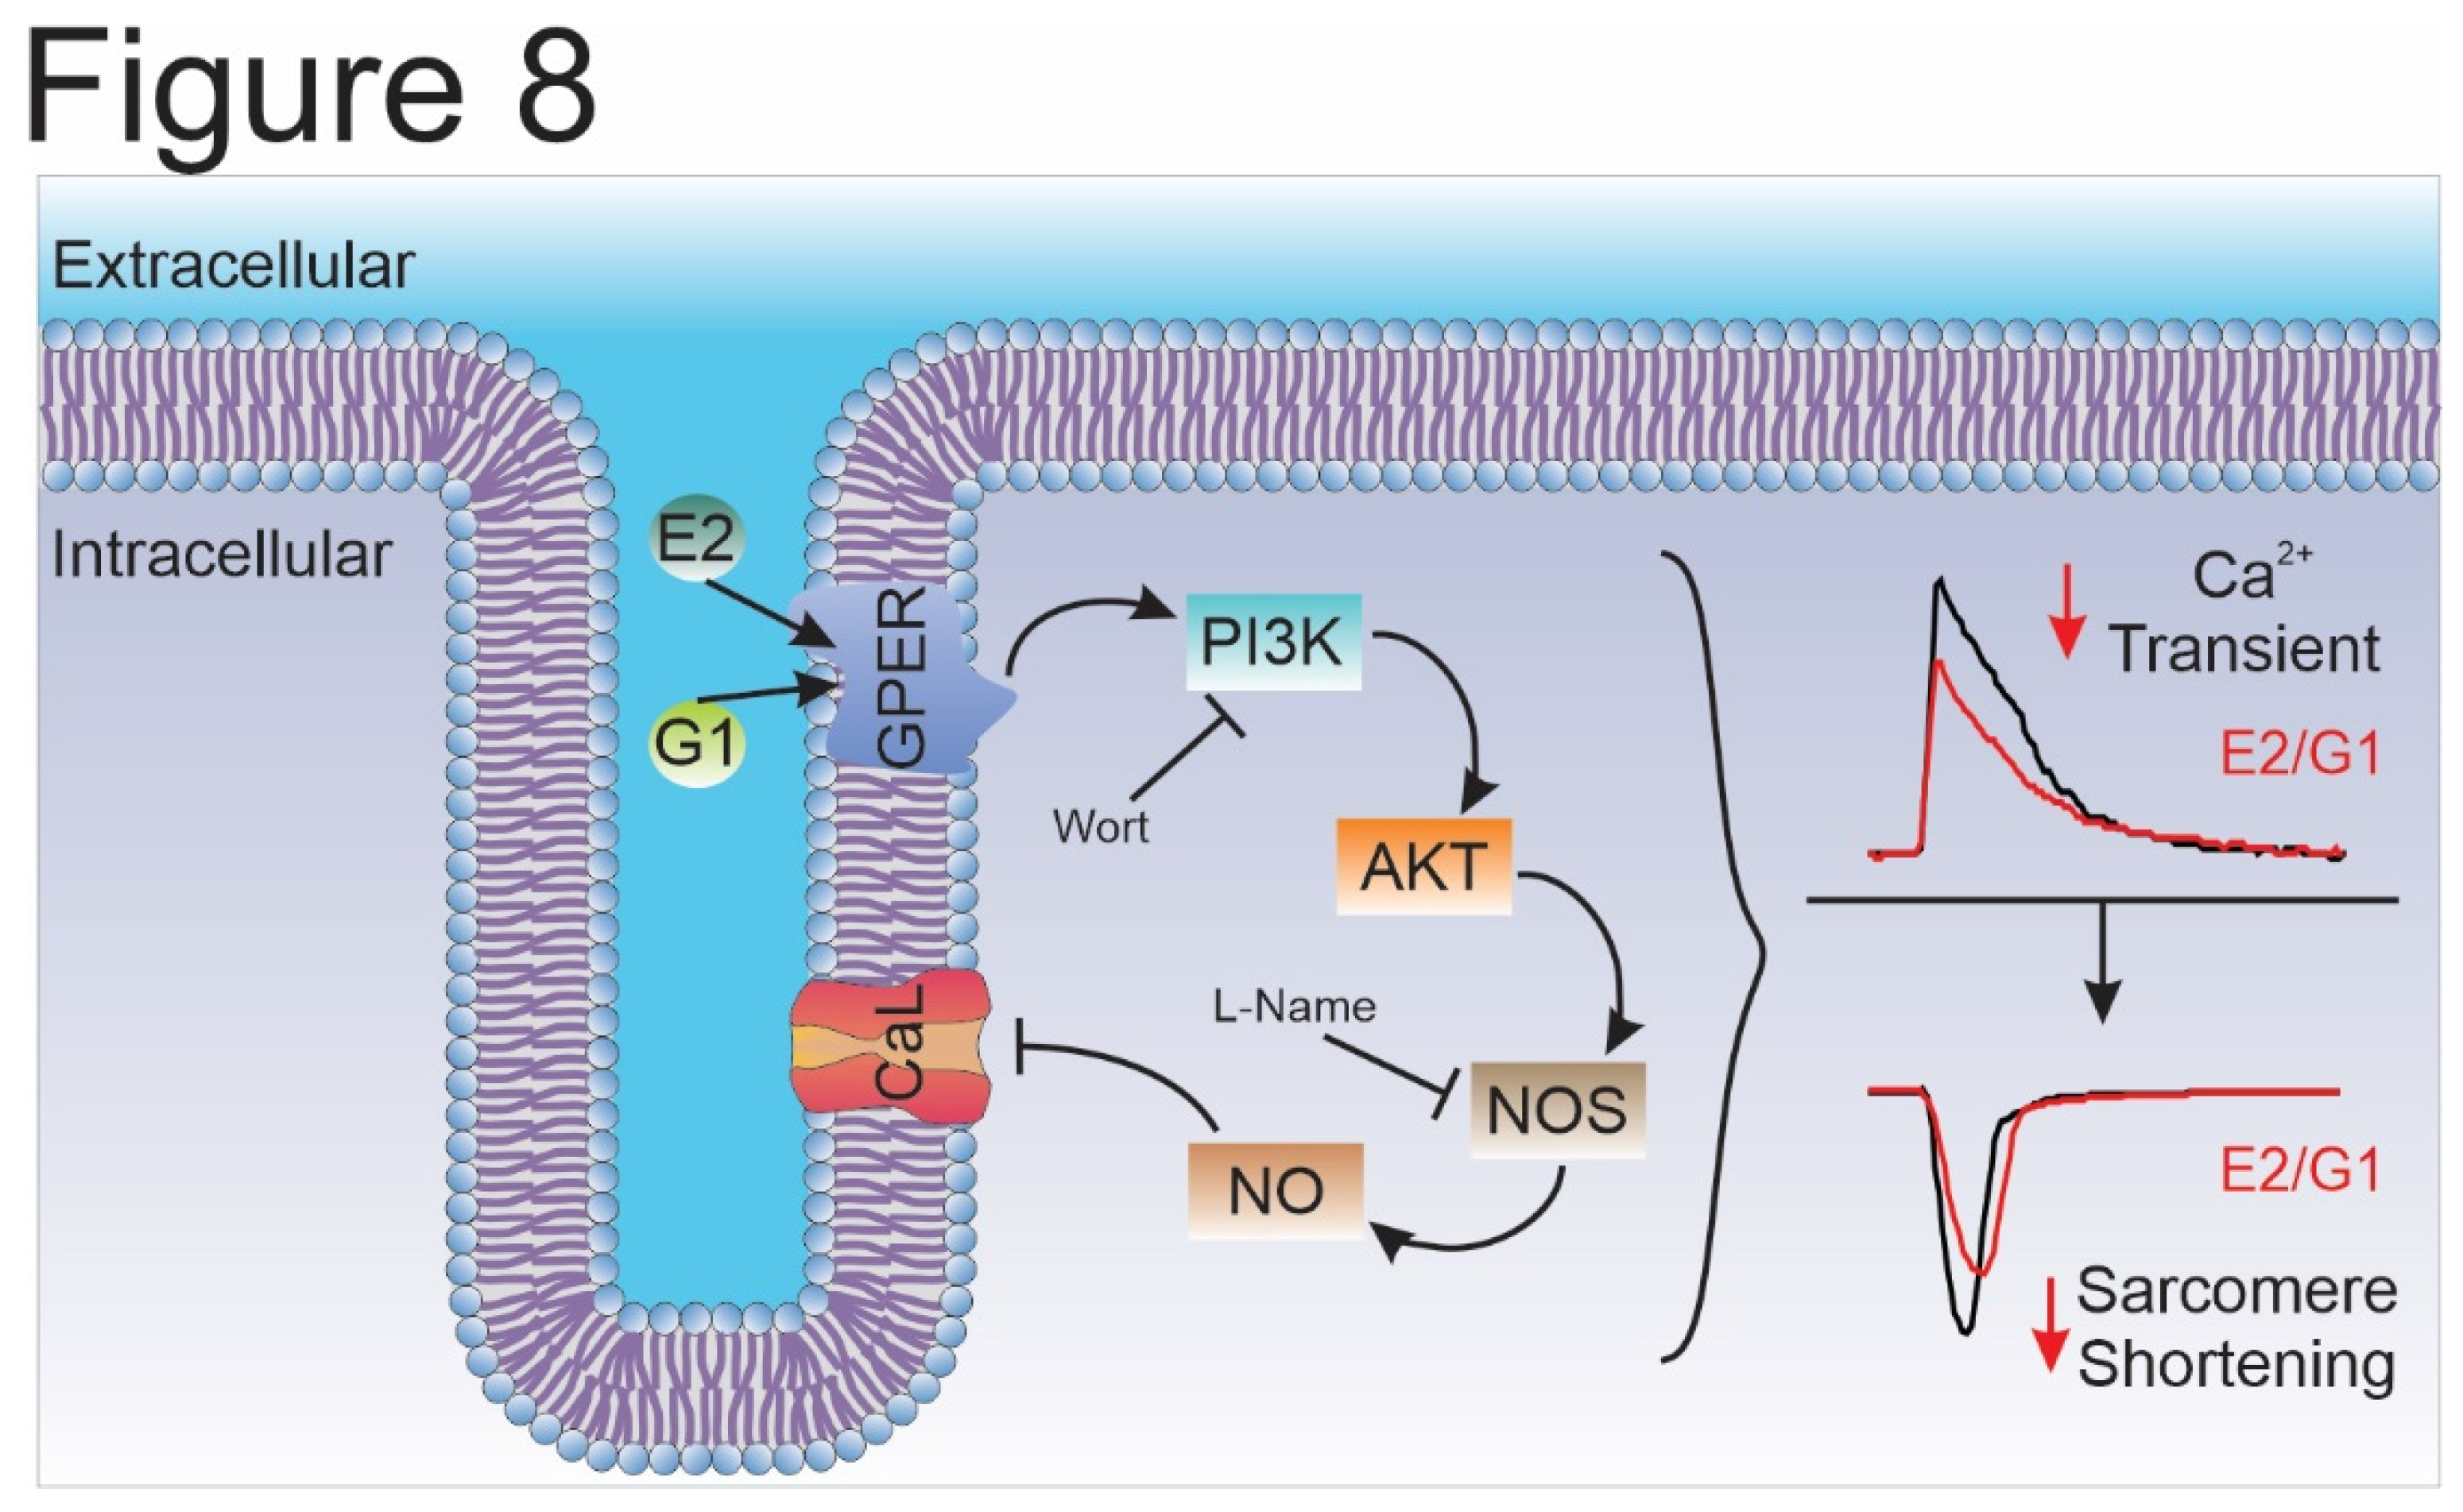
Overall, we conclude that the selective activation of GPER decreases CaT amplitude and consequently cardiomyocyte contractility by an ICaL reduction in Wistar male rats. In summary, we are reporting herein that the GPER-activated PI3K/NOS/NO pathway decreased CaL current and altered the contractile mechanism of the cardiomyocyte (
Figure 8). Further experiments are needed to elucidate how NO specifically decreases I
CaL.
Materials and Methods
Animals
All experiments were performed following the Guide for Care and Use of Laboratory Animals (NIH Publication No. 85-23, revised 2011) and approved by the Ethics committee of the Faculty of Medicine, La Plata, Buenos Aires, Argentina. Male Wistar rats of 12-week-old were used for all experiments.
Ventricular Myocytes Isolation
Ventricular myocytes were isolated according to the technique previously described [
48] with some modifications. The heart was attached via the ascendent aorta to a cannula, excised, and mounted in a Langendorff apparatus. Then a retrograde perfused at 37ºC with perfusion buffer (P-B) of the following composition (in mmol/L): 146.2 NaCl, 4.7 KCl, 1 CaCl2, 10 HEPES, 0.35 NaH
2PO
4, 1 MgSO
4, and 11 glucose (pH adjusted to 7.4 with NaOH). The solution was continuously bubbled with 100% O2. After a stabilization period of 4 minutes, the perfusion was switched to a nominally Ca
2+-free P-B for 4-5 minutes. The hearts were then perfused with collagenase (140 units/ml) in P-B containing 50 µmol/L of CaCl
2for 12-15 minutes or until it became flaccid. The heart was then removed from the perfusion apparatus by cutting at the atrioventricular junction. The desegregated myocytes were separated from the undigested tissue and the CaCl
2 concentration of perfusion buffer was increased in 5 steps to 1 mmol/L at room temperature (22-25ºC).
Measure of Calcium Transient and Cell Shortening
Calcium transient recordings were performed as previously described [
49]. Briefly, isolated myocytes were loaded with 3 μmol/L Fura-2 AM (Thermo Fisher Scientific) for 10 minutes. After a wash of the exceeding fluorescent dye, Fura-2 fluorescence kept in the myocytes was measured on an inverted microscope adapted for epifluorescence by IonOptix setup (IonOptix, Massachusetts, USA). The perfusion chamber with cells was continuously perfused at a flow rate of 1 ml/min and stimulated via 2-platinum electrodes on either side of the chamber at 0.5 Hz. The perfused solution is equal to P-B described previously (see above). The ratio of the Fura-2 fluorescence (at 510nm) obtained after exciting the dye at 340 and 380nm was taken as an index of intracellular Ca
2+ (Ca2+i). Cell shortening was detected as sarcomere shortening (SS) using a video-based motion detection and stored by software for an off-line analysis using IonWizard (IonOptix). For sarcoplasmic-reticulum (SR) Ca
2+ content measurement, a solution containing 15 mmol/L caffeine was rapidly applied to cells. The amplitude of the caffeine-induced Ca
2+ transient was used to estimate SR Ca
2+ content.
Patch-Clamp Recording
L-type calcium current (ICaL) was recorded with a whole-cell configuration of the Patch-Clamp technique in voltage-clamp mode, filtered at 2 kHz. AxoPatch 200B amplifier and analog-to-digital converter Digidata 1322A (Molecular Devices, California, USA) were used to acquire ICaL recorded with Clampex 9.2 Software (Molecular Devices). Borosilicate patch pipettes were pulled with P-97 puller (Sutter Instruments, California, USA) to a final resistance of 2.5-3.5 MΩ. The pipette was filled with (in mmol/L): 135 CsCl, 1 MgCl2, 4 Na2ATP, 5 EGTA, 10 HEPES (pH 7.2 with CsOH). Isolated rat ventricular myocytes were placed in a perfusion chamber and perfused at flow rate of 1 ml/min with bath solution (HEPES Buffer) contained (in mmol/L): 5 CsCl, 122 NaCl, 1 MgCl2, 1 CaCl2, 10 tetraethylammonium chloride, 5 4-aminopyridine, 5 glucose, 10 HEPES (pH 7.4 with NaOH). For ICaL recordings the following voltage protocol was applied: cardiomyocytes were depolarized from a holding potential of -80 to -40 mV for 200 msec to inactivate sodium current, and then to different test potentials ranging from -50 to +70 mV in 10 mV increments for 500 msec, delivered at 0.1 Hz. To obtain IV curves, the steady state current was subtracted from the peak inward current corresponding to each test pulse. The peak inward current was normalized to cell capacitance (pA/pF). The patch clamp data was processed and analyzed with ClampFit 10.3 (Molecular Device).
Nitric Oxide Production
Cardiac myocytes were loaded with 5 μmol/L DAF-FM diacetate (Thermo Fisher Scientific) for 30 minutes at room temperature and imaged by epifluorescence on a Zeis 410 inverted confocal microscope (LSM Tech, Pennsylvania, USA). Excitation at 488 nm was provided by an argon laser and emission was collected in a range of 500-550 nm. Photographs were taken every 30 seconds for 25 minutes. Image J software was used for the analysis. Results were expressed as a percentage of time zero and slope fitted with linear regression. Slopes were normalized using the difference between treated and control conditions.
Treatments
All experiments were performed at room temperature (20-25ºC) and with bath solution with or without: 0.01 % DMSO (Sigma, solvent for all reagents); 10 nM E2 (Invitrogen); 1 µM G1 (GPER agonist, Cayman Chemicals), 1 µM G36 (GPER antagonist, Cayman Chemicals), 100 nM Wortmannin (Invitrogen) or 100 nM L-NAME (Sigma) for 15 minutes after stabilization with the corresponding control solution for each set of experiments.
Statistics
GraphPad Prism 8 (GraphPad, California, USA) was used for all the statistics analysis. Data were expressed as means ± SEM. The Shapiro-Wilk test was used to test normality. Data were compared with paired Student t-test or paired t-test with Wilcoxon test if variances could not be assumed to be equal. When more than 2 groups were evaluated, 1-way ANOVA with the adequate post-test was performed to every particular situation. A value of P<0.05 was considered statistically significant.
Author Contributions
Conceptualization, E. A. A.; Methodology, L. A. D. Z., M. S. E., A. M. I., M. E. R. and L. E. P.; Validation, L. A. D. Z., M. S. E., V. C. DG and E. A. A.; Formal Analysis, L. A. D. Z. and M. S. E.; Investigation, L. A. D. Z., M. S. E. and E. A. A.; Writing—Original Draft Preparation, L. A. D. Z. and M. S. E.; Writing—Review and Editing, V. C. DG and E. A. A.; Supervision, V. C. DG and E. A. A.; Funding Acquisition, E. A. A. L. A. D. Z and M. S. E. authors contributed equally to this work in methodology (Patch-Clamp and IonOptix methodology) and formal analysis. All authors have read and agreed to the published version of the manuscript.
Figure 1.
E2 reduces cardiomyocyte contractility through GPER signaling. A and C. Representative traces of cardiac cell contraction in presence of E2 after ethanol or G36 plus E2 after G36 condition, respectively. Below, average traces of cell shortening at the end of each condition. B and D. Average data of sarcomere shortening for each condition. p < 0.05 indicated significantly different. N/n indicates animals and cells number, respectively.
Figure 2.
G1 reduces cardiomyocyte contractility through GPER signaling. A and C. Representative traces of cardiac cell contraction in presence of G1 after DMSO or G36 plus G1 after G36 condition, respectively. Below, average traces of cell shortening at the end of each condition. B and D. Average data of sarcomere shortening for each condition. p < 0.05 indicated significantly different. N/n indicates animals and cells number, respectively.
Figure 3.
Activation of GPER with E2 or G1 decrease calcium transient in isolated cardiomyocytes, without changing SR calcium content. A to D. Representative traces of calcium transient measured with Fura-2 in presence of E2, G36 plus E2, G1 or G36 plus G1, respectively, after each control condition (left). Right panels, representative average data of calcium transients for of all the treatment applied. E. Representative caffeine pulse induced-calcium transient (left) in presence of DMSO (up) or G1 (down) condition. Right. Representative average data of caffeine pulse induced-calcium transients. p < 0.05 indicates significantly different. N/n indicates animals and cells number, respectively.
Figure 4.
Activation of GPER with E2 decrease L-type calcium current in cardiomyocytes. A and B. Top, Voltage protocol and average traces of calcium current at 0 mV in presence of E2 after ethanol or G36 plus E2 after G36 condition, respectively. Down, average data of calcium current at 0 mV and linked dot blot (inset) of each condition. C. IV plot of L-type calcium current with ethanol or E2 treatment, and voltage protocol (inset). p < 0.05 indicates significantly different. N/n indicates animals and cells number, respectively.
Figure 5.
Activation of GPER with G1 decrease L-type calcium current in cardiomyocytes. A and B. Top, Voltage protocol and average traces of calcium current at 0 mV in presence of G1 after DMSO or G36 plus G1 after G36 condition, respectively. Down, average data of calcium current at 0 mV and linked dot blot (inset) of each condition. C. IV plot of L-type calcium current with DMSO or G1 treatment, and voltage protocol (inset). p < 0.05 indicates significantly different. N/n indicates animals and cells number, respectively.
Figure 6.
PI3K and NOS are involved in the GPER-triggered intracellular pathway. A and B. Average data of sarcomere shortening (left) and calcium transient (right) of cell treatment with wortmannin (PI3K blocker) or L-Name (NOS blocker) before exposing the cells to G1. C and D. Average traces (left) and average data (right) of calcium current of cell treated with wortmannin (PI3K blocker) or L-Name (NOS blocker) before exposing the cells to G1. p < 0.05 indicates significantly different. N/n indicates animals and cells number, respectively.
Figure 7.
GPER increases NO production activating PI3K before NOS activation. A. DAF-FM fluorescence respect to initial fluorescence of cells treated with G1 or wortmannin plus G1 after control condition (DMSO or wortmannin, respectively). B. Average slope of G1 or wortmannin plus G1. p < 0.05 indicates significantly different. N/n indicates animals and cells number, respectively. Since these values do not follow a normal distribution, Mann-Whitney test analysis was performed.
Figure 8.
Schematic summary of the molecular events proposed to underlie GPER activation. Briefly, GPER activation with E2 or G1 activates PI3K, which stimulates NOS, possibly, through AKT pathway, and then increases myocardial NO production. NO would be responsible for L-type calcium current inhibition that impact on calcium transient and, therefore, cell shortening. E2, estradiol; G1, agonist of GPER; GPER, G-protein coupled estrogen receptor; PI3K, phosphoinositide 3-kinase; AKT, protein kinase B; NOS, nitric oxide synthase; NO, nitric oxide; Wort, wortmannin, L-Name, NOS blocker; CaL, L-type calcium channel.
