Submitted:
19 May 2024
Posted:
20 May 2024
You are already at the latest version
Abstract

Keywords:
1. Introduction
2. Results
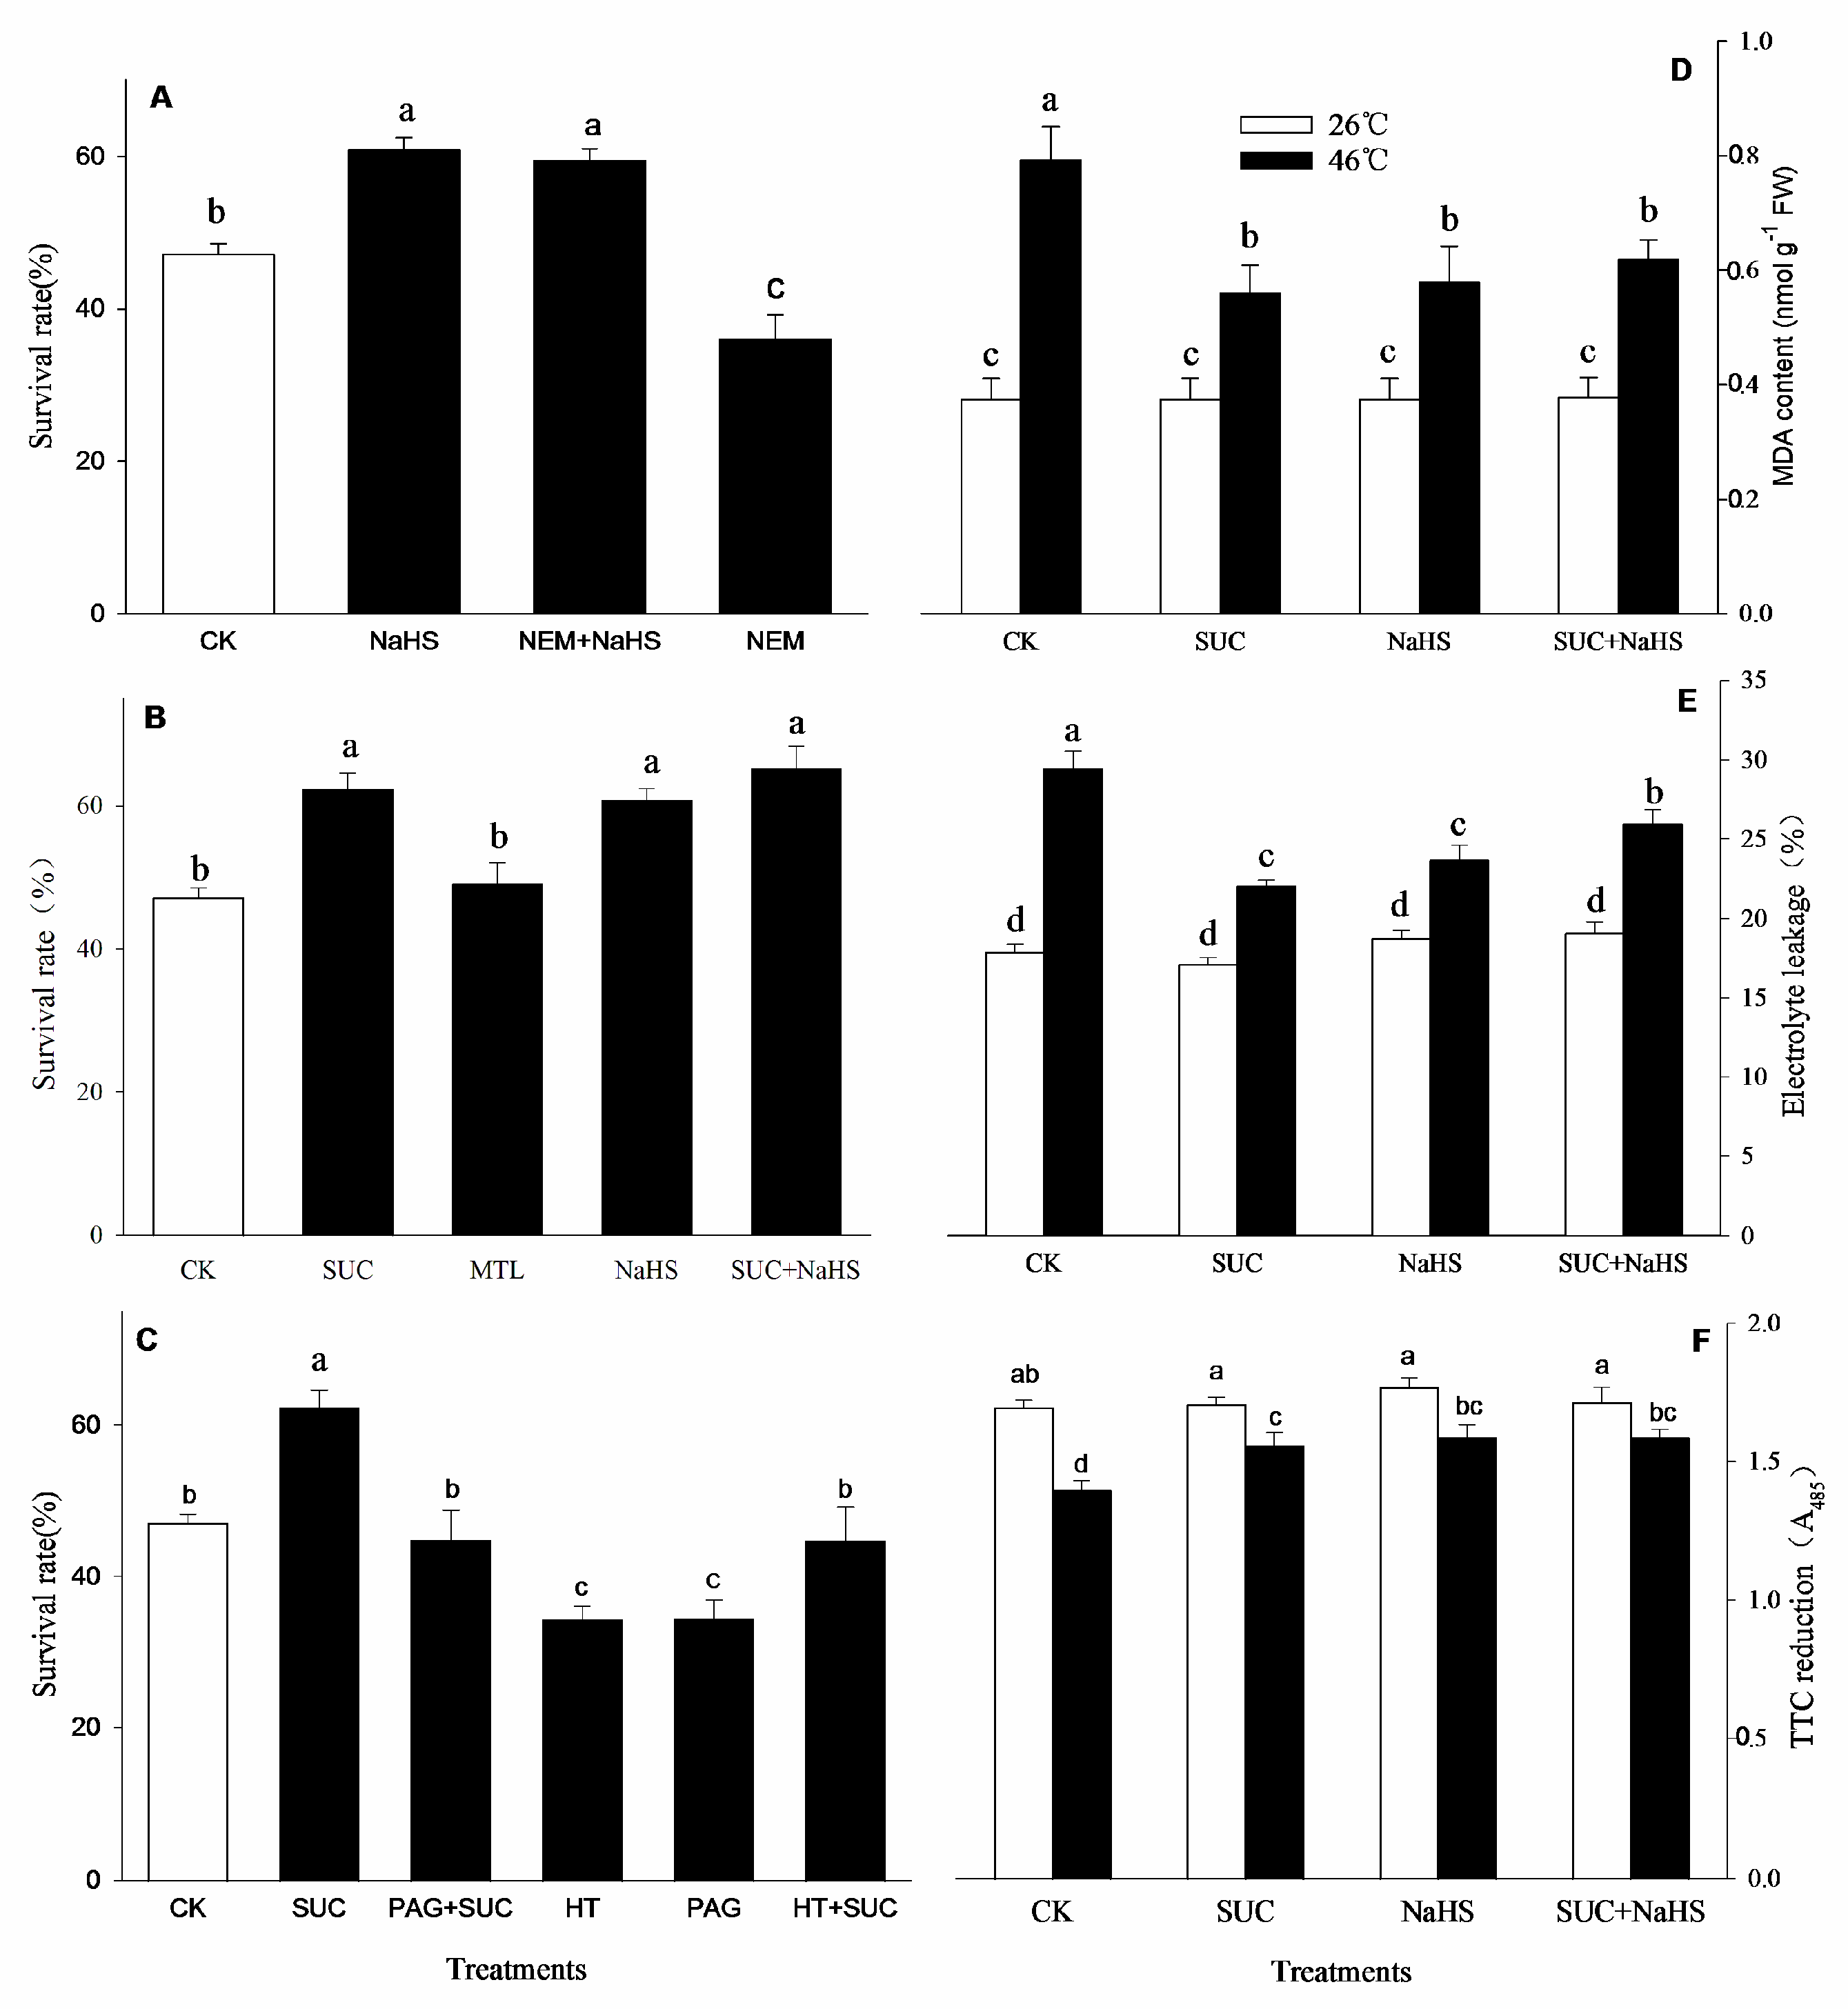
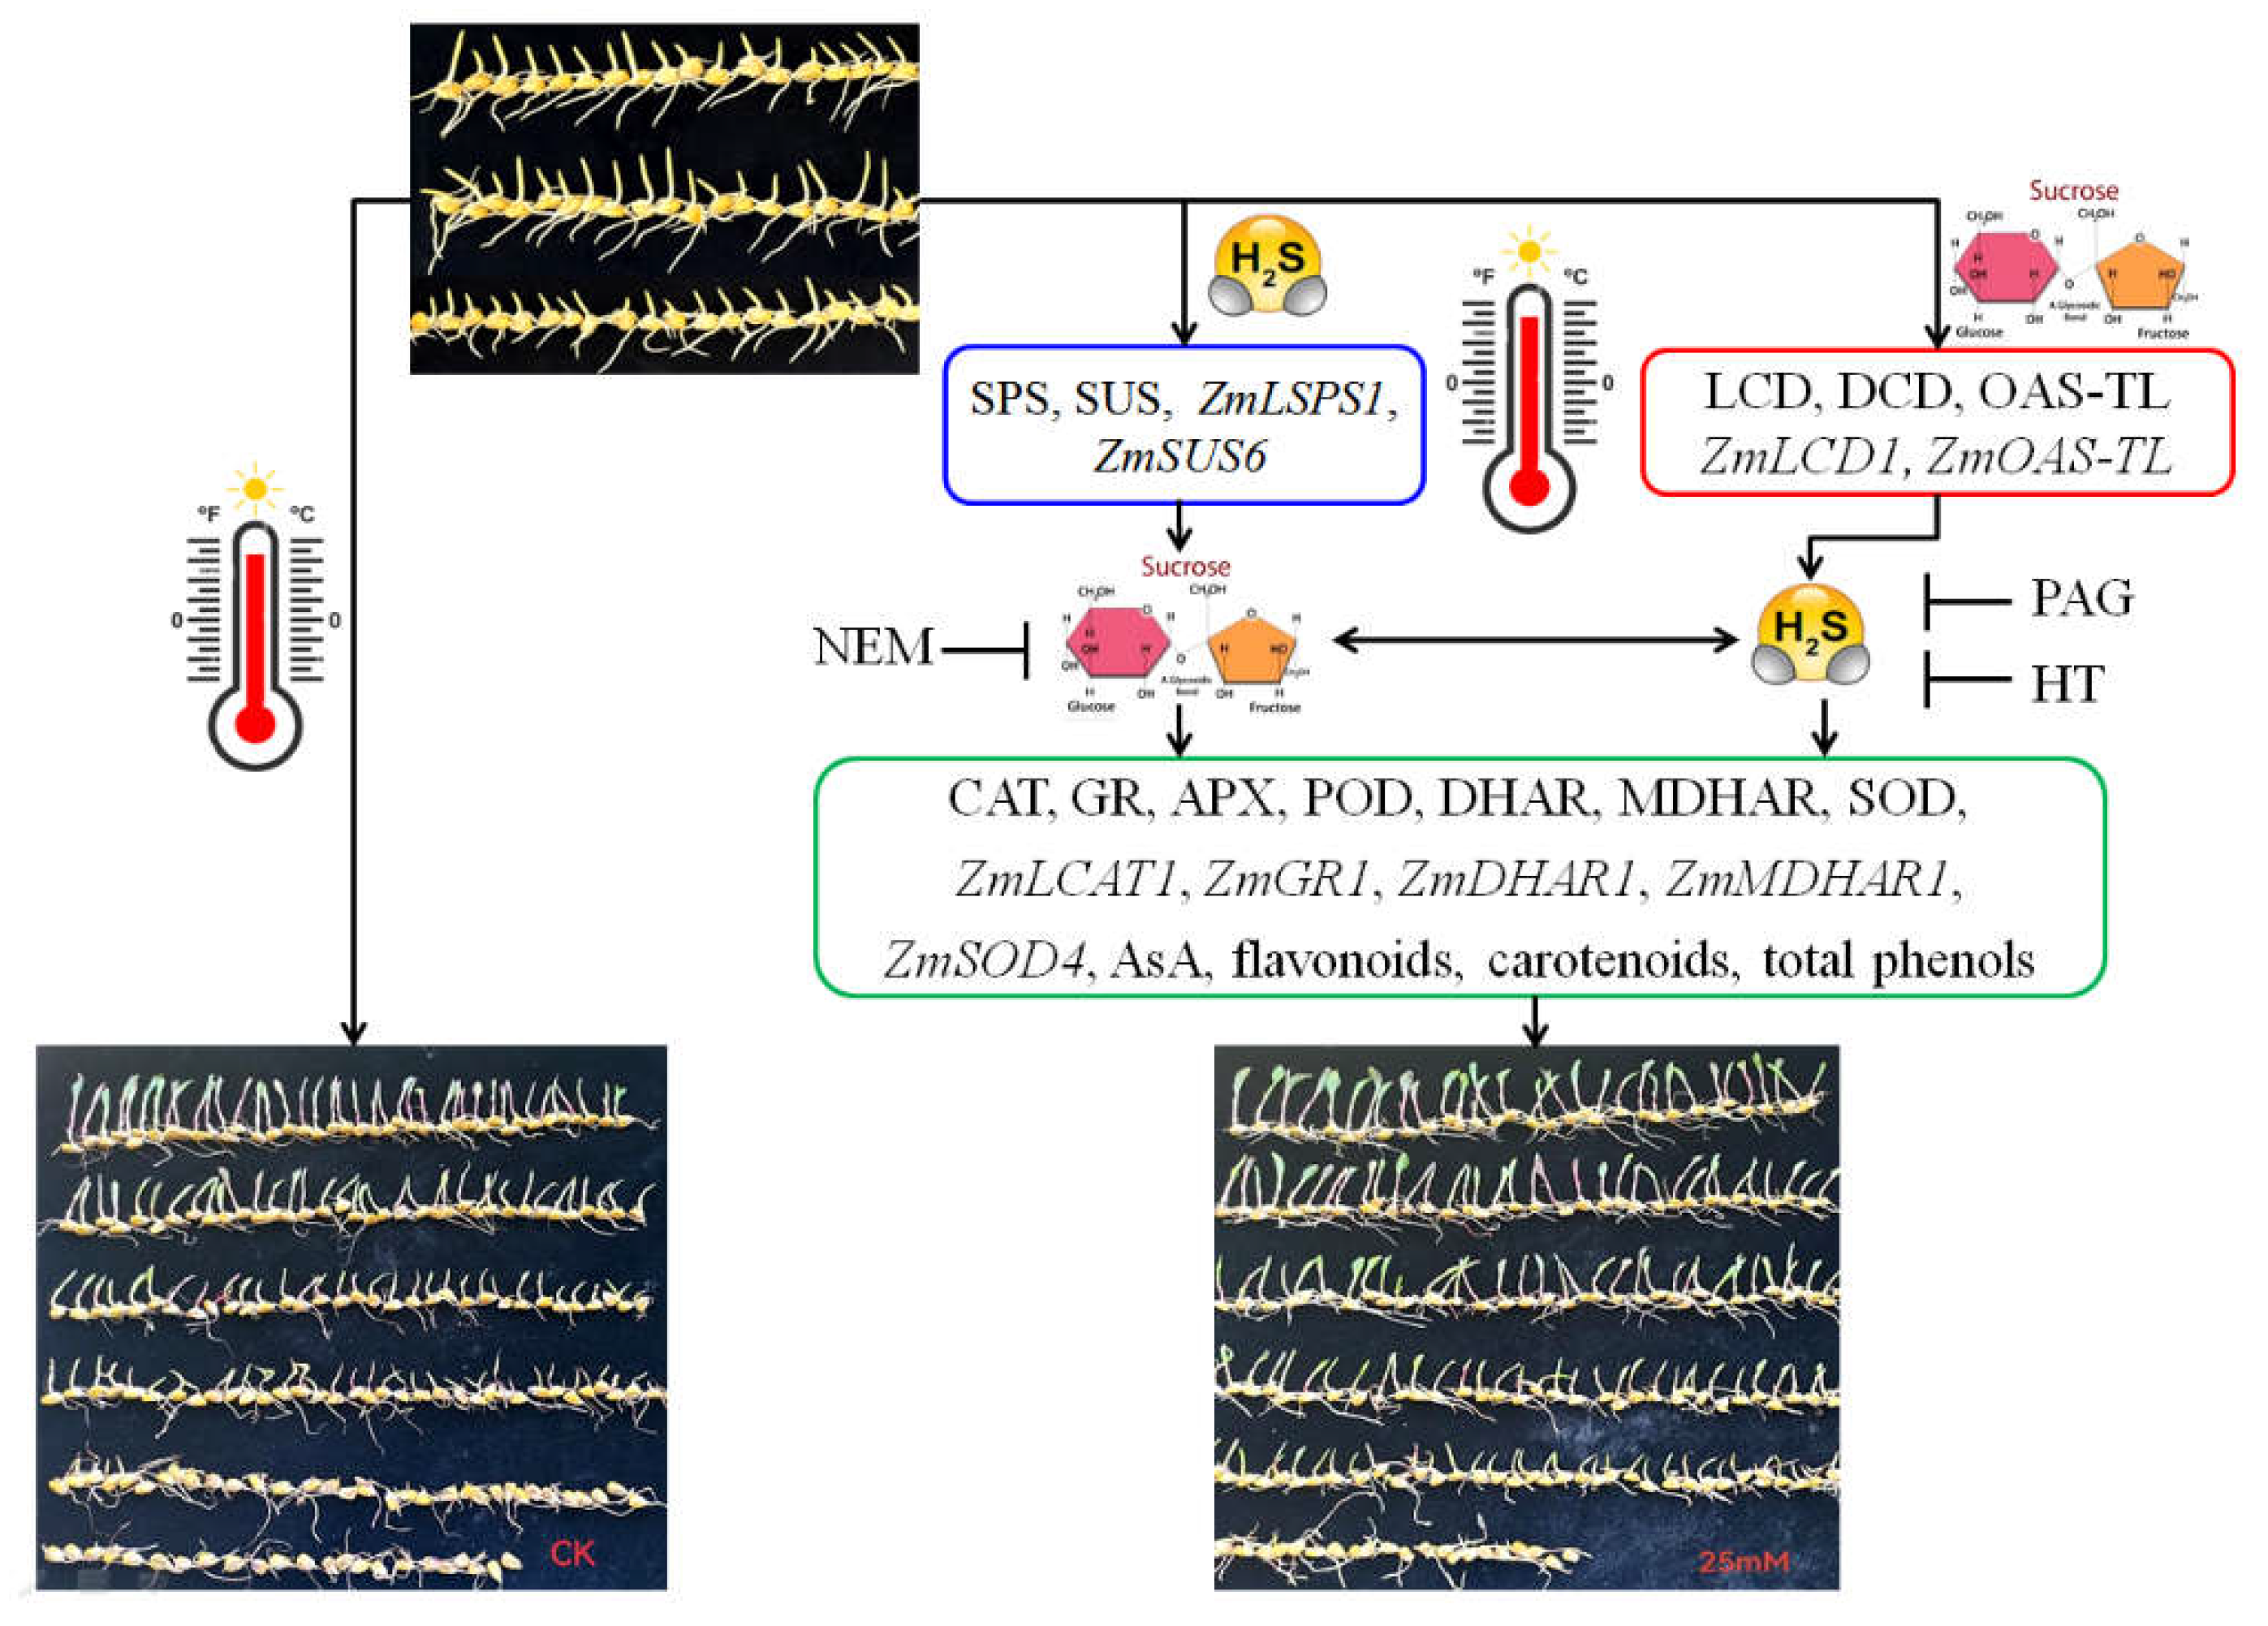
2.1. H2S and SUC Upraises Thermotolerance
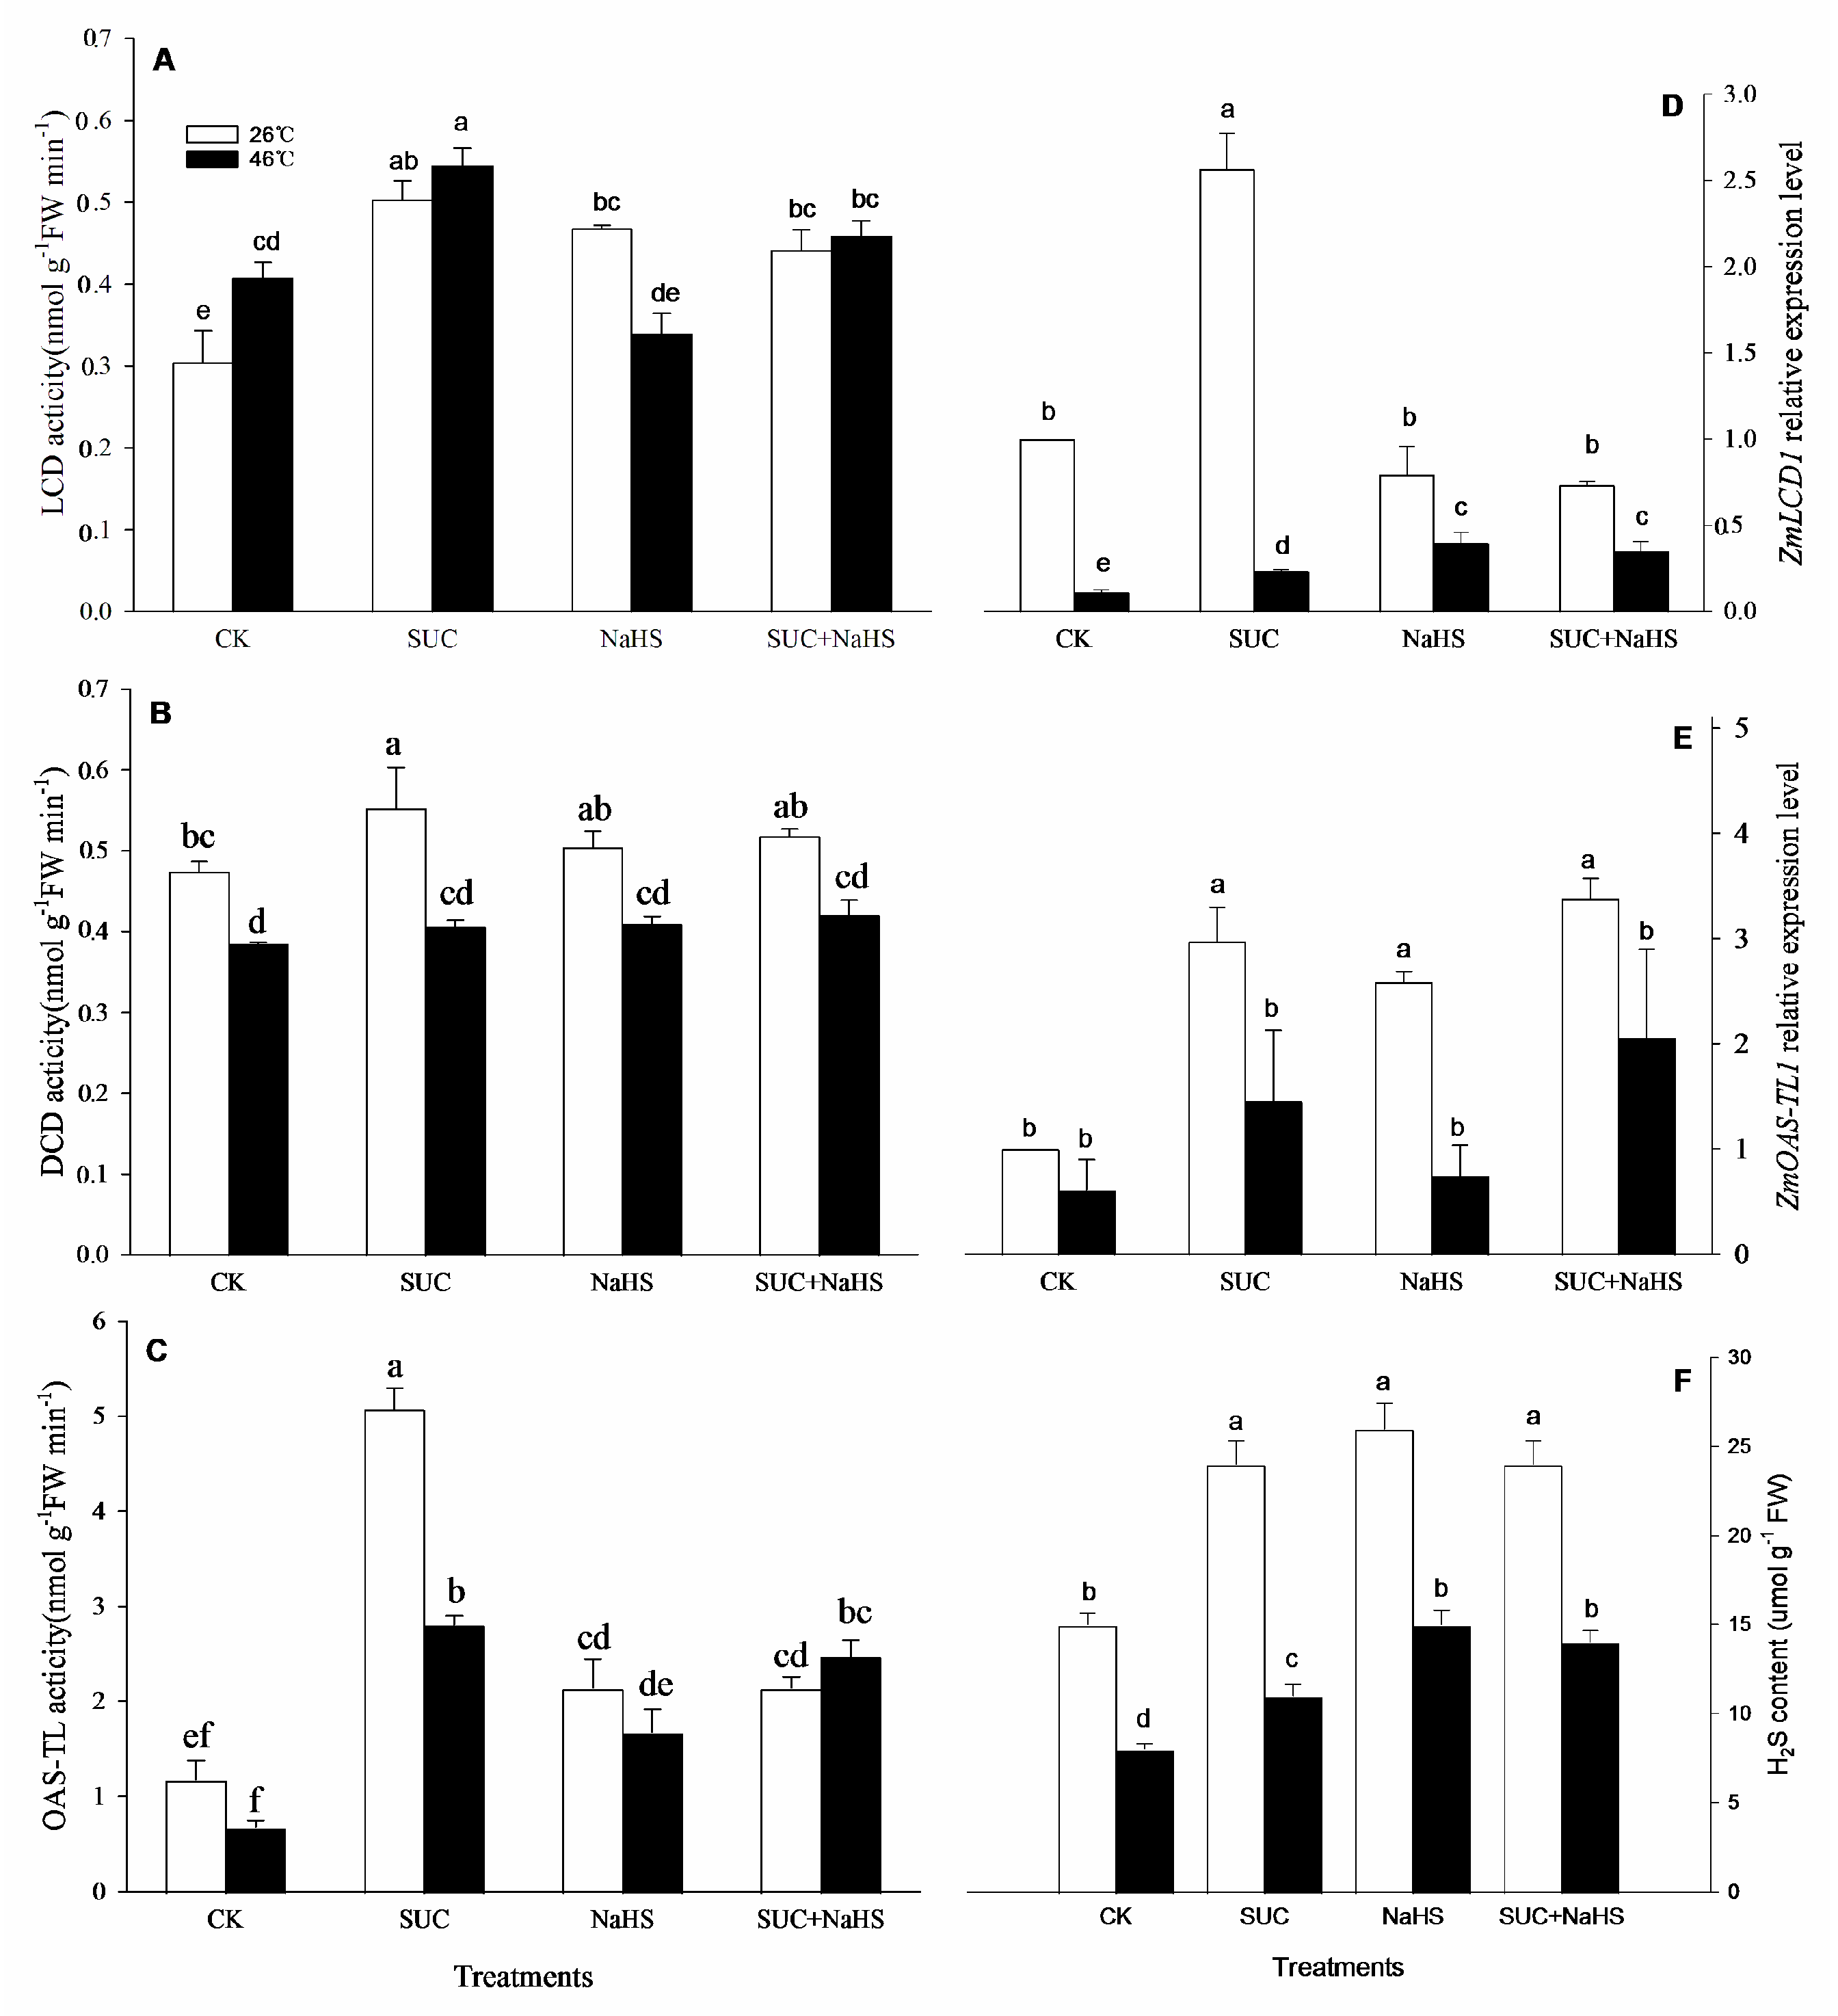
2.2. SUC Upraises H2S Level
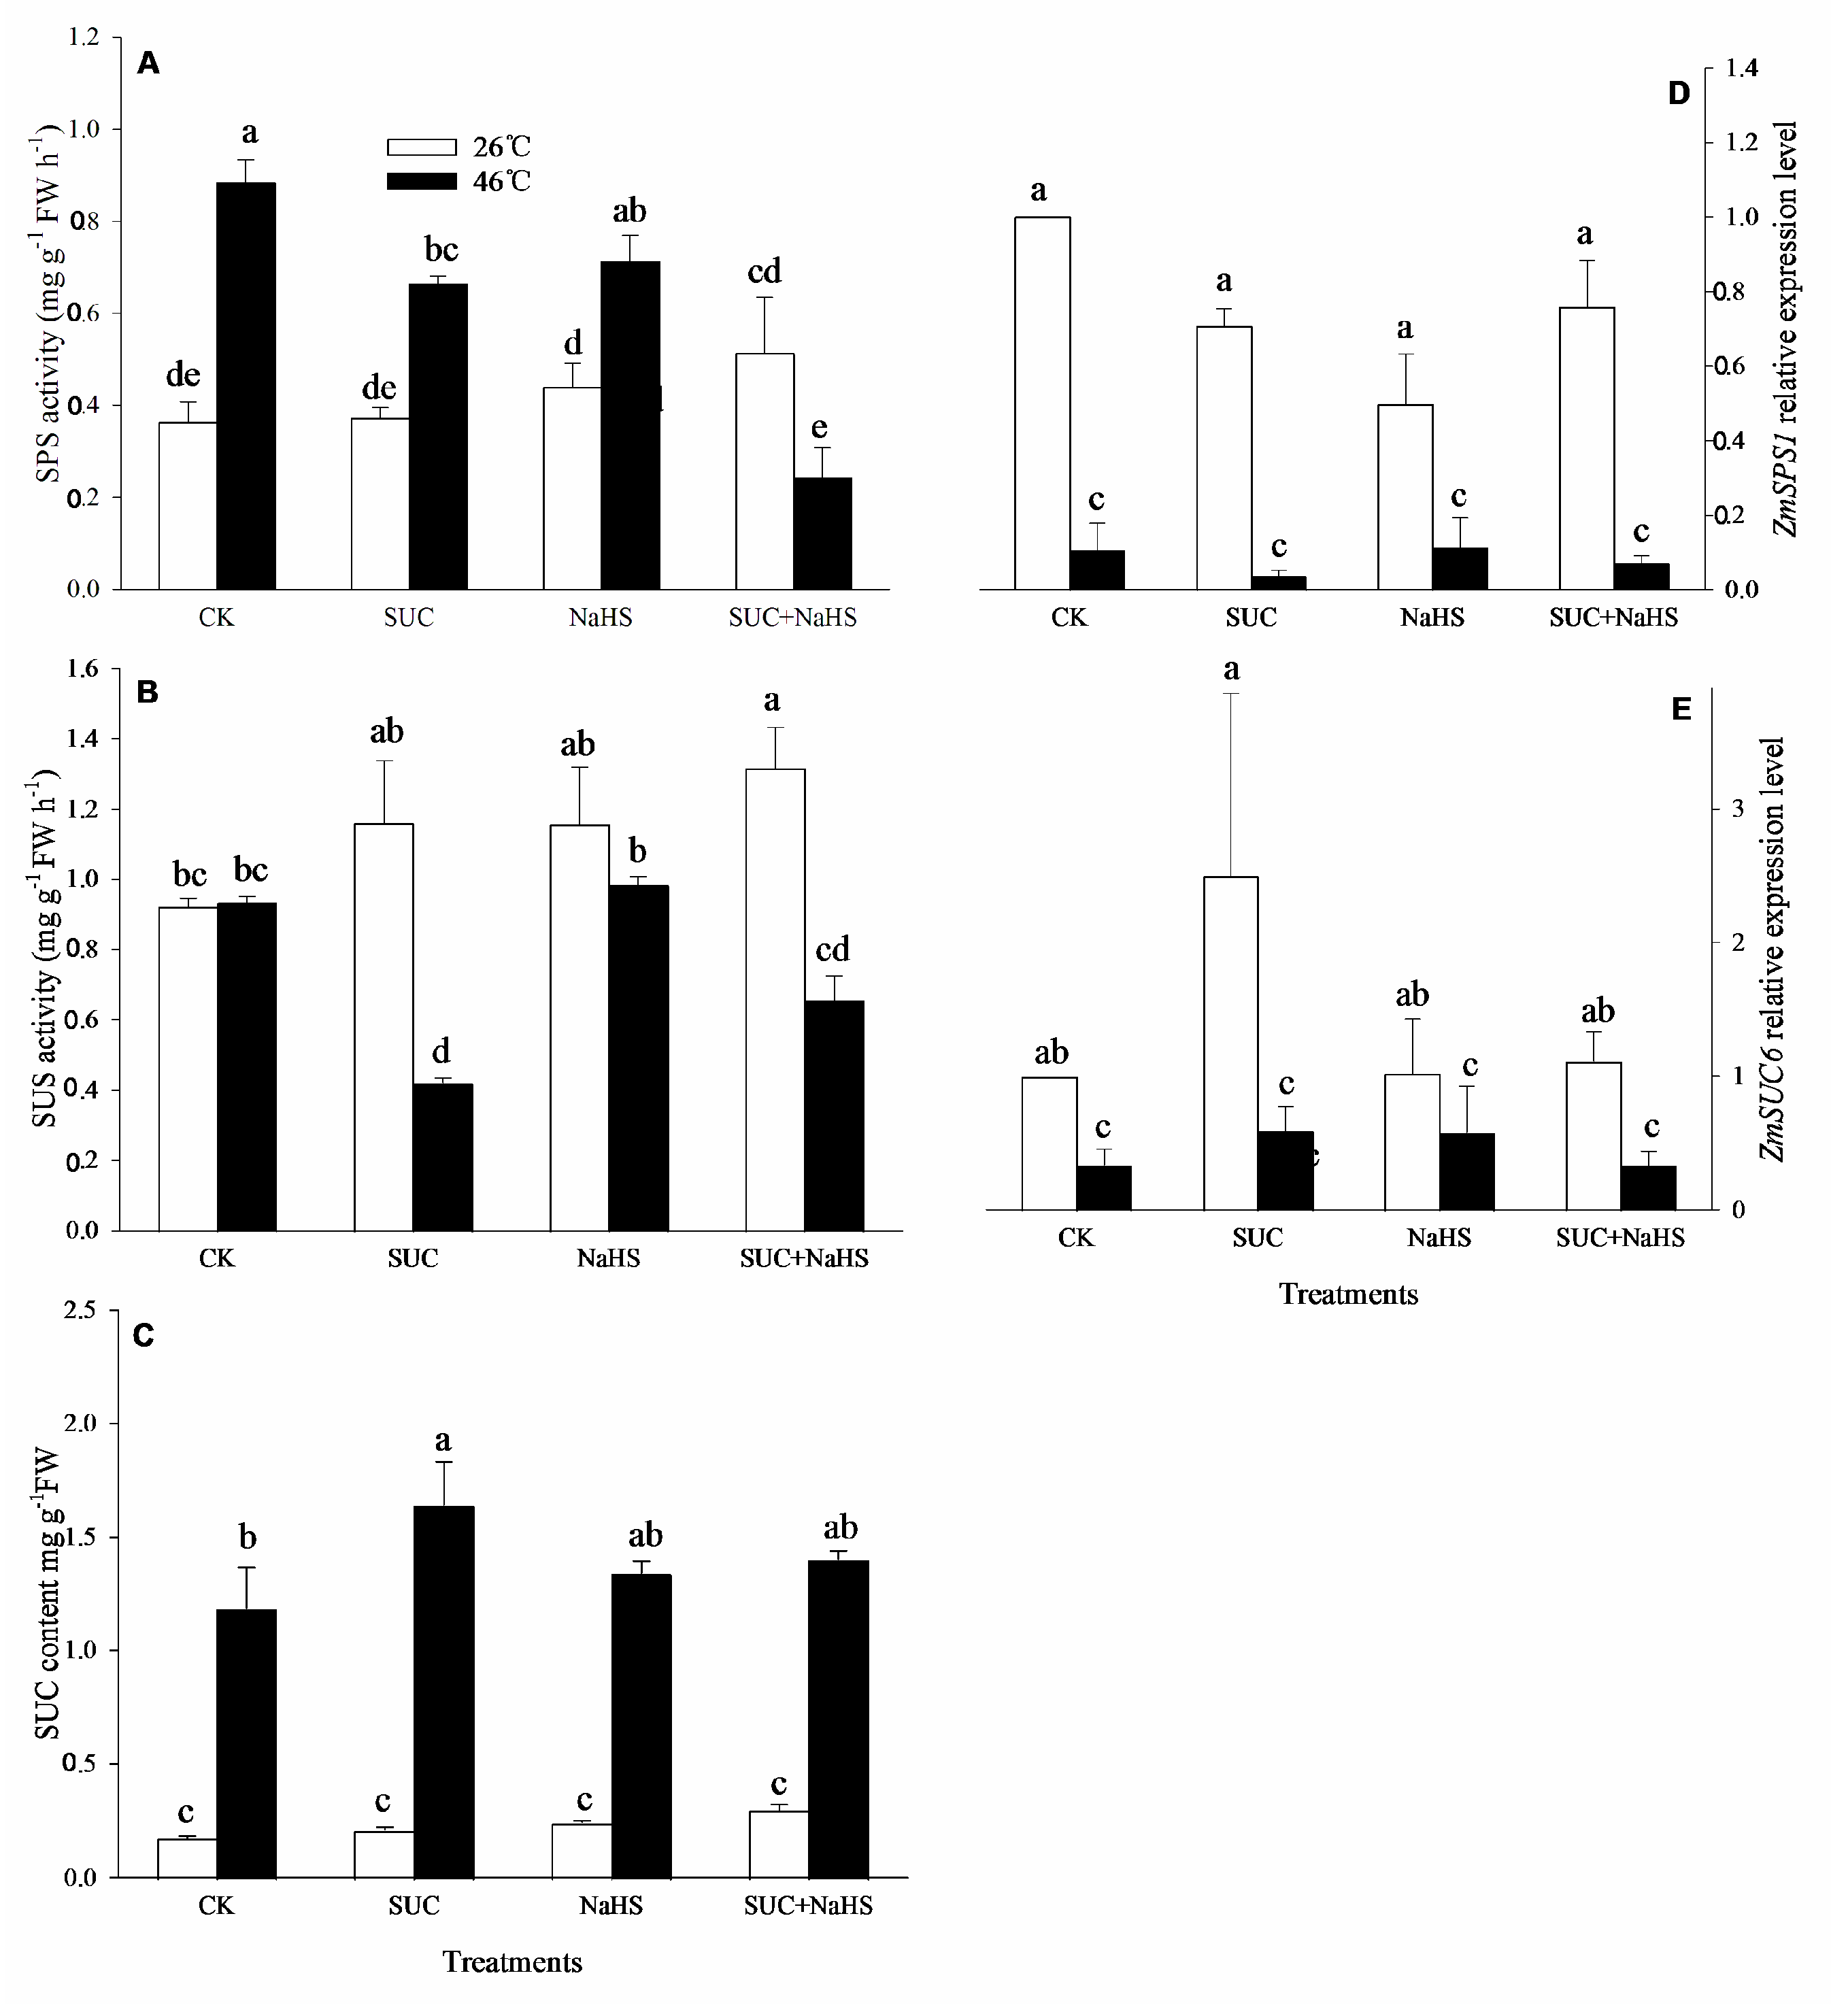
2.3. H2S Modulates SUC Level
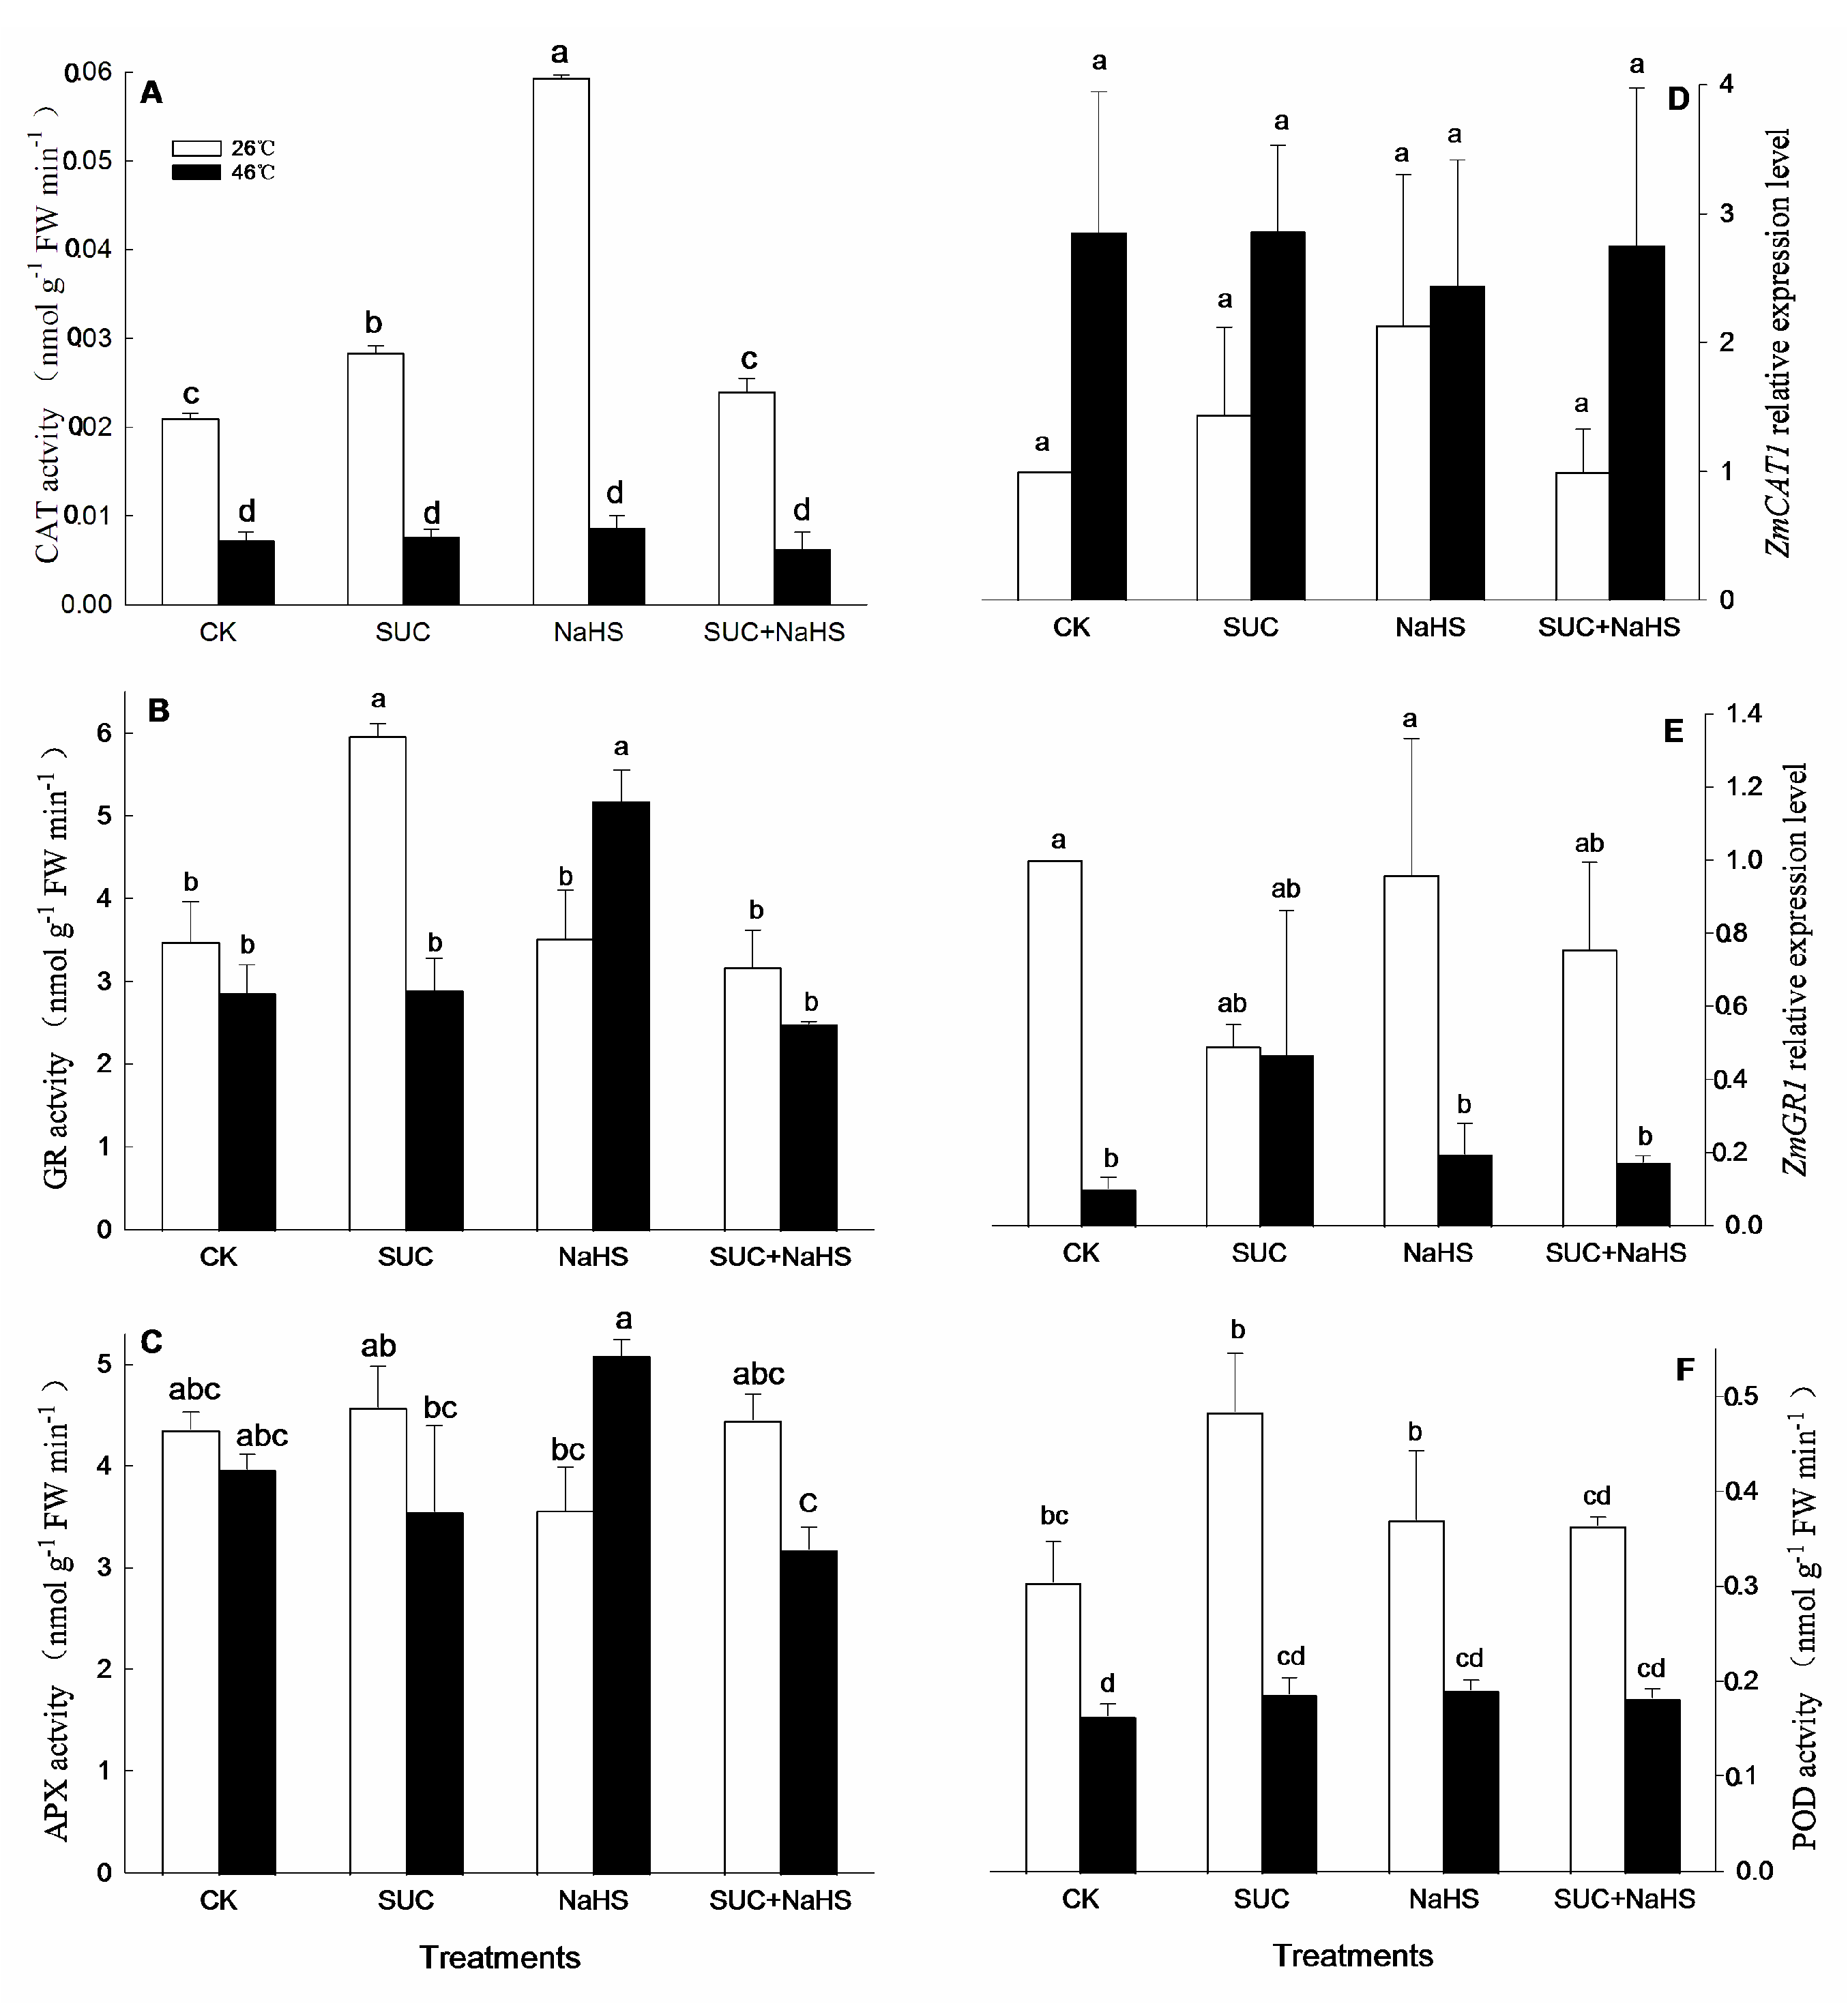
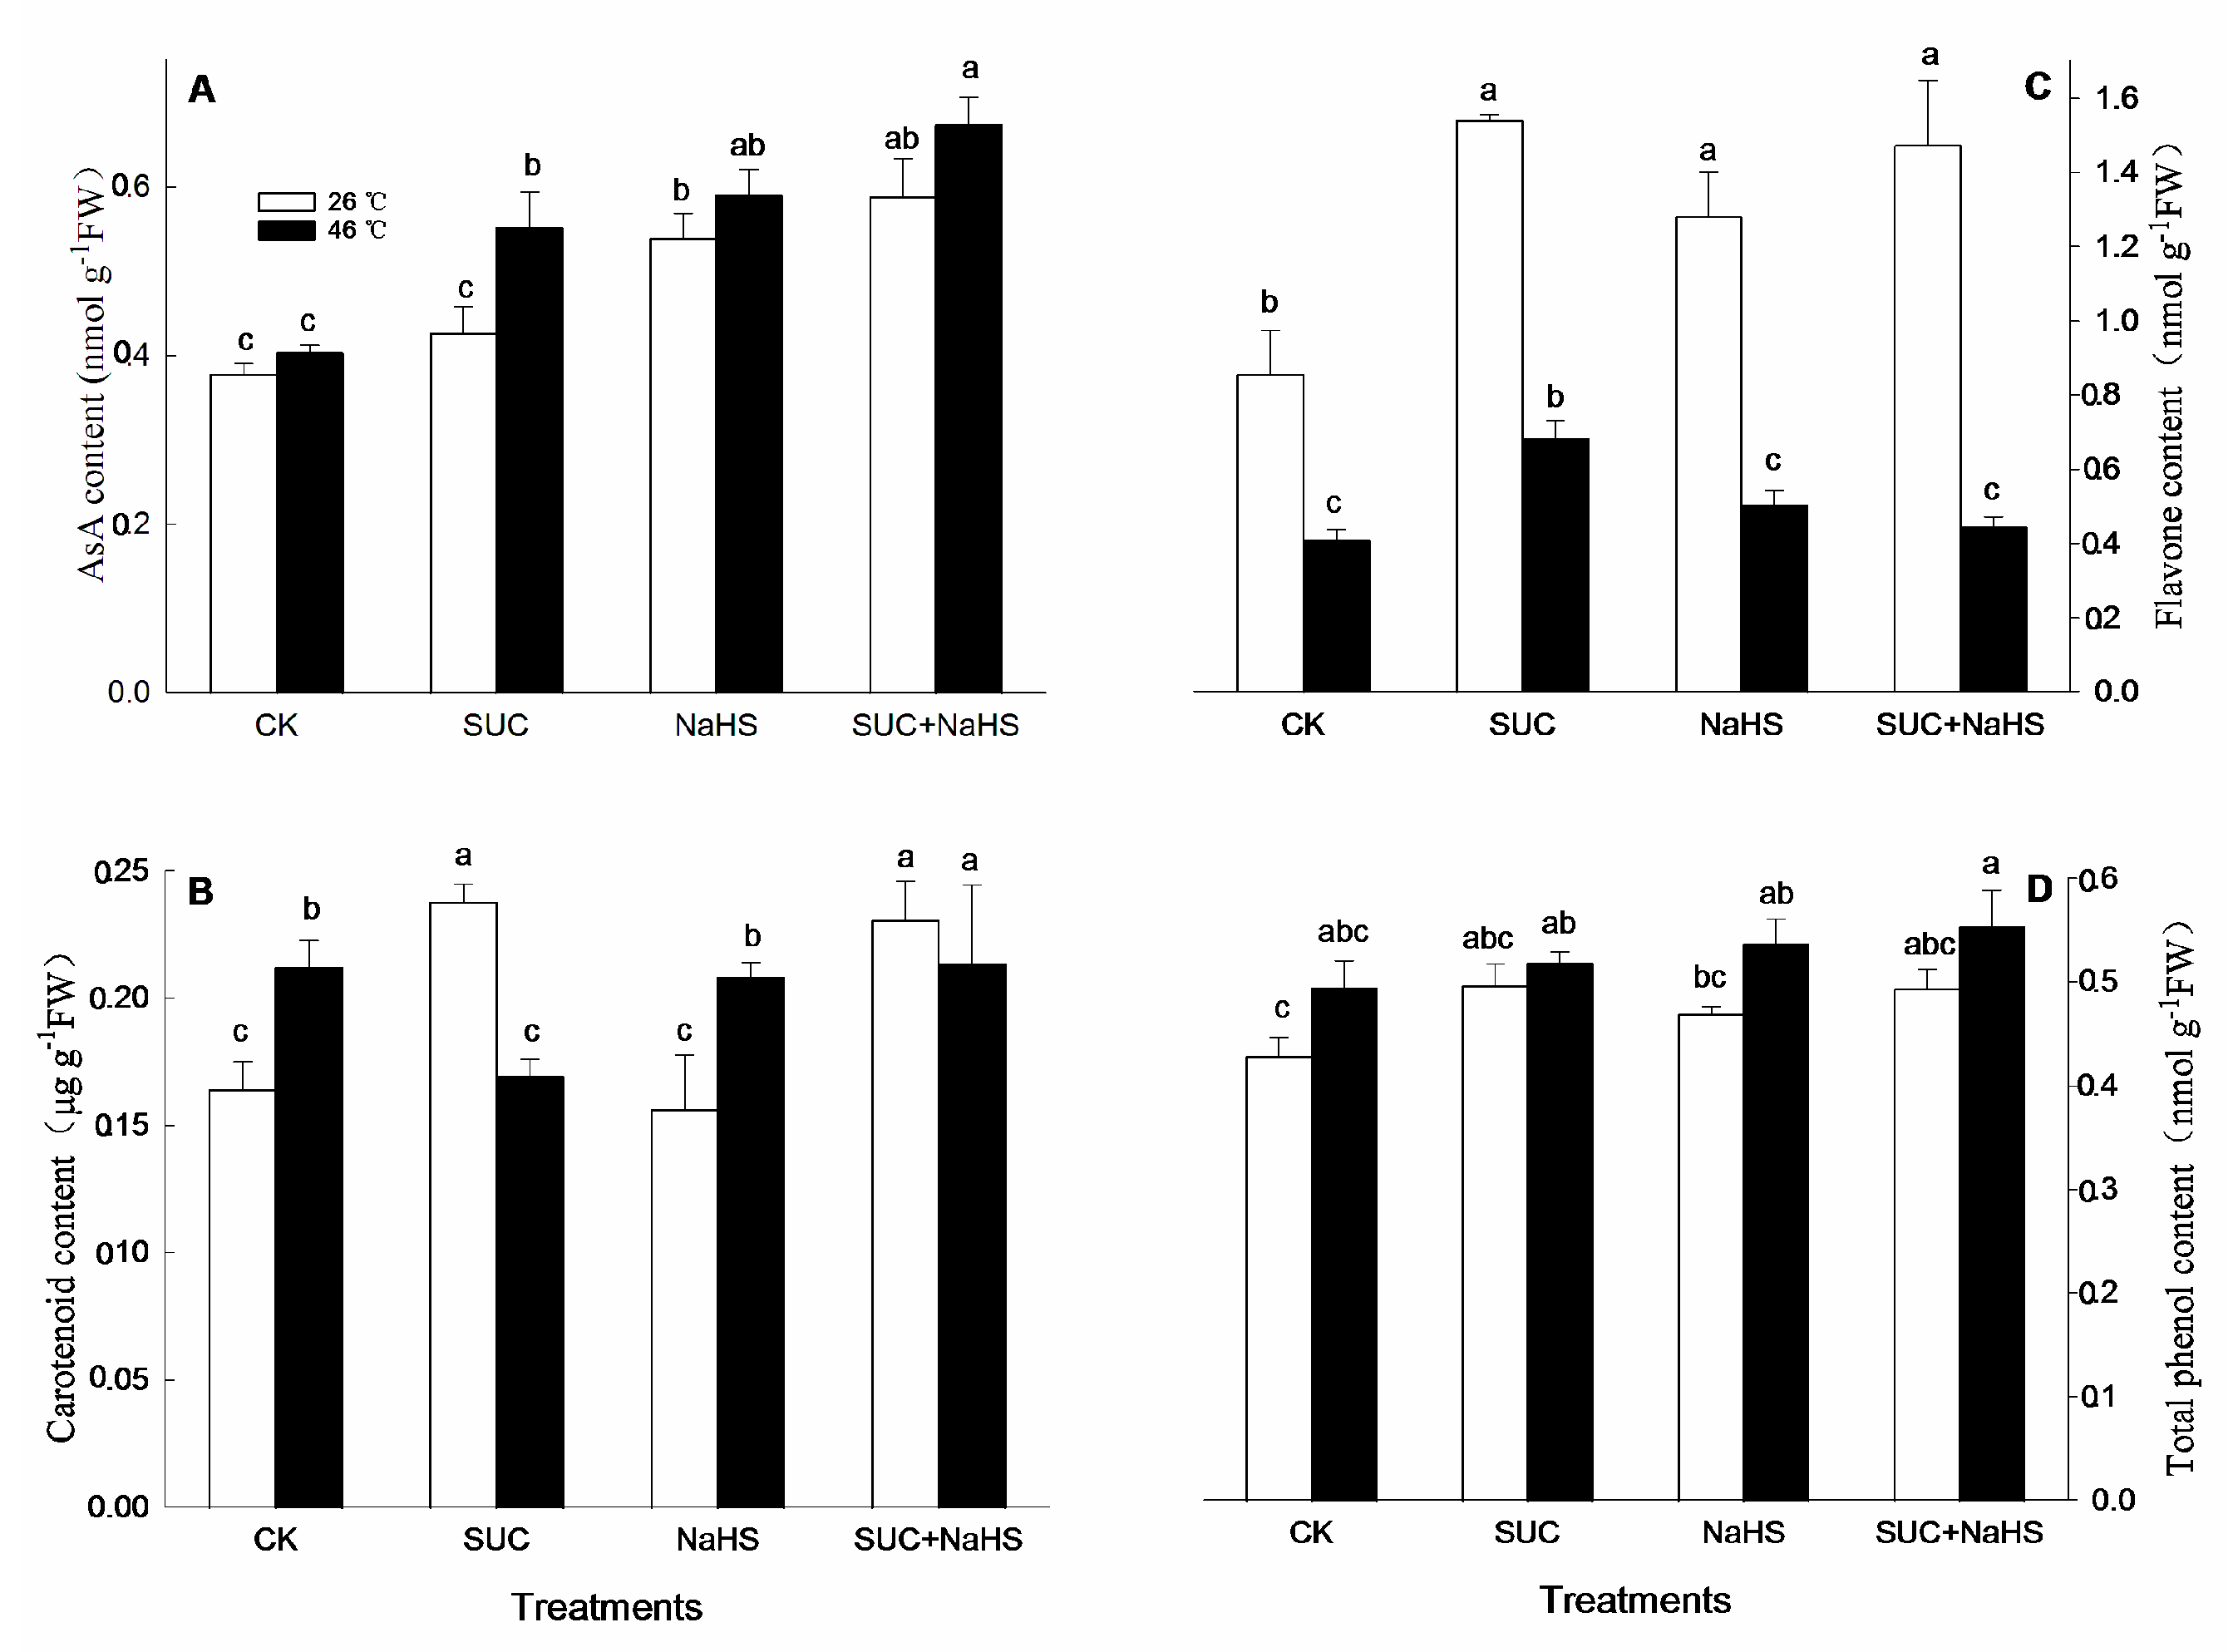
2.4. H2S-SUC Interaction Enhances Antioxidant Capacity
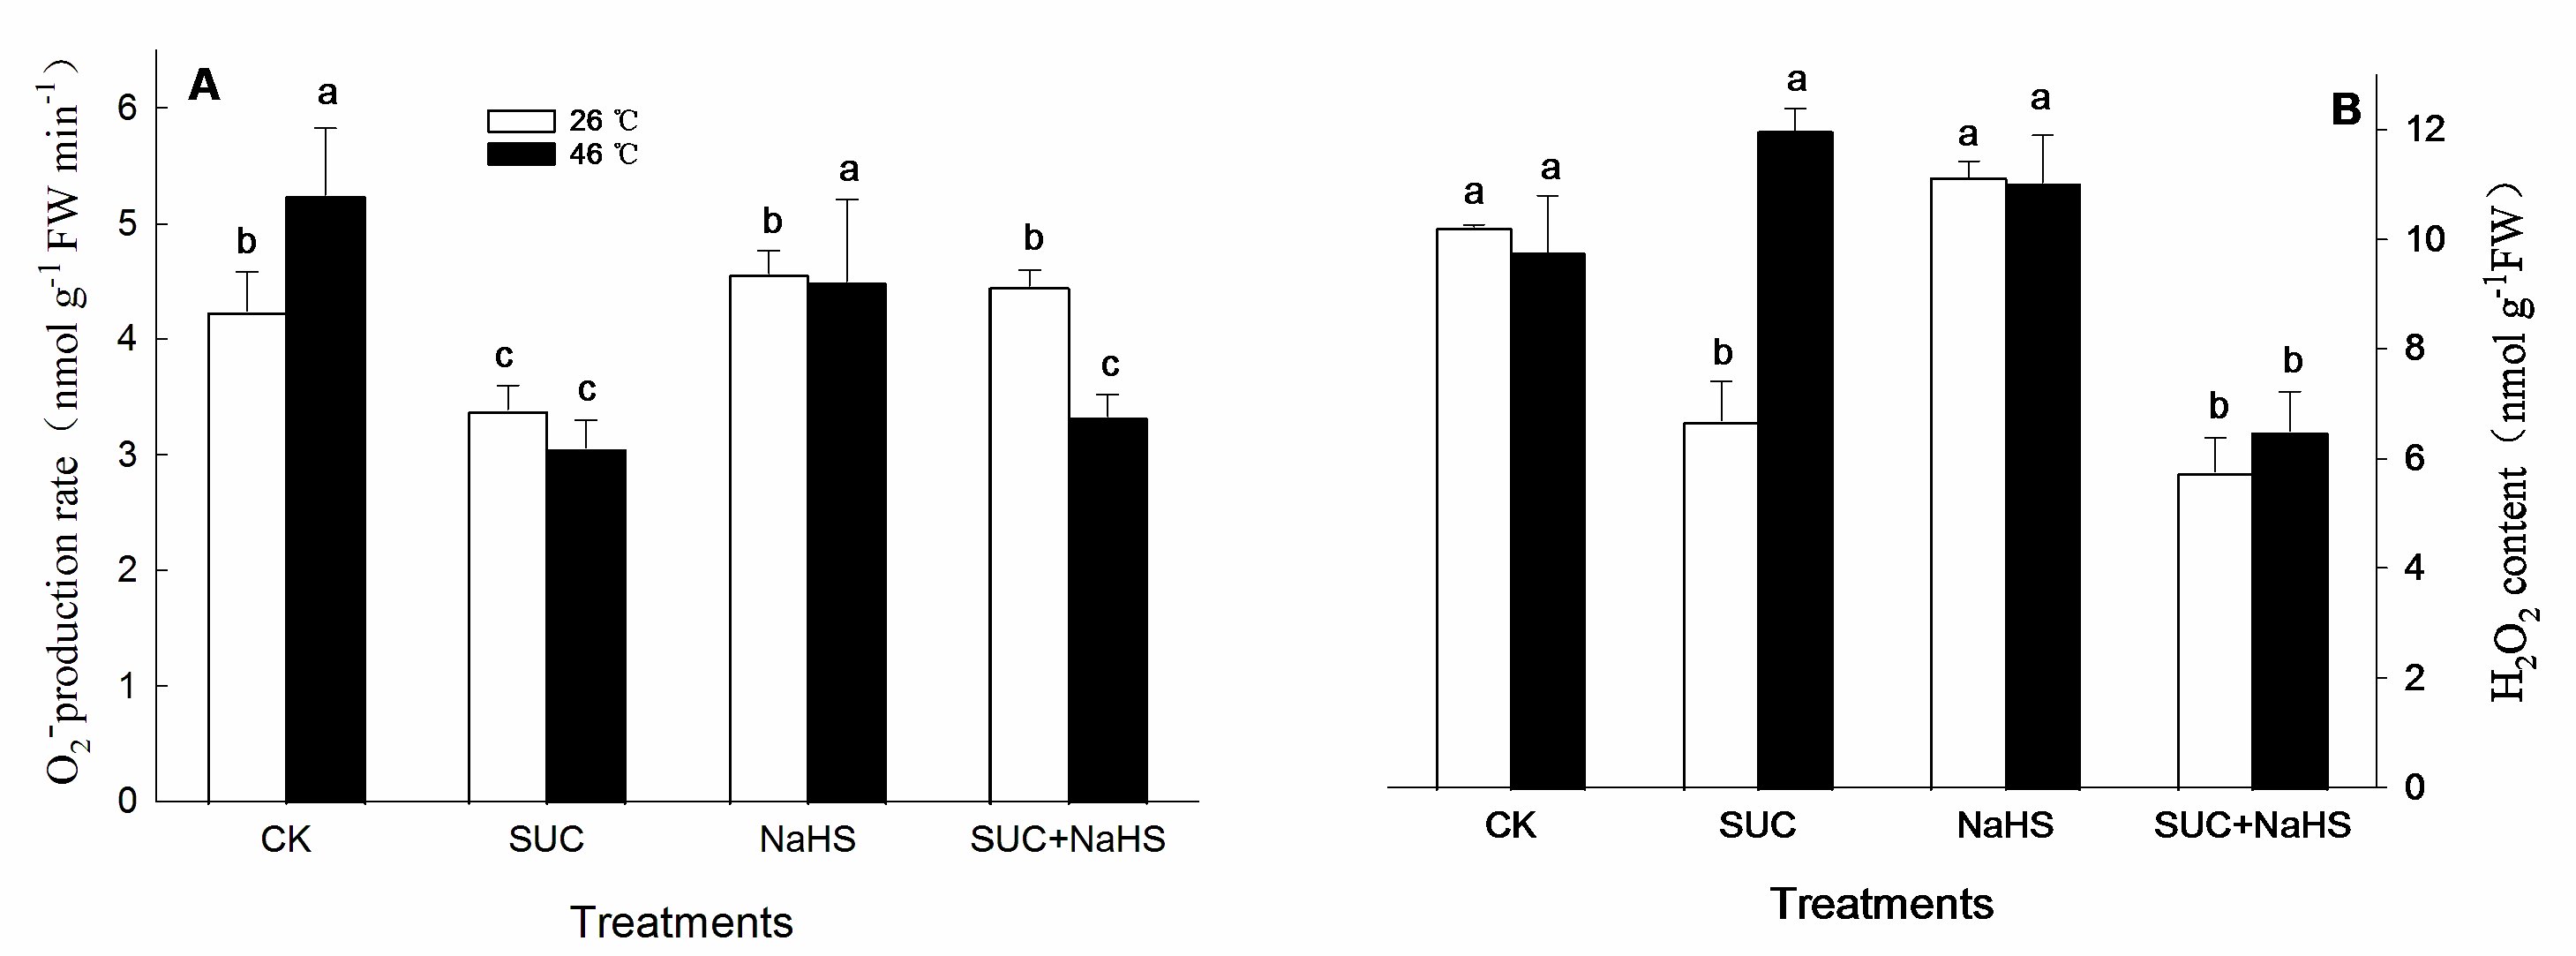
2.5. H2S-SUC Interaction Regulates ROS Level
3. Discussion
4. Materials and Methods
4.1. Seed Germination and Seedling Treatment
4.2. Estimation of Thermotolerance Indexes
4.3. Measurement of Metabolizing Enzymes and Endogenous Content of H2S
4.4. Analysis of Metabolizing Enzymes and Endogenous Content of SUC
4.5. Evaluation of Antioxidant Capacity
4.6. Assay for ROS
4.7. Statistical Analysis
5. Conclusions
Supplementary Materials
Author Contributions
Funding
Informed Consent Statement
Data Availability Statement
Data Availability Statement
Conflicts of Interest
References
- Choudhary, A.; Kumar, A.; Kaur, N.; Kaur, H. Molecular cues of sugar signaling in plants. Physiol. Plant. 2022, 174, e13630. [Google Scholar] [CrossRef] [PubMed]
- Li, Z. G.; Fang, J. R.; Bai, S. J. Hydrogen sulfide signaling in plant response to temperature stress. Front. Plant Sci. 2024, 15, 1337250. [Google Scholar] [CrossRef] [PubMed]
- Lee, Z.; Lim, J.; Harikrishna, J.; Islam, T.; Rahim, M. H. A.; Yaacob, J. S. Regulation of plant responses to temperature stress: A key factor in food security and for mitigating effects of climate change. Int. J. Plant Prod. 2024, 18. In press. [Google Scholar] [CrossRef]
- Yi, B.; Liu, Y.; Wu, Z.; Zheng, Y.; Chen, H.; Jin, P. Hydrogen sulfide alleviates chilling injury of zucchini fruit by regulating antioxidant capacity, endogenous hydrogen sulfide, proline, and polyamine metabolism. Postharv. Biol. Technol. 2024, 208, 112638. [Google Scholar] [CrossRef]
- Alvi, A. F.; Khan, S.; Khan, N. A. Hydrogen sulfide and ethylene regulate sulfur-mediated stomatal and photosynthetic responses and heat stress acclimation in rice. Plant Physiol. Biochem. 2024, 207, 108437. [Google Scholar] [CrossRef] [PubMed]
- Corpas, F. J.; Muñoz-Vargas, M. A.; González-Gordo, S.; Rodríguez-Ruiz, M.; Palma, J. M. Nitric oxide (NO) and hydrogen Sulfide (H2S): New potential biotechnological tools for postharvest storage of horticultural crops. J. Plant Growth Regul. 2024, 43. In press. [Google Scholar] [CrossRef]
- Wang, J. Q.; Xiang, R. H.; Li, Z. G. The essential role of H2S-ABA crosstalk in maize thermotolerance through the ROS-scavenging system. Int. J. Mol. Sci. 2023, 24, 12264. [Google Scholar] [CrossRef] [PubMed]
- Ye, X. Y.; Qiu, X. M.; Sun, Y. Y.; Li, Z. G. Interplay between hydrogen sulfide and methylglyoxal initiates thermotolerance in maize seedlings by modulating reactive oxidative species and osmolyte metabolism. Protoplasma 2020, 257, 1415–1432. [Google Scholar] [CrossRef] [PubMed]
- Hajibehzad, S. S.; Romanowski, A.; Pierik, R. Plant signaling: The sugar-coated story of root growth. Curr. Biol. 2023, 33, R805–R808. [Google Scholar] [CrossRef]
- Asad, M. A. U.; Yan, Z.; Zhou, L.; Guan, X.; Cheng, F. How abiotic stresses trigger sugar signaling to modulate leaf senescence? Plant Physiol. Biochem. 2024, 210, 108650. [Google Scholar] [CrossRef]
- Yamada, K.; Mine, A. Sugar coordinates plant defense signaling. Sci. Adv. 2024, 10, eadk4131. [Google Scholar] [CrossRef] [PubMed]
- Ahmad, I. Z. Role of sugars in abiotic stress signaling in plants. In: Khan, M. I. R.; Reddy, P. S.; Ferrante, A.; Khan, N. A (Eds.) Plant Signaling Molecules, Woodhead Publishing, 2019, pp. 207-217.
- Raza, A.; Bhardwaj, S.; Rahman, M. A.; García-Caparrós, P.; Habib, M.; Saeed, F.; Charagh, S.; Foyer, C. H.; Siddique, K. H. M.; Varshney, R. K. Trehalose: A sugar molecule involved in temperature stress management in plants. Crop J. 2024, 12, 1–16. [Google Scholar] [CrossRef]
- Zou, W.; Yu, Q.; Ma, Y.; Sun, G.; Feng, X.; Ge, L. Pivotal role of heterotrimeric G protein in the crosstalk between sugar signaling and abiotic stress response in plants. Plant Physiol. Biochem. 2024, 210, 108567. [Google Scholar] [CrossRef]
- Mishra, B. S.; Sharma, M.; Laxmi, A. Role of sugar and auxin crosstalk in plant growth and development. Physiol. Plant. 2022, 174, e13546. [Google Scholar] [CrossRef] [PubMed]
- Misra, V.; Mall, A. K.; Ansari, S. A.; Ansari, M. I. Sugar transporters, sugar-metabolizing enzymes, and their interaction with phytohormones in sugarcane. J. Plant Growth Regul. 2023, 42, 4975–4988. [Google Scholar] [CrossRef]
- Sharma, P.; Kapoor, N.; Dhiman, S.; Kour, J.; Singh, A. D.; Sharma, A.; Bhardwaj, R. Role of sugars in regulating physiological and molecular aspects of plants under abiotic stress. In: Sharma, A.; Pandey, S.; Bhardwaj, R.; Zheng, B.; Tripathi, D. K. (Eds.) The Role of Growth Regulators and Phytohormones in Overcoming Environmental Stress. Academic Press, 2023, pp.355-374.
- Chen, Q. Q. The effects of exogenous sucrose on tolerance in potato ender heat and chilling. Lanzhou University of Technology, 2017.
- Cisse, A. Role of sucrose in heat response in rice plants. Chinese Academy of Agricultural Sciences, 2020.
- Aroca, A.; Benito, J. M.; Gotor, C.; Romero, L. C. Persulfidation proteome reveals the regulation of protein function by hydrogen sulfide in diverse biological processes in Arabidopsis. J. Exp. Bot. 2017, 68, 4915–4927. [Google Scholar] [CrossRef] [PubMed]
- Li, Z.; Howell, S. H. Heat stress responses and thermotolerance in maize. Int. J. Mol. Sci. 2021, 22, 948. [Google Scholar] [CrossRef] [PubMed]
- Chandra, A. K.; Joshi, A.; Tripathi, A.; Kumar, A.; Pandey, S.; Singh, A.; Lal, D.; Bharati, A.; Adhikari, S.; Dinkar, V. Climate-resilience maize: Heat stress, signaling, and molecular interventions. J. Plant Growth. Regul. 2023, 42, 6349–6366. [Google Scholar] [CrossRef]
- Djalovic, I.; Kundu, S.; Bahuguna, R. N.; Pareek, A.; Raza, A.; Singla-Pareek, S. L.; Prasad, P. V. V.; Varshney, R. K. Maize and heat stress: Physiological, genetic, and molecular insights. Plant Genome 2024, 17, e20378. [Google Scholar] [CrossRef]
- Wang, Q.; Wu, Y.; Wu, W.; Lyu, L.; Li, W. A review of changes at the phenotypic, physiological, biochemical, and molecular levels of plants due to high temperatures. Planta 2024, 259, 57. [Google Scholar] [CrossRef]
- Fortunato, S.; Lasorella, C.; Dipierro, N.; Vita, F.; de Pinto, M. C. Redox signaling in plant heat stress response. Antioxidants 2023, 12, 605. [Google Scholar] [CrossRef] [PubMed]
- Sehar, Z.; Mir, I. R.; Khan, S.; Masood, A.; Khan, N. A. Nitric oxide and proline modulate redox homeostasis and photosynthetic metabolism in wheat plants under high temperature stress acclimation. Plants 2023, 12, 1256. [Google Scholar] [CrossRef]
- Sharma, G.; Sharma, N.; Ohri, P. Harmonizing hydrogen sulfide and nitric oxide: A duo defending plants against salinity stress. Nitric Oxide 2024, 144, 1–10. [Google Scholar] [CrossRef] [PubMed]
- Mishra, N.; Jiang, C.; Chen, L.; Paul, A.; Chatterjee, A.; Shen, G. Achieving abiotic stress tolerance in plants through antioxidative defense mechanisms. Front. Plant Sci. 2023, 14, 1110622. [Google Scholar] [CrossRef] [PubMed]
- Choudhary, R.; Rajput, V. D.; Ghodake, G.; Ahmad, F.; Meena, M.; Rehman, R.; Prasad, R.; Sharma, R. K.; Singh, R.; Seth, C. S. Comprehensive journey from past to present to future about seed priming with hydrogen peroxide and hydrogen sulfide concerning drought, temperature, UV and ozone stresses- a review. Plant Soil 2024, 498. In press. [Google Scholar] [CrossRef]
- Huang, Y.; An, J.; Sircar, S.; Bergis, C.; Lopes, C. D.; He, X.; Costa, B. D.; Tan, F. Q.; Bazin, J.; Antunez-Sanchez, J.; Mammarella, M. F.; Devani, R. S. HSFA1a modulates plant heat stress responses and alters the 3D chromatin organization of enhancer-promoter interactions. Nat. Commun. 2023, 14, 469. [Google Scholar] [CrossRef] [PubMed]
- Li, Z. G. Sugar signaling in plants under physiological and stress conditions. In: Hasanuzzaman, M.; Hawrylak-Nowak, B.; Islam, T.; Fujita, M. (Eds.) Biostimulants for Crop Production and Sustainable Agriculture. CABI, Wallingford, 2022, pp. 372-385.
- Hernandez-Leon, S. G.; Valenzuela-Soto, E. M. Glycine betaine is a phytohormone-like plant growth and development regulator under stress conditions. J. Plant Growth Regul. 2023, 42, 5029–5040. [Google Scholar] [CrossRef]
- Raza, A.; Charagh, S.; Abbas, S.; Hassan, M. U.; Saeed, F.; Haider, S.; Sharif, R.; Anand, A.; Corpas, F. J.; Jin, W.; Varshney, R. K. Assessment of proline function in higher plants under extreme temperatures. Plant Biol. 2023, 25, 379–395. [Google Scholar] [CrossRef]
- Alvarez, M. E.; Savouré, A.; Szabados, L. Proline metabolism as regulatory hub. Trends Plant Sci. 2022, 27, 39–55. [Google Scholar] [CrossRef]
- Vuković, M.; Kutnjak, M.; Vitko, S.; Tkalec, M.; Vidaković-Cifrek, Z. Heat priming modifies heat stress response in BPM1-overexpressing Arabidopsis thaliana (L.) Heynh. J. Plant Growth Regul. 2024, 43, in, in press. [Google Scholar] [CrossRef]
- Li, Z. G.; Yang, S. Z.; Long, W. B.; Yang, G. X.; Shen, Z. Z. Hydrogen sulfide may be a novel downstream signal molecule in nitric oxide-induced heat tolerance of maize (Zea mays L.) seedlings. Plant Cell Environ. 2013, 36, 1564–1572. [Google Scholar] [CrossRef] [PubMed]
- Gautam, H.; Fatma, M.; Sehar, Z.; Mir, I. R.; Khan, N. A. Hydrogen sulfide, ethylene, and nitric oxide regulate redox homeostasis and protect photosynthetic metabolism under high temperature stress in rice plants. Antioxidants 2022, 11, 1478. [Google Scholar] [CrossRef] [PubMed]
- Zhao, Y.; Pan, W.; Xin, Y.; Wu, J.; Li, R.; Shi, J.; Long, S.; Qu, L.; Yang, Y.; Yi, M.; Wu, J. Regulating bulb dormancy release and flowering in lily through chemical modulation of intercellular communication. Plant Methods 2023, 19, 136. [Google Scholar] [CrossRef] [PubMed]
- Zhou, Z. H.; Wang, Y.; Ye, X. Y.; Li, Z. G. Signaling molecule hydrogen sulfide improves seed germination and seedling growth of maize (Zea mays L.) under high temperature by inducing antioxidant system and osmolyte biosynthesis. Front. Plant Sci. 2018, 9, 1288. [Google Scholar] [CrossRef] [PubMed]
- Li, Z. G.; Xie, L. R.; Li, X. J. Hydrogen sulfide acts as a downstream signal molecule in salicylic acid-induced heat tolerance in maize (Zea mays L.) seedlings. J. Plant Physiol. 2015, 177, 121–127. [Google Scholar] [CrossRef] [PubMed]
- Sun, Y. Y.; Wang, J. Q.; Xiang, R. H.; Li, Z. G. Key role of reactive oxygen species-scavenging system in nitric oxide and hydrogen sulfide crosstalk-evoked thermotolerance in maize seedlings. Front. Plant Sci. 2022, 13, 967968. [Google Scholar] [CrossRef]
- Zhu, J.; Qi, J.; Fang, Y.; Xiao, X.; Li, J.; Lan, J.; Tang, C. Characterization of sugar contents and sucrose metabolizing enzymes in developing leaves of Hevea brasiliensis. Front. Plant Sci. 2018, 9, 58. [Google Scholar] [CrossRef]

| r | H2S | LCD | DCD | OAS-TL |
|---|---|---|---|---|
| SUC | 0.712* | 0.804** | 0.126 | 0.421* |
| SPS | 0.520 | 0.623* | 0.201 | 0.512* |
| SUS | 0.651* | 0.530* | 0.321 | 0.450* |
| r | Survival rate | CAT | GR | APX | POD | DHAR | MDHAR | SOD |
|---|---|---|---|---|---|---|---|---|
| Survival rate | 1 | |||||||
| CAT | 0.731** | 1 | ||||||
| GR | 0.654** | 0.320* | 1 | |||||
| APX | 0.321 | 0.412 | 0.437* | 1 | ||||
| POD | 0.452 | 0.214 | 0.213 | 0.234 | 1 | |||
| DHAR | 0.641** | 0.426* | 0.512* | 0.423* | 0.254 | 1 | ||
| MDHAR | 0.536* | 0.402** | 0.342* | 0.312* | 0. 315 | 0.452* | 1 | |
| SOD | 0.132 | 0.204 | 0.206 | 0.217 | 0.218 | 0.256 | 0.235 | 1 |
| r | Survival rate | AsA | Flavone | Carotenoid | Total phenol | H2O2 | O2·ˉ |
|---|---|---|---|---|---|---|---|
| Survival rate | 1 | ||||||
| AsA | 0.601* | 1 | |||||
| Flavone | 0.352* | 0.321 | 1 | ||||
| Carotenoid | 0.314* | 0.432* | 0.410* | 1 | |||
| Total phenol | 0.215 | 0.284 | 0.256* | 0.413* | 1 | ||
| H2O2 | 0.412* | 0.402* | 0.426* | -0.246* | 0.622* | 1 | |
| O2·ˉ | -0.523* | -0.346 | -0.532* | -0.420* | -0.516* | -0.421* | 1 |
Disclaimer/Publisher’s Note: The statements, opinions and data contained in all publications are solely those of the individual author(s) and contributor(s) and not of MDPI and/or the editor(s). MDPI and/or the editor(s) disclaim responsibility for any injury to people or property resulting from any ideas, methods, instructions or products referred to in the content. |
© 2024 by the authors. Licensee MDPI, Basel, Switzerland. This article is an open access article distributed under the terms and conditions of the Creative Commons Attribution (CC BY) license (http://creativecommons.org/licenses/by/4.0/).


