Preprint
Article

The Biocultural Resilience Index (BRI): A New Tool for Assessing the Sustainability of Multifunctional Landscapes

This version is not peer-reviewed.

Submitted:

20 May 2024

Posted:

20 May 2024

You are already at the latest version

Abstract
Multifunctional landscapes are complex systems that integrate biophysical, cultural-historical and socio-economic components into unique territorial structures and regional ensembles. Facing increasing pressures generated by urbanization, climate change and overexploitation of natural resources, assessing the sustainability of these landscapes has become an urgent priority. The present research is based on the development and parametrization of a new tool for evaluating the sustainability of multifunctional landscapes that aims to measure the level of biocultural resilience of a landscape, integrating biological, cultural and socio-economic indicators in a single analytical framework. This index, called the biocultural resilience index (BRI), provides a holistic perspective on the dynamics of landscapes, allowing the identification of vulnerability areas and the development of conservation and sustainable management strategies. The evaluation of the of multifunctional landscapes sustainability requires a comprehensive approach that has to integrate both biological aspects, such as biodiversity and ecosystem health, as well as identity and cultural aspects, such as cultural value and the relationship of the local communities with the environment. In this context, this study highlights the fact that the development of appropriate tools and methods for assessing and monitoring the sustainability of multifunctional landscapes becomes essential for their sustainable management and for protecting the benefits they offer to society. Our findings show that the biocultural resilience index (BRI) can be used in a variety of contexts and fields, including spatial planning, biodiversity conservation, sustainable rural development and ecotourism. In the meanwhile, this index offers a robust and flexible analytical framework, adaptable to the needs and particularities of different regions and communities.
Keywords: 
Subject: 
Environmental and Earth Sciences  -   Geography

1. Introduction

In an era where the delicate balance between human activity and natural ecosystems is increasingly under threat, this groundbreaking research introduces a pioneering tool designed to revolutionize the way we evaluate and preserve the complex interplay between biodiversity and cultural diversity across the globe's invaluable landscapes. The Biocultural Resilience Index (BRI) stands as a pivotal innovation, offering a holistic, integrative tool that assesses the sustainability of multifunctional landscapes by balancing ecological, economic, and cultural dimensions, thereby guiding informed decision-making, enhancing resilience to environmental and socio-economic changes, and promoting the co-protection of biodiversity and cultural heritage.
The sustainability of territorial systems is a complex and interconnected global challenge [1], influenced by factors such as climate change, land use, urbanization and the degradation of natural and semi-natural ecosystems [2,3,4].
Forests cover approximately 31% of the land surface and are an important component of the natural environment [5,6,7], providing essential ecosystem services by reducing carbon emissions and by facilitating the preservation of biodiversity [8,9,10].
Forests have multiple functions: social, environmental and economic [11], adapted to the various needs of human society [5,12]. Besides, forest systems play an important role in improving the livelihoods of many communities around the world [13].
Landscapes are an intensive analyzed component from the perspective of natural and cultural aspects [14,15], being directly influenced by the anthropic factor, which imprints a series of changes depending on the activities carried out [16,17,18]. Furthermore, the landscape represents the level at which human-nature interactions are most significantly reflected, a fact highlighted in its structure and configuration [19,20]. This is the reason why landscape is considered a field of major interest in terms of study and applicability of the concept of sustainability [19,21,22,23,24]. Multifunctional landscapes are the result of the trade-offs between the multiple ecological, economic and/or social functions of landscapes determined by human-nature interactions [25,26,27]. These landscapes provide natural and cultural resources, habitat for biodiversity [28] and vital spaces for recreation, tourism and social connectivity. Sustainable multifunctional landscapes are landscapes created and managed to integrate human production and landscape use in order to preserve basic ecosystem functions [29] and biodiversity [30,31].
Degradation of forest surfaces is a major problem in the developing world [32,33,34]. In contemporary society, forests face several threats, including: deforestation [34], climate change [35], high susceptibility to natural pests [36,37], unsustainable management [38,39] and vulnerability to extreme weather episodes [5]. Deforestation is a growing phenomenon in recent decades [34,40,41]. Globally, it is estimated that approximately 420 million ha have disappeared because of deforestation between 1990 and 2020 [42]. In the meanwhile, the reduction of forest surfaces through deforestation has a major impact on both environmental and socio-economic factors [41,43,44,45,46], as well as on inhabited areas, having direct effects on the development of local communities and economies [47]. One of the main risks associated with deforestation faced by developed countries is the intensification of climate change effects [32,48,49,50,51]. The removal of forest cover has consequences on the changes of the local microclimate [45], through processes such as increased solar exposure of surfaces, higher temperatures (both at ground and air level) and wind intensification [52]. Reduced vegetation cover also means a lower rate of evapotranspiration that leads to higher air temperature [45,53,54]. Moreover, deforestation accentuates soil degradation [55,56], resulting in the intensification of erosion processes [44,57], aquifer depletion [44,58] and changes both the structure and functionality of local ecosystems and the landscape identity of a region [59,60].
In this context, the assessment of forested areas is a necessary step towards effective management of forest resources [8,61]. Remote sensing is a useful tool in monitoring changes [62], having a high accuracy in their quantitative and spatial analysis [62,63]. The availability of Landsat satellite images represents an opportunity for estimating the dynamics of forest surfaces [64,65,66,67]. They are considered one of the most popular tools used for highlighting the changes of forest canopy [68,69,70], a fact also highlighted by the low costs of assessing these changes [44]. Based on satellite images, several vegetation indices have been developed, which are widely used to highlight the changes in land use/cover [71,72] and to emphasize the structural-functional transformations of the landscapes [73,74,75]. Among them, The Normalized Difference Vegetation Index (NDVI) has a high practical applicability, due to the fast calculation, high sensitivity to the detection of vegetation [72] and the close relationship with variables of ecological interest [76,77], providing useful information for the analysis of landscape structure and temporal changes [75,78].
Biocultural diversity represents a major component of social-ecological systems and a key resource for adapting to changes and their future development, having a very important role in increasing the resilience of systems [79,80,81]. In this context, the concept of 'resilience' has many definitions in various fields, such as ecology, engineering, development, geography, economics, psychology and health [82,83,84,85]. In the field of social-ecological systems, resilience broadly describes the ability to adapt to disturbances, disruptions, uncertainties, vulnerabilities and risks, while remaining within the thresholds that provide the system's functionality [84,86,87] and strengthening the necessary processes for the establishment of multifunctional adaptive structures [88]. Moreover, the concept of resilience, from the perspective of the study of social-ecological systems, refers to the achievement of objectives related to the ability to adapt, learn and innovate [84,89].
Assessing the resilience of a territorial system from the perspective of social and ecological factors is a challenge because the spatial organization processes and ecological factors cannot be estimated as individual factors but must be particularized depending on the context [90,91]. The development of relevant indicators for assessment of resilience from the perspective of biocultural approach is based both on the analysis of the territory’s biodiversity and ecosystem services, as well as on the management of specific human practices and local cultural background reflected in the productive landscape of the community [85,92,93,94].
According to the International Union for Conservation of Nature (IUCN), protected areas are defined as areas of ”land and/or sea especially dedicated to the protection and maintenance of biological diversity, and of natural and associated cultural resources, and managed through legal or other effective means” [95] (IUCN, 1994, p. 7). The sustainable development of a protected area is dependent on the social, economic and cultural context [96]. The protected areas play an essential role in preserving biodiversity and the integrity of natural habitats, their conservation being essential in the contemporary society [97,98,99,100]. In addition, protected areas are a key tool in ensuring the development of sustainable activities [101,102], their effective management being of crucial importance in order to provide the long-term development of environmental systems [39,103,104]. In the absence of an effective management, there is the risk of establishment of disturbances that endanger the resilience of the system in question, such as the expansion of natural pests (e.g. the bark beetle – Trypodendron lineatum/Ips typographus) that can strongly affect the balance of forest ecosystems [37,56,105].
Considering the complexity and multitude of contemporary environmental problems, such as climate change, the degradation of natural habitats, the vulnerability of inhabited territories and the dynamics of social-ecological systems intensification, this research aims to answer three main questions:
RQ1. How can the sustainability of multifunctional landscapes from protected areas be quantified by analyzing the elements that have functions in detecting the conflicts reflected in the social-ecological systems?
RQ2. To what extent can the proposed analysis provide a comprehensive and integrated perspective on the sustainability of landscapes through monitoring the biocultural resilience?
RQ3. What are the potential practical applications of the results obtained from the evaluations performed by the biocultural resilience index (BRI) for the planning and management of multifunctional landscapes?
The purpose of the present research is to investigate the role and relevance of the development of an appropriate tool in order to assess the sustainability of multifunctional landscapes in protected areas, which integrates quantifiable variables through GIS techniques and remote sensing. In this regard, we aim to identify the current challenges and limits associated with the implementation of the biocultural resilience index (BRI) for the assessment of the sustainability of multifunctional landscapes. Besides, we want to identify solutions and directions for the future development of this new analysis tool that integrates biological and cultural aspects, thus reflecting the complexity and interconnections between the natural and the socio-cultural environment. In this way, the biocultural resilience index (BRI) is a useful tool that integrates the evaluation of ecological resilience and cultural and social aspects to highlight the sustainability of multifunctional landscapes. At the same time, the BRI fills the existent gaps in traditional approaches, which focus exclusively on the ecological aspects of resilience and underestimate the role and value of cultural and social aspects for the management of landscape sustainability.
In this context, the use of BRI allows a comprehensive assessment of the resilience of landscapes, which is understood as their ability to respond to different types of disturbances or changes and to maintain their essential functions and ecosystem services over time, without damaging biodiversity.
By integrating a set of biophysical parameters (such as ecosystem health, landscape metrics, geomorphometry of the territory, biodiversity etc.) with socio-cultural parameters (landscape value, land cover/use, cultural traditions and practices etc.) there can be obtained a more comprehensive understanding of the complex interactions between the natural environment and society.
This holistic approach allows a more precise identification and assessment of the impact of human activities on ecosystems and on how they influence the life quality of local communities in the space of interference between protected areas and productive landscapes. The integration of socio-cultural parameters in ecological analyses may contribute to the definition of environmental conservation policies and strategies that take into account human needs and values. This integration promotes a more sustainable development and efficient management of natural resources, and implicitly a comprehensive perspective on the sustainability of multifunctional landscapes.

2. Materials and Methods

2.1. Study Area

The Apuseni National Park, located in the central-western part of the Western Carpathians, is one of the most important protected areas of national interest in the mountainous area of Romania, being included in category V IUCN. With a total area of approximately 76 055 ha (Figure 1), it includes parts of Alba, Bihor and Cluj counties and partially or fully overlaps 16 territorial-administrative units (LAU 2), respectively 15 communes and a town.
The Apuseni Natural Park stands out for its multifunctional landscapes of great values, some of which are rare or unique in the region. Moreover, it is distinguished by the wealth of bio- and geodiversity, being characterized by numerous geomorphosites, such as ice caves (Scărișoara Ice Cave is unique in South-Eastern Europe), avens, gorges, sinkholes, dry valleys, karstic intermittent springs. In addition, the park is home to a variety of traditional agricultural practices and architectural buildings specific to rural settlements in the Carpathian mountain area.
The internal zoning of the Apuseni National Park includes two categories: buffer zones and special conservation zones. The latter include the most valuable elements of the natural heritage and have an area of approximately 14 000 ha of the total. The predominant vegetation consists in forests, accounting for 74% of the total surface of the study area. Coniferous forests dominate the landscape, with spruce (Picea abies) being the most widespread species. On isolated areas there are other coniferous species, such as fir (Abies alba), larch (Larix decidua) and pine (Pinus sylvestris). Furthermore, deciduous forests are present at lower altitudes, in which beech (Fagus sylvatica) predominates, along with species such as hornbeam (Carpinus betulus), maple (Acer pseudoplatanus), birch (Betula verrucosa) and mountain ash (Sorbus aucuparia).
The main economic activities within the study area include the exploitation of forest resources and wood processing, which involve the production of wooden vessel, timber, wooden building materials and furniture, among others. These activities are traditional and take place in most of the settlements in the Apuseni Natural Park. In addition to this, agriculture, especially animal husbandry, and tourism are two other important activities from the study area.

2.2. Data acquisition and processing

We used several data sets for this research, grouped into two main categories: remote sensing data and data used in GIS analysis.
Remote sensing data provide a wide range of information, including vegetation distribution, biophysical characteristics of the vegetation cover (such as biomass, leaf area index etc.), the stage of plant grown at a given time and changes in vegetation health etc. The Normalized Difference Vegetation Index (NDVI) is one of the most widely used vegetation indices, being developed to analyze vegetation cover and to monitor changes over time, both at regional and local scale.
The equation of NDVI was developed and used for the first time by Rouse et. al. (1974) [106] and is based on the absorption and reflection of electromagnetic radiation by vegetation. Plants, thanks to chlorophyll, strongly absorb visible radiation (materialized in the red band) and reflect radiation in the near-infrared region.
The general formula for calculating NDVI is:
𝑁𝐷𝑉𝐼 = (𝑁𝐼𝑅 – 𝑅𝐸𝐷) / (𝑁𝐼𝑅 + 𝑅𝐸𝐷),
where:
NIR – Near-Infrared;
RED – Red band.
NDVI ranges between -1 and +1, with a high value indicating healthier or denser vegetation, while a value close to or below zero typically indicates areas covered by water, clouds, snow and other areas lacking vegetation. The satellite images required for the analysis (Table 1), belong to the Landsat 2, 5 and 8 missions. These images were downloaded from the US Geological Survey (https://earthexplorer.usgs.gov). For a better identification of the vegetation, all images were selected from the months of August-September.
The data used in GIS analysis were provided from various sources. Their integration and processing primarily took into account the aspects related to their relevance for the present research, the veracity of the results obtained and the accuracy of the definition of the qualitative variables of the monitoring parameters. Thus, the assessment of the forest cover dynamics in the study area was based on the processing of data from Global Forest Watch (GFW) for the period 2001-2022. The data resulting from the calculation of the value of the indicators used for the analysis of the state of the natural landscape and biodiversity were obtained by simple operations using ArcGIS 10.8.1 software, such as the spatialization of the absolute values using the Inverse Distance Weighting (IDW) interpolator and Euclidean Distance function.
The geographical information necessary for evaluating the architectural heritage and local community encompasses key indicators that influence the sustainability of the landscape within the protected region of the mountain area under study, specifically: the density of built heritage, building density, number of resident population and the settlement dispersion index (Demangeon variant). Data geoprocessing was performed by using GIS tools (IDW, Kernel Density).
The indicators used for the analysis of land cover/use and spatial accessibility were based on data series that allowed diachronic analyses, in order to explore the impact produced on traditional agricultural practices and ecosystems. In this context, pertinent data and information were extracted, focusing on the organizational methods and the means of valuing the geographical space, along with the impact on the landscape, as unique classifications grounded in the synthesis of territorial-identity relationships.
The integration of specific indicators of landscape metrics in the analysis carried out for the assessment of multifunctional landscapes sustainability is justified both from the point of view of highlighting the level of connectivity between different plots, and for assessing the degree of fragmentation of the forest landscape, which is an indicator of maximum relevance for the study area. The data required for the analysis were obtained through GIS techniques, using the Patch Analyst 5.2 and Patch Grid 5.1. extensions, as well as the FRAGSTAT Helper program for ArcGIS 10.8.1.
The present research also involved the use of other analytical techniques and procedures performed through GIS, which ensured the step-by-step process of the entire approach regarding the creation, structuring and processing of the database used in the analysis. Thus, the acquisition and correct processing of data was based on several operations, such as: indexing, specific parametrization, cross-queries of data and structuring of the indicators used in the spatial analysis. Moreover, it was also necessary to check the integrity and coherence of the data series, along with the multiscalar correlation of the spatial data sets, the application of calculation algorithms through spatial analysis equations, thematic editing and the cartographic representation of the used indicators.

2.3. Analysis methods and techniques

The resilience of territorial systems can be analyzed from multiple perspectives, including ecological, social and developmental [7]. In the present study, a holistic approach to this concept was carried out, integrating a series of parameterized variables, which target both natural and anthropogenic factors relevant for the present research.
The assessment of forest surfaces dynamics in the Apuseni Natural Park was performed by calculating The Normalized Difference Vegetation Index, derived from satellite images processing using open-source data available on the United States Geological Survey (USGS), for an extended analysis interval (43 years), between 1980-2023 (Figure 2).
For the calculation of NDVI index and data processing we used the ArcGIS 10.8.1 software. The data was reprojected into the official projection system of Romania (Stereo 1970, EPSG: 3844). After calculating the NDVI index, we performed a classification of the values to highlight the different classes of vegetation density.
NDVI threshold values were used to delineate land use/cover categories, resulting in five classes: water/clouds, barren land, sparse vegetation, moderate vegetation and dense vegetation. Basically, negative NDVI values indicate areas with water, artificial structures, rocks or clouds. Barren land usually has values that range between 0.15-0.2, while plants have positive values, between 0.2 and 1. The values of healthy, dense vegetation are above 0.5, while the sparse vegetation has values that range between 0.2-0.5. Generally, NDVI values are between 0.2 and 0.4 for areas with sparse vegetation and from 0.4 to 0.6 for moderate vegetation, while the values above 0.6 indicate the highest density [107,108]. It is important to mention that the interpretation of NDVI values may vary depending on factors such as vegetation type, climate, seasonality etc.
In order to understand and evaluate the biocultural resilience of multifunctional landscapes, a more elaborated approach is required, which integrates the essential aspects associated with the state of the habitats, their functionality, spatial extension, fragmentation, connectivity, evolution of land cover/use, exploitation of resources, biodiversity conservation, landscape protection and ecosystemic services [109,110]. This approach has to be more sensitive to the specific context of the regional insertion environment. In this regard, we used a formula that includes more interactions between systemic variables and reflects the complexity and multifunctionality of the landscape as best as possible:
B R I = i = 1 n K i V i ,
where:
n – total number of variables included in the analysis;
Ki​ – weight of the i variable;
Vi​ – normalized values of i variable.
The formula used can be adapted and extended depending on the peculiarities and on how the variables and their interactions are evaluated. Thus, the use of product and sum in the spatial equation represents an essential tool for highlighting and interpreting the complexity of spatial relationships and the dynamics of associated processes. Such an approach allows the integrated assessment of how they interact multiplicatively, suggesting that their impact on the final result may be more than the simple addition of terms.
In order to evaluate the sustainability of multifunctional landscapes, we used a number of 18 analysis indicators (Table 2), which were grouped into 4 relatively homogeneous structural categories, depending on their relevance in the assessment of sustainability. The grouping allowed a better covering of the ecological, social, cultural and spatial aspects. This provided a better understanding of the dynamics of the analyzed territorial system, aspects that are relevant for the assessment of the sustainability of landscapes through the biocultural resilience index (BRI).
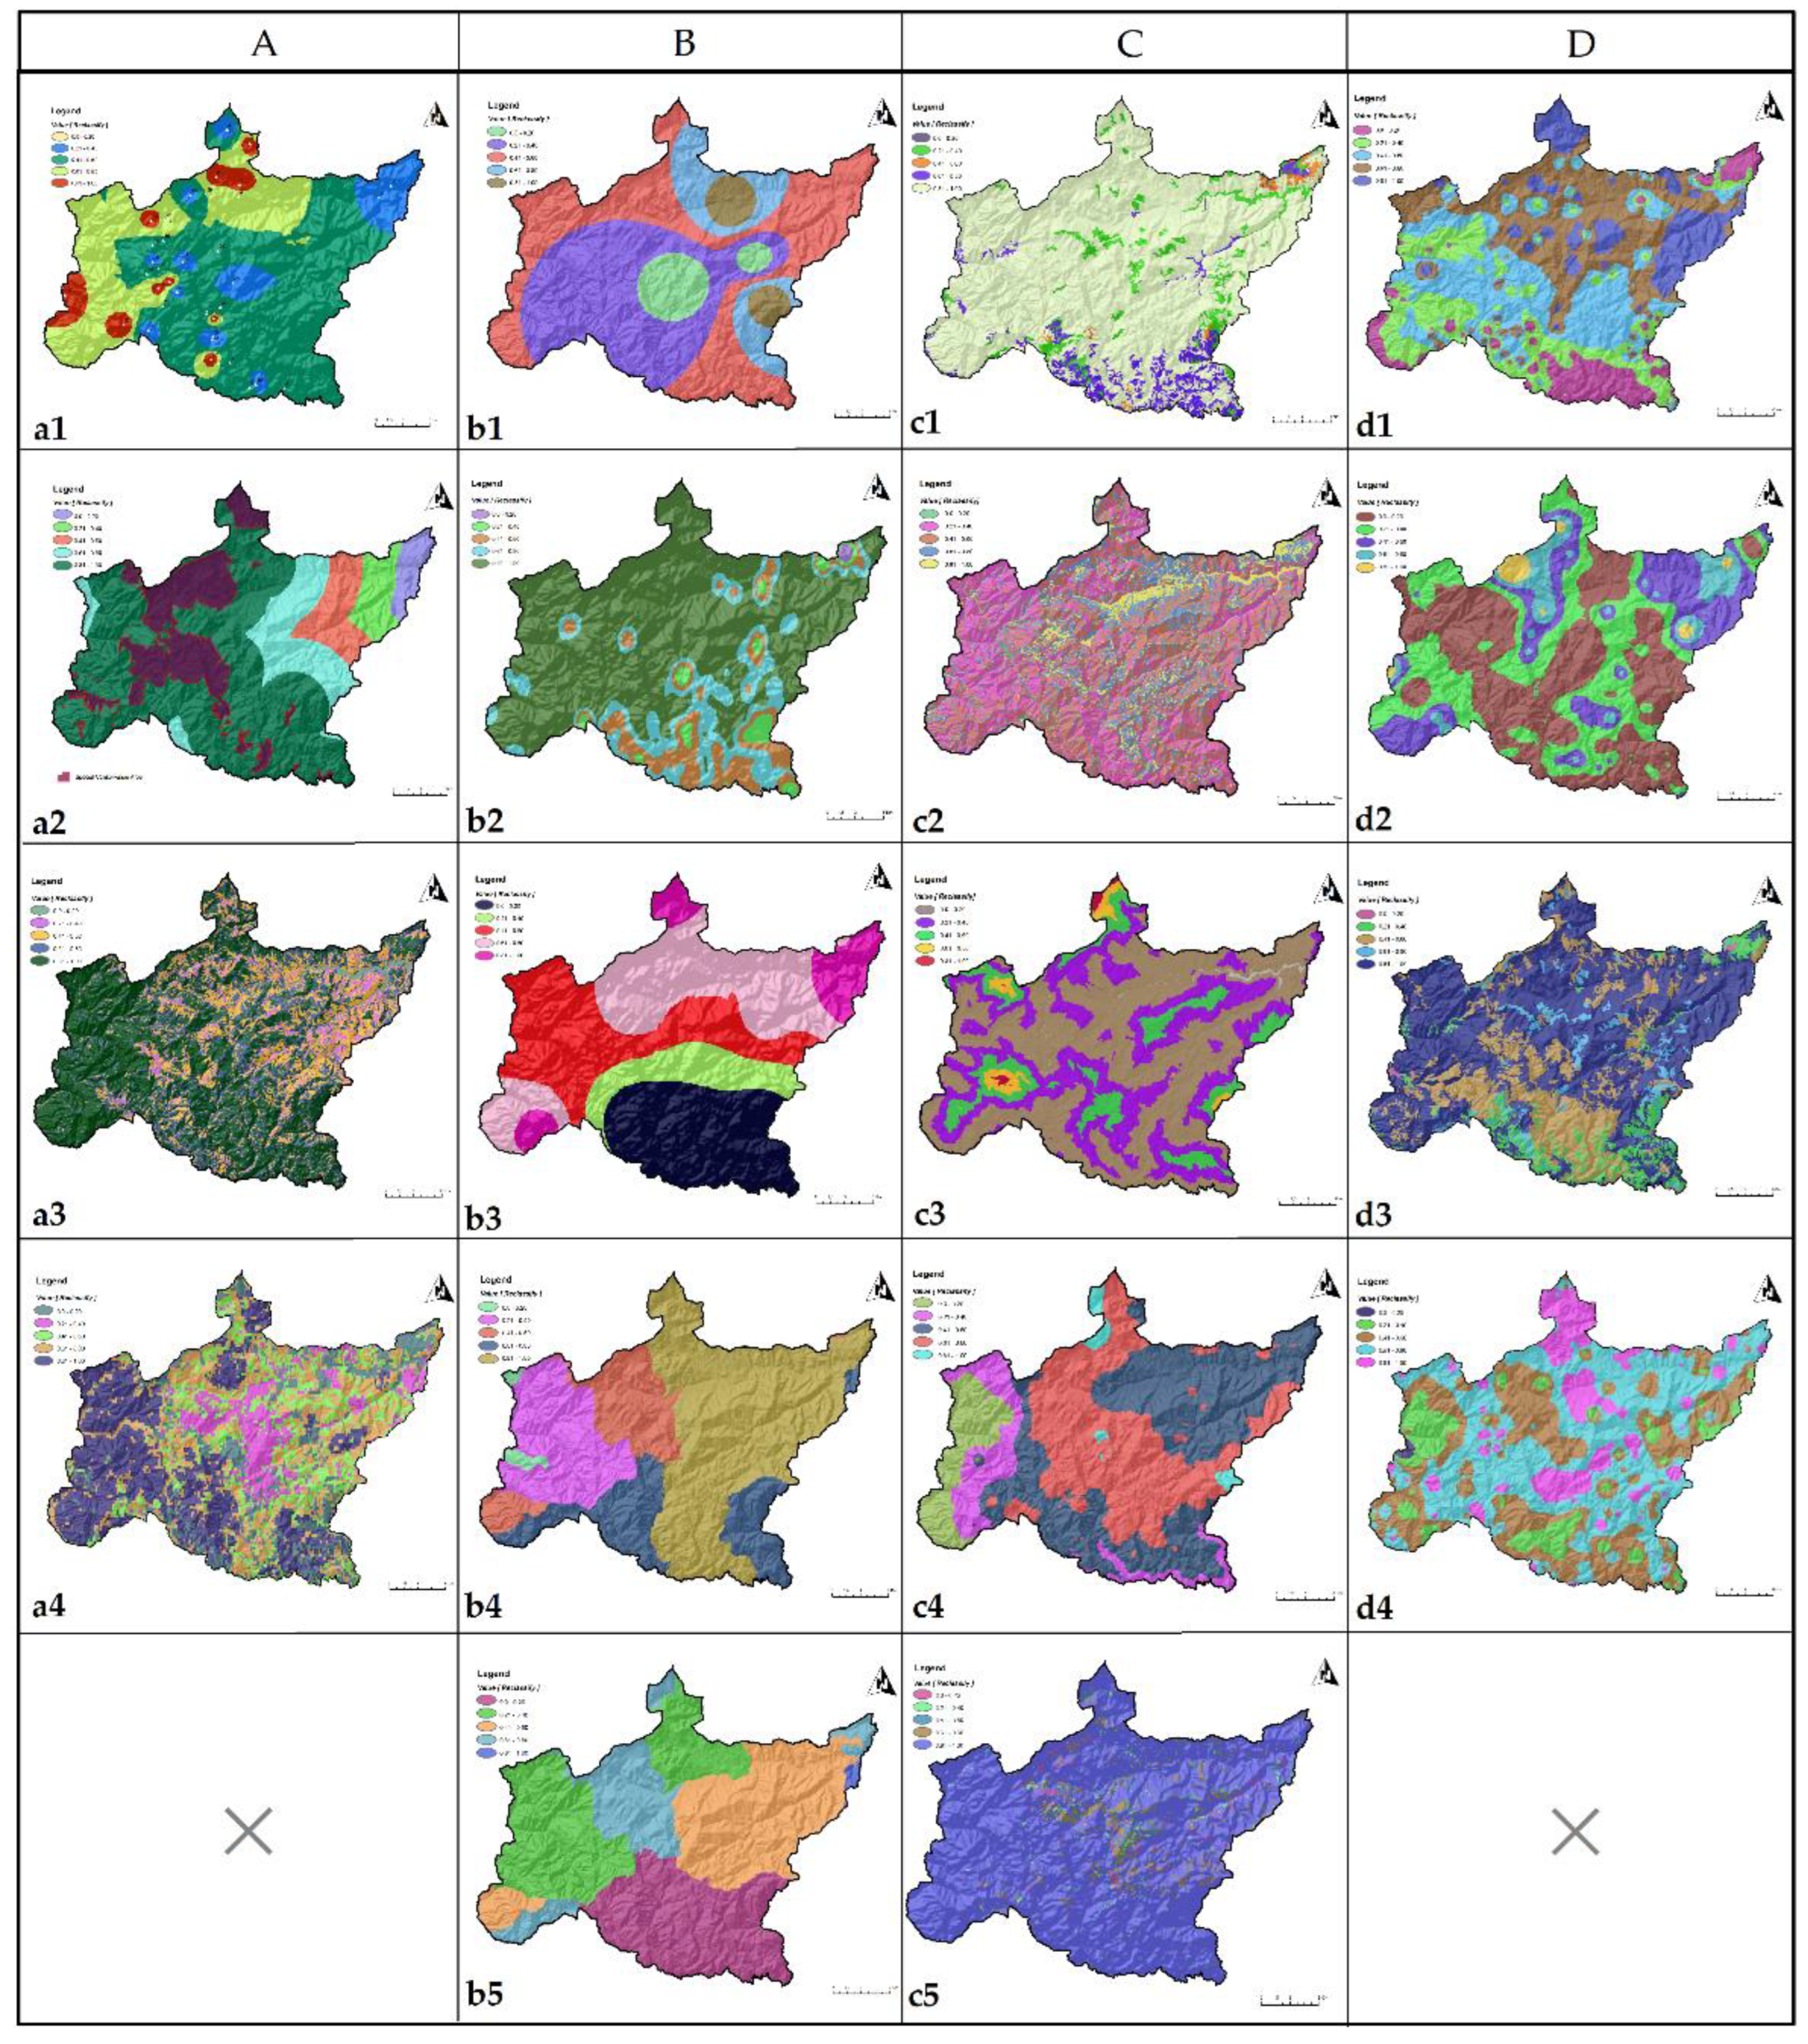
The diversity of the absolute values of the analyzed spatial indicators required the normalization procedure. The method that was used in the GIS environment targeted the normalization of each raster in the range between 0 - 1, using the "Rescale by Function" tool from the Spatial Analyst toolbox (Figure 3).
For the calculation of the aggregate index, it was necessary to assign corresponding weights to each calculated spatial indicator, since not all criteria had an equal contribution in this analysis. The differentiation of the weighted values was performed by the AHP method (Analytic Hierarchy Process), using the tool developed by Goepel (2018) [111].
The formula used to calculate the aggregate index combines the values of the 18 reclassified raster layers, using the appropriate weights assigned to each spatial analysis indicator:
BRI = ("raster_a1" * 0.1) + ("raster_a2" * 0.05) + ("raster_a3" * 0.02) + ("raster_a4" * 0.08) + ("raster_b1" * 0.1) + ("raster_b2" * 0.08) + ("raster_b3" * 0.1) + ("raster_b4" * 0.01) + ("raster_b5" * 0.04) + ("raster_c1" * 0.01) + ("raster_c2" * 0.01) + ("raster_c3" * 0.03) + ("raster_c4" * 0.08) + ("raster_c5" * 0.06) + ("raster_d1" * 0.05) + ("raster_d2" * 0.08) + ("raster_d3" * 0.05) + ("raster_d4" * 0.05),
where:
"raster_a1", "raster_a2", etc. - raster datasets that contain the values for each indicator
0.1 - weight of the value of the indicator ”a1”.
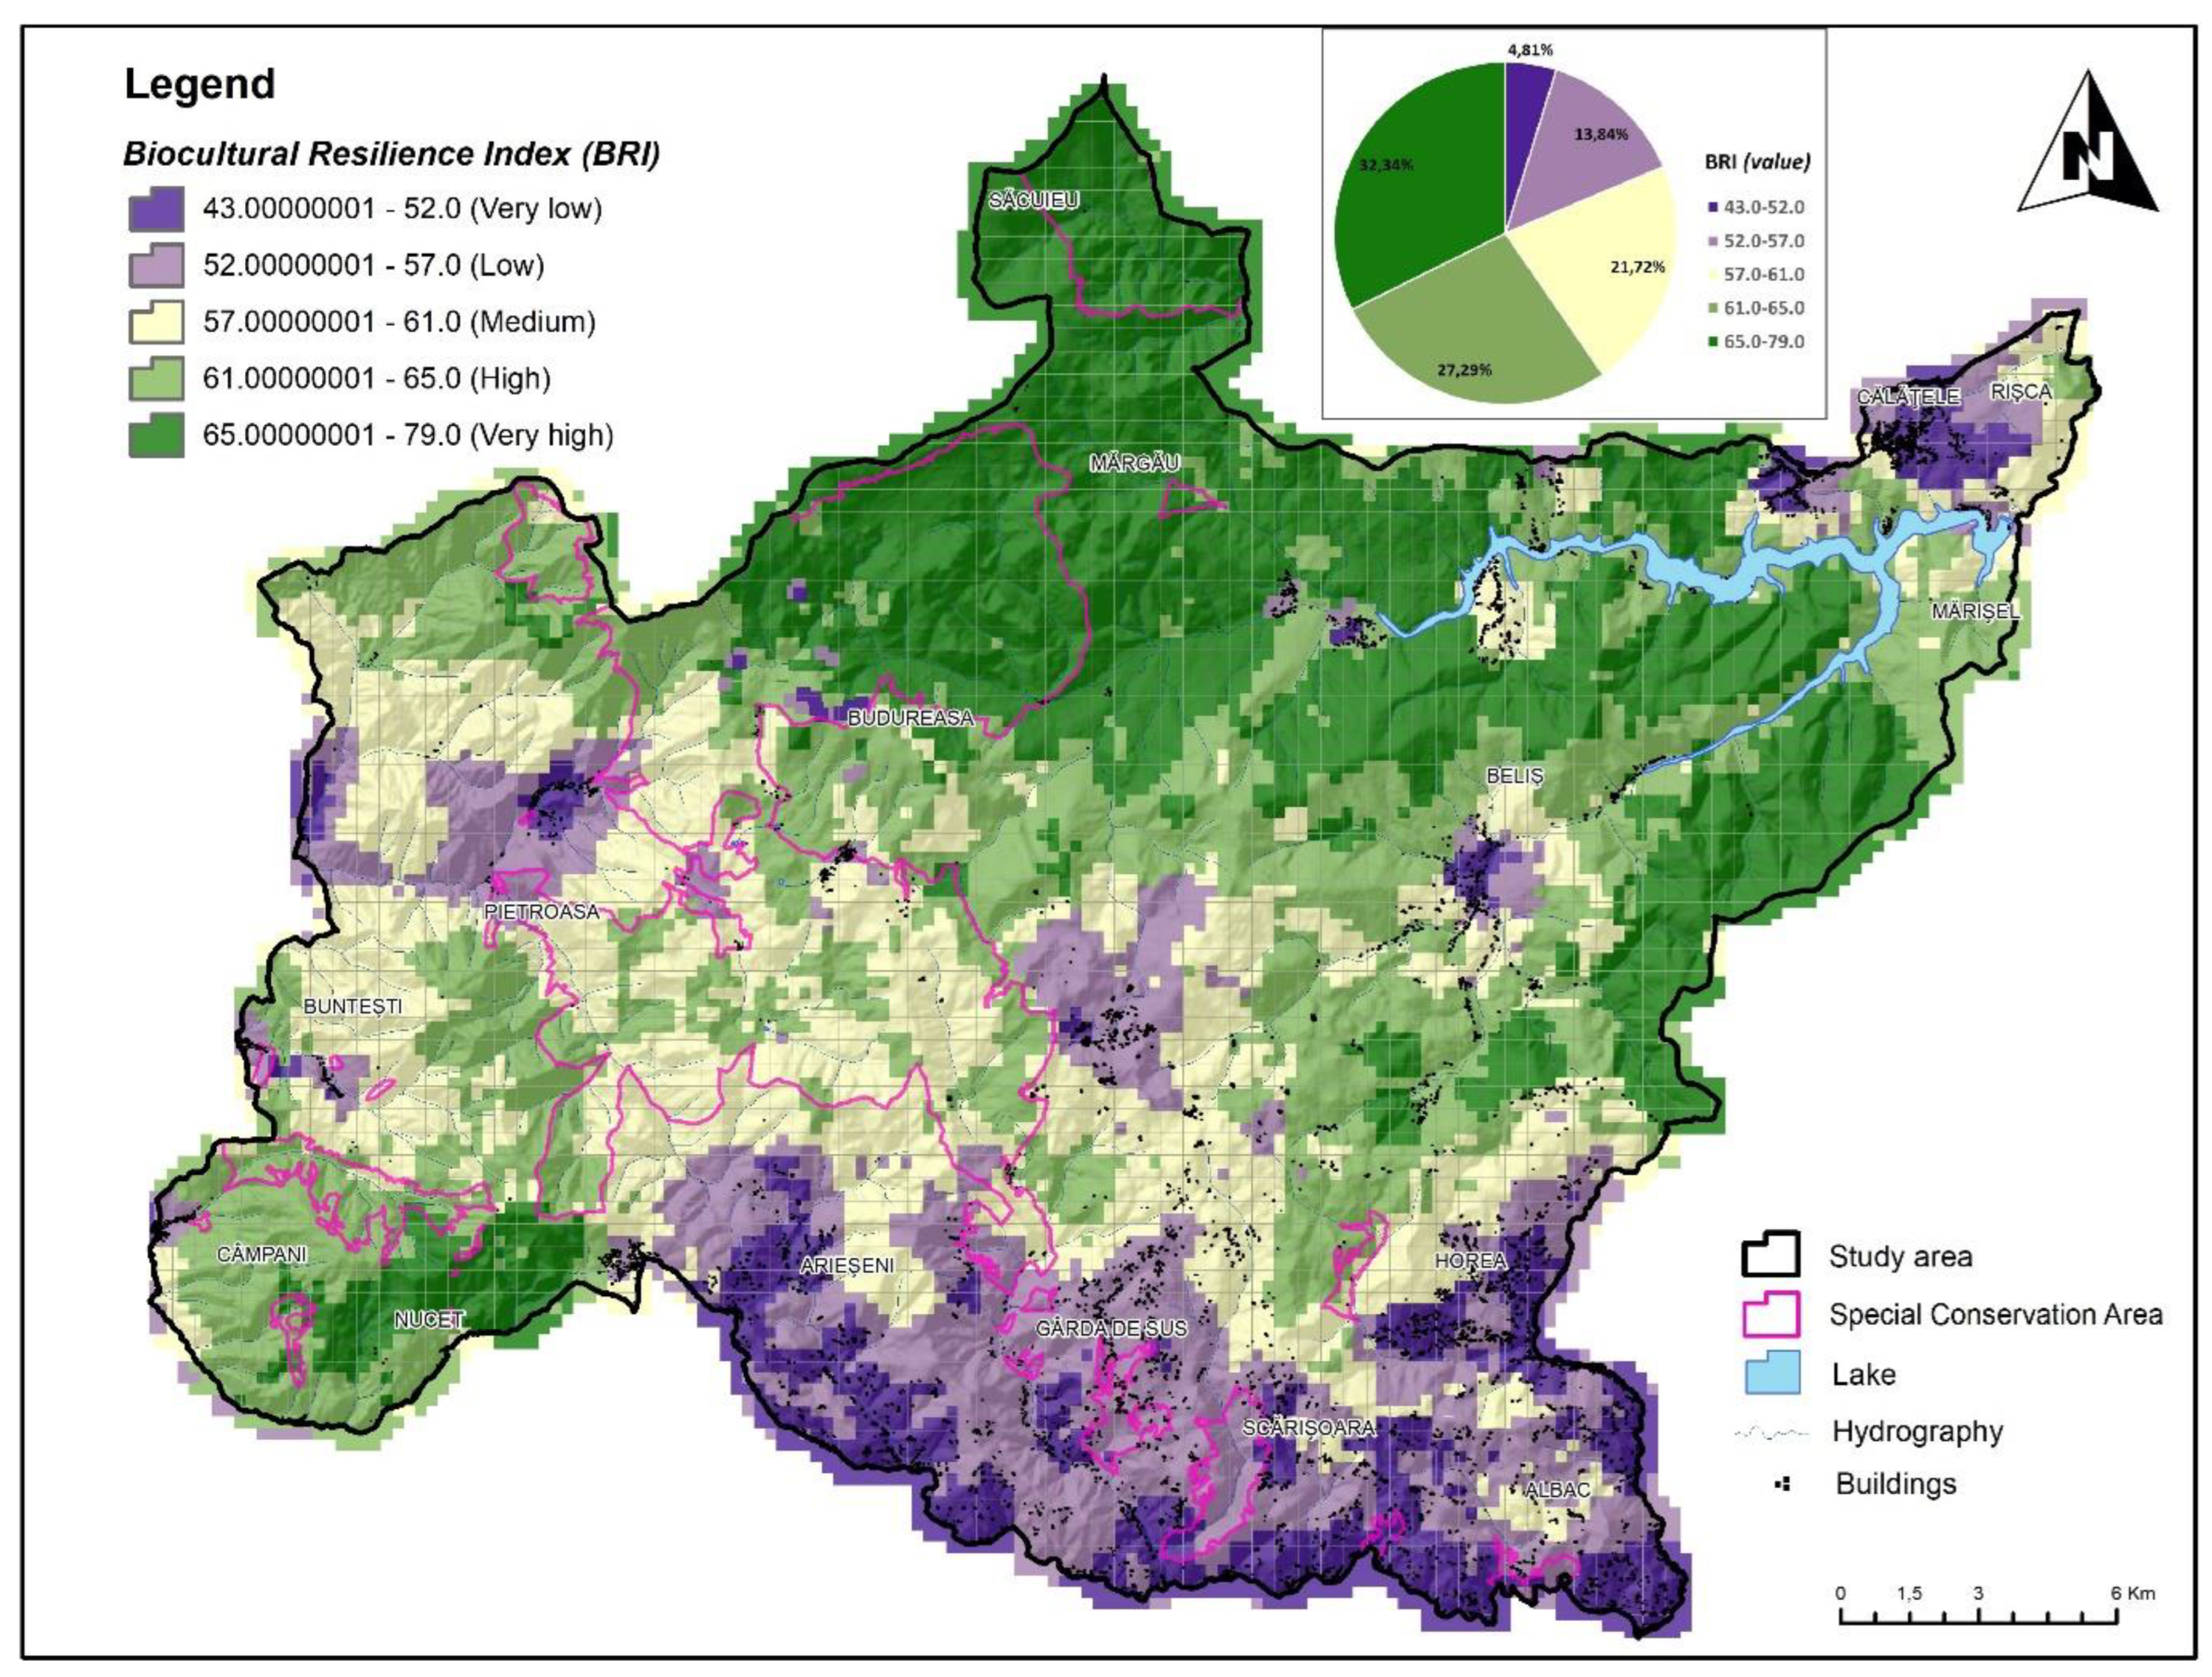
This procedure was performed by ArcGIS 10.8.1 software, using the Raster Calculator tool, Spatial Analyst Tools, Map Algebra submenu. The final result is a raster image of the study area, which was later classified according to the values obtained by the Natural Breaks (Jenks) method into 5 classes differentiating the degree of biocultural resilience, with the extreme ranges being very low (43.0) and very high (79.0).

3. Results

3.1. Land Cover/Land Use Changes (LCLUC)

Land cover/use is a crucial factor in changes to biodiversity, representing a synthesis of human activities carried out in the space of interference between social end ecological processes. The transformations in land use reflect in the landscape the changes in the economic and demographic structure [112], as well as the complexity of the interactions between the physical and the social-cultural environment, as responses to the diachronic succession of the different stages of development.
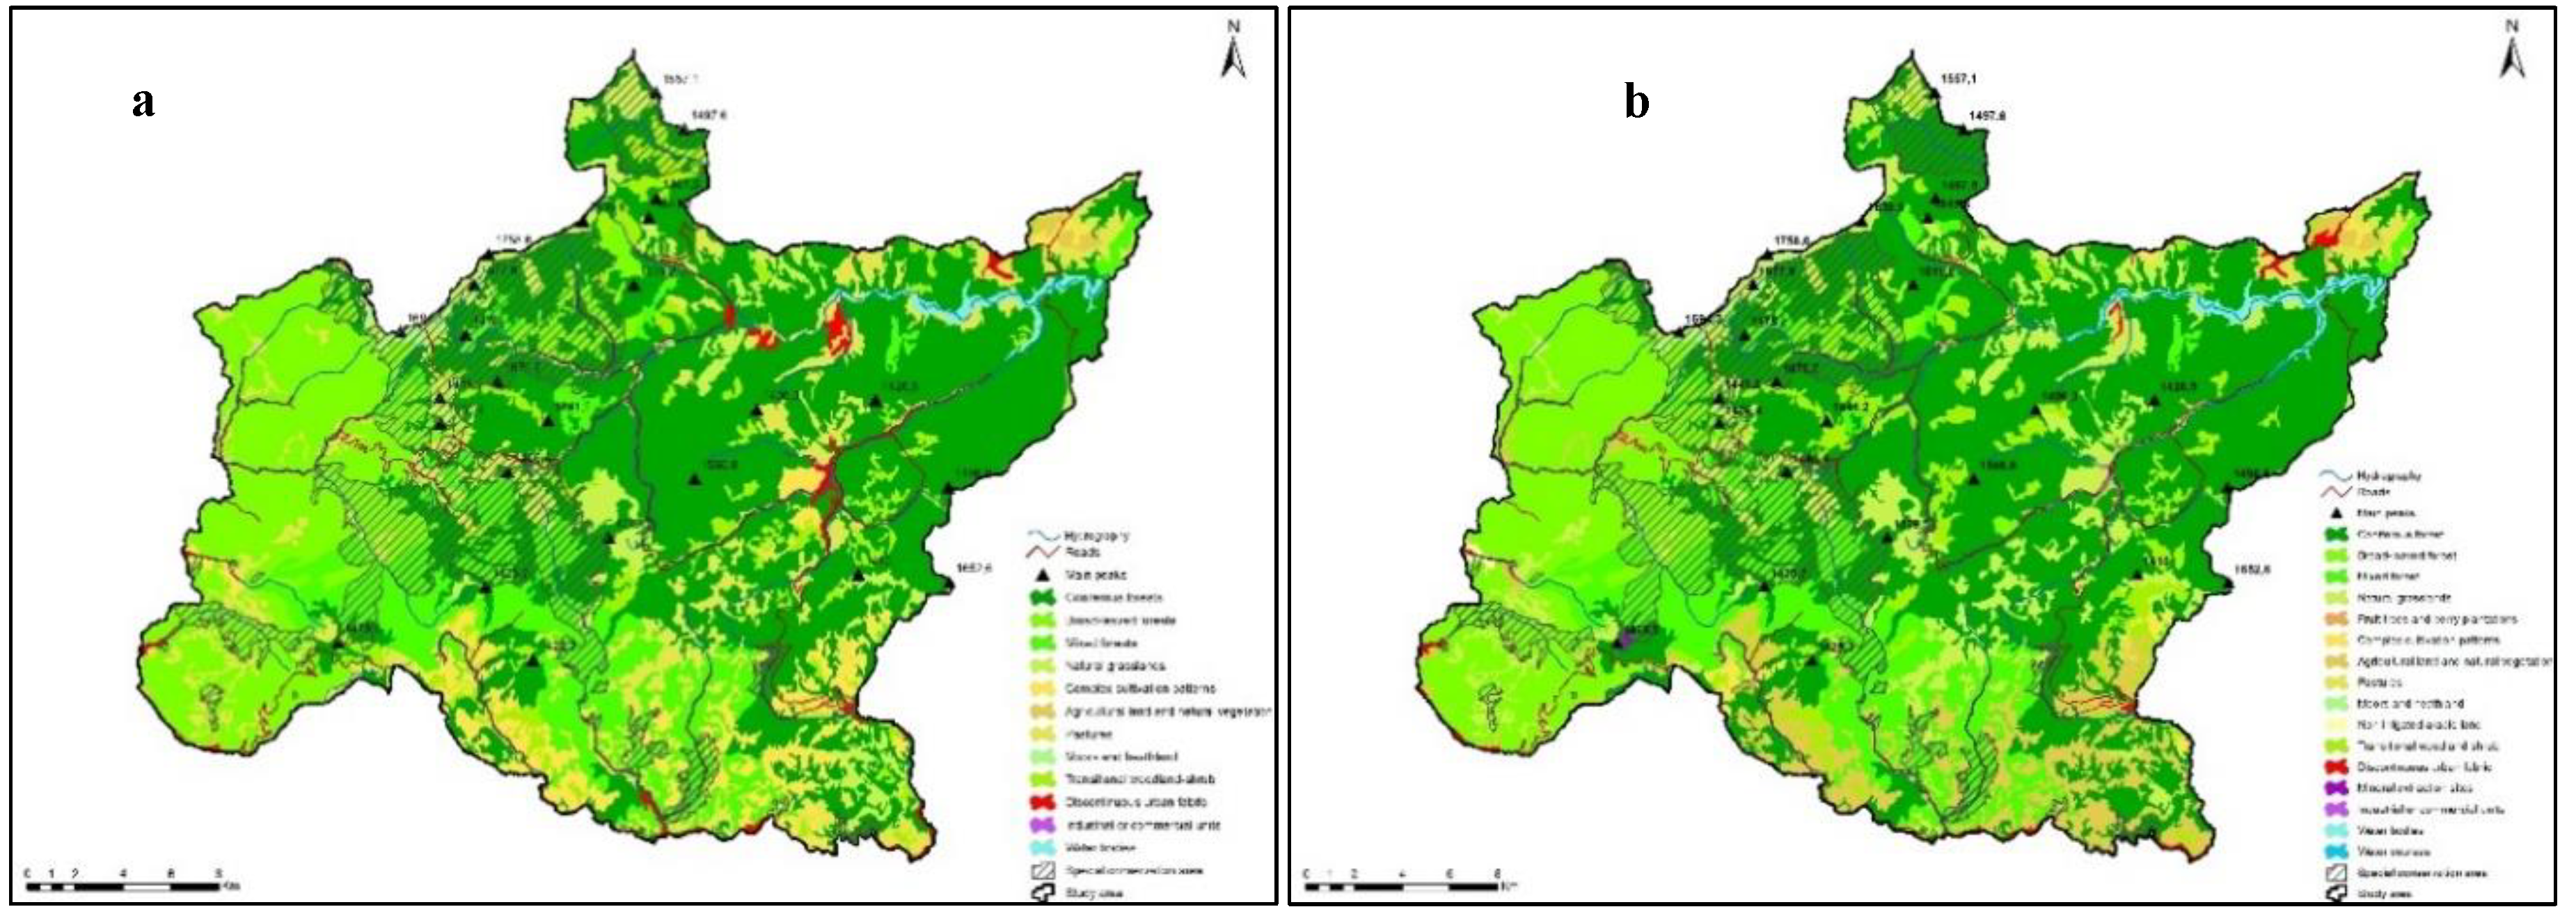
The analysis of the dynamics of land use in the Apuseni Natural Park was performed by comparing the information provided by the CORINE Land Cover databases from 1990 and 2018 (Figure 4).
The purpose of this approach is to highlight the changes both from the perspective of the spatial distribution of the land use categories, as well as from their percentage distribution. There were identified 12 types of land use/cover categories in 1990, respectively 16 in 2018, due to the establishment of the following categories: fruit trees and berry plantations, watercourses, mineral extraction sites and non-irrigated arable land.
Overall, it is noted that the percentage of most of the land use categories is similar for both analyzed periods and the natural surfaces are the ones predominating, covering more than 90%. The main differences can be identified from the perspective of their spatial distribution. Forests occupy the largest area at both times, of approximately 74% (73.58% in 1990; 74.22% in 2018), with the predominance of the coniferous ones (44.13 in 1990; 44.87 in 2018), followed by the broad-leaves forests (16.81% in 1990; 16.75 in 2018) and mixed ones (12.64 in 1990; 12.6 in 2018). There are slight changes in the rest of the categories, especially regarding pastures, agricultural land and natural vegetation, complex cultivation patterns and natural grassland. Thus, the pastures registered a significant decrease in the mentioned interval, from 8.79% in 1990, to 1,1% in 2018, on the background of the limitation of grazing activities in the special conservation areas within the Apuseni National Park, according to MO 552/26.08.2003. Moreover, the distribution of complex cultivation patterns decreased from 5.88% in 1990, to 0.67% in 2018, while the distribution of natural grassland and arable land with natural vegetation has increased considerably, in both cases being registered an increase of approximately 6%. The rest of each categories within the study area have weights below 1% in both analyzed moments, summing approximately 1.39% in 1990, respectively 1.85% in 2018.
The analysis of the spatial distribution of land use categories highlights that the changes are more pronounced than from the quantitative one, so that there can be identified several structural conversions between 1990 and 2018. There is a fragmentation of the plots with coniferous forests, in the central and eastern part of the study area, on the background of the appearance of some surfaces from the category of transitional woodland-shrub, that are deforested. On the other hand, the expansion of a plot with coniferous forests can be observed in the northern and southwestern part of the area, replacing deforested surfaces. Besides, it can be identified the disappearance of some inhabited areas, especially in the proximity of the Someșul Cald River, due to the accentuated depopulation that characterizes the settlements in the Apuseni Natural Park.

3.2. Evaluation of the forest dynamics

The analysis of deforested areas between 2001-2022, according to the data downloaded from the Global Forest Watch (https://www.globalforestwatch.org/) shows the extensive damage of the forest vegetation recorded at the level of the entire investigated territorial system. However, there can be identified a series of isolated areas where significant changes have occurred (Figure 5). This has direct consequences on the functionality and resilience of the social-ecological system, by affecting its biological diversity and by increasing flood vulnerability for communities with housing located near watercourses.
The reduction of forest areas is mainly caused by abusive and illegal forest exploitation. Nevertheless, there is information [36] that mentions other causes, associated with natural hazards intensified due to climate change (for example, in the period 2006-2007, approximately 30% of the total deforestation occurred on the background of a strong wind throw from 2006, which affected over 200 000 cubic meter of spruce trees).
The northern half of the study area is the most affected by deforestation and there can be identified hot spots with affected areas throughout the whole analyzed period. This situation is highlighted by the increase in the fractal dimension of the plots, the high degree of landscape fragmentation [99] and the decrease in the internal connectivity of the regional ecosystem. Besides, it is important to mention that some areas with significant deforestation, produced in the period 2001-2022, are located in the special conservation area of the Apuseni Natural Park, where, according to the legislation in place, forest exploitation activities are strictly prohibited, since they have a direct impact on basic habitats.
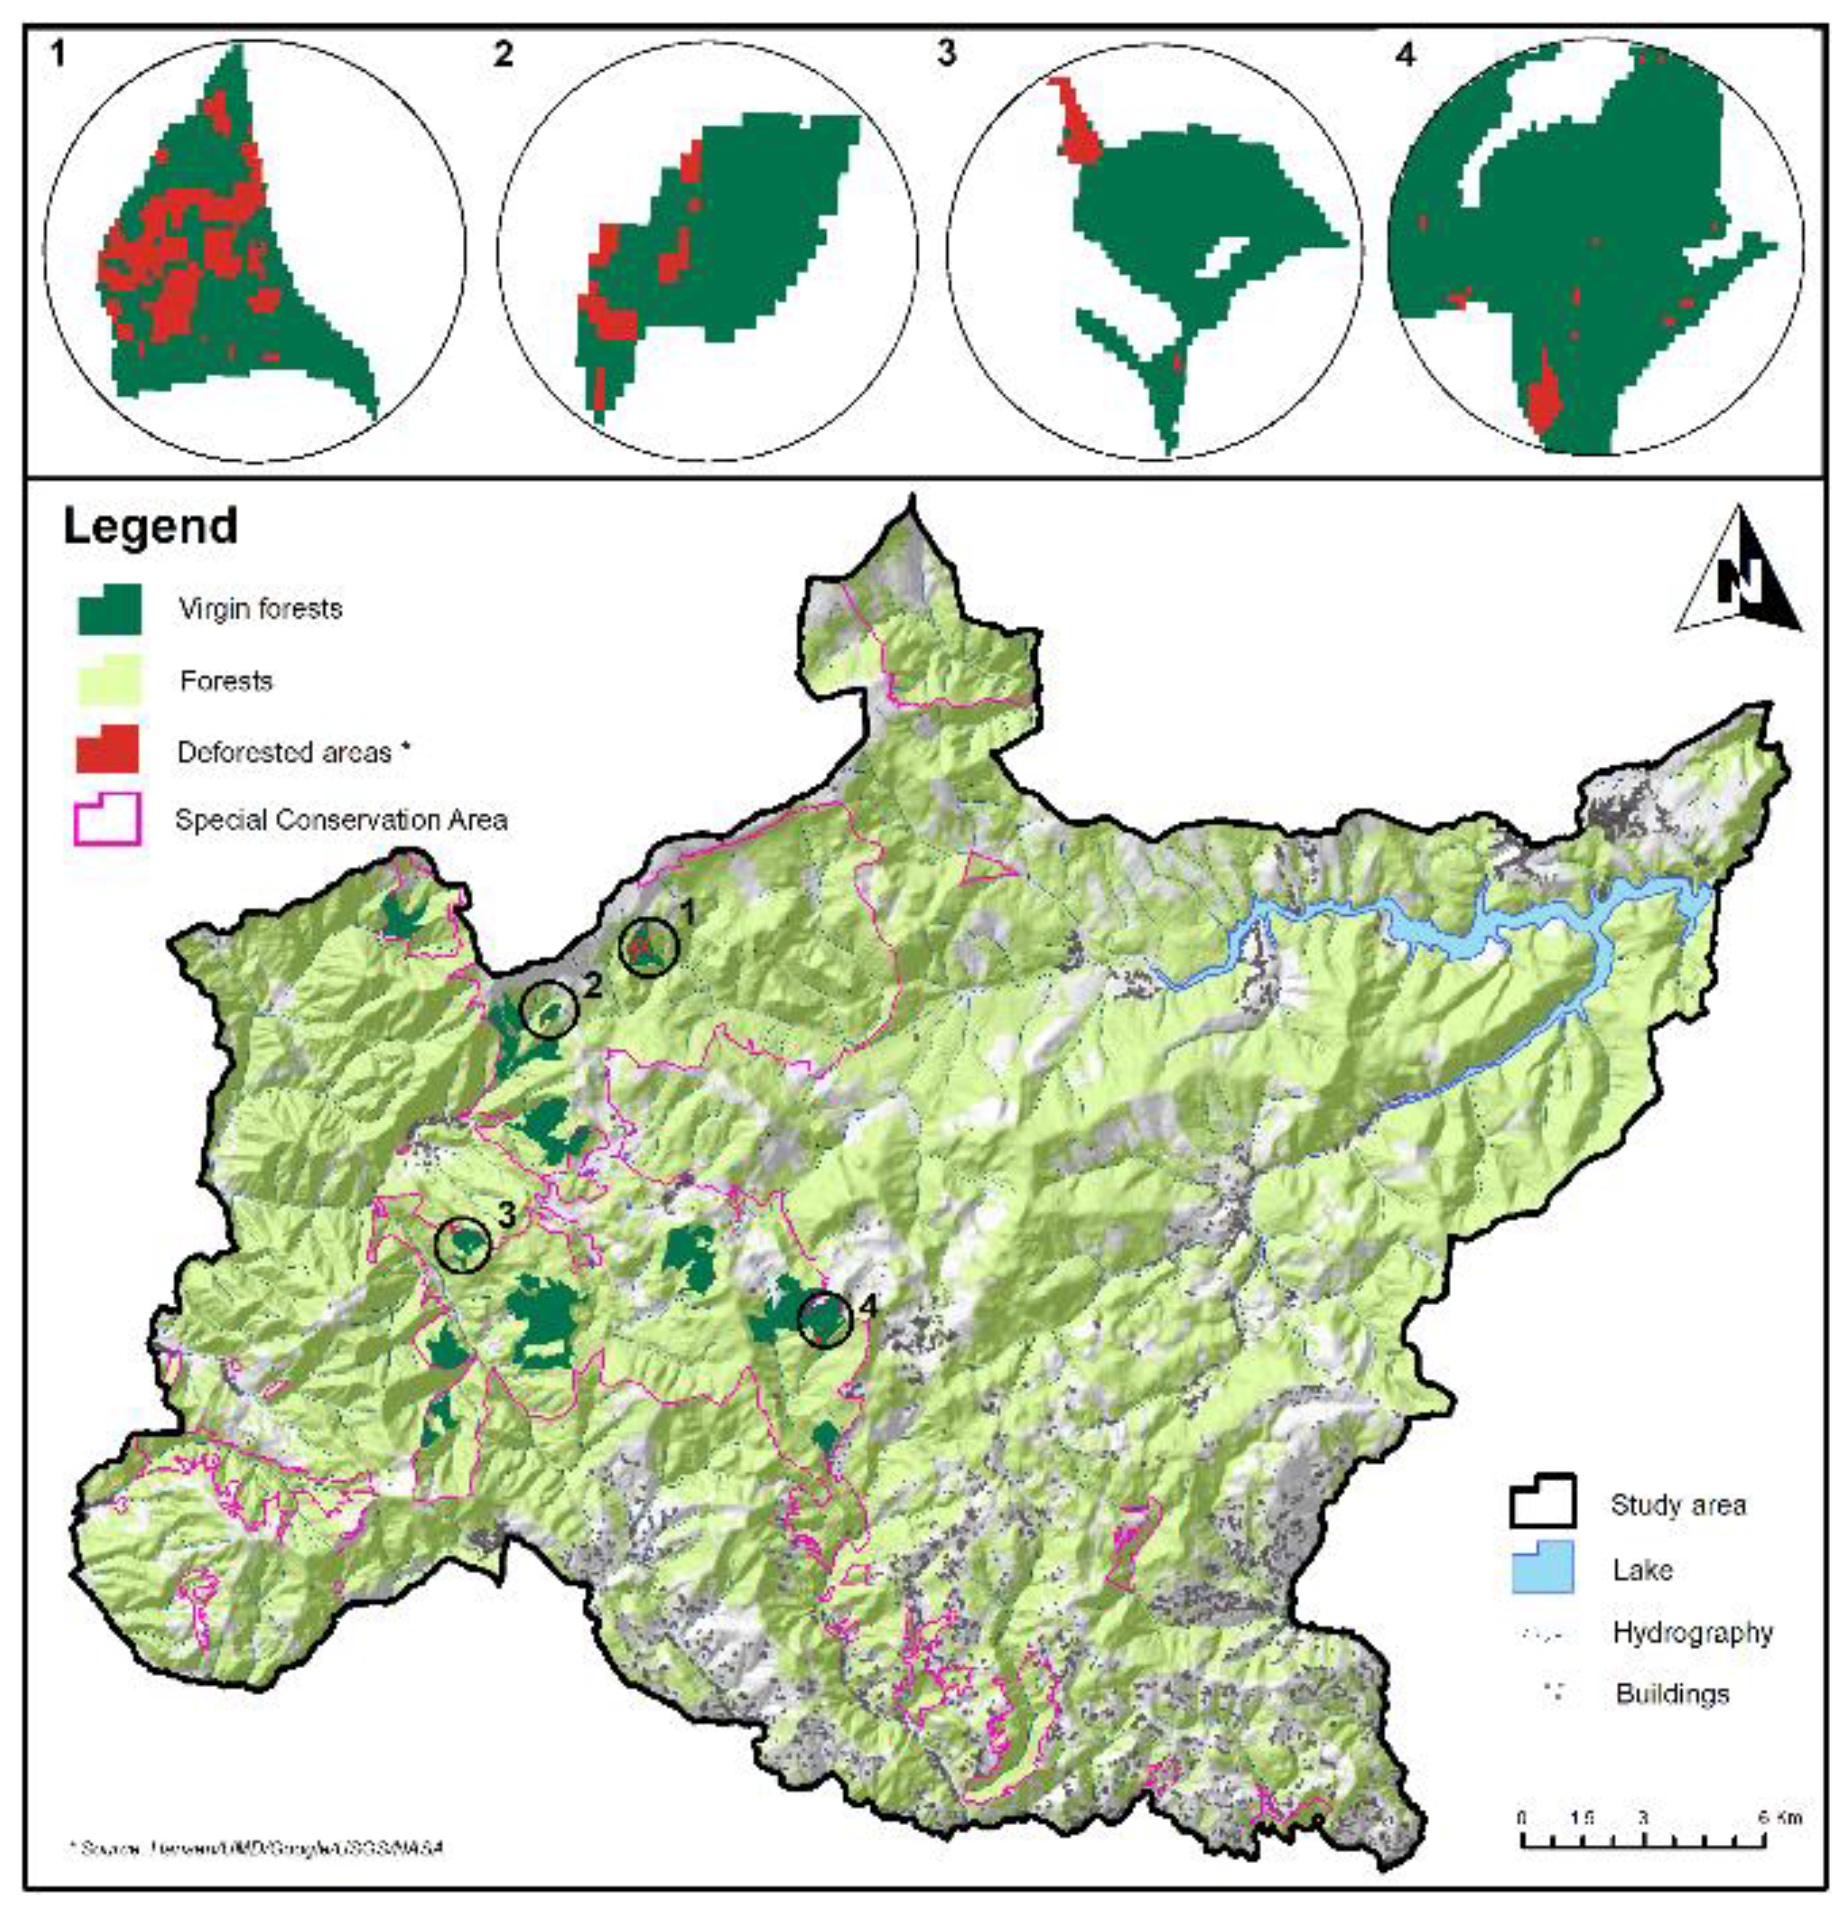
The analysis of the spatial distribution of virgin forests in the study area provides information on zones with minimal anthropogenic impact, where the natural factor has imprinted the defining characteristics of the landscape. The total area of the virgin forests in the Apuseni Natural Park is of approximately 282 ha. These forests are located in hard-to-reach areas from the special conservation area (Figure 6), where human anthropogenic forestry activities are prohibited. However, there have been identified hot spots with significant areas of virgin forests affected by deforestation, that endanger the integrity and functionality of forest ecosystems [113] and can even cause their disappearance over time, as a result of the failure to comply with regulations regarding protected area and violation of forestry legislation.

3.3. Building density and distribution by altitude

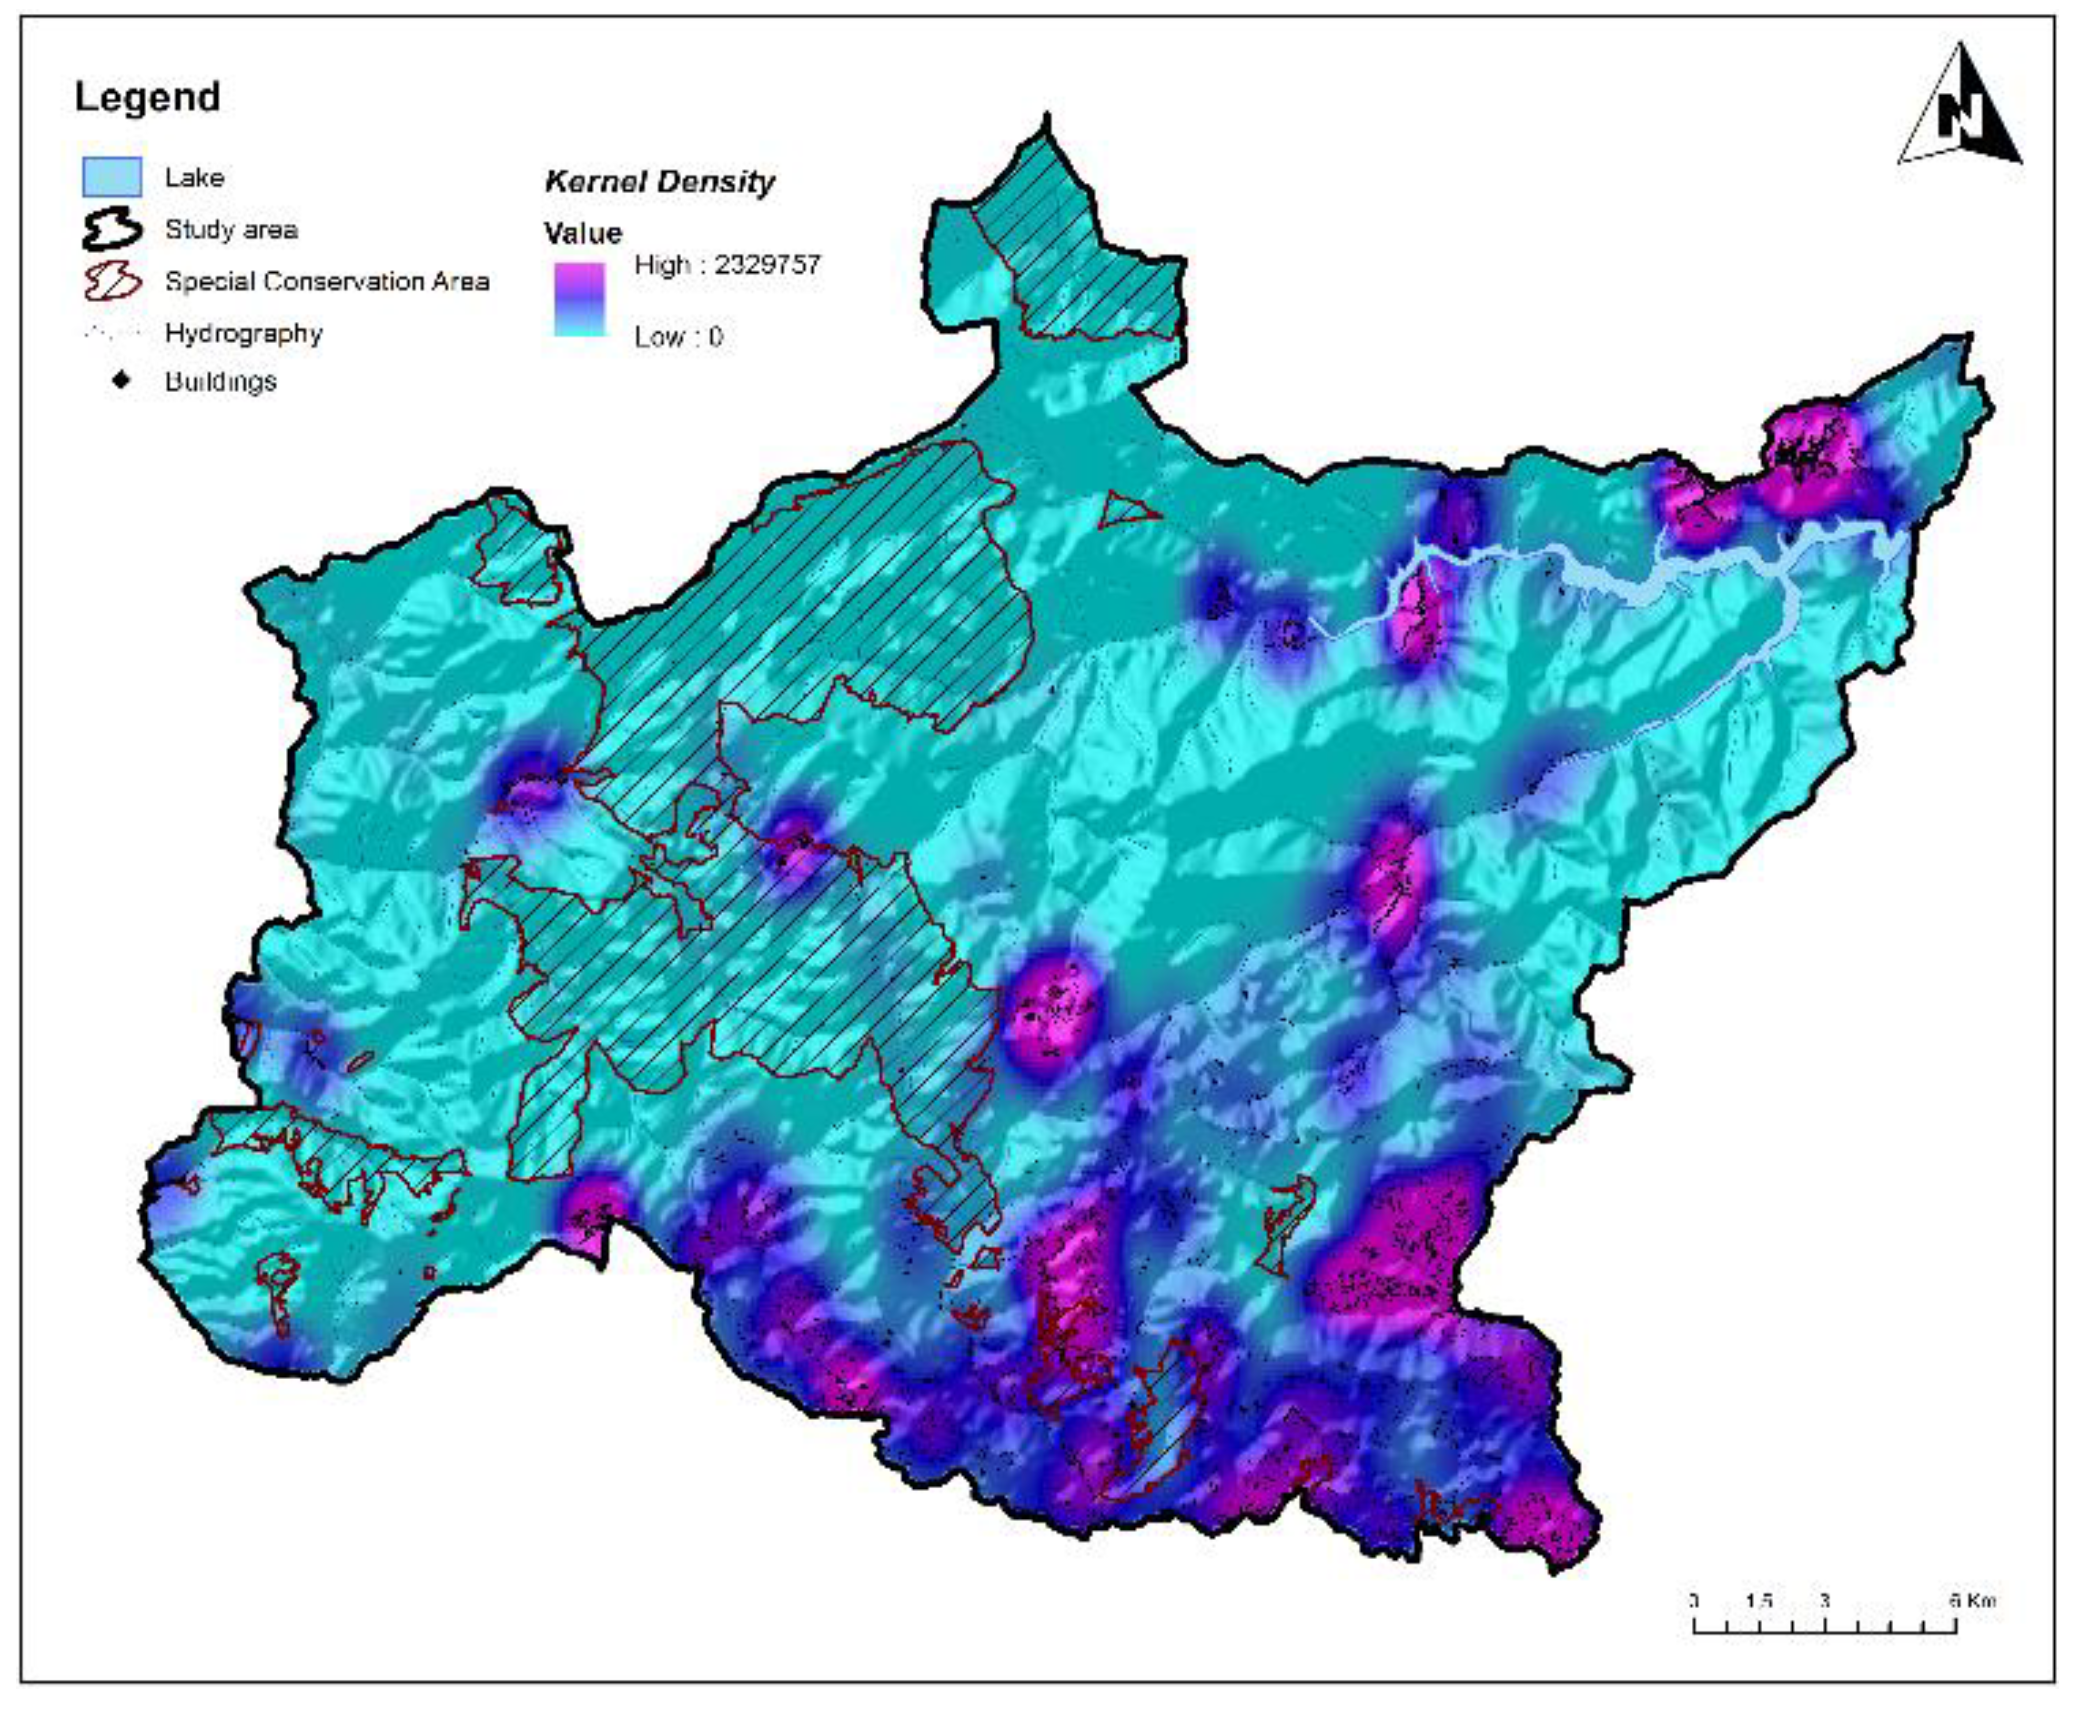
The building density in the study area provides information regarding the anthropogenic impact and the shaping of the landscape according to the needs of the local communities. The highest concentration of buildings is spatially identified in the south of the system, where the villages with the highest population are located. This concentration is also associated with the highest pressure on biodiversity and on the balance of ecological systems (Figure 7). The uneven spatial distribution of buildings is caused by the peculiarities induced by the morphology of the mountain relief, which determined the formation of specific settlements, characterized by households scattered on the slopes (called ”groves”), that have a high dispersion index and low territorial accessibility. Isolated areas with a high concentration of buildings can be identified in the northeast and west, while in the special conservation area there are few buildings, this space being mainly unaffected by human impact. The zones without buildings occupy large areas of the analyzed system, due to the fact that this is a protected area where the natural and semi-natural factors predominate.
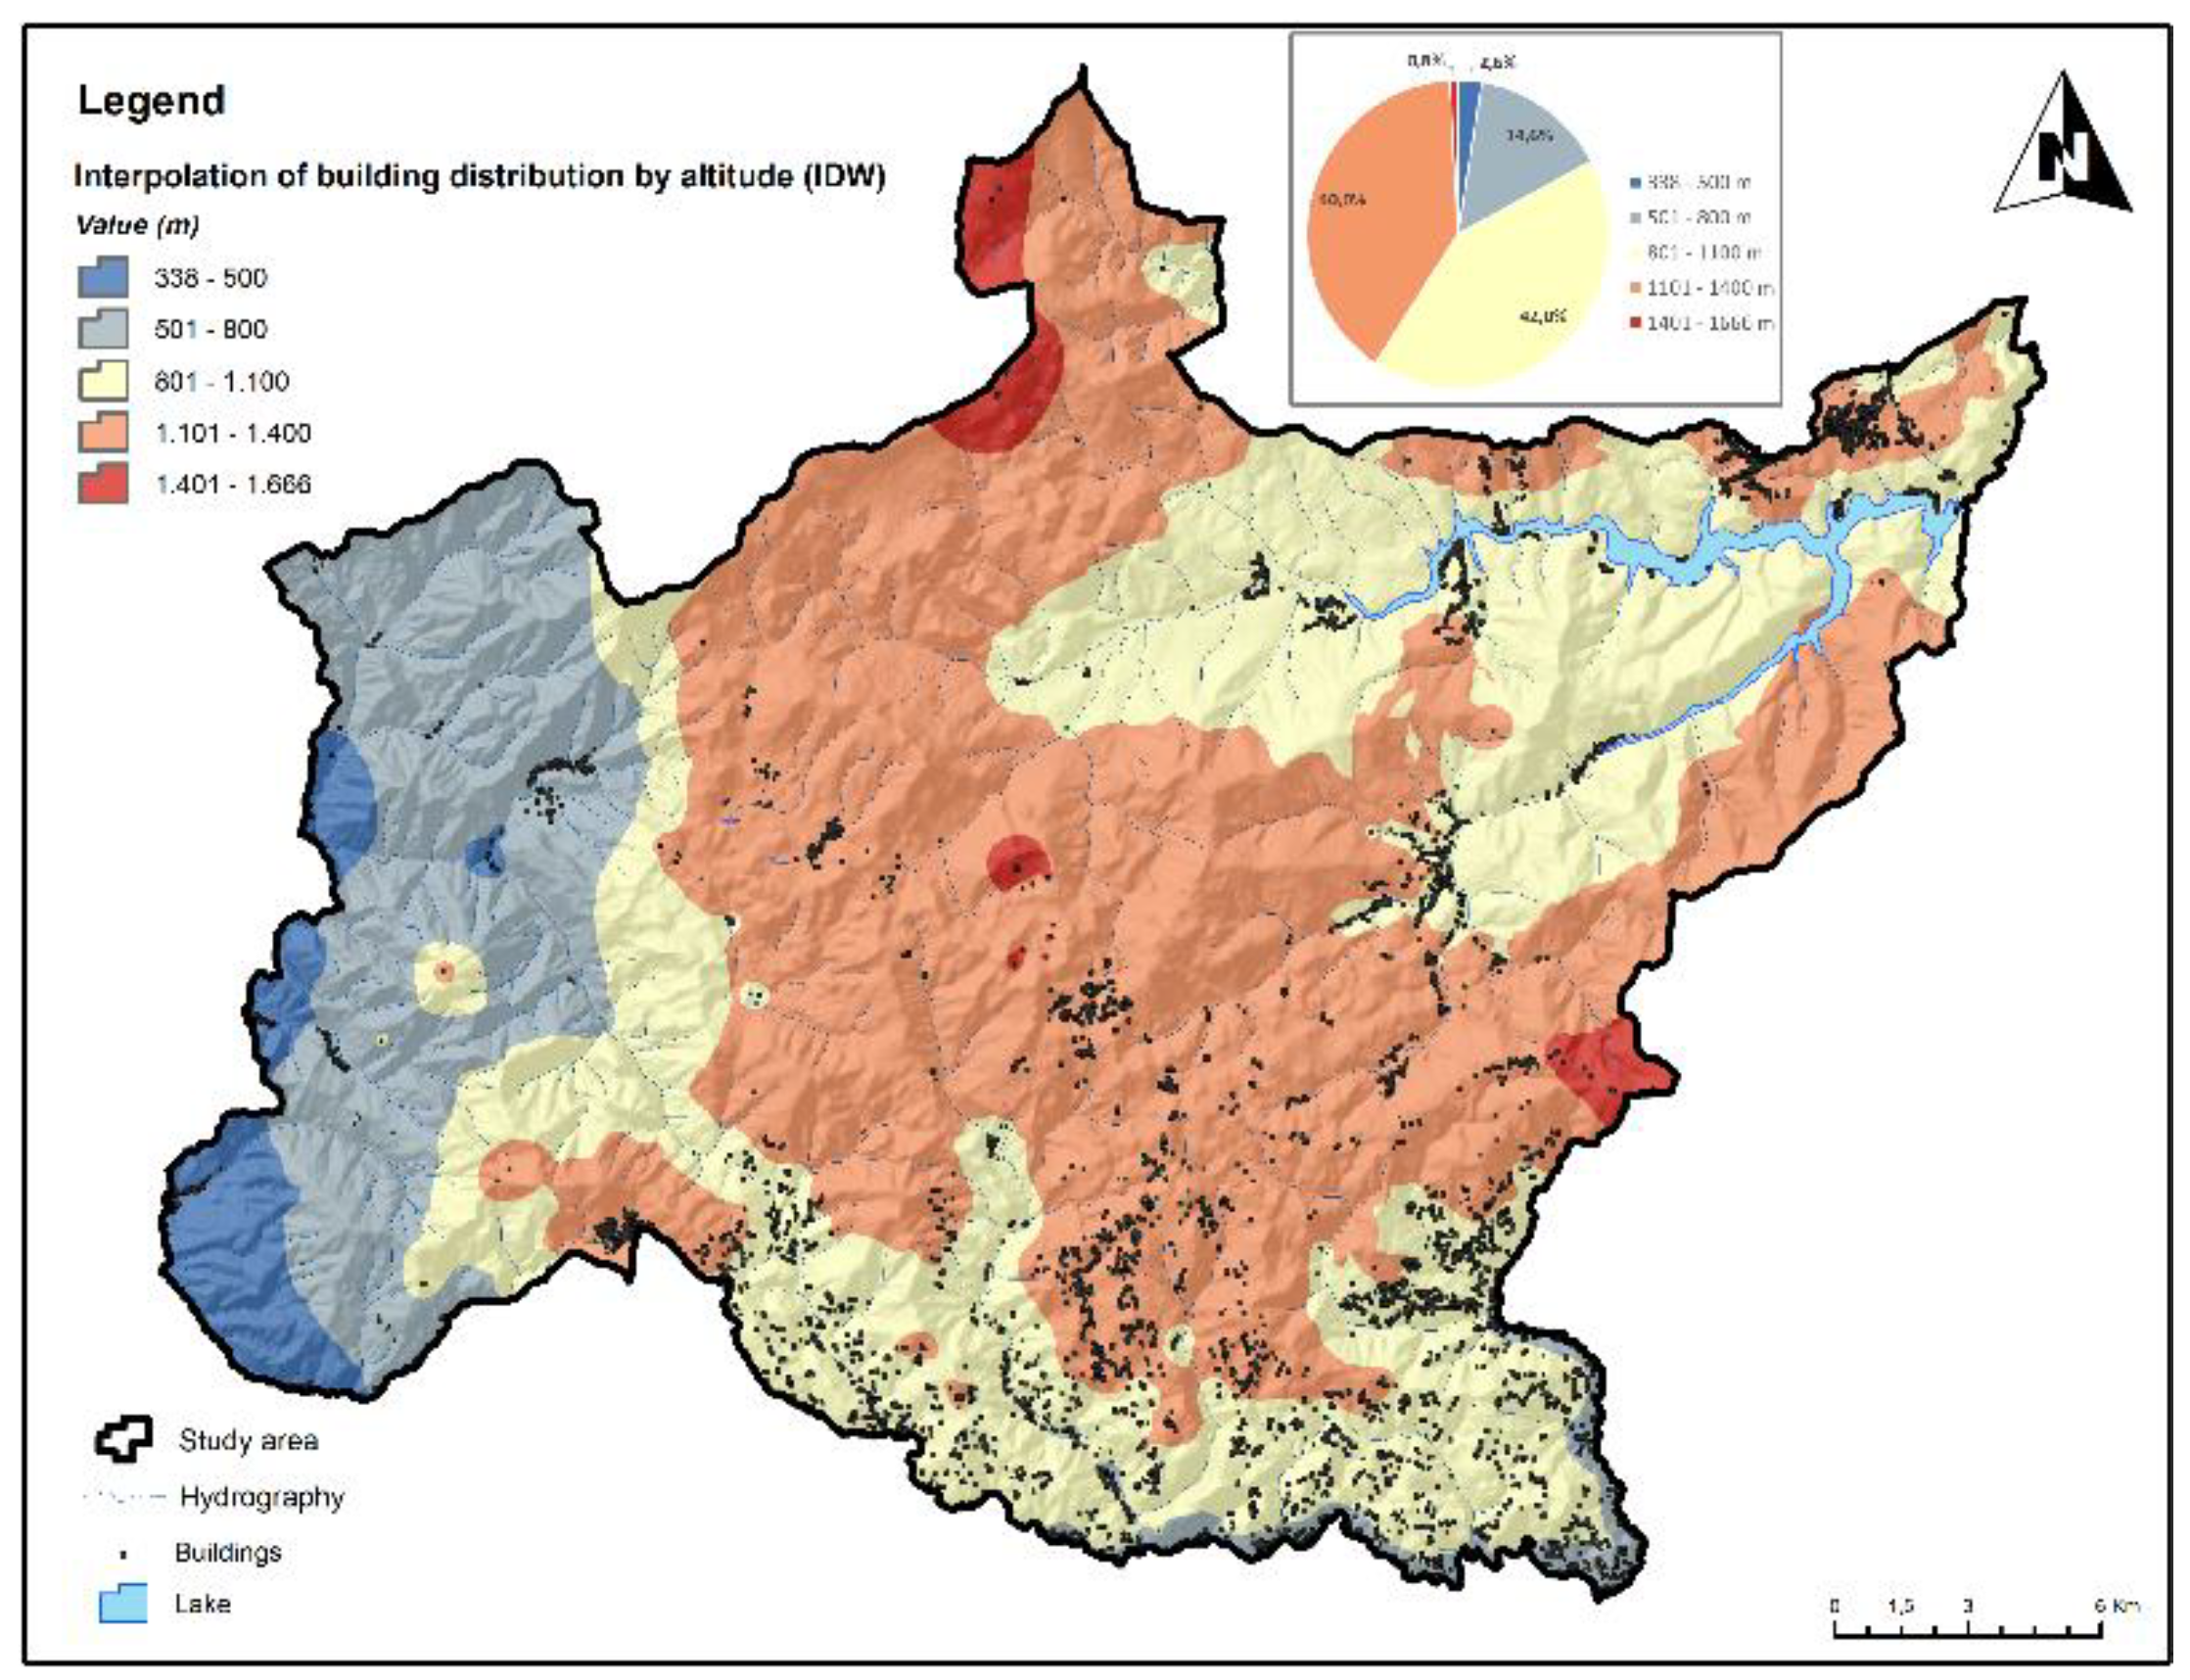
The map of building distribution by altitude highlights a series of peculiarities induced by the conditions imposed by the configuration of the relief and the adaptability of the human factor. A significant surface, of about 42% of the total, is occupied by the altitude interval between 801-1100 m, which coincides with the branched morpho-hydrographic corridors of the two most important hydrographic courses from the study area, Arieș and Someșul Cald rivers, spatially identified in the south and northeast parts (Figure 8). The following altitude interval from the perspective of the spatial distribution is the one between 1101-1400 m (40%), which corresponds to the settlements located on the level tops of the slopes, being mainly extended in the center of the study area. The highest values of this index, over 1400 m, occupy less than 1% and are located on isolated areas, in the north, center and east of the system, being mainly characterized by the presence of buildings with a temporary function, specific to the main economic activities in the area, respectively forestry and animal husbandry. The lowest values of this index are mainly located in the western part of the study area.

3.4. Biocultural resilience index (BRI)

Next, we will present and interpret the results obtained by applying the biocultural resilience level assessment tool, according to the methodology described in the previous section. The map of sustainability of multifunctional landscapes (Figure 9) shows a close-up view of the degree of resilience and functionality of landscapes, highlighting the complex interactions between natural and human factors and providing important guidelines for sustainable resource management and biodiversity conservation. In this regard, spatial data processing, based on complex parameter analysis equations, allowed the calculation of the biocultural resilience index (BRI) and the spatial differentiation of its values into 5 categories, as following:
a. Very low biocultural resilience - characterizes communities or ecosystems that have an extremely low capacity to adapt to environmental changes or disturbances. This could reflect a severe lack of resources, limited access to essential services (such as household water supply or health services), lack/poor development of basic infrastructure and high vulnerability to natural or social disasters. The communities in this category could be at increased risk of poverty, low quality of life and environmental degradation, while having a low level of awareness and adaptive capacity.
b. Low biocultural resilience - indicates a limited but existing ability to adapt to various changes and critical situations. Communities may have access to some essential resources and services, but these may be insecure or limited in the long run. Besides, these communities are partially exposed to various risks of moderate intensity or may face certain effects caused by the environmental impact, such as soil degradation or decrease in biodiversity. Overall, the capacity to plan and respond to climate or social change is low.
c. Medium biocultural resilience - it is specific to social-ecological systems that have a moderate capacity to adapt to various disturbances and imbalances of the environment. These systems may have access to a diverse range of essential resources and services and can be better prepared to deal with external pressures. The capacity for planning and cooperation among the community members can be more developed, which allows a more effective response to change. However, there may still be vulnerabilities and risks associated with phenomena such as climate change, environmental degradation or loss of cultural identity that may affect the stability and functioning of these systems.
d. High biocultural resilience - expresses a significant capacity to adapt and resist environmental changes and pressures. The communities or ecosystems that belong to this category may have access to varied and sustainable resources, the territorial systems preserve identity structures and have an appropriate way of resource management. They may also be able to adjust their activities in sustainable development processes, protect the environment from risks and sustainably preserve their resources.
e. Very high biocultural resilience - includes the category of communities or ecosystems characterized by reaching high levels of adaptability, functionality and sustainability. They possess strong socio-cultural systems and traditional practices that enable them to effectively adapt to changes and responsibly protect the environment. Moreover, they have a rich background of biodiversity and the landscapes are characterized by the highest values of the indices of sustainability and biocultural resilience.

4. Discussion and Conclusions

The present research proposes an analysis model of social-ecological systems from the perspective of a new index, the biocultural resilience index (BRI), which represents a synthetic measure of the capacity of a territorial system to adapt and respond to changes and disturbances in the environment, especially in the context of the interactions between natural and human factors. This index integrates a diverse range of relevant variables and indicators to the assessment of the sustainability of multifunctional landscapes, including ecological, social, cultural and spatial features. By calculating this index, researchers can gain a deeper understanding of the level of biocultural resilience of landscapes and identify areas of high vulnerability [114] or low potential for adaptation and sustainability in the face of environmental and social changes [115,116].
The method for calculating the biocultural resilience index involves normalizing and weighting relevant data on natural factors (such es forest distribution, biodiversity) and human factors (such as building density, accessibility of services), followed by combining the values to calculate an aggregated index. At the same time, the analysis also included combined sets of spatial data resulting both from the processing of satellite images over an extended time interval, as well as based on calculations performed through several analytical procedures in GIS environment [117,118,119]. Besides, in the context of carrying out the operations necessary for the present research, spatial analysis was also used, which allowed various quantitative comparisons under territorial aspect between all the elements that compose the analyzed mountain system.
The multitude of the analyzed parameters (biophysical indices, socio-cultural in-dices, spatial accessibility and connectivity indices, landscape transformation indices), along with the heterogeneity of the quantified variables [120] and the complexity of the working techniques, attribute a certain transdisciplinary dimension to the research carried out. From our point of view, this aspect has a significant contribution to strengthening the applied role of profile research, expanding the multidimensional perception of differentiated reality [121,122] and mitigating interdisciplinary asperities.
The biocultural resilience index (BRI) provides a measure of the ability of landscapes to adapt and resist change, providing essential information for sustainable resource management and biodiversity conservation. By using this index, we can provide a conceptual and practical framework for protecting and preserving biodiversity and the ecological and social functions of landscapes. By assessing the biocultural resilience, the ability of landscapes to adapt to anthropogenic and natural changes and pressures can be identified, thus contributing to the development of appropriate strategies and actions for the conservation and sustainable management of natural and cultural resources. Moreover, biocultural resilience can provide guidance for promoting sustainable development that balances the social, economic and ecological needs of local communities, helping to maintain the health [123] and stability of ecosystems and the quality of human life [124,125] within multifunctional landscapes.
Observing the changes over time within the landscapes and communities in the analyzed territory, we note that the need to protect and preserve areas of high ecological value is crucial for maintaining the resilience and functioning of multifunctional landscapes. These areas are key elements in the assessment of territorial sustainability and in ensuring biodiversity, contributing significantly to the ability of ecological systems to adapt to environmental and social changes. By monitoring and preserving them properly, the ecosystem services provided by these landscapes can be protected and enhanced, thus ensuring the prosperity and well-being of human communities and the environment.
In front of increasing pressures generated by urbanization, climate change and the excessive exploitation of natural resources, the sustainability of landscapes has become an urgent priority for their durable management and for protecting the benefits they offer to society.
A fragmented approach that targets only ecological [126,127,128,129] or cultural features is insufficient to reflect the degree of complexity and interconnection of these multifunctional landscapes. Thus, there is an urgent need for tools and methods that integrate these aspects into a unique and comprehensive analytical framework.
The evaluation of sustainability of multifunctional landscapes by using the biocultural resilience index (BRI) is useful in identifying discrete relationships or anticipating the vulnerability of social-ecological and territorial systems, helping to make more informed decisions and to develop more effective strategies in various fields of application.

5. Future Research Trends

The BRI catalyzes interdisciplinary exploration, encouraging advancements in region-specific adaptations, longitudinal resilience assessments [130], policy integration [130], and technological enhancements for comprehensive landscape sustainability analyses.

6. Methodological Limitations

The effectiveness of the BRI is contingent on high-quality, multi-dimensional data, with challenges including subjective weight allocations, the necessity for high-resolution spatial-temporal data, and the intricacies of integrating diverse disciplinary insights into its framework.

Author Contributions

Conceptualization, V.G. and A.C.; methodology, V.G. and M.A.; software, A.C., V.G. and M.A.; validation, M.D.; formal analysis, V.G., M.A.; investigation, V.G.; resources, A.C.; data curation, M.D.; writing—original draft preparation, A.C. and V.G.; writing—review and editing, E.-A.N.; visualization, E.-A.N.; supervision, M.D.; project administration, A.C. and V.G.; funding acquisition, A.C. All authors have read and agreed to the published version of the manuscript. All authors contributed equally to the research presented in this paper and to the preparation of the final manuscript.

Funding

This research received no external funding.

Conflicts of Interest

The authors declare no conflicts of interest.

References

  1. Cusens, J., Barraclough, A.M.D., Måren, I.E. Participatory mapping reveals biocultural and nature values in the shared landscape of a Nordic UNESCO Biosphere Reserve. People and Nature 2022, 4, 365-381. https://doi.org/10.1002/pan3.10287. [CrossRef]
  2. Polce, C., Maes, J., Brander, L., Cescatti, A., Baranzelli, C., Lavalle, C, Zulian, G. Global change impacts on ecosystem services: a spatially explicit assessment for Europe. One Ecosystem 1: e9990 2016. https://doi.org/10.3897/oneeco.1.e9990. [CrossRef]
  3. Ruckelshaus, M.H., Jackson, S.T., Mooney, H.A., Jacobs, K.L., Kassam, K.-A.S., Arroyo, M.T.K., Báldi, A., Bartuska, A.M., Boyd, J., Joppa, L.N., Kovács-Hostyánszki, A., Parsons, J.P., Scholes, R.J., Shogren, J.F., Ouyang, Z. The IPBES global assessment: pathways to action. Trends in Ecology & Evolution 2020, 35(5), 407-414. [CrossRef]
  4. Nowak-Olejnik, A., Schirpke, U., Tappeiner, U. A systematic review on subjective well-being benefits associated with cultural ecosystem services. Ecosystem Services 2022, 57, 101467. [CrossRef]
  5. Lausch, A., Erasmi, S., King, D.J., Magdon, P., Heurich, M. Understanding forest health with remote sensing-part I-a review of spectral traits, processes and remote-sensing characteristics. Remote Sensing 2016, 8(12), 1029.
  6. Djomo, A.N., Grant, J.A., Fonyikeh-Bomboh Lucha, C., Tchoko Gagoe, J., Fonton, N.H., Scott, N., Sonwa, D.J. Forest governance and REDD+ in Central Africa: towards a participatory model to increase stakeholder involvement in carbon markets. International Journal of Environmental Studies 2018, 75(2), 251-266. [CrossRef]
  7. Seidl, R., Turner, M.G. Post-disturbance reorganization of forest ecosystems in a changing world. Proceedings of the National Academy of Sciences 2022, 119(28), e2202190119. [CrossRef]
  8. Krankina, O.N., Harmon, M.E., Winjum, J.K. Carbon storage and sequestration in the Russian forest sector. AMBIO-STOCKHOLM 1996, 25, 284-288.
  9. Luo, Y., Chen, H.Y. Observations from old forests underestimate climate change effects on tree mortality. Nature communications 2013, 4(1), 1655. [CrossRef]
  10. Hadziabdic, D., Hamelin, R.C., Stewart, J.E., Villari, C. Forest pathology in changing climate. Frontiers in Forests and Global Change 2022, 5, 1032035.
  11. Cozma, A.C., Coroș, M.M., Pop, A. M., Gavrilescu, I., Dinucă, N.C. Corruption, deforestation, and tourism - Europe case study. Heliyon 2023, 9(8). https://doi.org/10.1016/j.heliyon.2023.e19075. [CrossRef]
  12. Führer, E. Forest functions, ecosystem stability and management. Forest Ecology and management 2000, 132(1), 29-38. [CrossRef]
  13. Jebiwott, A., Ogendi, G.M., Agbeja, B.O., Alo, A.A., Kibet, R. Mapping the trends of forest cover change and associated drivers in Mau Forest, Kenya. Remote Sensing Applications: Society and Environment 2021, 23, 100586. [CrossRef]
  14. Brandt, J. Demands for future landscapes research on multifunctional landscapes. In Proceedings of the Conference on Multifunctional Landscapes-Interdisciplinary Approaches to Landscape Research and Management. Roskilde, October 2000 (pp. 18-21).
  15. Van Eetvelde, V., Antrop, M. Analyzing structural and functional changes of traditional landscapes-two examples from Southern France. Landscape and urban planning 2004, 67(1-4), 79-95.
  16. Farina, A. The cultural landscape as a model for the integration of ecology and economics. BioScience 2000, 50(4), 313-320. [CrossRef]
  17. Ellis, E.C. Ecology in an anthropogenic biosphere. Ecological Monographs 2015, 85(3), 287-331. [CrossRef]
  18. Plieninger, T., Draux, H., Fagerholm, N., Bieling, C., Bürgi, M., Kizos, T., Kuemmerle, T., Primdahl, J., Verburg, P.H. The driving forces of landscape change in Europe: A systematic review of the evidence. Land Use Policy 2016, 57, 204-214. https://doi.org/10.1016/j.landusepol.2016.04.040. [CrossRef]
  19. Wu, J. Key concepts and research topics in landscape ecology revisited: 30 years after the Allerton Park workshop. Landscape ecology 2013, 28, 1-11. [CrossRef]
  20. Ianăş, A.N., Germain, D. Quantifying landscape changes and fragmentation in a National Park in the Romanian Carpathians. Carpathian Journal of Earth and Environmental Sciences 2018, 13(1): 147-160. [CrossRef]
  21. Forman, R. T. Ecologically sustainable landscapes: the role of spatial configuration. In Changing landscapes: an ecological perspective (pp. 261-278). New York, NY: Springer New York, 1990.
  22. Wu, J. Landscape ecology, cross-disciplinarity, and sustainability science. Landscape ecology 2006, 21, 1-4.
  23. Forman, R. T. The urban region: natural systems in our place, our nourishment, our home range, our future. Landscape Ecology 2008, 23, 251-253. [CrossRef]
  24. Pătru-Stupariu, I., Stupariu, M.S, Tudor, C.A., Grădinaru, S.R., Gavrilidis A., Kienast, F., Hersperger A.M. Landscape fragmentation in Romania’s Southern Carpathians: testing a European assessment with local data. Landscape and Urban Planning 2015, 143, 1-8. [CrossRef]
  25. Wilson, G.A., Multifunctional Agriculture-A Transition Theory Perspective; CABI: Oxfordshire, UK, 2007.
  26. Vejre, H., Abildtrup, J., Andersen, E., Andersen, P.S., Brandt, J., Busck, A., Dalgaard, T., Hasler, B., Huusom, H., Kristensen, L.S., Kristensen, S.P., Præstholm, S. Multifunctional Agriculture and Multifunctional Landscapes-Land Use as an Interface. In Multifunctional Land Use: Meeting Future Demands for Landscape Goods and Services; Mander, Ü., Wiggering, H., Helming, K., Eds.; Springer: Berlin/Heidelberg, Germany; pp. 93-104. 2007. ISBN 978-3-540-36763-5.
  27. Peng, J., Hu, X., Qiu, S., Meersmans, J., Liu, Y. Multifunctional landscapes identification and associated development zoning in mountainous area. Science of the Total Environment 2019, 660, 765-775. [CrossRef]
  28. Cimpoca, A.-L., Voiculescu, M., Crețan, R., Voiculescu, S., Ianăș, A.-N. Living with Bears in Prahova Valley, Romania: An Integrative Analysis. Animals 2024, 14, 587. https://doi.org/10.3390/ani14040587. [CrossRef]
  29. Blumetto, O., Castagna, A., Cardozo, G., Ruggia, A., Scarlato, G.T., Garcia, F., Aguerre, V. (2016). Ecosystem Integrity Index: A New Tool for Ecosystem Services Evaluation in Livestock Production Systems, The Future Management of Grazing and Wild Lands in a High-Tech World. In Proceedings of the 10th International Rangeland Congress. Canada, 2016, 448-449.
  30. O’Farrell, P.J., Anderson, P.M. Sustainable multifunctional landscapes: a review to implementation. Current Opinion in Environmental Sustainability 2010. 2(1-2), 59-65. [CrossRef]
  31. Fagerholm, N., Torralba, M., Moreno, G., Girardello, M., Herzog, F., Aviron, S., Burgess, P., Crous-Duran, J., Ferreiro-Domínguez, N., Graves, A., Hartel, T., Măcicăsan, V., Kay, S., Pantera, A., Varga, A., Plieninger, T. Cross-site analysis of perceived ecosystem service benefits in multi-functional landscapes. Glob. Environ. Chang 2019, 56, 134–147.
  32. German, L. A., Karsenty, A., Tiani, A. M. (Eds.).Governing Africa's forests in a globalized world. Earthscan: London, UK, 2010.
  33. Jebiwott, A., Ogendi, G.M., Agbeja, B.O., Alo, A.A., Kibet, R. Mapping the trends of forest cover change and associated drivers in Mau Forest, Kenya. Remote Sensing Applications: Society and Environment 2021, 23, 100586.
  34. Oktan, E., Kezik, U., Hacisalihoglu, S., Yucesan, Z. Effects of Deforestation on Soil Erosion and Carbon Sequestration in the Soil. Fresenius Environ. Bull 2022, 31, 2239-2249.
  35. Corbera, E., Estrada, M., Brown, K. Reducing greenhouse gas emissions from deforestation and forest degradation in developing countries: revisiting the assumptions. Climatic change 2010, 100(3-4), 355-388. [CrossRef]
  36. Gauthier, S., Bernier, P., Kuuluvainen, T., Shvidenko, A.Z., Schepaschenko, D.G. Boreal forest health and global change. Science 2015, 349(6250), 819-822. [CrossRef]
  37. Fora, C.G., Balog, A. The effects of the management strategies on spruce bark beetles populations (Ips typographus and Pityogenes chalcographus), in Apuseni Natural Park, Romania. Forests 2021, 12(6), 760.
  38. Suorsa, P., Huhta, E., Nikula, A., Nikinmaa, M., Jäntti, A., Helle, H., Hakkarainen, H. Forest management is associated with physiological stress in an old-growth forest passerine. Proceedings of the Royal Society of London. Series B: Biological Sciences 2003, 270(1518), 963-969. [CrossRef]
  39. He, M., Cliquet, A. Challenges for protected areas management in China. Sustainability 2020, 12(15), 5879. [CrossRef]
  40. Acheson, J. M., McCloskey, J. Causes of deforestation: The Maine case. Human ecology 2008, 36, 909-922. [CrossRef]
  41. Rachmawan, I. E. W., Kiyoki, Y. Semantic analysis of deforestation soil effect using multispectral reflectance. In 2016 International Electronics Symposium (IES), September 2016, (pp. 363-368). IEEE.
  42. FAO (Food and Agriculture Organization), 2020 Global Forest Resources Assessment 2020 (Rome: FAO) (available at: https://doi.org/10.4060/ca8753en). [CrossRef]
  43. Houghton, R. A. Tropical deforestation as a source of greenhouse gas emissions. Tropical deforestation and climate change 2005, 13.
  44. Blackman, A. Evaluating forest conservation policies in developing countries using remote sensing data: An introduction and practical guide. Forest Policy and Economics 2013, 34, 1-16. [CrossRef]
  45. Strandberg, G., Kjellström, E., Poska, A., Wagner, S., Gaillard, M.-J., Trondman, A.-K., Mauri, A., Davis, B.A.S., Kaplan, J.O., Birks, H.J.B., Bjune, A.E., Fyfe, R., Giesecke, T., Kalnina, L., Kangur, M., Van Der Knaap, W.O., Kokfelt, U., Kuneš, P., Latałowa, M., Marquer, L., Mazier, F., Nielsen, A.B., Smith, B., Seppä, H., Sugita, S. Regional climate model simulations for Europe at 6 and 0.2 k BP: sensitivity to changes in anthropogenic deforestation. Climate of the Past 2014, 10, 661–680. https://doi.org/10.5194/cp-10-661-2014. [CrossRef]
  46. Yamamoto, Y., Matsumoto, K.I. The effect of forest certification on conservation and sustainable forest management. Journal of Cleaner Production 2022, 363, 132374. [CrossRef]
  47. Bradshaw, C.J., Sodhi, N.S., PEH, K.S.H., Brook, B.W. Global evidence that deforestation amplifies flood risk and severity in the developing world. Global Change Biology 2007, 13(11), 2379-2395. [CrossRef]
  48. Corbera, E., Estrada, M., Brown, K. Reducing greenhouse gas emissions from deforestation and forest degradation in developing countries: revisiting the assumptions. Climatic change 2010, 100(3-4), 355-388. [CrossRef]
  49. La Vina, A., de Leon, A.M. Two global challenges, one solution: international cooperation to combat climate change and tropical deforestation. Center for Global Development Working Paper 2014, (388).
  50. Baccini, A., Walker, W., Carvalho, L., Farina, M., Sulla-Menashe, D., Houghton, R.A. Tropical forests are a net carbon source based on aboveground measurements of gain and loss. Science 2017, 358(6360), 230-234. [CrossRef]
  51. Pendrill, F., Persson, U.M., Godar, J., Kastner, T. Deforestation displaced: trade in forest-risk commodities and the prospects for a global forest transition. Environmental Research Letters 2019, 14(5), 055003. https://doi.org/10.1088/1748-9326/ab0d41. [CrossRef]
  52. Swanson, M.E., Franklin, J.F., Beschta, R.L., Crisafulli, C.M., Dellasala, D.A., Hutto, R.L., Lindenmayer, D.B., Swanson, F.J. The forgotten stage of forest succession: early-successional ecosystems on forest sites. Frontiers in Ecology and the Environment 2011, 9, 117–125. https://doi.org/10.1890/090157. [CrossRef]
  53. Kuemmerle, T., Kaplan, J.O., Prishchepov, A.V., Rylsky, I., Chaskovskyy, O., Tikunov, V. S., Müller, D. Forest transitions in Eastern Europe and their effects on carbon budgets. Global change biology 2015, 21(8), 3049-3061. [CrossRef]
  54. Davin, E.L., Rechid, D., Breil, M., Cardoso, R.M., Coppola, E., Hoffmann, P., Jach, L.L., Katragkou, E., De Noblet-Ducoudré, N., Radtke, K., Raffa, M., Soares, P.M.M., Sofiadis, G., Strada, S., Strandberg, G., Tölle, M.H., Warrach-Sagi, K., Wulfmeyer, V. Biogeophysical impacts of forestation in Europe: first results from the LUCAS (Land Use and Climate Across Scales) regional climate model intercomparison. Earth System Dynamics 2020, 11(1), 183-200. https://doi.org/10.5194/esd-11-183-2020. [CrossRef]
  55. Hajabbasi, M.A., Jalalian, A., Karimzadeh, H.R. Deforestation effects on soil physical and chemical properties, Lordegan, Iran. Plant and soil 1997, 190, 301-308. [CrossRef]
  56. Falt’an, V.,Petrovic, F., Gábor, M., Šagát, V., Hruška, M. Mountain Landscape Dynamics after Large Wind and Bark Beetle Disasters and Subsequent Logging-Case Studies from the Carpathians. Remote Sens. 2021, 13, 3873. https://doi.org/ 10.3390/rs13193873. [CrossRef]
  57. Costea, A., Bilașco, Șt., Irimuș, I.-A., Roșca, S., Vescan, I., Fodorean, I., Sestraș, P., Evaluation of the Risk Induced by Soil Erosion on the Land Use. Case Study: Guruslău Depression. Sustainability 2022, 14(2), 652. https://doi.org/10.3390/su14020652. [CrossRef]
  58. Chomitz, K. M., Piet, B., Giacomo, D. L., Timothy, S.T., Sheila, W.K. At loggerheads? Agricultural expansion, poverty reduction and environment in the tropical forests. World Bank, Washington, D.C. 2007.
  59. Boțan, C.N., Gligor, V., Horvath, C., Fonogea, S.F. Land of Hațeg Identity and Regional Brands, Transylvanian Review 2019, Vol. XXVIII, Supplement No. 2, 183 – 198.
  60. Adorean, E.C., Nofre, J., Ilovan, O.-R., Gligor, V. Exploring nightlife in the university city of Cluj-Napoca (Romania): a mixed methods research study. Fennia 2020, 198(1-2), 180-195, https://doi.org/10.11143/fennia.90011. [CrossRef]
  61. Akumu, C.E., Amadi, E.O. Examining the Integration of Landsat Operational Land Imager with Sentinel-1 and Vegetation Indices in Mapping Southern Yellow Pines (Loblolly, Shortleaf, and Virginia Pines). Photogrammetric Engineering & Remote Sensing 2022, 88(1), 29–38. https://doi.org/10.14358/pers.21-00024r2. [CrossRef]
  62. Forkuo, E.K. Frimpong, A. Analysis of Forest Cover Change Detection. Int. J. Remote Sens. Appl. 2012, 2, 82–92.
  63. Miller, A.B., Bryant, E.S., Birnie, R.W. An analysis of land cover changes in the Northern Forest of New England using multitemporal Landsat MSS data. International journal of remote sensing 1998, 19(2), 245-265. [CrossRef]
  64. Cohen, W.B., Spies, T.A., Alig, R.J., Oetter, D.R., Maiersperger, T.K., Fiorella, M. Characterizing 23 years (1972–95) of stand replacement disturbance in western Oregon forests with Landsat imagery. Ecosystems 2002, 5, 122-137. [CrossRef]
  65. Yang, C., Huang, H., Han, S., Ni, J. Correlation analysis between forest volume and LANDSAT TM data based on sub-compartment objects. In 2013 IEEE International Geoscience and Remote Sensing Symposium-IGARSS July 2013, (pp. 1721-1724). IEEE.
  66. Jiao, Q., Zhang, X., Sun, Q. Detecting of forest afforestation and deforestation in Hainan Jianfengling Forest Park (China) using yearly Landsat time-series images. In MIPPR 2017: Remote Sensing Image Processing, Geographic Information Systems, and Other Applications March 2018 (Vol. 10611, pp. 311-315). SPIE.
  67. Blaga, L., Ilies, D.C., Wendt, J.A., Rus, I., Zhu, K., Dávid, L.D. Monitoring Forest Cover Dynamics Using Orthophotos and Satellite Imagery. Remote Sens 2023, 15, 3168. https://doi.org/10.3390/ rs15123168. [CrossRef]
  68. Wulder, M.A., Coops, N.C., Roy, D.P., White, J.C., Hermosilla, T. Land cover 2.0. International Journal of Remote Sensing 2018, 39 (12), 4254-4284. https://doi.org/10.1080/01431161.2018.1452075. [CrossRef]
  69. Roy, D.P., Yan, L. Robust Landsat-based crop time series modelling. Remote Sens. Environ. 2018, 238, 110810. [CrossRef]
  70. Rose, M.B., Nagle, N.N. Characterizing Forest Dynamics with Landsat-Derived Phenology Curves. Remote Sensing 2021, 13(2), 267. [CrossRef]
  71. Ni, G. Vegetation index and its advances. Journal of Arid Meteorology 2003, 21(4), 71.
  72. Bai, Y., Yang, Y., Jiang, H. Intercomparison of AVHRR GIMMS3g, terra MODIS, and SPOT-VGT NDVI products over the Mongolian plateau. Remote Sensing 2019, 11(17), 2030. [CrossRef]
  73. Costantini, M.L., Zaccarelli, N., Mandrone, S., Rossi, D., Calizza, E., Rossi, L. NDVI spatial pattern and the potential fragility of mixed forested areas in volcanic lake watersheds. Forest ecology and management 2012, 285, 133-141. [CrossRef]
  74. Wu, J. Key concepts and research topics in landscape ecology revisited: 30 years after the Allerton Park workshop. Landscape ecology 2013, 28, 1-11. [CrossRef]
  75. Silveira, E.M.D.O., Mello, J.M.D., Acerbi, F.W., Reis, A.A.D., Withey, K.D., Ruiz, L.A. Characterizing landscape spatial heterogeneity using semivariogram parameters derived from NDVI images. Cerne 2017, 23, 413-422.
  76. Zurlini, G., Riitters, K., Zaccarelli, N., Petrosillo, I., Jones, K.B., Rossi, L. Disturbance patterns in a socio-ecological system at multiple scales. Ecol. Complex. 2006, 3, 119–128. [CrossRef]
  77. Zaccarelli, N., Riitters, K.H., Petrosillo, I., Zurlini, G. Indicating disturbance content and context for preserved areas. Ecol. Indic. 2008, 8(6), 841-853. [CrossRef]
  78. Griffith, J.A., Martinko, E.A., Whistler, J.L., Price, K.P. Preliminary comparison of landscape pattern–normalized difference vegetation index (NDVI) relationships to Central Plains stream conditions. Journal of environmental quality 2002,31(3), 846-859.
  79. Agnoletti, M., Tredici, M., Santoro, A. Biocultural diversity and landscape patterns in three historical rural areas of Morocco, Cuba and Italy, Biodiversity and conservation 2015, 24, 3387-3404. https://doi.org/10.1007/s10531-015-1013-6. [CrossRef]
  80. Merçon, J., Vetter, S., Tengö, M., Cocks, M., Balvanera, P., Rosell, J.A., Ayala-Orozco, B. From local landscapes to international policy: contributions of the biocultural paradigm to global sustainability. Global Sustainability 2019, 2, e7. [CrossRef]
  81. Bridgewater, P., Rotherham, I.D. A critical perspective on the concept of biocultural diversity and its emerging role in nature and heritage conservation. People and Nature 2019, 1(3), 291-304. [CrossRef]
  82. Berkes, F., Ross, H. Community resilience: Toward an integrated approach. Society & natural resources 2013, 26(1), 5-20. https://doi.org/10.1080/08941920.2012.736605. [CrossRef]
  83. Engle, N.L., de Bremond, A., Malone, E.L., Moss, R.H. Towards a resilience indicator framework for making climate-change adaptation decisions. Mitigation and Adaptation Strategies for Global Change 2014, 19, 1295-1312. https://doi. org/10.1007/s11027-013-9475-x. [CrossRef]
  84. Ungar, M., McRuer, J., Liu, X., Theron, L., Blais, D., Schnurr, M.A. Social-ecological resilience through a biocultural lens: A participatory methodology to support global targets and local priorities. Ecol. Soc. 2020, 25, 8. [CrossRef]
  85. Bengtsson, J., Angelstam, P., Elmqvist, T., Emanuelsson, U., Folke, C., Ihse, M., Moberg, F. Nystrm, M. Reserves, resilience and dynamic landscapes 20 years later. Ambio 2021, 50, 962-966. https://doi.org/10.1007/s13280-020-01477-8. [CrossRef]
  86. Walker, B., Holling, C.S., Carpenter, S.R., Kinzig, A. Resilience, adaptability and transformability in social–ecological systems. Ecology and society 2004, 9(2). https://doi.org/10.5751/ ES-00650-090205. [CrossRef]
  87. Folke, C., Carpenter, S. R., Walker, B., Scheffer, M., Chapin, T., Rockström, J. Resilience thinking: integrating resilience, adaptability and transformability. Ecology and society 2010, 15(4). http://doi.org/10.5751/ES-03610-150420. [CrossRef]
  88. Bănică, A. Resilience and/or sustainable development? Avatars of sustainability. In Sustainable development and resilience. Territorial perspectives and multidisciplinary approaches. Bănică, A., Petrișor, A.I., Publishing House of the Romanian Academy, Bucharest, 2021.
  89. Quinlan, A.E., Berbés-Blázquez, M., Haider, L.J., Peterson, G.D. Measuring and assessing resilience: broadening understanding through multiple disciplinary perspectives. Journal of Applied Ecology 2016, 53(3), 677-687. [CrossRef]
  90. Olsson, P., Folke, C., Hahn, T. Social-ecological transformation for ecosystem management: the development of adaptive co-management of a wetland landscape in southern Sweden. Ecology and society 2004, 9(4). [CrossRef]
  91. Sterling, E., Ticktin, T., Morgan, T.K.K., Cullman, G., Alvira, D., Andrade, P., Bergamini, N., Betley, E., Burrows, K., Caillon, S. Culturally grounded indicators of resilience in social-ecological systems. Environ. Soc. 2017, 8, 63-95. [CrossRef]
  92. Berkes, F. Sacred Ecology: Traditional Ecological Knowledge and Resource Management. Third edition. Routledge: New York, 2012. [CrossRef]
  93. Gavin, M.C., McCarter, J., Mead, A., Berkes, F., Stepp, J.R., Peterson, D., Tang, R. Defining biocultural approaches to conservation. Trends in ecology & evolution 2015, 30(3), 140-145. [CrossRef]
  94. Sterling, E.J., Filardi, C., Toomey, A.; Sigouin, A., Betley, E., Gazit, N., Newell, J., Albert, S., Alvira, D., Bergamini, N. Biocultural approaches to well-being and sustainability indicators across scales. Nat. Ecol. Evol. 2017, 1, 1798–1806. [CrossRef]
  95. IUCN; WCMC. Guidelines for Protected Areas Management Categories; IUCN: Gland, Switzerland; CNPPA: Ambleside, UK; WCMC: Cambridge, UK, 1994.
  96. Strickland-Munro, J.K., Allison, H.E., Moore, S.A. Using resilience concepts to investigate the impacts of protected area tourism on communities. Annals of tourism research 2010, 37(2), 499-519. [CrossRef]
  97. Ribeiro, M.B.N., Verissimo, A. Patterns and causes of deforestation in protected areas of Rondonia-Brazil. Natureza & Conservação 2007, 5(1), 15-26.
  98. Cuenca, P., Arriagada, R., Echeverría, C. How much deforestation do protected areas avoid in tropical Andean landscapes?. Environmental Science & Policy 2016, 56, 56-66. [CrossRef]
  99. Vorovencii, I. Quantification of forest fragmentation in pre-and post-establishment periods, inside and around Apuseni Natural Park, Romania. Environmental monitoring and assessment 2018, 190, 1-15.
  100. Wade, C.M., Austin, K.G., Cajka, J., Lapidus, D., Everett, K.H., Galperin, D., Maynard, R., Sobel, A. What Is Threatening Forests in Protected Areas? A Global Assessment of Deforestation in Protected Areas, 2001-2018. Forests 2020, 11, 539. [CrossRef]
  101. Kroeker-Maus, D. The protected area as enclave: Towards new geographies of tourism and conservation. Geography Compass 2014, 8(11), 796-807. [CrossRef]
  102. Huggins, X., Gleeson, T., Serrano, D., Zipper, S., Jehn, F., Rohde, M.M., Abell, R., Vigerstol, K., Hartmann, A. Overlooked risks and opportunities in groundwatersheds of the world’s protected areas. Nat. Sustain. 2023, 6, 855-864. [CrossRef]
  103. Zielinska, A. Abilities of running an economic activity on protected areas. Economics & Sociology 2009, 2(2), 108. [CrossRef]
  104. Zmijanović, L. Measurements Of Protected Areas Management Efficiency. Ekonomski pregled 2019, 70(1), 62-86.
  105. Grodzki, W. Entomofauna of Dying Young Spruces Picea Abies (L.) Karst. in the Area after Forest Decline in the Izerskie Mountains. Folia For. Pol. Ser. A 2009, 51, 161–170. [CrossRef]
  106. Rouse, R.W.H., Haas, J.A.W., Deering, D.W. Monitoring Vegetation Systems in the Great Plains with ERTS. In Third Earth Resources Technology Satellite-1 Symposium-Volume I: Technical Presentations; NASA SP-351; NASA: Washington, DC, USA, 1974; pp. 309–317. https://ntrs.nasa.gov/citations/19740022614.
  107. Fusami, A.A., Nweze, O.C., Hassan, R. Comparing the Effect of Deforestation Result by NDVI and SAVI. Int. J. Sci. Res. Publ.(IJSRP) 2020, 10(6), 918-925. [CrossRef]
  108. Zaitunah, A., Samsuri, Sahara, F. Mapping and Assessment of Vegetation Cover Change and Species Variation in Medan, North Sumatra. Heliyon 2021, 7, e07637. https://doi.org/10.1016/j.heliyon.2021.e07637. [CrossRef]
  109. Hesselbarth, M.H.K., Sciaini, M., With, K.A., Wiegand, K., Nowosad, J. Landscapemetrics: an open-source R tool to calculate landscape metrics. Ecography 2019, 42 (10), 1648-1657. [CrossRef]
  110. Mustățea, M. Fragmentation and connectivity at landscape level from Carpathian mountains ecoregion - A synthesis. Bucov. For. 2021, 21(2), 199-216.
  111. Goepel, K.D. Implementation of an Online Software Tool for the Analytic Hierarchy Process (AHP-OS). International Journal of the Analytic Hierarchy Process 2018, 10 (3), pp 469-487. [CrossRef]
  112. Avădănei, V., Surdu, I., Medveschi, I., Cociș, E.-A., Păcurar, B.-N., Nicula, A.-S. Analysis of Discording Geodemographic Structures and Space Polarization in Regional Context Using GIS Technology: Case Study: Apuseni Mountains Romania. In L. Chivu, V. IoanFranc, G. Georgescu, & J.V. Andrei (Eds.), Romanian Economy. A Century of Transformation (1918-2018): Proceedings of ESPERA 2018 (pp. 1011-1022).
  113. Andronache, I., Marin, M., Fischer, R., Ahammer, H., Radulovic, M., Ciobotaru, A.-M., Jelinek, H.F., Di Ieva, A., Pintilii, R.-D., Drăghici, C.-C., Herman, G.V., Nicula, A.-S., Simion, A.-G., Loghin, I.-V., Diaconu, D.-C., Peptenatu, D., Dynamics of Forest Fragmentation and Connectivity Using Particle and Fractal Analysis. Sci Rep, 2019, 9, 12228. https://doi.org/10.1038/s41598-019-48277-z. [CrossRef]
  114. Nistor, Mărgărit & Nicula, Alexandru-Sabin & Cervi, Federico & Man, Titus & Ioan-Aurel, Irimus & Surdu, Ioan. Groundwater vulnerability gis models in the carpathian mountains under climate and land cover changes. Applied Ecology and Environmental Research, 2018, 16, 5095-5116. 10.15666/aeer/1604_50955116. [CrossRef]
  115. Nistor, M.M., Mîndrescu, M., Petrea, D., Nicula, A.S., Rai, P.K., Benzaghta, M.A., Dezsi, Ş., Hognogi, G., Porumb-Ghiurco, C.G. Climate change impact on crop evapotranspiration in Turkey during the 21st Century. Meteorological Applications, 2019, 26(3), 442-453. [CrossRef]
  116. Ilovan, O.R., Dulamă, M.E., Boțan, C.N., Havadi-Nagy, K.X., Horvath, C., Nițoaia, A., Nicula, S., Rus, G.M. Environmental education and education for sustainable development in Romania. Teachers' perceptions and recommendations. Journal of Environmental Protection and Ecology, 2018, 19(1), 350-356.
  117. Nistor, M.M., Nicula, A.S., Haidu, I., Surdu, I., Carebia, I.A., Petrea, D. GIS Integration Model of Metropolitan Area Sustainability Index (MASI). The Case of Paris Metropolitan Area. Journal of Settlements & Spatial Planning, 2019, 10(1). [CrossRef]
  118. Nistor, M.M., Nicula, A.S., Dezsi, Ş., Petrea, D., Kamarajugedda, S.A., Carebia, I.A. GIS-Based Kernel Analysis for Tourism Flow Mapping. Journal of Settlements & Spatial Planning, 2020, 11(2). [CrossRef]
  119. Nistor, M.M., Nicula, A.S. Application of GIS Technology for Tourism Flow Modelling in The United Kingdom. Geographia Technica, 2021, 16(1). [CrossRef]
  120. Maroşi, Z., Adorean, E.C., Ilovan, O.R., Gligor, V., Voicu, C.G., Nicula, A.S., Dulamă, M.E. Living the urban cultural landscapes in the city centre of Cluj-Napoca/Kolozsvár/Klausenburg, Romania. Mitteilungen der Österreichischen Geographischen Gesellschaft, 2019, 161.
  121. Nicula, A.S., Stoica, M.S., Ilovan, O.R. The Cultural-Historical and Political Spheres of Influence of Alba Iulia. Transylvanian Review, 2017, 26.
  122. Nicula, A.S., Boțan, C.N., Gligor, V., Cociș, E.A. Celebrating the Great Union through smart digital solutions: lessons from Alba Iulia, Romania. Journal of Urban History, 2022, 48(2), 425-443. [CrossRef]
  123. Bota, V.B., Neamtu, A.A., Olah, N.K., Chișe, E., Burtescu, R.F., Pripon Furtuna, F.R., Nicula, A.S., Neamtu, C., Maghiar, A.M., Ivănescu, L.C., Zamfirache, M.M.A Comparative analysis of the anatomy, phenolic profile, and antioxidant capacity of Tussilago farfara L. vegetative organs. Plants, 2022, 11(13), 1663.
  124. Bîrsănuc, E.M., Cociș, E.A., Gligor, V., Man, T.C., Nicula, A.S., Stoica, M.S. Performing Democracy An Analysis of Church-Based Electoral Capital in Romania. Transylvanian Review, 2020, 29, 291-309.
  125. Nicula, A.S., Stoica, M.S., Bîrsănuc, E.M., Man, T.C. Why Do Romanians Take to the Streets? A Spatial Analysis of Romania's 2016-2017 Protests. Romanian Journal of Political Science, 2019, 19(2), 201-222.
  126. Cociș, E.A., Soporan, V.F., Ilea, P., Imre-Lucaci, F., Soporan, B.M., Bere, P., Nemeș, O. Characterisation of generated ash from hazardous waste incineration, Studia Universitatis Babes-Bolyai Chemia, 2012, 57(2), 147-156.
  127. Soporan, M., Soporan, V., Cociș, E.-A., Batrinescu, G., Nemes, O. Gas Analysis of Municipal Landfill Emissions. Studia Universitatis Babeș-Bolyai, Chemia 2012, 57, 23-30.
  128. Soporan, M.B.V., Soporan, V.F., Bătrînescu, G., Cociş, E. Assessment methodology for non-compliant landfills. Environmental Engineering and Management Journal, 2013, 12(2), 387-391. [CrossRef]
  129. Soporan, M.B., Soporan, V.F., Bătrînescu, G., Cociş, E. Exploratory analysis of gas emissions from non-compliant municipal landfill used for energetic evaluation. Environmental Engineering and Management Journal, 2013, 12(2), 381-386. [CrossRef]
  130. Nicula, E.-A., Crețan, R., Nicula, A.-S. Personal Protective Equipment (PPE) during the covid-19 crisis: a review of current knowledge and future directions, EEMJ, 2024, accepted for publication.
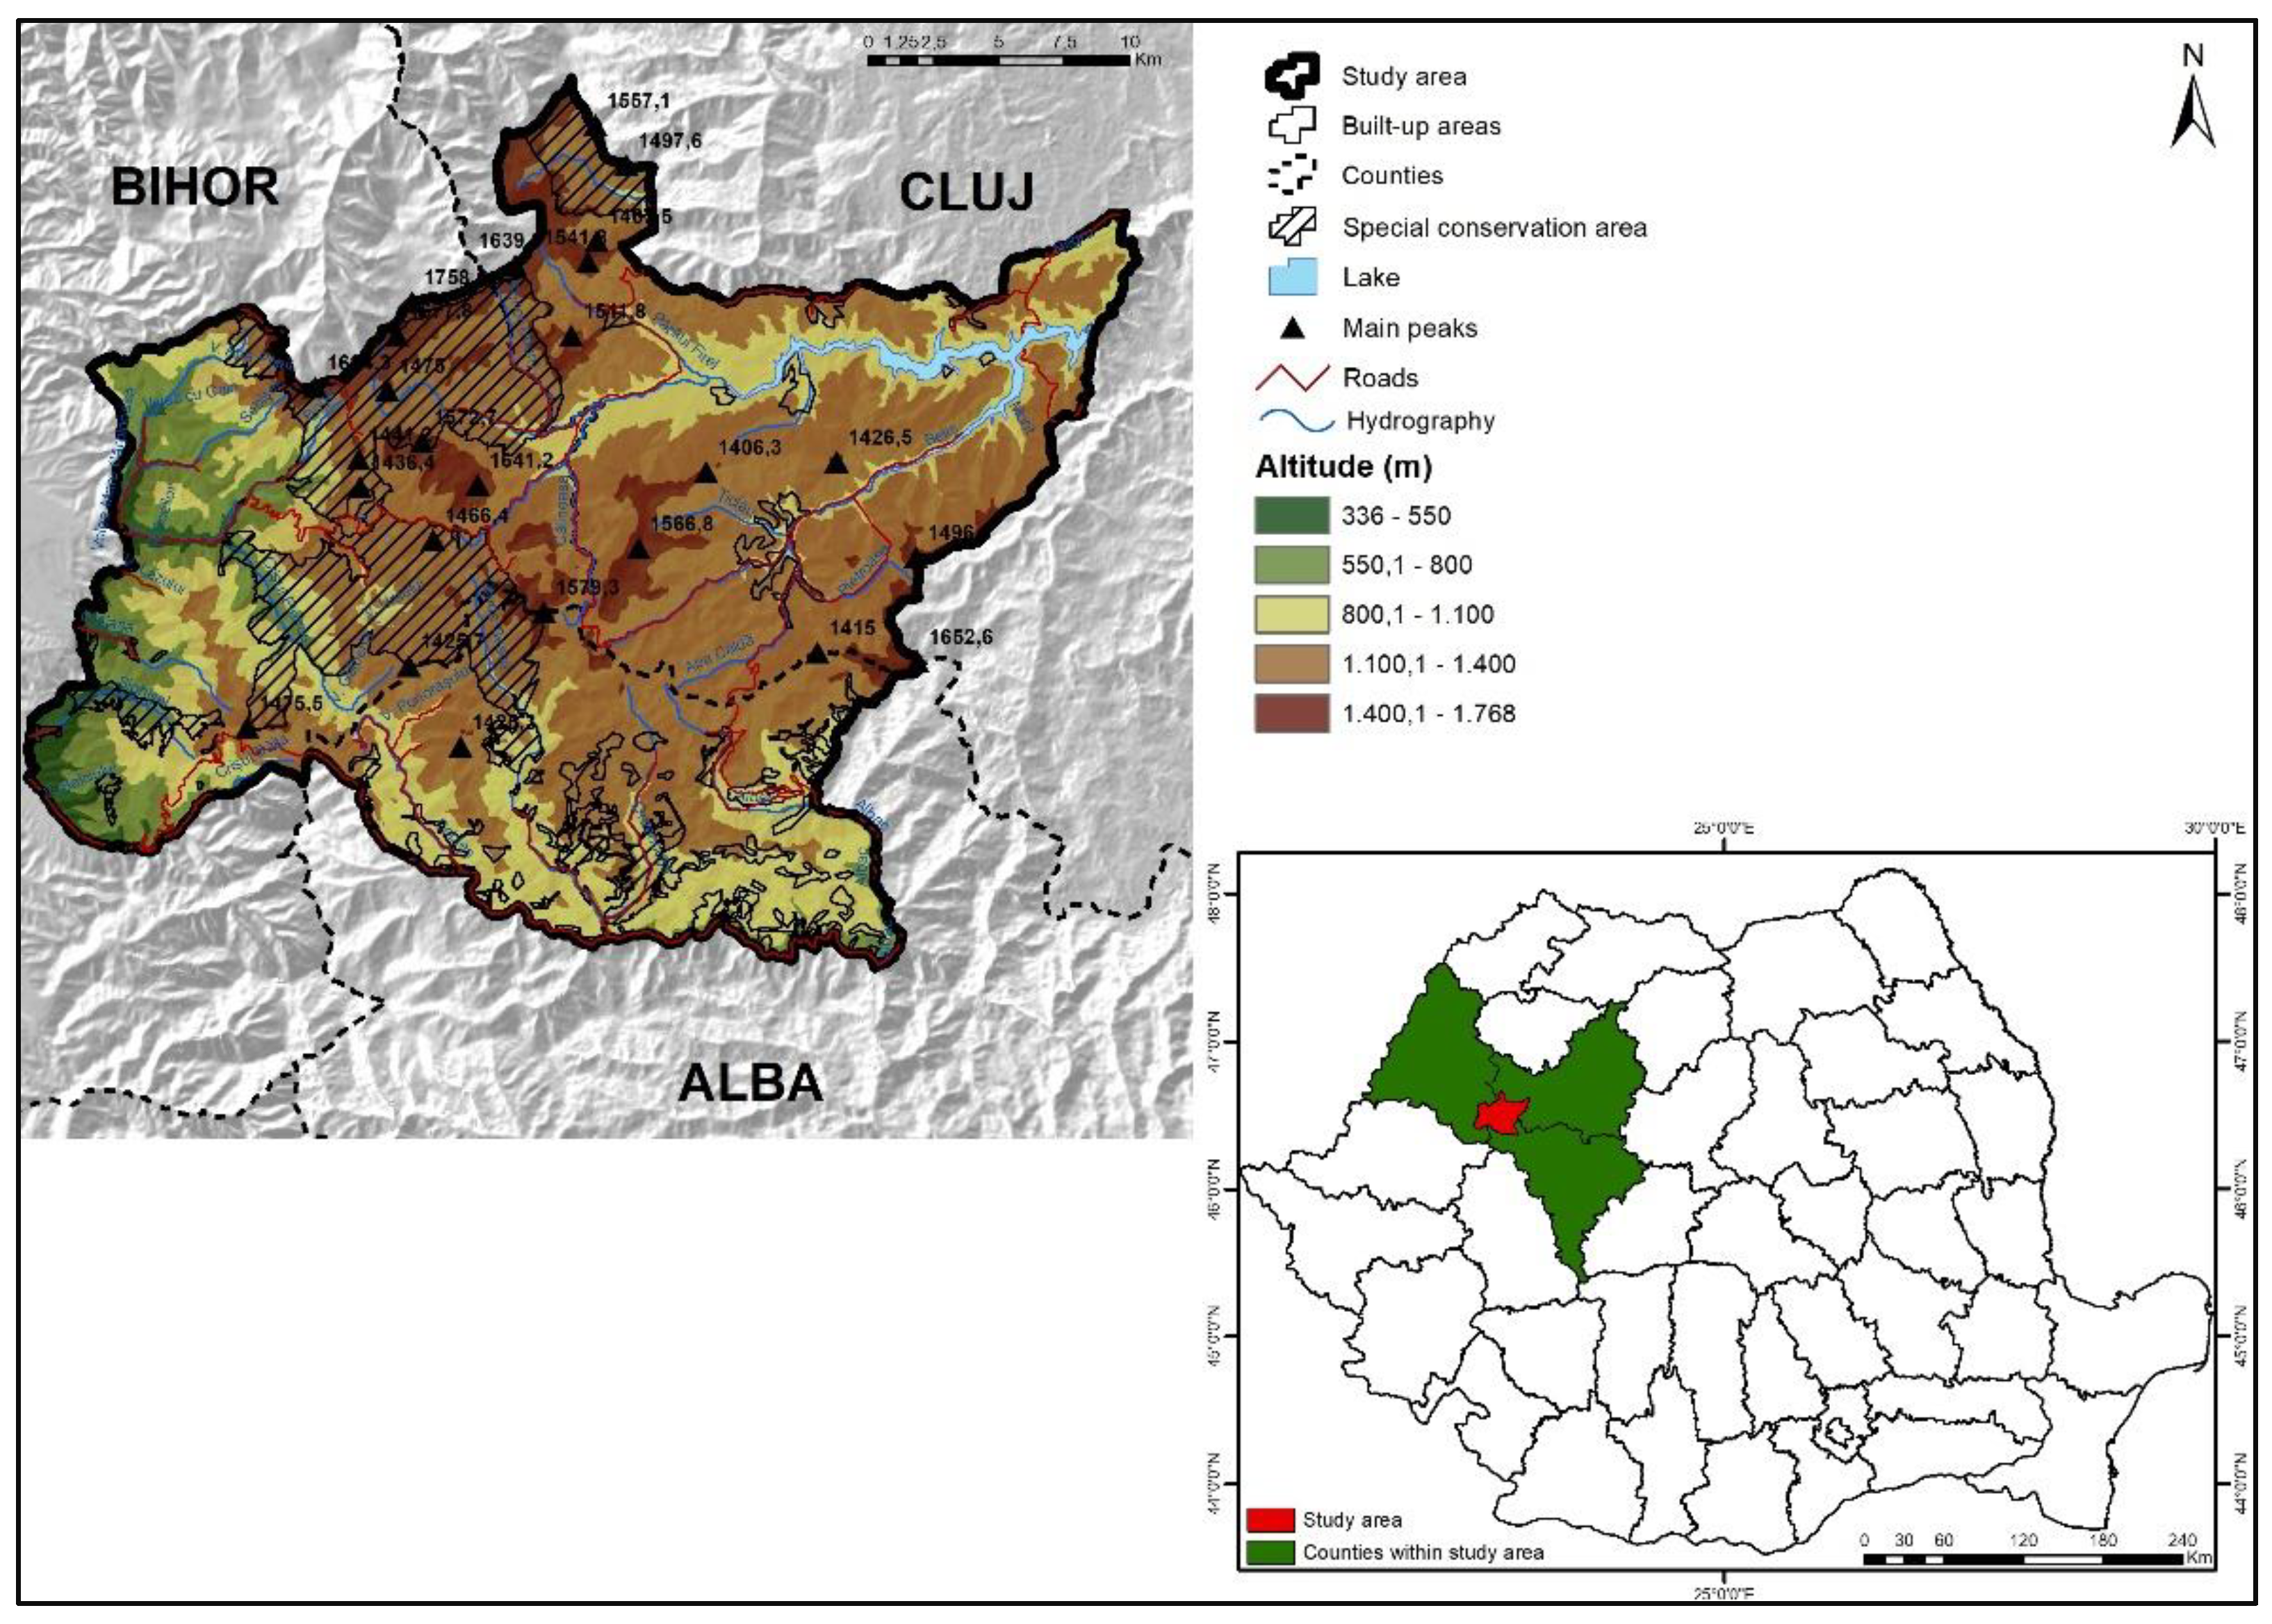
Figure 1. Geographical position of the study area.
Preprints 106972 g001
Figure 2. Normalized Difference Vegetation Index (NDVI): 1980, 1997, 2007 and 2023.
Preprints 106972 g002
Figure 3. The reclassified rasters of the spatial analysis indicators (A-D): a1 - density of natural monuments; a2 - Euclidean distance to the special conservation area; a3 - normalized difference vegetation index (NDVI); a4 - forest landscape integrity index; b1 - density of built heritage; b2 - building density (Kernel); b3 - density of settlement network; b4 - number of resident population; b5 - settlement dispersion index; c1 - land cover/use; c2 - slope; c3 - spatial accessibility; c4 - altitude of the built environment; c5 - Forest Cover Loss (2001-2022); d1 - shape index; d2 - forest landscape fragmentation (FRAGSTATS Helper); d3 - plots connectivity; d4 - fractal dimension.
Preprints 106972 g003
Figure 4. Land use/cover in Apuseni Natural Park: a) 1990; b) 2018.
Preprints 106972 g004
Figure 5. Forest loss between 2001-2022.
Preprints 106972 g005
Figure 6. Virgin forests from Apuseni Natural Park.
Preprints 106972 g006
Figure 7. Building density (Kernel).
Preprints 106972 g007
Figure 8. Building distribution by altitude.
Preprints 106972 g008
Figure 9. Map of sustainability of multifunctional landscapes in Apuseni Natural Park.
Preprints 106972 g009
Table 1. Satellite images used for the analysis.
Date Mission ID Sensor Orbit (path/row)
08.08.1980 Landsat 2 MSS 200/27
07.09.1997 Landsat 5 TM 185/28
17.08.2007 Landsat 5 TM 185/28
14.08.2023 Landsat 8 OLI_TIRS 185/28
Table 2. Spatial analysis indicators and the calculated absolute values .
Indicator Minimum 2 3 4 Maximum Mean Standard Deviation
A. Natural landscape and biodiversity (Nl-B)
a1. Density of natural monuments 0.2 0.4 0.6 0.79 0.99 0.55 0.14
a2. Euclidean distance to the special conservation area 0.01 2.117 5.988 11.465 18.622 3.241 4.242
a3. Normalized difference vegetation index NDVI (2023) -0.87 -0.35 0.01 0.12 0.55 0.05 0.12
a4. Forest landscape integrity index -9.99 2635 5142 7317 9233 3541.9 6041.2
B. Built heritage and local community (Bh-Lc)
b1. Density of built heritage 0.20 0.30 0.38 0.47 0.59 0.37 0.07
b2. Building density (Kernel) 0.01 146180.8 502496.6 1224264.5 2329757.2 67597.1 165124.6
b3. Density of settlement network 1.0 5.73 8932 12.79 17.99 8.96 3.90
b4. Number of resident population (2021) 758 1008 1499 2307 4090 1811.1 793.74
b5. Settlement dispersion index 0.01 2.34 4.29 7.94 16.60 5.97 4.60
C. Land cover/use and spatial accessibility (LCLU-Sa)
c1. Land cover/use 0.59 2.09 6.28 8.68 12.27 6.25 3.27
c2. Slope 0.01 20.52 41.04 61.56 82.08 39.95 15.60
c3. Spatial accessibility 0.01 2.03 4.07 6.10 8.14 1.36 1.16
c4. Altitude of the built environment 340.3 683.5 948.6 1177.4 1666.2 1042.9 240.81
c5. Forest Cover Loss (2001-2022) 0.01 3.0 9.0 15.0 22.0 1.22 3.89
D. Landscape metrics (Lm)
d1. Shape index (SI) 1.66 95.44 148.12 197.65 270.35 148.58 51.79
d2. Forest landscape fragmentation (FRAGSTATS Helper) 199.44 710.69 1221.95 2116.64 4273.50 925.87 531.91
d3. Plots connectivity 0.01 4.0 8.0 11.0 15.0 11.99 3.10
d4. Fractal dimension (FD) 1.0 1.10 1.14 1.28 1.67 1.12 0.03
Disclaimer/Publisher’s Note: The statements, opinions and data contained in all publications are solely those of the individual author(s) and contributor(s) and not of MDPI and/or the editor(s). MDPI and/or the editor(s) disclaim responsibility for any injury to people or property resulting from any ideas, methods, instructions or products referred to in the content.
Copyright: This open access article is published under a Creative Commons CC BY 4.0 license, which permit the free download, distribution, and reuse, provided that the author and preprint are cited in any reuse.
Alerts
Prerpints.org logo

Preprints.org is a free preprint server supported by MDPI in Basel, Switzerland.

Subscribe

© 2025 MDPI (Basel, Switzerland) unless otherwise stated