1. Introduction
Duplex stainless steel (DSS) is a kind of stainless steel with similar volume fraction of α phase and γ phase, which good corrosion resistance and excellent mechanical properties are well combined. Compared with austenitic stainless steel, DSS has higher multiplication of strength and plasticity [
1], so it is widely used in construction [
2], offshore oil and gas exploitation [
3], chemical processing and nuclear industry [
4,
5,
6] and so on. However, many components are required to serve under long-term alternating load conditions, and continuous accumulation of fatigue damage can lead to fatigue failure and accidents. Therefore, to ensure safe service of components and improve service life, the fatigue performance of duplex stainless steel has always been the focus of international research.
The difference in properties of ferrite and austenite in S32750 DSS, as well as the existence of phase boundaries and grain boundaries, so the plastic deformation of the two phases is dynamically coordinated under external loads. Therefore, the response behavior of the test steel under cyclic loading is significantly different from that of ordinary single crystal materials [
7]. For stainless steels with high alloying element content, such as 316LN and Sancro 25, continuous cyclic softening is observed under low cyclic loading [
8,
9], but the material may exhibit additional secondary cyclic hardening behavior under large cyclic amplitude [
10,
11,
12]. Guo et al. reported that DSS with metastable austenite exhibited three strain hardening stages at room temperature, and strain-induced martensitic transformation increased the strain hardening rate of austenite in the second stage [
13]. Hongfu Wang [
14] believed that during the fatigue process the mechanical incompatibility of two phases and the uneven initial residual stress caused by quenching are the main reasons for the diverse and complex crack initiation positions of DSS. It can be seen that the two-phase deformation behavior of DSS during fatigue is a complex scientific problem. However, there is still a lack of research on the relationship between the two-phase deformation behavior and fatigue crack initiation, and the dislocation evolution of the two phases during deformation. Therefore, a series of studies on the deformation behavior of S32750 DSS is helpful to understand the formation and propagation of microcracks in the fatigue process of the steel, and provide a theoretical basis for improving its fatigue performance.
2. Experimental Materials and Methods
2.1. Preparation of Test Steel
The test steel is a Φ180 × 200 mm ingot provided by Zhejiang Jiuli Special Materials Technology Co., Ltd., which was forged by Hebei Sanhe Forging Plant. The size of the formed slab is 245 × 115 × 45mm. In order to ensure the subsequent smooth rolling, the plate is uniformly polished up and down along the thickness direction of the plate until the final plate thickness is 40mm. The slab was heated to 1200°C for 2h, and then 25%, 20%, 17% three passes of rolling treatment were carried out to ensure that the final rolling temperature was not less than 1000°C. The chemical composition of the test steel is shown in
Table 1.
In order to ensure that the matrix does not contain harmful precipitates [
15], the solution treatment temperature of S32750 duplex stainless steel is usually higher than 1050°C. In order to make the content of α and γ phases close to 1 : 1, the heat treatment process of the test steel is 1080°C, holding for 40 minutes and water cooling.
2.2. Methods of Tensile and Fatigue Properties
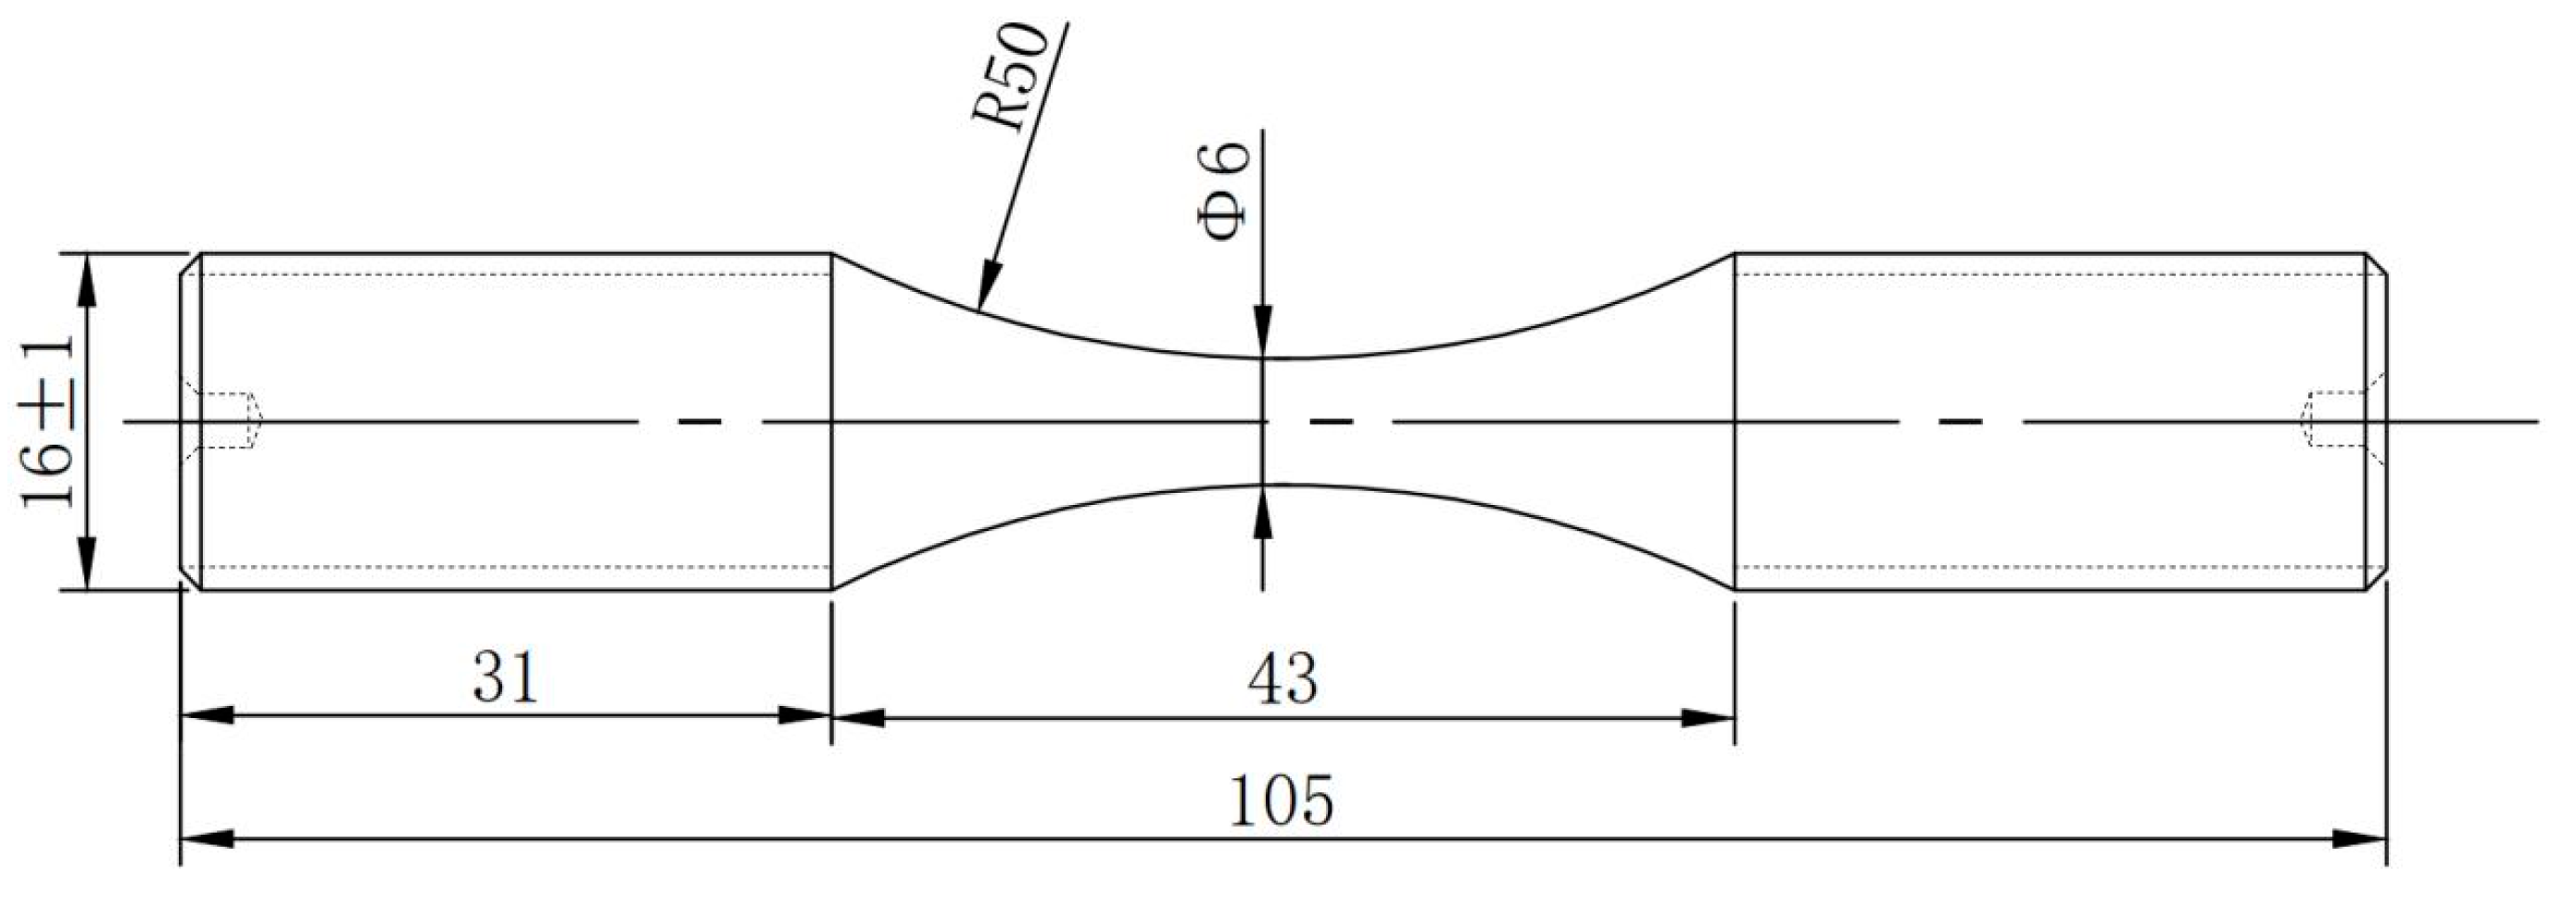
The tensile test was carried out using the GB/T 228.1-2021. The experimental results show that the yield and tensile strength of S32750 DSS after solution treatment at 1080°C can reach 560MPa and 825MPa, and the elongation and reduction of area are 35% and 66%. The low cycle fatigue performance is completed according to the GB/T 3075-2021. The fatigue trial was carried out at room temperature, the maximum stress was 600MPa, R = -1, the frequency was 1Hz, and the loading waveform was sine wave. The rod-like fatigue specimen is shown in Fig.2-1, and the surface roughness Ra is less than 0.2μm. In order to explore the deformation behavior of the two phases in the fatigue process, five samples were subjected to fatigue experiments of 2000, 4000, 6000, 8000 and fracture cycles.
Figure 2.
Rod fatigue specimen size.
Figure 2.
Rod fatigue specimen size.
2.3. Microstructure Observation and Microscopic Characterization
The ferrite phase was colored by 15 % KOH solution constant voltage electrolysis method, voltage 5V, time 10s ~ 15s, for phase ratio statistics. Using 10% H2SO4 + 1gKMnO4 solution water bath method, temperature 50°C, immersion time 3h, make α, γ grain boundaries colored, and then use the Nano Measure software to calculate the grain size. The microhardness of two phases was measured by FM-300 digital microhardness tester, and the loading load was 0.05kgf. Ten positions were selected for both phases to measure and take the average. EBSD samples were prepared by constant voltage electrolysis of 10 % HClO4 solution at 25V for 30s. TEM thin disk were prepared by constant current electrolysis in 10 % HClO4 solution, with current of 75 mA and pore size of 80. The database used for Thermo-calc calculation is TCFE12 : Steel/Fe-Alloys v12.0.
3. Result and Discussion
3.1. Phase Ratio and Grain Size
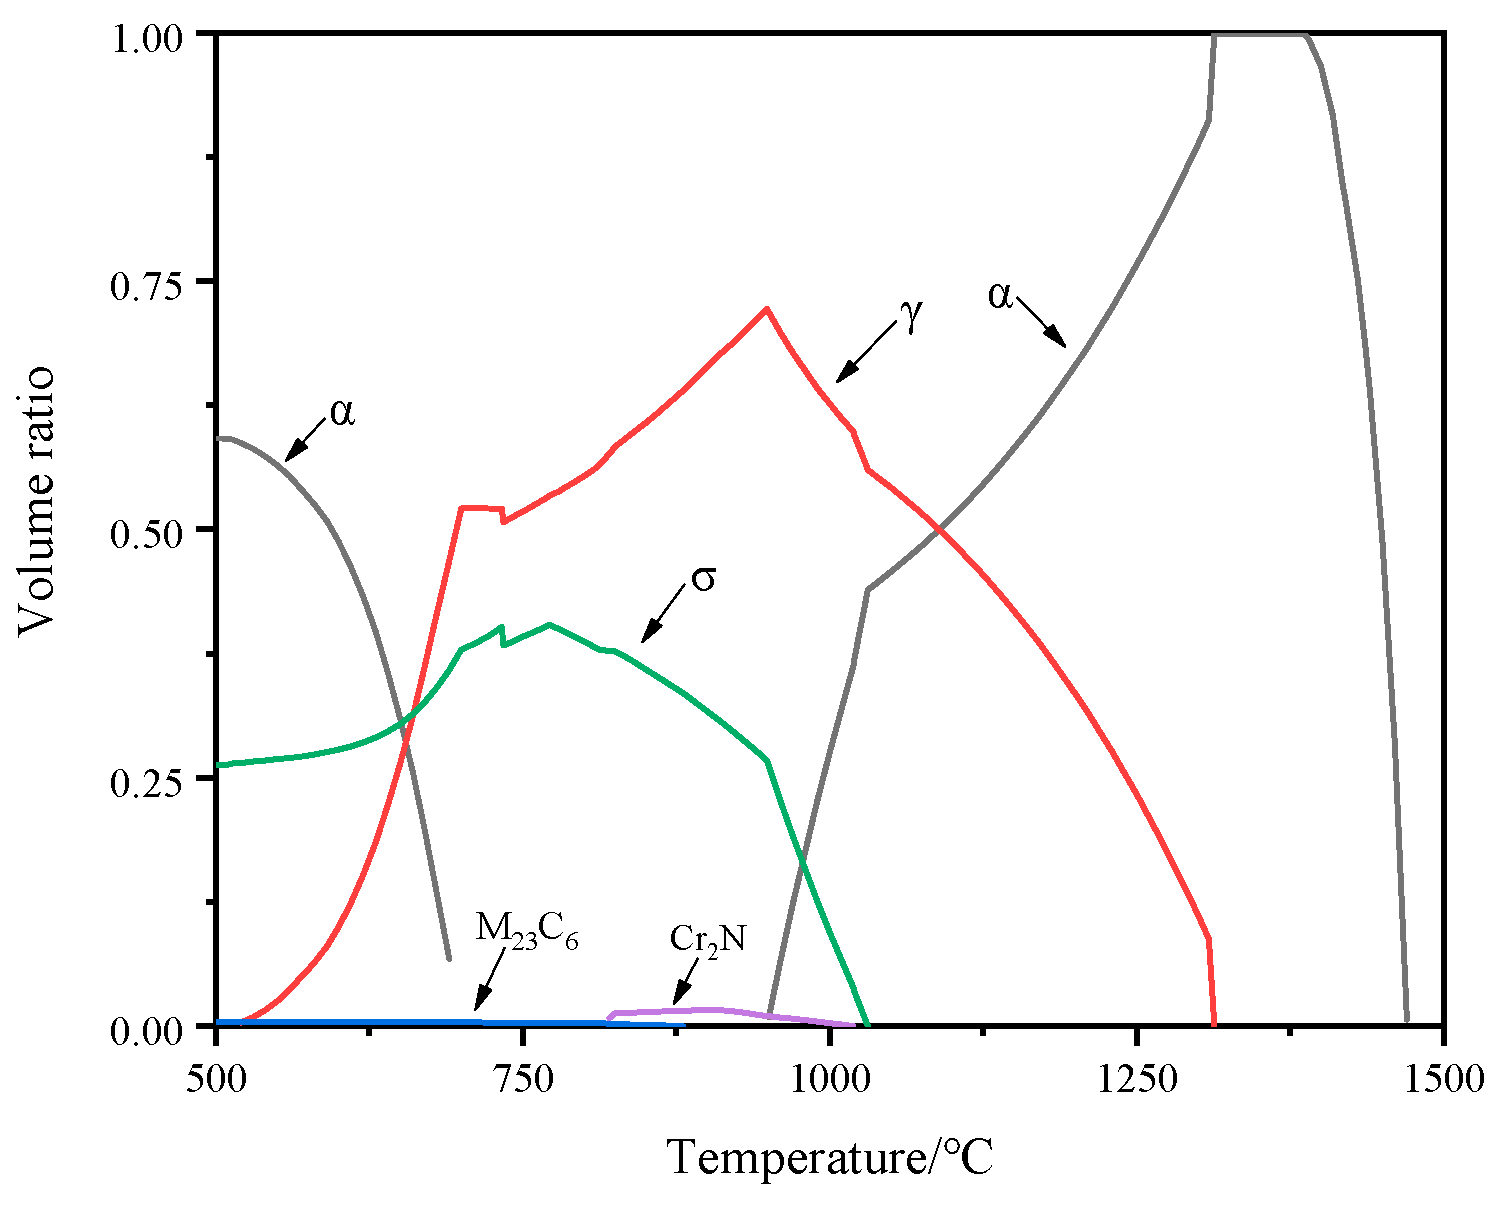
The content of alloying elements in S32750 DSS is more than 35%, which leads to the increase of precipitation tendency of harmful phases such as M23C6, σ phase and χ phase. Through Thermo calc thermodynamic calculation software, the precipitation temperature, content of each phase and the content of components in the phase can be effectively known. The main composition of the test steel is used as the input value of thermodynamic calculation, and the relationship between each phase and temperature are shown in Fig.3-1. It can be seen from the figure that when the temperature exceeds 1030°C, the matrix contains only ferrite and austenite phases. When the temperature is close to 1080°C, the volume fraction of the two phases is closest to 1 : 1.
Figure 3.
Thermodynamic calculation of the main precipitated phase and temperature.
Figure 3.
Thermodynamic calculation of the main precipitated phase and temperature.
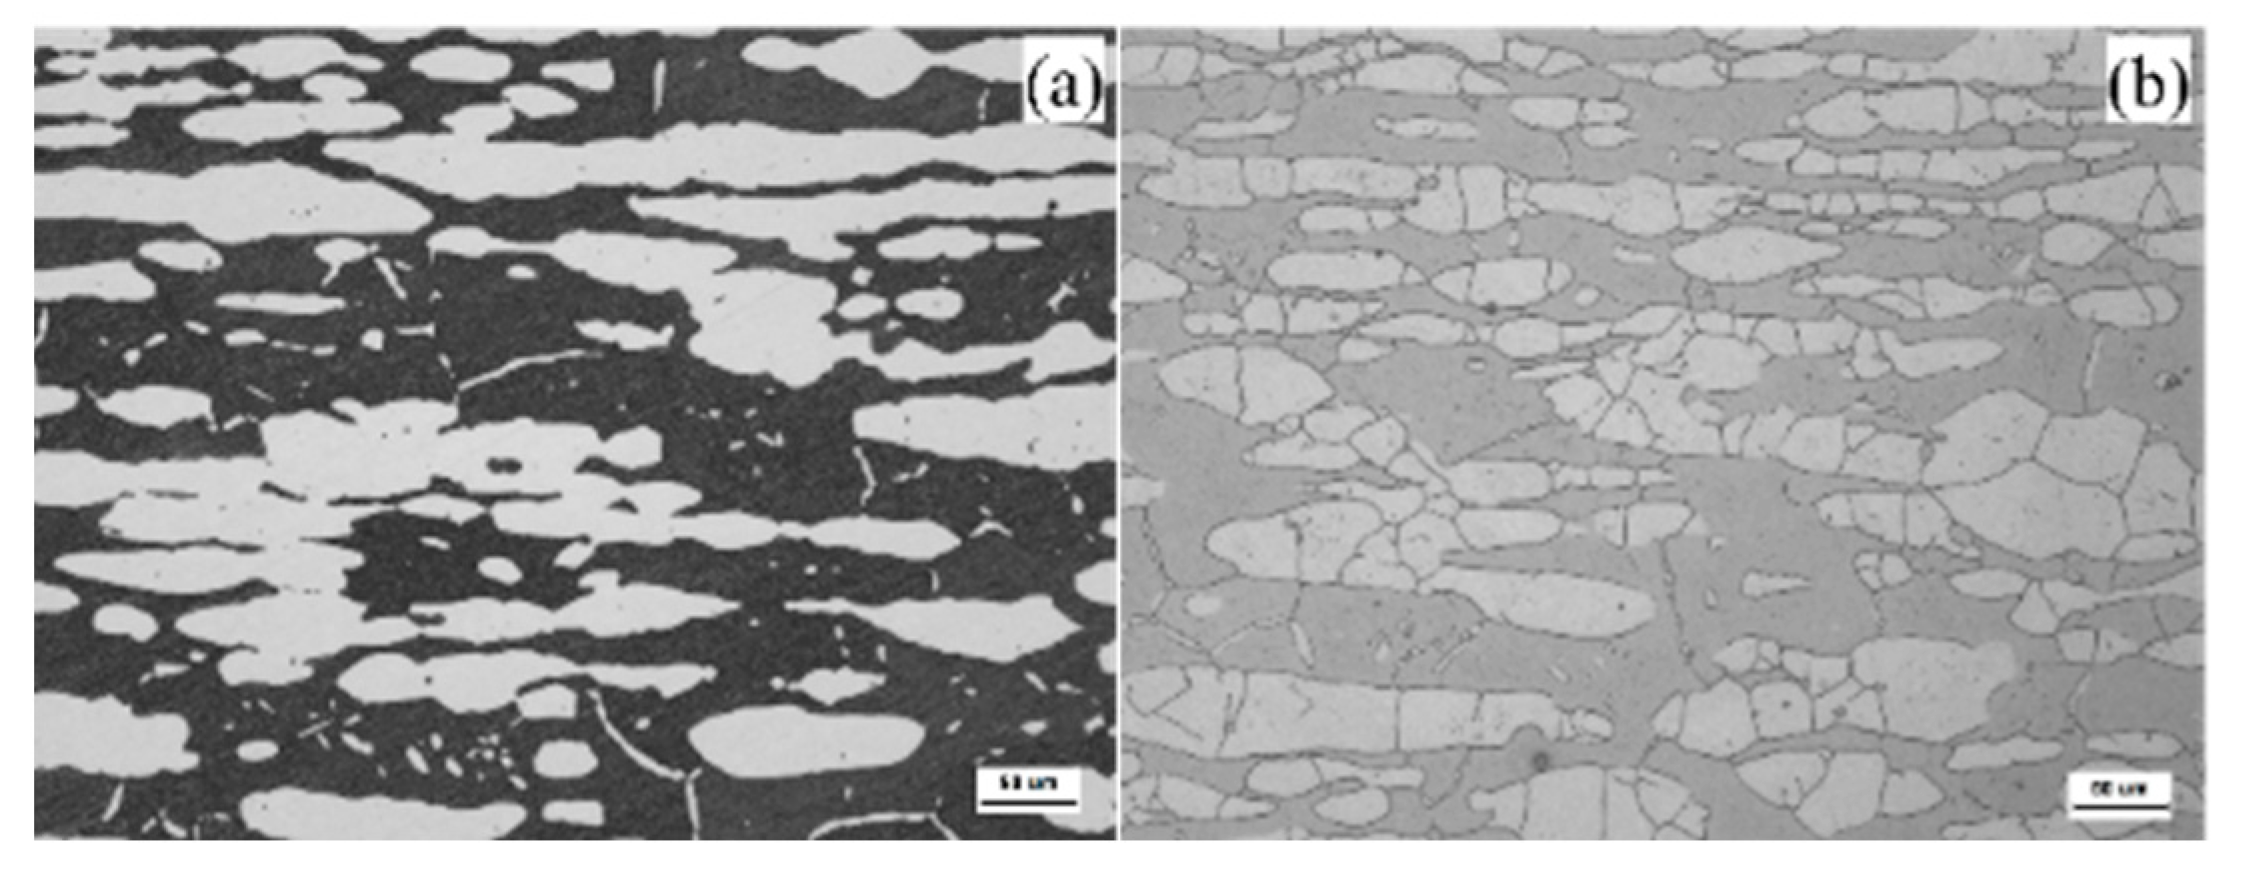
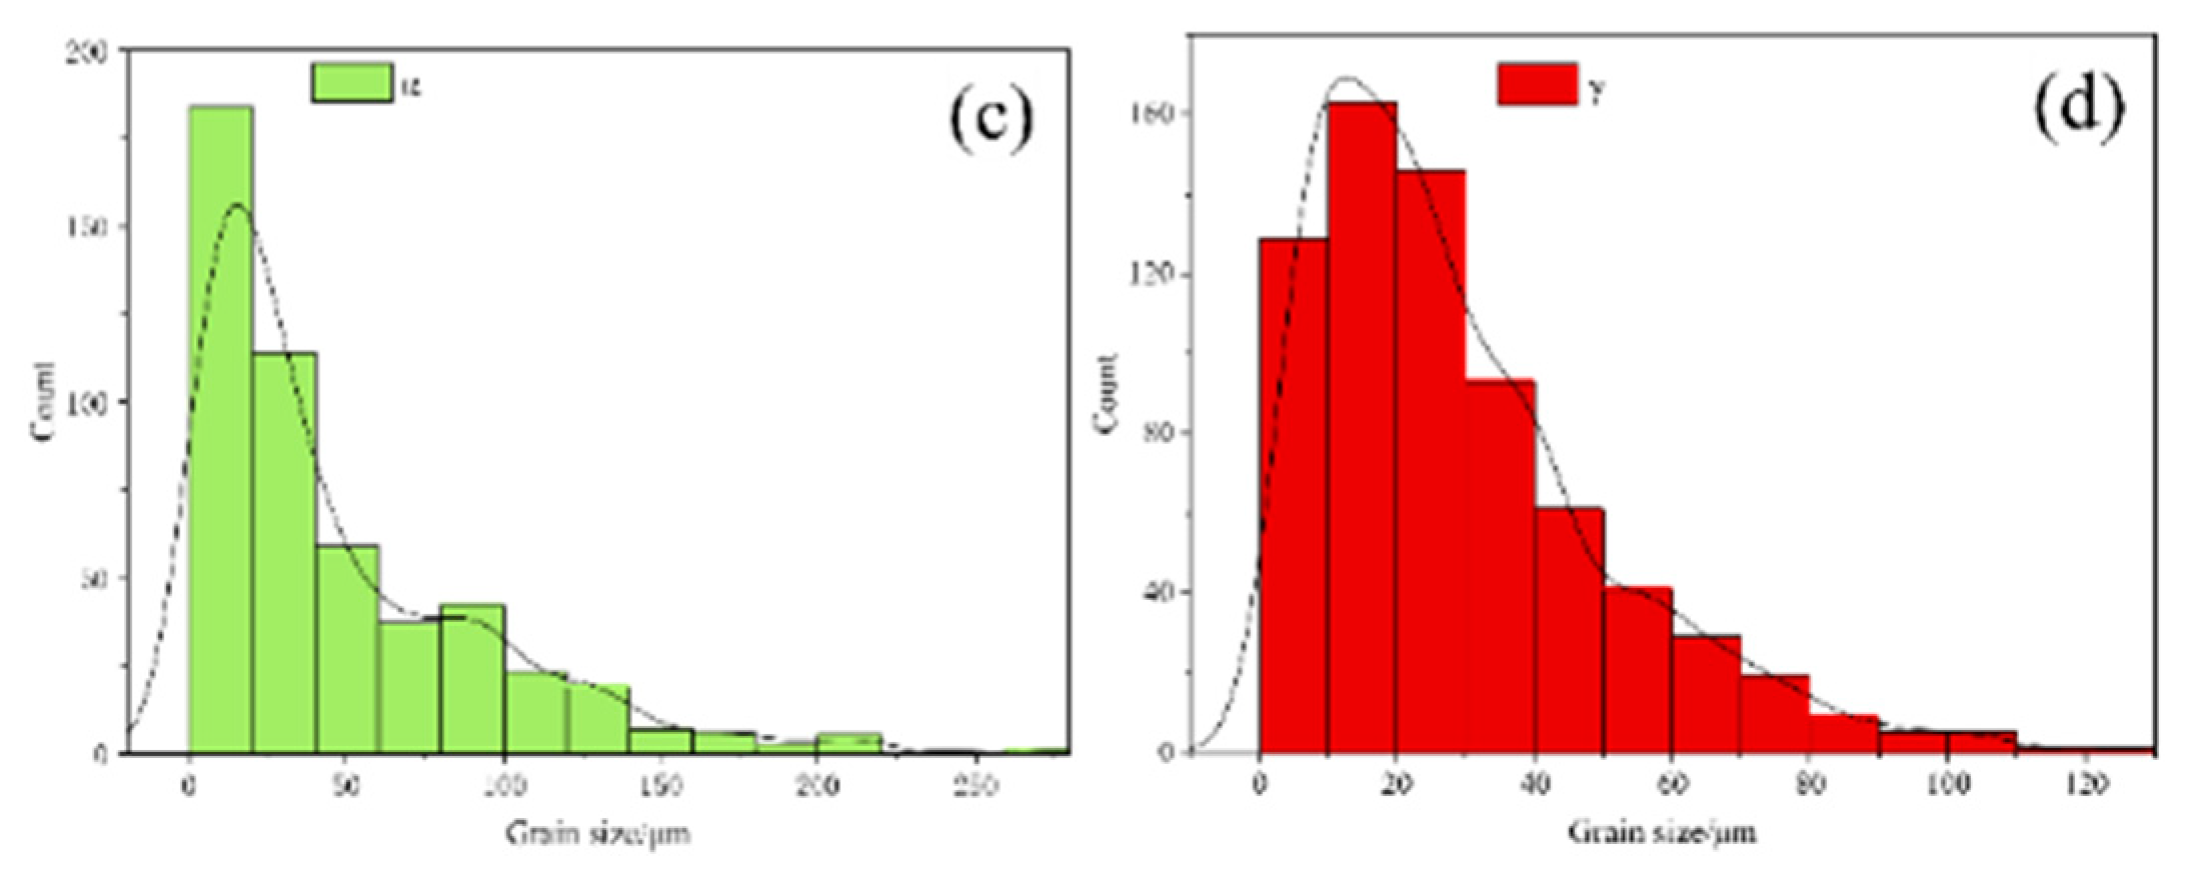
The two-phase microstructure morphology of steel is shown in Fig.3-2 (a). The black is α phase, and the white island structure is γ phase. After hot rolling and solid solution treatment, two-phase structure in the matrix is elongated and evenly distributed in layers. According to statistics, the proportion of α and γ phases is 51.35% and 48.65%. Two-phase grain boundaries and grain morphology are shown in Fig.3-2 (b). The grain size data of ferrite and austenite are shown in Figs.3-2 (c) and (d). It is found that ferrite and austenite are still dominated by grains less than 50μm, with a maximum size of 250μm. The austenite grain size is closer to the normal distribution, and the maximum size is 120μm. The average grain sizes of ferrite and austenite are 46.4μm and 28.8μm, respectively.
Figure 3.
Two-phase morphology(a), two-phase grain boundaries(b), ferrtic grain size distribution(c), austenite grain size distribution(d).
Figure 3.
Two-phase morphology(a), two-phase grain boundaries(b), ferrtic grain size distribution(c), austenite grain size distribution(d).
3.2. Fatigue Crack Source and Fracture Morphology
For high-strength steel, inclusions can easily cause stress concentration and fatigue fracture during cycling, it is more sensitive to the size of inclusions [
16]. In contrast, DSS with lower strength are less sensitive to inclusion size. The low cycle fatigue fracture morphology and fatigue fracture diagram of S32750 DSS under the stress amplitude of 600 MPa are shown in Fig.3-3. Of which, (a) is macroscopic morphology of the fracture at low magnification, (b) and (c) are the amplification diagram of the crack initiation source, and (d) is the surface crack initiation diagram of the rod fatigue specimen. After observing the macroscopic fracture morphology, no oxide inclusions were found on the surface and sub-surface, but two intrusion and extrusion traces were found on the surface edge, as shown in Fig.3-3 (b) and (c). Under continuous load, plastic deformation accumulates and passes to the surface, causing relative displacement on the surface and and gradually evolves into crack source.
Figure 3.
The macro fracture morphology (a); (b) and (c) are the location of the crack source; (d) is the schematic diagram of fatigue fracture.
Figure 3.
The macro fracture morphology (a); (b) and (c) are the location of the crack source; (d) is the schematic diagram of fatigue fracture.
The fatigue fracture is divided into four parts, including crack propagation zone I, II and III and instantaneous fracture zone IV. It is found that there exsit clear boundaries between crack propagation zones I, II and III, and the morphology on both sides of the boundary is also different. It may be due to the different crack propagation speeds during the fatigue fracture process, forming different cleavage and ductile fracture morphologies. Figure 3-4 (a-c) correspond to the local amplification of I, II and III positions in Figure 3-3, respectively. Region I is cleavage fracture, which is composed of many cleavage planes, secondary cracks and a small amount of fatigue striations as shown in Figure 3-4 (a), and the crack propagation in this region is extremely fast. Figure 3-4 (b) is the typical morphology of region II. A large number of fatigue striations occupy almost the whole field of view. In this region, the fatigue crack can expand more stably. Under the action of tensile stress, plastic deformation makes the crack tip passivated, when unloading, the stress is reduced, which can make the crack tip become sharp again, and finally a large number of fatigue striations [
17] are formed on this area. In the later periods of the crack propagation as shown in Figure 3-4 (c), massive dimples with different sizes are formed. The formation of regions I and II have consumed a lot of energy. The crack has experienced rapid expansion of zones I and II, which has consumed a lot of energy, and the crack growth rate will be slowed down,so it is easy to form dimple morphology.
Figure 3.
The micro-morphology of fatigue crack propagation zone (a- c) is the enlarged of zone I,II and III.
Figure 3.
The micro-morphology of fatigue crack propagation zone (a- c) is the enlarged of zone I,II and III.
3.3. Change of Two Phases Microhardness under Different Cycles
The two-phase crystal structure in S32750 DSS matrix is different, so its ability to withstand deformation is also inequable. The macroscopic plastic deformation of materials is the result of continuous accumulation of microscopic deformation. Local stress and strain concentration will cause crack initiation. The crack initiation of DSS is a complicated phenomenon affected by many factors [
18]. Internal factors such as the elastic-plastic difference of ferrite and austenite, and the change of elements, external factors including experimental parameters such as stress amplitude and frequency [
19,
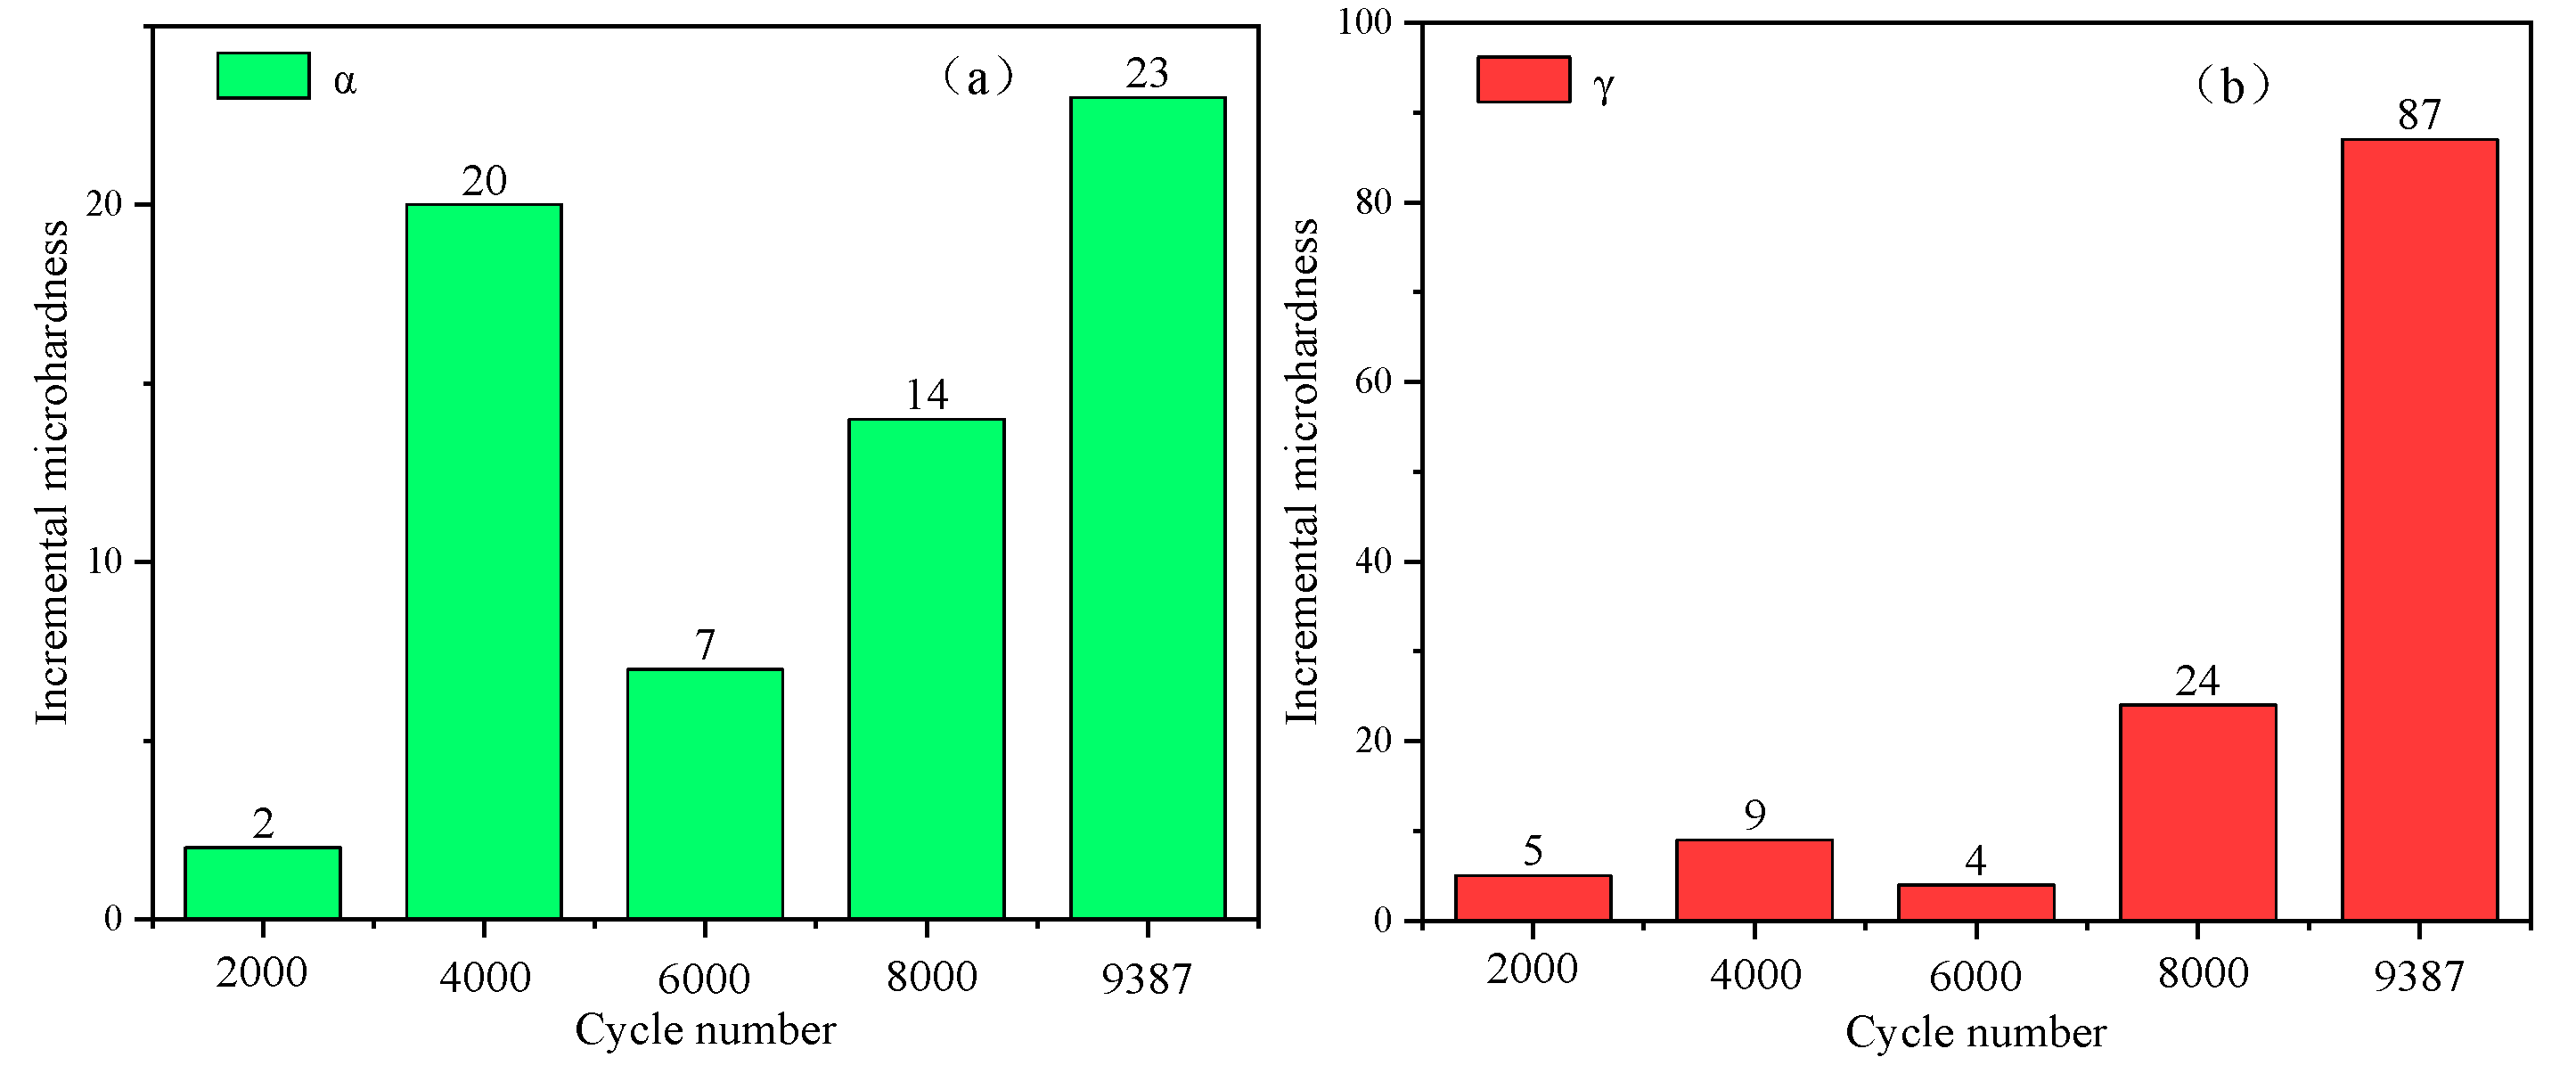
20], will affect the fatigue deformation mechanism and crack initiation. Therefore, studying the deformation behavior of the two phases during the cyclic process is of great help to elucidate the fatigue failure mechanism of DSS. The microhardness can reflect the degree of deformation in grains of α and γ phases. The hardness increment of ferrite and austenite in five specimens with different cycles is shown in Figure 3-5.
Figure 3.
(a) and (b) are the microhardness increments of ferrite and austenite under different cycles.
Figure 3.
(a) and (b) are the microhardness increments of ferrite and austenite under different cycles.
The initial microhardness of ferrite is higher than that of austenite after solution treatment. Comparing (a) and (b) in Fig.3-5, it is found that the microhardness increments of α and γ phases show completely different trends. After 2000 cycles, the microhardness of the two phases increased slightly, in the early stage of the cycle, the deformation mainly occurs in soft phase (austenite), the plane slip is relatively easy, it is not easy to generate strain accumulation. As the number of cycles increases to 4000, the ferrite is obviously hardened, the microhardness increases by 20HV, and the austenite hardness increases by 9HV, indicating that a large amount of deformation is accumulated in ferrite during this process. Subsequently, when the number of cycles increases to 8000, the microhardness in the ferrite grains continues to increase, while the hardness in the austenite grains also show a significant growth trend. The specimen fractured after 9387 cycles, and the microhardness of two phases near the fracture showed that the microhardness increment of ferrite was 23HV, the microhardness increment of austenite was 87HV, the strain hardening was much higher than that of ferrite.
3.4. Evolution Rule of Two-Phase KAM in the Cyclic Process
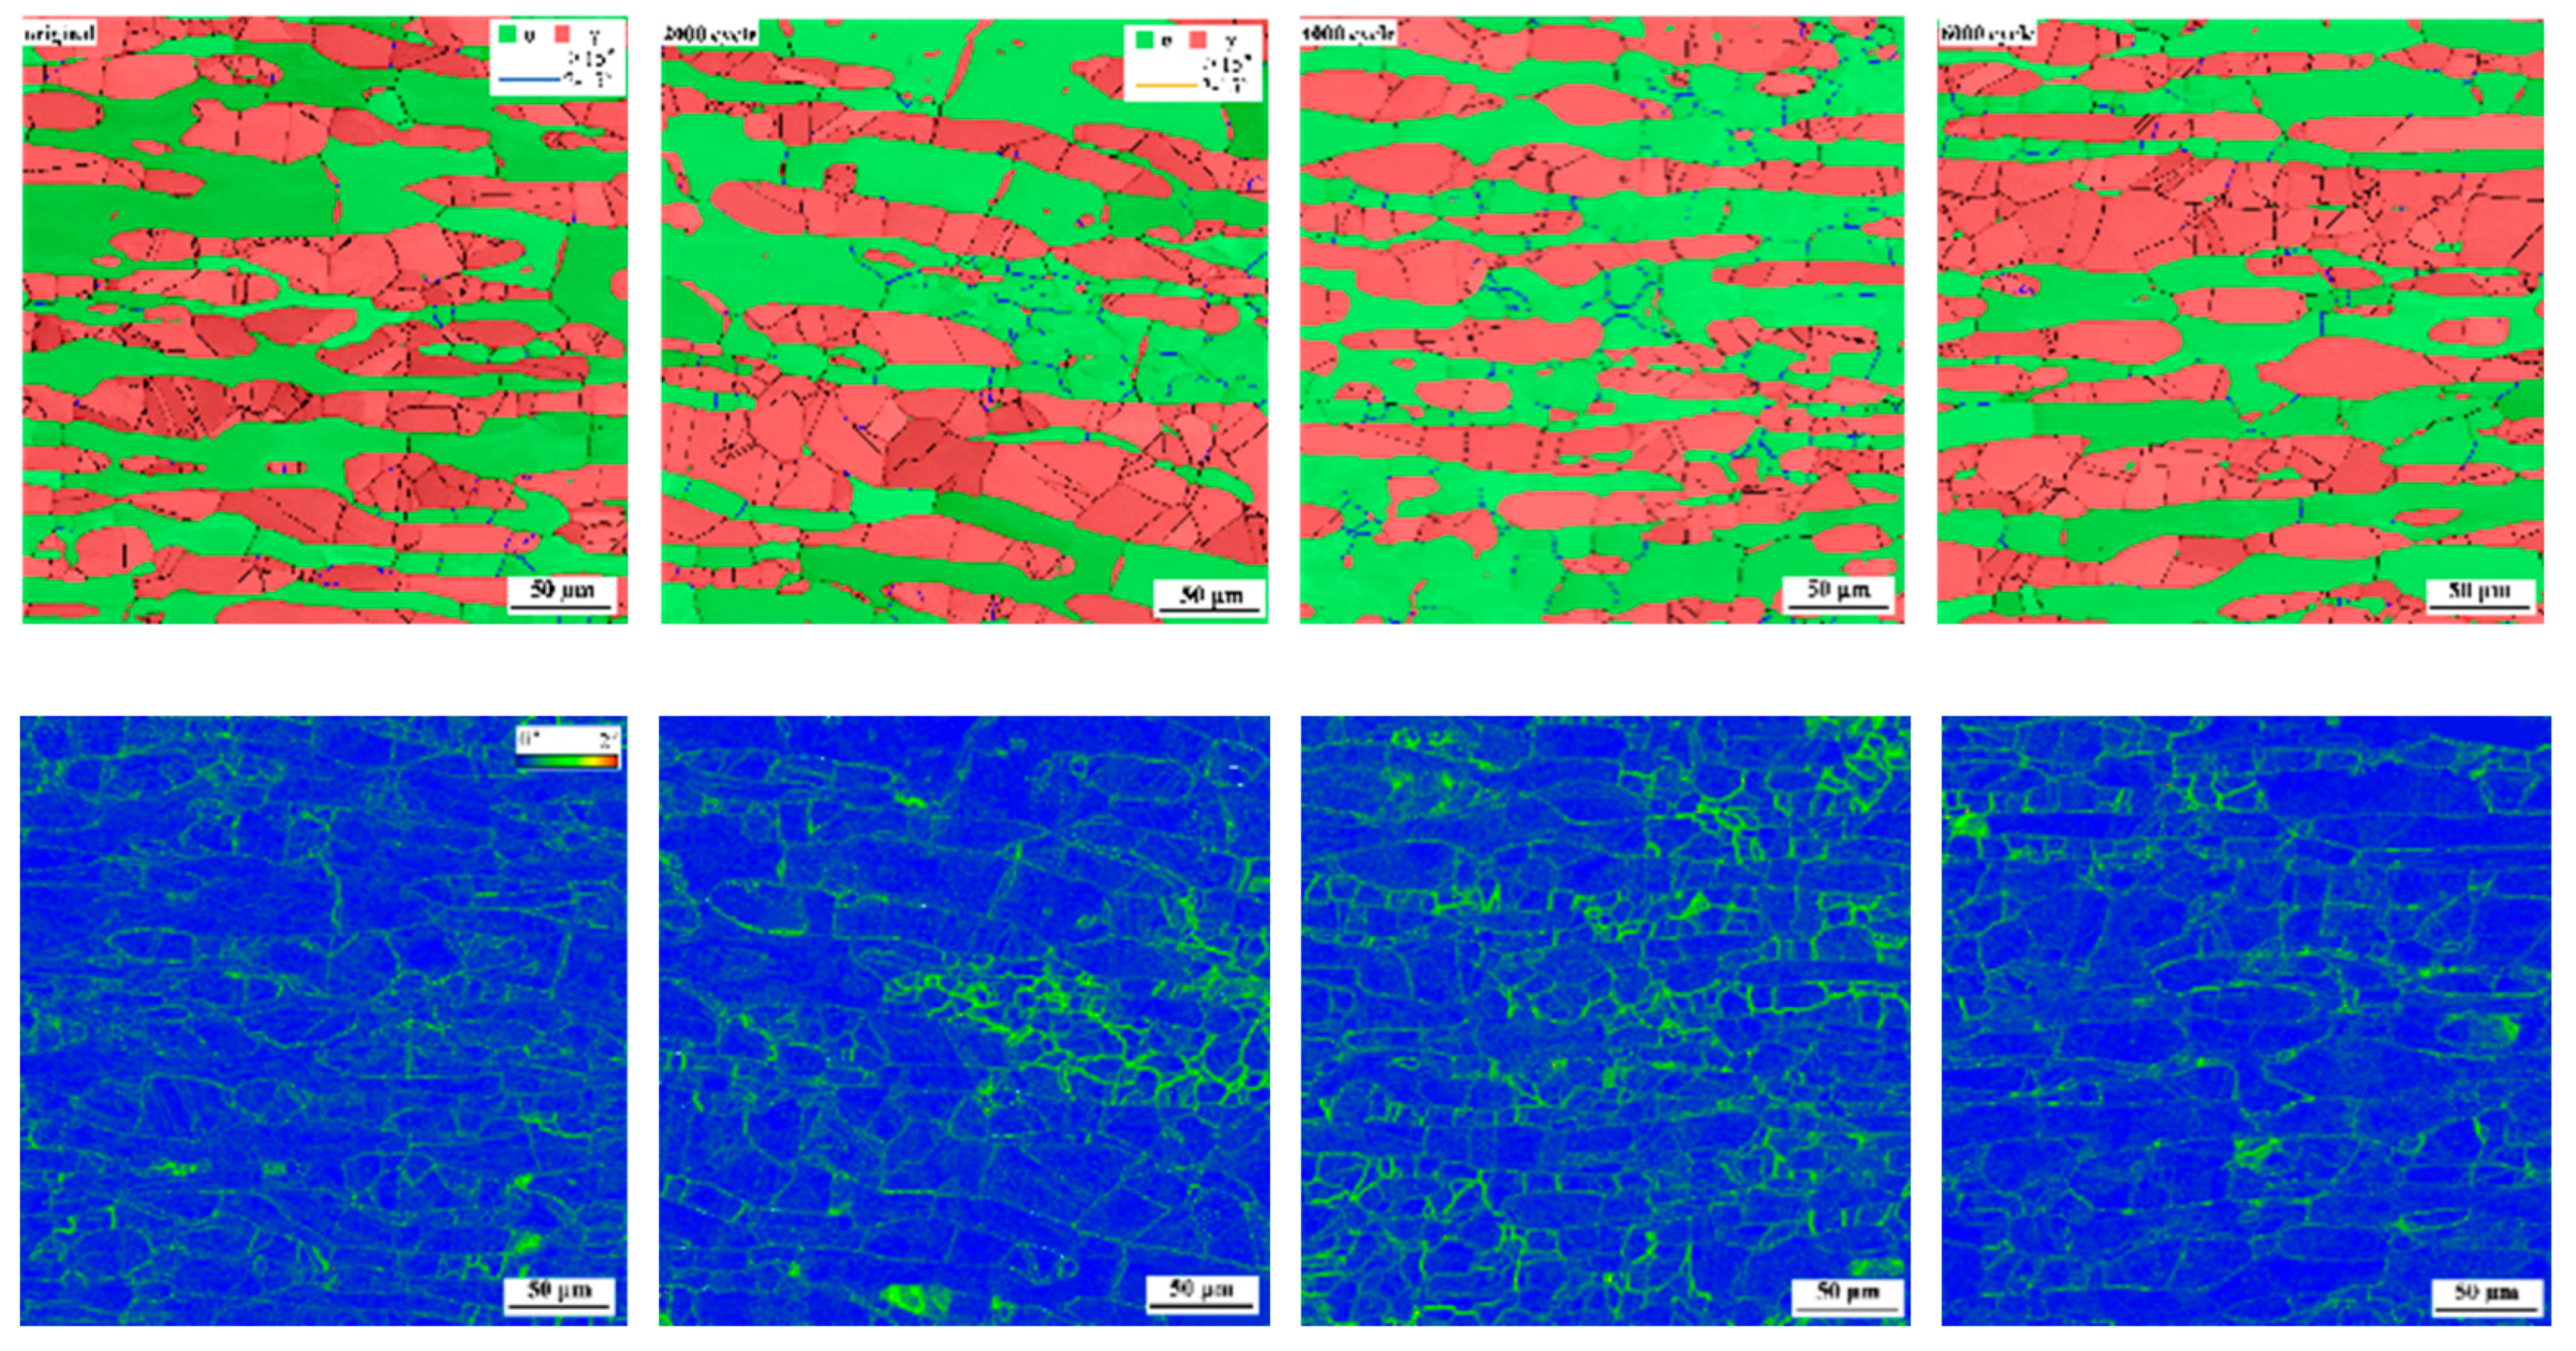
KAM diagram is usually used to characterize the degree of plastic deformation in test area. The large and small angle grain boundaries can reflect the movement, proliferation and entanglement of dislocations to some extent. Fig.3-6 shows the two-phase large and small angle grain boundaries and the corresponding KAM distribution of the test steel from the initial to 6000 cycles. It can be seen that the initial state of the experimental steel after solution treatment is mainly composed of large-angle grain boundaries. The overall KAM value fluctuates little, and the position with large difference is mainly concentrated at the ferrite-austenite phase boundaries, indicating that the solution treatment can restore the dislocation and substructure defects in grains to some extent. As the number of cycles increased to 4000, it was found that the number of subgrain boundaries inside the ferritic grains showed an obvious upward trend. And it can be seen from the KAM diagram that the accumulation of plastic deformation was mainly concentrated in the small angle grain boundaries inside the ferrite, and the KAM value at the phase boundary was also improved compared with the initial state. With the number of cycles increases to 6000, the KAM value in the ferrite grains decreases, indicating that the plastic deformation in the ferrite also begins to transfer to the phase boundary.
Figure 3.
two-phase grain boundary distribution and KAM distribution under the initial state to 6000 cycles.
Figure 3.
two-phase grain boundary distribution and KAM distribution under the initial state to 6000 cycles.
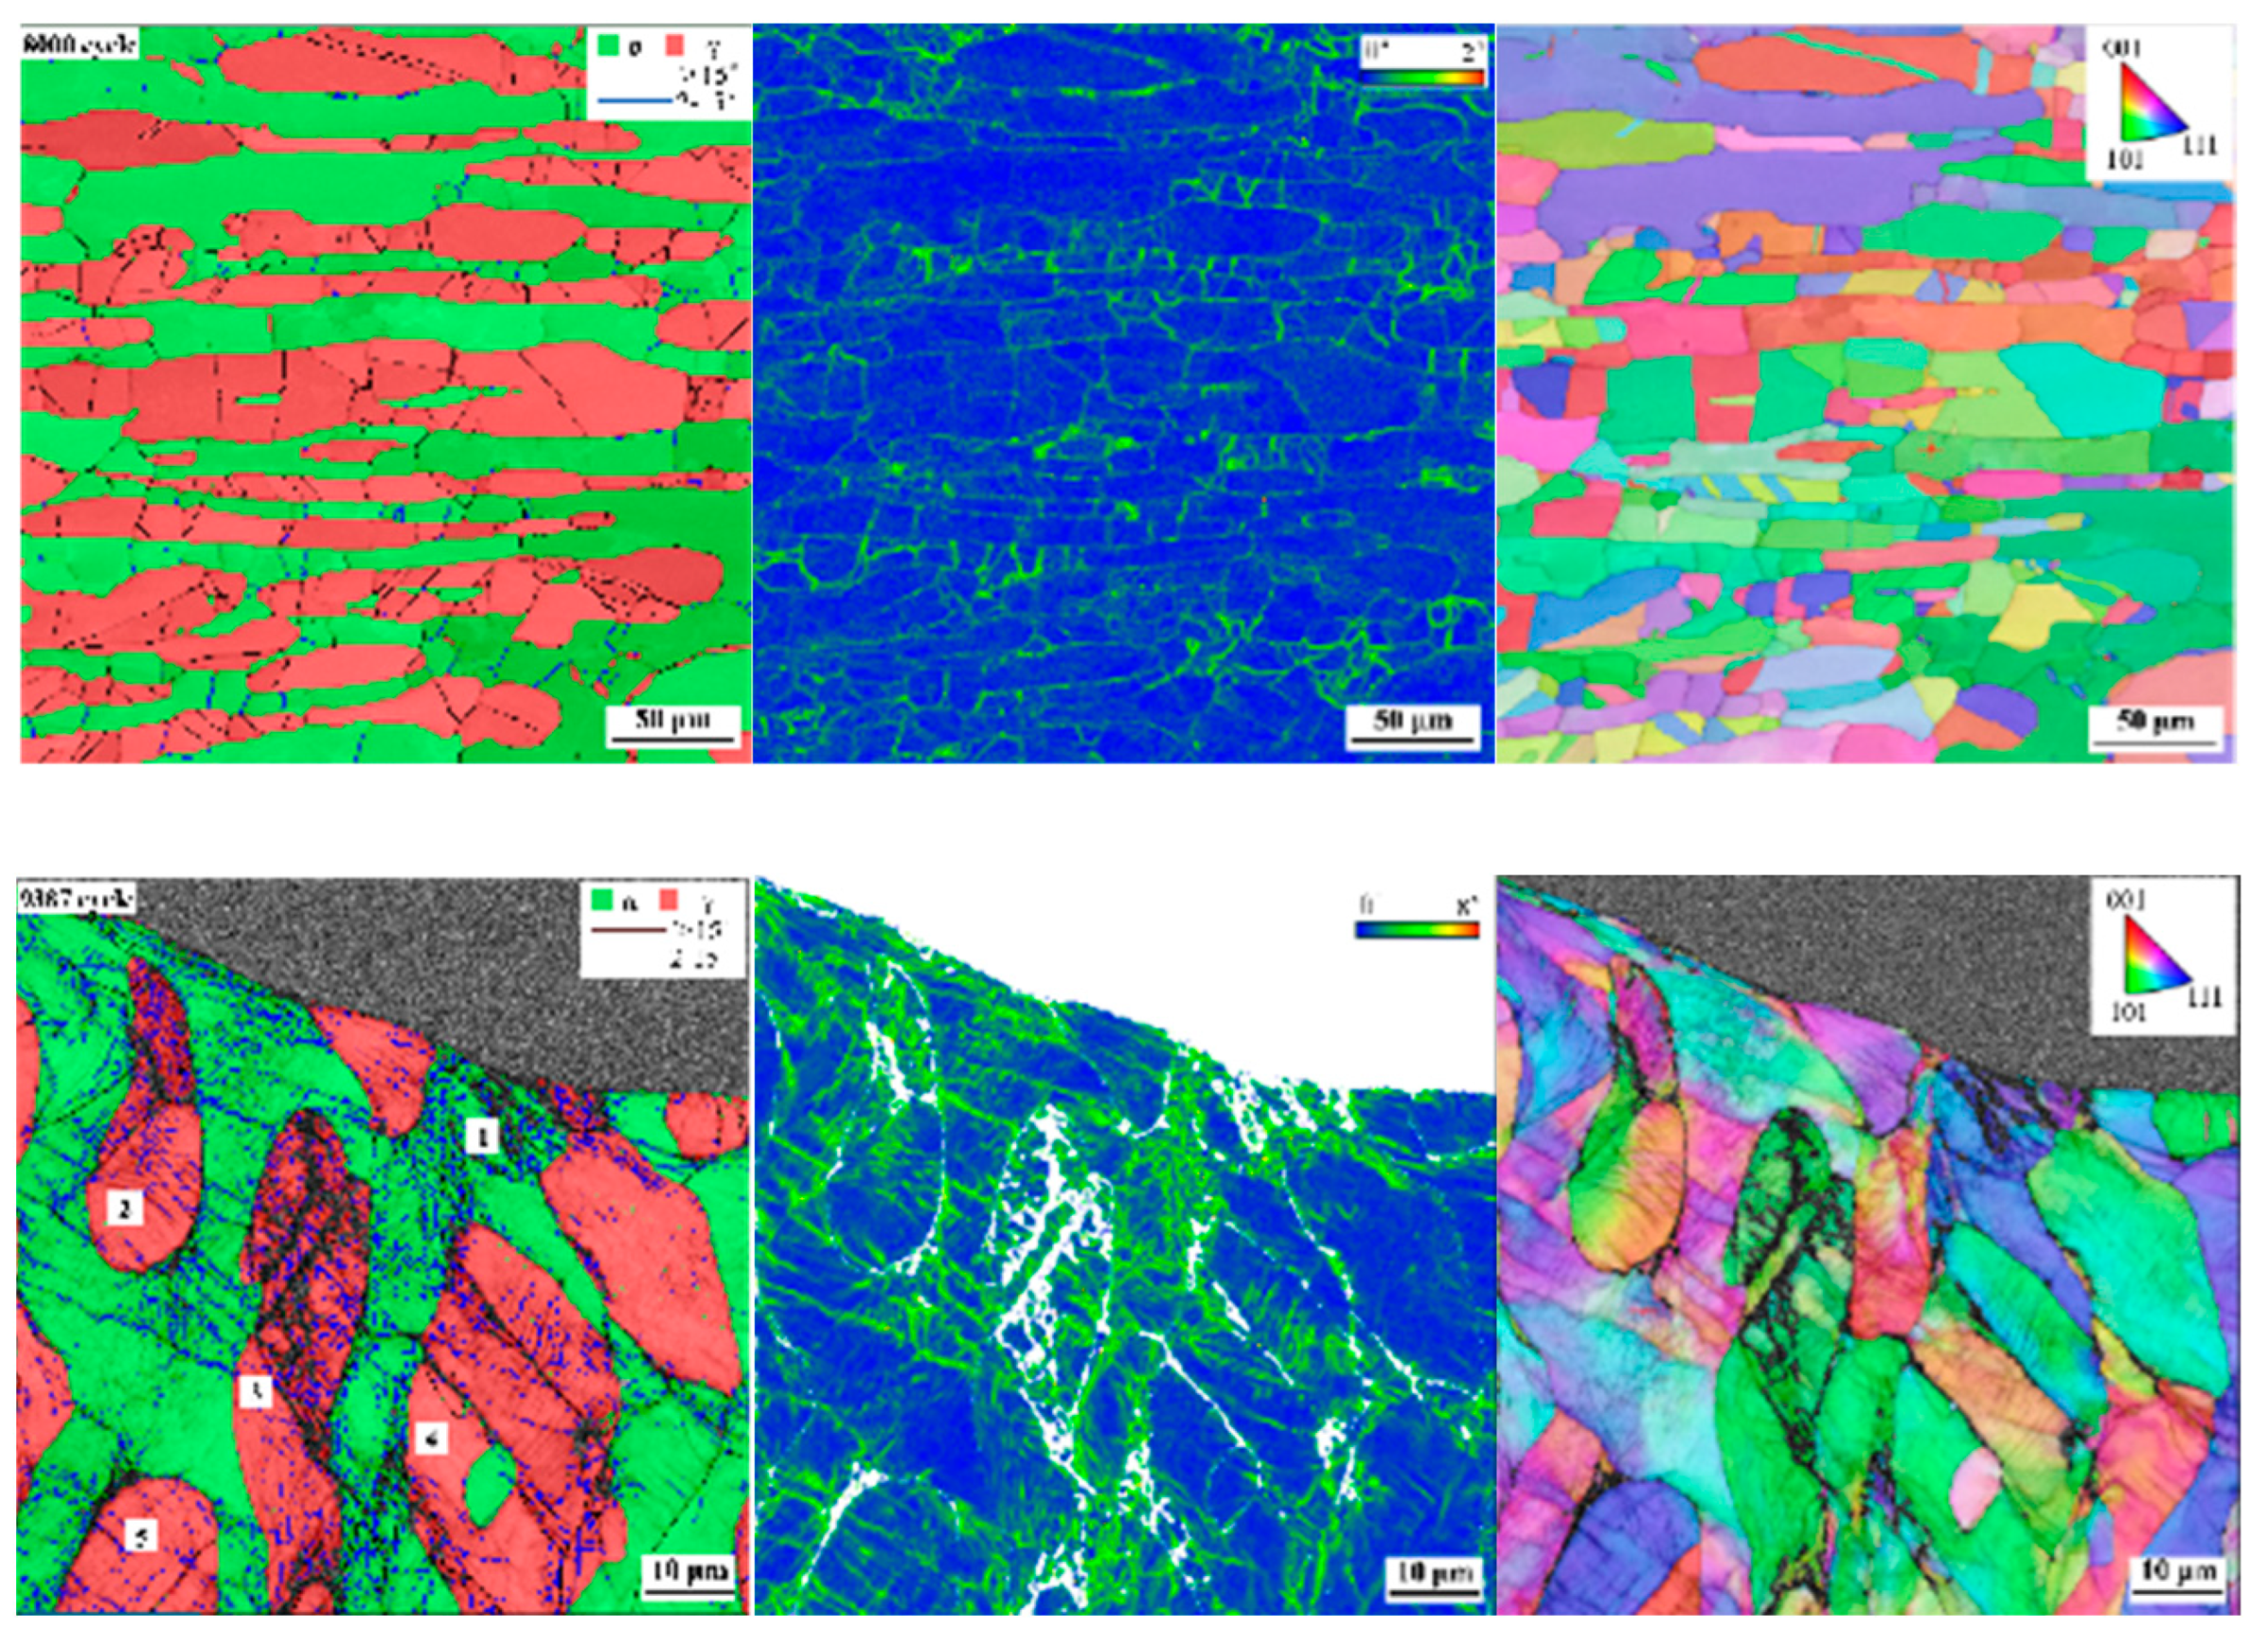
Two-phase grain boundaries, KAM and orientation diagrams of the test steel after 8000 cycles and 9387 cycles are shown in Fig.3-7. It can be seen that after 8000 cycles, the accumulation of plastic deformation is still concentrated in the ferrite grains and the phase boundary and there wasn't formed disorientation in each grain. The fatigue fracture of the tested steel occurred after 9387 cycles, and the two-phase information of the longitudinal parabolic surface of the fracture is shown in Fig.3-7. The small angle grain boundary near the fracture increases greatly. It can be seen from the KAM diagram that a large amount of deformation accumulates in the ferrite, austenite and two-phase phase boundary. The ferrite grain 1 near the edge of the fracture is fragmented and a large gap is formed. The austenite grains 2, 3, 4 and 5 not only form a gap at the phase boundary due to large plastic deformation, but also have a large deformation inside the grain, resulting in grain fragmentation and splitting. The angle between the splitting directions of austenite grains 3 and 4 and the loading direction is about 45°. Austenite is more likely to cause intragranular cracking than ferrite, so after long-term loading, cracks are easy to initiate inside the austenite and the phase boundary. By observing the grain orientation distribution, it is found that the ferrite tends to <111>∥RD (road direction) texture, and there are also orientation differences within the grains, indicating that the long-term dislocation accumulation in the ferrite is easy to cause the grains to rotate. Austenite tends to <101>∥RD texture, and only a small amount of grains rotated.
Figure 3.
8000 and 9387 cycles of two-phase grain boundary distribution, KAM and grain orientation.
Figure 3.
8000 and 9387 cycles of two-phase grain boundary distribution, KAM and grain orientation.
3.5. Relationship between Dislocation Structure and the Number of Cycles
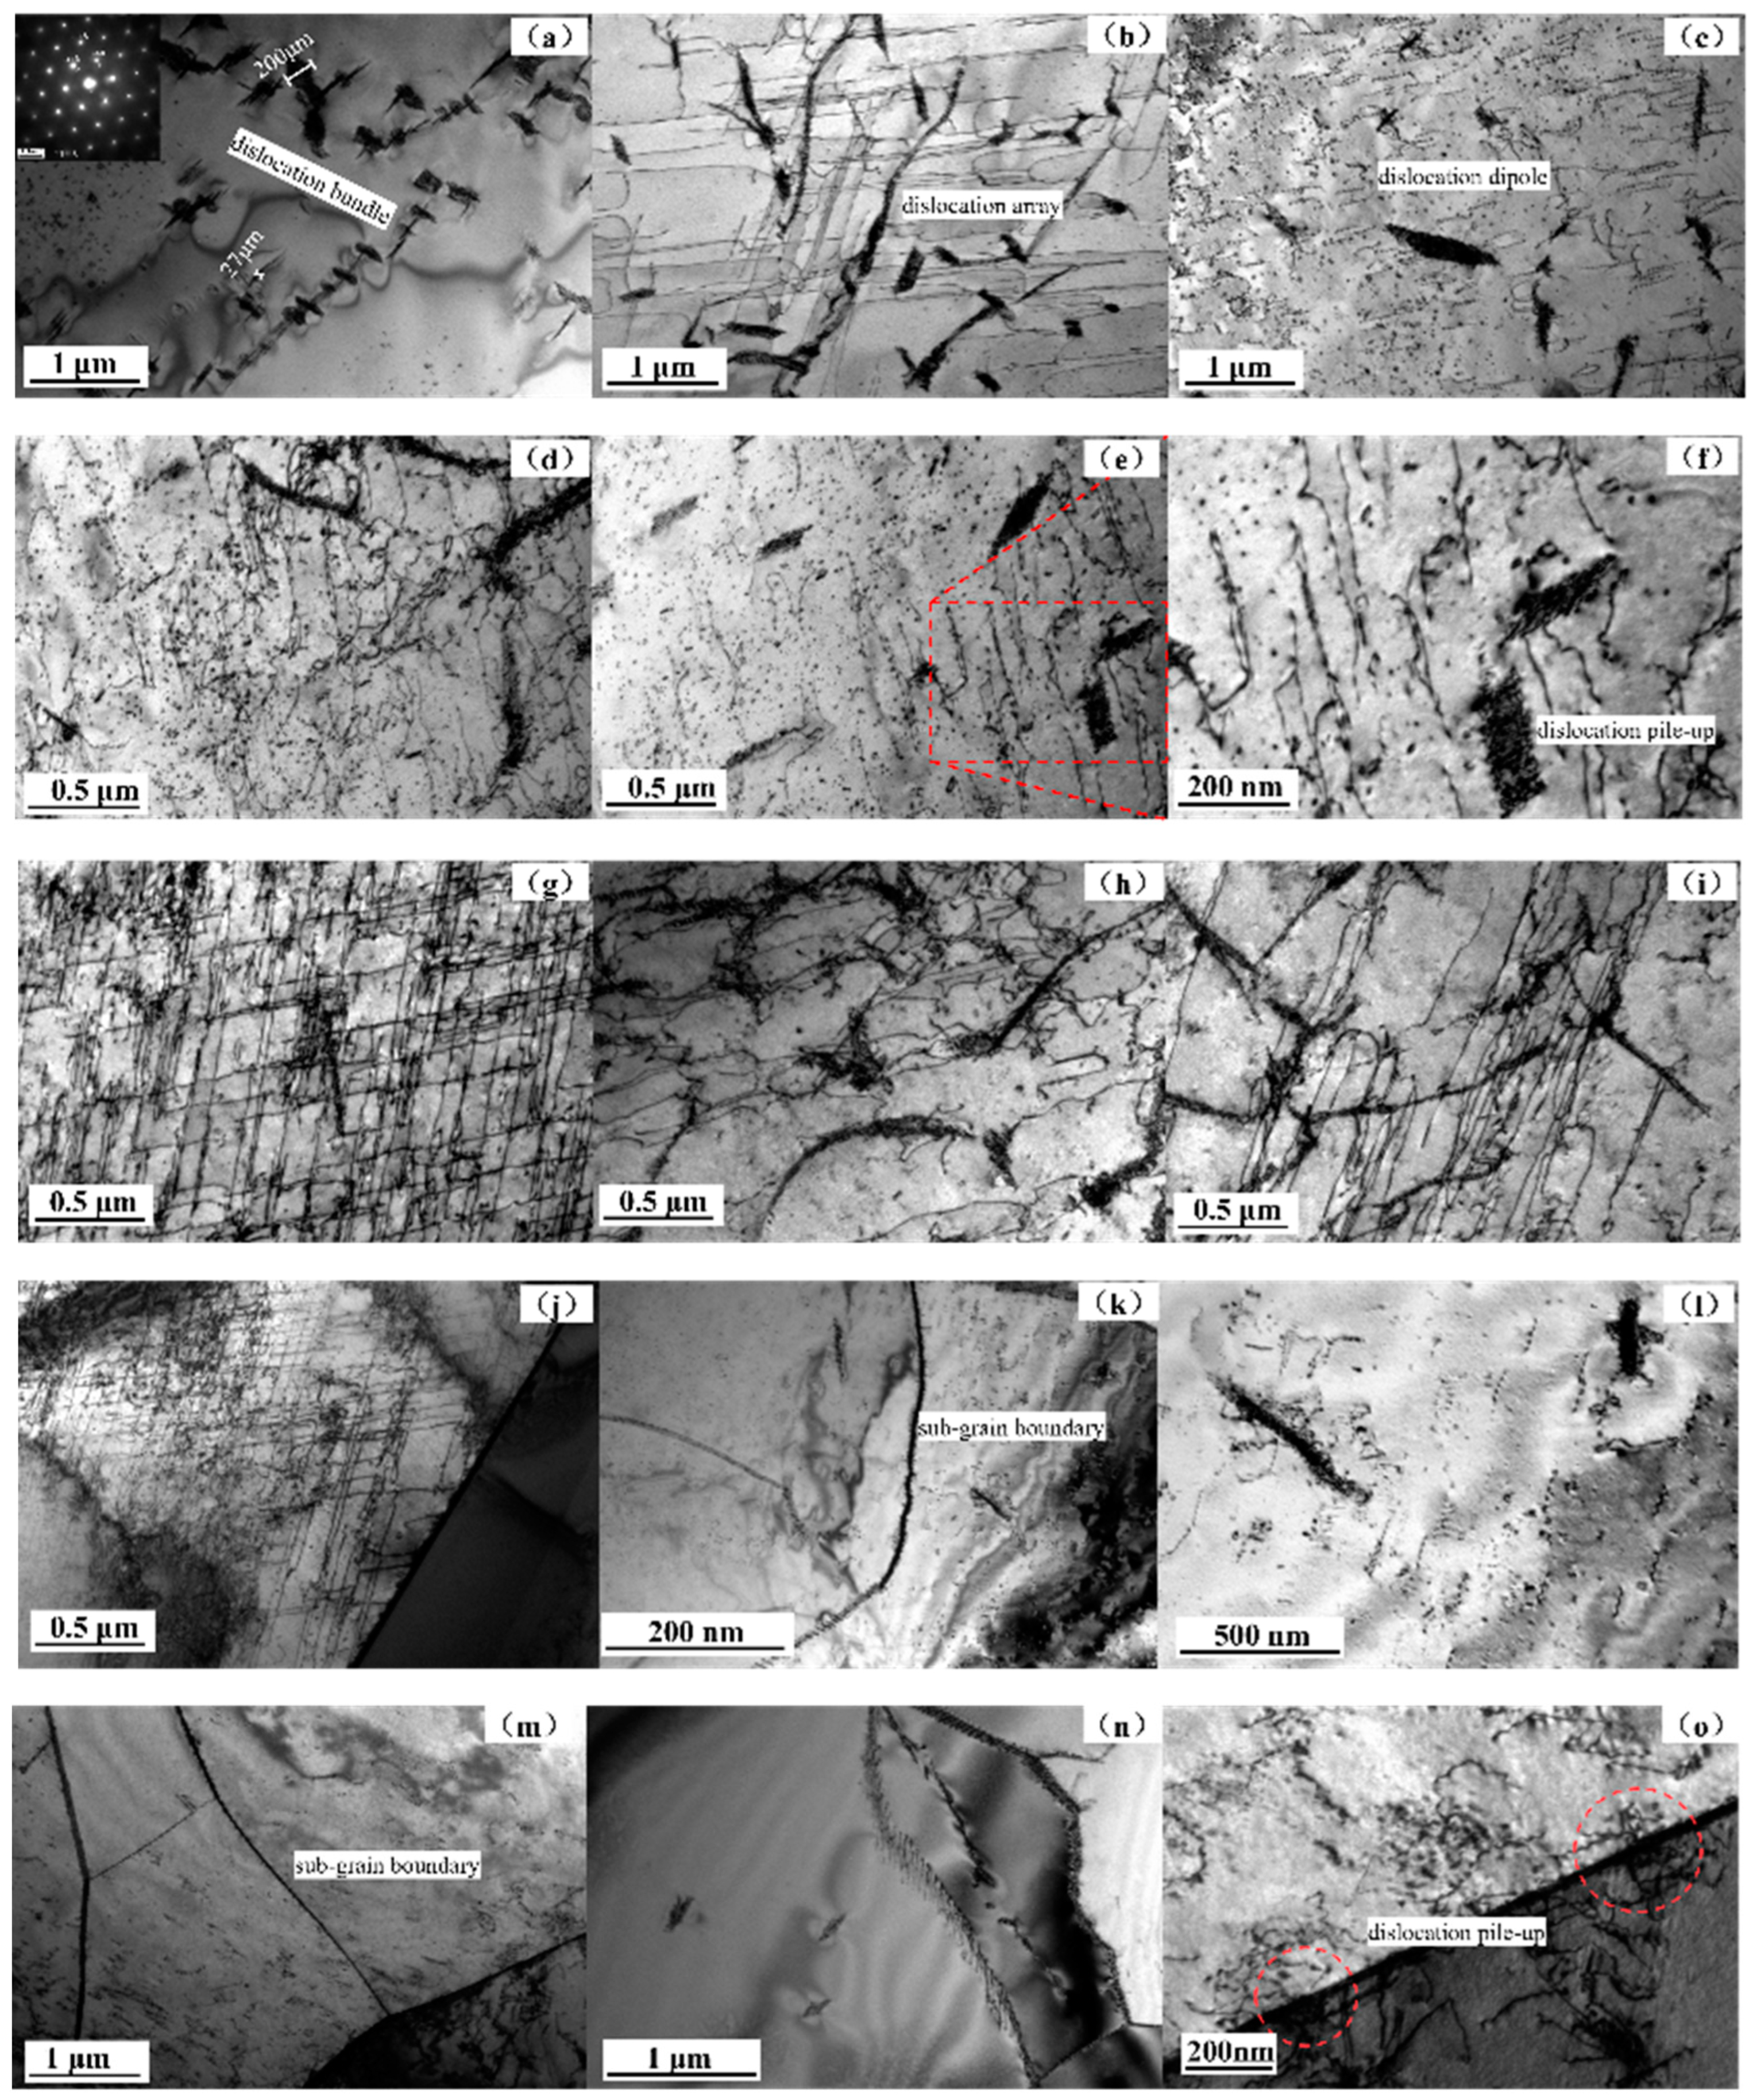
The evolution of dislocation structure during cycling at nanoscale can be observed by TEM. The generation and development of dislocations are related to the overall plastic deformation. Therefore, in order to reveal the essence of fatigue fracture, it is necessary to combine macro and micro methods. Fig.3-8 shows the internal dislocation morphology of ferrite grains from the initial state of the test steel to 8000 cycles. By observing (a-c) in Fig.3-8, it is found that there are still a certain number of dislocations in the initial state of the test steel, and they show three different morphologies : The first is a dislocation bundle with a certain thickness of 27nm ~ 200nm formed by dislocation stacking entanglement, and this dislocation bundle has a certain hindrance to the new dislocation;The second is a parallel and straight dislocation array [
21] in two directions; The third type is the nearly uniform dislocation dipole [
22] formed by the screw dislocation motion. Fig.3-8 (d-f) is the dislocation morphology in ferrite after 2000 cycles, which does not change much, and is still dominated by dislocation bundle and dislocation dipole. When the number of cycles increases to 4000, as shown in Figs.3-8 (g-i), the density of parallel dislocation arrays increases significantly, forming a grid morphology. In Fig.3-8 (j-l) is the dislocation morphology of ferrite after 6000 cycles. It is found that in addition to the continuous increase of the density of dislocation array, subgrain boundaries are formed inside the grains. When the cycles increases to 8000, as shown in Fig.3-8 (m-o), the number of subgrain boundaries begins to increase, and dislocations continue to accumulate at the two-phase phase boundary.
Figure 3.
The dislocation morphology (a-c) in the ferrite grains of the test steel is the initial state ; (d-f) is the state of 2000 cycles ; (g-i) is the state of 4000 cycles ; (j-l) is the state of 6000 cycles ; (m-o) is the state of 8000 cycles.
Figure 3.
The dislocation morphology (a-c) in the ferrite grains of the test steel is the initial state ; (d-f) is the state of 2000 cycles ; (g-i) is the state of 4000 cycles ; (j-l) is the state of 6000 cycles ; (m-o) is the state of 8000 cycles.
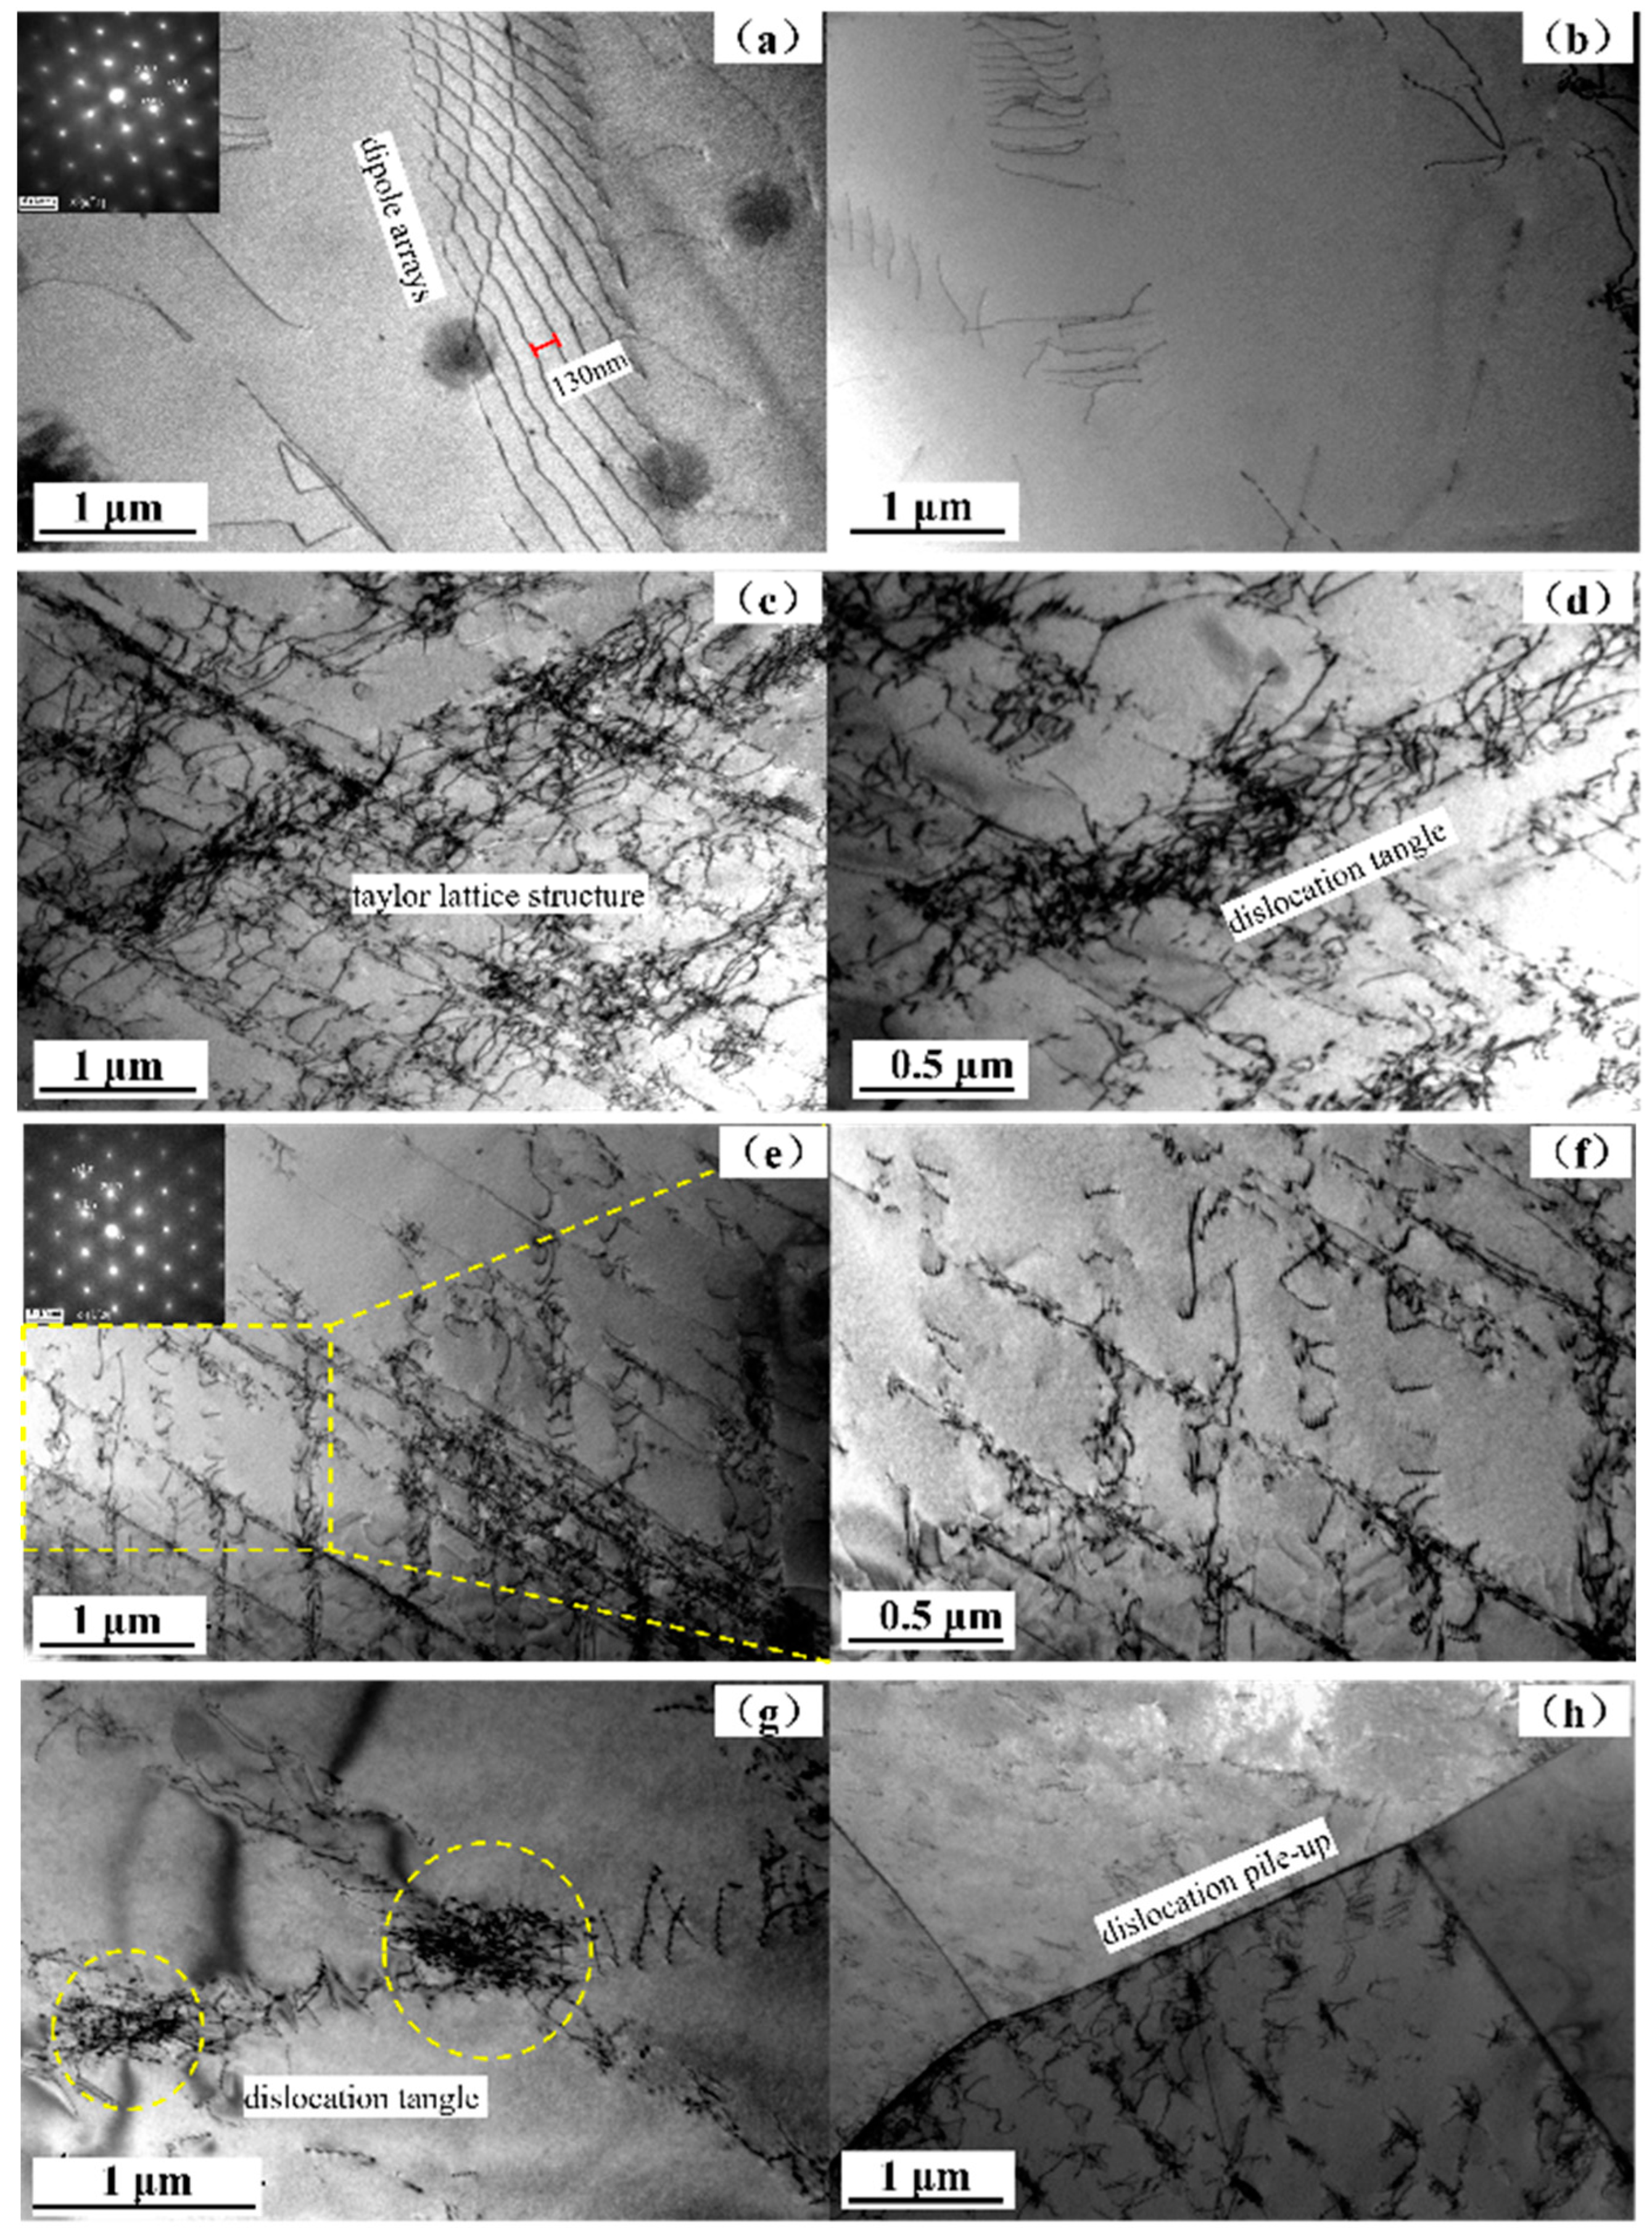
Figs.3-9 show the internal dislocation morphology of austenite from the initial state to 8000 cycles. Among them, (a) and (b) are the internal dislocation morphology of austenite in the initial state, which are mainly composed of dipole arrays [
23] with a spacing of approximately 130nm, and the dipole arrays have been bent many times, indicating that after solution treatment, there are still deformation traces caused by forging and hot rolling in austenite. Figure 3-9 (b) shows the cross-entanglement of the dipole array. After 2000 cycles, the dislocation morphology in austenite changed significantly, as shown in Figs.3-9 (c) and (d). Due to the continuous tension and compression loading, the movement of multiple slip systems is intensified, resulting in severe deformation of the dipole array, increased dislocation entanglement, and an ordered network-like dislocation Taylor lattice structure [
24] is formed inside the grains. It can be seen that a large amount of deformation occurred in austenite at the early stage of fatigue cycle. Figs.3-9 (e) and (f) show the dislocation morphology of austenite after 4000 cycles, which is still dominated by regular grid morphology. When the number of cycles increases to 6000 and 8000 times, the dislocation morphology in austenite is shown as (g) and (h) in Figure 3-9, and the internal dislocation tangles are further aggravated. At the same time, the phase boundary, as a barrier that effectively hinders the dislocation movement, has also accumulated a large number of dislocations.
Figure 3.
The dislocation morphology in austenite grain, (a) and (b) are the initial state; (c) and (d) are the states of 2000 cycles; (e) and (f) are the state of 4000 cycles; (g) and (h) are the state of 6000 and 8000 cycles.
Figure 3.
The dislocation morphology in austenite grain, (a) and (b) are the initial state; (c) and (d) are the states of 2000 cycles; (e) and (f) are the state of 4000 cycles; (g) and (h) are the state of 6000 and 8000 cycles.
3.6. Fatigue Crack Initiation Process
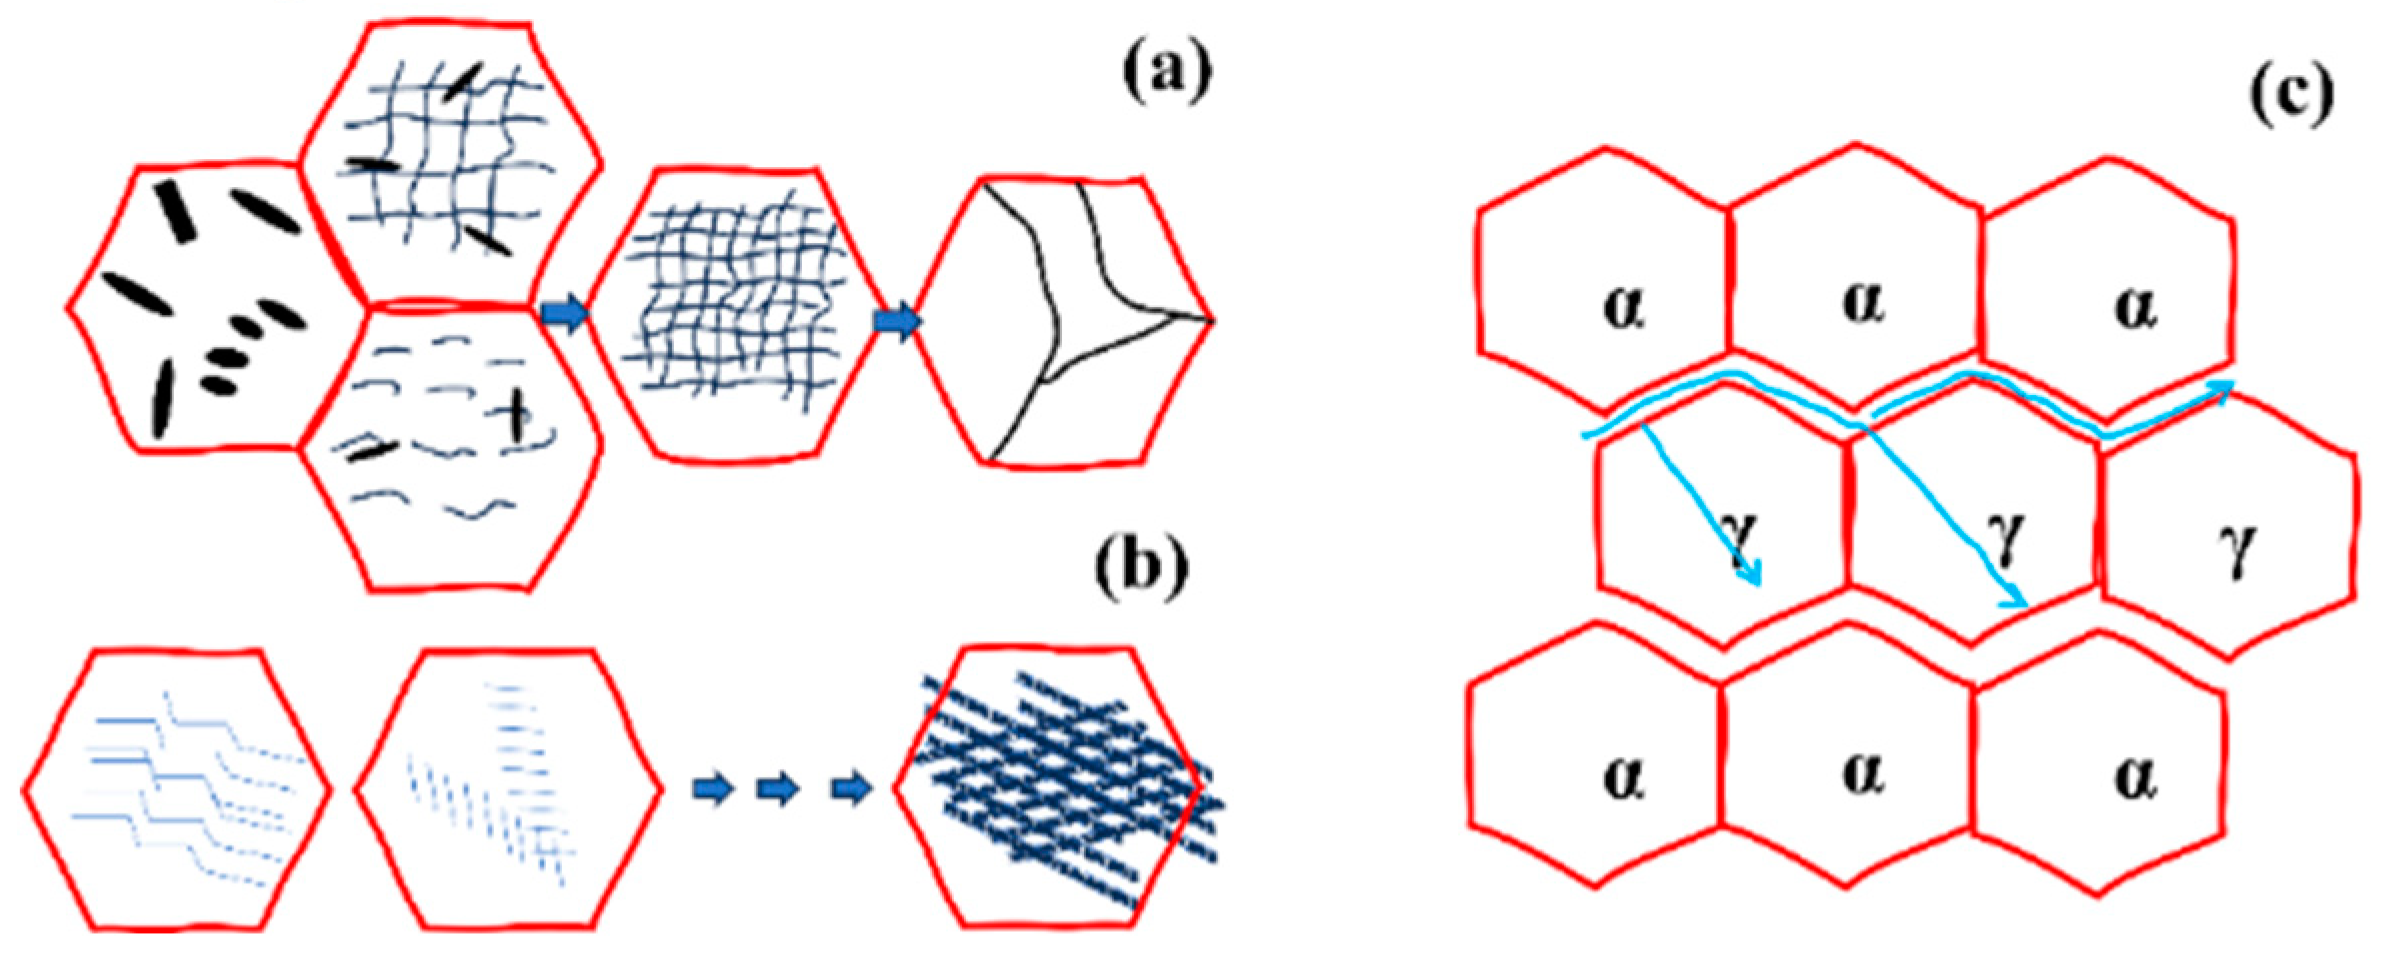
During the fatigue process, the dislocation proliferation and development of the two phases show different trends, which affects the accumulation of plastic deformation and the location of crack initiation. The development process of the two-phase dislocation and the initiation of fatigue cracks are shown in Figs.3-10. Dislocation tangles in ferrite grains are increasing, and a large number of dislocations remain inside the grains. The increasing density of dislocation arrays will eventually evolve into subgrain boundaries. However, the dislocations in austenite are mainly the continuous increase of dislocation dipoles, and finally the network Taylor lattice structure is formed, and most of the dislocations are accumulated in several slip systems and accumulated at the phase boundary of the two phases. Therefore, fatigue cracks are more likely to initiate at the two-phase boundaries and within the austenite grains.
Figure 3.
ferrite phase dislocation evolution (a), austenite phase dislocation evolution (b), fatigue crack initiation and propagation (c).
Figure 3.
ferrite phase dislocation evolution (a), austenite phase dislocation evolution (b), fatigue crack initiation and propagation (c).
4. Conclusion
In early 2000 cycles, the microhardness of two phases of S32750 duplex stainless steel is slightly increased. When the number of cycles increased to 4000 times, the microhardness of ferrite increased significantly, indicating that a large amount of plastic deformation was accumulated in ferrtic grains. After fatigue fracture, the microhardness of ferrite and austenite increased by 23 and 87, respectively, and the strain hardening rate of austenite was much higher than that of ferrite.
After 9387 cycles, fatigue fracture occurred. Near the fracture, the austenite grains are more likely to be fragmented, and the phase boundaries are also easy to form gaps. Therefore, micro-cracks are easy to initiate in austenite grains and phase boundaries. After fatigue fracture, ferrite grains tend to form <111>∥RD texture, and austenite tends to form <101>∥RD texture.
With the increase of cycle numbers, the development of dislocation morphology in ferrite and austenite shows different trends. The initial dislocation beam and dislocation array in ferrite gradually change into sub-grain boundary structure. The initial dipole array in austenite gradually deforms and tangles, and finally forms a regular network Taylor lattice structure.
References
- Francis, R.; Byrne, G. Duplex Stainless Steels—Alloys for the 21st Century. Metals 2021, 11, 836. [Google Scholar] [CrossRef]
- Jing, Q.; Fang, X. Application of Stainless Steel Reinforcements in the Hong Kong-Zhuhai-Macao Bridge 2016 International Conference on Architectural Engineering and Civil Engineering. 2017.
- Zhigang, S. Research and Development Progress of Super Duplex Stainless Steel in China. Third China Iron and Steel Annual Conference Papers-Conference Invited Report & Sub-conference Invited Report 2022, 71.
- Han, F.; Xiaoyu, Z.; Hu, L.; Zhigang, S. Development status and trend of super duplex stainless steel. Journal of Iron and Steel Research 2015, 27, 1–5. [Google Scholar]
- Norimitsu, K.; Tatsuya, N.; Osamu, U.; Valentin, T.; Klaus-Peter, W. Tensile properties and deformation behavior of ferrite and austenite duplex stainless steel at cryogenic temperature. Materials Science & Engineering A 2020, 801, 140442. [Google Scholar]
- de Moura, A.N.; Neto, C.A.R.; Castro, N.A.; Vieira, E.A.; Orlando, M.T.D. Microstructure, crystallographic texture and strain hardening behavior in hot tensile tests of UNS S32304 Lean Duplex stainless steel. J. Mater. Res. Technol. 2021, 12, 1065–1079. [Google Scholar] [CrossRef]
- Abboud, A.; AlHassan, A.; Dönges, B.; Micha, J.S.; Hartmann, R.; Strüder, L.; Christ, H.-J.; Pietsch, U. VHCF damage in duplex stainless steel revealed by microbeam energy-dispersive X-ray Laue diffraction. Int. J. Fatigue 2021, 151, 106358. [Google Scholar] [CrossRef]
- Polák, J.; Petráš, R.; Heczko, M.; Kuběna, I.; Kruml, T.; Chai, G. Low cycle fatigue behavior of Sanicro25 steel at room and at elevated temperature. Mater. Sci. Eng. A 2014, 615, 175–182. [Google Scholar] [CrossRef]
- Heczko, M.; Polák, J.; Kruml, T. Microstructure and dislocation arrangements in Sanicro 25 steel fatigued at ambient and elevated temperatures. Mater. Sci. Eng. A 2017, 680, 168–181. [Google Scholar] [CrossRef]
- Zhou, J.; Sun, Z.; Kanouté, P.; Retraint, D. Experimental analysis and constitutive modelling of cyclic behavior of 316L steels including hardening/softening and strain range memory effect in LCF regime. International Journal of Plasticity 2018, 107. [Google Scholar]
- Kundu, A.; Field, D.P.; Chakraborti, P.C. Influence of strain amplitude on the development of dislocation structure during cyclic plastic deformation of 304 LN austenitic stainless steel. Mater. Sci. Eng. A 2019, 762, 138090. [Google Scholar] [CrossRef]
- Pham, M.; Holdsworth, S. Role of microstructural condition on fatigue damage development of AISI 316L at 20 and 300°C. Int. J. Fatigue 2013, 51, 36–48. [Google Scholar] [CrossRef]
- Baofeng, G.; Qifei, Z.; Chen, L.; Xiaomin, G.; Na, L.; Xingang, L.; Jin, M. Influence of annealing temperature on the strain-hardening behavior of a lean duplex stainless steel. Materials Science & Engineering A 2018, 722, 216–224. [Google Scholar]
- Hongwang, F.; Dönges, B.; Krupp, U.; Pietsch, U.; Fritzen, C.P.; Xinbing, Y.; et al. Microcrack initiation mechanism of a duplex stainless steel under very high cycle fatigue loading condition: The significance of load partitioning and micro residual stresses. Acta Materialia 2020, 199, 278–287. [Google Scholar]
- Haicheng, Y.; Yuhui, Y.; Xiaoyang, L.; Zhangxian, T.; Guilin, W. Analysis of Composition, Properties and Precipitates of Duplex Stainless Steel. Special Steel 2019, 40, 53–58. [Google Scholar]
- Li, S.X. Effects of inclusions on very high cycle fatigue properties of high strength steels. Int. Mater. Rev. 2012, 57, 92–114. [Google Scholar] [CrossRef]
- Totten, G. Fatigue crack propagation. advanced materials & processes 2008, 166, 39–41. [Google Scholar]
- Tofique, M.; Bergström, J.; Svensson, K.; Johansson, S.; Peng, R. ECCI/EBSD and TEM analysis of plastic fatigue damage accumulation responsible for fatigue crack initiation and propagation in VHCF of duplex stainless steels. Int. J. Fatigue 2017, 100, 251–262. [Google Scholar] [CrossRef]
- Degallam, S.; Sedwuki, A.; Degallaix, G.; Kruml, T.; Polák, J. FATIGUE DAMAGE IN AUSTENITIC-FERRITIC DUPLEX STAINLESS STEELS. Fatigue Fract. Eng. Mater. Struct. 1995, 18, 65–77. [Google Scholar] [CrossRef]
- Strubbia, R.; Hereñú, S.; Giertler, A.; Alvarez-Armas, I.; Krupp, U. Experimental characterization of short crack nucleation and growth during cycling in lean duplex stainless steels. Int. J. Fatigue 2014, 65, 58–63. [Google Scholar] [CrossRef]
- Soares, G.C.; Queiroz, R.R.U.; Santos, L.A. Effects of Dynamic Strain Aging on Strain Hardening Behavior, Dislocation Substructure, and Fracture Morphology in a Ferritic Stainless Steel. Met. Mater. Trans. A 2019, 51, 725–739. [Google Scholar] [CrossRef]
- Kim, B.K.; Kim, D.-I.; Choi, I.-S.; Jung, W.S.; Kwun, S.I. High temperature low cycle fatigue properties of 24Cr ferritic stainless steel for SOFC applications. Mater. Sci. Eng. A 2013, 577, 81–86. [Google Scholar] [CrossRef]
- Li, P.; Li, S.; Wang, Z.; Zhang, Z. Unified factor controlling the dislocation evolution of fatigued face-centered cubic crystals. Acta Mater. 2017, 129, 98–111. [Google Scholar] [CrossRef]
- Peter, R. Dislocation patterning and bunching in crystals and epitaxial layers-a review. Crystal Research and Technology 2017, 52, 1–15. [Google Scholar]
Table 1.
Main chemical composition of test steel ( mass fraction % ).
Table 1.
Main chemical composition of test steel ( mass fraction % ).
| C |
Si |
Mn |
P |
S |
Cr |
Ni |
Cu |
Mo |
N |
O |
| 0.021 |
0.37 |
0.68 |
0.019 |
<0.0004 |
25.54 |
6.28 |
0.15 |
3.90 |
0.28 |
0.0022 |
|
Disclaimer/Publisher’s Note: The statements, opinions and data contained in all publications are solely those of the individual author(s) and contributor(s) and not of MDPI and/or the editor(s). MDPI and/or the editor(s) disclaim responsibility for any injury to people or property resulting from any ideas, methods, instructions or products referred to in the content. |
© 2024 by the authors. Licensee MDPI, Basel, Switzerland. This article is an open access article distributed under the terms and conditions of the Creative Commons Attribution (CC BY) license (http://creativecommons.org/licenses/by/4.0/).
