Submitted:
20 May 2024
Posted:
21 May 2024
You are already at the latest version
Abstract

Keywords:
1. Introduction
2. Theory and Method
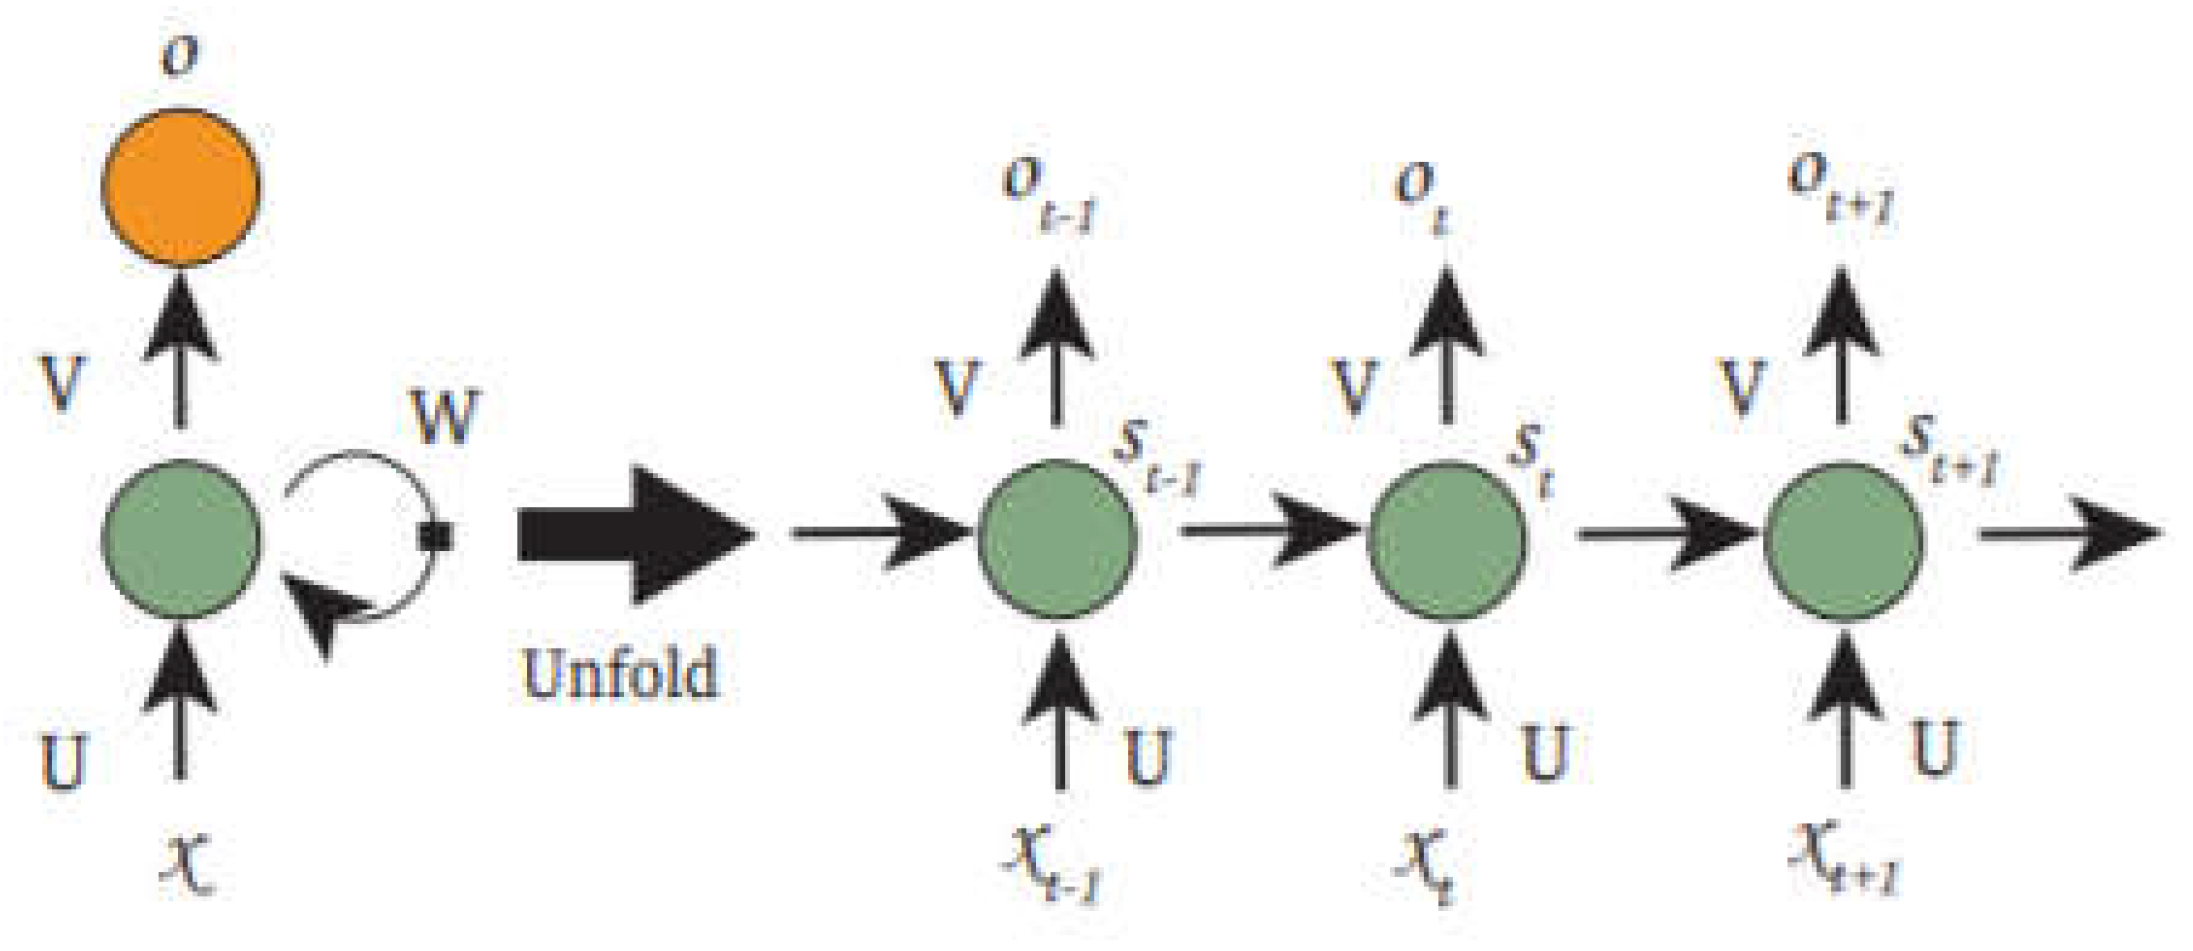
2.1. Recurrent Neural Network
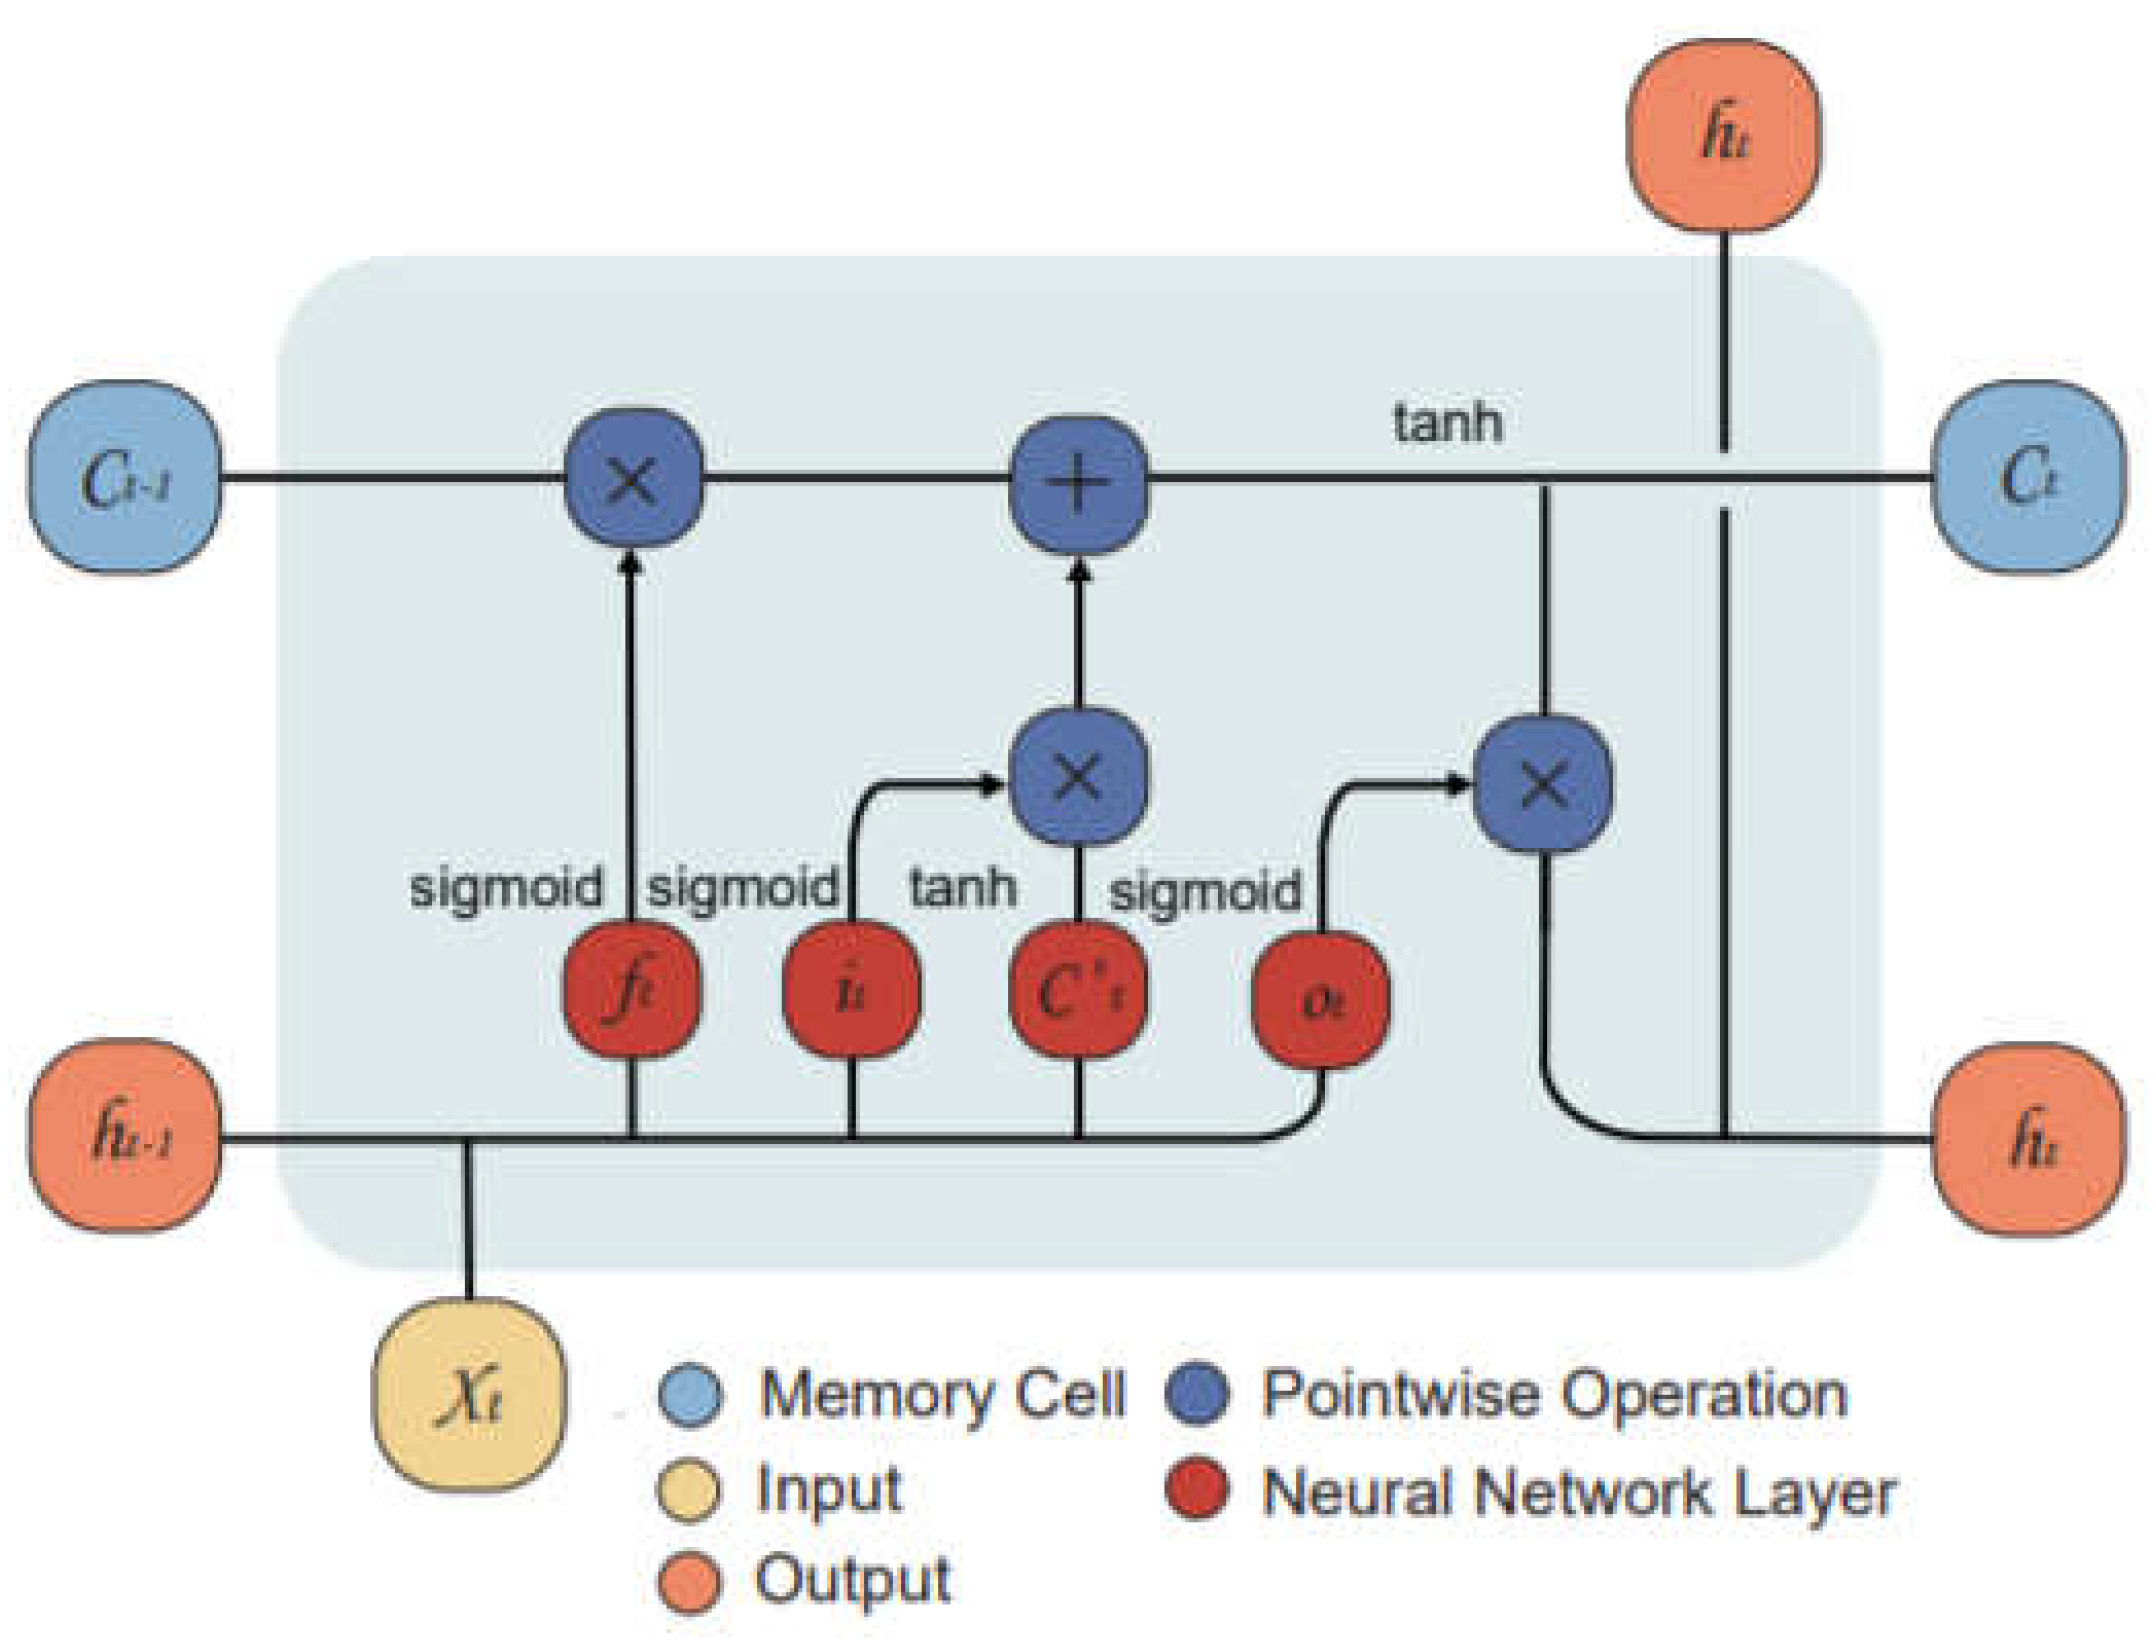
2.2. Long Short-Term Memory Neural Network
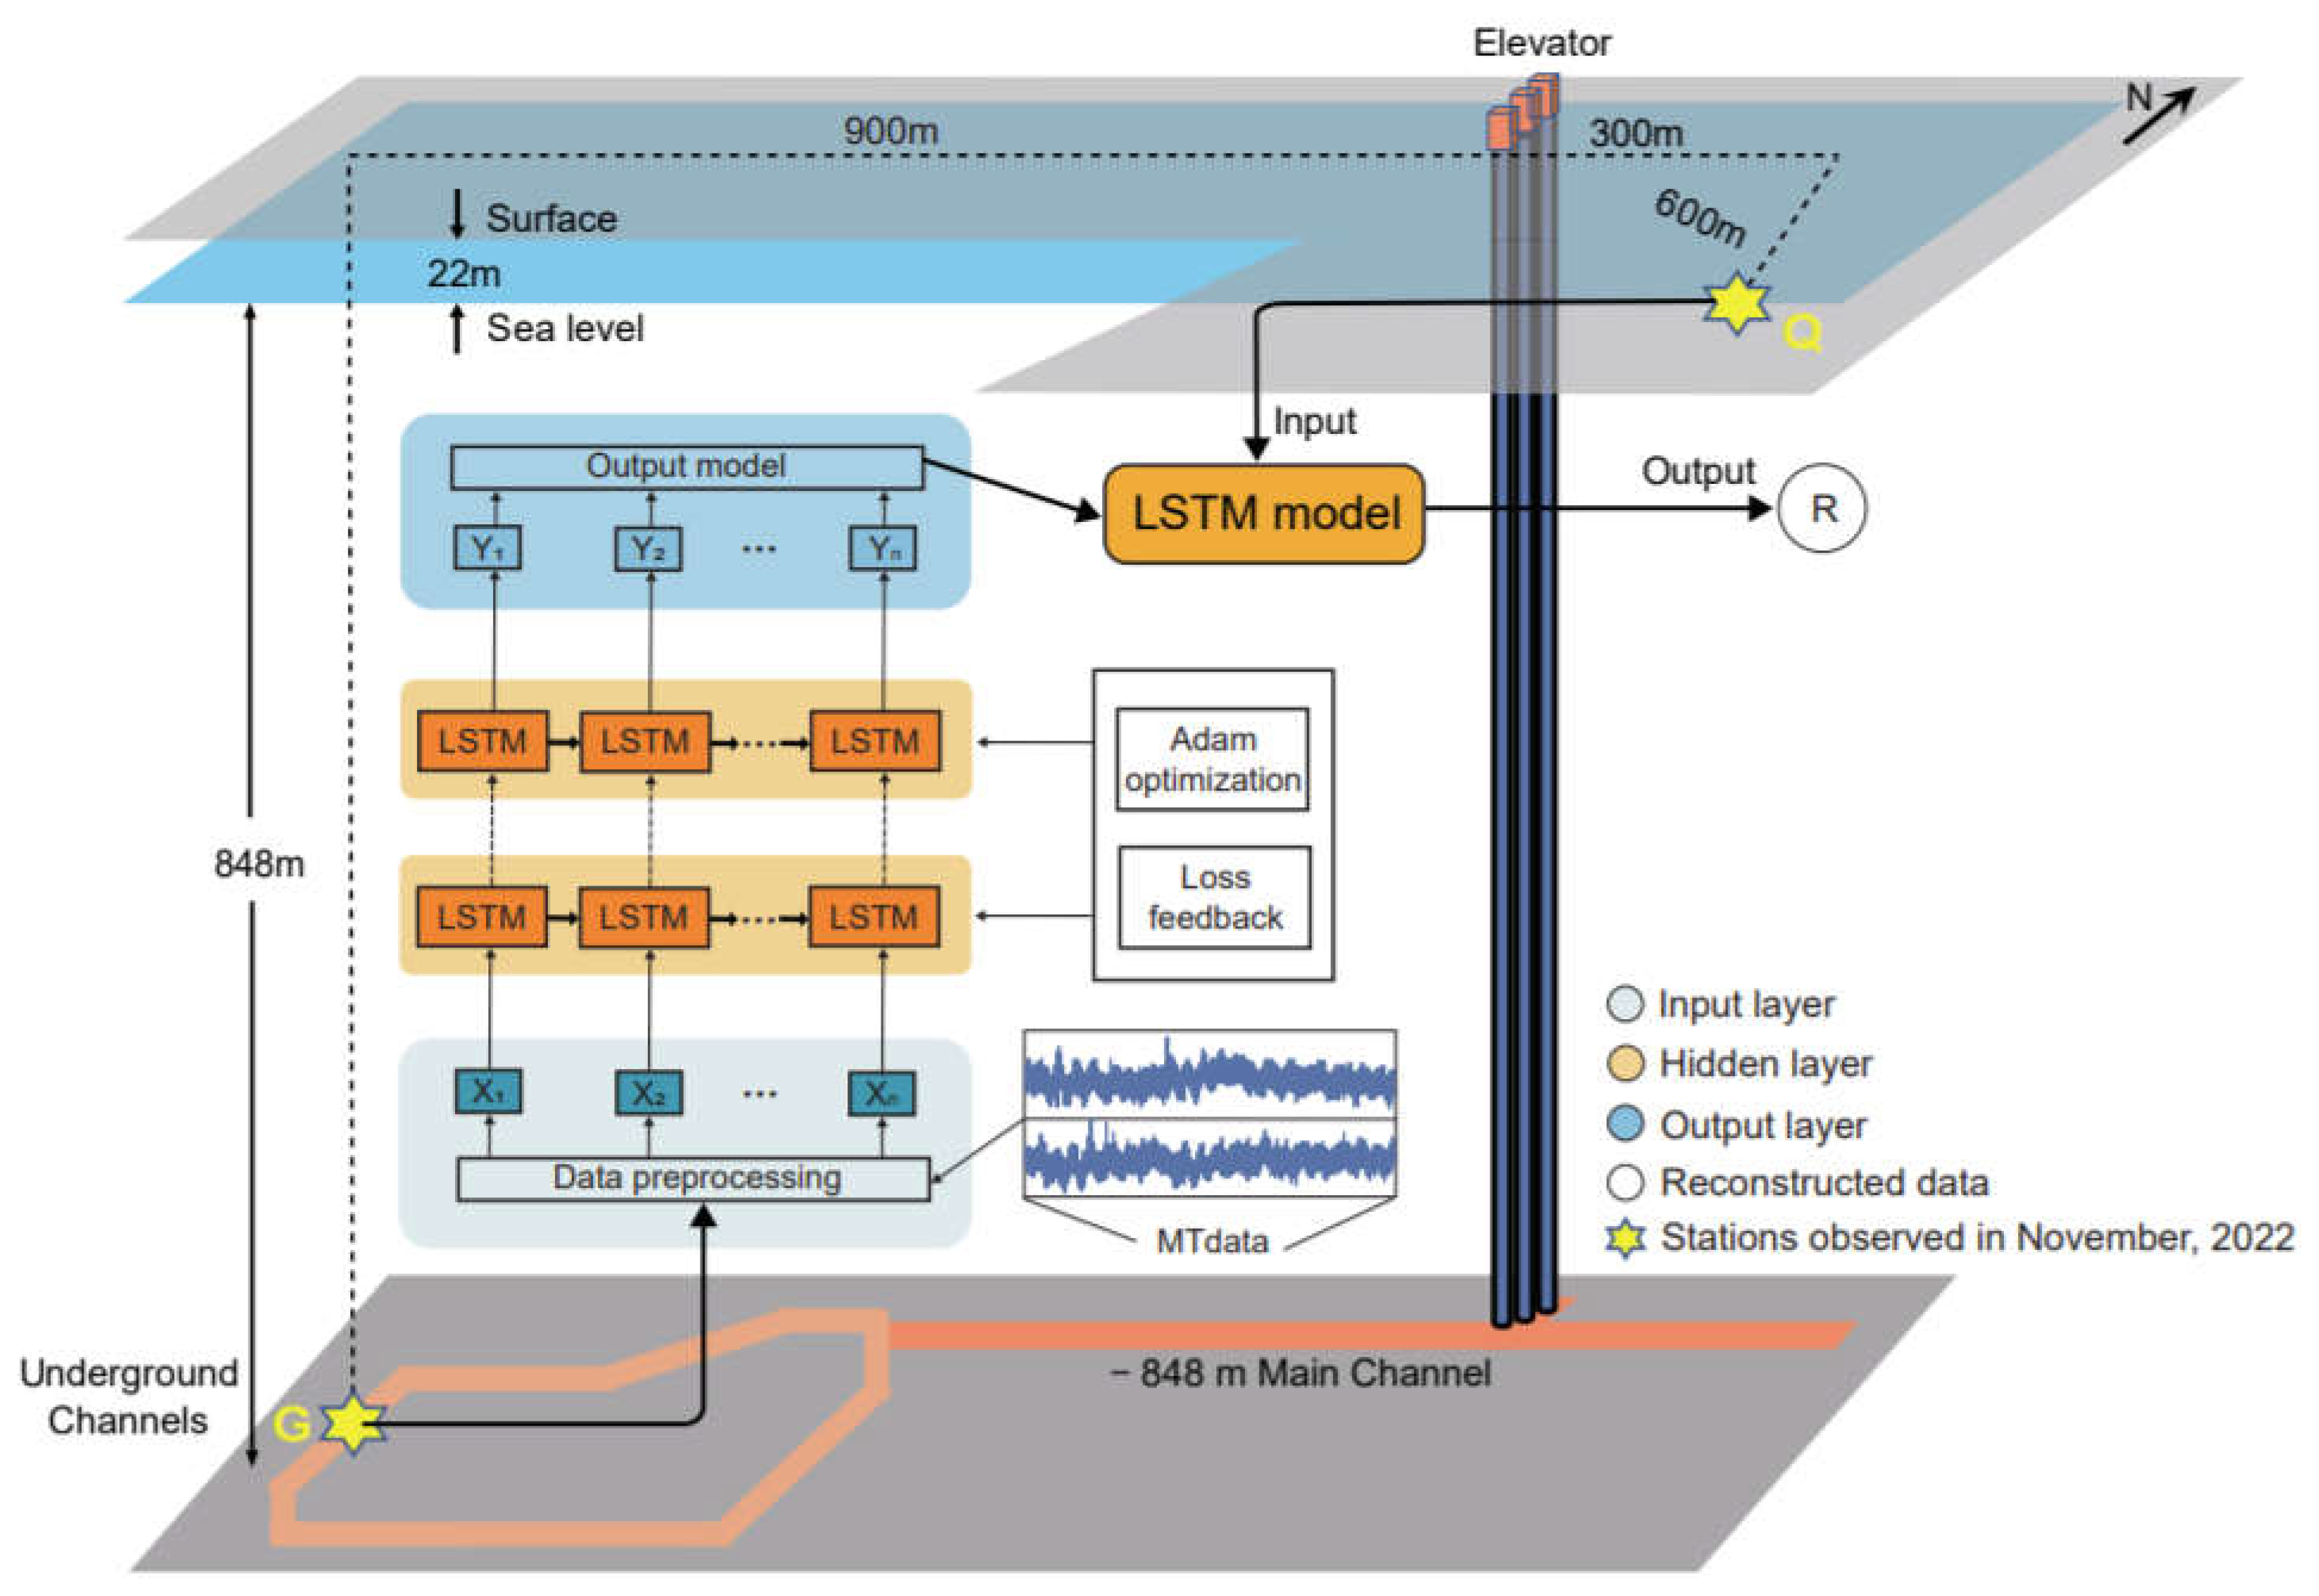
2.3. Reconstruction of Electromagnetic Data
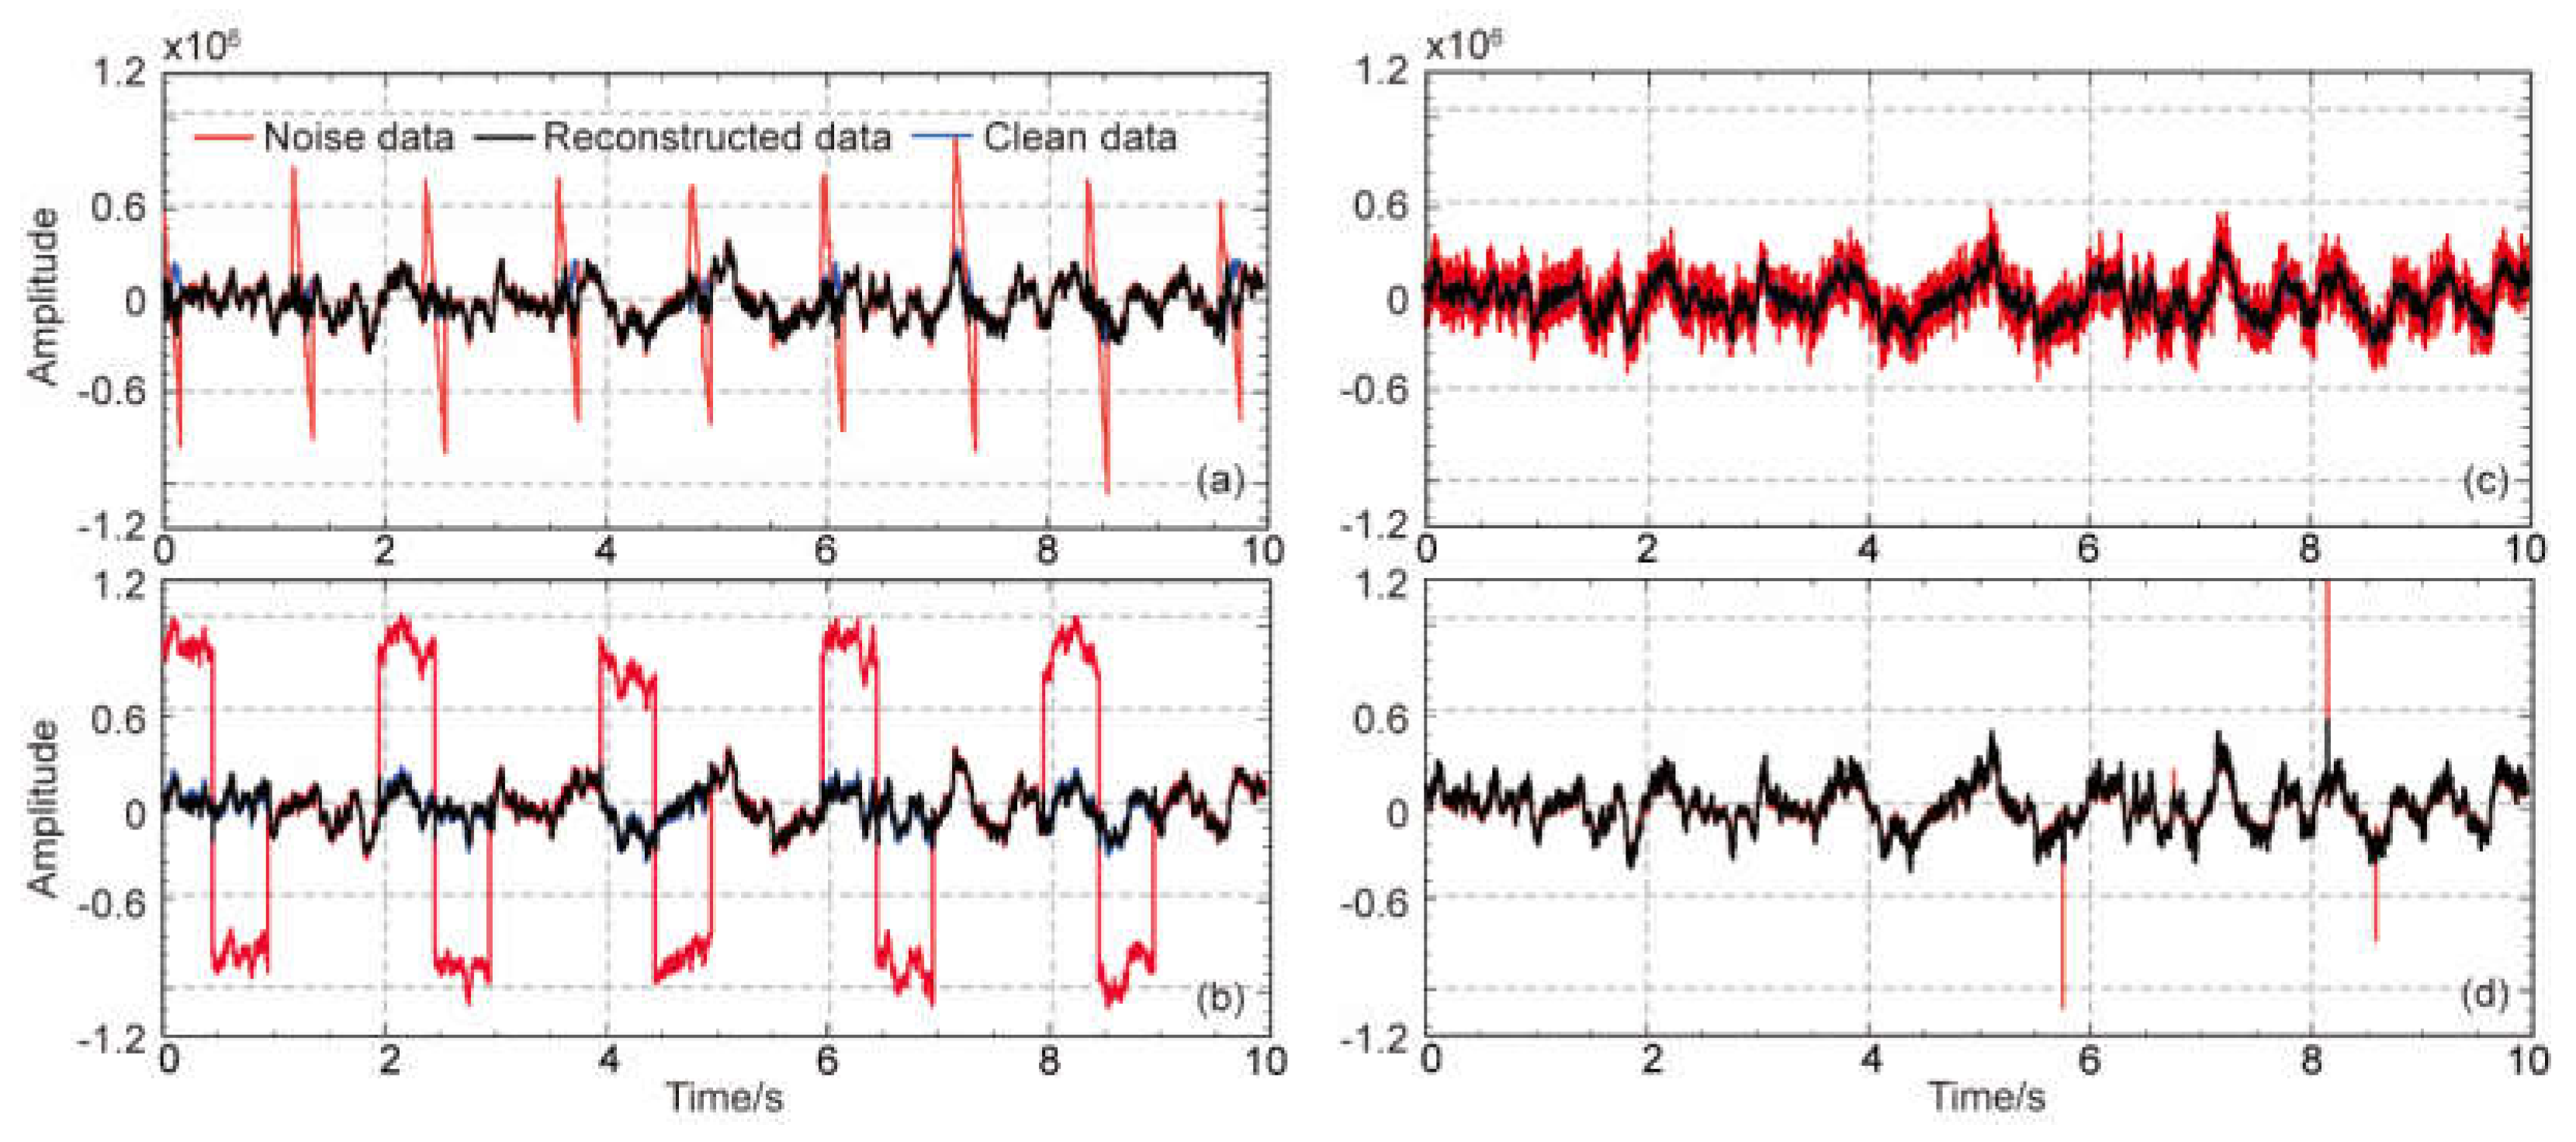
3. Synthetic Experiments
4. Application to Observed Data Sets
4.1. Data
4.2. Processing and Results
5. Discussion and Conclusions
Author Contributions
Funding
Institutional Review Board Statement
Informed Consent Statement
Data Availability Statement
Acknowledgments
Conflicts of Interest
References
- Kang, K.J.; Cheng, J.P.; Chen, Y.H.; Li, Y.J.; Shen, M.B.; Wu, S.Y.; Yue, Q. Status and Prospects of a Deep Underground Laboratory in China. J. Phys.: Conf. Ser. 2010, 203, 012028. [Google Scholar] [CrossRef]
- Smith, N.J.T. The SNOLAB Deep Underground Facility. Eur. Phys. J. Plus 2012, 127, 108. [Google Scholar] [CrossRef]
- Mizukoshi, K.; Taishaku, R.; Hosokawa, K.; Kobayashi, K.; Miuchi, K.; Naka, T.; Takeda, A.; Tanaka, M.; Wada, Y.; Yorita, K. Measurement of Ambient Neutrons in an Underground Laboratory at Kamioka Observatory and Future Plan. In Proceedings of the Journal of Physics: Conference Series; IOP Publishing, 2020; Vol. 1468, p. 012247.
- Palušová, V.; Breier, R.; Chauveau, E.; Piquemal, F.; Povinec, P.P. Natural Radionuclides as Background Sources in the Modane Underground Laboratory. Journal of environmental radioactivity 2020, 216, 106185. [Google Scholar] [CrossRef] [PubMed]
- Waysand, G.; Bloyet, D.; Bongiraud, J.P.; Collar, J.I.; Dolabdjian, C.; Le Thiec, P. First Characterization of the Ultra-Shielded Chamber in the Low-Noise Underground Laboratory (LSBB) of Rustrel-Pays d’Apt. Nuclear Instruments and Methods in Physics Research Section A: Accelerators, Spectrometers, Detectors and Associated Equipment 2000, 444, 336–339. [Google Scholar] [CrossRef]
- Daniels, K.A.; Harrington, J.F.; Wiseall, A.C.; Shoemark-Banks, E.; Hough, E.; Wallis, H.C.; Paling, S.M. Battery Earth: Using the Subsurface at Boulby Underground Laboratory to Investigate Energy Storage Technologies. Frontiers in Physics 2023, 11, 1249458. [Google Scholar] [CrossRef]
- Pomansky, A.A. Underground Low Background Laboratories of the Baksan Neutrino Observatory. Nuclear Instruments and Methods in Physics Research Section B: Beam Interactions with Materials and Atoms 1986, 17, 406–410. [Google Scholar] [CrossRef]
- Naticchioni, L.; Iudochkin, N.; Yushkin, V.; Majorana, E.; Perciballi, M.; Ricci, F.; Rudenko, V. Seismic Noise Background in the Baksan Neutrino Observatory. Eur. Phys. J. Plus 2022, 137, 124. [Google Scholar] [CrossRef]
- Naticchioni, L.; Perciballi, M.; Ricci, F.; Coccia, E.; Malvezzi, V.; Acernese, F.; Barone, F.; Giordano, G.; Romano, R.; Punturo, M. Microseismic Studies of an Underground Site for a New Interferometric Gravitational Wave Detector. Classical and Quantum Gravity 2014, 31, 105016. [Google Scholar] [CrossRef]
- Naticchioni, L.; Boschi, V.; Calloni, E.; Capello, M.; Cardini, A.; Carpinelli, M.; Cuccuru, S.; D’Ambrosio, M.; De Rosa, R.; Di Giovanni, M. Characterization of the Sos Enattos Site for the Einstein Telescope. In Proceedings of the Journal of Physics: Conference Series; IOP Publishing, 2020; Vol. 1468, p. 012242.
- Gaffet, S.; Guglielmi, Y.; Virieux, J.; Waysand, G.; Chwala, A.; Stolz, R.; Emblanch, C.; Auguste, M.; Boyer, D.; Cavaillou, A. Simultaneous Seismic and Magnetic Measurements in the Low-Noise Underground Laboratory (LSBB) of Rustrel, France, during the 2001 January 26 Indian Earthquake. Geophysical Journal International 2003, 155, 981–990. [Google Scholar] [CrossRef]
- Waysand, G.; Barroy, P.; Blancon, R.; Gaffet, S.; Guilpin, C.; Marfaing, J.; Di Borgo, E.P.; Pyée, M.; Auguste, M.; Boyer, D. Seismo-Ionosphere Detection by Underground SQUID in Low-Noise Environment in LSBB-Rustrel, France. The European Physical Journal-Applied Physics 2009, 47, 12705. [Google Scholar] [CrossRef]
- Sun, H.; CHEN, X.; WEI, Z.; ZHANG, M.; ZHANG, G.; NI, S.; CHU, R.; XU, J.; CUI, X.; XING, L. A Preliminary Study on the Ultra-Wide Band Ambient Noise of the Deep Underground Based on Observations of the Seismometer and Gravimeter. Chinese Journal of Geophysics 2022, 65, 4543–4554. [Google Scholar]
- Wang, Z.; WANG, Y.; XU, R.; LIU, T.; FU, G.; SUN, H. Environmental Noise Assessment of Underground Gravity Observation in Huainan and the Potential Capability of Detecting Slow Earthquake. Chinese Journal of Geophysics 2022, 65, 4555–4568. [Google Scholar]
- Wang, Y.; JIAN, Y.; HE, Y.; MIAO, Q.; TENG, J.; WANG, Z.; RONG, L.; QIU, L.; XIE, C.; ZHANG, Q. Underground Laboratories and Deep Underground Geophysical Observations. Chinese Journal of Geophysics 2022, 65, 4527–4542. [Google Scholar]
- Wang, Y.; Yang, Y.; Sun, H.; Xie, C.; Zhang, Q.; Cui, X.; Chen, C.; He, Y.; Miao, Q.; Mu, C.; et al. Observation and Research of Deep Underground Multi-Physical Fields—Huainan −848 m Deep Experiment. Sci. China Earth Sci. 2023, 66, 54–70. [Google Scholar] [CrossRef]
- Guo, L.; WANG, B.; SONG, X.; WANG, Y.; JIN, C.; YAO, S.; SHI, Y. Continuous Observation of Geomagnetic Total-Field at the Underground Laboratory in Huainan City, China and Its Time-Varying Characteristics. Chinese Journal of Geophysics 2024, 67, 820–828. [Google Scholar]
- Wan, W.; CHEN, C.; WANG, Y.; MU, C.; HE, Y.; WANG, C. Comparative Analysis of Surface and Deep Underground Seismic Ambient Noise. Chinese Journal of Geophysics 2024, 67, 793–808. [Google Scholar]
- Xie, C.; Chen, C.; Liu, C.; Wan, W.; Jin, S.; Ye, G.; Jing, J.; Wang, Y. Insights from Underground Laboratory Observations: Attenuation-Induced Suppression of Electromagnetic Noise. The European Physical Journal Plus 2024, 139, 218. [Google Scholar] [CrossRef]
- Wang, H.; Campanyà, J.; Cheng, J.; Zhu, G.; Wei, W.; Jin, S.; Ye, G. Synthesis of Natural Electric and Magnetic Time-series Using Inter-station Transfer Functions and Time-series from a Neighboring Site (STIN): Applications for Processing MT Data. JGR Solid Earth 2017, 122, 5835–5851. [Google Scholar] [CrossRef]
- Zhao, G.; Zhang, X.; Cai, J.; Zhan, Y.; Ma, Q.; Tang, J.; Du, X.; Han, B.; Wang, L.; Chen, X.; et al. A Review of Seismo-Electromagnetic Research in China. Sci. China Earth Sci. 2022, 65, 1229–1246. [Google Scholar] [CrossRef]
- Egbert, G.D.; Booker, J.R. Robust Estimation of Geomagnetic Transfer Functions. Geophysical Journal of the Royal Astronomical Society 1986, 87, 173–194. [Google Scholar] [CrossRef]
- Chave, A.D.; Thomson, D.J. Some Comments on Magnetotelluric Response Function Estimation. Journal of Geophysical Research: Solid Earth 1989, 94, 14215–14225. [Google Scholar] [CrossRef]
- Jones, A.G.; Chave, A.D.; Egbert, G.; Auld, D.; Bahr, K. A Comparison of Techniques for Magnetotelluric Response Function Estimation. Journal of Geophysical Research: Solid Earth 1989, 94, 14201–14213. [Google Scholar] [CrossRef]
- Mebane Jr., J. S. S., W.R. Robust Estimation and Outlier Detection for Overdispersed Multinomial Models of Count Data. American Journal of Political Science 2004, 48, 392–411. [Google Scholar] [CrossRef]
- Goubau, W.M.; Gamble, T.D.; Clarke, J. Magnetotelluric Data Analysis: Removal of Bias. GEOPHYSICS 1978, 43, 1157–1166. [Google Scholar] [CrossRef]
- Gamble, T.D.; Goubau, W.M.; Clarke, J. Magnetotellurics with a Remote Magnetic Reference. GEOPHYSICS 1979, 44, 53–68. [Google Scholar] [CrossRef]
- Clarke, J.; Gamble, T.D.; Goubau, W.M.; Koch, R.H.; Miracky, R.F. Remote-Reference Magnetotellurics: Equipment and Procedures. Geophysical Prospecting 1983, 31, 149–170. [Google Scholar] [CrossRef]
- Egbert, G.D. Robust Multiple-Station Magnetotelluric Data Processing. Geophysical Journal International 1997, 130, 475–496. [Google Scholar] [CrossRef]
- Egbert, G. Processing And Interpretation Of Electromagnetic Induction Array Data. Surveys in Geophysics 2002, 23, 207–249. [Google Scholar] [CrossRef]
- Smirnov, M.Y.; Egbert, G.D. Robust Principal Component Analysis of Electromagnetic Arrays with Missing Data. Geophysical Journal International 2012, 190, 1423–1438. [Google Scholar] [CrossRef]
- Zhou, C.; Tang, J.; Yuan, Y. Multi-Reference Array MT Data Processing Method. Oil Geophysical Prospecting 2020, 55, 1373–1382. [Google Scholar] [CrossRef]
- Garcia, X.; Jones, A.G. Robust Processing of Magnetotelluric Data in the AMT Dead Band Using the Continuous Wavelet Transform. GEOPHYSICS 2008, 73, 223–234. [Google Scholar] [CrossRef]
- Cai, J.-H.; Tang, J.-T.; Hua, X.-R.; Gong, Y.-R. An Analysis Method for Magnetotelluric Data Based on the Hilbert–Huang Transform. Exploration Geophysics 2009, 40, 197–205. [Google Scholar] [CrossRef]
- Chen, J.; Heincke, B.; Jegen, M.; Moorkamp, M. Using Empirical Mode Decomposition to Process Marine Magnetotelluric Data. Geophysical Journal International 2012, 190, 293–309. [Google Scholar] [CrossRef]
- Tang, J.T.; Li, G.; Xiao, X. Strong Noise Separation for Magnetotelluric Data Based on a Signal Reconstruction Algorithm of Compressive Sensing. Chinese J. Geophys. (in Chinese) 2017, 60, 3642–3654. [Google Scholar] [CrossRef]
- Kappler, K.N. A Data Variance Technique for Automated Despiking of Magnetotelluric Data with a Remote Reference. Geophysical Prospecting 2012, 60, 179–191. [Google Scholar] [CrossRef]
- Ogawa, H.; Asamori, K.; Negi, T.; Ueda, T. A Novel Method for Processing Noisy Magnetotelluric Data Based on Independence of Signal Sources and Continuity of Response Functions. Journal of Applied Geophysics 2023, 213, 105012. [Google Scholar] [CrossRef]
- Dramsch, J. 70 Years of Machine Learning in Geoscience in Review. In Machine Learning in Geosciences; edited, Ed.; 2020; pp. 1–55.
- Manoj, C.; Nagarajan, N. The Application of Artificial Neural Networks to Magnetotelluric Time-Series Analysis. Geophysical Journal International 2003, 153, 409–423. [Google Scholar] [CrossRef]
- Li, J.; Liu, Y.; Tang, J.; Ma, F. Magnetotelluric Noise Suppression via Convolutional Neural Network. GEOPHYSICS 2023, 88, WA361–WA375. [Google Scholar] [CrossRef]
- Li, J.; Liu, Y.; Tang, J.; Peng, Y.; Zhang, X.; Li, Y. Magnetotelluric Data Denoising Method Combining Two Deep-Learning-Based Models. GEOPHYSICS 2023, 88, E13–E28. [Google Scholar] [CrossRef]
- Han, Y.; An, Z.; Di, Q.; Wang, Z.; Kang, L. Research on Noise Suppression of Magnetotelluric Signal Based on Recurrent Neural Network. Chinese Journal of Geophysics 2023, 66, 4317–4331. [Google Scholar]
- Zhang, L.; Li, G.; Chen, H.; Tang, J.; Yang, G.; Yu, M.; Hu, Y.; Xu, J.; Sun, J. Identification and Suppression of Multicomponent Noise in Audio Magnetotelluric Data Based on Convolutional Block Attention Module. IEEE Transactions on Geoscience and Remote Sensing 2024, 62, 1–15. [Google Scholar] [CrossRef]
- Feng, C.; Li, Y.; Wu, Y.; Duan, S. A Noise Suppression Method of Marine Magnetotelluric Data Using K-SVD Dictionary Learning. Chinese Journal of Geophysics 2022, 65, 1853–1865. [Google Scholar]
- Li, J.; Peng, Y.; Tang, J.; Li, Y. Denoising of Magnetotelluric Data Using K-SVD Dictionary Training. Geophysical Prospecting 2021, 69, 448–473. [Google Scholar] [CrossRef]
- Li, G.; Gu, X.; Ren, Z.; Wu, Q.; Liu, X.; Zhang, L.; Xiao, D.; Zhou, C. Deep Learning Optimized Dictionary Learning and Its Application in Eliminating Strong Magnetotelluric Noise. Minerals 2022, 12. [Google Scholar] [CrossRef]
- Li, G.; Liu, X.; Tang, J.; Deng, J.; Hu, S.; Zhou, C.; Chen, C.; Tang, W. Improved Shift-Invariant Sparse Coding for Noise Attenuation of Magnetotelluric Data, Earth. Planets and Space 2020, 72, 45. [Google Scholar] [CrossRef]
- Liu, X.; Li, G.; Li, J.; Zhou, X.; Gu, X.; Zhou, C.; Gong, M. Self-Organizing Competitive Neural Network Based Adaptive Sparse Representation for Magnetotelluric Data Denoising. Journal of Physics: Conference Series 2023, 2651, 012129. [Google Scholar] [CrossRef]
- Cunningham, P.; Cord, M.; Delany, S.J. Supervised Learning. In Machine Learning Techniques for Multimedia; Cord, M., Cunningham, P., Eds.; Cognitive Technologies; Springer Berlin Heidelberg: Berlin, Heidelberg, 2008; pp. 21–49. ISBN 978-3-540-75170-0. [Google Scholar]
- Schuster, M.; Paliwal, K.K. Bidirectional Recurrent Neural Networks. IEEE Trans. Signal Process. 1997, 45, 2673–2681. [Google Scholar] [CrossRef]
- LeCun, Y.; Bengio, Y.; Hinton, G. Deep Learning. Nature 2015, 521, 436–444. [Google Scholar] [CrossRef] [PubMed]
- Salehinejad, H.; Sankar, S.; Barfett, J.; Colak, E.; Valaee, S. Recent Advances in Recurrent Neural Networks 2018.
- Graves, A. Supervised Sequence Labelling with Recurrent Neural Networks; Studies in Computational Intelligence; Springer Berlin Heidelberg: Berlin, Heidelberg, 2012; Vol. 385, ISBN 978-3-642-24796-5. [Google Scholar]
- Van Houdt, G.; Mosquera, C.; Nápoles, G. A Review on the Long Short-Term Memory Model. Artif Intell Rev 2020, 53, 5929–5955. [Google Scholar] [CrossRef]
- Hochreiter, S.; Schmidhuber, J. Long Short-Term Memory. Neural Computation 1997, 9, 1735–1780. [Google Scholar] [CrossRef]
- Malhotra, P.; Vig, L.; Shroff, G.; Agarwal, P. Long Short Term Memory Networks for Anomaly Detection in Time Series. Computational Intelligence 2015. [Google Scholar]
- Wan, S.; Qi, L.; Xu, X.; Tong, C.; Gu, Z. Deep Learning Models for Real-Time Human Activity Recognition with Smartphones. Mobile Netw Appl 2020, 25, 743–755. [Google Scholar] [CrossRef]
- Yang, J.; Yao, S.; Wang, J. Deep Fusion Feature Learning Network for MI-EEG Classification. Ieee Access 2018, 6, 79050–79059. [Google Scholar] [CrossRef]
- Staudemeyer, R.C.; Morris, E.R. Understanding LSTM -- a Tutorial into Long Short-Term Memory Recurrent Neural Networks 2019.
- Van Houdt, G.; Mosquera, C.; Nápoles, G. A Review on the Long Short-Term Memory Model. Artif Intell Rev 2020, 53, 5929–5955. [Google Scholar] [CrossRef]
- Huang, L.; Qin, J.; Zhou, Y.; Zhu, F.; Liu, L.; Shao, L. Normalization Techniques in Training Dnns: Methodology, Analysis and Application. IEEE transactions on pattern analysis and machine intelligence 2023, 45, 10173–10196. [Google Scholar] [CrossRef] [PubMed]
- Chen, W.; Yang, L.; Zha, B.; Zhang, M.; Chen, Y. Deep Learning Reservoir Porosity Prediction Based on Multilayer Long Short-Term Memory Network. Geophysics 2020, 85, WA213–WA225. [Google Scholar] [CrossRef]
- Kingma, D.P.; Ba, J. Adam: A Method for Stochastic Optimization 2017.
- Bouktif, S.; Fiaz, A.; Ouni, A.; Serhani, M.A. Optimal Deep Learning Lstm Model for Electric Load Forecasting Using Feature Selection and Genetic Algorithm: Comparison with Machine Learning Approaches. Energies 2018, 11, 1636. [Google Scholar] [CrossRef]
- McNamara, D.E.; Buland, R.P. Ambient Noise Levels in the Continental United States. Bulletin of the seismological society of America 2004, 94, 1517–1527. [Google Scholar] [CrossRef]
- Varentsov, I. RRMC TECHNIQUE FIGHTS HIGHLY COHERENT EM NOISE, in Protokoll Uber Das 21 Kolloquium “EM Tiefenforschung.” In RRMC TECHNIQUE FIGHTS HIGHLY COHERENT EM NOISE, in Protokoll uber das 21 Kolloquium “EM Tiefenforschung”; edited., Ed.; 2005.
- Varentsov, I.; Sokolova, E.; Martanus, E.; Nalivaiko, K.; Group System of Electromagnetic Field Transfer Operators for the BEAR Array of Simultaneous Soundings: Methods and Results. Izvestiya Physics of the Solid Earth 2003, 39, 118–148.
- Dong, X.T.; Li, Y.; Yang, B.J. Desert Low-Frequency Noise Suppression by Using Adaptive DnCNNs Based on the Determination of High-Order Statistic. Geophysical Journal International 2019, 219, 1281–1299. [Google Scholar] [CrossRef]
- Zhao, Y.; Li, Y.; Dong, X.; Yang, B. Low-Frequency Noise Suppression Method Based on Improved DnCNN in Desert Seismic Data. IEEE Geoscience and Remote Sensing Letters 2019, 16, 811–815. [Google Scholar] [CrossRef]
- Maiti, S.; Chiluvuru, R.K. A Deep CNN-LSTM Model for Predicting Interface Depth from Gravity Data over Thrust and Fold Belts of North East India. Journal of Asian Earth Sciences 2024, 259, 105881. [Google Scholar] [CrossRef]
- Zhou, Y.; Chang, Y.; Chen, H.; Zhou, Y.; Ma, Y.; XIE, C.; He, Z.; Katsumi, H.; Han, P. Application of Reference-Based Blind Source Separation Method in the Reduction of near-Field Noise of Geomagnetic Measurements. CHINESE JOURNAL OF GEOPHYSICS-CHINESE EDITION 2019, 62, 572–586. [Google Scholar]
| Noise | MAPE (%) | SMAPE (%) |
|---|---|---|
| Charge and discharge triangle wave | 1.9222 | 0.6738 |
| Square wave | 1.7582 | 0.5977 |
| Gaussian noise | 2.0160 | 0.5724 |
| Peak noise | 1.6031 | 0.5099 |
| Combined noise | 3.8490 | 1.0905 |
Disclaimer/Publisher’s Note: The statements, opinions and data contained in all publications are solely those of the individual author(s) and contributor(s) and not of MDPI and/or the editor(s). MDPI and/or the editor(s) disclaim responsibility for any injury to people or property resulting from any ideas, methods, instructions or products referred to in the content. |
© 2024 by the authors. Licensee MDPI, Basel, Switzerland. This article is an open access article distributed under the terms and conditions of the Creative Commons Attribution (CC BY) license (http://creativecommons.org/licenses/by/4.0/).


