1. Introduction
The excavation of trenches marks the initial diaphragm wall or underground wall construction stage. Vertical trench excavation employs supporting systems, including shoring, bracing, underpinning, guided wall, etc., to guarantee safety during excavation operations [
1,
2]. Consequently, the principal focus is the stability assessment of excavation trenches, specifically vertical ones. Stability analysis of vertical trenches is typically performed using methodologies advocated by researchers such as Rankine, Mohr-Coulomb, Cullman, etc. [
3,
4,
5].
Piaskowski and Kowalewski [
6] presented the initial concept of 3D stability of slurry-supported trenches as early as 1965. An interesting study, including a 3D wedge failure surface introduced by Washbourne in 1984 [
7], is further discussed later in the paper. The improved method for stability analysis for the slurry-filled trench, assuming 3D limit equilibrium in cohesionless soil, was presented in [
8]. An experimental study of the stabilising mechanism of a slurry trench excavation in soft clay under normal consolidation is presented in [
9]. Fox [
10] presented the Coulomb-type force equilibrium analyses for general 2D and 3D stability of slurry-supported trench. This solution considered variable trench depth, length, slurry depth, groundwater table elevation, surcharge loading, tension crack depth, and fluid level in the tension cracks.
Numerical simulations of soil displacements and stability analysis for the trench excavation process using the FLAC3D software were presented and discussed in [
11,
12]. The interesting concept of the horizontal slice method for stability analysis of slurry trenches, allowing consideration of soil stratification, was presented in [
13]. A 2D and 3D kinematically admissible rotational failure mechanism for homogeneous slurry trenches in frictional/cohesive soils was introduced in [
14]. Zhang et al. [
15] presented the limit equilibrium solution for the stability of a slurry-supported trench, assuming the rotational 3D failure mechanism. 3D numerical calculations accompanied by limit equilibrium theory were also applied to estimate slurry trench stability analysis by Xiao and Sun [
16]. A very interesting example of 3D stability analysis of a trench located in soil with a weak soil layer solved with FLAC3D and Limit Analysis is presented by Li and Zhang [
17].
Wang and Huang [
18] analysed slurry-supported trenches in horizontally layered cohesive-frictional soils using 2D the kinematical approach of limit analysis and compared the results with those obtained from shear strength reduction using the finite element method. The 3D trench stability analysis in non-uniform undrained clay adopting the kinematic approach of limit analysis was presented by Wang et al. [
19].
Huang et al. [
20] presented a modified 3D failure mechanism of trench walls, introducing nonlinear characteristics and soil nonhomogeneity into the theoretical calculation. Xu et al. [
21] proposed an instability model for a double-angled trench wall based on a 3D sliding body and verified it numerically with FLAC3D.
2. Description of the Analysed Problem
The numerical model was developed based on geotechnical information obtained from the C3 stratum in the Hue city area, which includes interlayers of cohesive and non-cohesive soils. The model simulates trench excavation under temporary support of bentonite slurry during the wall construction stage, particularly during the diaphragm wall or underground wall construction stage. It is worth noting that trench excavation is the initial step in diaphragm wall or underground wall construction. Hence, the numerical model estimates bentonite slurry trench stability during the construction phase in typical stratigraphy. Additionally, Bell-Washbourne’s LEM method was applied to calculate trench stability.
During the excavation process of a trench, it is possible to temporarily support the trench wall with a bentonite slurry of 10.5 ÷ 12.0 kN/m
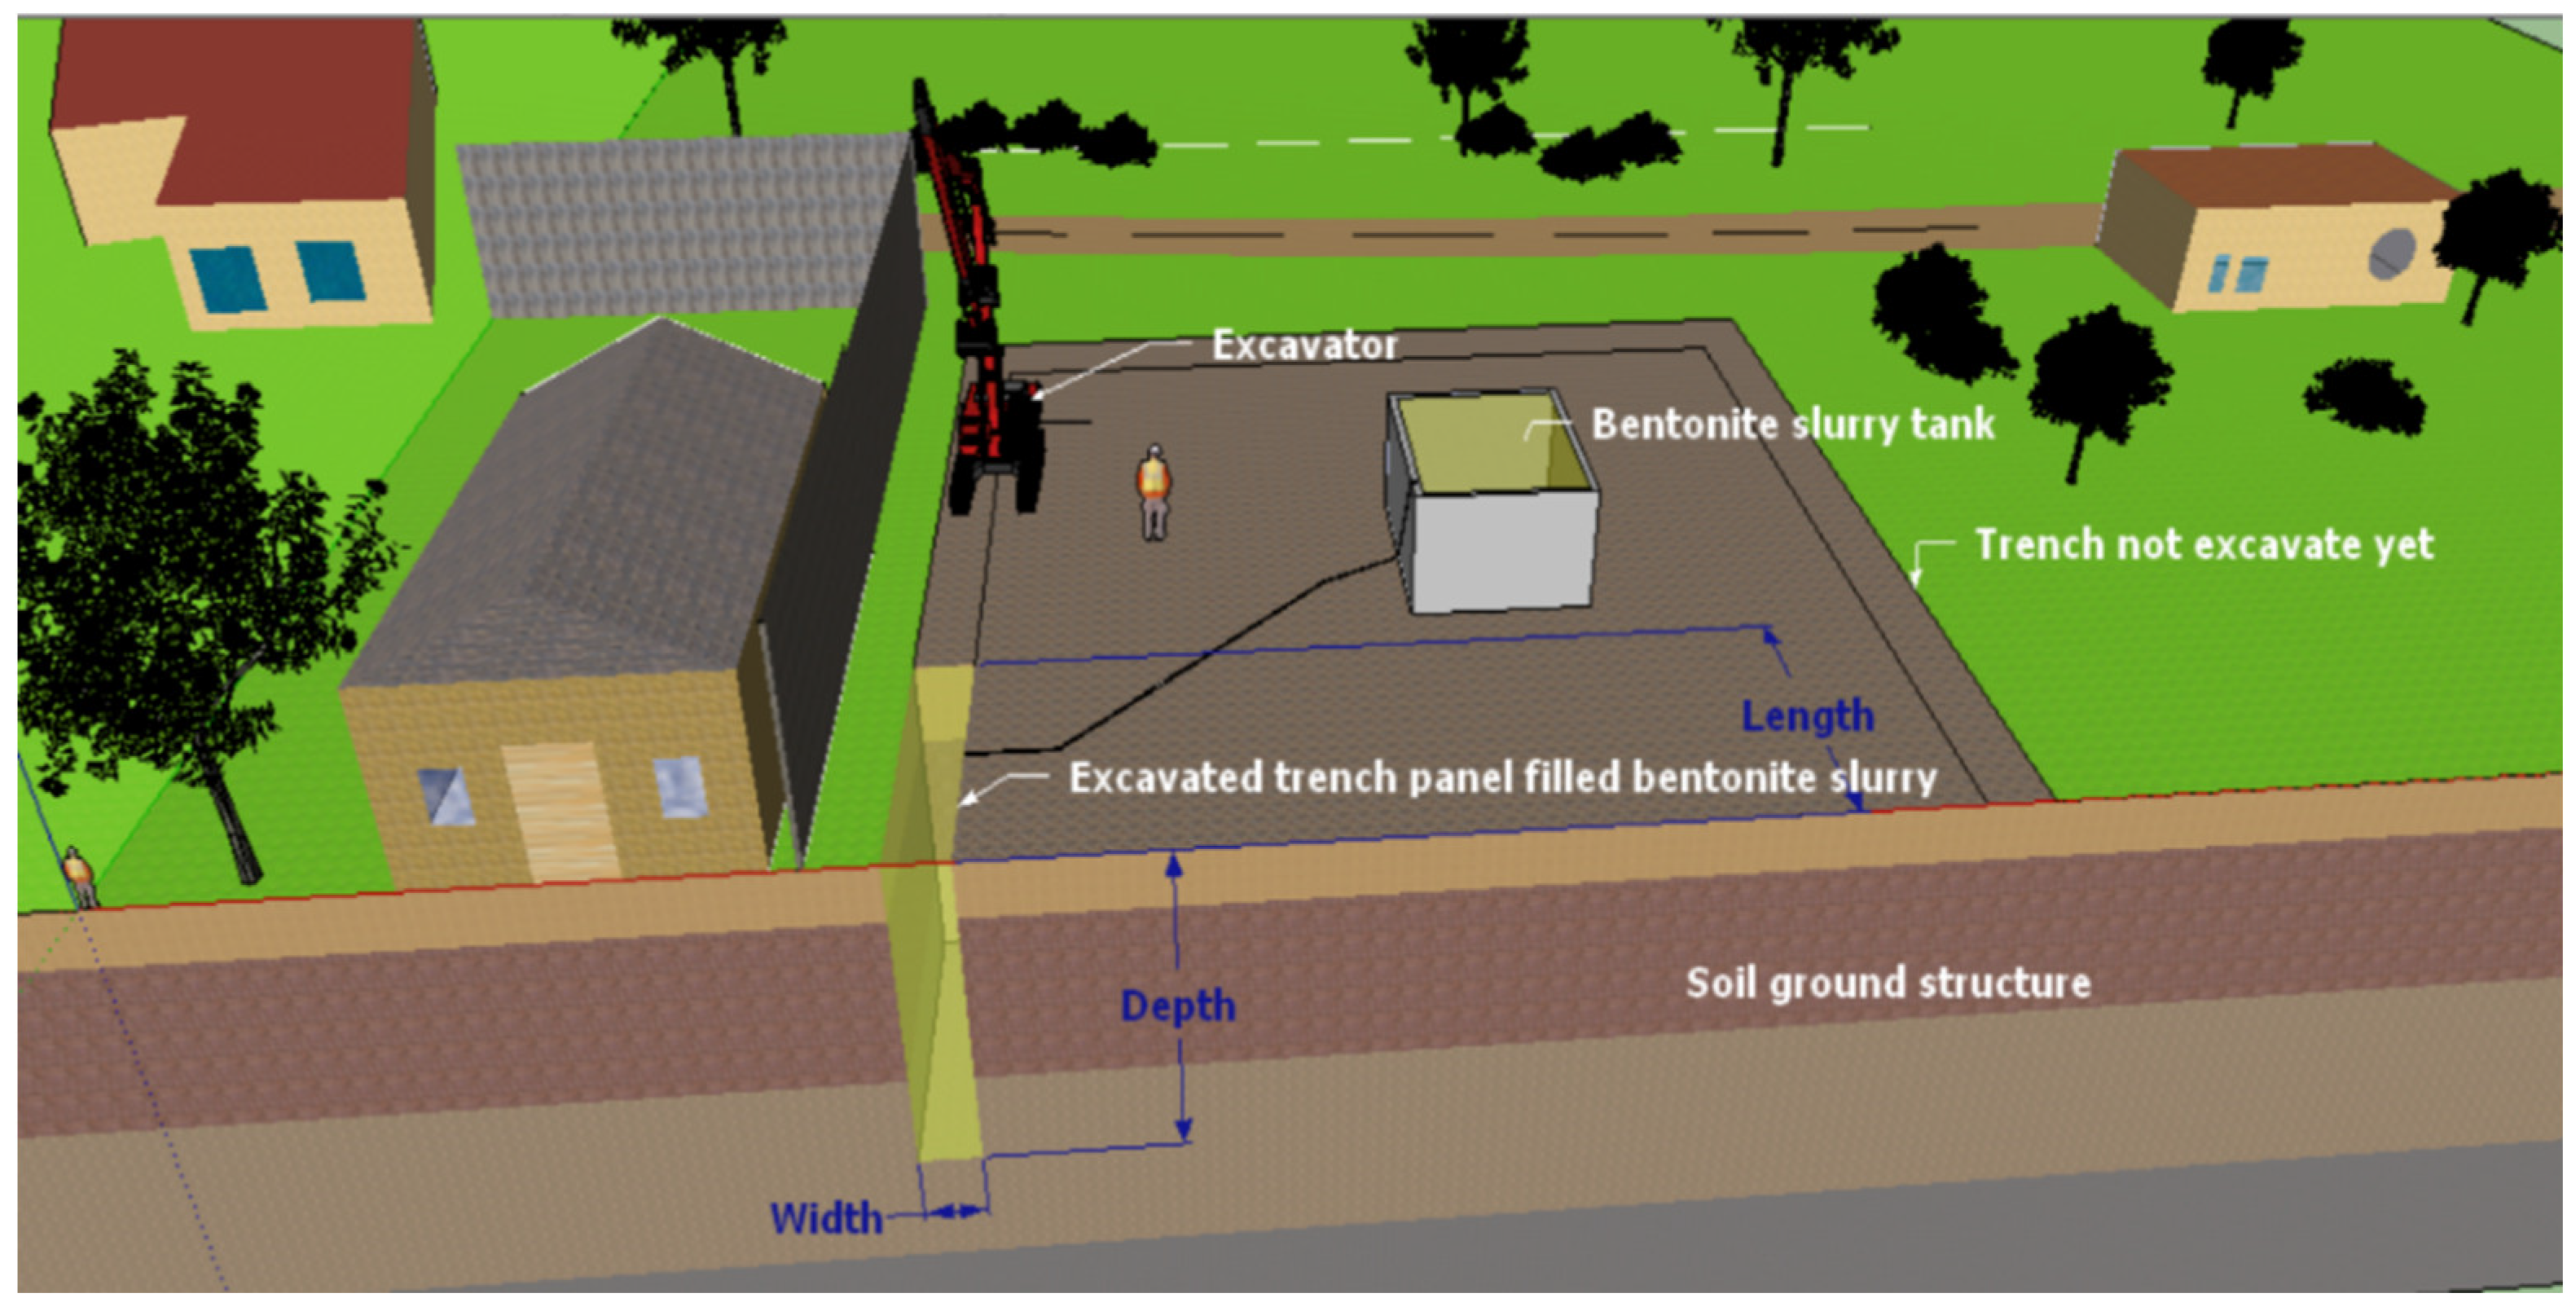
3 to prevent the collapse of the trench wall. This entails filling the trench with bentonite slurry up to the top of the trench while digging with a mechanical bucket. Subsequently, the steel frame is inserted into the trench and poured concrete grout into the trench through a concrete pipe underwater. This action pushes the bentonite slurry up from the bottom of the trench and out of the trench. It is important to note that the article solely focuses on the stability analysis during the trench excavation step with temporary support of bentonite slurry (
Figure 1).
2.1. Shear Strength Reduction Technique
The Shear Strength Reduction technique (SSR) is a highly popular and efficient numerical method for stability estimation, which aims to evaluate the location of the slip surface and define the factor of safety (FS). The SSR technique, introduced by Zienkiewicz et al. (1975), entails progressively reducing the soil strength parameters until failure occurs. Many researchers have effectively applied this technique in slope stability analysis [
22,
23,
24]. Furthermore, the stability analysis of underground openings with complex geology and geometry [
25,
26] and large-scale open pit structures [
27,
28,
29,
30] has also been effectively carried out using the SSR technique. Here SSR technique was applied utilising tools such as RS2 [
31], RS3 [
32], FLAC2D [
33], and FLAC3D [
34] codes to evaluate the stability of excavation trenches with temporary support of bentonite slurry (γs = 10.5 ÷ 12.0 kN/m
3).
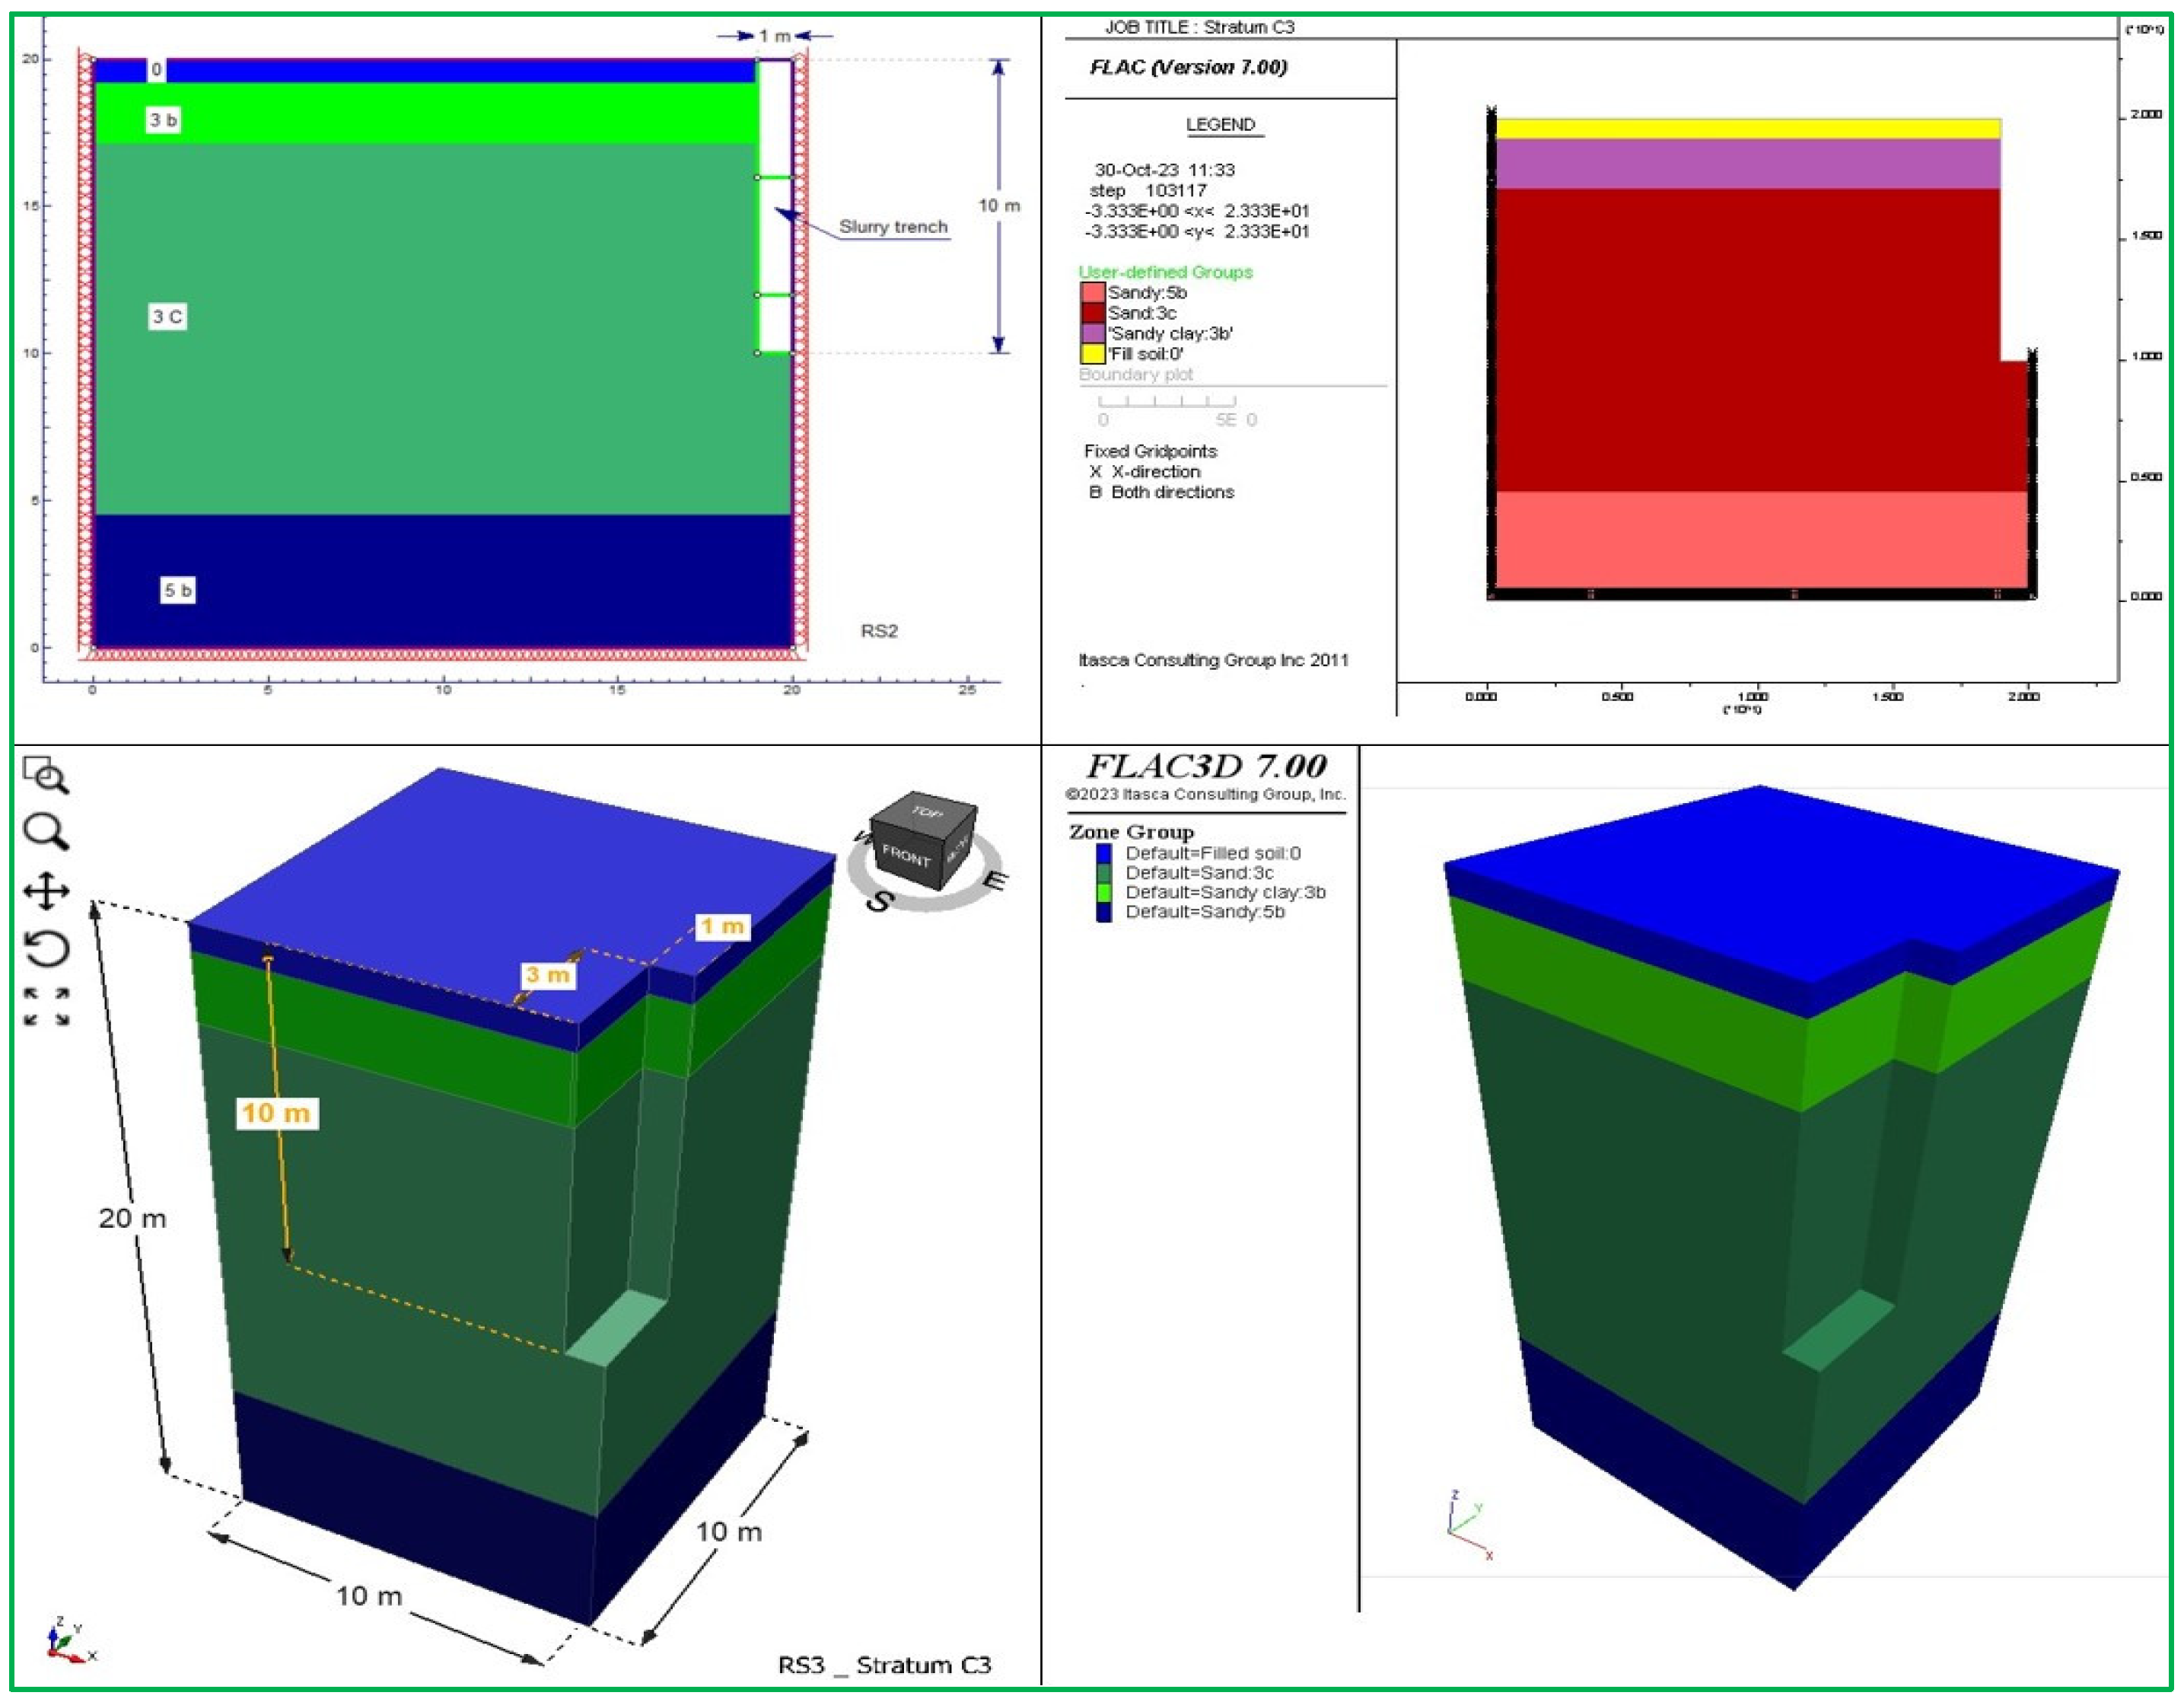
The numerical models are constructed using a quarter block of soil background structure (
Figure 2) with the following dimensions:
in 2D (FLAC2D and RS2): X x Z = 20m x 20m,
in 3D (FLAC3D and RS3): X x Y x Z = 10m x 10m (up to 34 m) x 20m.
The trench model is also represented by a quarter block with the following dimensions:
The analysed trench length ranges from 6m to 54m.
The trench model was initially built with vertical effective stresses set according to the Mohr-Coulomb material and pore pressures in a static state. Subsequently, the model stresses were reset to prepare for the next step, which involved excavating the trench under bentonite slurry with a density of 10.5 – 12.0 kN/m3.
The excavation process involved removing elements/nodes of soil layers until the desired excavation depth reached 10 m while simultaneously applying stress distribution to represent the fluid pressure of the bentonite slurry (
Figure 3a, b). It is important to note that the stress distribution of the bentonite slurry was applied along the sides and bottom of the trench to match the unit weight of the bentonite slurry multiplied by the depth of the slurry. This stress distribution of the bentonite slurry was carried out concurrently with the trench excavation, corresponding to each excavation depth. This approach aligns with the site’s construction conditions
2.1. Bell-Washbourne Method
In Washbourne’s work in 1984 [
17], his idealisation involved modifying the shape of the slide wedge from a 2-dimensional form (Bell) to a 3-dimensional one (Bell-Washbourne) while assuming the angle α between the slide surface and the face of the trench. Stability analysis is similar to the stability of the wedge conducted on the Coulomb wedge in retaining walls. The safety factor FS was calculated as the ratio of the horizontal force due to slurry pressure to the active thrust of the wedge (
Figure 4a, b).
In the original Washbourne study (1984), equation (2.3) was employed to calculate the safety factor.
where: P
a = active thrust of the wedge, P
s = slurry support thrust and Pw = thrust on slurry/soil interface of groundwater,
However, this paper presents a different perspective on using equations for safety factor calculation. Considering the original limit equilibrium condition, the formula for limit equilibrium is:
This implies that the factor of safety will be:
A comparison reveals that the FS calculated using equation (1) is significantly greater (what is an overestimation) than that derived from equation (3). This suggests that equation (3) would provide a safer outcome and align with the original limit equilibrium mechanism’s initial premise. That is why this paper utilises equation (3) to compute the safety factor for the slurry trench.
3. Stability of Bentonite Slurry with Stratum C3
Stratum C3 (
Figure 7) is located in the suburban area of Hue City, where the construction density ranges from 0% to 30%. It includes mainly residential buildings with small loads of 1 or 2 floors and surrounding roads designated for internal traffic vehicles. Therefore, this paper conducted a study for this location under two cases: one without any surcharge load and the other with a surcharge load of 10kPa applied on the ground surface. The average mechanical properties of the soil layers around the C3 main layer are presented in
Table 1.
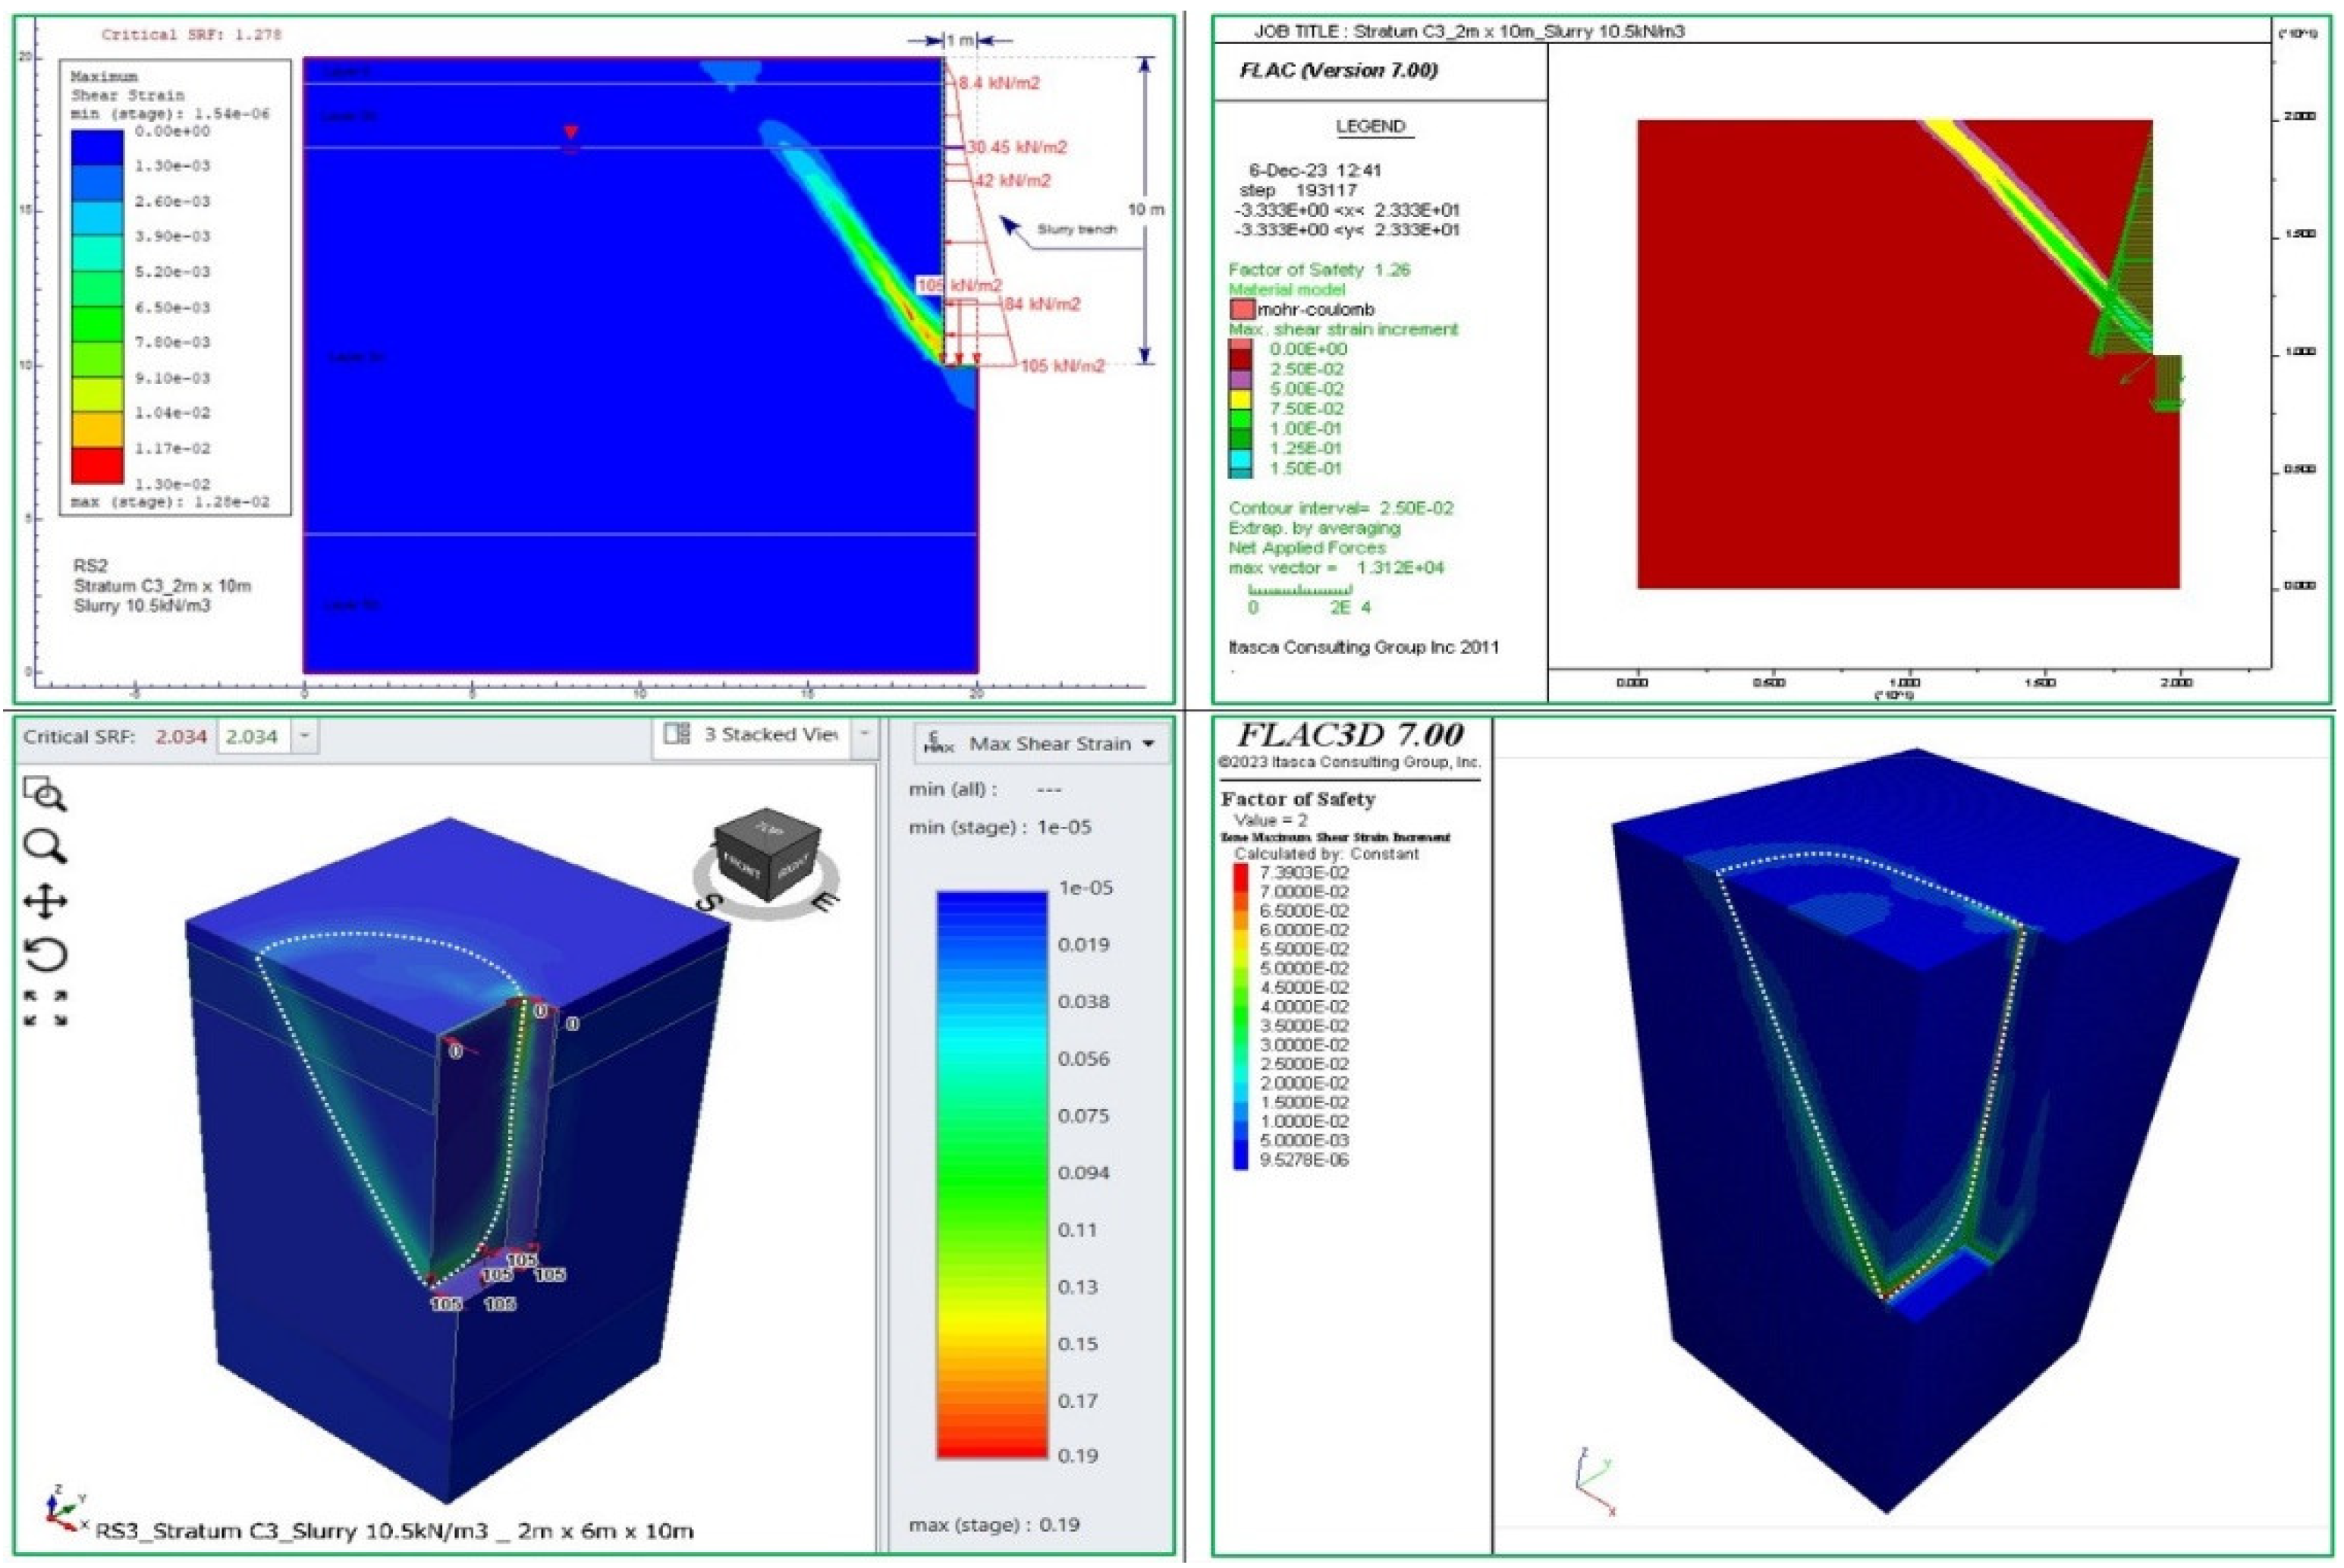
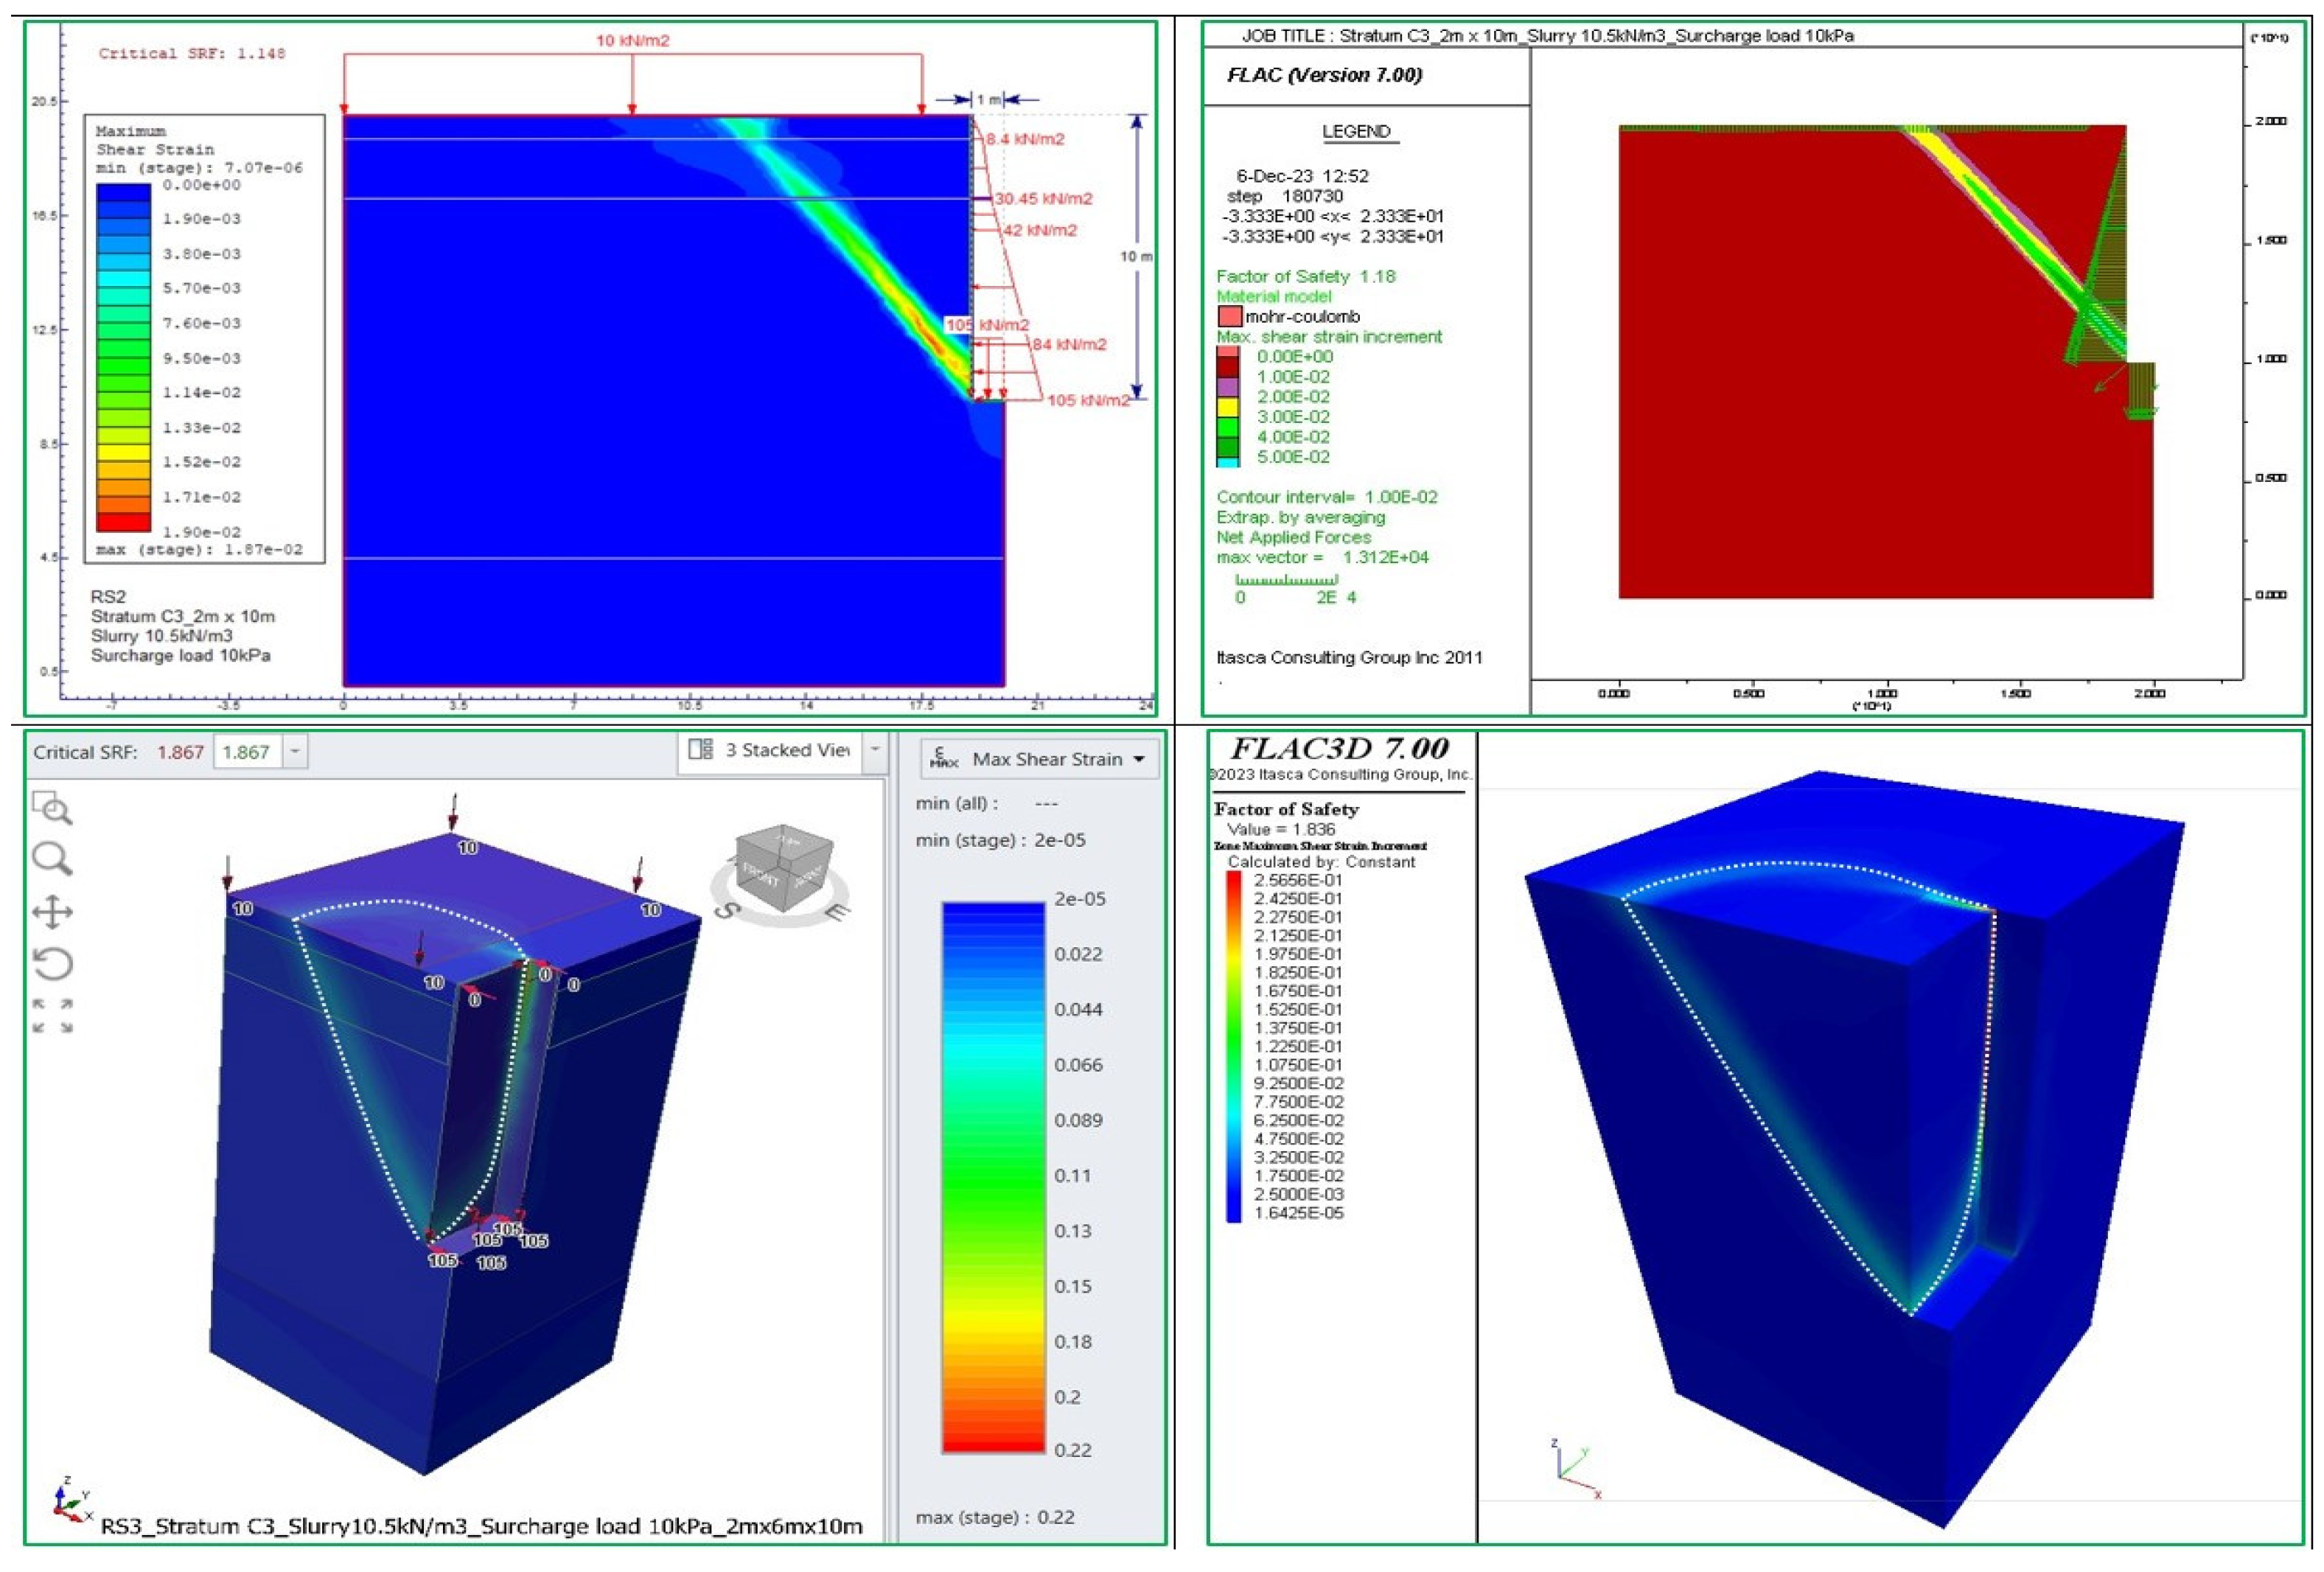
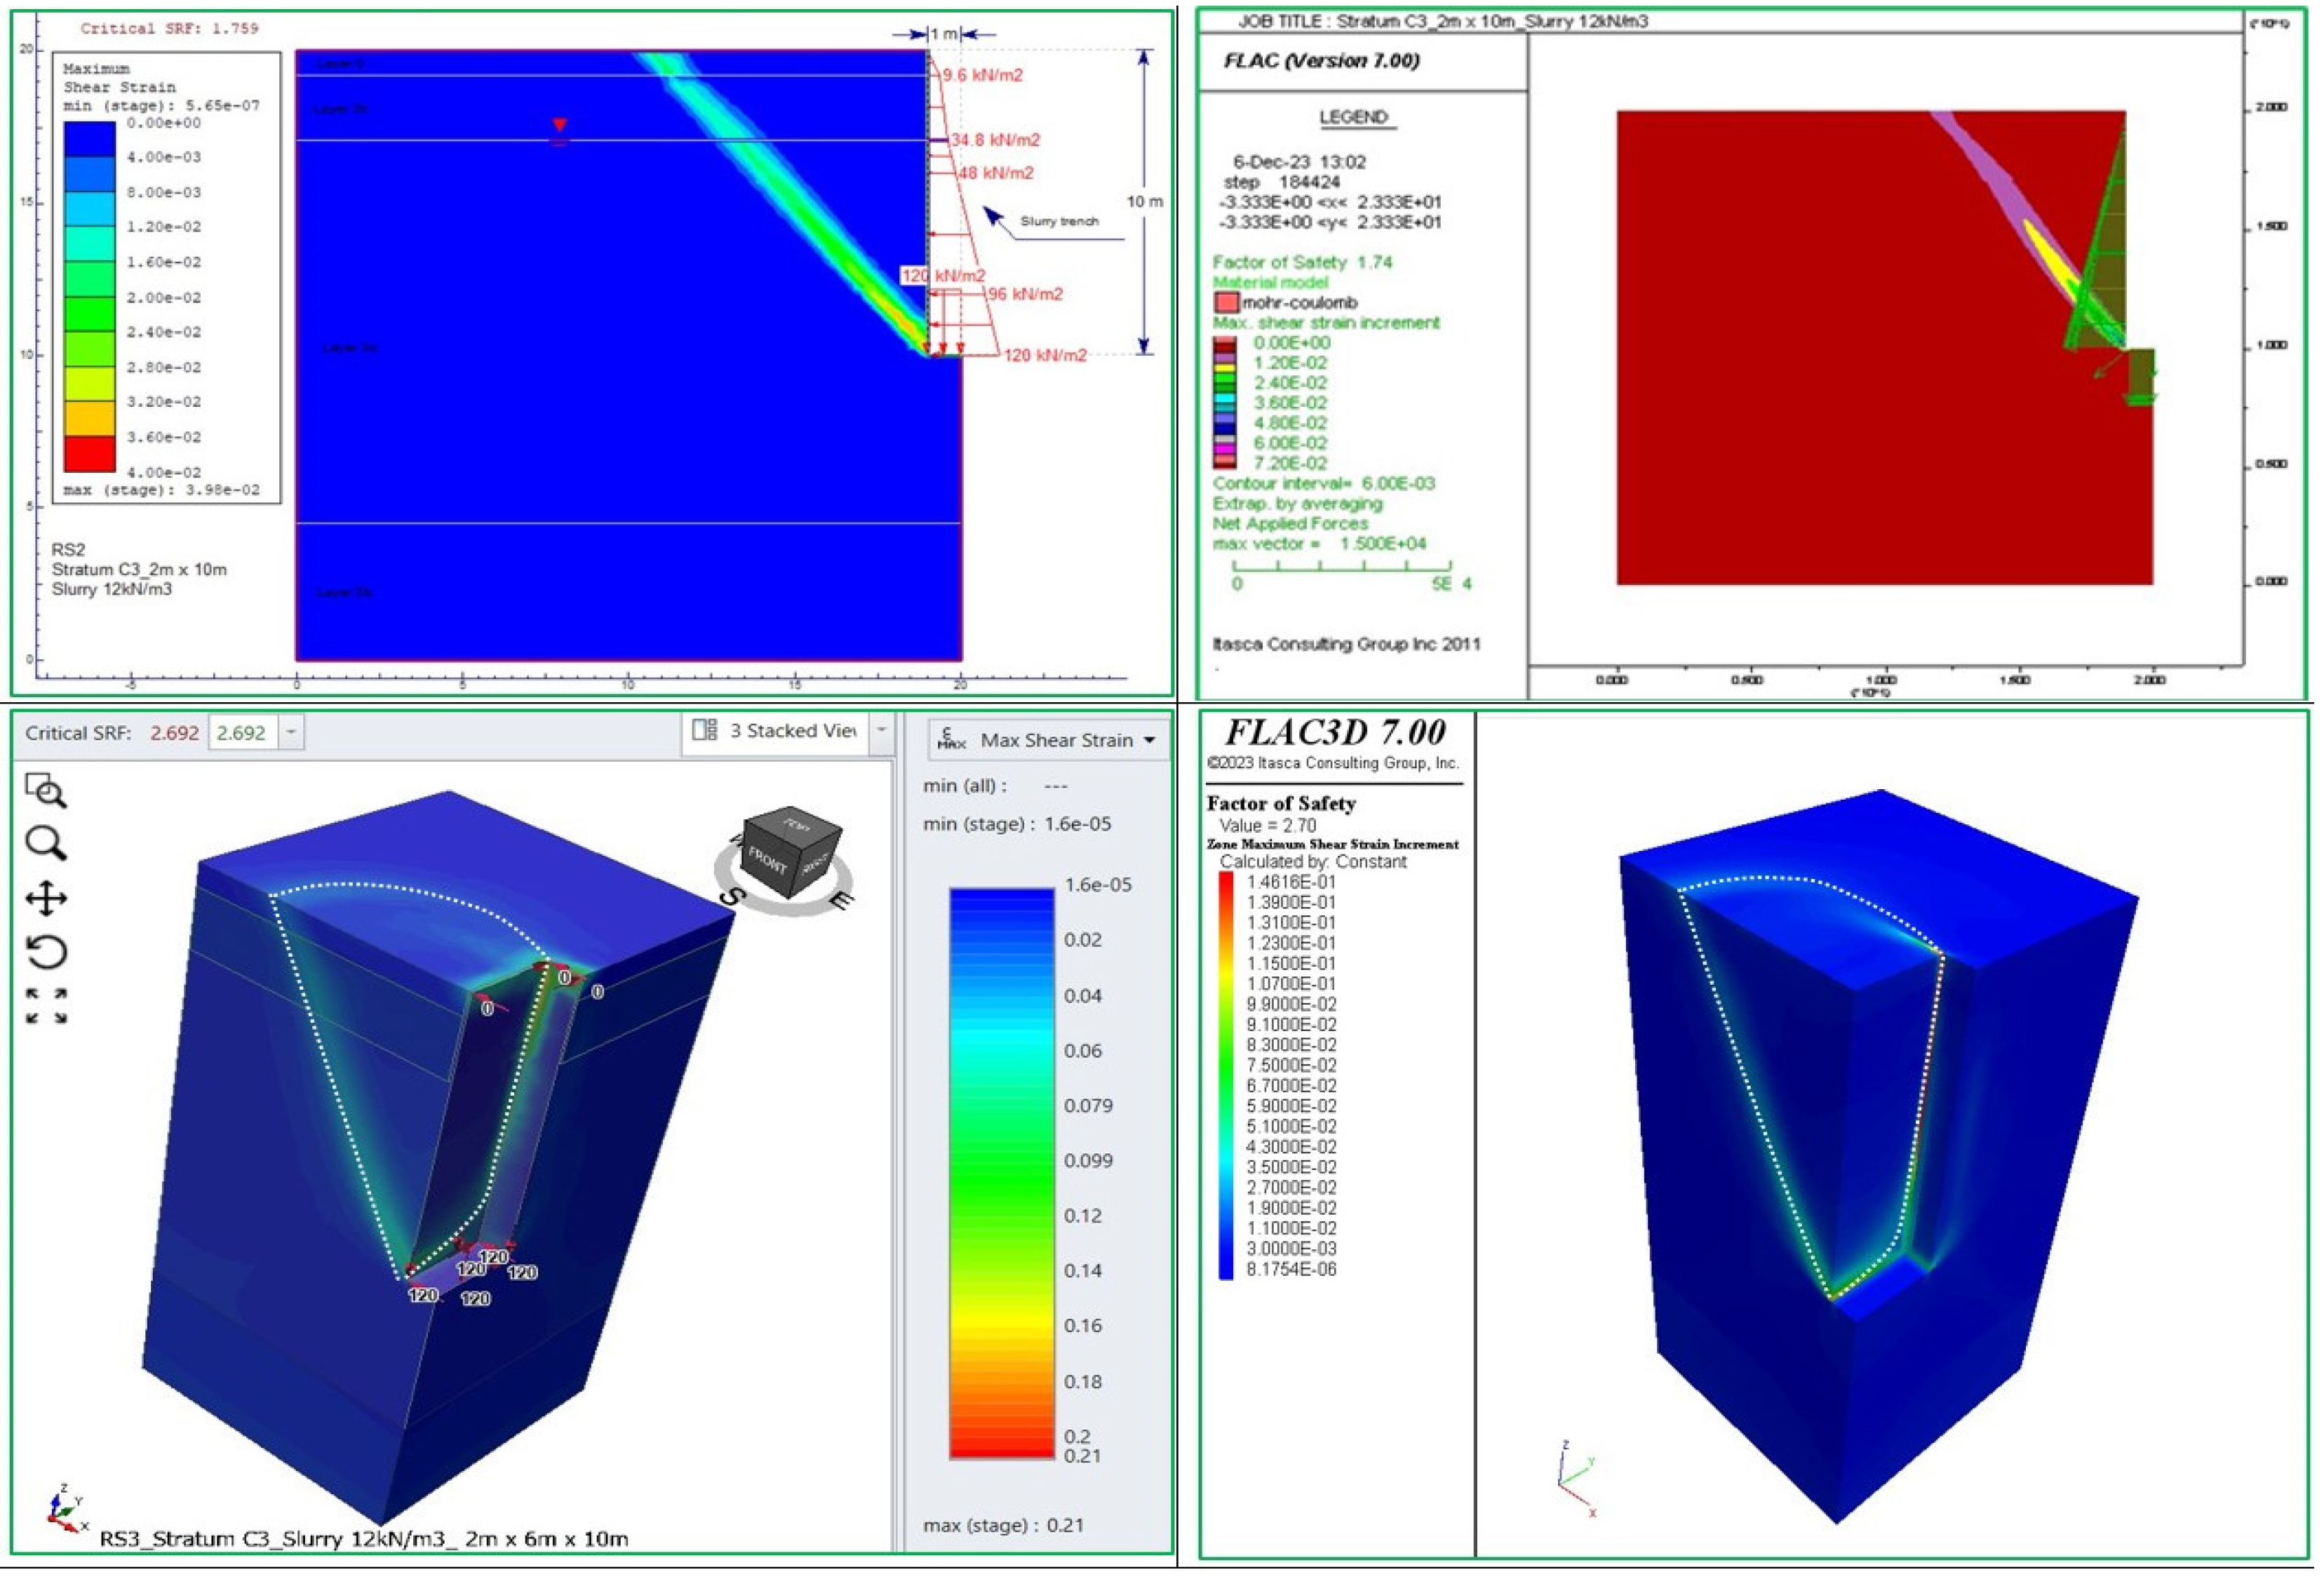
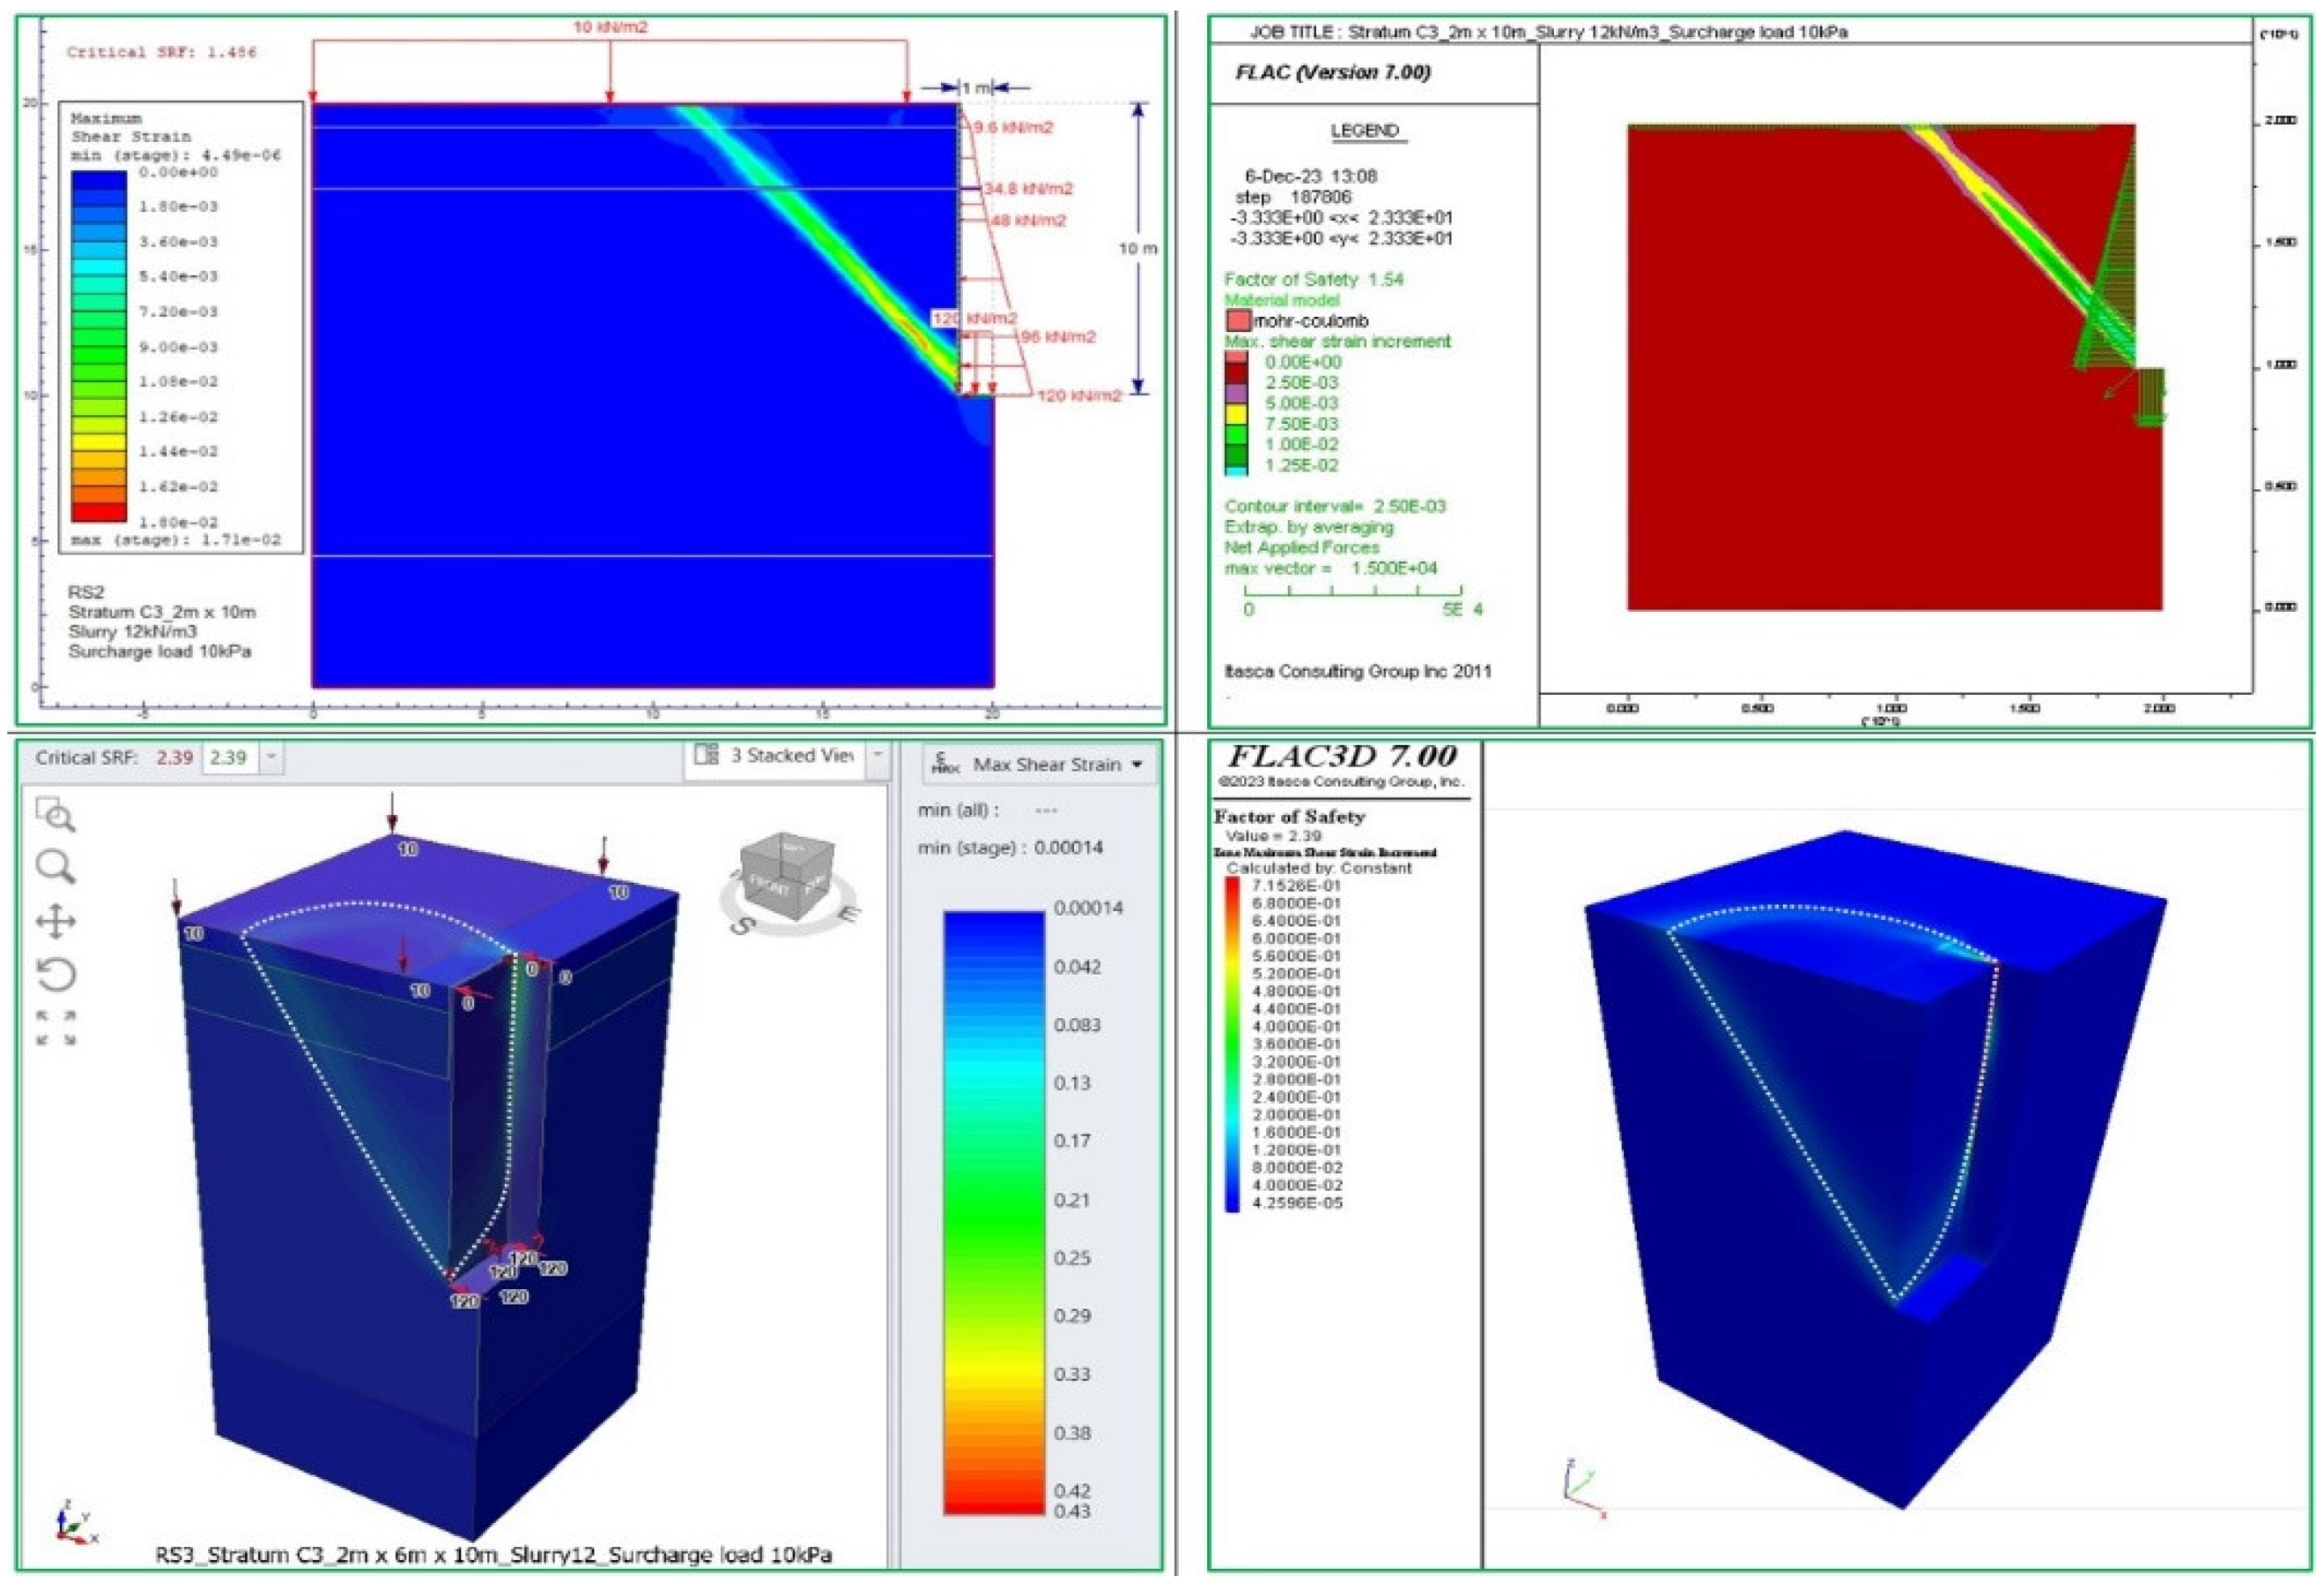
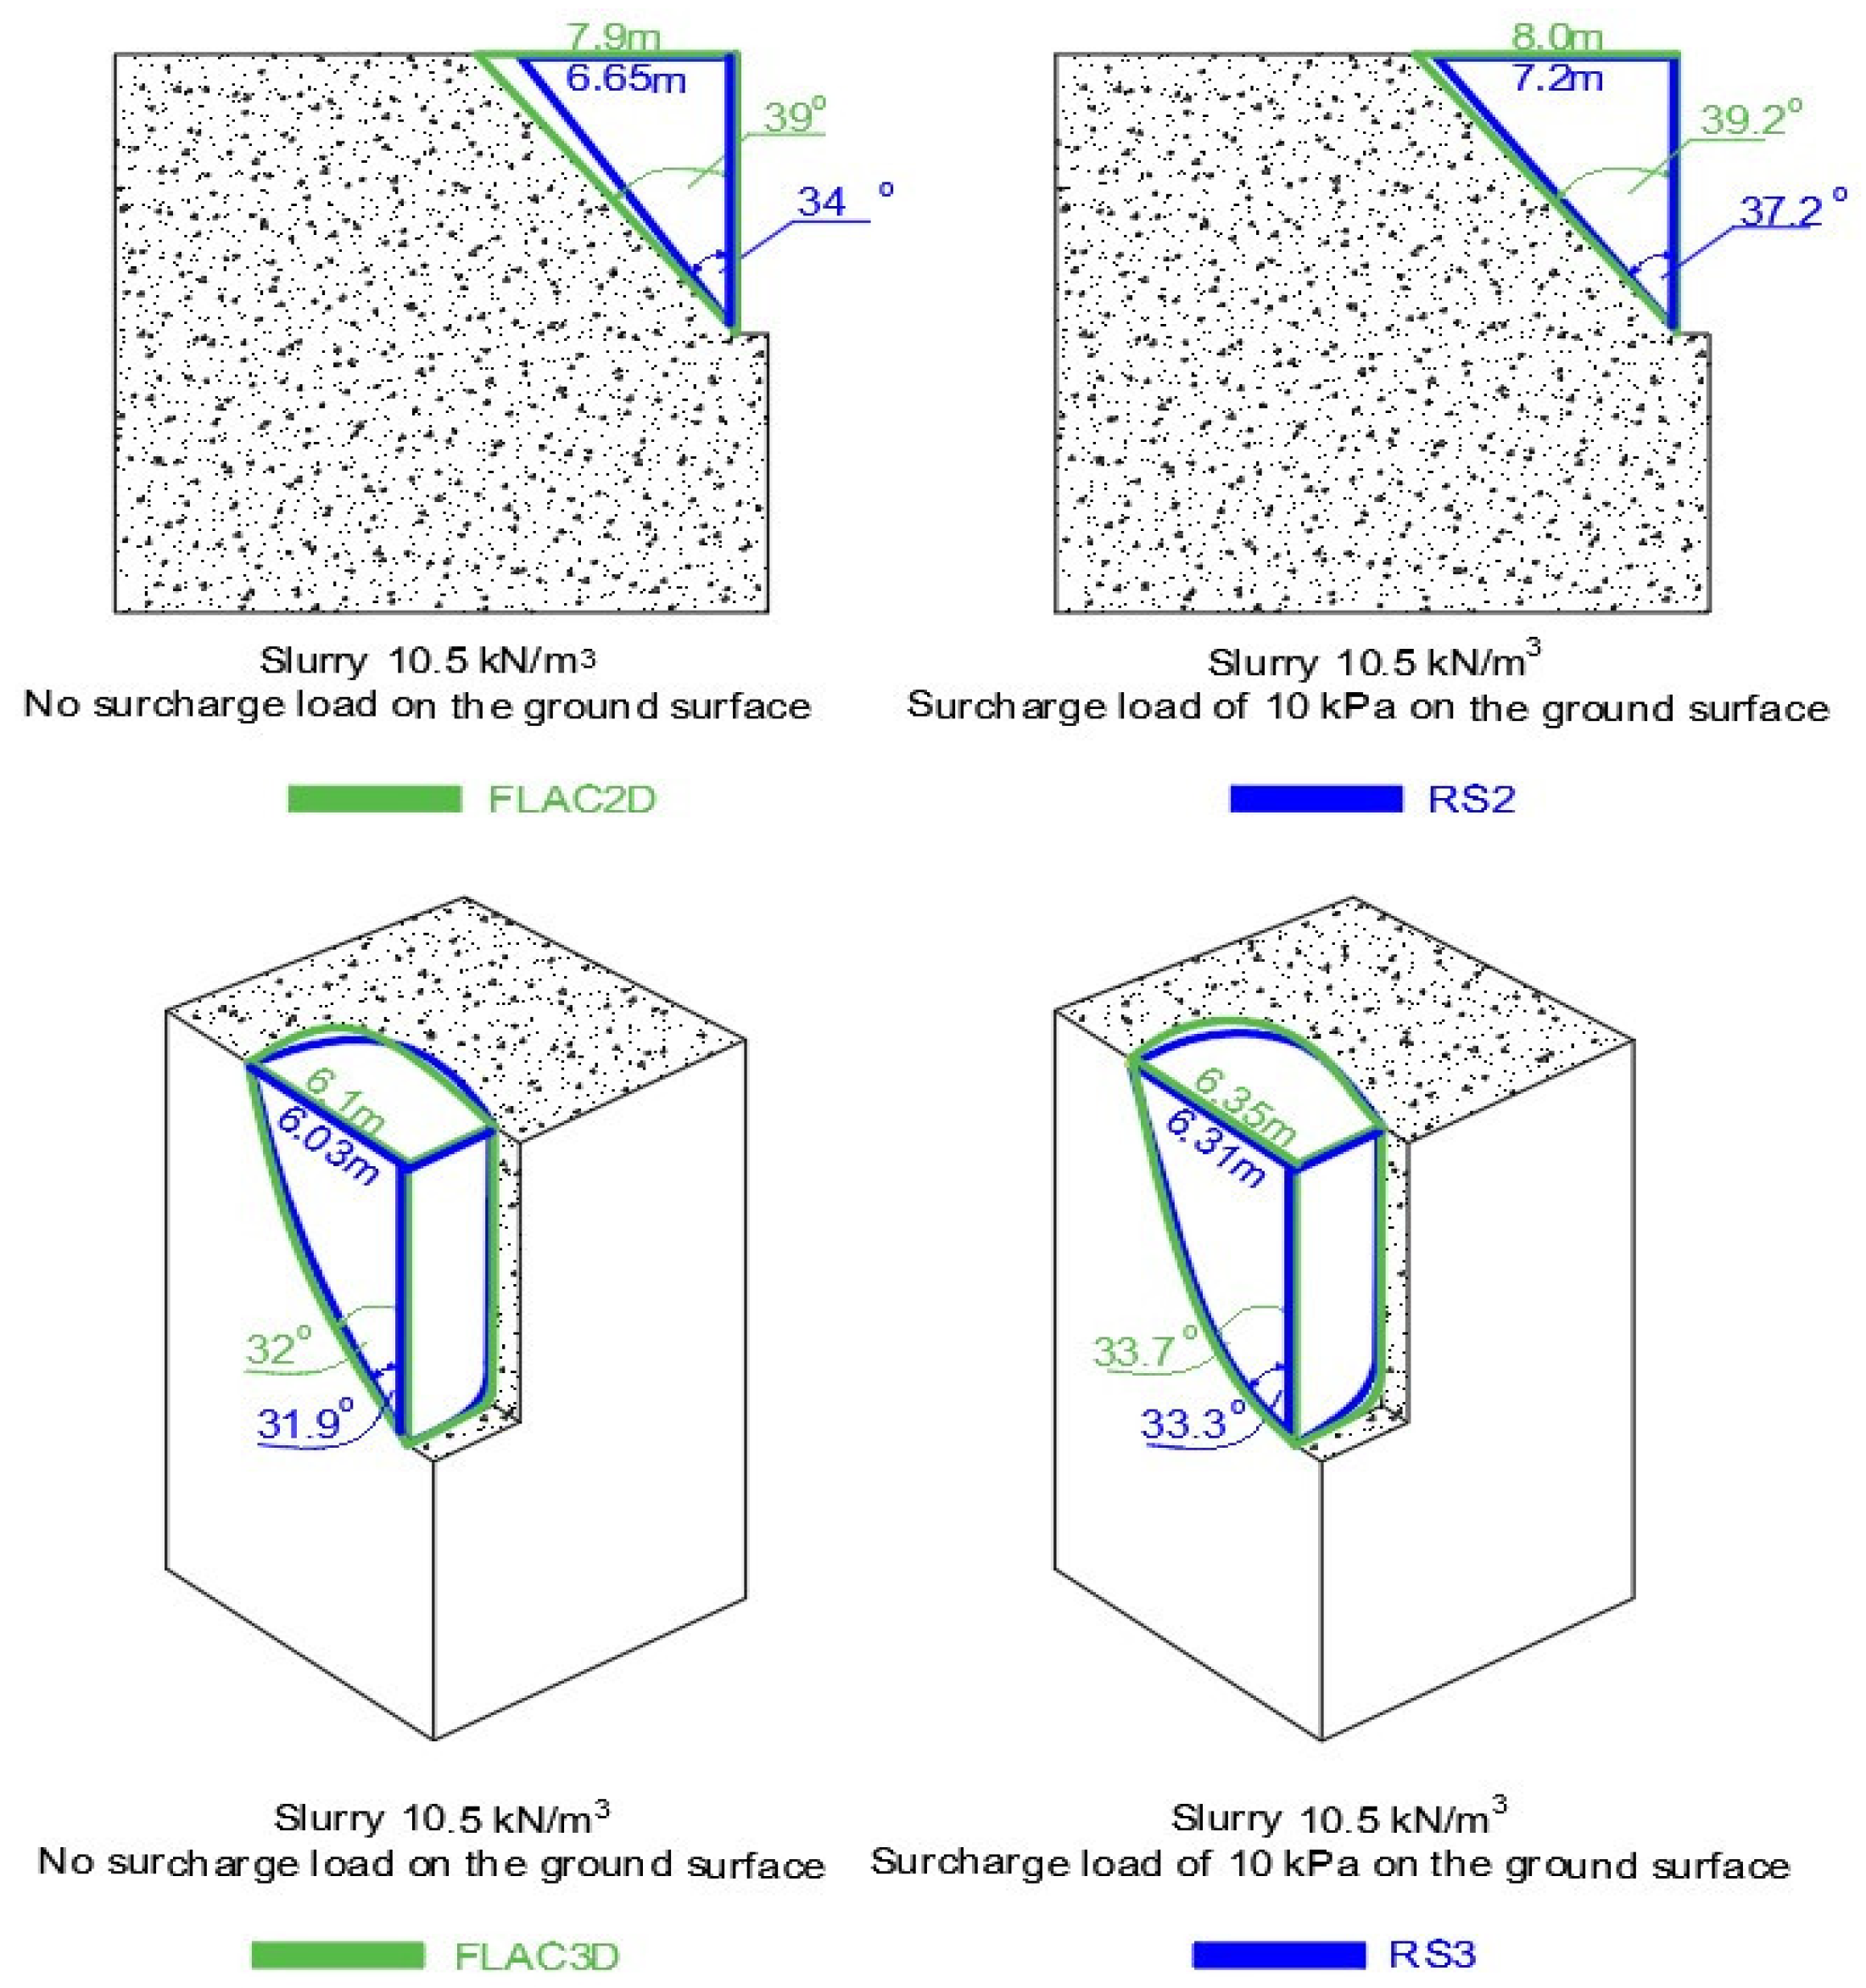
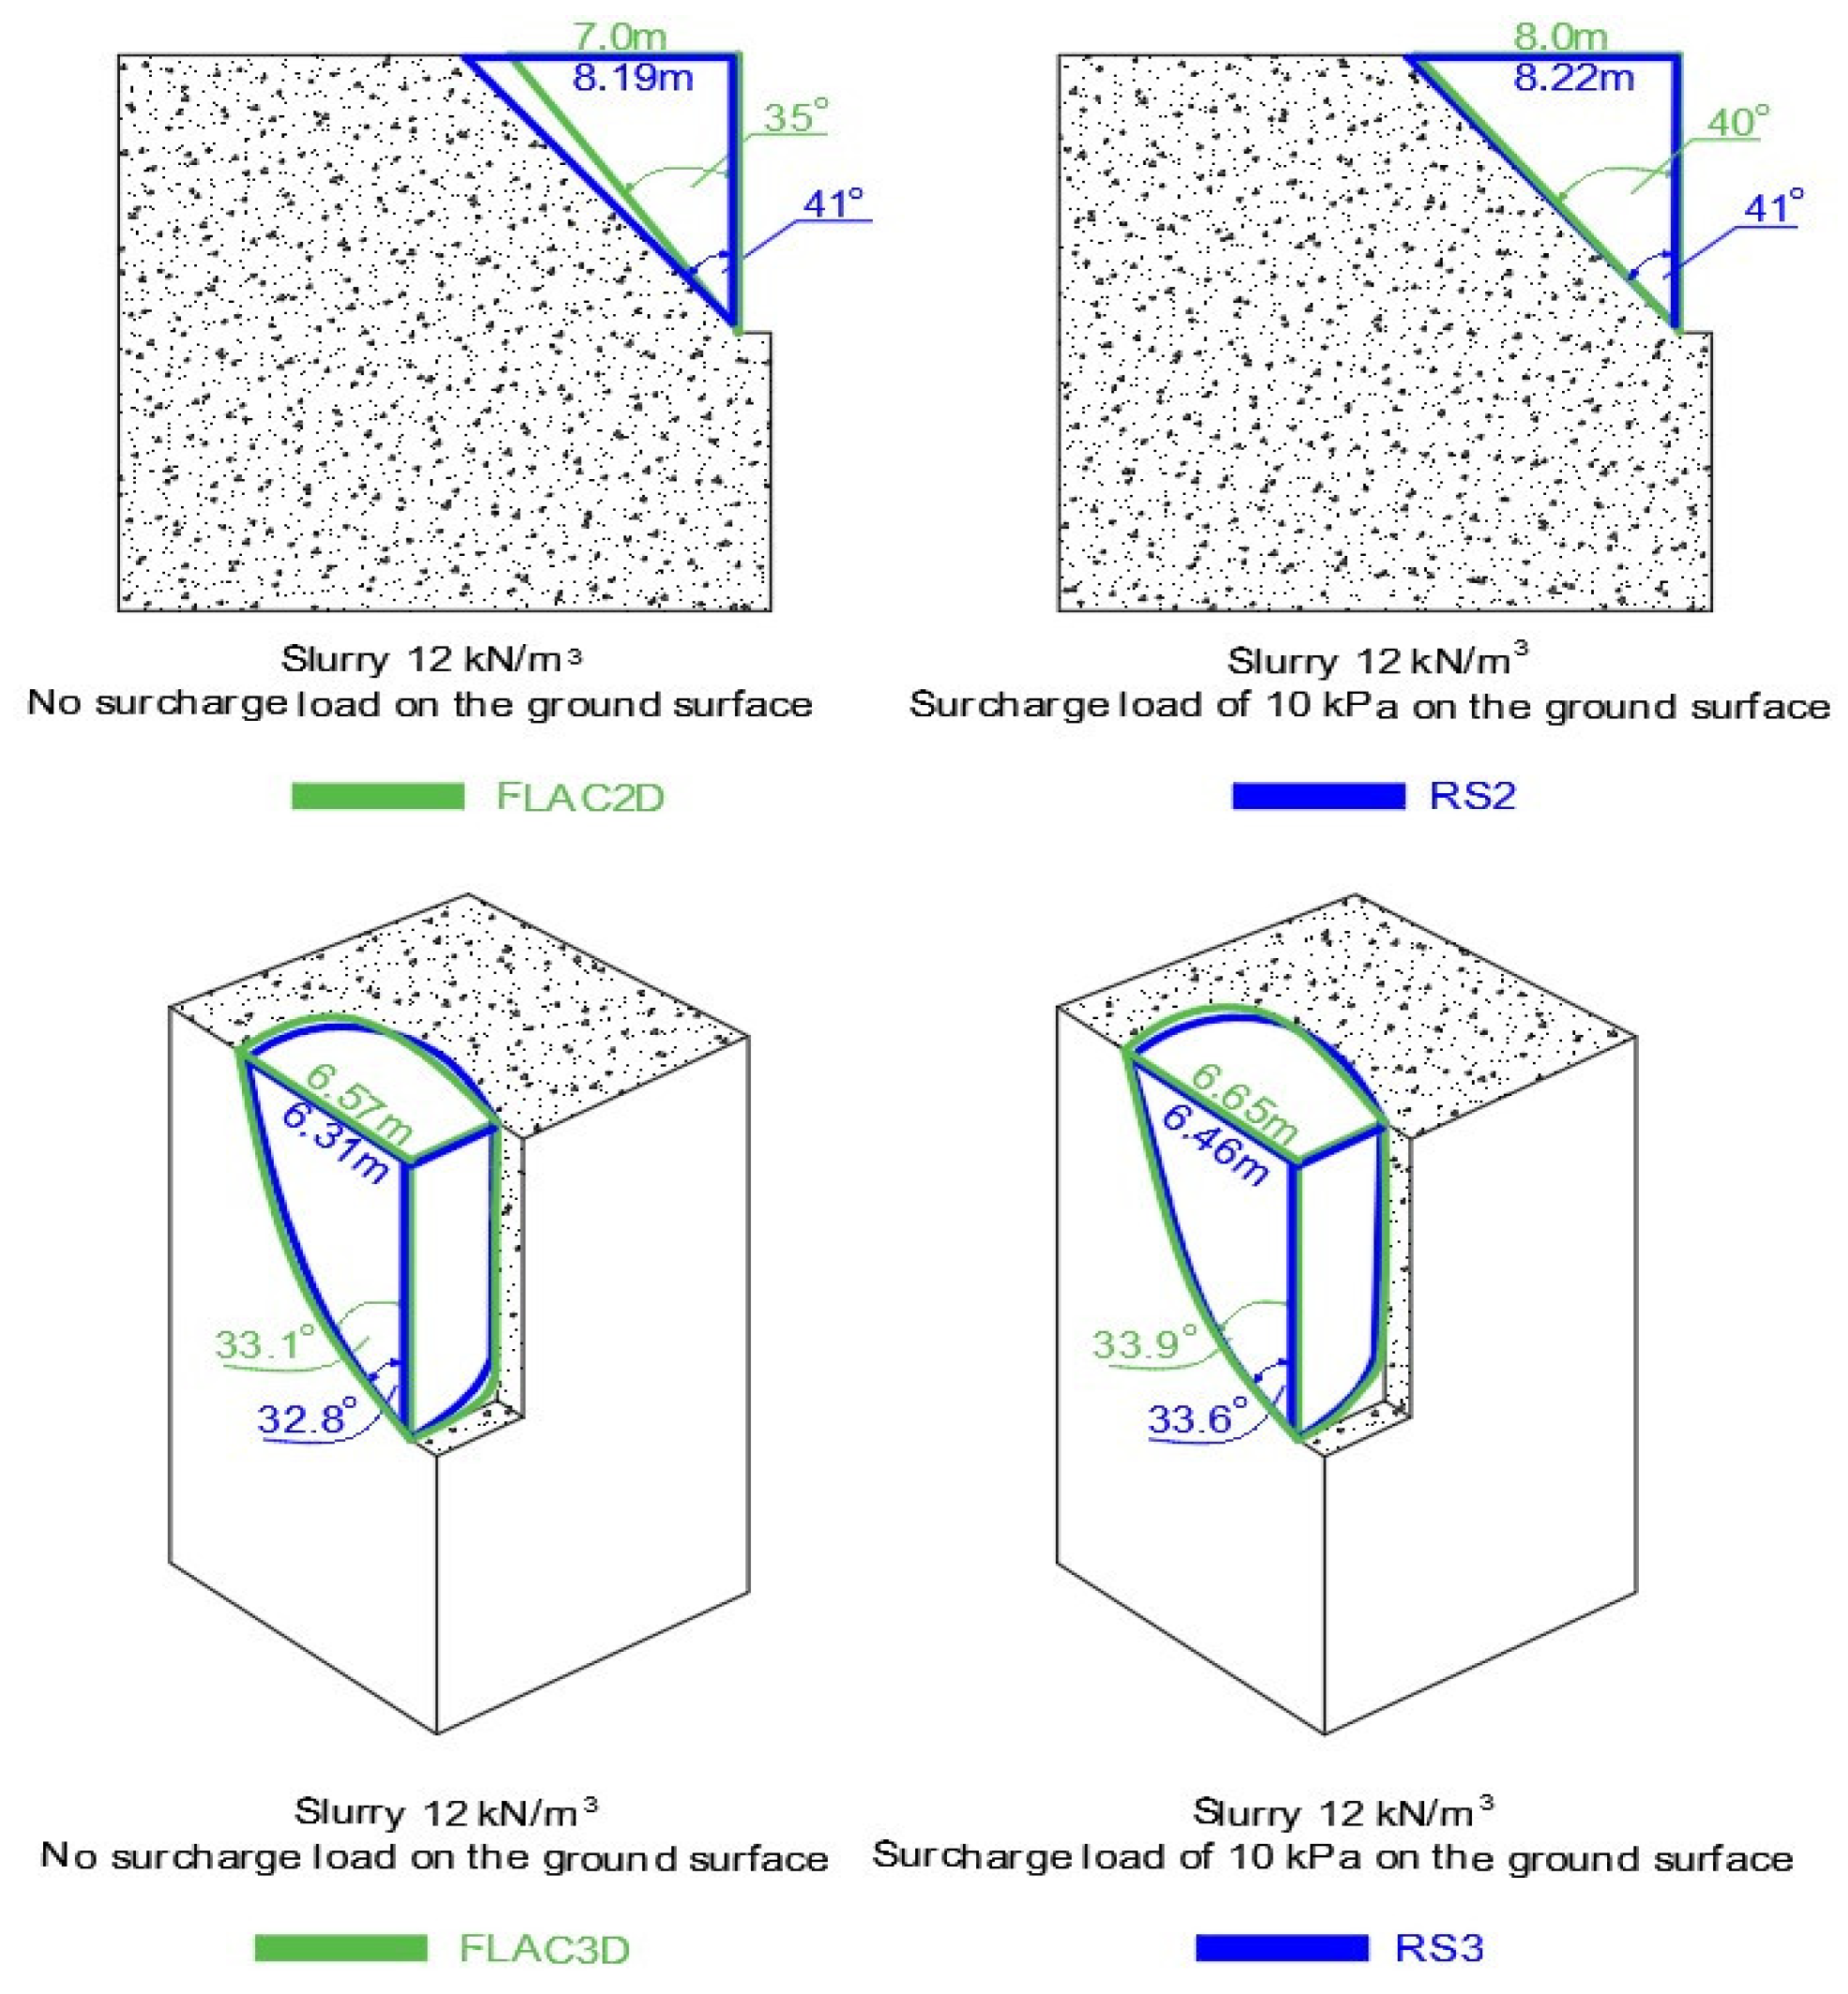
Firstly, the slurry trench models were built and analysed by FLAC2D, RS2, and at a trench length of 6m in 3D (FLAC3D, RS3). The results demonstrate agreement between FLAC2D and RS and between FLAC3D and RS3, as depicted in
Table 2 and
Figure 5,
Figure 6,
Figure 7 and
Figure 8. In the case of temporary support with 10.5 kN/m³ bentonite slurry and no surcharge load on the ground surface, the factors of safety (as analysed by RS2 and FLAC2D) range from 1.26 to 1.32. However, with a surcharge load of 10.0 kPa on the ground surface under the same conditions, the factors of safety decrease and stabilise at values ranging from 1.148 to 1.19.
Figure 5.
The failure mode of trenches in FLAC 2D/3D and RS2/3 for the case of gs = 10.5 kN/m³ slurry and no surcharge load on the ground surface.
Figure 5.
The failure mode of trenches in FLAC 2D/3D and RS2/3 for the case of gs = 10.5 kN/m³ slurry and no surcharge load on the ground surface.
Figure 6.
The failure mode of trenches in FLAC 2D/3D and RS2/3 for the case of gs = 10.5 kN/m³ slurry and surcharge load of 10.0 kPa on the ground surface.
Figure 6.
The failure mode of trenches in FLAC 2D/3D and RS2/3 for the case of gs = 10.5 kN/m³ slurry and surcharge load of 10.0 kPa on the ground surface.
Figure 7.
The failure mode of trenches in FLAC 2D/3D and RS2/3 for the case of gs = 12.0 kN/m³ slurry and no surcharge load on the ground surface.
Figure 7.
The failure mode of trenches in FLAC 2D/3D and RS2/3 for the case of gs = 12.0 kN/m³ slurry and no surcharge load on the ground surface.
Turning to the case of temporary support with γs = 12kN/m³ bentonite slurry and no surcharge load on the ground surface, RS2 and FLAC2D estimate the safety factors to range from 1.74 to 1.80. However, with an evenly distributed surcharge load of 10.0 kPa, the safety factors remain between 1.456 and 1.540.
After analysing the slurry trench with a length of 6m in 3D, FLAC3D and RS3 were also used to conduct stability analysis with an extension of the trench length from 6m to 54m. The results show that initially, in a length of 6m, the safety factor in 3D is higher than in 2D by an average of 57.8 % (
Table 1,
Figure 5,
Figure 6,
Figure 7 and
Figure 8).
Figure 8.
The failure mode of trenches in FLAC 2D/3D and RS2/3 for the case of gs = 12.0 kN/m³ slurry and surcharge load of 10.0 kPa on the ground surface.
Figure 8.
The failure mode of trenches in FLAC 2D/3D and RS2/3 for the case of gs = 12.0 kN/m³ slurry and surcharge load of 10.0 kPa on the ground surface.
Figure 12 and
Figure 13 depict the critical slip surfaces identified respectively by FLAC and RS in both 2D and 3D configurations for the case of slurry γ
s = 10.5 kN/m
3 (
Figure 9) and 12.0 kN/m
3 (
Figure 10). Slight differences in the localisation of slip surfaces obtained from both programs are visible.
Figure 9.
Critical slip surfaces identified by FLSC and RS for the case of slurry gs = 10.5 kN/m³.
Figure 9.
Critical slip surfaces identified by FLSC and RS for the case of slurry gs = 10.5 kN/m³.
Figure 10.
Critical slip surfaces identified by FLSC and RS for the case of slurry gs = 12.0 kN/m³.
Figure 10.
Critical slip surfaces identified by FLSC and RS for the case of slurry gs = 12.0 kN/m³.
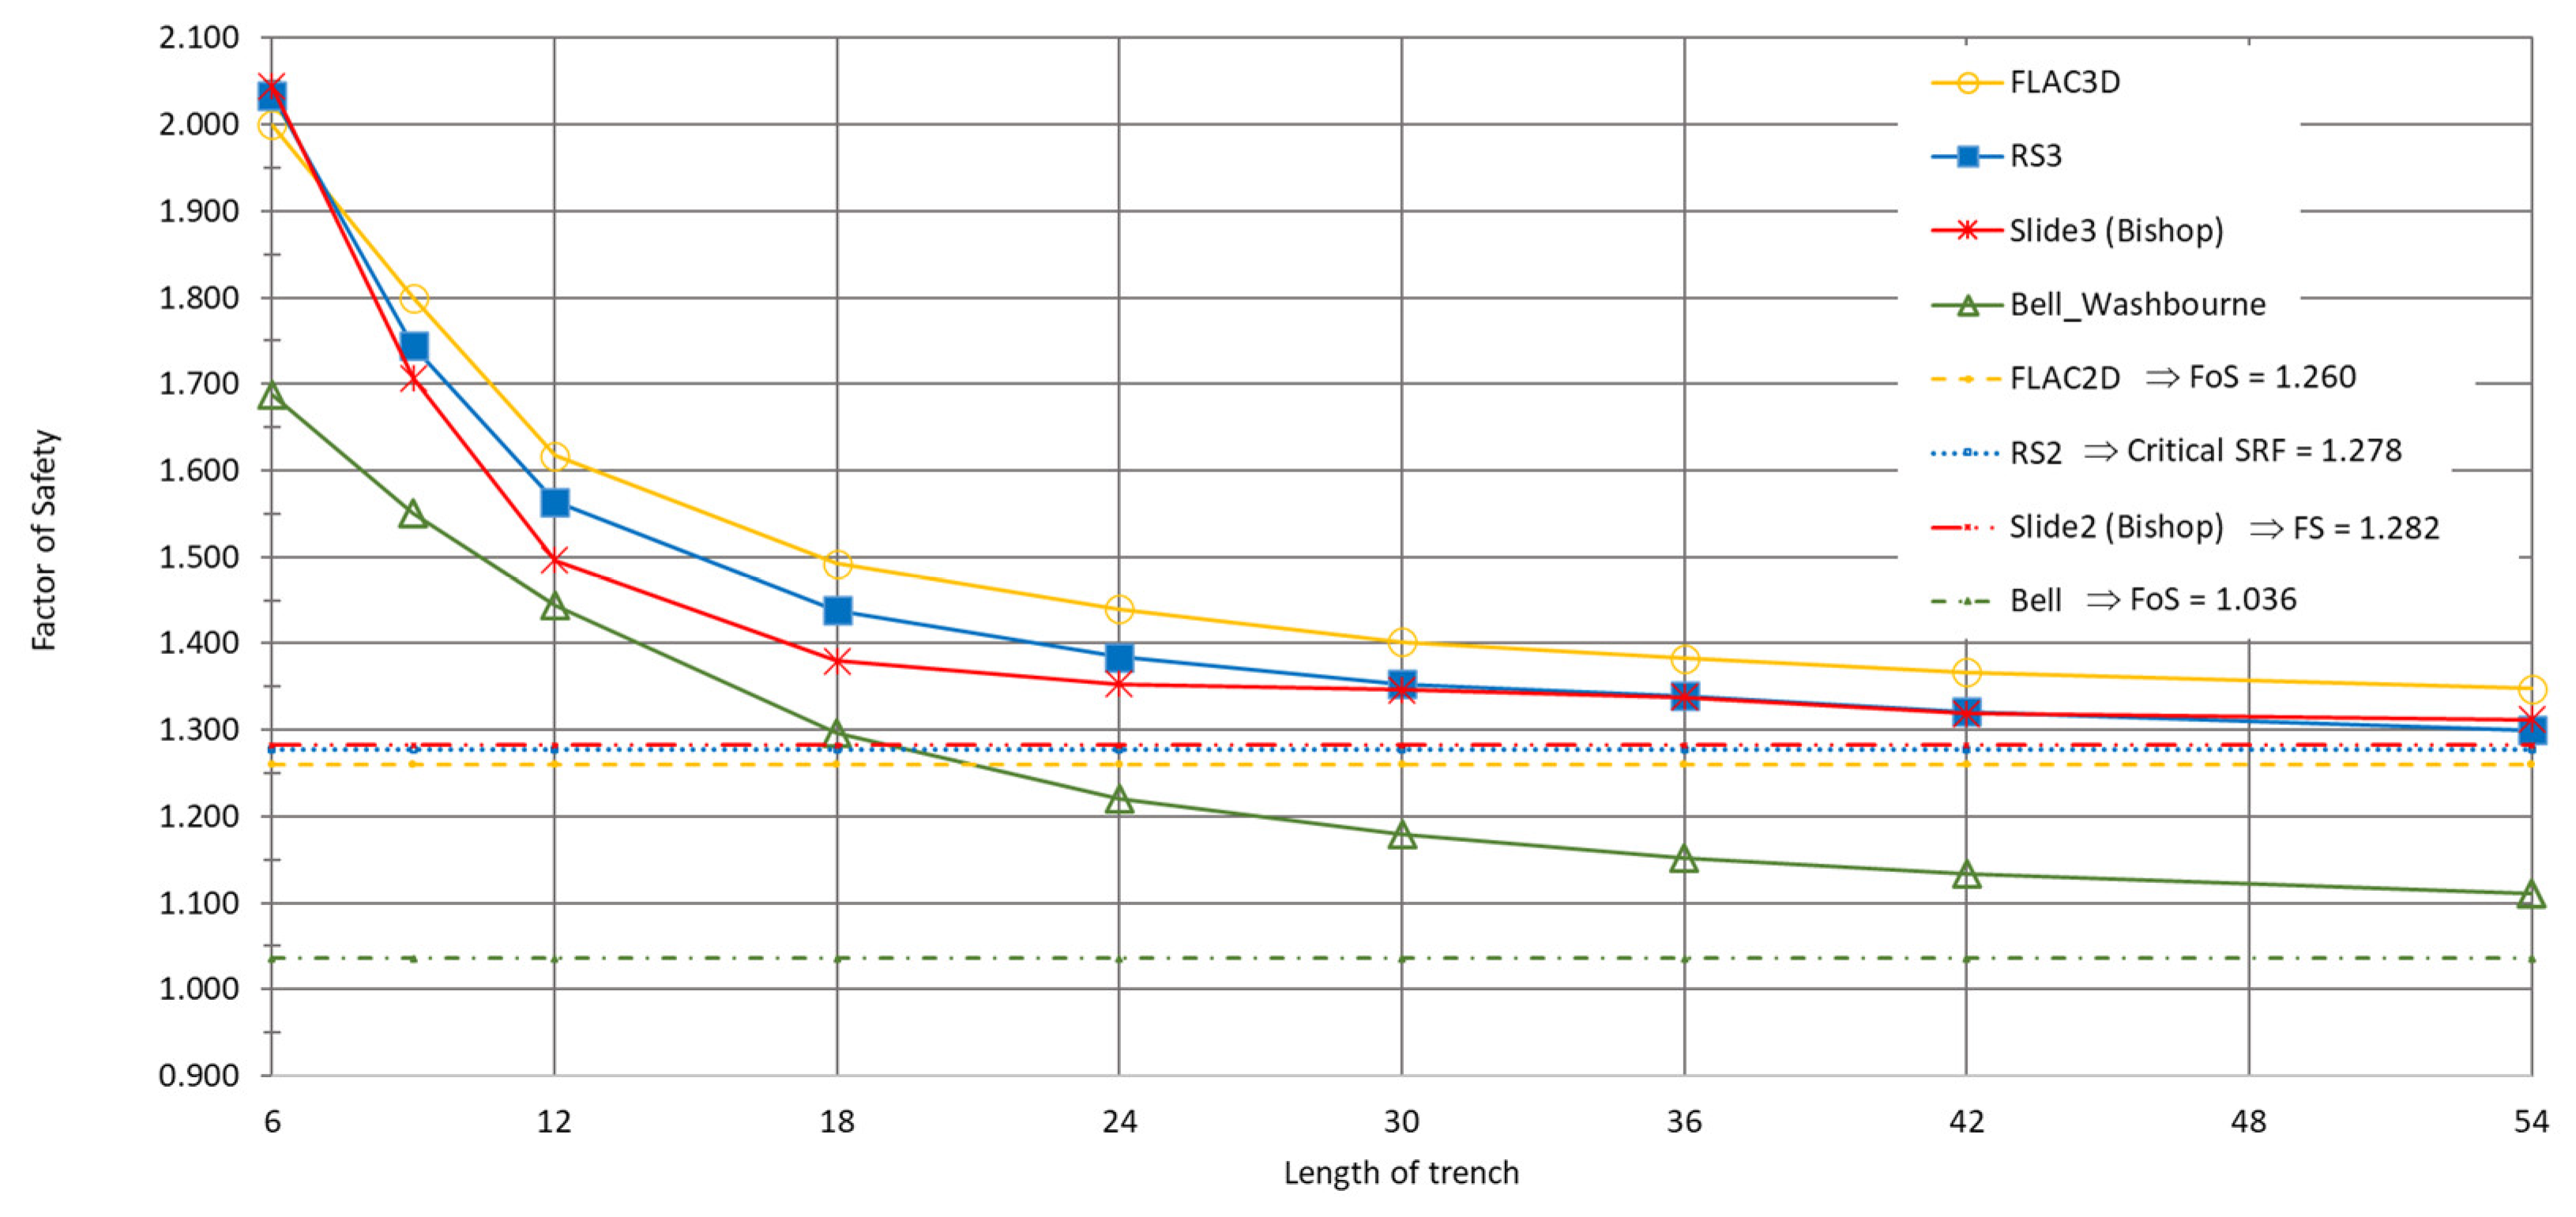
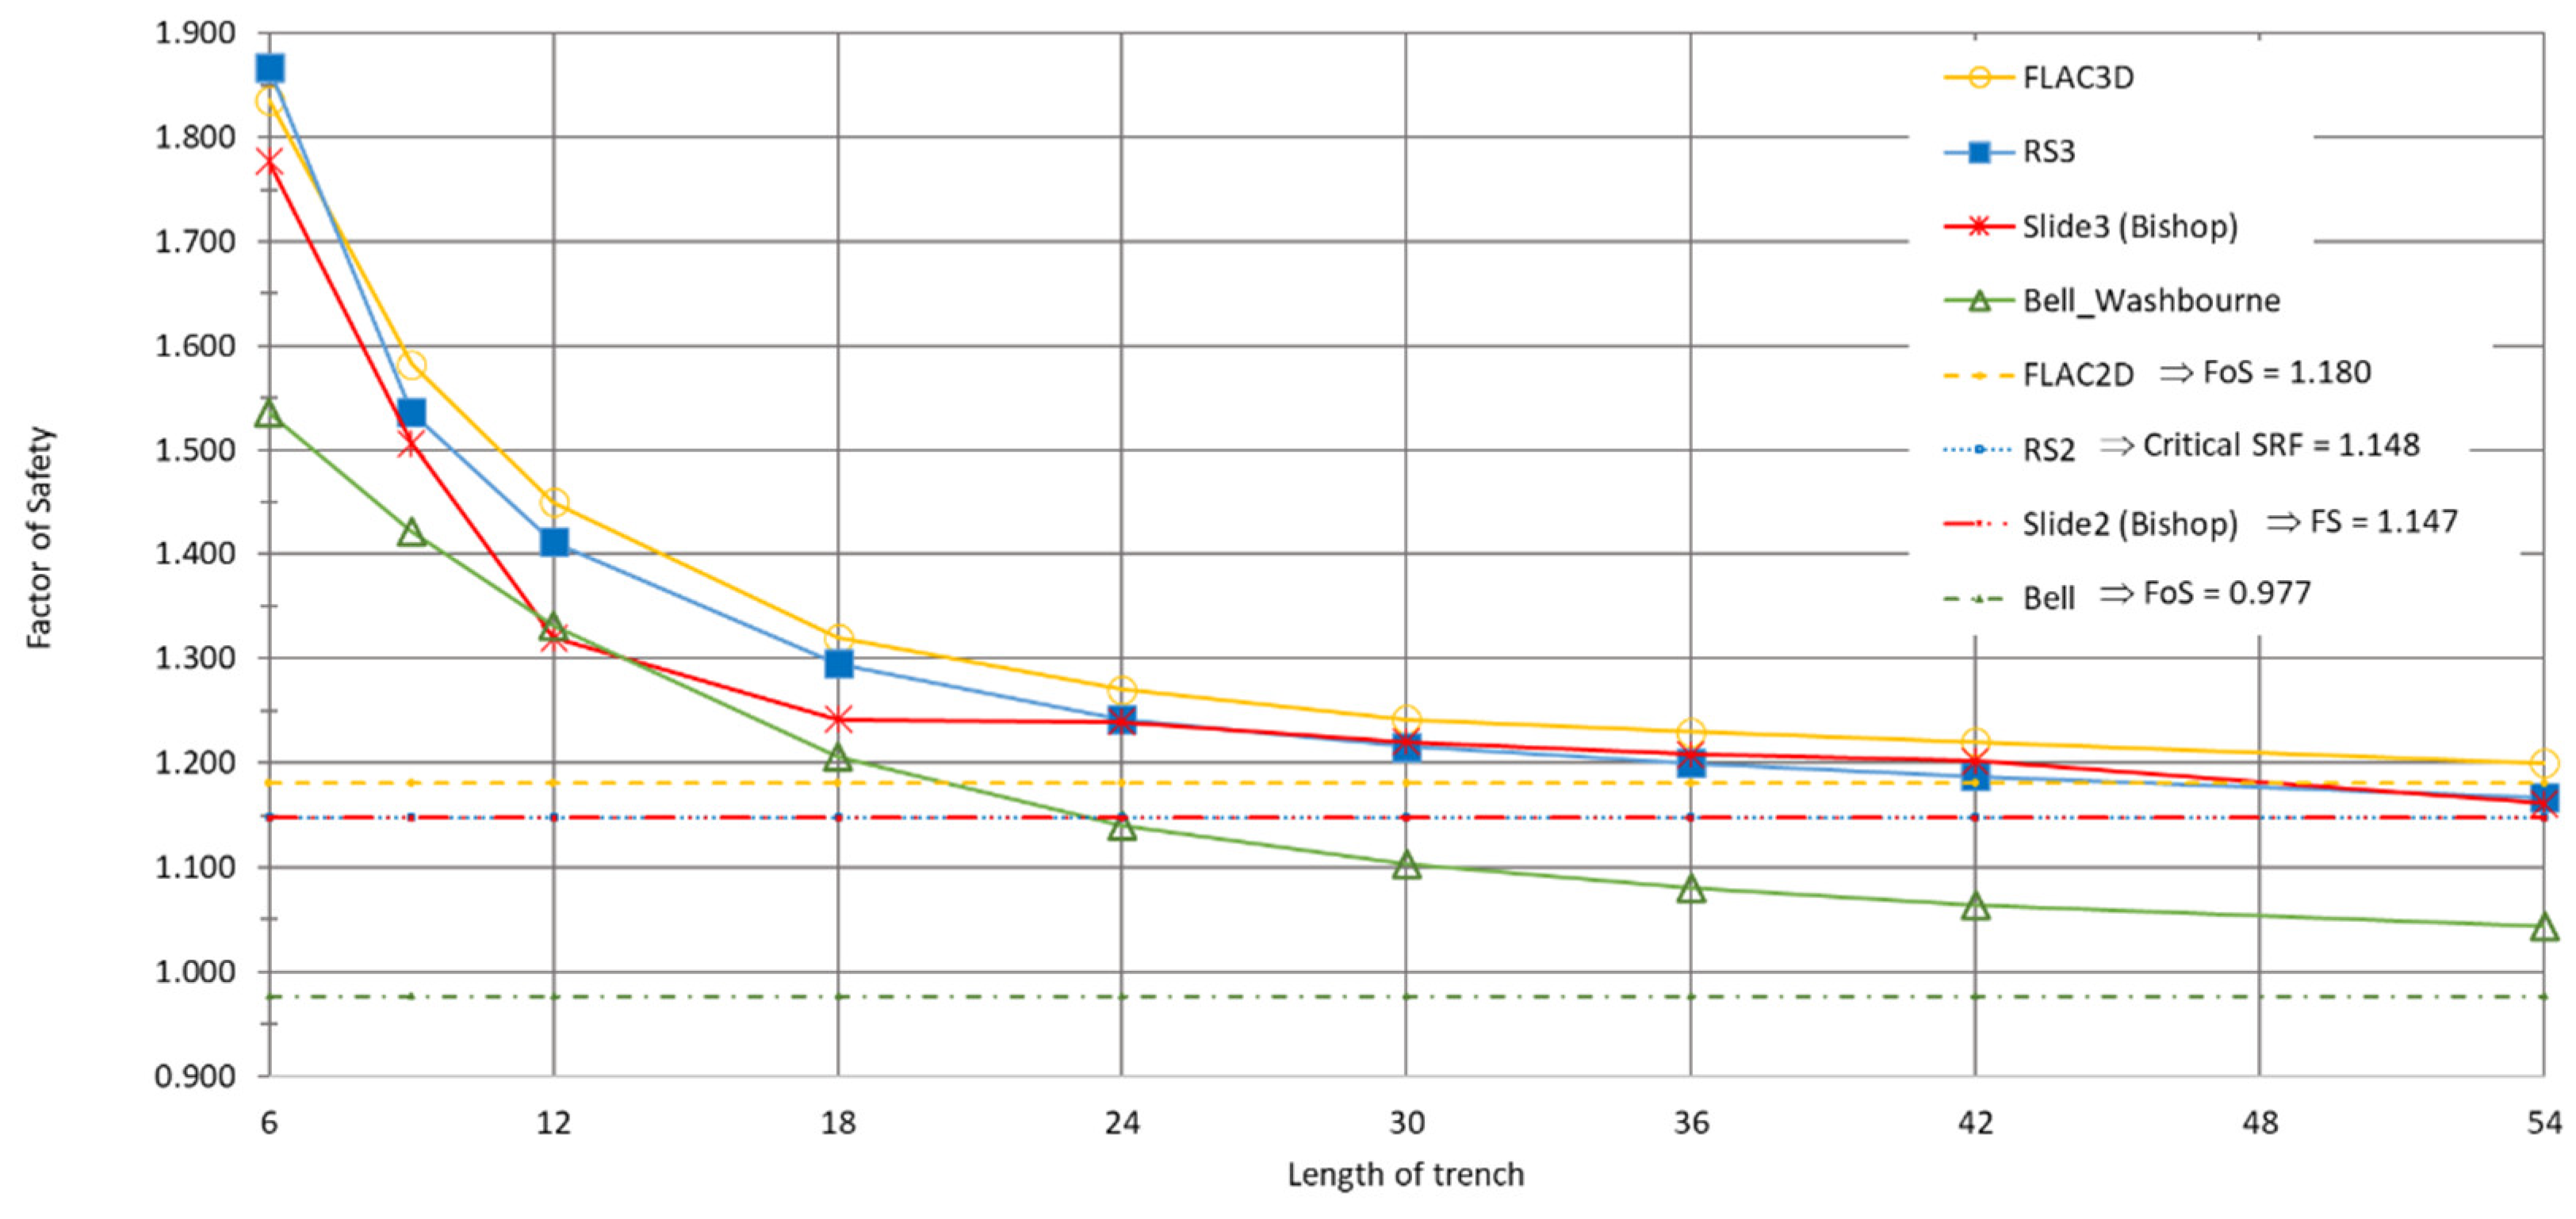
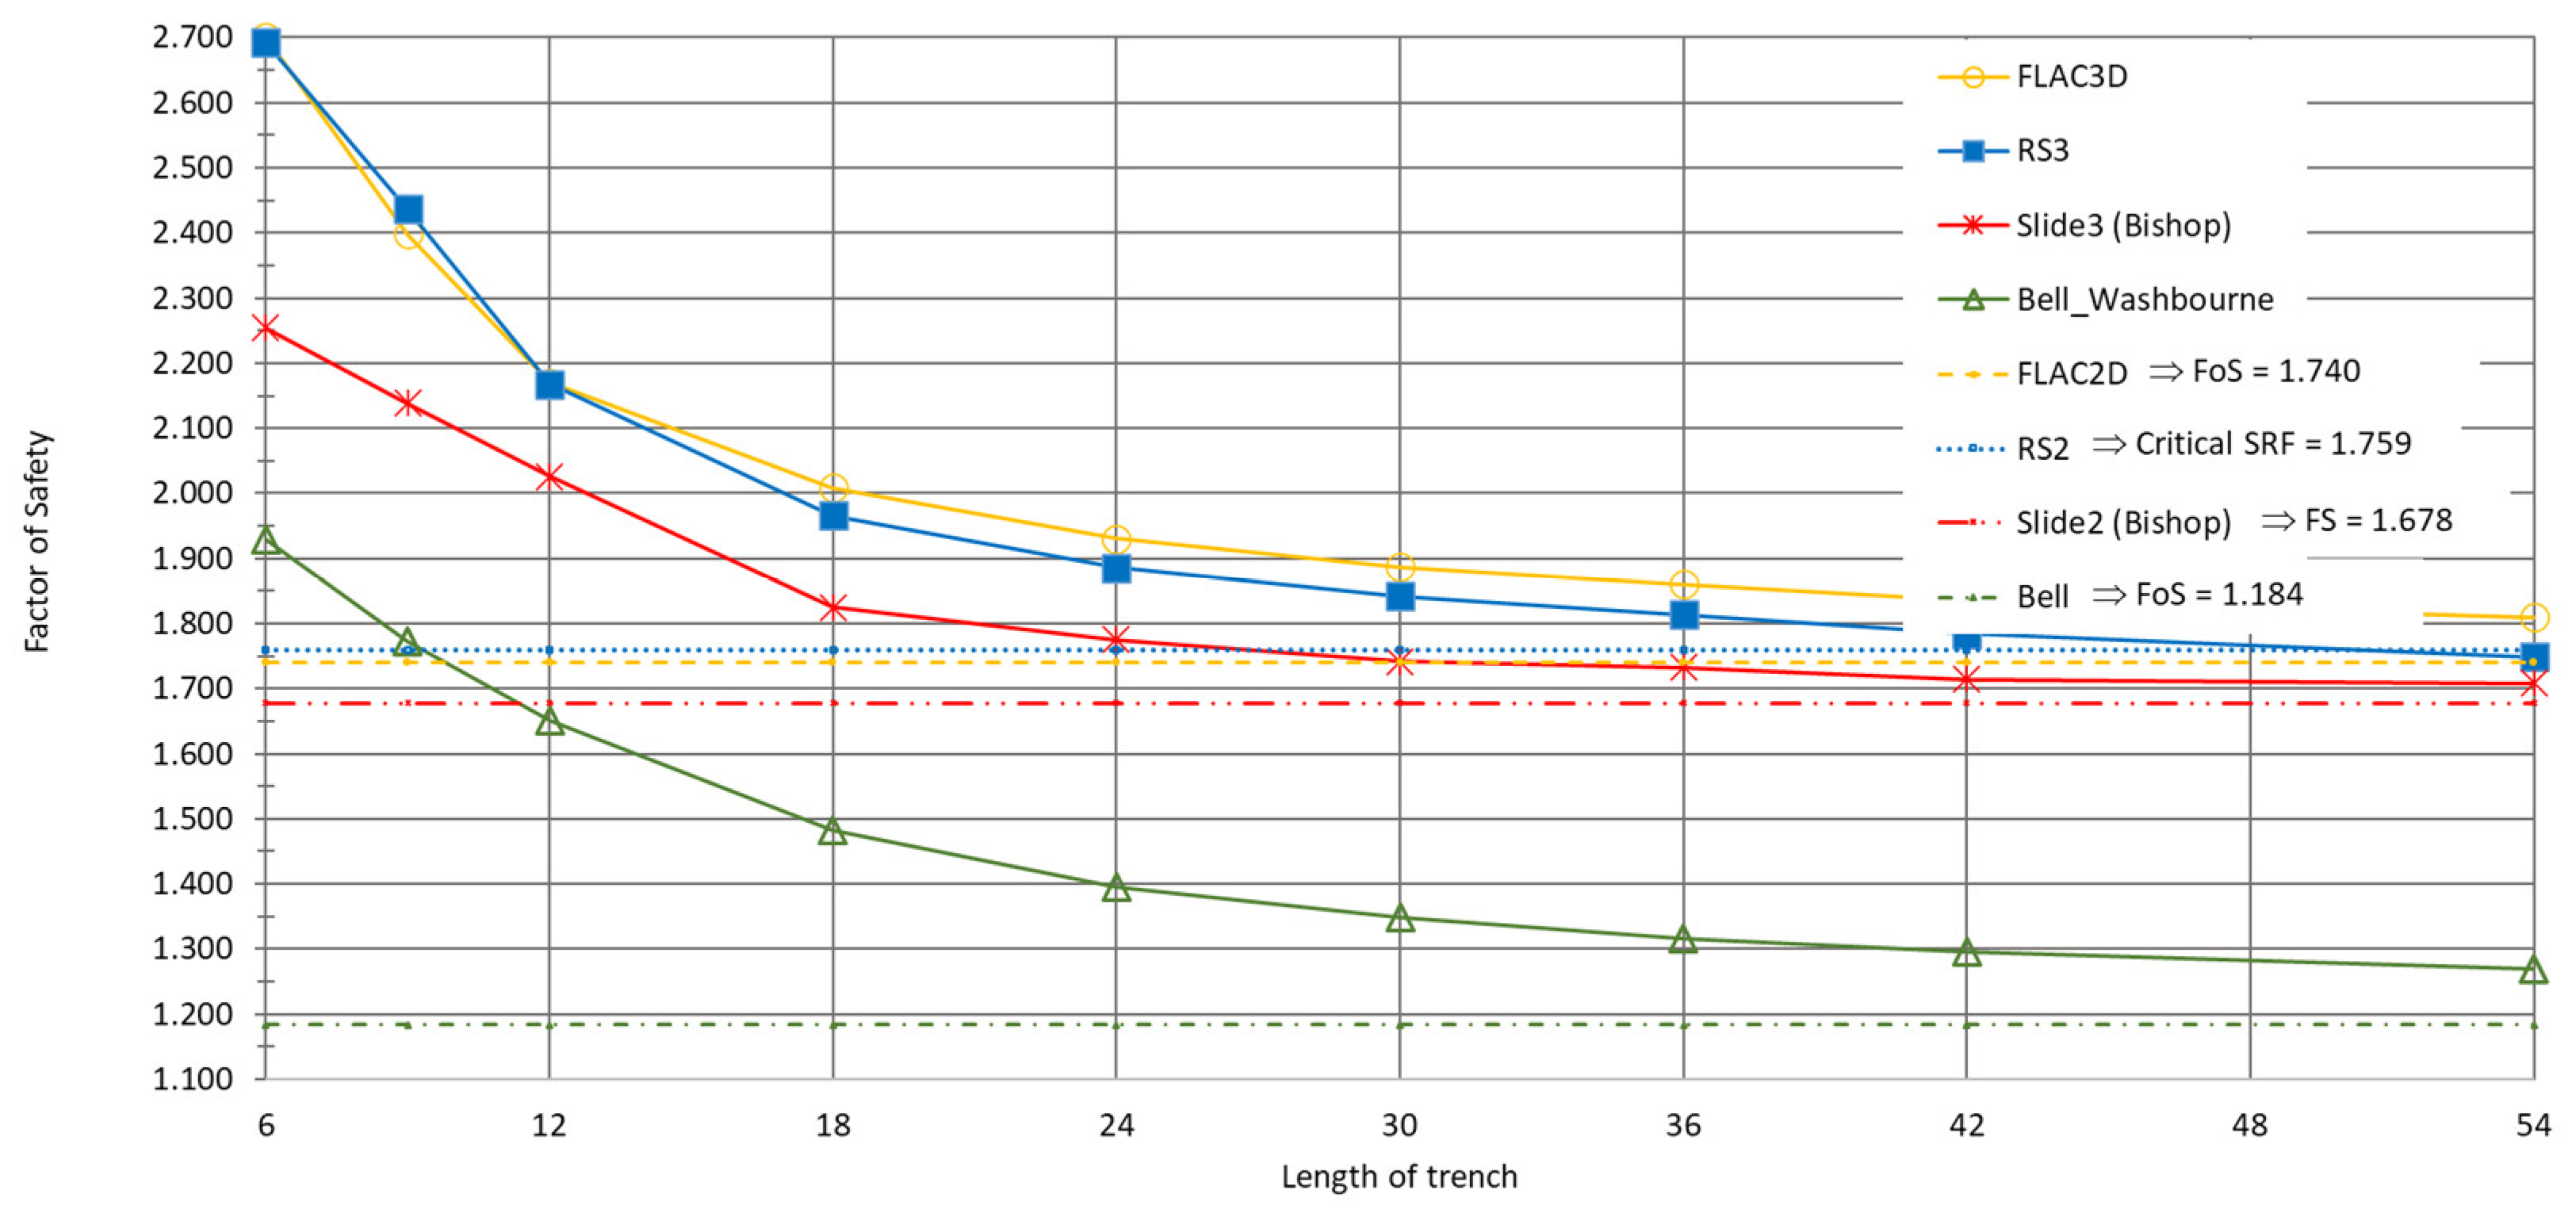
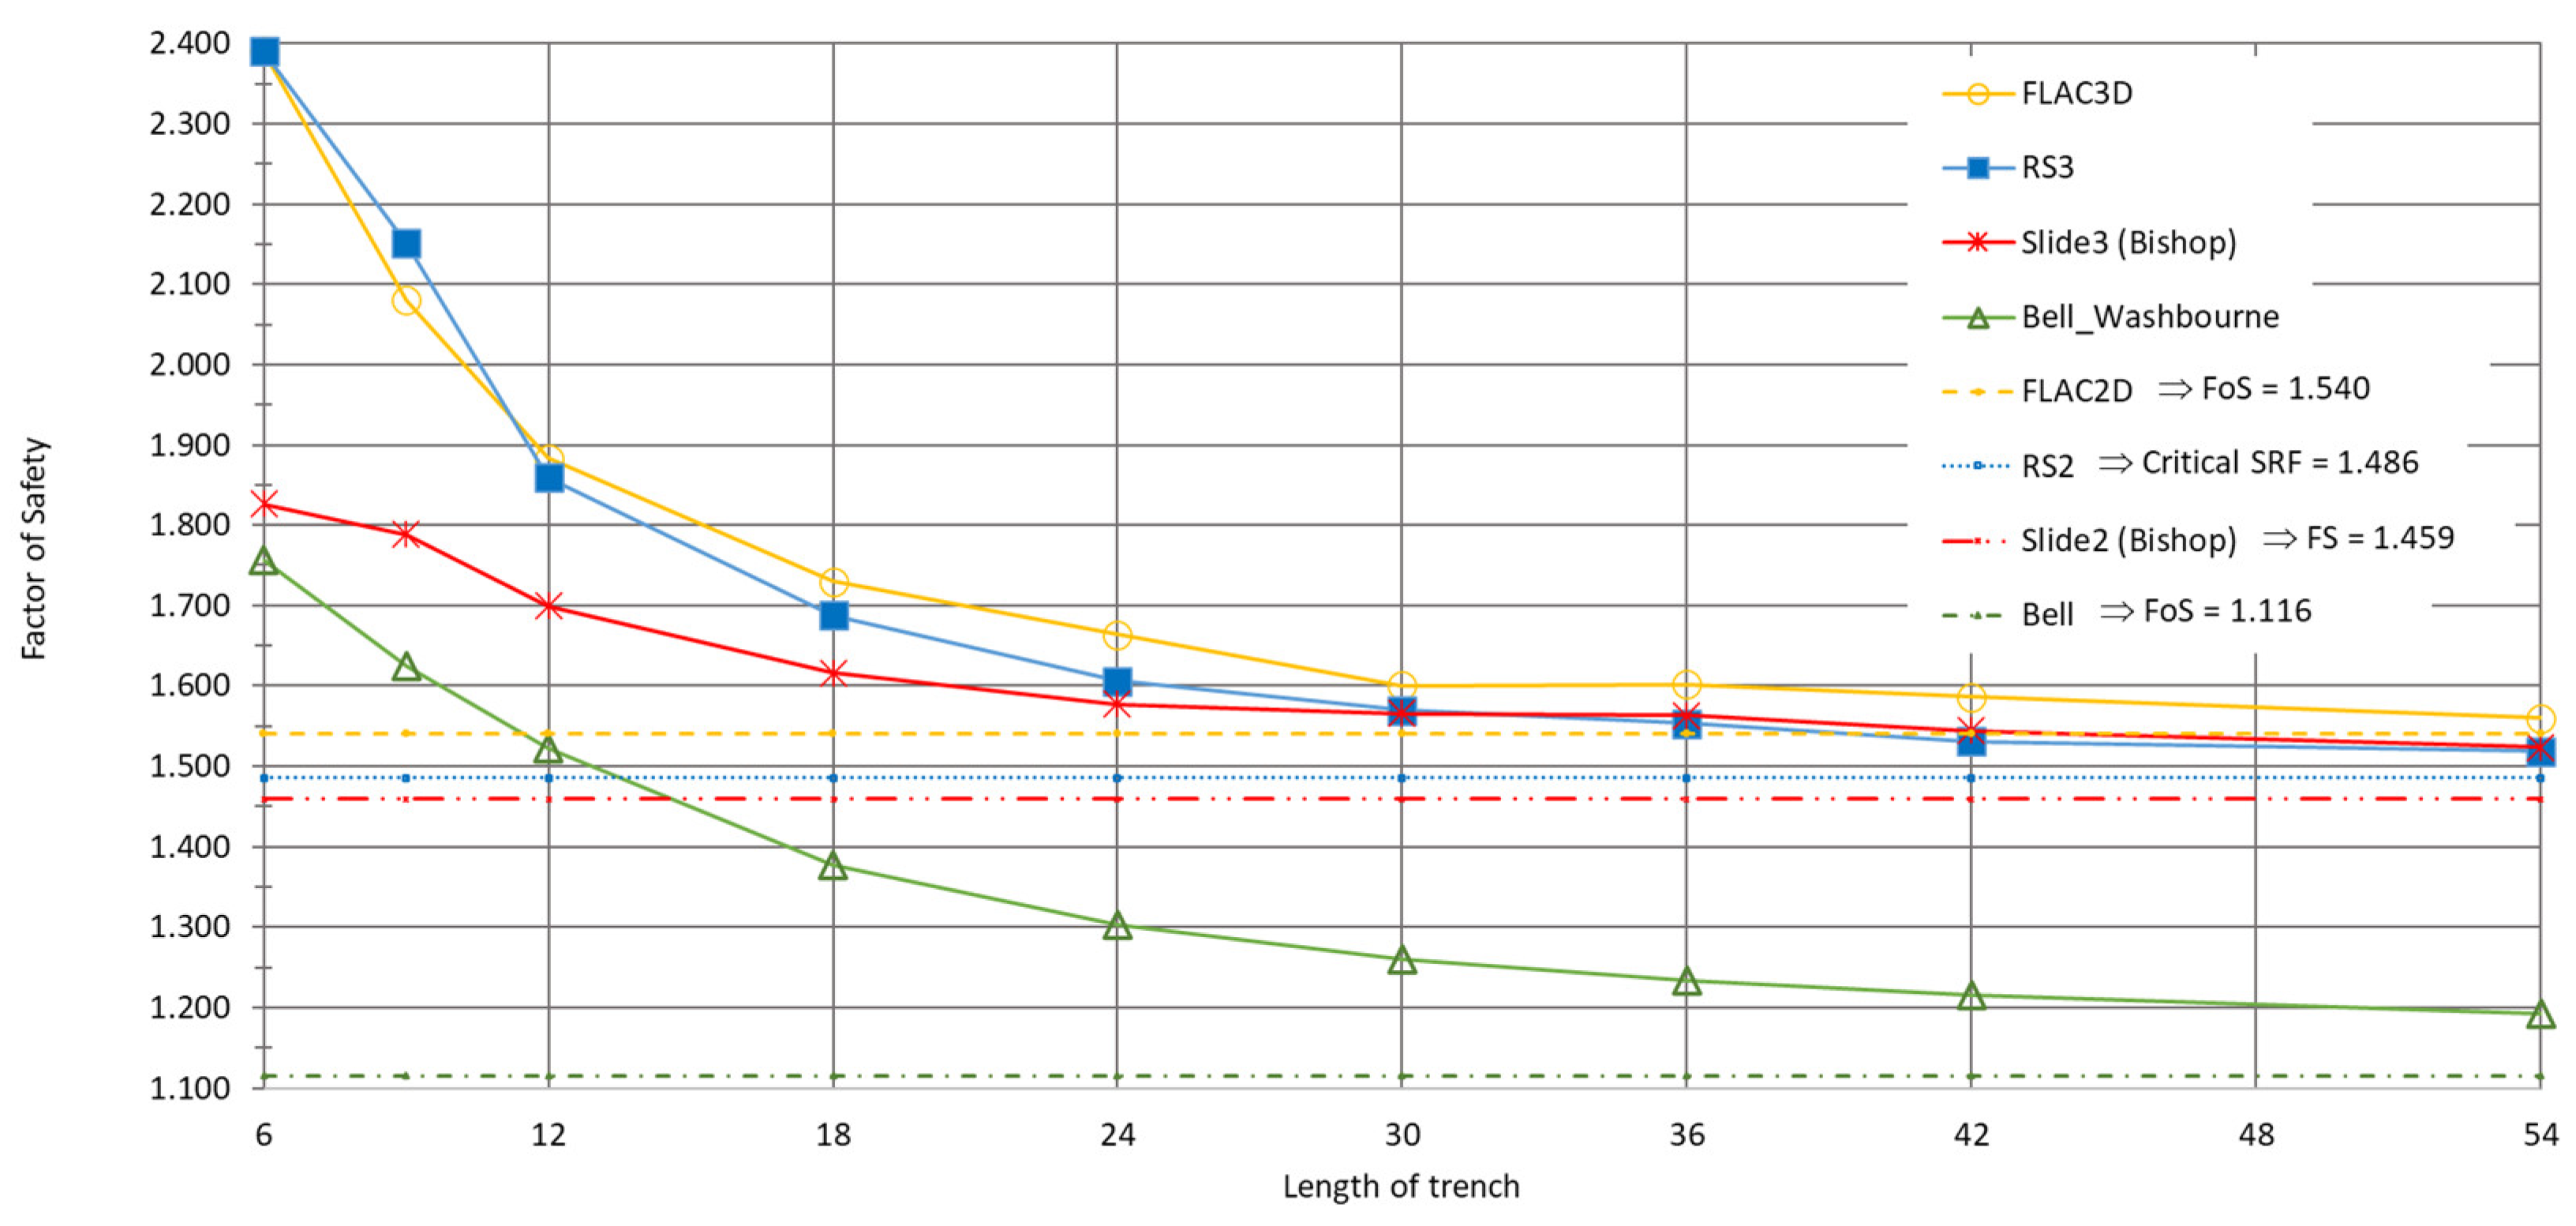
However, as trench length increases, the safety factor gradually decreases until, at a length of 54m, the safety factors for both 3D and 2D are almost equal (
Figure 13,
Figure 14,
Figure 15 and
Figure 16).
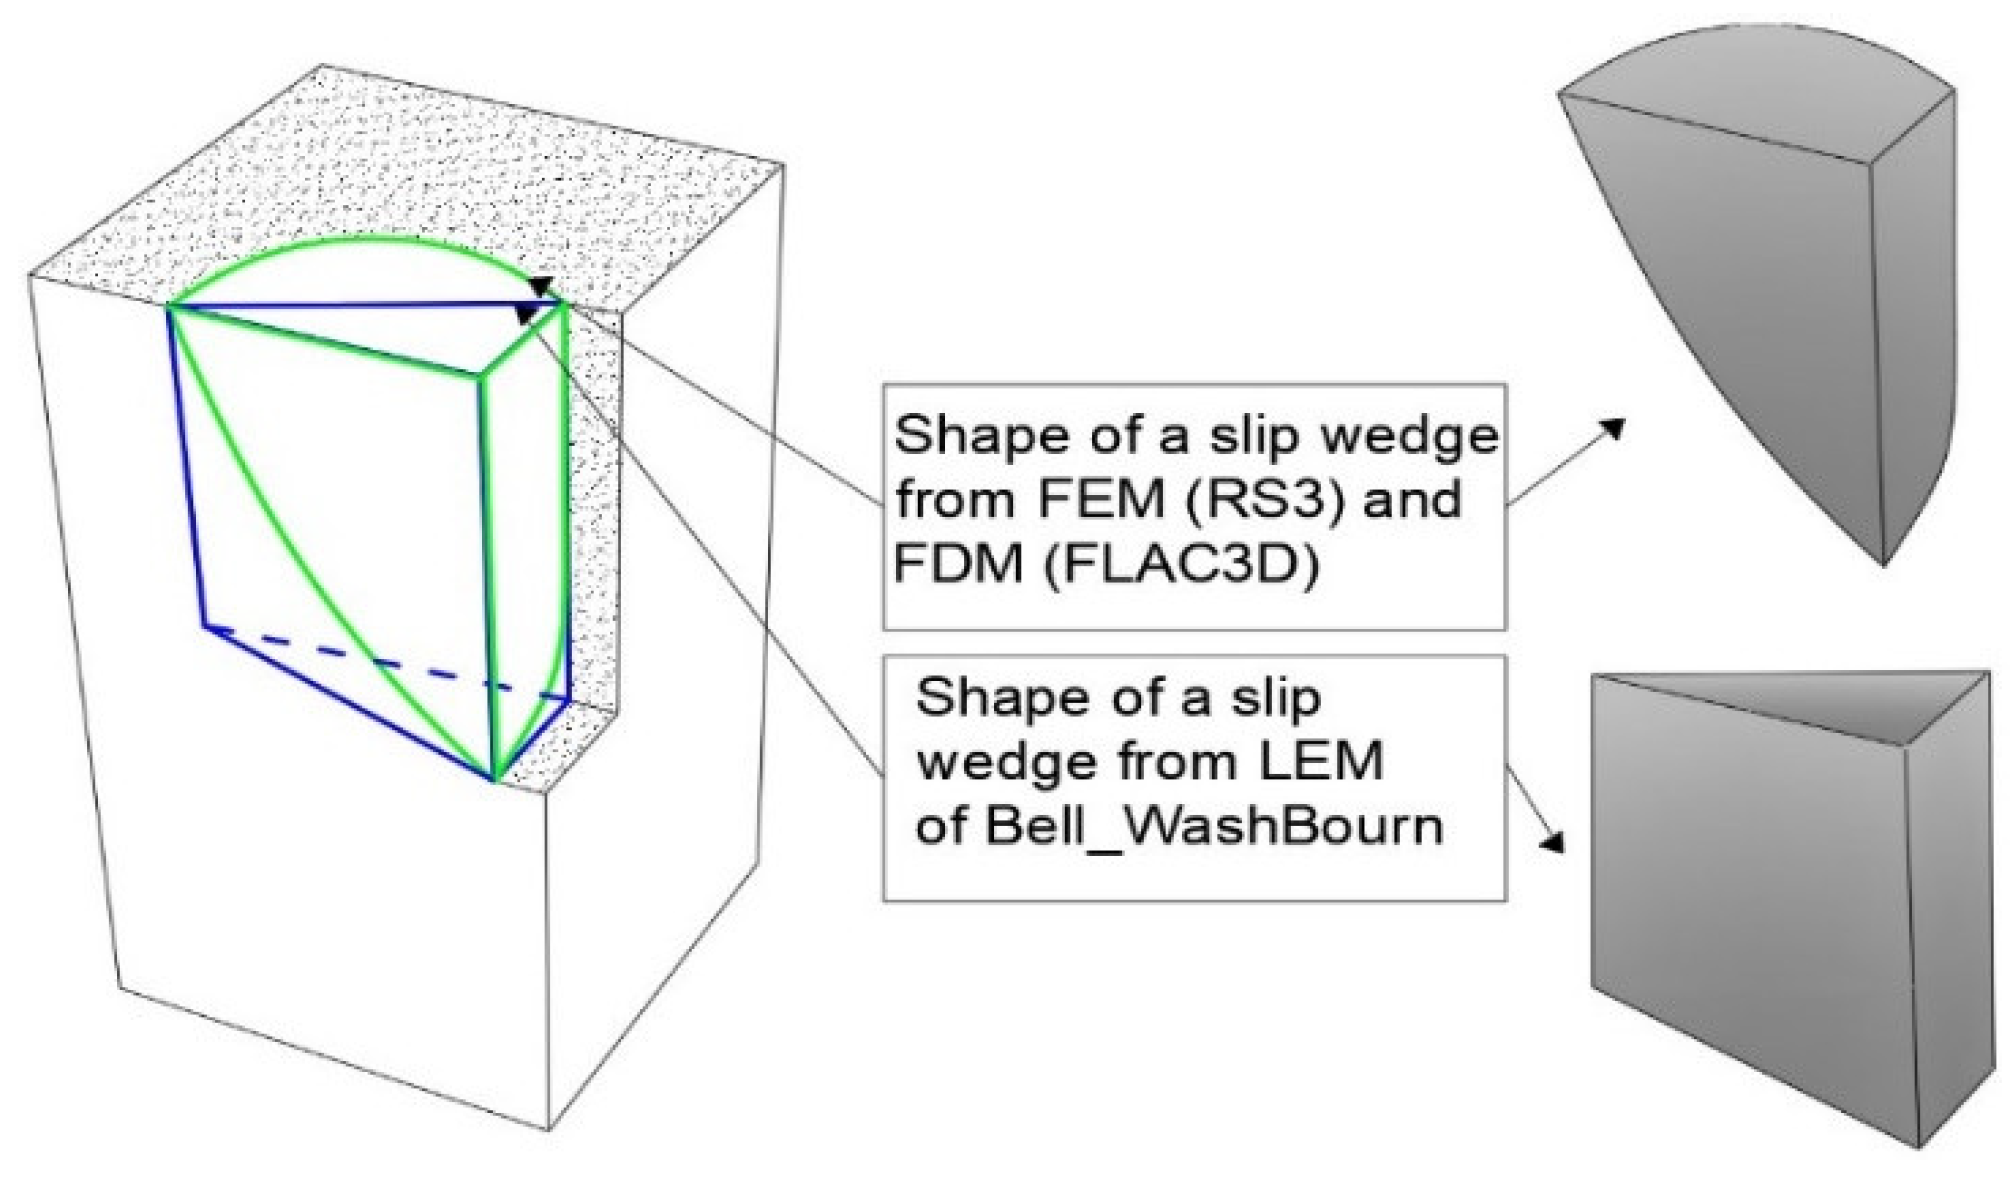
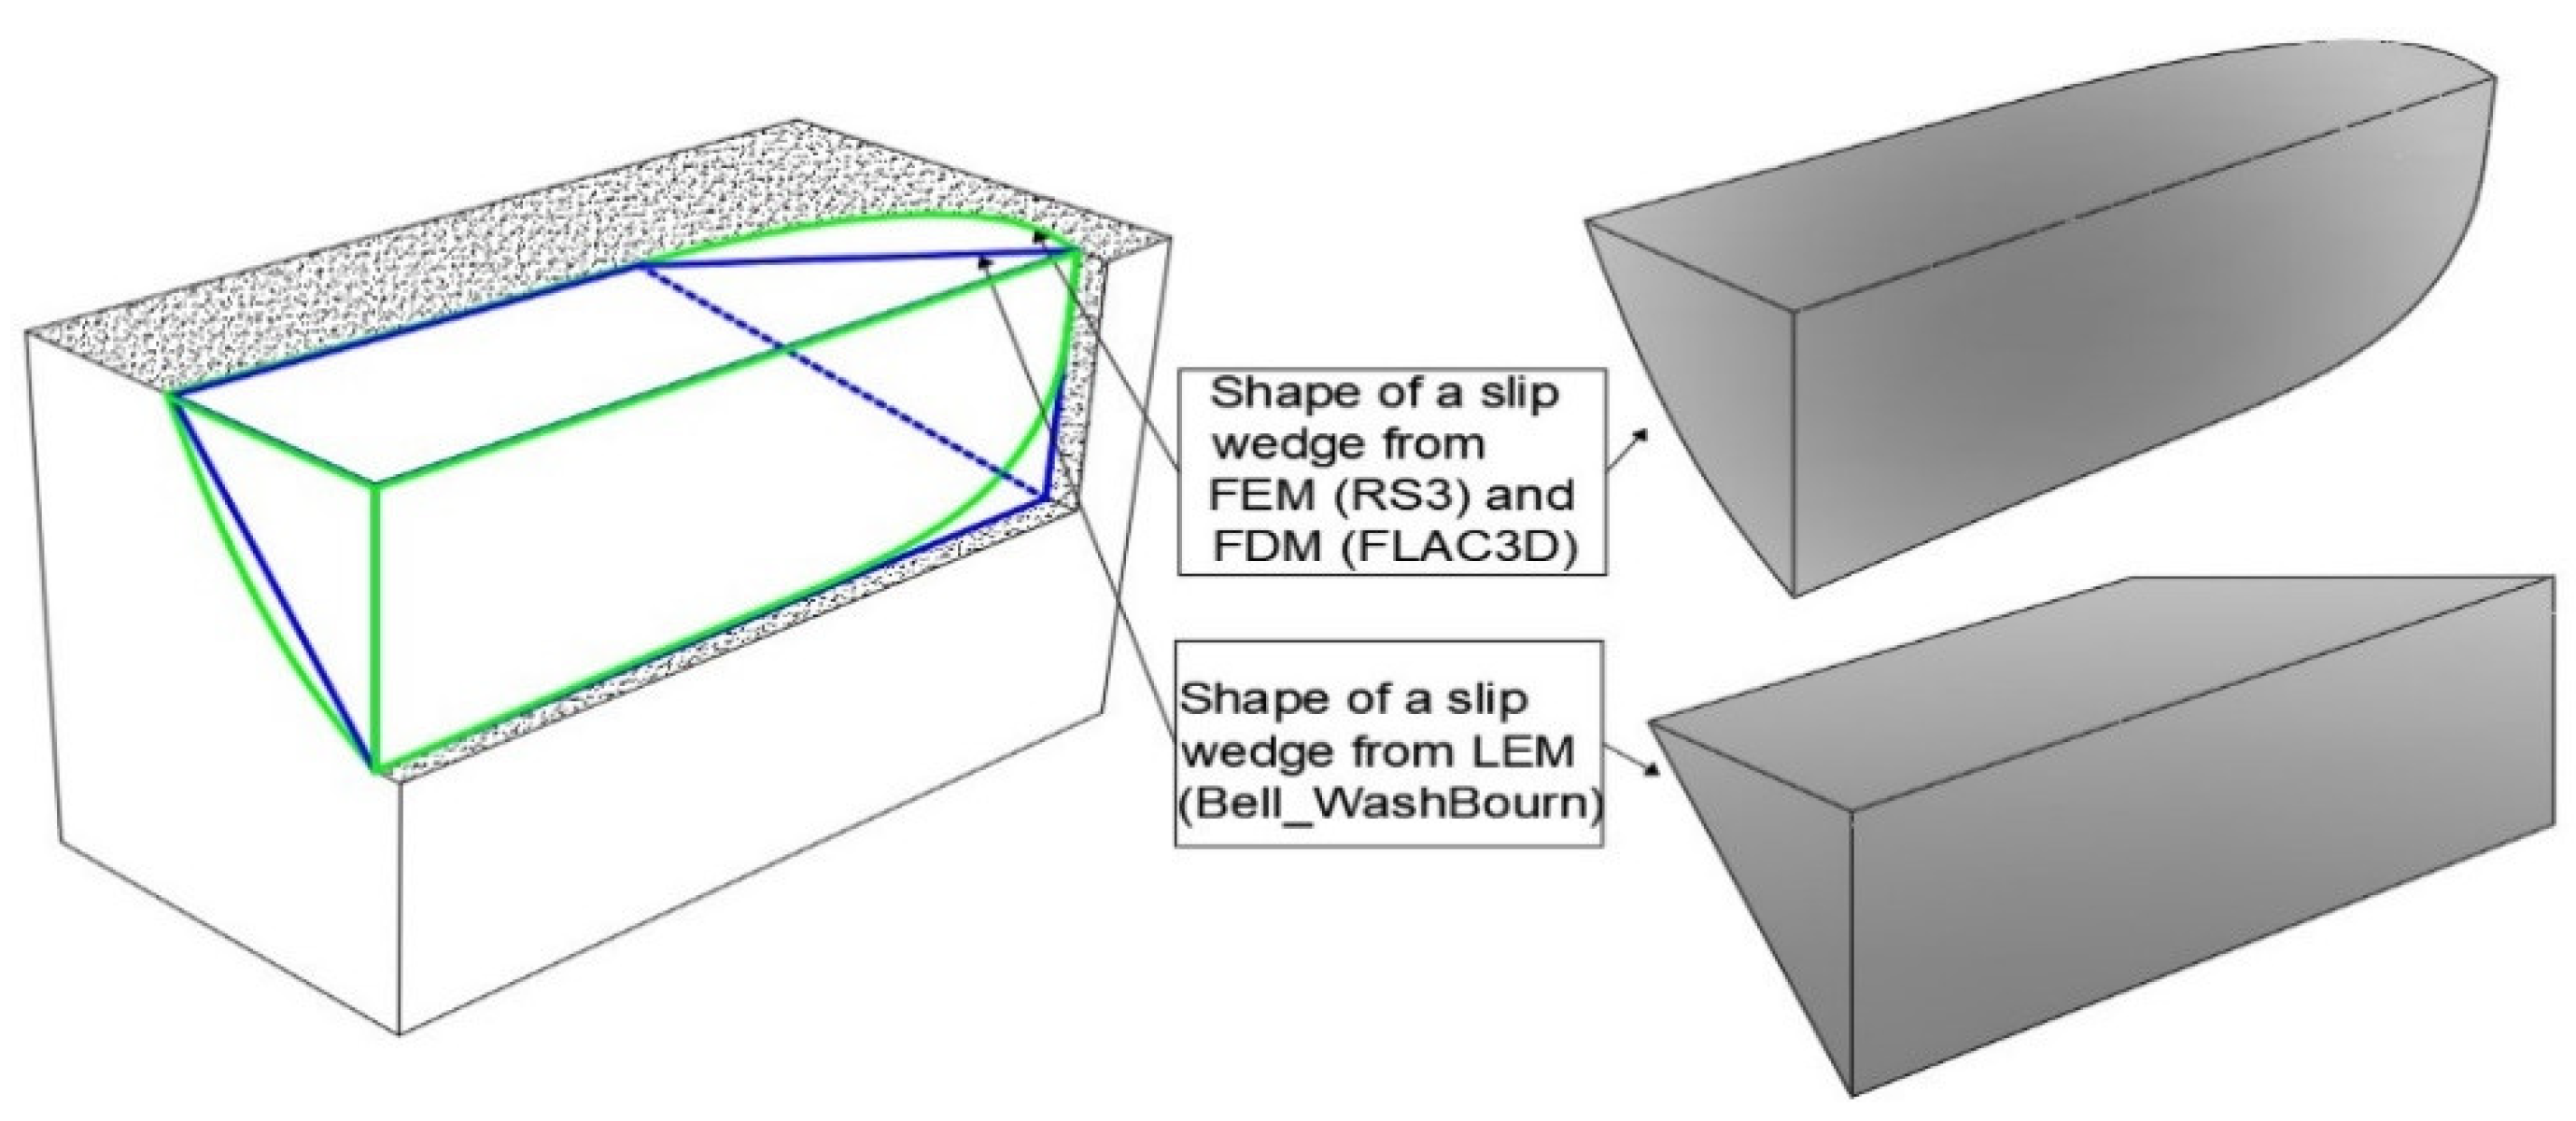
The limit equilibrium method (LEM) of Bell-Washbourne was also applied to calculate the stability, as mentioned in section 2.2. After obtaining the stability results using the Bell-Washbourne method, a comparison was made between the Bell-Washbourne method and the numerical one (FLAC, RS). It was observed that the shape of the slip wedge differs between the Bell-Washbourne method and FLAC3D, RS3, as shown in
Figure 11 and
Figure 12. The differences are most significant near the narrower edge of the trench.
Figure 11.
Shape of a slip wedge for a deep trench (Length < 2Depth).
Figure 11.
Shape of a slip wedge for a deep trench (Length < 2Depth).
Figure 12.
Shape of a slip wedge for a shallow trench (Length > 2Depth).
Figure 12.
Shape of a slip wedge for a shallow trench (Length > 2Depth).
Figure 13.
Variation in FS with trench length using different analysis methods such as FLAC2D, RS2, Bell-Washbourne-2D, RS3, FLAC3D, Slide 3 (Bishop) and Bell-Washbourne-3D for stratum C3 and gs = 10.5 kN/m³.
Figure 13.
Variation in FS with trench length using different analysis methods such as FLAC2D, RS2, Bell-Washbourne-2D, RS3, FLAC3D, Slide 3 (Bishop) and Bell-Washbourne-3D for stratum C3 and gs = 10.5 kN/m³.
Figure 14.
Variation in FS with trench length using different analysis methods such as FLAC2D, RS2, Bell-Washbourne-2D, RS3, FLAC3D, Slide 3 (Bishop) and Bell-Washbourne-3D for stratum C3 and gs = 10.5 kN/m³ and surcharge load 10 kPa.
Figure 14.
Variation in FS with trench length using different analysis methods such as FLAC2D, RS2, Bell-Washbourne-2D, RS3, FLAC3D, Slide 3 (Bishop) and Bell-Washbourne-3D for stratum C3 and gs = 10.5 kN/m³ and surcharge load 10 kPa.
Figure 15.
Variation in FS with trench length using different analysis methods such as FLAC2D, RS2, Bell-Washbourne-2D, RS3, FLAC3D, Slide 3 (Bishop) and Bell-Washbourne-3D for stratum C3 and gs = 12.0 kN/m³.
Figure 15.
Variation in FS with trench length using different analysis methods such as FLAC2D, RS2, Bell-Washbourne-2D, RS3, FLAC3D, Slide 3 (Bishop) and Bell-Washbourne-3D for stratum C3 and gs = 12.0 kN/m³.
Figure 16.
Variation in FS with trench length using different analysis methods such as FLAC2D, RS2, Bell-Washbourne-2D, RS3, FLAC3D, Slide 3 (Bishop) and Bell-Washbourne-3D for stratum C3 and gs = 12.0 kN/m³ and surcharge load 10 kPa.
Figure 16.
Variation in FS with trench length using different analysis methods such as FLAC2D, RS2, Bell-Washbourne-2D, RS3, FLAC3D, Slide 3 (Bishop) and Bell-Washbourne-3D for stratum C3 and gs = 12.0 kN/m³ and surcharge load 10 kPa.
The results obtained using FLAC and RS programs were 1.1 to 1.4 times higher than those calculated using the Bell-Washbourne method (
Figure 13, 14, 15, and 16).
The differences in FS values obtained from 3D analyses are greatest for the trench’s smallest dimensions (lengths). In cases without surcharge load, FS values in 2D and 3D are quite high, around 1.3 and higher (
Figure 16 and 18). For both cases with surcharge load, FS3D > FS2D. The largest differences between FS2D and FS3D, on the order of 0.1, occur for trench lengths up to 18 m, decreasing for higher lengths.
3. Results
The FS values indicate good agreement between RS2 and FLAC2D and RS3 and FLAC3D. However, there are significant differences when comparing these methods with LEM results from the Bell-Washbourne and Bishop methods.
Applying the SSR technique in 3D introduces an appropriate FS value for most cases. The 3D model considers each small element in three dimensions, considering complex geological geometries such as thin layers overlapping, arc-shaped slip surfaces, concave surfaces, etc. This approach is sufficiently realistic in analysis.
In 2D, all analyses only consider two dimensions, whereas in 3D, all three are considered. This means that in 2D, the trench is analysed in width x depth, while in 3D, it is analysed in width x length x depth. This leads to a difference between 2D and 3D. The obtained result in 2D is equivalent to that in 3D for a certain length dimension, specifically corresponding to a trench length of more than 20-30 m (
Figure 13-16).
In the LEM of Bell-Washbourne, a simplified method is utilised. This method assumes the sliding mechanism occurs in straight lines rather than sliding arcs (
Figure 11, 12) for simplicity in stability calculation. This may seem inconsistent with reality since, in reality, the sliding mechanism occurs in the form of a sliding arc.
Although 3D analysis may be an effective method, slurry trench design also requires consideration of flexibility, balancing safety [
23], economy, and construction conditions. This entails excavating trench panels, typically with a maximum length of 6m, corresponding to the length of the wall section. This ensures safe and efficient construction and convenient on-site rotation of materials and machinery equipment. Therefore, a 6m length for slurry trench panels is chosen.
The safety factor of the slurry trench panel length of 6m, determined using numerical methods in 3D (RS3 and FLAC3D), exceeds 1.5 (
Table 1 and
Figure 13-16). This safety factor ensures safety and economic feasibility in the slurry trench design.
With the increase in computer speed, 3D numerical analysis appears to be a relatively straightforward and rapid alternative to classical methods for the design and stability analysis of bentonite slurry trenches.
