1. Introduction
Thanks to the high energy density and specific energy [
1], lithium-ion batteries have gone through a dizzying diffusion in recent years, both in the automotive sector (passing from a market share of 0.2 in 2013 to 13% in 2022 [
2]) and for portable electronic devices (15 billion of mobile phones in the world in 2021 [
3]). Cells are typically assembled in modules, or packs, to achieve the desired battery rating. In modules, cells are connected both in series and in parallel to attain the desired voltage and energy capacity. For instance, many electric cars operate in the range 400-800 volts, while individual cells generally have voltages ranging from 3-4 volts. The proper and safe module operation is ensured by the Battery Management System (BMS), whose effective design calls for an accurate and physically consistent electrical and thermal model of the Li-ion pack [
4]. This applies to several BMS features, such as: State of Charge (
SoC) measurements, State of Health (
SoH) estimation (also in extreme conditions), circuit balancing and thermal runaway detection and suppression to preclude fire hazards.
As regards the last issue, the acceptable operational temperature for Li-ion cells spans from -20 to 60 °C, with optimal performance occurring between 15 °C and 35 °C. Nevertheless, heat generation within a Li-ion battery pack is inevitable due to various losses and entropic effects, resulting in a uneven temperature distribution with gradients among module cells. Uncontrolled heat generation can lead not only to thermal runaway but also to capacity loss and cell instability, so that the temperature differences among cells should be limited to 6 °C to ensure optimal operation and preserve the battery SoH.
Developing a BMS is a complex task that entails creating reduced battery models, estimators, and functionalities to guarantee the battery optimal performance in all operating conditions and throughout its entire lifespan. All of them must operate with limited computational resources on a cost-effective microcontroller. This calls for significant expertise and technical know-how, which may lack in a framework of a rapidly developing technology, a condition particularly evident in the battery industry with emerging chemistries, each presenting its own challenges, requirement and features. To address this, an accurate characterization of the cells is vital.
This paper describes some electrical and thermal experimental characterization procedures conceived for producing with high accuracy all the cell physical parameters needed in a reliable electrical and thermal lumped models. Four commercial 18650 Li-ion cells of different manufacturers have been considered: Molicel® P28A, P28B and P30B and Sony Murata VTC5D. The following parameters have been obtained: the cell capacity at different temperatures and discharge currents (C-rates), the Open Circuit Voltage (OCV) at varying State of Charge (SoC), the entropic coefficient and electrical and thermal lumped parameters.
This work is part of a collaborative research between three groups within the Department of Industrial Engineering (DII) of the University of Padua (Padova, Italy): Electrochemical Energy Storage and Conversion Lab (EESCOLab), Modelling, Analysis and Research in Turbomachinery and Energy Systems (MARTES), RaceUp Formula SAE Students Team, togheter with the company FIAMM Energy Technology S.p.A. The target of this work is to analyse different lithium-ion cells in order to implement them in a prototype Formula SAE hybrid racing car. Formula SAE is a student design competition program organized by SAE International (previously known as the Society of Automotive Engineers). Few articles in the literature report accurate descriptions of measurement techniques, experimental results and their use in suitably validated models. For the sake of comparison, different techniques published in the literature are also detailed. The obtained models demonstrated to successfully predict the battery voltage at a 8 RMS error lower than 20 mV and the temperature to a RMS error equal to 0.5 °C. The authors hope that this this manuscript can be useful for the development of standardized characterization techniques of such cells, while also providing experimental data and validated models that researchers and BMS designers can utilize across various applications.
Section 2 describes the reduced-order modeling of 18650 cells, both thermal and electrical.
Section 3 describes the methods for the electrical and thermal characterization of the four type of cells. The former concern the determination of the cell capacity at different C-rate currents and temperatures, the dependence of the OCV with the
SoC, the impulsive current charge/discharge tests to identified the Equivalent Circuit Model (ECM) parameters and the determination of the entropic contribution. The thermal characterization deals with the methods for determining the main thermal parameters involved in thermal modeling, i.e. the cell thermal capacity, the conduction thermal resistance between cell bulk and surface and the convection thermal resistance between the cell surface and environment. In
Section 4 the validation of the battery models for four different load profiles is presented, demonstrating their good accuracy. The significance of this work is finally outlined in the conclusion in
Section 5.
2. Reduced-Order Coupled Modeling of 18650 Cells
Several approaches are presented in the literature to develop reduced-order models capable of predicting the battery voltage and temperature for short dynamic current cycle [
5,
6], spanning from electrochemical-based to circuit-based types, as well as empirical and data-driven models for voltage prediction coupled with thermal models. Due to ease of characterization and implementation in Simulink [
7], an Electrical Circuit Model (ECM) approach was chosen to model the cell electrical behaviour, coupled with an array-based thermal circuit model simulating the battery temperatures.
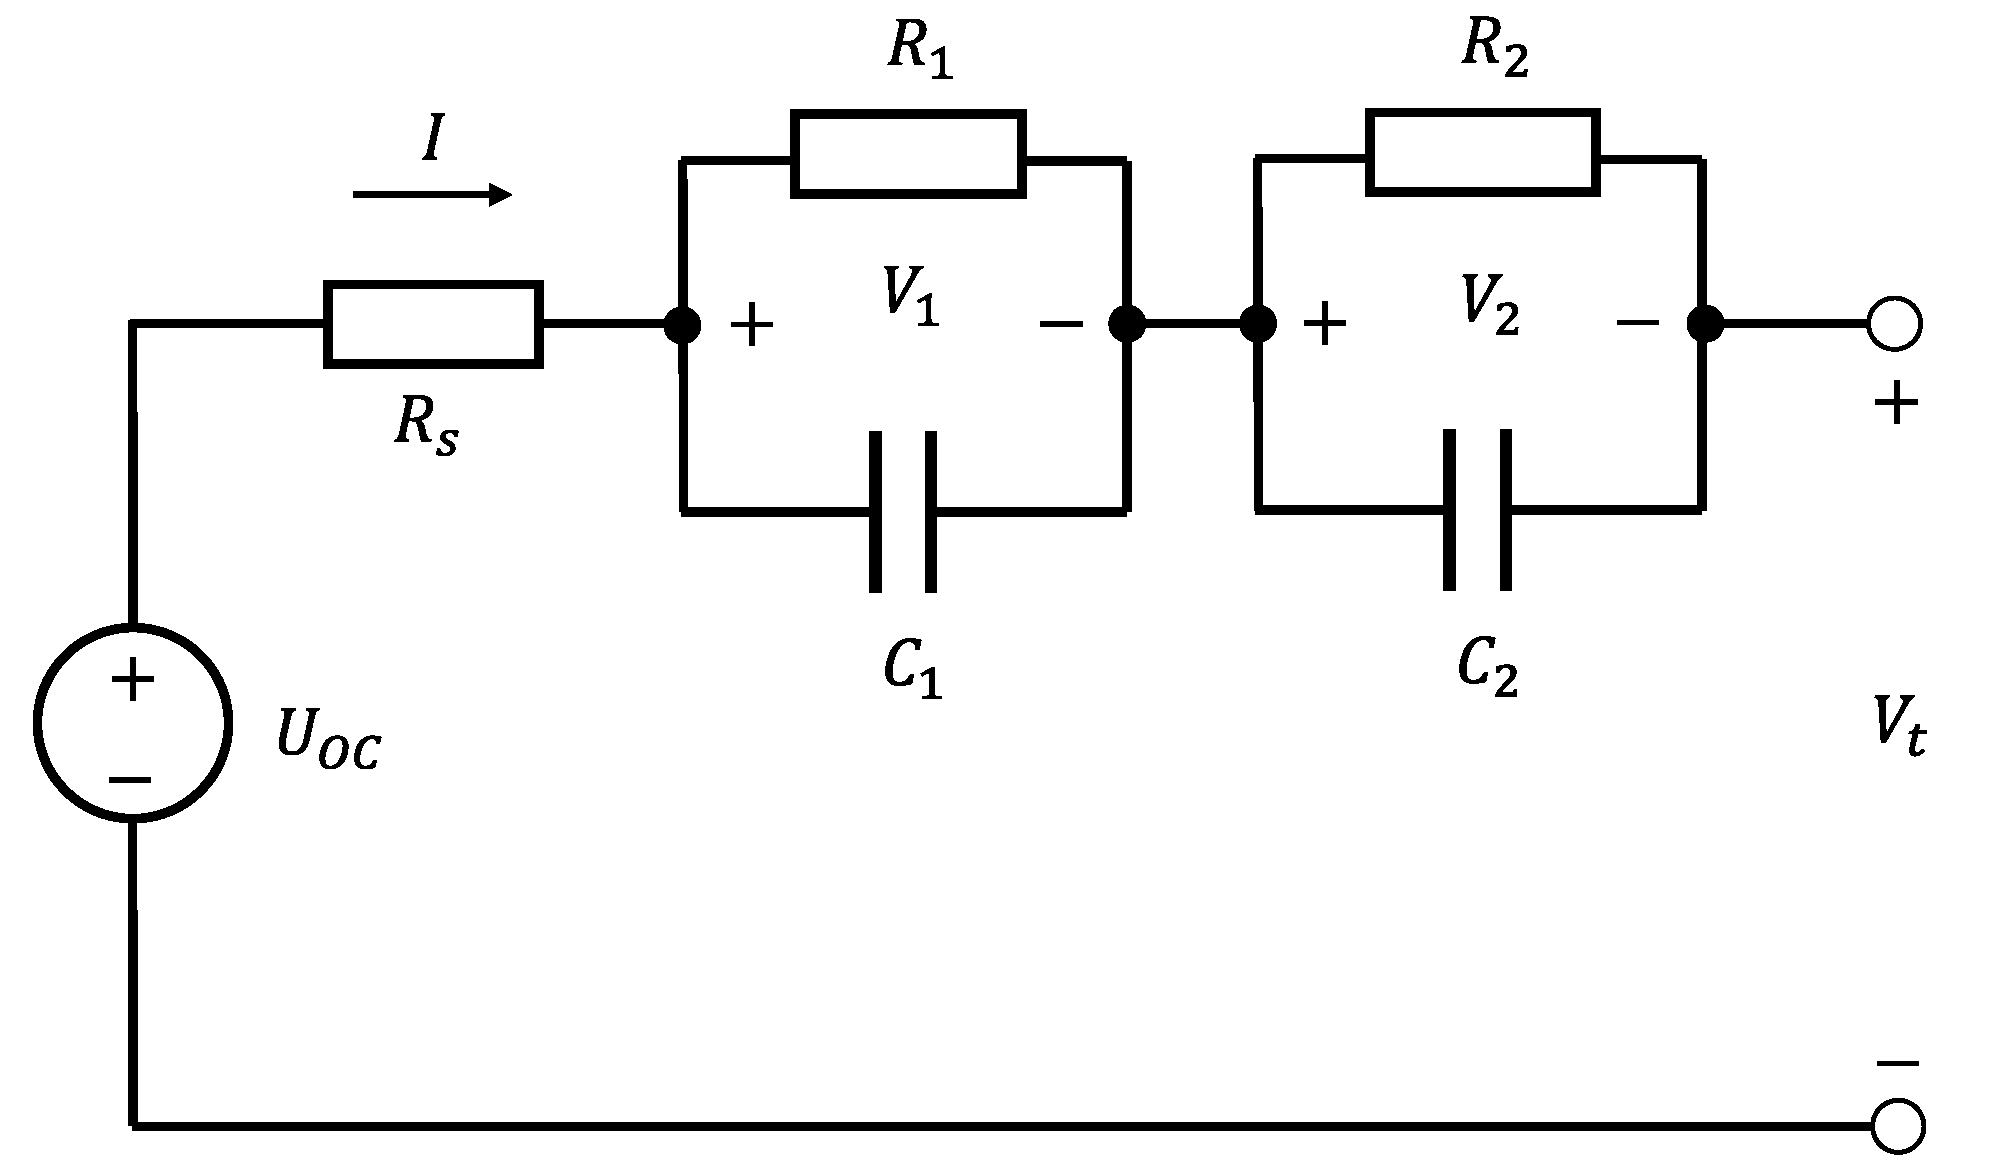
The ECM, represented in
Figure 1, consists of a voltage source
giving the cell OCV, a resistor
and the series of two
loops, each consisting of a resistor
and a capacitor
. Similar models using only resistors and capacitors as passive elements are largely presented in the literature ([
8,
9,
10]). To account for the effects of the physical conditions on the cell performance, the ECM elements were assumed to be driven as follows:
is driven by the
SoC, while
,
and
are driven by the
SoC, operating temperature and current sign. Consistently with the targeted model accuracy, minor dependencies such as current magnitude and aging, were neglected [
10,
11].
The electrical model is coupled with the thermal model through the heat generation equation [
12]:
where
[
] is the battery average temperature and
/
[
/
] is the entropic coefficient, i.e. the temperature derivative of the OCV, that depends on the
SoC [
13].
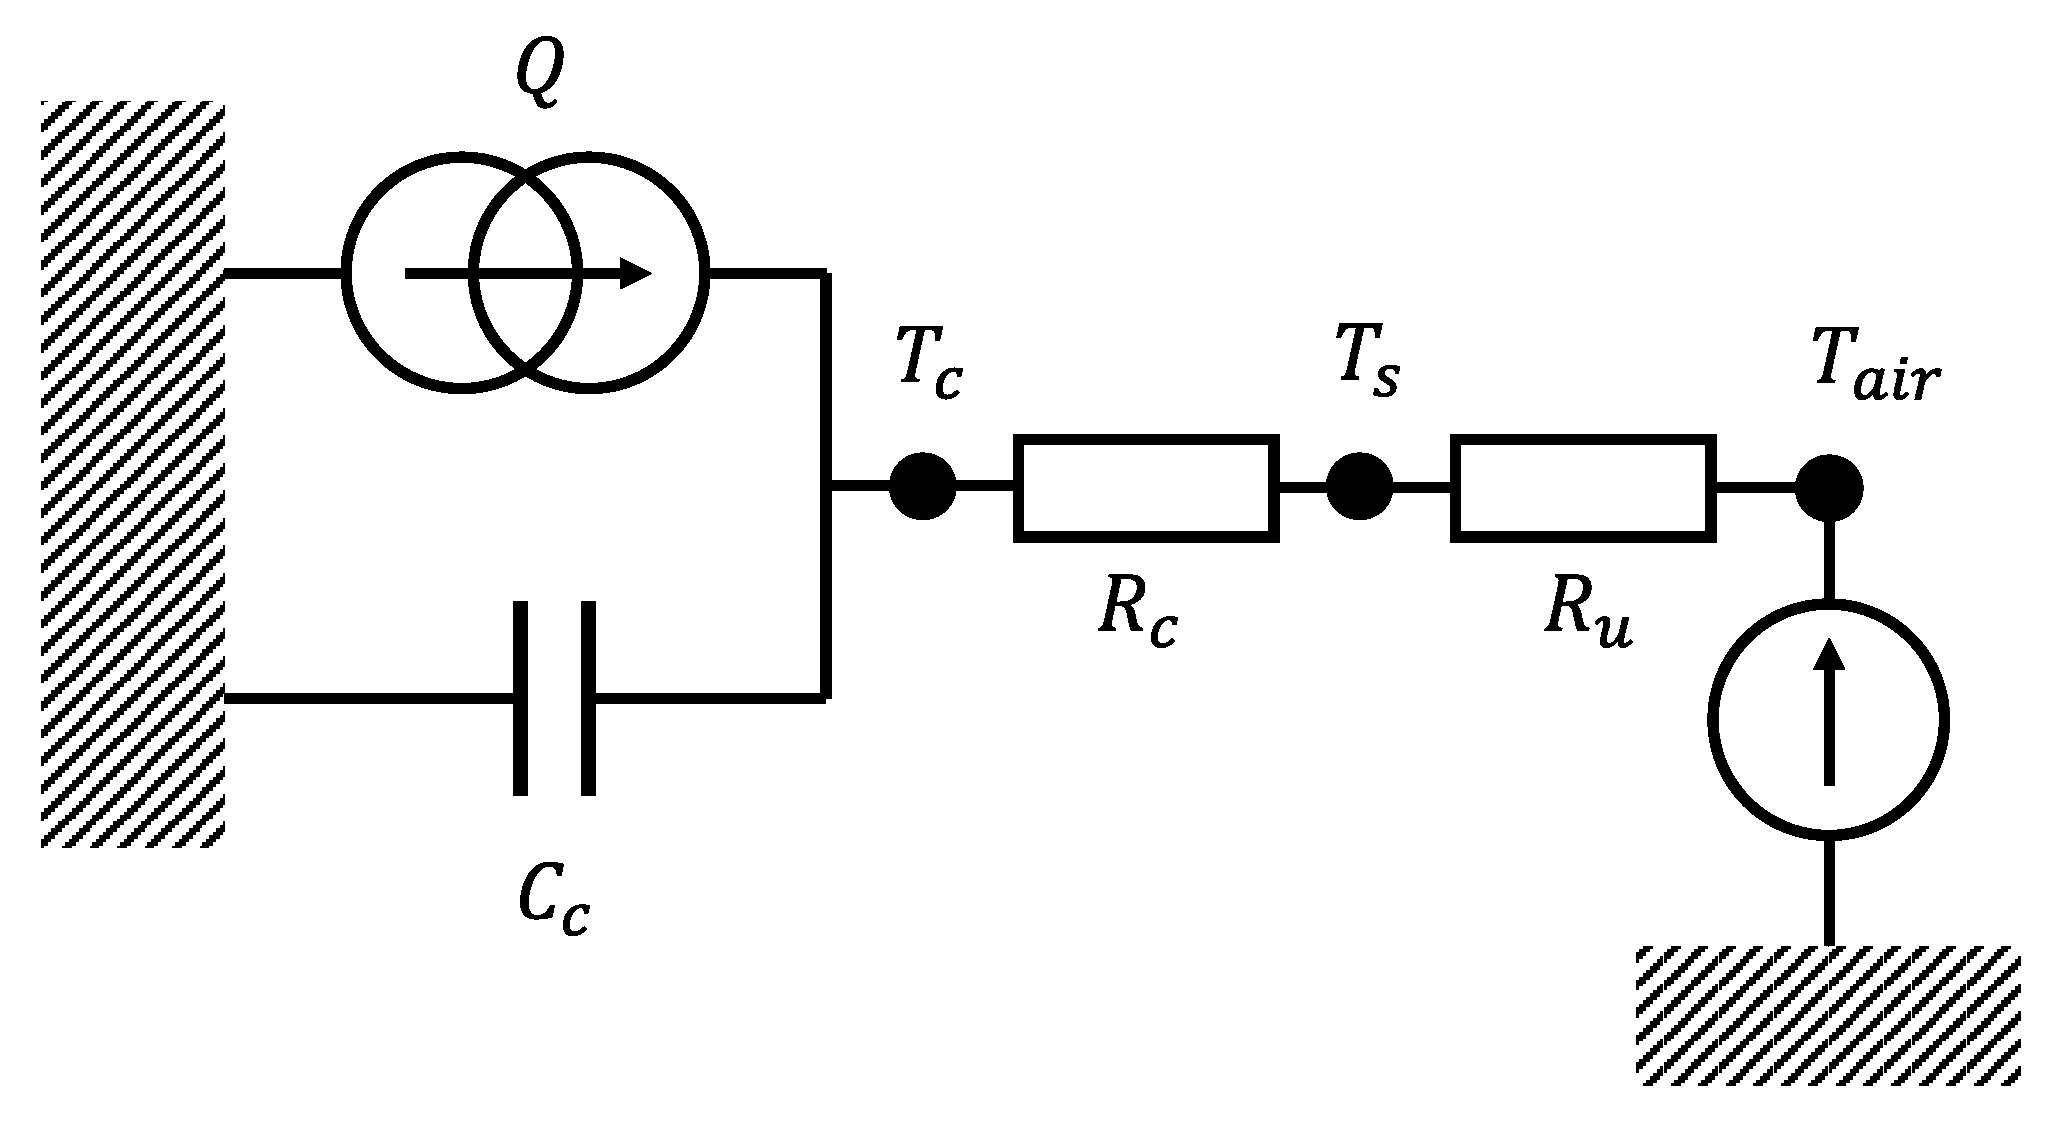
The lumped thermal model is shown in
Figure 2. As commonly done in literature [
12,
14], the battery surface temperature was assumed homogeneous and the battery thermal behaviour perfectly axis-symmetric, so that heat exchanges at the top and bottom cell caps were neglected. The room temperature was assumed homogeneous and constant. The battery casing thermal capacity was neglected, because it was considered orders of magnitude smaller than the cell one [
15].
The equations of the thermal model are reported in Equation
2:
where
is the cell bulk temperature,
is the cell surface temperature,
is the cell thermal capacity,
is the conduction thermal resistance between cell bulk and surface and
is the convection thermal resistance between the cell surface and the room, while
Q is the heat rate, generated by the cell losses.
3. Testing and Characterization
3.1. Materials and Experimental Set-Up
Four commericial 18650 Li-ion cells of different manufacturers underwent the testing procedure: Molicel
® P28A, P28B and P30B and Sony Murata VTC5D (
Figure 3.) In
Table 1, the cells characteristics and performance are reported as from the manufacturers data-sheet.
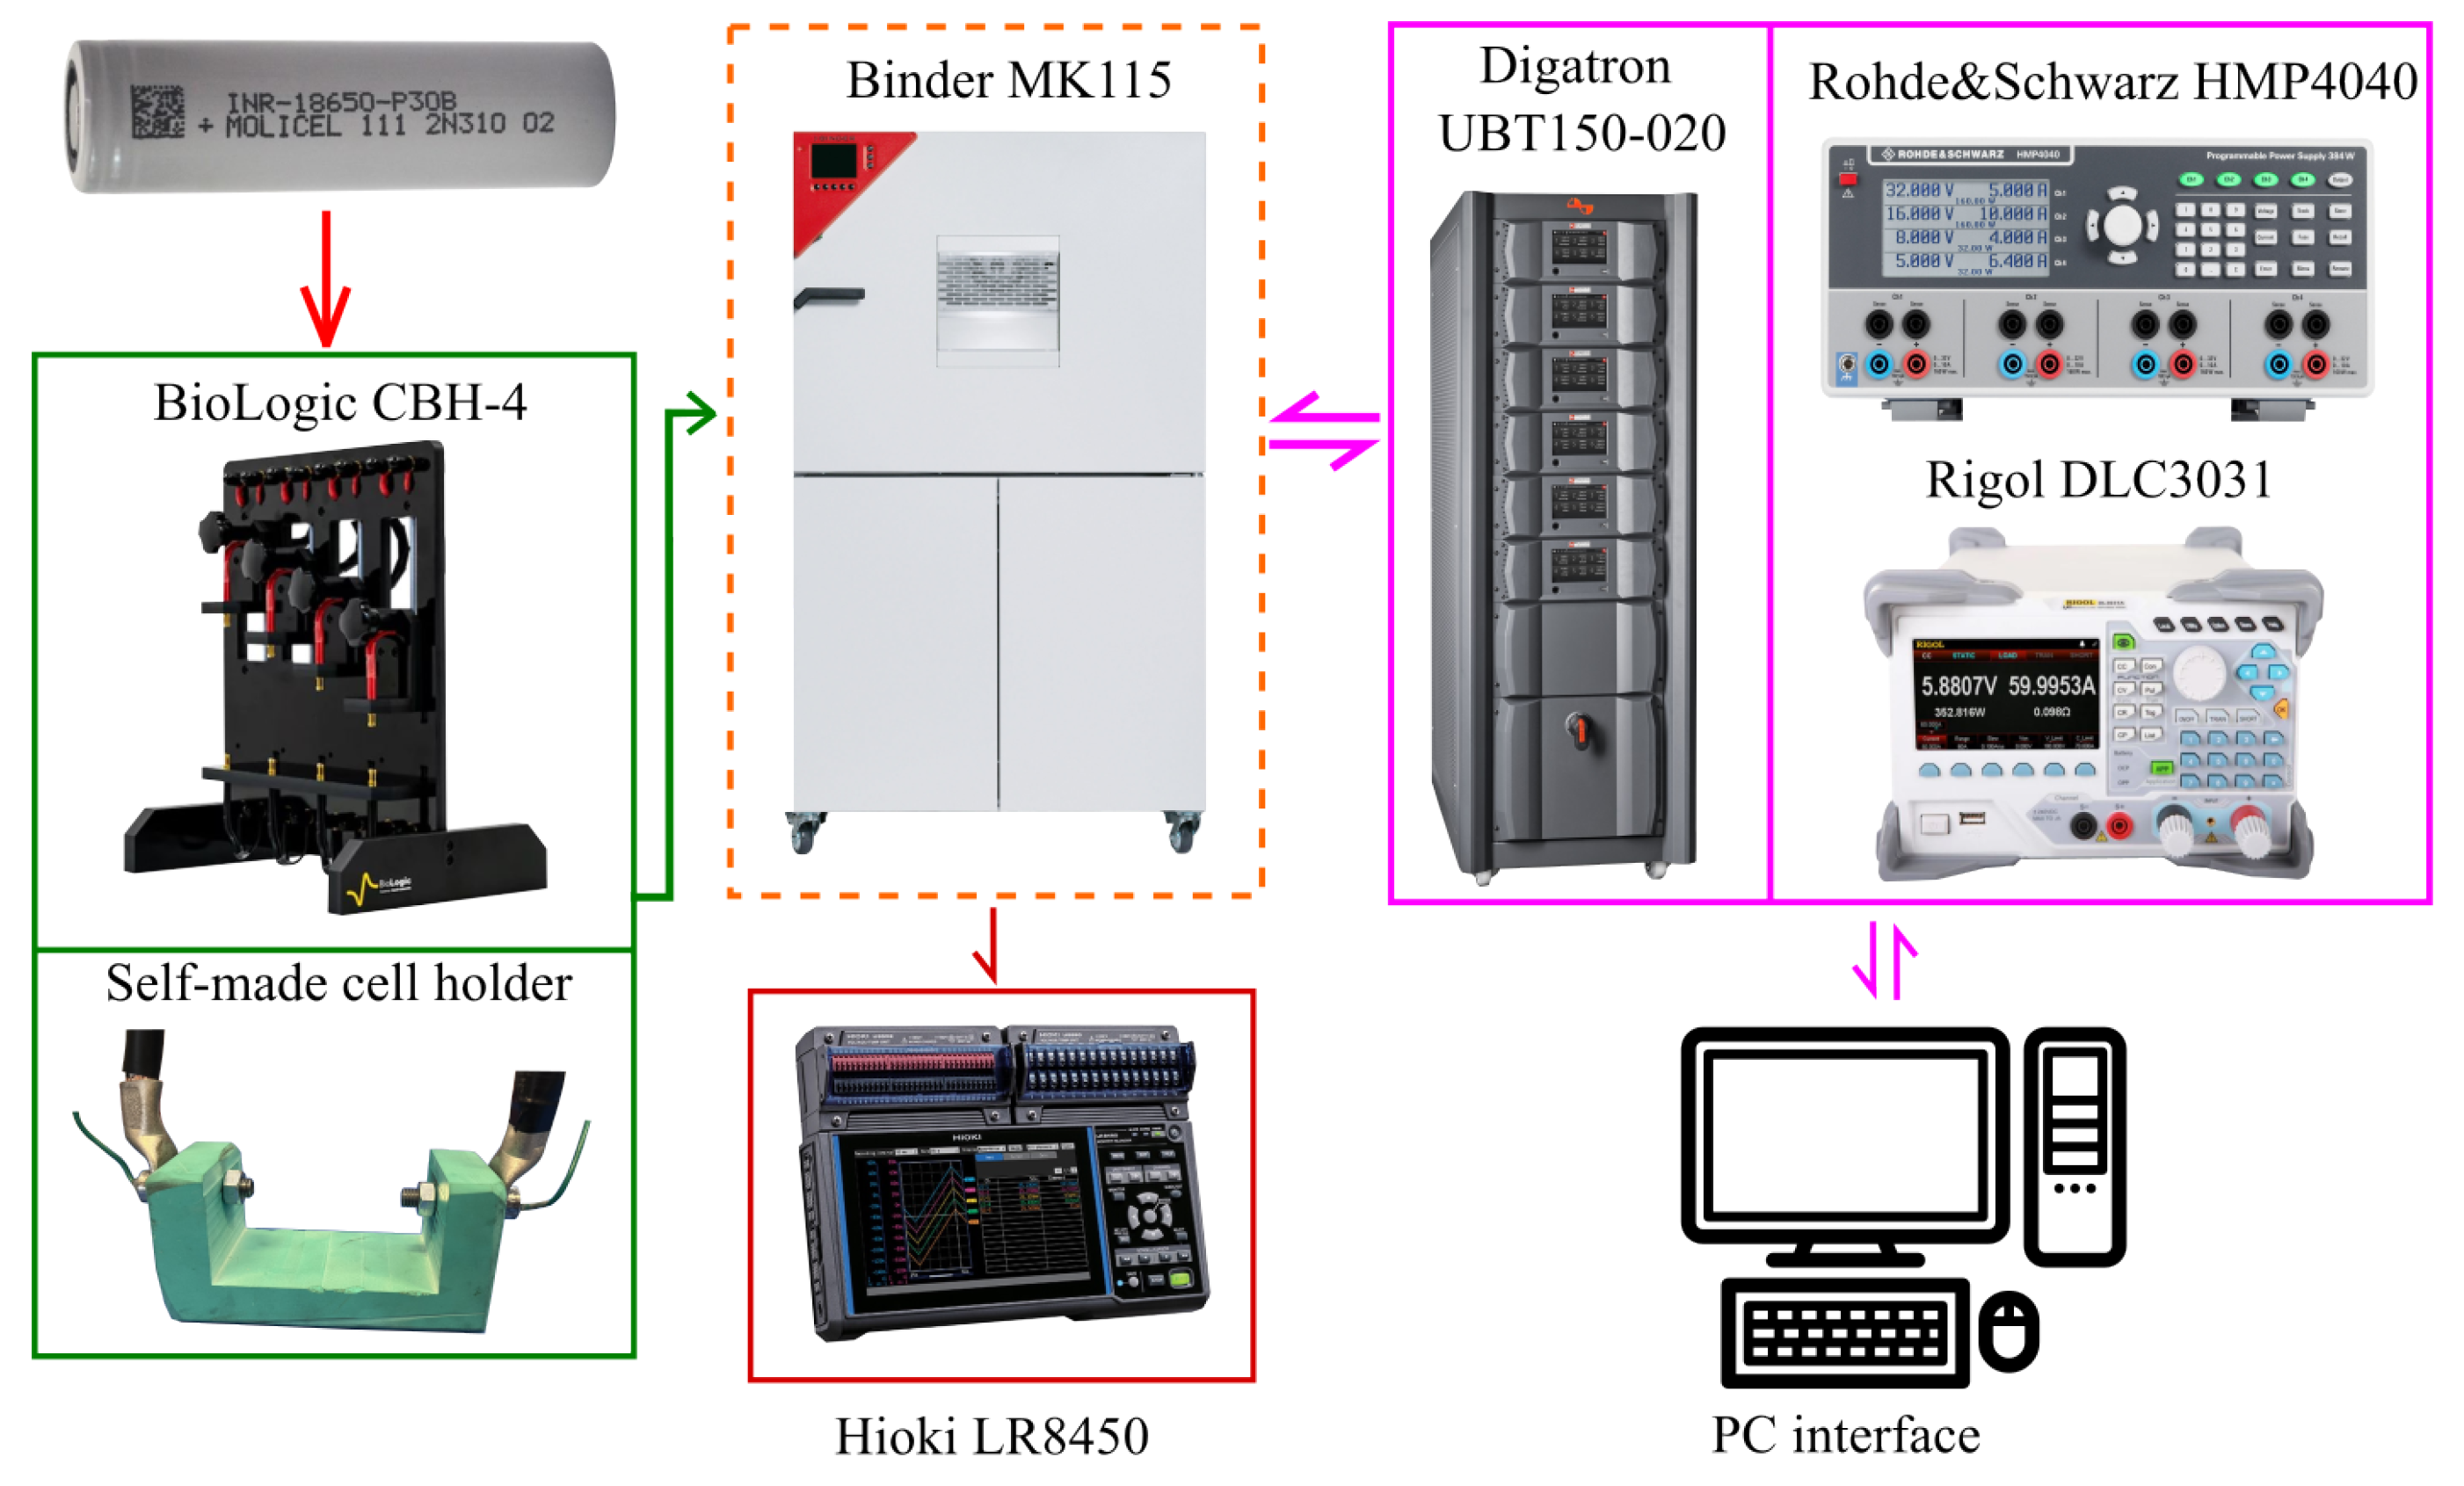
The tests were mostly conducted in the laboratories of FIAMM Energy Technology using the following major equipment:
Thermal chamber Binder Mk115, to maintain constant operating temperature in each experiment and to allow testing at different temperatures.
Four-terminal sensing cell holder: a BioLogic CBH-4 was used for electrical tests,.
In-house polymeric cell holder for thermal tests.
Thermocouples array, to detect the battery surface temperature and the room temperature in side the thermal chamber, connected to a Hioki LR8450 data logger.
Cell cycler, consisting of a Rohde&Schwarz® HMP4040 charger and a) a Rigol DLC3031 load, to measure the entropic contribution and the pseudo- experiment, and b) a Digatron Systems UBT150-020 for other tests.
The experimental set-up was controlled by a PC and data were post-processed in MatLab and Simulink environments.
Figure 4 shows a scheme of the experimental set-up.
3.2. Electrical Characterization Tests
3.2.1. Capacity Determination
The battery capacity at the Beginning of Life (BoL) is an important Key Performance Indicator (KPI) for applications where the long cycle life is not a driving design parameters, as in the case of the target application of this work, i.e. a FSAE racing car [
16,
17,
18].
In order to evaluate the dependence of cell capacity on the temperature and discharge current, as in [
19,
20,
21,
22], the following testing procedure was implemented:
Fully charge the cell to with a) 1 C Constant Current (CC) till the voltage reaches the upper cut-off ( ) and b) Constant Voltage (CV) till the current reduces to the rate C/20, at reference temperature = 25 °C.
Put the thermal chamber at the temperature and wait 1 h to allow cell temperature and voltage relaxation.
Discharge the cell at CC with a rate till the voltage reduces to the lower cut-off voltage .
Bring the thermal chamber to the reference temperature and wait 1 h to allow cell temperature and voltage relaxation.
Repeat step 1-4 five times.
The testing procedure was run at
= 5 °C, 25 °C, and 40 °C and at discharge currents with C-rate
=
C, 1 C, 3 C, and 5 C. The cell charge capacity [mAh] for each test was computed as the time integral of the current during the CC discharge. To quantify the spread of performance among different cells of the same type [
23], three samples for each model were tested and each of them underwent five discharges. The capacity of the cell model was then obtained as the average of such 15 tests. In addition, the standard deviations of these tests are are shown in
Table 2.
3.2.2. OCV Measurements
Determining the dependence of
on
SoC is crucial to accurately predict the battery voltage
. The main experimental techniques for a priori OCV vs
SoC measurements are the "pseudo-
test", also referred to as "low current continuous OCV measurement", and the "intermittent current pulse test" [
24,
25]. Measurement data can be collected in look-up table or used to fit mathematical functions [
26]. In the present work, the OCV vs
SoC curve was obtained applying the pseudo-
test for all the cells, conisting in the following procedure:
Fully charge the cell to with a) 1 C Constant Current (CC) till the voltage reaches the upper cut-off ( ) and b) a Constant Voltage (CV) till the current reduce to a rate C/20, at reference temperature = 25 °C.
Relax the cell voltage for 1 h.
Discharge the cell with CC at a rate C/20 till the voltage reduces to the lower cut-off .
Charge the cell with CC at a rate C/20 till the voltage reaches the upper cut-off .
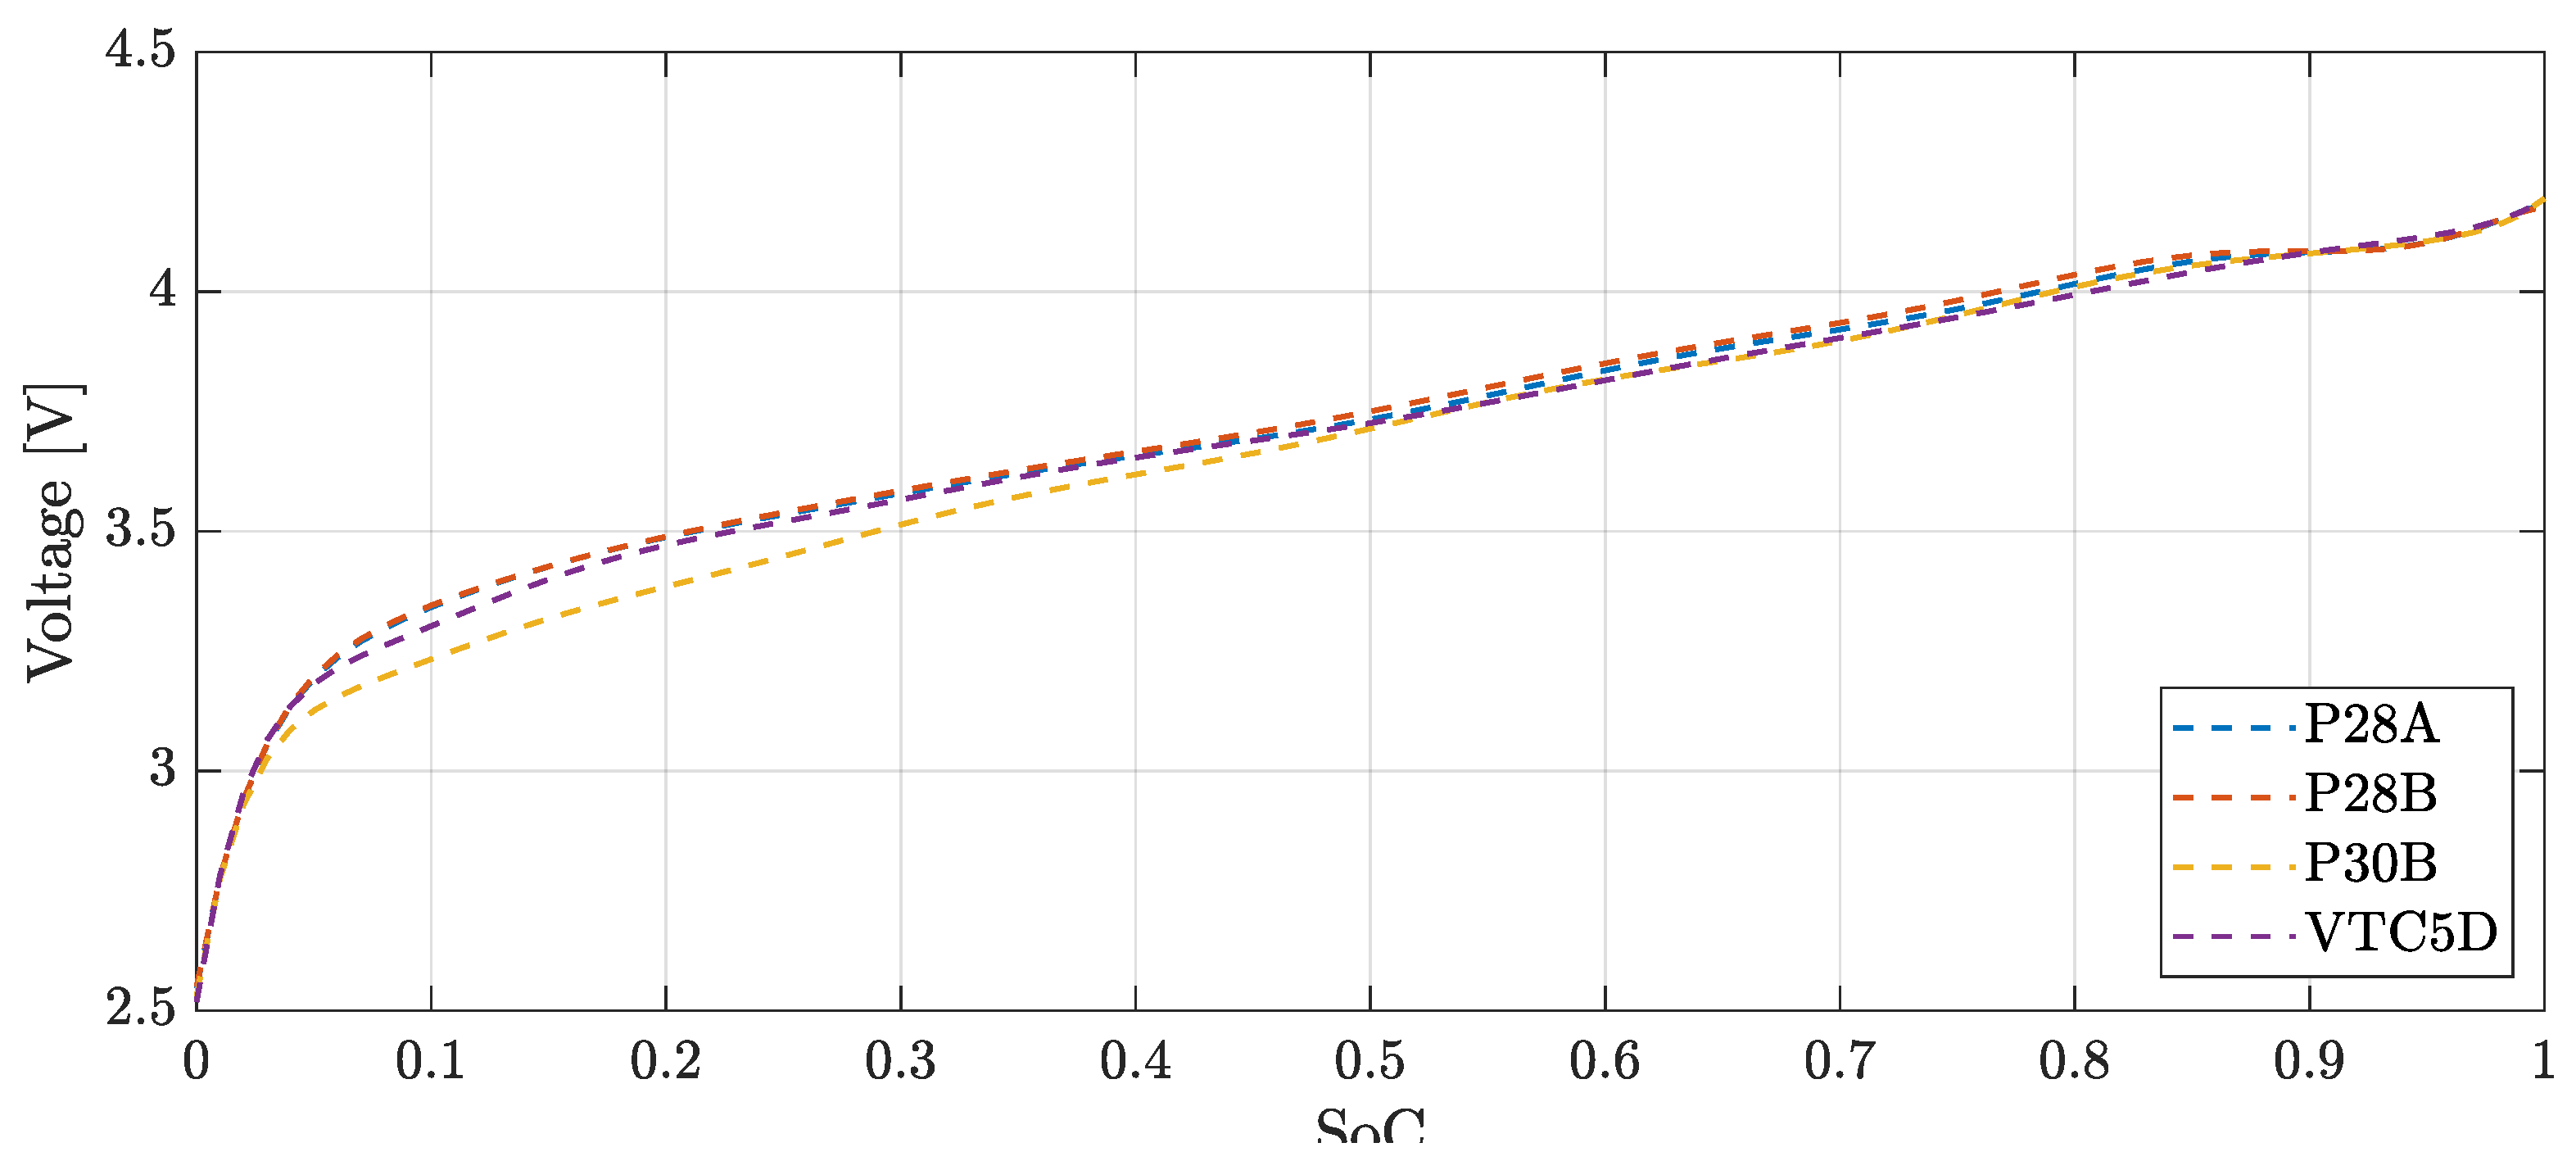
The cell OCV curve was obtained as the average between voltages in charge and discharge (
Figure 5).
This is a simple and reliable method, which has proven to be successful in the present application. Future developments may involve the use of more complex post-processing data algorithms, aimed at identifying voltage hysteresis in OCV measurements [
27], correcting partial relaxations effects during pulse tests [
28], or implementing filtering techniques (
e.g., Kalman filters) as in [
29].
3.2.3. GITT characterization tests
Impulsive current charge/discharge tests are commonly presented in literature to determine the ECM parameters of lithium-ion batteries [
10,
12,
30]. Such impulsive test take different names, e.g. Galvanostatic Intermittent Titration Technique (GITT) test. Considering the ECM decribed above, the test was oriented to identify the circuit parameters in charge and discharge at different operating temperatures. The testing procedure used for GITT characterization was as follows:
Fully charge the cell () with a) 1 C Constant Current (CC) till the voltage reacheas the upper cut-off ( ) and b) Constant Voltage (CV) till the current reduced to a rate C/20, at reference temperature = 25 °C.
Relaxe the cell voltage for 1 h.
Impose a discharge 2 C current impulse lasting for , then relax the battery voltage for 1 h.
Repeat 3 till the voltage reachers the lower cut-off , then relax the battery voltage for 1 h.
Repeat 3 with charge current impulse till the voltages reachers the upper cut-off .
Repeat the impulsive test at 5 and 40 °C.
The duration of the load impulse varied between 180 when , and 72 otherwise.
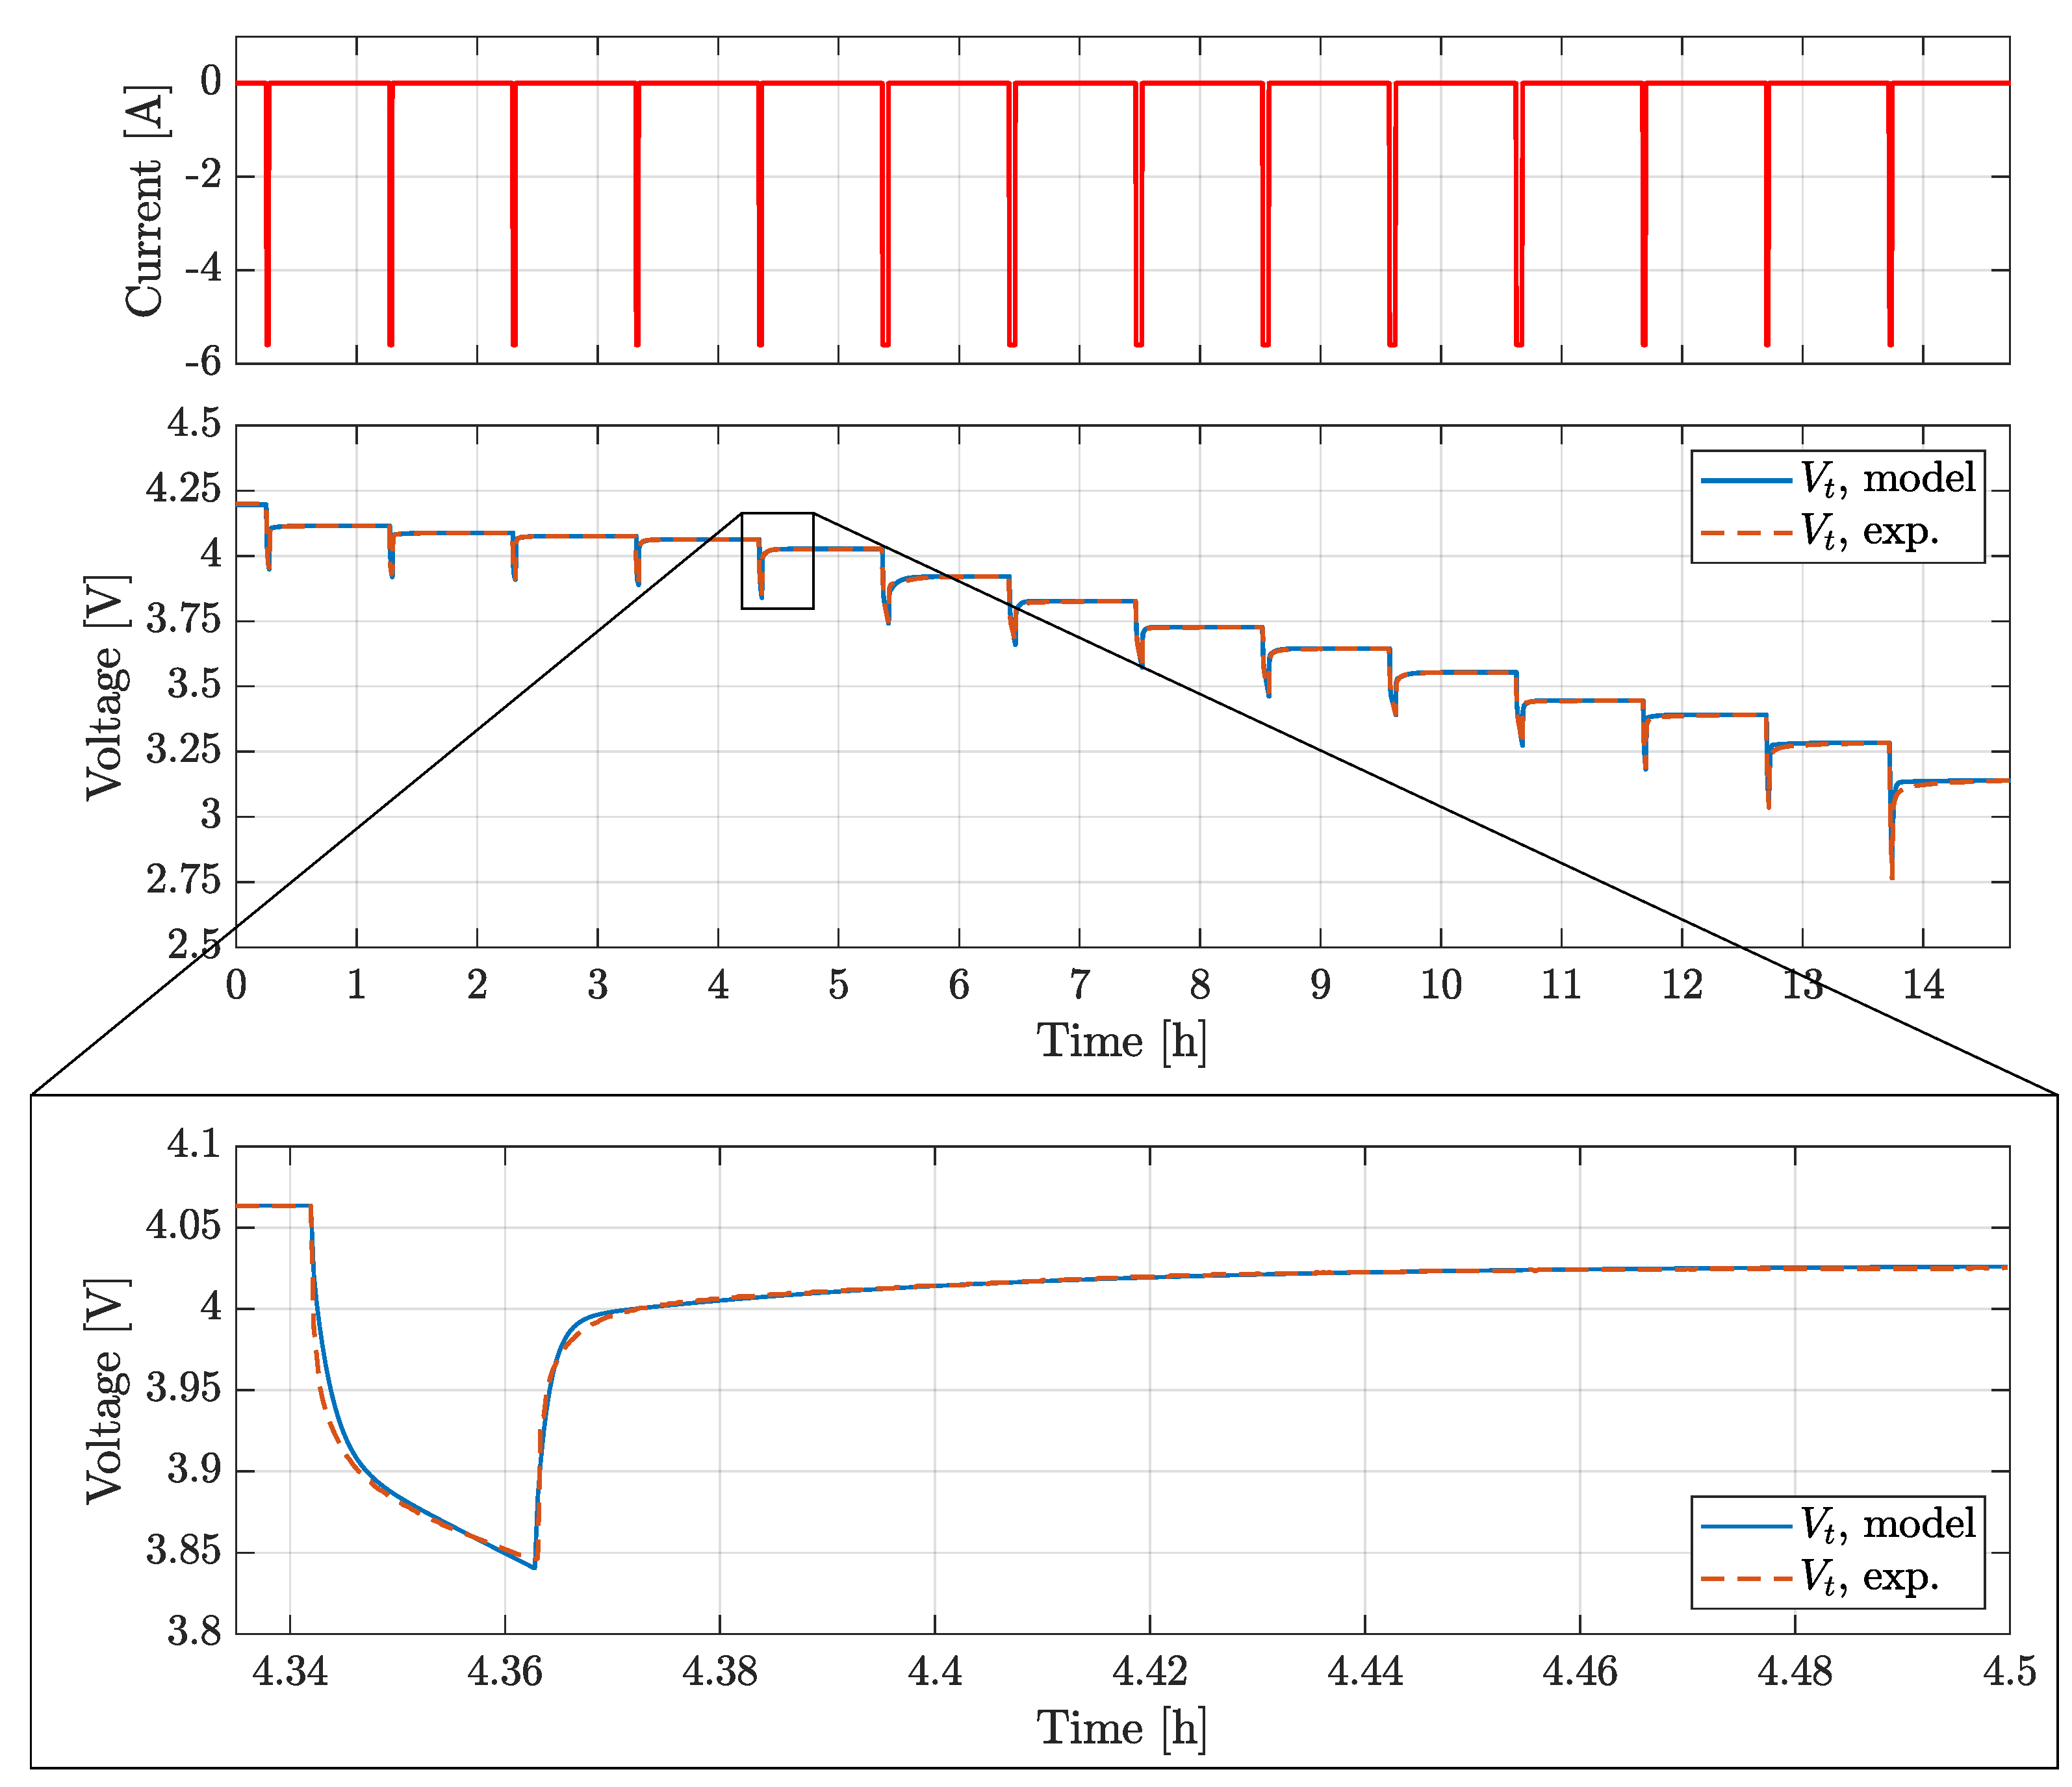
Data-post processing consisted in an optimization procedure, with the goal of minimizing the error between the cell voltage measured during experiments and that computed with ECM-based simulations. The output of the GITT characterization was a set of look-up tables defined for different temperatures and SoCs, in charge and discharge. The optimization problem was developed in the Matlab Optimization Toolbox making use of the
lsqnonlin solver. A finite difference approximation approach was used to implement ECM behaviour. The differentiation time step corresponded to the sampling frequency of cell voltage during experiments. To reduce the computational cost, instead of performing a single optimization through the entire GITT test, independent optimizations were run for each GITT cycle (pulse and relaxation), corresponding to given
SoC, temperature, and current sign. The output parameters calculated for a given cycle were then used as guess values for the subsequent one, which resulted in a layered approach [
8].
Figure 6 shows the experimental and modelled GITT test voltages , while the ECM parameters tables for the four tested cell models are reported in Appendix.
3.3. Entropic Contribution Measurement
Entropic contribution of lithium-ion cells is traditionally determined from potentiometric and calorimetric measurements [
31]. The former consists in measuring the cell OCV at different temperatures and
SoCs [
32]. A thermal cycle needs to be applied after complete relaxation of the cell voltage. In addition, at each temperature of the cycle the thermal equilibrium condition requires some time to be reached and the larger the thermal capacity of the cell, the larger the system thermal time constant [
33]. Instead, the calorimetric method is based on the cell heat flux measurement during charge/discharge operations: the entropic contribution is determined after separating the irreversible and the reversible heat contributions in the overall measured heat flux [
33]. This method can be considered superior to the potentiometric one, allowing for a quasi-continuous measurement of the cell entropic profile. On the other hand, it presents some disadvantages: many cell electrical parameters [
34,
35] have to be previously determined and advanced cell-specific experimental equipment is needed, as an isothermal or accelerating-rate calorimeters.
To overcome the limitations of the potentiometric and calorimetric methods, a novel
determination technique via Electrothermal Impedance Spectroscopy (ETIS) has been developed by Schmidt
et al. in [
36]: a thermal transfer function is obtained to relate the surface temperature to the heat flux, then the reversible heat flux is split from the irreversible term by Fourier analysis. Such technique, used also by Geng
et al. in [
33], presents some drawbacks regarding the precise determination of a thermal transfer function and the spectroscopy data analysis [
31].
Recently, different improved approaches have been proposed to reduce the testing time required by the potentiometric method, mainly in the form of correction of the voltage baseline drift, as in [
37] and [
31]. Furthermore, in [
38] Lin
et al. proposed an improved potentiometric method based on current Positive Adjustment Method (PAM). In the present work, the Common Potentiometric Method (CPM) was modified to reach the desired
SoC, i.e. after a long charge (or discharge) phase an opposite current was applied for a short time. Such PAM was expected to accelerate the depolarization and reduce the voltage relaxation time (from 10 - 20 h of the CPM to
min of the PAM). The approach was validated by comparing the measured entropy profile of 18650 lithium ion cylindrical cells with those obtained from CPM: results showed good agreement between the two, thus confirming the advantage of saving test time.
A similar approach to the PAM was used in this paper. Considering that all cells are based on similar NMC chemistry and have similar forms, sizes and capacities, only the P30B model was tested. The testing procedure consisted of:
Fully charge the cell to at the reference temperature = 25 °C.
Relax the cell voltage for 20 h.
Apply a controlled thermal cycle ( 1 h at 20 °C, 1 h at 10 °C, 1 h at 30 °C, 1 h at 40 °C, 1 h at 25 °C).
Discharge the cell for at 1 C rate and then charge at C rate for .
Relax the cell voltage for 1 h.
Repeat step 3-5 till the voltage reaches the lower cut-off .
The value of
varied in order to collect more data points at high and at low
.
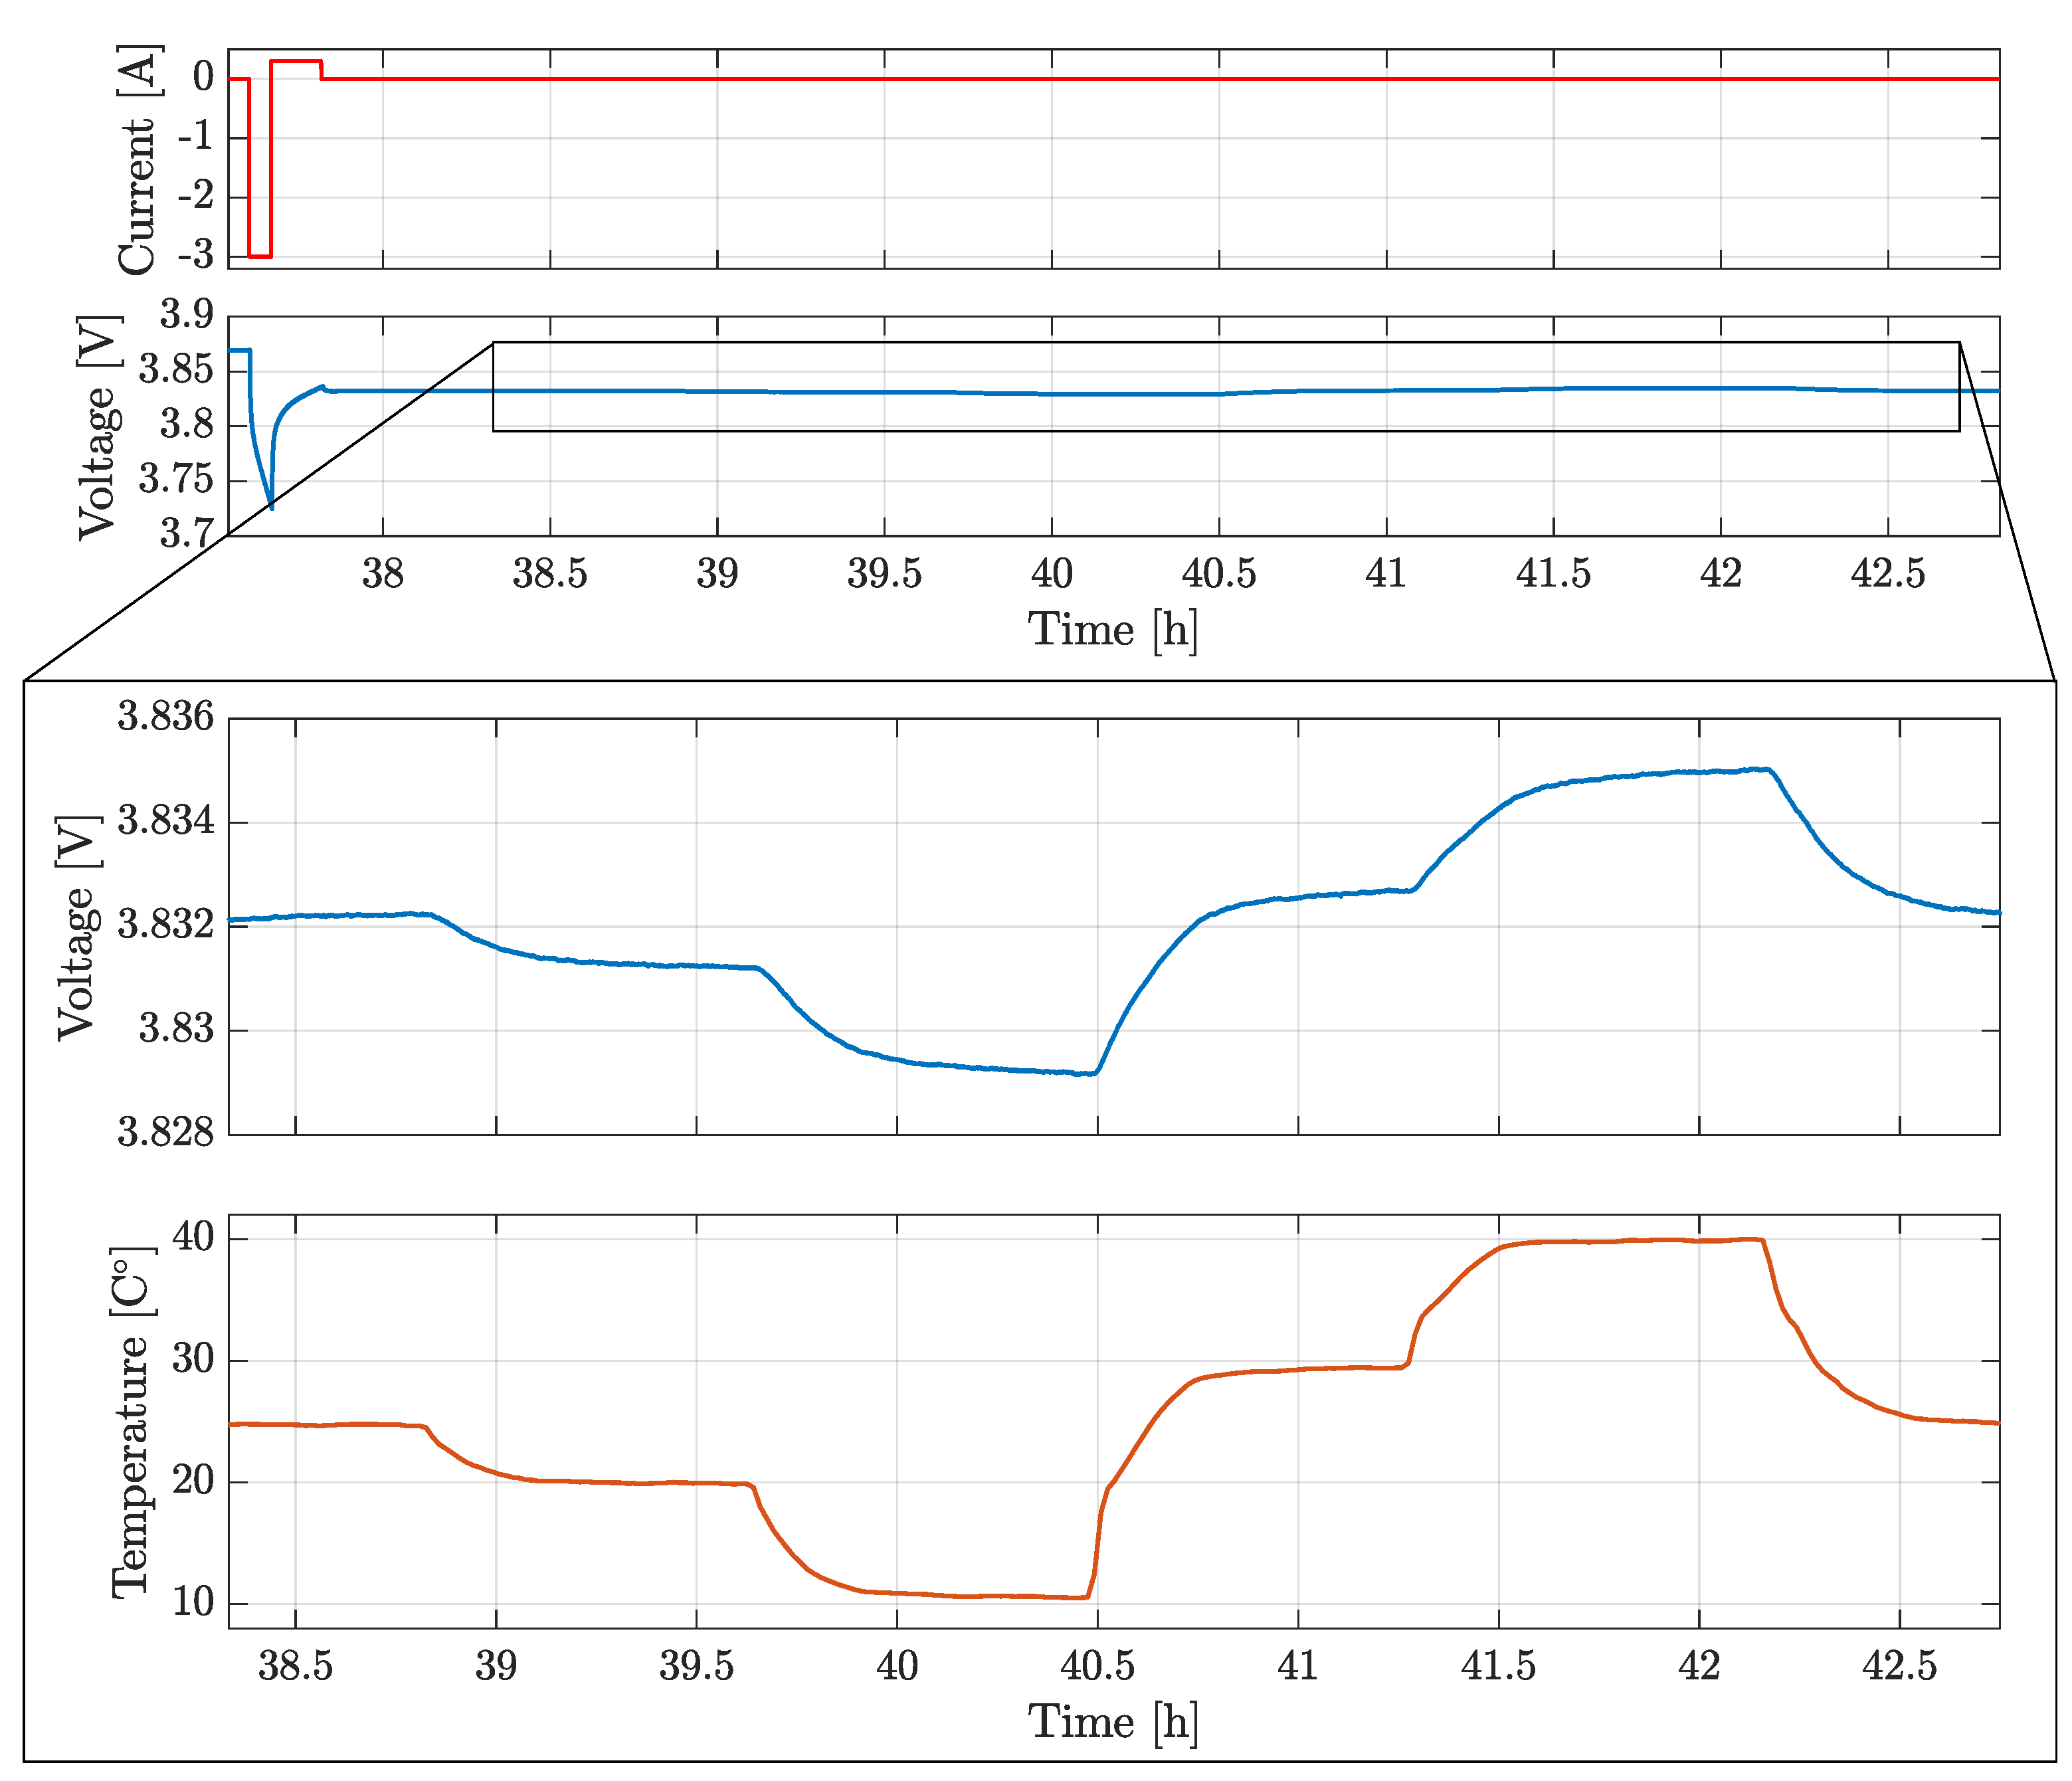
Figure 7 shows the current profile imposed and the voltage measured at the cell terminals, with a zoom on the temperature profile for
=
.
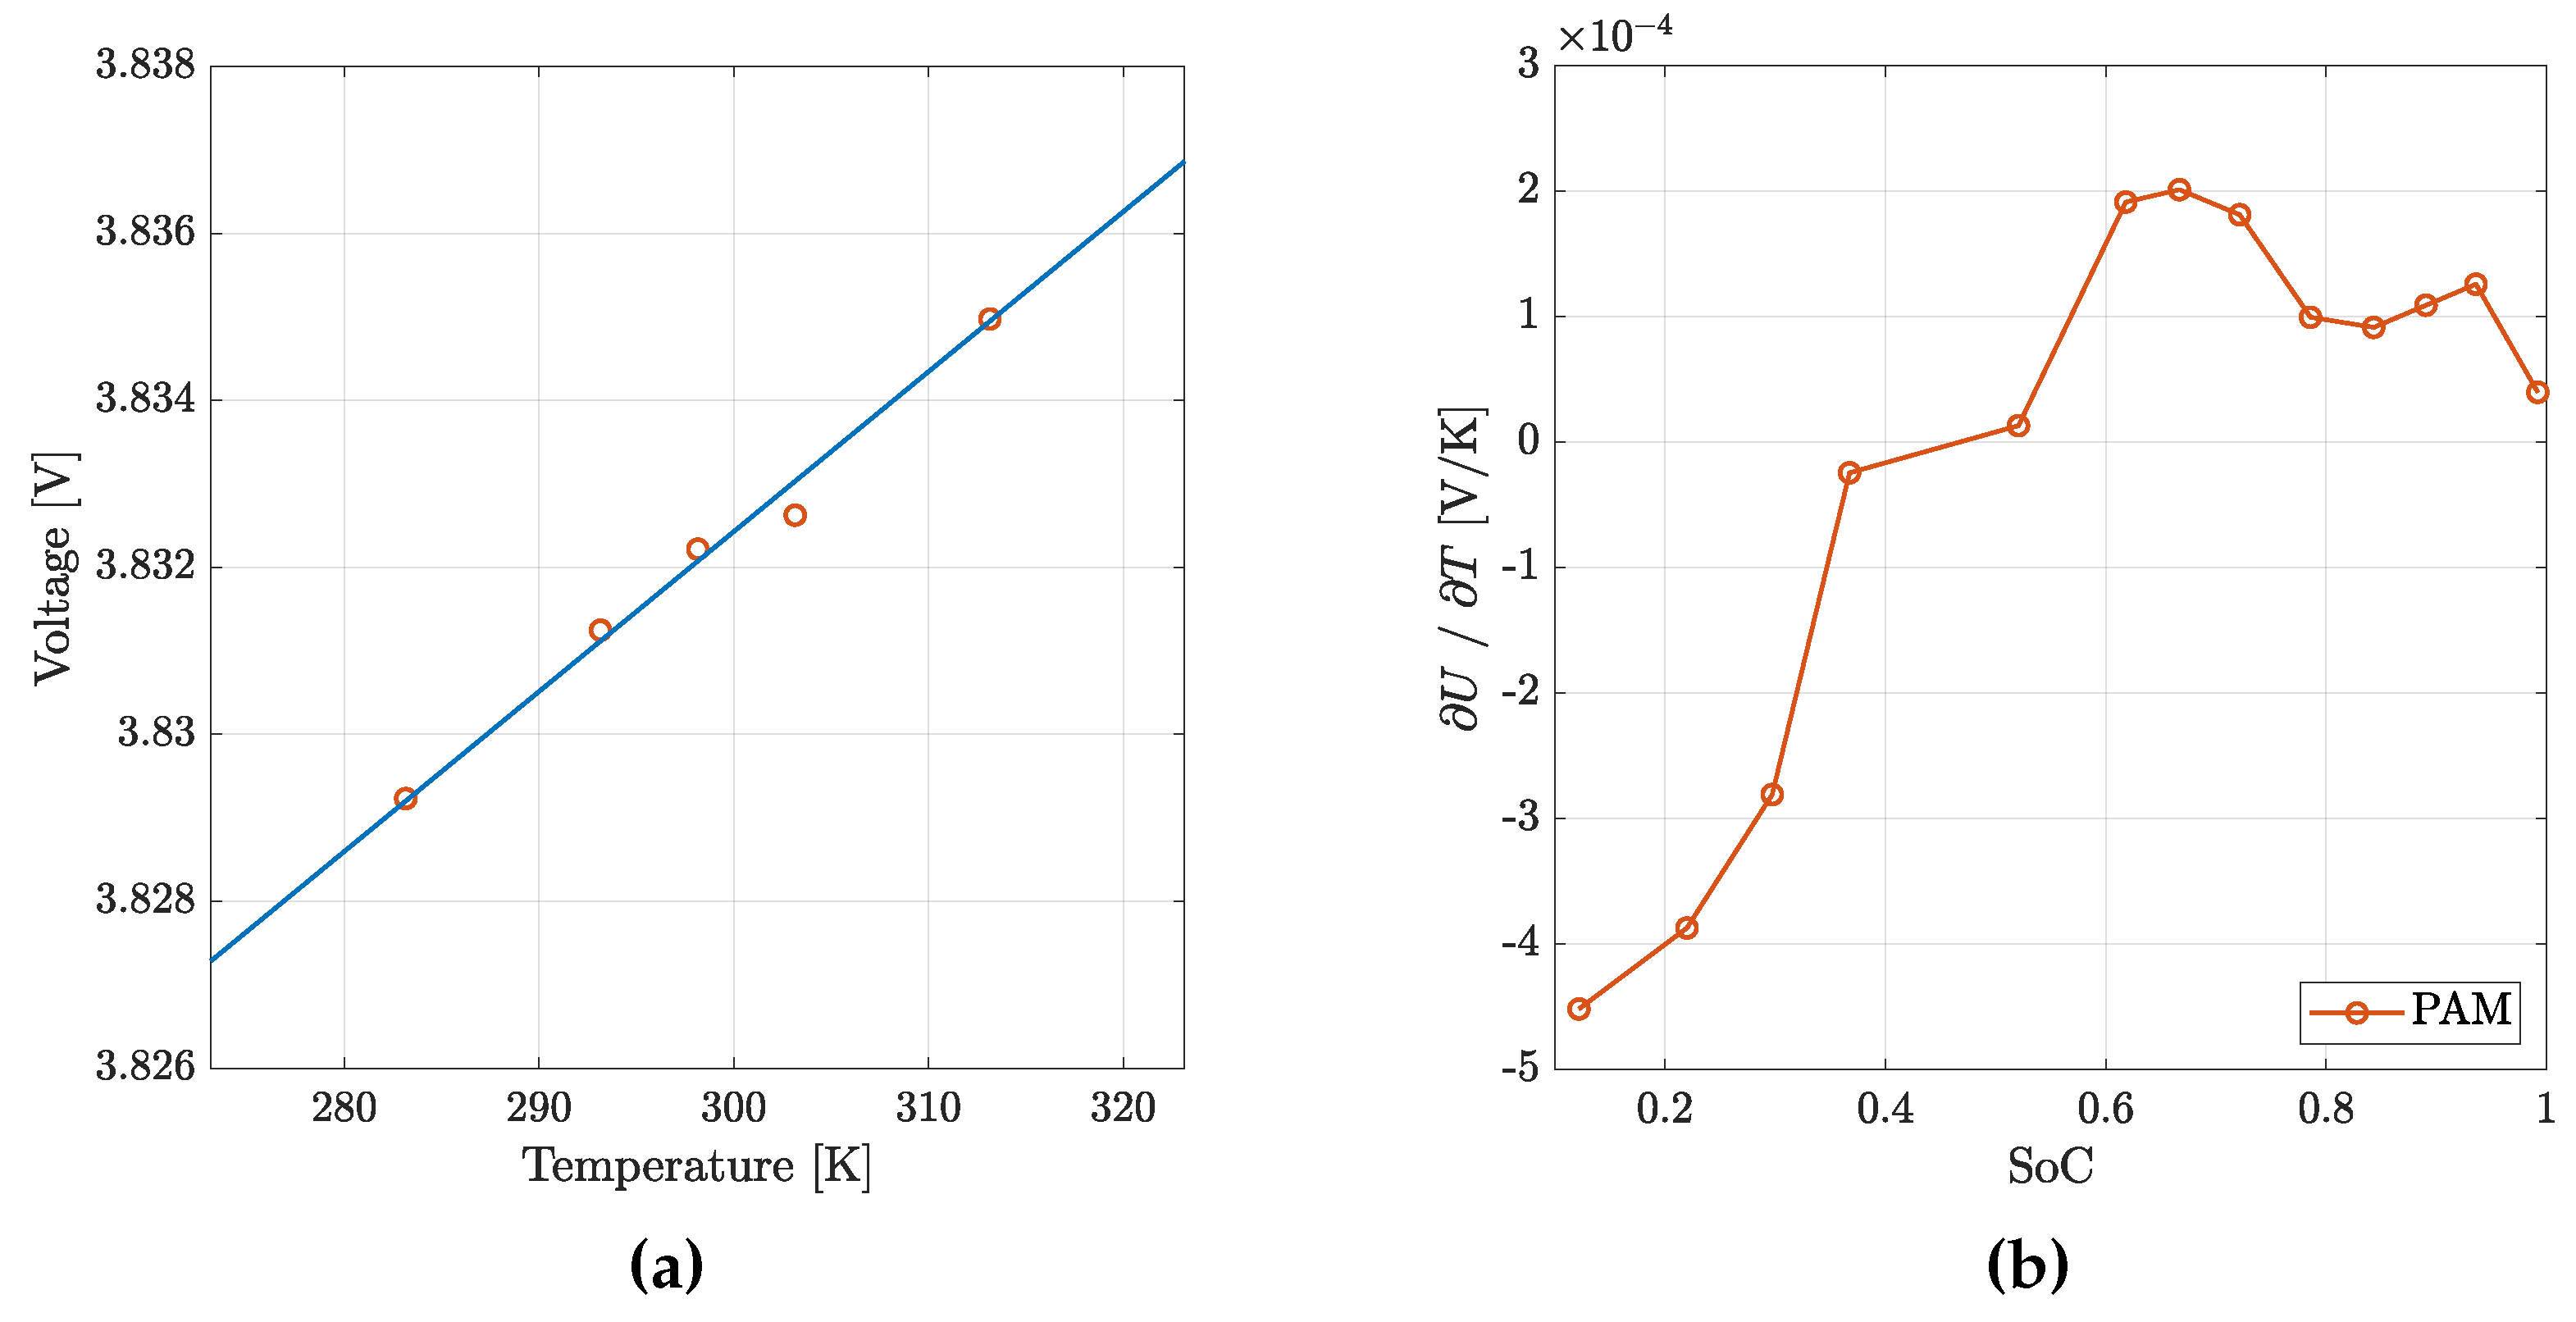
During the PAM test, the battery Open Circuit Voltage (OCV) was measured at various temperatures and SoCs (
Figure 8).
3.4. Thermal Characterization Tests
The thermal parameters involved in thermal modeling of lithium ion cell can be identified in different ways. A common approach is to used calorimetric measurements to determine the battery heat capacity and the anisotropic thermal conductivity: Vertiz
et al. [
40] used Accelerating Rate Calorimeter (ARC) technique to determine heat capacity and thermal conductivity of a lithium-ion pouch cell, coupling an electrical circuit model to a thermal circuit model. Sheng
et al. [
41] imposed controlled heat flux to investigate thermal parameters of a prismatic lithium-ion cell, whereas Cao
et al. studied the heat generation characteristics through heat flux measurements of commercial 18650 cells [
42]. Calorimetric measurements, though precise, require expensive equipment: this is one of the reason why many papers on thermal modelling of Li-ion cells cited above adopted the volume-fraction method to determine the battery thermal parameters from the materials properties. This is the case of [
43,
44] or [
45], where cylindrical cells are studied coupling a electrochemical model with a 2-D thermal model.
Other works present thermal characterization procedures based on cell surface temperature measurements and obtain the internal thermal parameters through numerical optimization studies. Al-Zareer
et al. [
46] determined the heat capacity and the radial and axial cell thermal conductivities by measuring the cell surface temperature and implementing an optimization routine on a COMSOL Multiphysics
® 3-D model for a cylindrical 18650 cell. A similar approach to identify the heat transfer coefficient and the thermal parameters for a prismatic lithium-ion cell was adopted by Samad
et al. [
47] using MATLAB software and considering an array of surface temperature probes, coupling the thermal model with a two RC-loops ECM. Different online parameterization algorithms have also been proposed, in particular for BMS application for battery stacks, as that described by Lin
et al. [
48], which implemented a simple equivalent circuit-based thermal model, or that described in [
49].
Bryden
et al. [
50] proposed a new method based on a non-invasive cell surface temperature measurements in two experimental heat transfer conditions: natural convection and forced convection. Such method, used also by Akbarzadeh
et al. [
9] on prismatic cells, allows a fast and easy thermal characterization and it is particularly suitable for equivalent thermal circuit models and for these reasons it was chosen in this work.
The experimental procedure applied to the cell model consisted of:
Fully charge the cell and then discharge to at reference temperature = 25 °C.
Relax the cell voltage and temperature for 1 h.
Apply a square alternating wave load current with period of 120
, a peak-to-peak amplitude corresponding to a rate of 6 C till reaching a steady-state thermal equilibrium on the cell surface. In this way, the entropic heat contribution could be neglected (see Equation
1).
-
Repeat step 1-3 in two heat exchange condition:
) low-convective heat transfer condition (the cell is placed in the and exchanges heat by natural convection with the air inside the thermal chamber),
) high-convective heat transfer condition (the cell is placed in and a pair of fans cools it down, so that heat exchange is mainly driven by forced convection).
In Equation
2,
in the first equation can be replaced giving:
By measuring
the time dependent heat rate
Q was calculated: once reached the thermal quasi-stationary equilibrium condition (
), we can estimate a first-try value for
as:
Considering the two different heat transfer conditions
and
and defining:
we can write Equation
3 as:
A Levenberg-Marquardt optimization algorithm was run using the MATLAB routine
lsqcurvefit: the value of
and
obtained from Equation
4 were considered as first tries, and the final values of
,
and
,
were calculated by minimizing the residuals between the modelled and the experimental temperature
in the two conditions. Eventually, the algebraic solution of Equation
6 system yielded
and
.
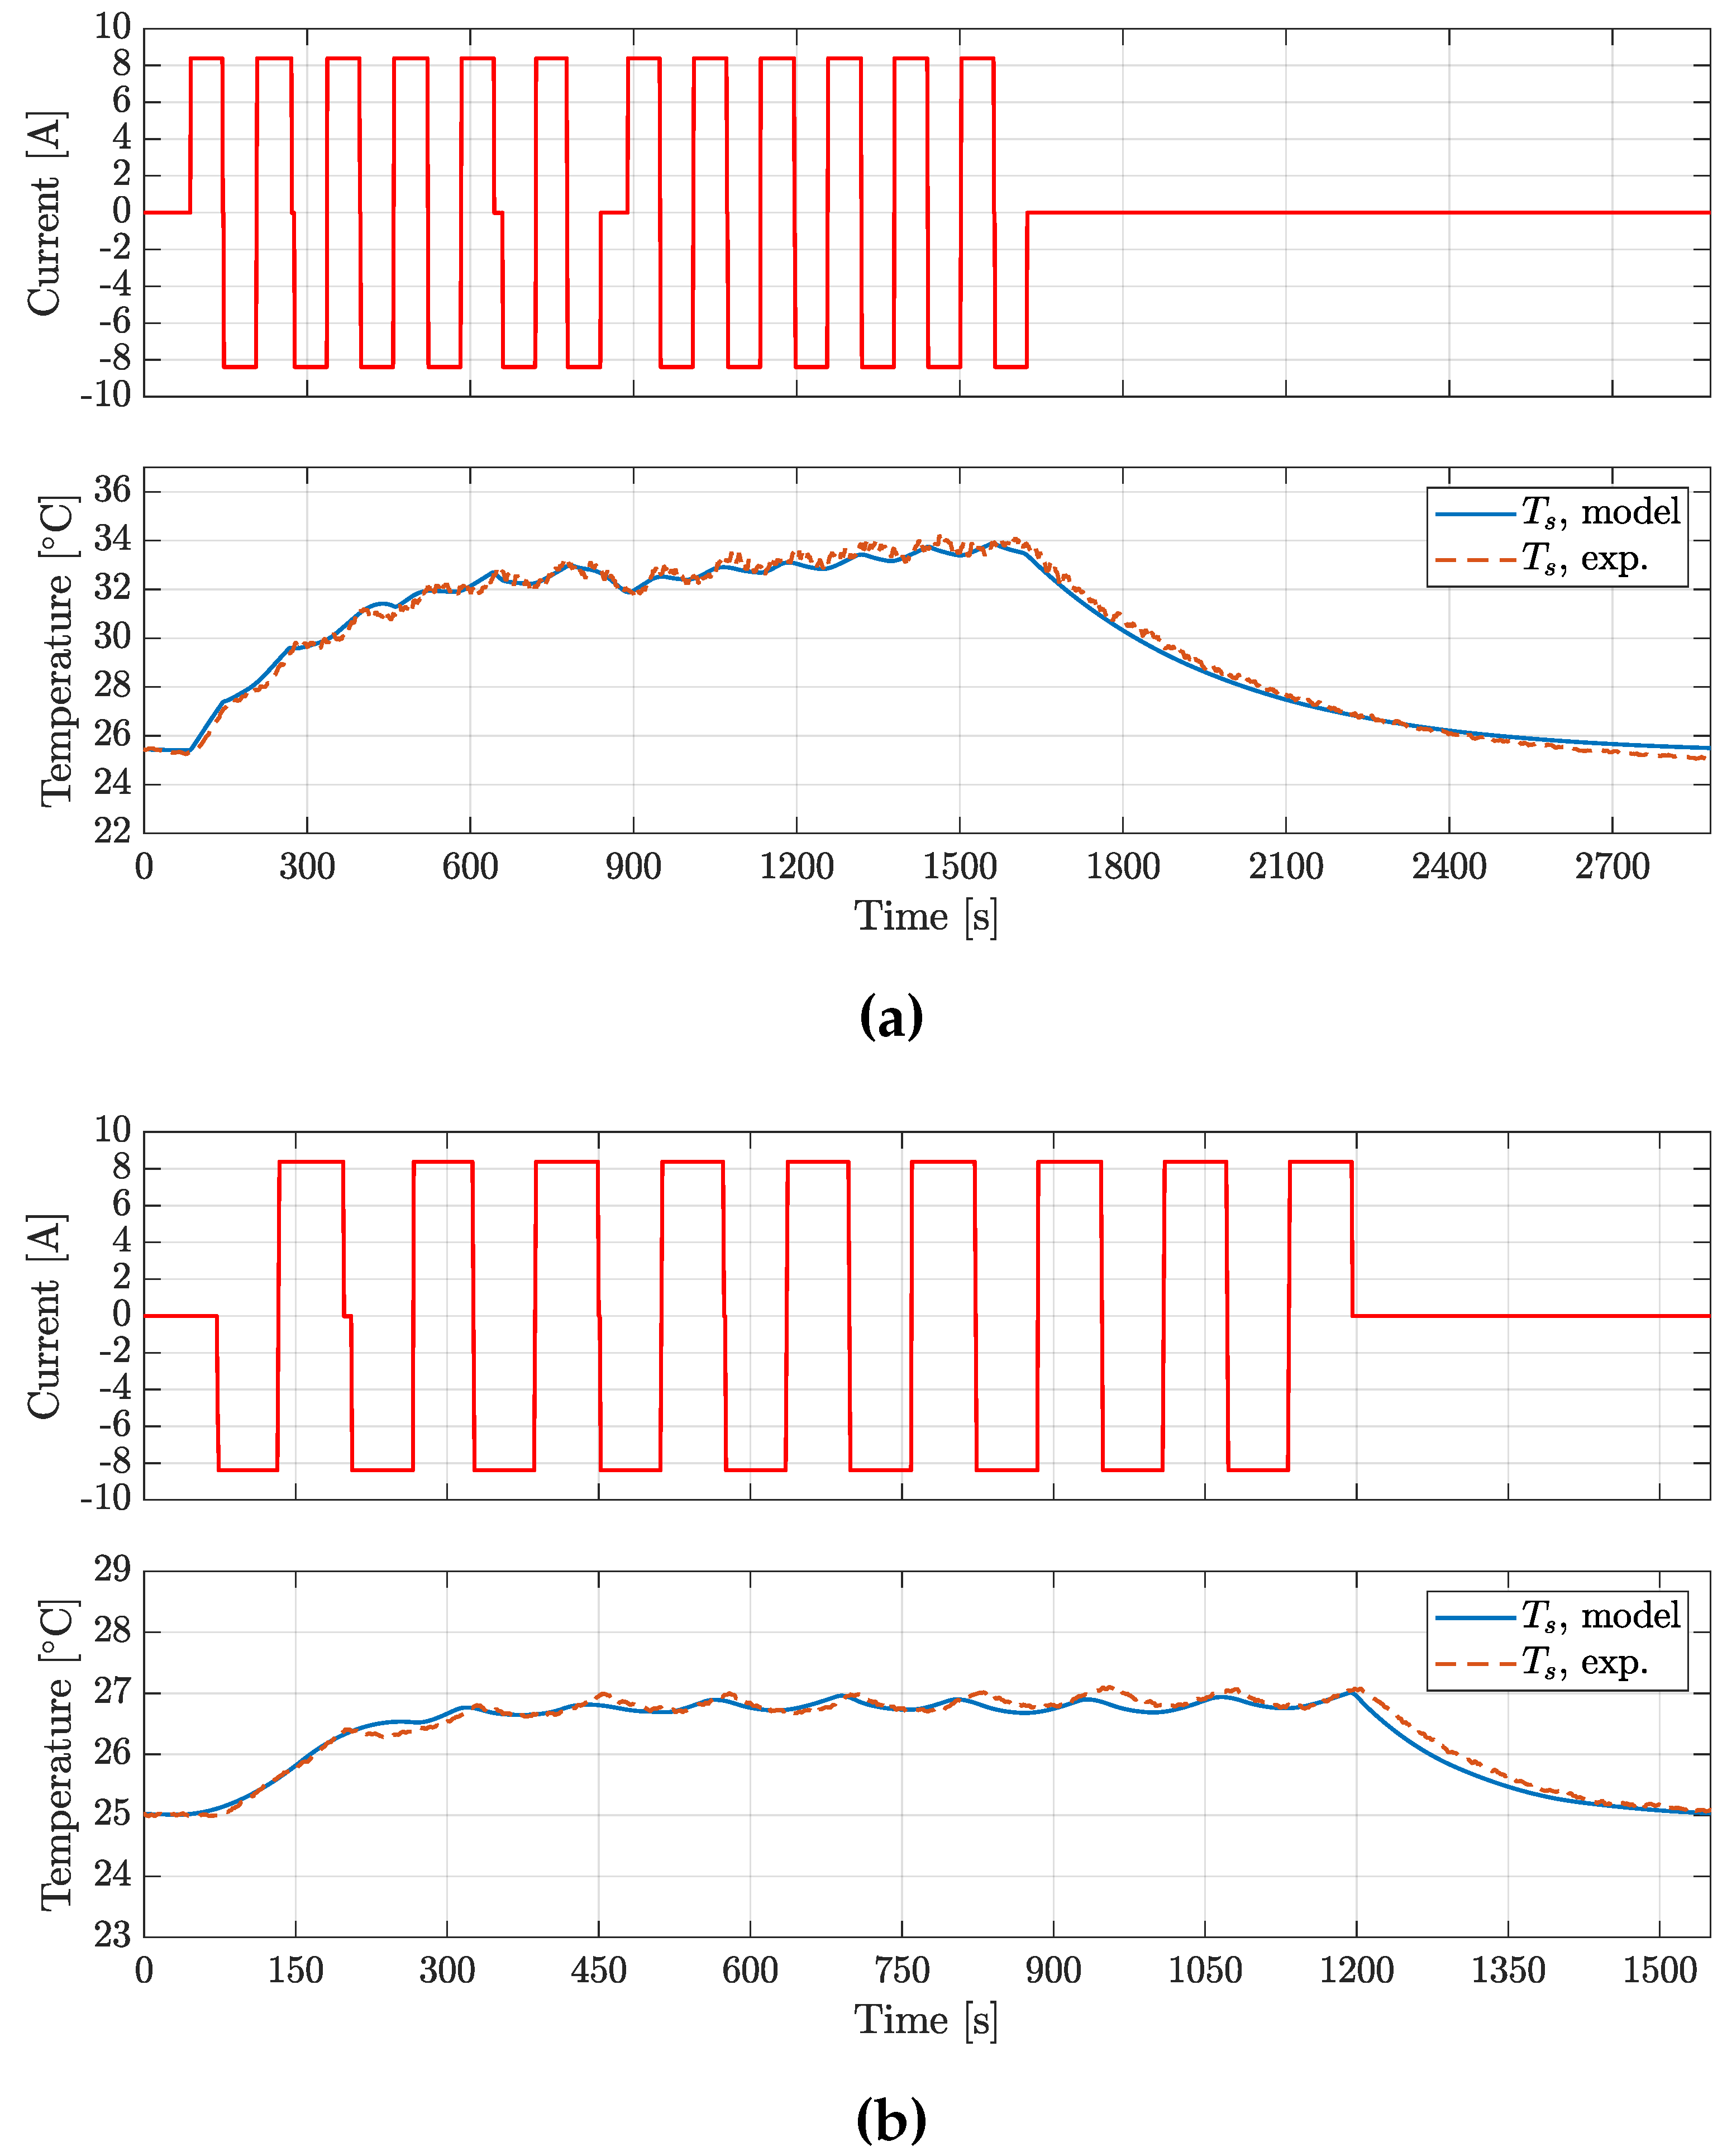
Figure 9 shows the thermal characterization
and
test profiles of the P28A cell, revealing a good agreement between the experimental and simulated
profiles, obtained using the optimized thermal parameters.
The thermal model parameters obtained from the thermal characterization tests for four tested cell are listed in
Table 3.
4. Model Validation
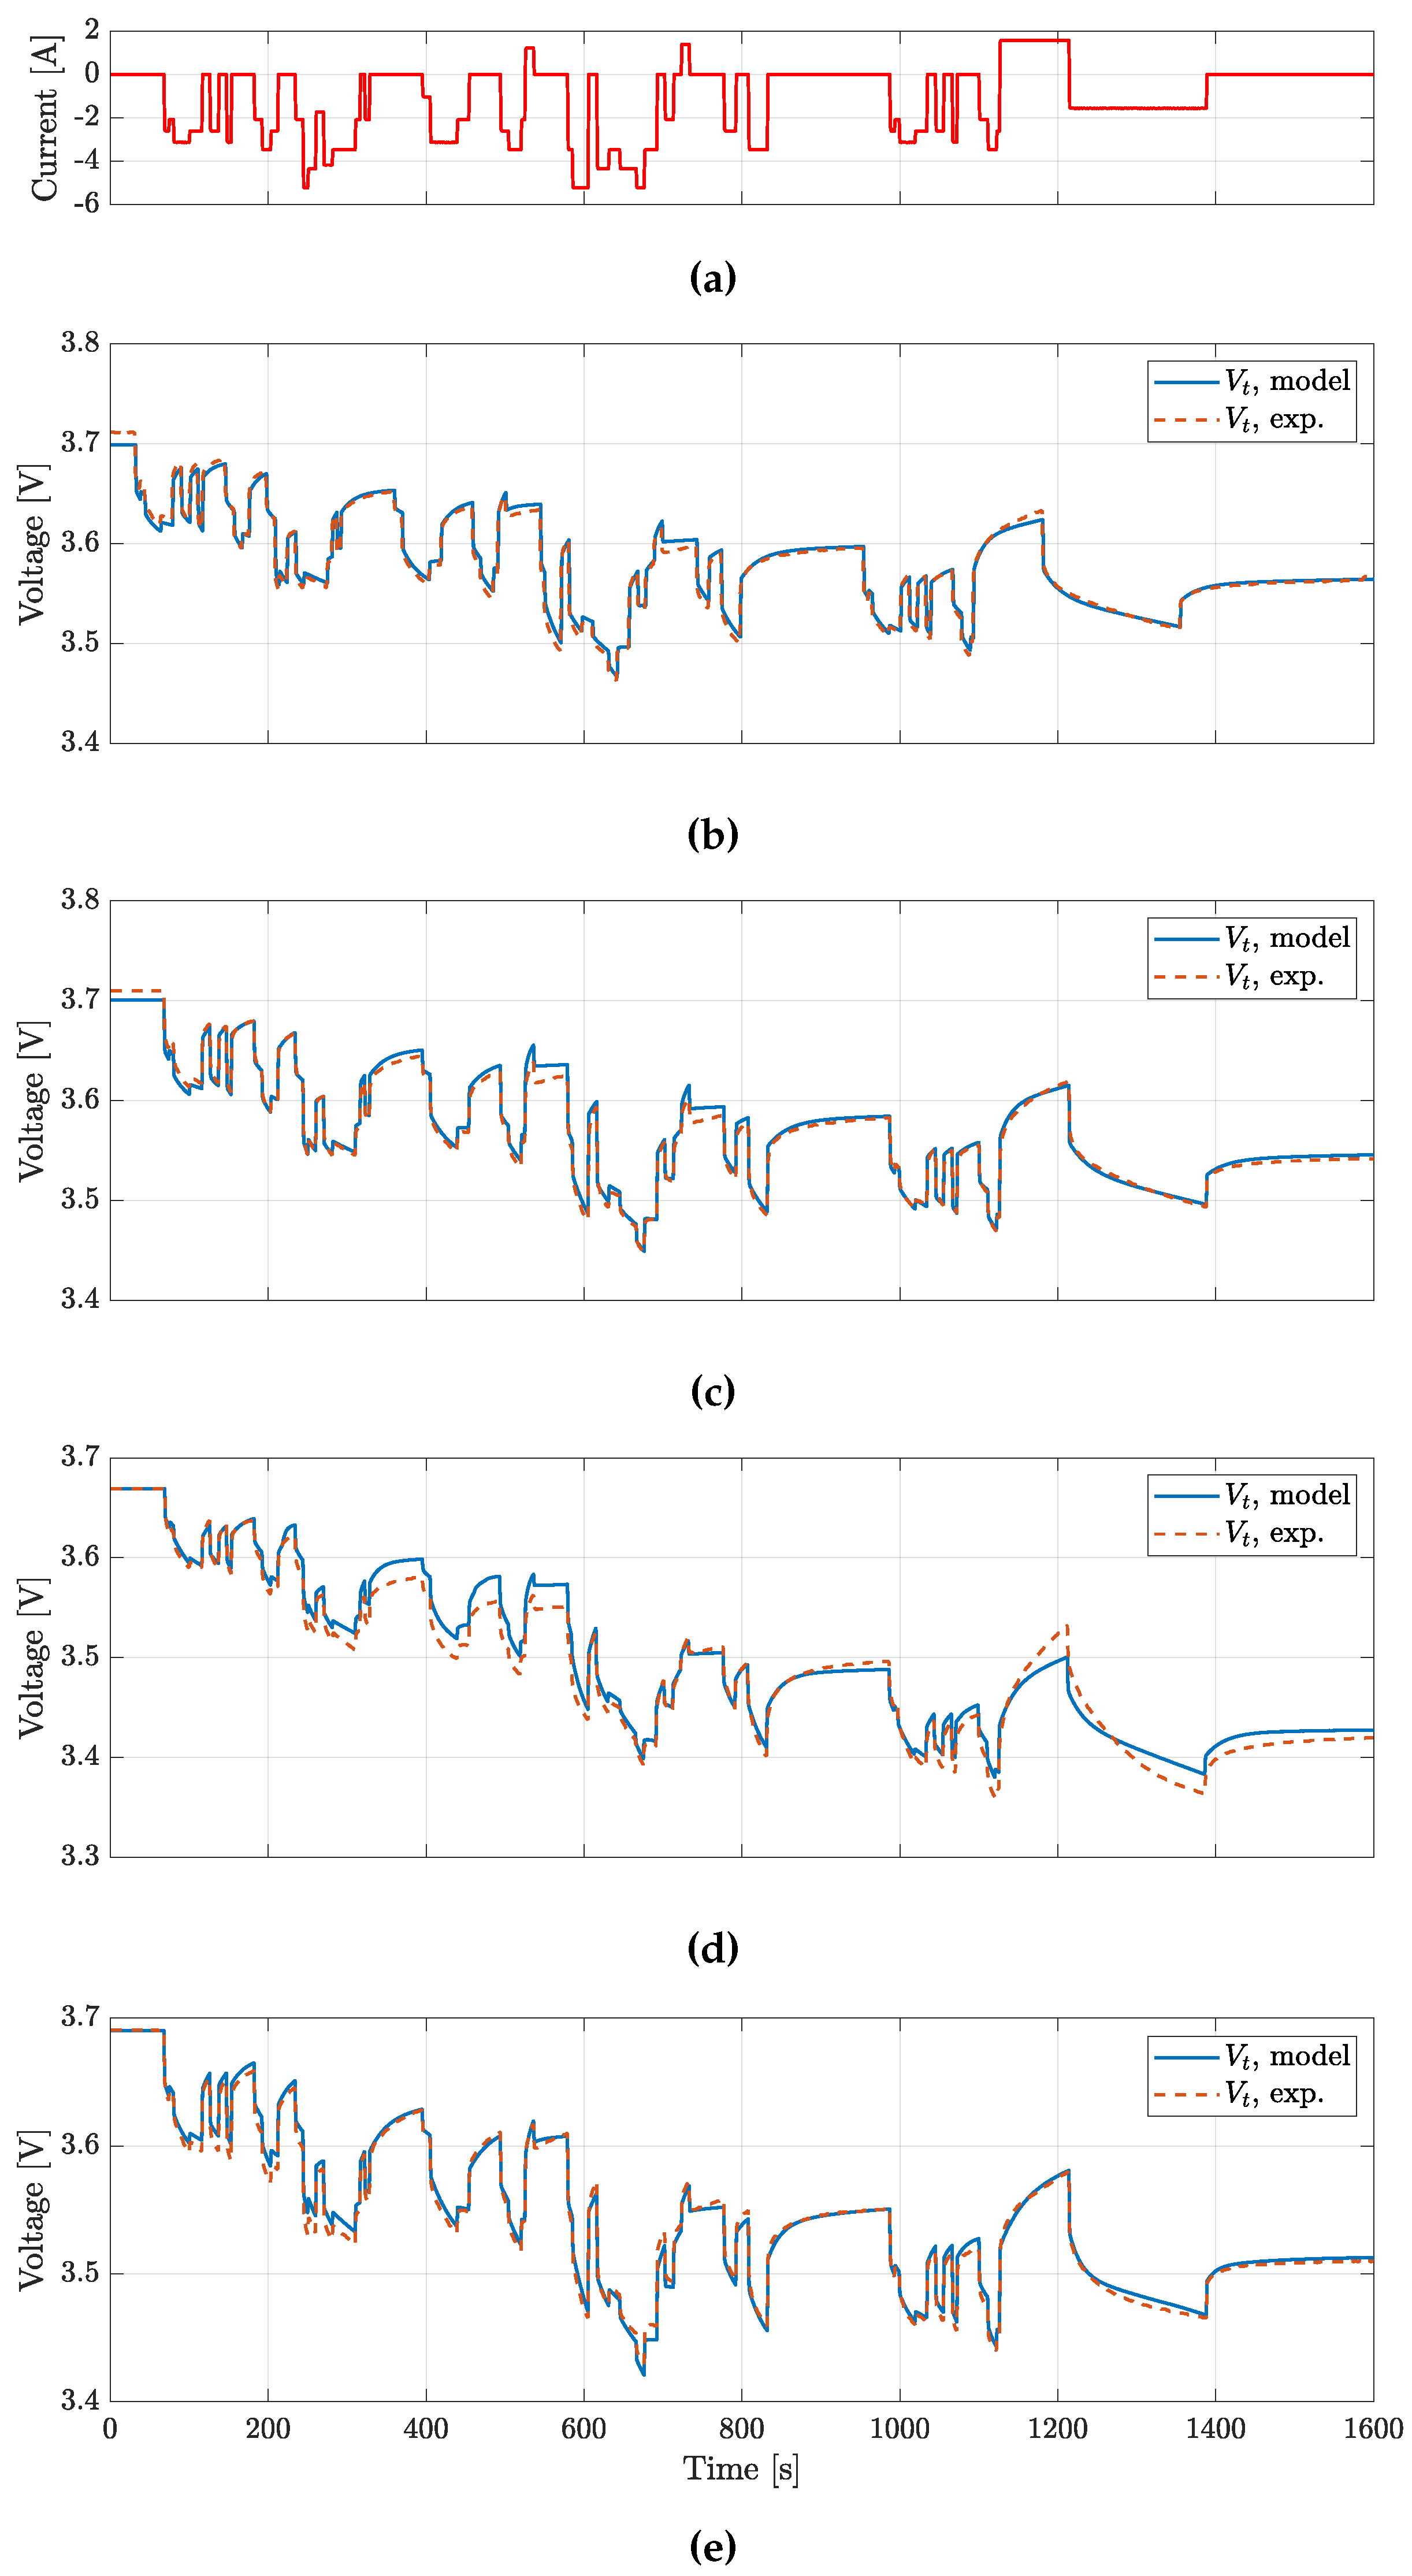
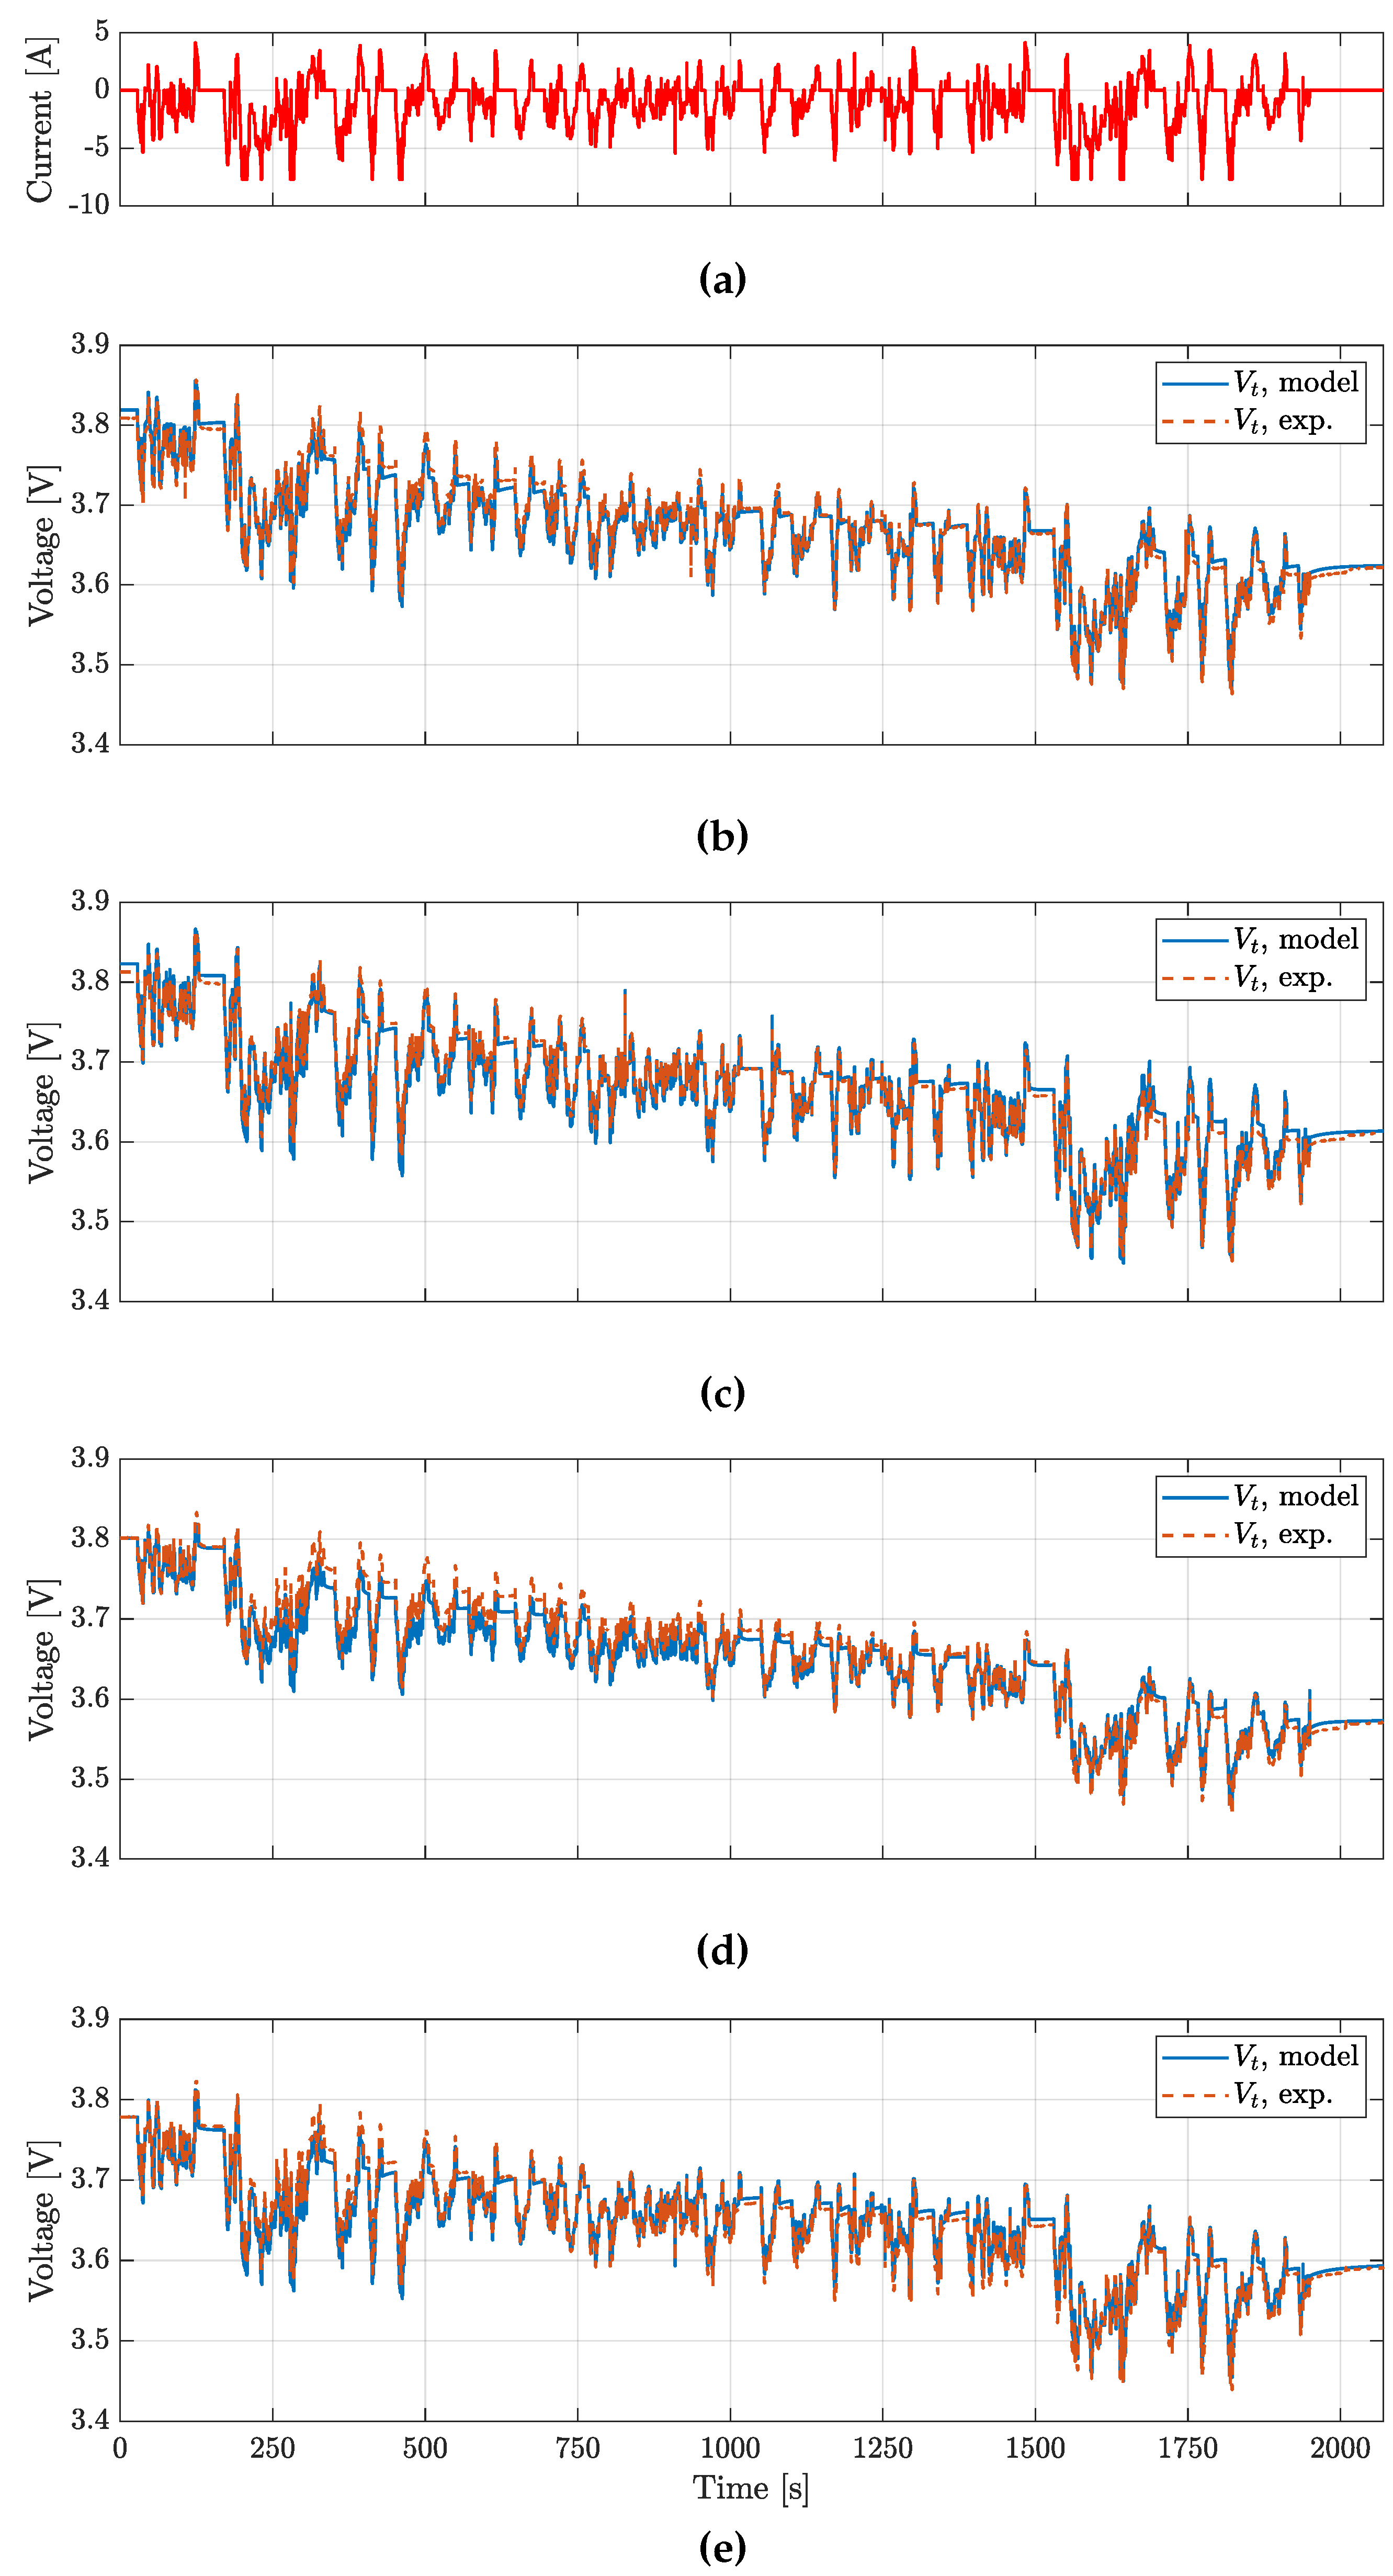
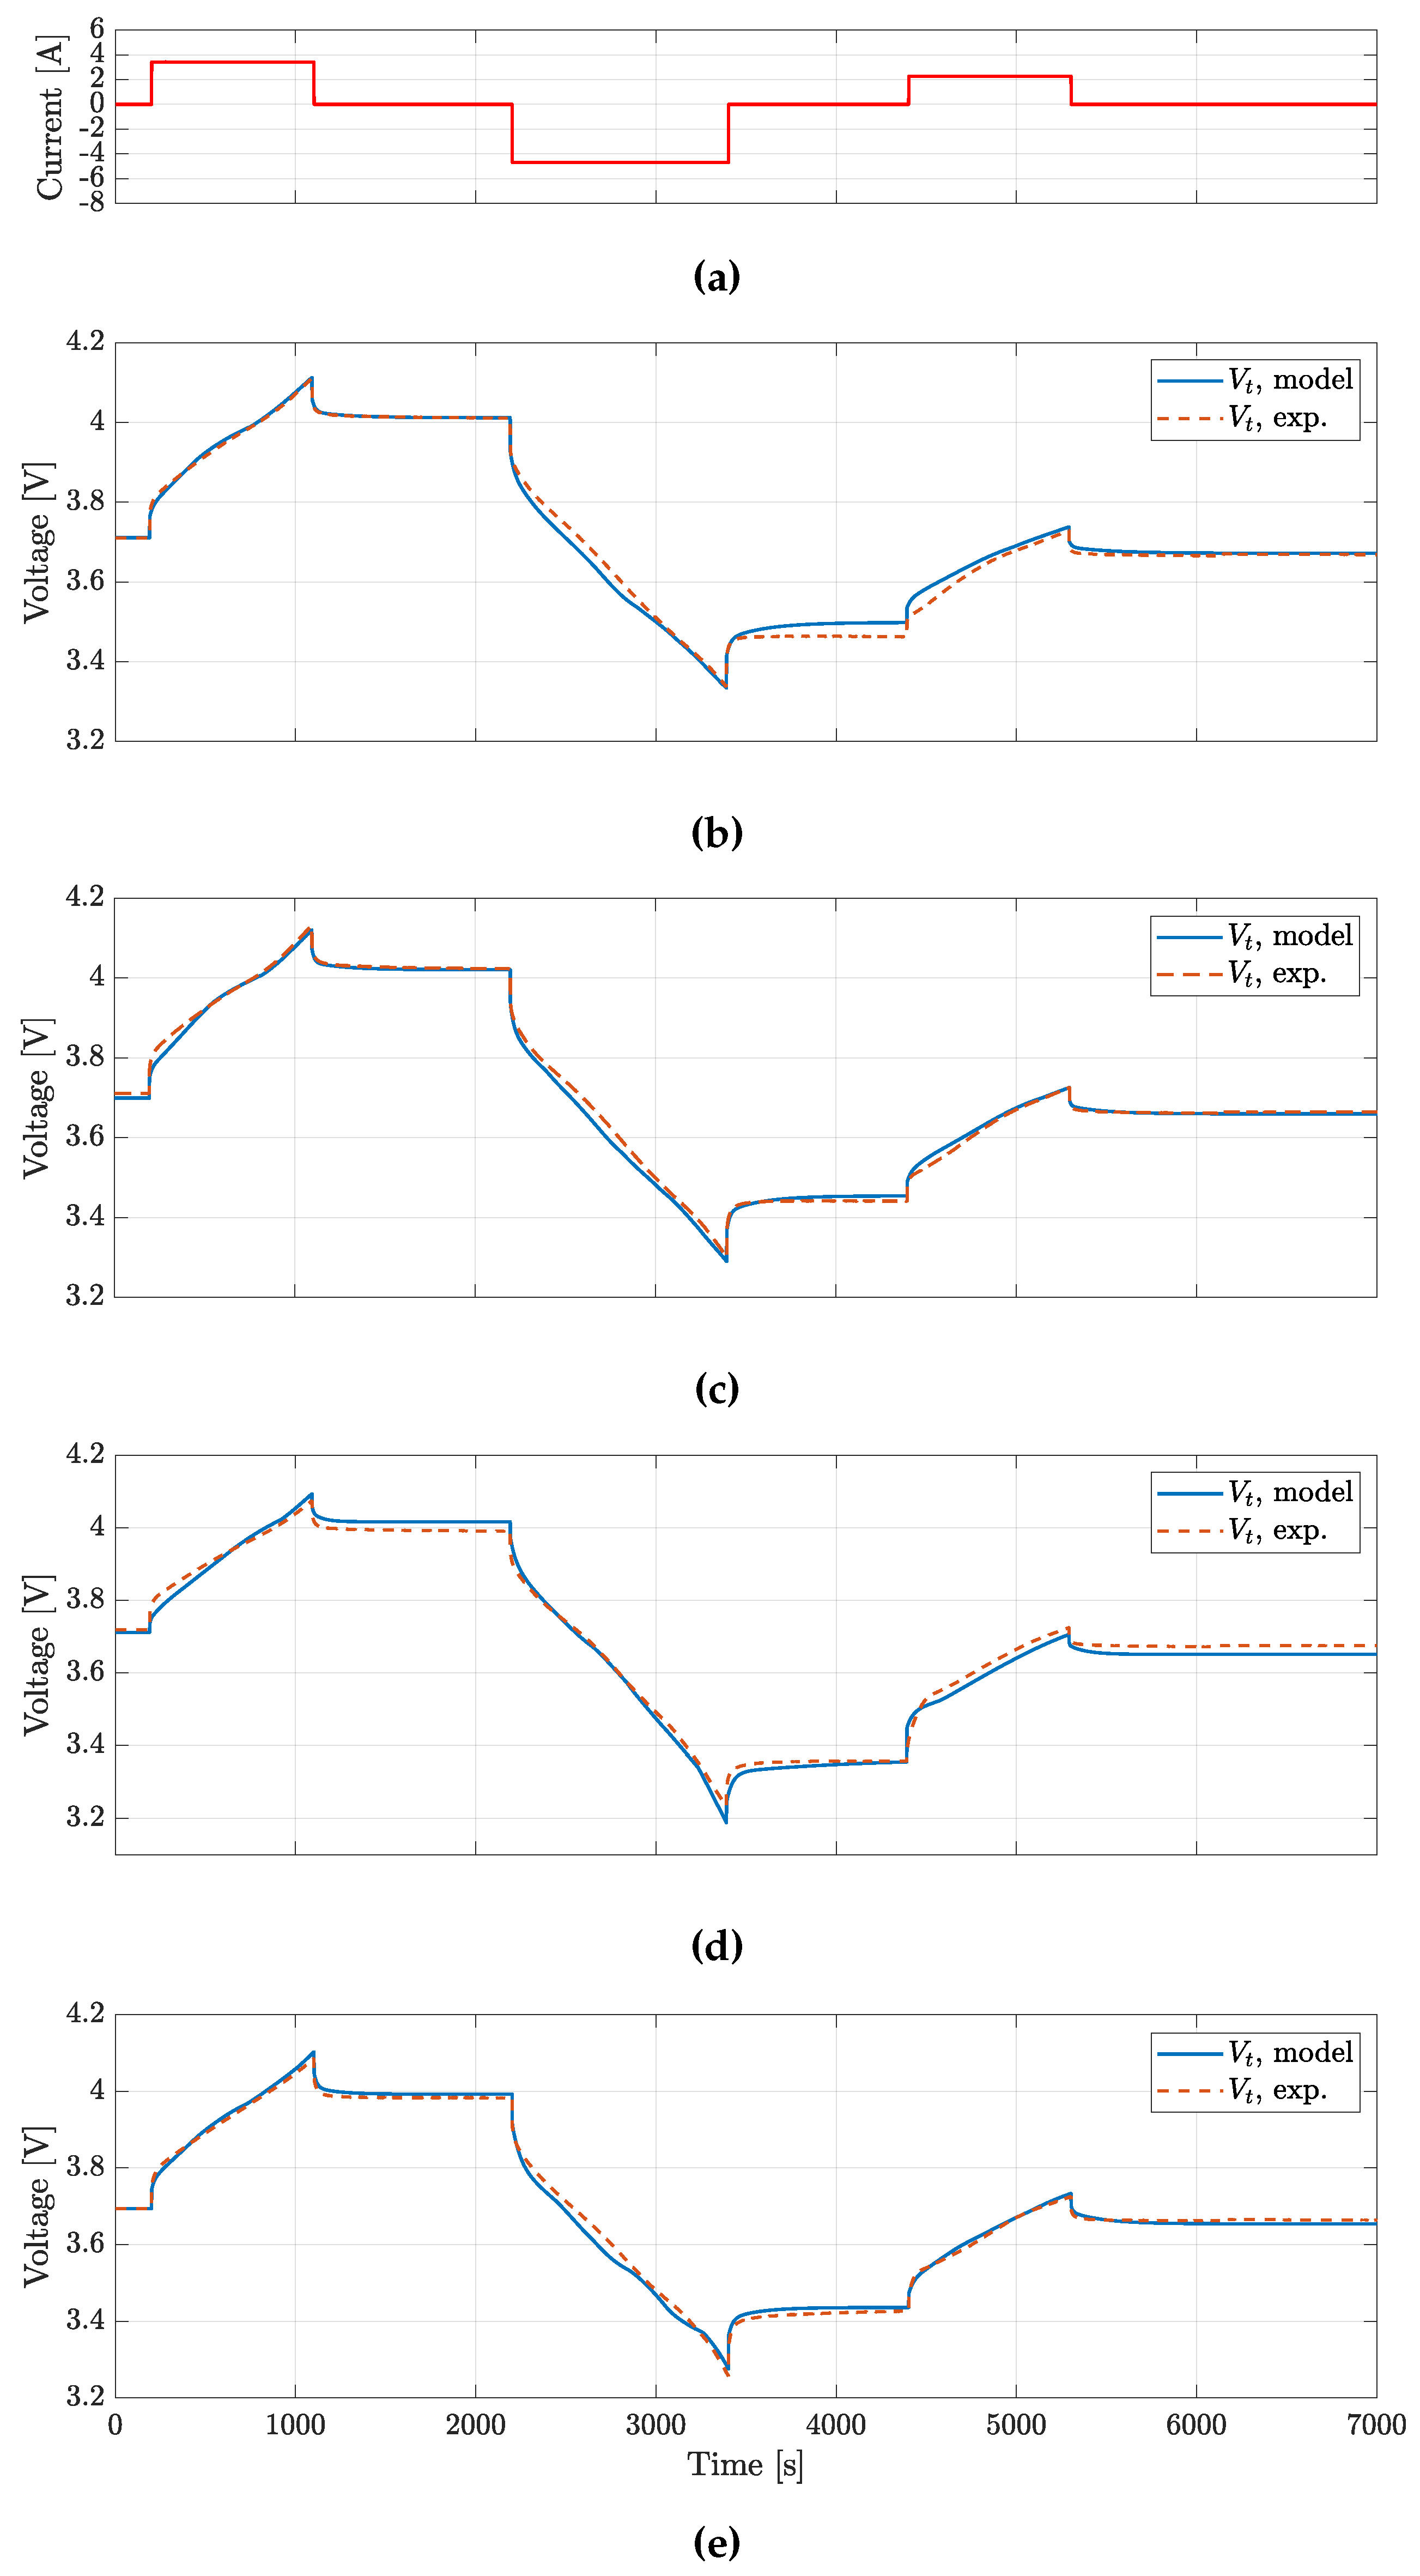
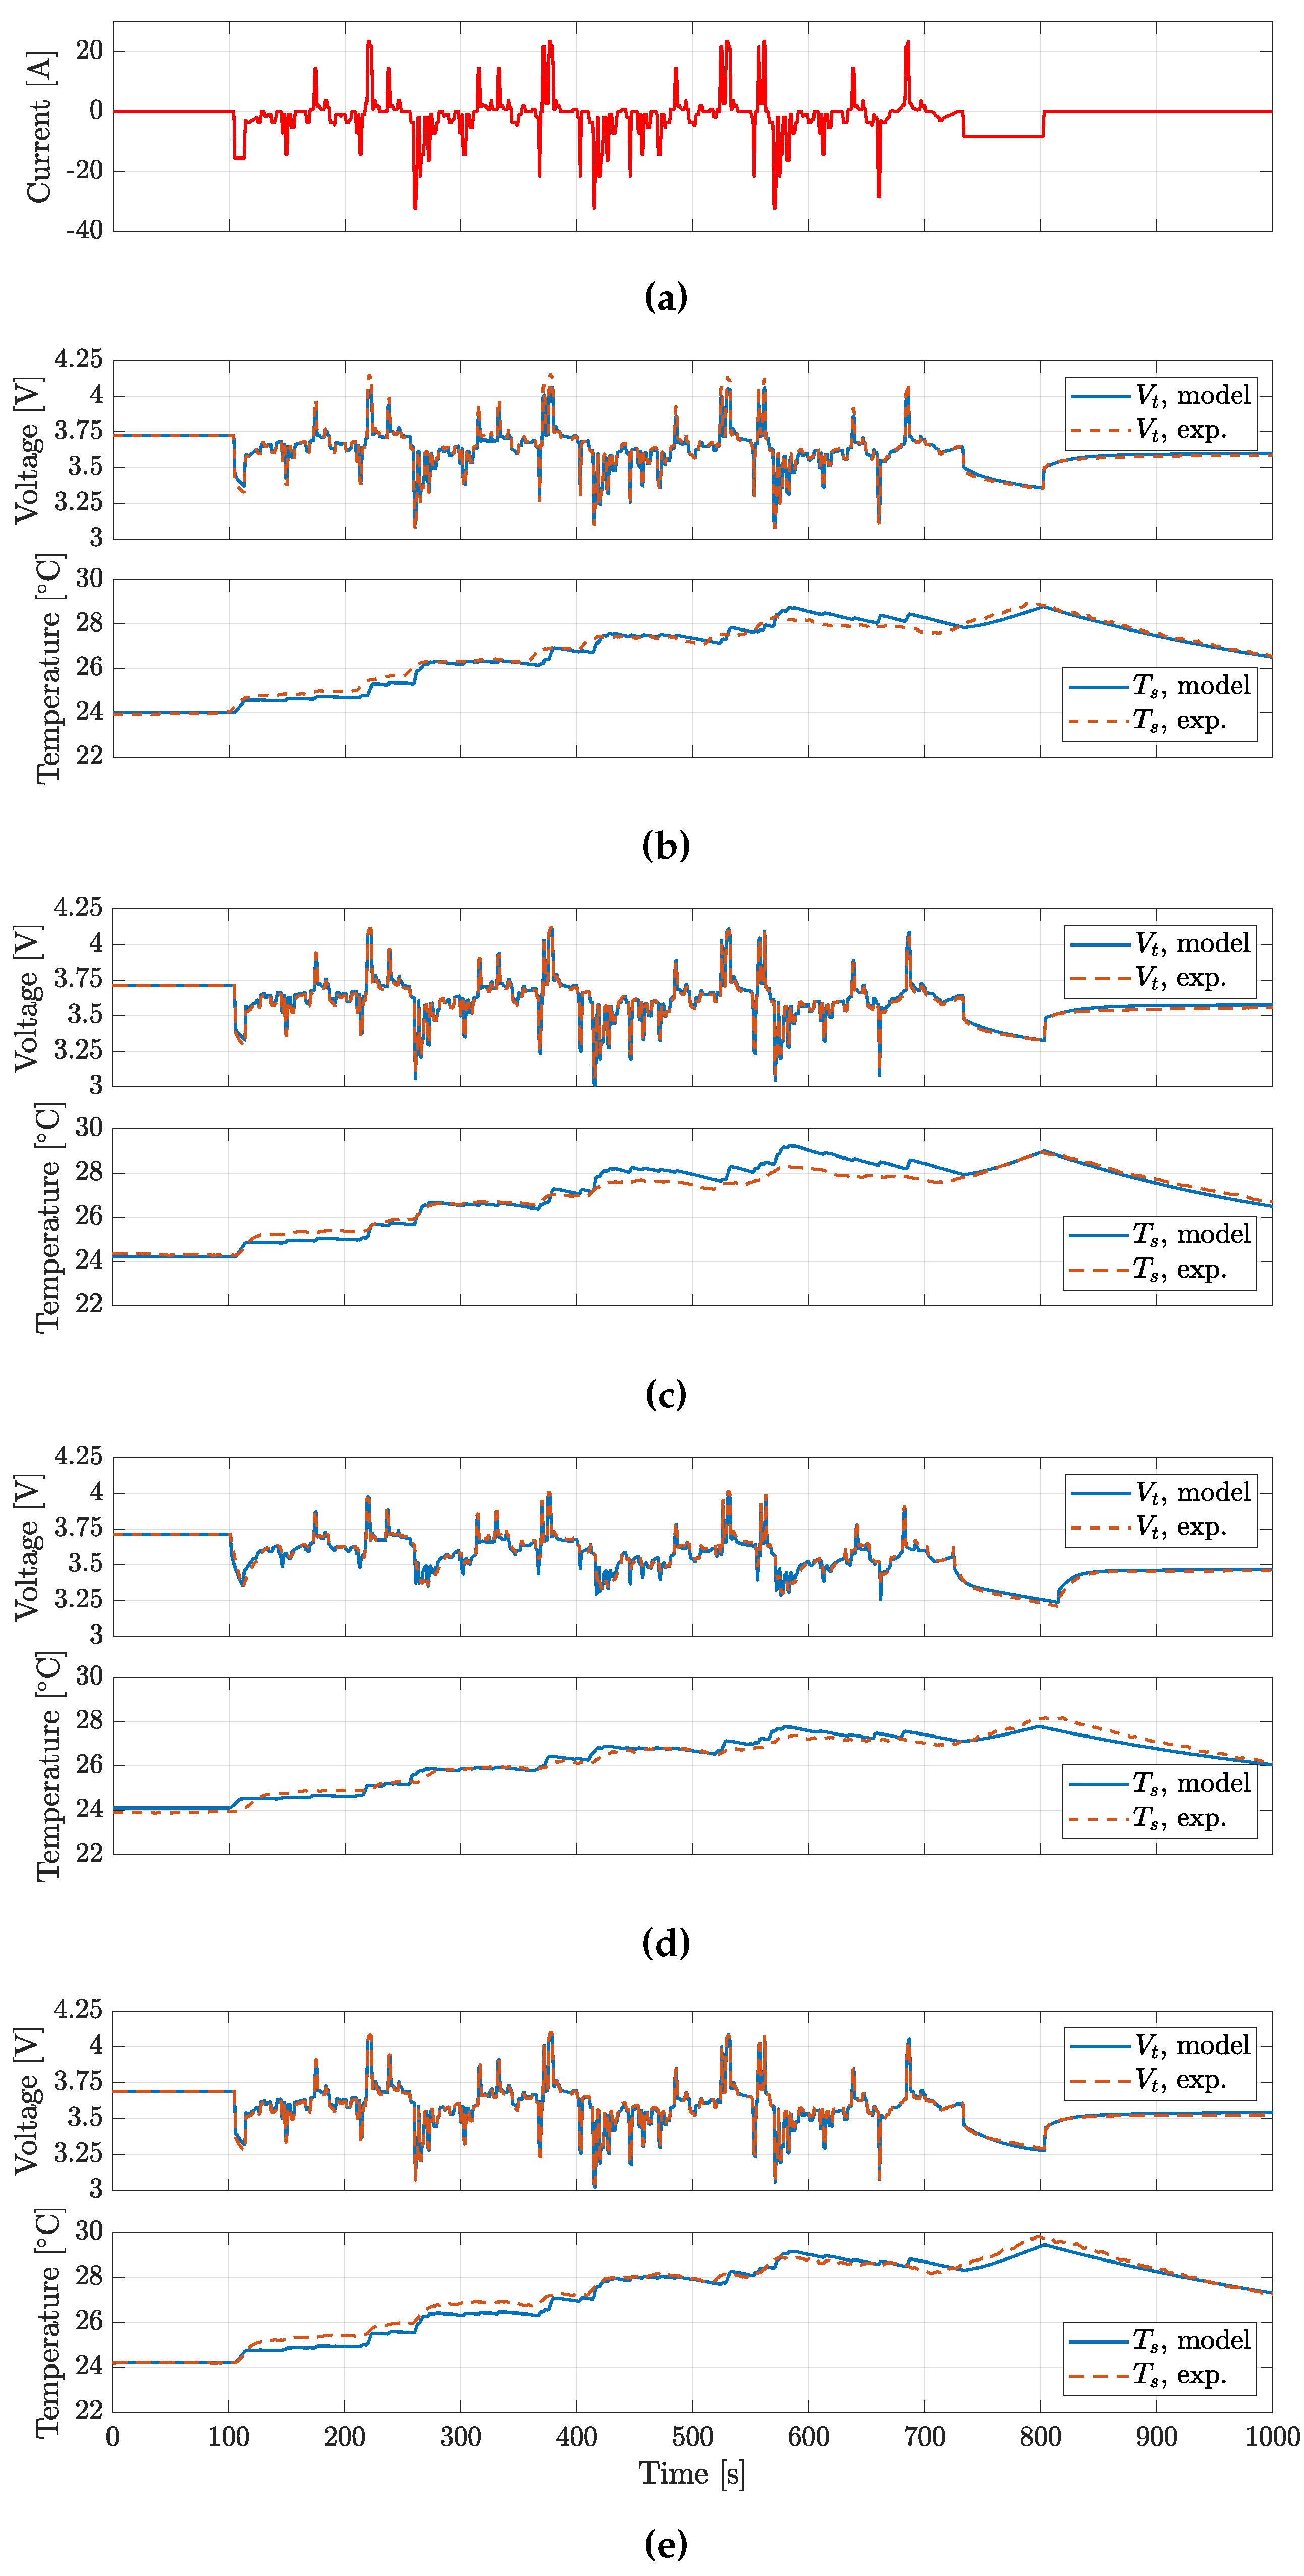
To validate the battery model, four different load profiles have been considered.
The first and the second are taken from common autmotive sector oriented testing profiles, respectively the Beijing Dynamic Stress Test (BJDST) and the Federal Urban Driving Schedule (FUDS) [
51]. The third profile is named Non-Dynamic Cycle (NDC) and it accounts for non intensive electrical device loads, like smartphones or low usage systems [
10]. The fourth is the High Power Load (HPL) profile, characterized by high magnitude discharge current peaks (up to 10 C) [
7].
The BJDST, FUDS and NDC profiles were used to validated the model voltage prediction for the batteries considered, while HPL was also targeting the validation of model prediction.
Experimental data were collected using the testing facility described above, the thermal chamber air temperature equal to 24 °C.
Validation results for BJDST and FUDS profiles are reported in
Figure 10 and in
Figure 11, while
Figure 12 and
Figure 13 account for the NDC and the HPL profiles respectively. In
Table 4, the Root Mean Square Error (RMSE) for the various profiles tested are reported.
The results show that voltages are predicted with a RMSE lower than 20
, while
predicition presents a RMSE lower than
. It is worth noting how the ECM could be further improved. In particular, the actual Coulomb counting based
SoC estimation could be enhanced by using an optimization routine (
e.g., Kalman filter). In this way, the dependence of the battery capacity on the load could be better accounted: in the actual work, a charge/discharge
equal to
was considered. Furthermore, an hysteretic behaviour was noted when measuring the OCV, in particular for the Molicel P30B (that presents the higher errors on voltage prediction): this could be considered adding an hysteresis term in
prediction as in [
10].
5. Conclusions
In this work, a group of four different market available 18650 Li-ion cells consisting of Molicel P28A, P28B and P30B and Sony Murata VTC5D was tested and characterized.
The CC discharge performance were measured for all the cells at operating temperature of 5 °C, 25 °C and 40 °C and C-rate of C, 1 C, 3 C and 5 C. Performance spreading was accounted giving the standard deviation over a sample of 3 cells per model.
A second order ECM model was characterized: first the OCV curves were measured through a pseudo- technique, then the ECM parameters were extrapolated using a Matlab based algorithm from GITT tests at various temperatures and SoC.
Furthermore, the entropic contribution was measured using a PAM approach. This resulted in shortening the time needed to measure the temperature derivative of the OCV at various , without the need for expensive equipment as calorimeters or complex modelling. Results obtained showed a good agreement with literature for NMC based cells.
Moreover, the thermal behaviour of the cells was described using a thermal lumped parameters model, that has been characterized using only temperatures data.
The coupled model was validated over three dynamic and one non-dynamic load profiles. Battery terminals voltages were predicted with an RMSE lower than 20 , while the battery surface temperature prediction RMSE was lower than . Further developments of the ECM model can consider the addition of Kalman filter to predict the battery over longer simulations and improving the circuit taking into account voltage hysteresis phenomena.
It is worth noting how overall performance of Molicel P28A, P28B and Sony Murata VTC5D are pretty close: in particular, given the same current load profile, overvoltages are similar, thus giving a similar thermal behaviour. On the contrary, the Molicel P30B, considering its higher nominal capacity results in lower overvoltages and in a lower temperature rise considering the same testing profile.
Author Contributions
Conceptualization, N.Z.; methodology, N.Z.; software, N.Z., B.D., E.D., G.C1.; validation, N.Z. and B.D.; formal analysis, A.T. and M.G.; investigation, N.Z.; resources, B.D. and G.C2.; data curation, N.Z. and B.D.; writing original draft preparation, N.Z.; writing, review and editing, A.L., A.T. and M.G.; visualization, N.Z.; supervision, G.C2., A.L. and M.G.; project administration, M.G.; funding acquisition, A.L. and M.G. All authors have read and agreed to the published version of the manuscript.
Funding
This research received no external funding.
Institutional Review Board Statement
Not applicable.
Informed Consent Statement
Not applicable.
Data Availability Statement
The data presented in this study are available on request from the corresponding author. The data are not publicly available due to confidentiality.
Acknowledgments
This work was supported by FIAMM Energy Technologies, Montecchio Maggiore, Italy.
Conflicts of Interest
The authors declare no conflict of interest.
Sample Availability
Samples of the compounds ... are available from the authors.
Abbreviations
The following abbreviations are used in this manuscript:
| ARC |
Accelerating Rate Calorimeter |
| BJDST |
Beijing Dynamic Stress Test |
| BMS |
Battery Management System |
| CC |
Constant Current |
| CPM |
Common Potentiometric Method |
| CV |
Constant Voltage |
| ECM |
Equivalent Circuit Model |
| EIS |
Electrothermal Impedance Spectroscopy |
| FSAE |
Formula of the Society of Automotive Engineers |
| FUDS |
Federal Urban Driving Schedule |
| HPL |
High Power Load |
| NDC |
Non Dynamic Cycle |
| OCV |
Open Circuit Voltage |
| PAM |
Positive Adjustment Method |
| RMSE |
Root Mean Square Error |
| SoC |
State Of Charge |
Appendix A
Appendix A.1
Here are reported the table containing the ECM parameters for the different cells 386 tested at 5, 25 and 40 °C.
Table A1.
The ECM parameters for the P28A cell model.
Table A1.
The ECM parameters for the P28A cell model.
| |
Tc°C |
| |
Discharge |
|
Charge |
| SoC |
Rs |
R1 |
C1 |
R2 |
C2 |
|
Rs |
R1 |
C1 |
R2 |
C2 |
| |
[Ω] |
[Ω] |
[F] |
[Ω] |
[F] |
|
[Ω] |
[Ω] |
[F] |
[Ω] |
[F] |
| 0.1 |
0.0271 |
0.0308 |
1173 |
0.0196 |
21970 |
|
0.0266 |
0.0433 |
8526 |
0.0355 |
24350 |
| 0.2 |
0.0263 |
0.0219 |
1412 |
0.0211 |
33364 |
|
0.0242 |
0.0662 |
4058 |
0.0281 |
21050 |
| 0.3 |
0.0264 |
0.0230 |
1573 |
0.0225 |
42927 |
|
0.0222 |
0.0570 |
512 |
0.0155 |
20215 |
| 0.4 |
0.0269 |
0.0216 |
1197 |
0.0154 |
40665 |
|
0.0218 |
0.0171 |
886 |
0.0268 |
16880 |
| 0.5 |
0.0272 |
0.0178 |
819 |
0.0130 |
33119 |
|
0.0217 |
0.0132 |
823 |
0.0110 |
20650 |
| 0.6 |
0.0273 |
0.0152 |
646 |
0.0190 |
23145 |
|
0.0208 |
0.0127 |
941 |
0.0092 |
21596 |
| 0.7 |
0.0283 |
0.0134 |
775 |
0.0325 |
15821 |
|
0.0227 |
0.0148 |
1085 |
0.0135 |
31539 |
| 0.8 |
0.0305 |
0.0183 |
959 |
0.0397 |
11399 |
|
0.0284 |
0.0114 |
1531 |
0.0140 |
34055 |
| 0.9 |
0.0313 |
0.0215 |
999 |
0.0180 |
24522 |
|
0.0331 |
0.0059 |
2139 |
0.0096 |
22909 |
| |
Tc°C
|
| |
Discharge |
|
Charge |
| SoC |
Rs |
R1 |
C1 |
R2 |
C2 |
|
Rs |
R1 |
C1 |
R2 |
C2 |
| |
[Ω] |
[Ω] |
[F] |
[Ω] |
[F] |
|
[Ω] |
[Ω] |
[F] |
[Ω] |
[F] |
| 0.1 |
0.0191 |
0.0128 |
2345 |
0.0101 |
21935 |
|
0.0166 |
0.0098 |
1141 |
0.0110 |
38210 |
| 0.2 |
0.0170 |
0.0083 |
1844 |
0.0080 |
19192 |
|
0.0160 |
0.0092 |
2314 |
0.0109 |
53291 |
| 0.3 |
0.0165 |
0.0106 |
2187 |
0.0101 |
29387 |
|
0.0155 |
0.0069 |
1735 |
0.0099 |
38424 |
| 0.4 |
0.0170 |
0.0106 |
1833 |
0.0069 |
36820 |
|
0.0152 |
0.0068 |
1847 |
0.0068 |
34442 |
| 0.5 |
0.0173 |
0.0077 |
1408 |
0.0063 |
30551 |
|
0.0152 |
0.0093 |
2521 |
0.0082 |
49947 |
| 0.6 |
0.0174 |
0.0073 |
1192 |
0.0121 |
35108 |
|
0.0154 |
0.0084 |
2256 |
0.0075 |
45617 |
| 0.7 |
0.0173 |
0.0085 |
1375 |
0.0193 |
24324 |
|
0.0155 |
0.0073 |
1505 |
0.0046 |
36110 |
| 0.8 |
0.0179 |
0.0106 |
1953 |
0.0125 |
19786 |
|
0.0161 |
0.0110 |
1623 |
0.0052 |
43433 |
| 0.9 |
0.0184 |
0.0106 |
1874 |
0.0056 |
90703 |
|
0.0148 |
0.0144 |
2441 |
0.0116 |
63415 |
| |
Tc°C
|
| |
Discharge |
|
Charge |
| SoC |
Rs |
R1 |
C1 |
R2 |
C2 |
|
Rs |
R1 |
C1 |
R2 |
C2 |
| |
[Ω] |
[Ω] |
[F] |
[Ω] |
[F] |
|
[Ω] |
[Ω] |
[F] |
[Ω] |
[F] |
| 0.1 |
0.0141 |
0.0169 |
2955 |
0.0086 |
162380 |
|
0.0121 |
0.0088 |
1084 |
0.0203 |
40517 |
| 0.2 |
0.0132 |
0.0094 |
2871 |
0.0052 |
184930 |
|
0.0134 |
0.0076 |
2574 |
0.0142 |
78985 |
| 0.3 |
0.0135 |
0.0092 |
3330 |
0.0045 |
178230 |
|
0.0133 |
0.0044 |
1921 |
0.0121 |
34480 |
| 0.4 |
0.0137 |
0.0101 |
2264 |
0.0033 |
133110 |
|
0.0132 |
0.0035 |
1918 |
0.0063 |
21319 |
| 0.5 |
0.0132 |
0.0082 |
1705 |
0.0031 |
90442 |
|
0.0130 |
0.0046 |
2800 |
0.0059 |
24030 |
| 0.6 |
0.0130 |
0.0068 |
1995 |
0.0054 |
63078 |
|
0.0131 |
0.0040 |
2360 |
0.0050 |
20253 |
| 0.7 |
0.0130 |
0.0094 |
2733 |
0.0079 |
48266 |
|
0.0132 |
0.0033 |
2042 |
0.0038 |
17394 |
| 0.8 |
0.0142 |
0.0085 |
2367 |
0.0051 |
55187 |
|
0.0135 |
0.0046 |
2425 |
0.0050 |
16172 |
| 0.9 |
0.0138 |
0.0074 |
1858 |
0.0044 |
104600 |
|
0.0124 |
0.0063 |
2394 |
0.0096 |
15963 |
Table A2.
The ECM parameters for the P28B cell model.
Table A2.
The ECM parameters for the P28B cell model.
| |
Tc°C |
| |
Discharge |
|
Charge |
| SoC |
Rs |
R1 |
C1 |
R2 |
C2 |
|
Rs |
R1 |
C1 |
R2 |
C2 |
| |
[Ω] |
[Ω] |
[F] |
[Ω] |
[F] |
|
[Ω] |
[Ω] |
[F] |
[Ω] |
[F] |
| 0.1 |
0.0307 |
0.0269 |
1037 |
0.0222 |
16531 |
|
0.0312 |
0.0194 |
706 |
0.0409 |
16162 |
| 0.2 |
0.0273 |
0.0220 |
1333 |
0.0262 |
31633 |
|
0.0290 |
0.0168 |
930 |
0.0295 |
15259 |
| 0.3 |
0.0271 |
0.0227 |
1208 |
0.0227 |
33162 |
|
0.0264 |
0.0139 |
931 |
0.0114 |
19789 |
| 0.4 |
0.0279 |
0.0197 |
915 |
0.0157 |
25628 |
|
0.0235 |
0.0135 |
932 |
0.0114 |
19789 |
| 0.5 |
0.0276 |
0.0166 |
657 |
0.0136 |
17738 |
|
0.0220 |
0.0185 |
921 |
0.0164 |
28506 |
| 0.6 |
0.0207 |
0.0143 |
581 |
0.0197 |
13993 |
|
0.0206 |
0.0212 |
1121 |
0.0198 |
34355 |
| 0.7 |
0.0289 |
0.0137 |
744 |
0.0367 |
12739 |
|
0.0192 |
0.0175 |
1338 |
0.0114 |
19324 |
| 0.8 |
0.0329 |
0.0214 |
911 |
0.0528 |
9585 |
|
0.0179 |
0.0190 |
1303 |
0.0150 |
17600 |
| 0.9 |
0.0345 |
0.0230 |
817 |
0.0334 |
14201 |
|
0.0166 |
0.0185 |
1206 |
0.0160 |
21537 |
| |
Tc°C
|
| |
Discharge |
|
Charge |
| SoC |
Rs |
R1 |
C1 |
R2 |
C2 |
|
Rs |
R1 |
C1 |
R2 |
C2 |
| |
[Ω] |
[Ω] |
[F] |
[Ω] |
[F] |
|
[Ω] |
[Ω] |
[F] |
[Ω] |
[F] |
| 0.1 |
0.0178 |
0.0190 |
2365 |
0.0105 |
46810 |
|
0.0161 |
0.0110 |
1094 |
0.0203 |
23947 |
| 0.2 |
0.0161 |
0.0102 |
1757 |
0.0078 |
27662 |
|
0.0155 |
0.0113 |
2165 |
0.0185 |
44449 |
| 0.3 |
0.0159 |
0.0106 |
2445 |
0.0104 |
34794 |
|
0.0147 |
0.0071 |
1525 |
0.0123 |
29553 |
| 0.4 |
0.0162 |
0.0112 |
1950 |
0.0071 |
42074 |
|
0.0142 |
0.0065 |
1385 |
0.0077 |
25390 |
| 0.5 |
0.0163 |
0.0082 |
1328 |
0.0060 |
37689 |
|
0.0139 |
0.0095 |
1699 |
0.0084 |
37180 |
| 0.6 |
0.0164 |
0.0083 |
1039 |
0.0115 |
35216 |
|
0.0137 |
0.0099 |
1510 |
0.0085 |
37336 |
| 0.7 |
0.0171 |
0.0073 |
1779 |
0.0202 |
23936 |
|
0.0138 |
0.0080 |
1058 |
0.0052 |
26508 |
| 0.8 |
0.0177 |
0.0135 |
1339 |
0.0146 |
16296 |
|
0.0138 |
0.0118 |
1304 |
0.0061 |
33520 |
| 0.9 |
0.0181 |
0.0114 |
1615 |
0.0067 |
59597 |
|
0.0158 |
0.0130 |
2103 |
0.0120 |
47036 |
| |
Tc°C
|
| |
Discharge |
|
Charge |
| SoC |
Rs |
R1 |
C1 |
R2 |
C2 |
|
Rs |
R1 |
C1 |
R2 |
C2 |
| |
[Ω] |
[Ω] |
[F] |
[Ω] |
[F] |
|
[Ω] |
[Ω] |
[F] |
[Ω] |
[F] |
| 0.1 |
0.0126 |
0.0161 |
2360 |
0.0084 |
142620 |
|
0.0120 |
0.0091 |
1243 |
0.0143 |
32013 |
| 0.2 |
0.0111 |
0.0095 |
1792 |
0.0047 |
104860 |
|
0.0116 |
0.0075 |
2534 |
0.0092 |
75070 |
| 0.3 |
0.0111 |
0.0086 |
2315 |
0.0046 |
71871 |
|
0.0116 |
0.0055 |
2529 |
0.0112 |
59639 |
| 0.4 |
0.0119 |
0.0076 |
2389 |
0.0048 |
50264 |
|
0.0112 |
0.0047 |
2021 |
0.0060 |
41868 |
| 0.5 |
0.0125 |
0.0052 |
1959 |
0.0050 |
43107 |
|
0.0106 |
0.0068 |
2819 |
0.0047 |
53780 |
| 0.6 |
0.125 |
0.0051 |
2382 |
0.0094 |
43637 |
|
0.0100 |
0.0080 |
2985 |
0.0053 |
78268 |
| 0.7 |
0.0127 |
0.0083 |
3214 |
0.0138 |
38551 |
|
0.0110 |
0.0062 |
1864 |
0.0033 |
111810 |
| 0.8 |
0.0130 |
0.0092 |
2863 |
0.0091 |
85219 |
|
0.0114 |
0.0084 |
2512 |
0.0046 |
136800 |
| 0.9 |
0.0132 |
0.0071 |
2231 |
0.0056 |
93891 |
|
0.0116 |
0.0116 |
2404 |
0.0073 |
74297 |
Table A3.
The ECM parameters for the P30B cell model.
Table A3.
The ECM parameters for the P30B cell model.
| |
Tc°C |
| |
Discharge |
|
Charge |
| SoC |
Rs |
R1 |
C1 |
R2 |
C2 |
|
Rs |
R1 |
C1 |
R2 |
C2 |
| |
[Ω] |
[Ω] |
[F] |
[Ω] |
[F] |
|
[Ω] |
[Ω] |
[F] |
[Ω] |
[F] |
| 0.1 |
0.0238 |
0.0311 |
1356 |
0.0406 |
26412 |
|
0.0228 |
0.0795 |
4076 |
0.0190 |
50626 |
| 0.2 |
0.0189 |
0.0218 |
1160 |
0.0231 |
26096 |
|
0.0207 |
0.0606 |
4832 |
0.0319 |
60550 |
| 0.3 |
0.0176 |
0.0211 |
1146 |
0.0274 |
24765 |
|
0.0174 |
0.0179 |
1907 |
0.0353 |
57155 |
| 0.4 |
0.0175 |
0.0211 |
1011 |
0.0295 |
23330 |
|
0.0142 |
0.0116 |
1858 |
0.0184 |
29798 |
| 0.5 |
0.0177 |
0.0188 |
824 |
0.0202 |
15980 |
|
0.0140 |
0.0134 |
1026 |
0.0110 |
19511 |
| 0.6 |
0.0180 |
0.0135 |
652 |
0.0200 |
10938 |
|
0.0137 |
0.0158 |
831 |
0.0128 |
28351 |
| 0.7 |
0.0188 |
0.0147 |
742 |
0.0373 |
10167 |
|
0.0135 |
0.0203 |
965 |
0.0170 |
38968 |
| 0.8 |
0.0213 |
0.0236 |
1197 |
0.0512 |
16595 |
|
0.0137 |
0.0173 |
938 |
0.0089 |
34889 |
| 0.9 |
0.0224 |
0.0244 |
1100 |
0.0202 |
27749 |
|
0.0145 |
0.0280 |
1012 |
0.0135 |
47824 |
| |
Tc°C
|
| |
Discharge |
|
Charge |
| SoC |
Rs |
R1 |
C1 |
R2 |
C2 |
|
Rs |
R1 |
C1 |
R2 |
C2 |
| |
[Ω] |
[Ω] |
[F] |
[Ω] |
[F] |
|
[Ω] |
[Ω] |
[F] |
[Ω] |
[F] |
| 0.1 |
0.0170 |
0.0394 |
1760 |
0.0255 |
49984 |
|
0.0114 |
0.0345 |
2178 |
0.0144 |
62725 |
| 0.2 |
0.0118 |
0.0179 |
1731 |
0.0115 |
64108 |
|
0.0106 |
0.0164 |
1909 |
0.0338 |
48519 |
| 0.3 |
0.0110 |
0.0130 |
1302 |
0.0083 |
43164 |
|
0.0096 |
0.0064 |
1763 |
0.0209 |
23110 |
| 0.4 |
0.0105 |
0.0110 |
1239 |
0.0082 |
29060 |
|
0.0094 |
0.0041 |
1100 |
0.0106 |
11786 |
| 0.5 |
0.0116 |
0.0108 |
1862 |
0.0090 |
19562 |
|
0.0094 |
0.0046 |
1170 |
0.0078 |
11054 |
| 0.6 |
0.0119 |
0.0078 |
1297 |
0.0076 |
16602 |
|
0.0093 |
0.0068 |
1062 |
0.0101 |
16393 |
| 0.7 |
0.0120 |
0.0086 |
1273 |
0.0138 |
26587 |
|
0.0095 |
0.0060 |
1109 |
0.0087 |
14093 |
| 0.8 |
0.0127 |
0.0128 |
2017 |
0.0168 |
21666 |
|
0.0096 |
0.0054 |
1227 |
0.0075 |
7982 |
| 0.9 |
0.0127 |
0.0125 |
1652 |
0.0069 |
95862 |
|
0.0103 |
0.0088 |
1371 |
0.0132 |
10814 |
| |
Tc°C
|
| |
Discharge |
|
Charge |
| SoC |
Rs |
R1 |
C1 |
R2 |
C2 |
|
Rs |
R1 |
C1 |
R2 |
C2 |
| |
[Ω] |
[Ω] |
[F] |
[Ω] |
[F] |
|
[Ω] |
[Ω] |
[F] |
[Ω] |
[F] |
| 0.1 |
0.0110 |
0.0274 |
6336 |
0.0309 |
57321 |
|
0.0090 |
0.0160 |
1332 |
0.0651 |
14153 |
| 0.2 |
0.0093 |
0.0131 |
3732 |
0.0141 |
105080 |
|
0.0081 |
0.0077 |
1708 |
0.0662 |
14516 |
| 0.3 |
0.0087 |
0.0103 |
2516 |
0.0095 |
124580 |
|
0.0076 |
0.0037 |
1253 |
0.0245 |
26619 |
| 0.4 |
0.0080 |
0.0083 |
1943 |
0.0064 |
130980 |
|
0.0076 |
0.0045 |
900 |
0.0125 |
39521 |
| 0.5 |
0.0084 |
0.0095 |
2198 |
0.0043 |
90444 |
|
0.0076 |
0.0061 |
1006 |
0.0115 |
58670 |
| 0.6 |
0.0092 |
0.0068 |
2204 |
0.0066 |
75590 |
|
0.0077 |
0.0070 |
1493 |
0.0081 |
37061 |
| 0.7 |
0.0093 |
0.0070 |
2610 |
0.0066 |
78856 |
|
0.0078 |
0.0054 |
1540 |
0.0081 |
37061 |
| 0.8 |
0.0095 |
0.0102 |
3046 |
0.0073 |
75567 |
|
0.0080 |
0.0045 |
1549 |
0.0053 |
36016 |
| 0.9 |
0.0095 |
0.0077 |
2187 |
0.0054 |
129950 |
|
0.0083 |
0.0083 |
2227 |
0.0081 |
50669 |
Table A4.
The ECM parameters for the VTC5D cell model.
Table A4.
The ECM parameters for the VTC5D cell model.
| |
Tc°C |
| |
Discharge |
|
Charge |
| SoC |
Rs |
R1 |
C1 |
R2 |
C2 |
|
Rs |
R1 |
C1 |
R2 |
C2 |
| |
[Ω] |
[Ω] |
[F] |
[Ω] |
[F] |
|
[Ω] |
[Ω] |
[F] |
[Ω] |
[F] |
| 0.1 |
0.0265 |
0.0330 |
1125 |
0.0271 |
11198 |
|
0.0291 |
0.0219 |
658 |
0.0450 |
8029 |
| 0.2 |
0.0249 |
0.0188 |
1367 |
0.0154 |
15964 |
|
0.0266 |
0.0067 |
768 |
0.0324 |
3196 |
| 0.3 |
0.0238 |
0.0215 |
1650 |
0.0197 |
25405 |
|
0.0232 |
0.0073 |
804 |
0.0168 |
5071 |
| 0.4 |
0.0235 |
0.0243 |
1814 |
0.0218 |
31775 |
|
0.0216 |
0.0066 |
1080 |
0.0144 |
5541 |
| 0.5 |
0.0238 |
0.0206 |
1440 |
0.0149 |
30667 |
|
0.0216 |
0.0096 |
962 |
0.0211 |
6901 |
| 0.6 |
0.0243 |
0.0173 |
1222 |
0.0151 |
30607 |
|
0.0218 |
0.0117 |
647 |
0.0214 |
7393 |
| 0.7 |
0.0254 |
0.0159 |
1552 |
0.0287 |
26171 |
|
0.0227 |
0.0121 |
818 |
0.0128 |
6113 |
| 0.8 |
0.0273 |
0.0259 |
1767 |
0.0387 |
20423 |
|
0.0264 |
0.0160 |
1208 |
0.0145 |
8581 |
| 0.9 |
0.0294 |
0.0259 |
1251 |
0.0154 |
34463 |
|
0.0402 |
0.0245 |
2300 |
0.0450 |
17704 |
| |
Tc°C
|
| |
Discharge |
|
Charge |
| SoC |
Rs |
R1 |
C1 |
R2 |
C2 |
|
Rs |
R1 |
C1 |
R2 |
C2 |
| |
[Ω] |
[Ω] |
[F] |
[Ω] |
[F] |
|
[Ω] |
[Ω] |
[F] |
[Ω] |
[F] |
| 0.1 |
0.0227 |
0.0165 |
2772 |
0.0123 |
15823 |
|
0.0163 |
0.0358 |
2089 |
0.0175 |
62603 |
| 0.2 |
0.0176 |
0.0089 |
1832 |
0.0066 |
19355 |
|
0.0154 |
0.0133 |
2257 |
0.0234 |
51085 |
| 0.3 |
0.0158 |
0.0105 |
1741 |
0.0078 |
17670 |
|
0.0147 |
0.0106 |
1727 |
0.0230 |
24814 |
| 0.4 |
0.0151 |
0.0123 |
1760 |
0.0092 |
17286 |
|
0.0144 |
0.0070 |
1581 |
0.0118 |
15220 |
| 0.5 |
0.0156 |
0.0086 |
1208 |
0.0097 |
13320 |
|
0.0144 |
0.0082 |
1632 |
0.0103 |
16589 |
| 0.6 |
0.0160 |
0.0079 |
1198 |
0.0186 |
17363 |
|
0.0146 |
0.0084 |
1337 |
0.0094 |
16235 |
| 0.7 |
0.0160 |
0.0114 |
1898 |
0.0259 |
24139 |
|
0.0150 |
0.0080 |
1328 |
0.0057 |
14737 |
| 0.8 |
0.0167 |
0.0146 |
2295 |
0.0157 |
18389 |
|
0.0158 |
0.0115 |
1324 |
0.0058 |
21896 |
| 0.9 |
0.0174 |
0.0127 |
1965 |
0.0061 |
37337 |
|
0.0137 |
0.0197 |
1617 |
0.0121 |
41477 |
| |
Tc°C
|
| |
Discharge |
|
Charge |
| SoC |
Rs |
R1 |
C1 |
R2 |
C2 |
|
Rs |
R1 |
C1 |
R2 |
C2 |
| |
[Ω] |
[Ω] |
[F] |
[Ω] |
[F] |
|
[Ω] |
[Ω] |
[F] |
[Ω] |
[F] |
| 0.1 |
0.0150 |
0.0184 |
2727 |
0.0086 |
80205 |
|
0.0116 |
0.0193 |
1153 |
0.0372 |
18047 |
| 0.2 |
0.0138 |
0.0093 |
2013 |
0.0043 |
44757 |
|
0.0117 |
0.0099 |
1311 |
0.0184 |
40515 |
| 0.3 |
0.0127 |
0.0083 |
1614 |
0.0041 |
30351 |
|
0.0120 |
0.0078 |
1806 |
0.0160 |
55242 |
| 0.4 |
0.0124 |
0.0089 |
1788 |
0.0060 |
20576 |
|
0.0123 |
0.0069 |
1619 |
0.0083 |
45626 |
| 0.5 |
0.0133 |
0.0063 |
1975 |
0.0066 |
16017 |
|
0.0122 |
0.0084 |
1929 |
0.0078 |
38101 |
| 0.6 |
0.0133 |
0.0057 |
2361 |
0.0062 |
21600 |
|
0.0123 |
0.0068 |
1826 |
0.0065 |
32643 |
| 0.7 |
0.0134 |
0.0090 |
3291 |
0.0090 |
31691 |
|
0.0127 |
0.0060 |
1701 |
0.0040 |
34223 |
| 0.8 |
0.0137 |
0.0096 |
2348 |
0.0056 |
21288 |
|
0.0131 |
0.0083 |
1671 |
0.0044 |
39989 |
| 0.9 |
0.0141 |
0.0058 |
2081 |
0.0039 |
10820 |
|
0.0116 |
0.0142 |
1904 |
0.0087 |
61896 |
References
- Bashir, T.; Ismail, S.A.; Song, Y.; Irfan, R.M.; Yang, S.; Zhou, S.; Zhaou, J.; Gao, L. A review of the energy storage aspects of chemical elements for lithium-ion based batteries. Energy Materials 2021, 1, 100019. [Google Scholar] [CrossRef]
- Kumar, R.; Goel, V. A study on thermal management system of lithium-ion batteries for electrical vehicles: A critical review. Journal of Energy Storage 2023, 71, 108025. [Google Scholar] [CrossRef]
- Abdalla, A.M.; Abdullah, M.F.; Dawood, M.K.; Wei, B.; Subramanian, Y.; Azad, A.T.; Nourin, S.; Afroze, S.; Taweekun, J.; Azad, A.K. Innovative lithium-ion battery recycling: Sustainable process for recovery of critical materials from lithium-ion batteries. Journal of Energy Storage 2023, 67, 107551. [Google Scholar] [CrossRef]
- Jaguemont, J.; Boulon, L.; Dubé, Y. A comprehensive review of lithium-ion batteries used in hybrid and electric vehicles at cold temperatures. Applied Energy 2016, 164, 99–114. [Google Scholar] [CrossRef]
- Adaikkappan, M.; Sathiyamoorthy, N. Modeling, state of charge estimation, and charging of lithium-ion battery in electric vehicle: A review. International Journal of Energy Research 2022, 46, 2141–2165. [Google Scholar] [CrossRef]
- Barcellona, S.; Piegari, L. Lithium Ion Battery Models and Parameter Identification Techniques. Energies 2017, 10. [Google Scholar] [CrossRef]
- Ekström, H.; Fridholm, B.; Lindbergh, G. Comparison of lumped diffusion models for voltage prediction of a lithium-ion battery cell during dynamic loads. Journal of Power Sources 2018, 402, 296–300. [Google Scholar] [CrossRef]
- Jackey, R.; Saginaw, M.; Sanghvi, P.; Gazzarri, J.; Huria, T.; Ceraolo, M. Battery Model Parameter Estimation Using a Layered Technique: An Example Using a Lithium Iron Phosphate Cell. SAE Technical Paper 2013, 1547. [Google Scholar] [CrossRef]
- Akbarzadeh, M.; Kalogiannis, T.; Jaguemont, J.; He, J.; Jin, L.; Berecibar, M.; Van Mierlo, J. Thermal modeling of a high-energy prismatic lithium-ion battery cell and module based on a new thermal characterization methodology. Journal of Energy Storage 2020, 32, 101707. [Google Scholar] [CrossRef]
- Tran, M.K.; DaCosta, A.; Mevawalla, A.; Panchal, S.; Fowler, M. Comparative Study of Equivalent Circuit Models Performance in Four Common Lithium-Ion Batteries: LFP, NMC, LMO, NCA. Batteries 2021, 7. [Google Scholar] [CrossRef]
- Hua, X.; Zhang, C.; Offer, G. Finding a better fit for lithium ion batteries: A simple, novel, load dependent, modified equivalent circuit model and parameterization method. Journal of Power Sources 2021, 484, 229117. [Google Scholar] [CrossRef]
- Lin, X.; Perez, H.E.; Mohan, S.; Siegel, J.B.; Stefanopoulou, A.G.; Ding, Y.; Castanier, M.P. A lumped-parameter electro-thermal model for cylindrical batteries. Journal of Power Sources 2014, 257, 1–11. [Google Scholar] [CrossRef]
- Madani, S.S.; Schaltz, E.; Knudsen Kær, S. Review of Parameter Determination for Thermal Modeling of Lithium Ion Batteries. Batteries 2018, 4. [Google Scholar] [CrossRef]
- Chin, C.; Gao, Z.; Zhang, C. Comprehensive electro-thermal model of 26650 lithium battery for discharge cycle under parametric and temperature variations. Journal of Energy Storage 2020, 28, 101222. [Google Scholar] [CrossRef]
- Forgez, C.; Vinh Do, D.; Friedrich, G.; Morcrette, M.; Delacourt, C. Thermal modeling of a cylindrical LiFePO4/graphite lithium-ion battery. Journal of Power Sources 2010, 195, 2961–2968. [Google Scholar] [CrossRef]
- Asus, Z.; Aglzim, E.H.; Chrenko, D.; Daud, Z.H.C.; Le Moyne, L. Dynamic Modeling and Driving Cycle Prediction for a Racing Series Hybrid Car. IEEE Journal of Emerging and Selected Topics in Power Electronics 2014, 2, 541–551. [Google Scholar] [CrossRef]
- Mattarelli, E.; Rinaldini, C.A.; Scrignoli, F.; Mangeruga, V. Development of a Hybrid Power Unit for Formula SAE Application: ICE CFD-1D Optimization and Vehicle Lap Simulation. 14th International Conference on Engines & Vehicles. SAE International, 2019. [CrossRef]
- Conceptual Design of a Formula Hybrid Powertrain System Utilizing Functionality-Based Modeling Tools, Vol. Volume 5: 22nd International Conference on Design Theory and Methodology; Special Conference on Mechanical Vibration and Noise, International Design Engineering Technical Conferences and Computers and Information in Engineering Conference, 2010. [CrossRef]
- Muenzel, V.; Hollenkamp, A.F.; Bhatt, A.I.; de Hoog, J.; Brazil, M.; Thomas, D.A.; Mareels, I. A Comparative Testing Study of Commercial 18650-Format Lithium-Ion Battery Cells. Journal of The Electrochemical Society 2015, 162, A1592. [Google Scholar] [CrossRef]
- Braco, E.; San Martín, I.; Berrueta, A.; Sanchis, P.; Ursúa, A. Experimental assessment of cycling ageing of lithium-ion second-life batteries from electric vehicles. Journal of Energy Storage 2020, 32, 101695. [Google Scholar] [CrossRef]
- Waldmann, T.; Scurtu, R.G.; Richter, K.; Wohlfahrt-Mehrens, M. 18650 vs. 21700 Li-ion cells – A direct comparison of electrochemical, thermal, and geometrical properties. Journal of Power Sources 2020, 472, 228614. [Google Scholar] [CrossRef]
- Mulpuri, S.K.; Sah, B.; Kumar, P. Protocol for conducting advanced cyclic tests in lithium-ion batteries to estimate capacity fade. STAR Protocols 2024, 5, 102938. [Google Scholar] [CrossRef]
- Baumhöfer, T.; Brühl, M.; Rothgang, S.; Sauer, D.U. Production caused variation in capacity aging trend and correlation to initial cell performance. Journal of Power Sources 2014, 247, 332–338. [Google Scholar] [CrossRef]
- Soto, A.; Berrueta, A.; Sanchis, P.; Ursúa, A. Analysis of the main battery characterization techniques and experimental comparison of commercial 18650 Li-ion cells. 2019 IEEE International Conference on Environment and Electrical Engineering and 2019 IEEE Industrial and Commercial Power Systems Europe (EEEIC / I & CPS Europe), 2019, pp. 1–6. [CrossRef]
- Ren, Z.; Du, C.; Wu, Z.; Shao, J.; Deng, W. A comparative study of the influence of different open circuit voltage tests on model-based state of charge estimation for lithium-ion batteries. International Journal of Energy Research 2021, 45, 13692–13711. [Google Scholar] [CrossRef]
- Pillai, P.; Sundaresan, S.; Kumar, P.; Pattipati, K.R.; Balasingam, B. Open-Circuit Voltage Models for Battery Management Systems: A Review. Energies 2022, 15. [Google Scholar] [CrossRef]
- Pillai, P.; Nguyen, J.; Balasingam, B. Performance Analysis of Empirical Open-Circuit Voltage Modeling in Lithium-ion Batteries, Part-2: Data Collection Procedure. IEEE Transactions on Transportation Electrification. [CrossRef]
- Baronti, F.; Zamboni, W.; Roncella, R.; Saletti, R.; Spagnuolo, G. Open-circuit voltage measurement of Lithium-Iron-Phosphate batteries. 2015 IEEE International Instrumentation and Measurement Technology Conference (I2MTC) Proceedings, 2015, pp. 1711–1716. [CrossRef]
- Pan, H.; Lü, Z.; Lin, W.; Li, J.; Chen, L. State of charge estimation of lithium-ion batteries using a grey extended Kalman filter and a novel open-circuit voltage model. Energy 2017, 138, 764–775. [Google Scholar] [CrossRef]
- Samieian, M.A.; Hales, A.; Patel, Y. A Novel Experimental Technique for Use in Fast Parameterisation of Equivalent Circuit Models for Lithium-Ion Batteries. Batteries 2022, 8. [Google Scholar] [CrossRef]
- Zhang, X.F.; Zhao, Y.; Patel, Y.; Zhang, T.; Liu, W.M.; Chen, M.; Offer, G.J.; Yan, Y. Potentiometric measurement of entropy change for lithium batteries. Phys. Chem. Chem. Phys. 2017, 19, 9833–9842. [Google Scholar] [CrossRef]
- Eddahech, A.; Briat, O.; Vinassa, J.M. Thermal characterization of a high-power lithium-ion battery: Potentiometric and calorimetric measurement of entropy changes. Energy 2013, 61, 432–439. [Google Scholar] [CrossRef]
- Geng, Z.; Groot, J.; Thiringer, T. A Time- and Cost-Effective Method for Entropic Coefficient Determination of a Large Commercial Battery Cell. IEEE Transactions on Transportation Electrification 2020, 6, 257–266. [Google Scholar] [CrossRef]
- Xiao, M.; Choe, S.Y. Theoretical and experimental analysis of heat generations of a pouch type LiMn2O4/carbon high power Li-polymer battery. Journal of Power Sources 2013, 241, 46–55. [Google Scholar] [CrossRef]
- Damay, N.; Forgez, C.; Bichat, M.P.; Friedrich, G. A method for the fast estimation of a battery entropy-variation high-resolution curve – Application on a commercial LiFePO4/graphite cell. Journal of Power Sources 2016, 332, 149–153. [Google Scholar] [CrossRef]
- Schmidt, J.P.; Weber, A.; Ivers-Tiffée, E. A novel and precise measuring method for the entropy of lithium-ion cells: ΔS via electrothermal impedance spectroscopy. Electrochimica Acta 2014, 137, 311–319. [Google Scholar] [CrossRef]
- Hudak, N.S.; Davis, L.E.; Nagasubramanian, G. Cycling-Induced Changes in the Entropy Profiles of Lithium Cobalt Oxide Electrodes. Journal of The Electrochemical Society 2014, 162, A315. [Google Scholar] [CrossRef]
- Lin, Z.; Wu, D.; Du, C.; Ren, Z. An improved potentiometric method for the measurement of entropy coefficient of lithium-ion battery based on positive adjustment. Energy Reports 2022, 8, 54–63. [Google Scholar] [CrossRef]
- Zhao, W.; Rohde, M.; Mohsin, I.U.; Ziebert, C.; Seifert, H.J. Heat Generation in NMC622 Coin Cells during Electrochemical Cycling: Separation of Reversible and Irreversible Heat Effects. Batteries 2020, 6. [Google Scholar] [CrossRef]
- Vertiz, G.; Oyarbide, M.; Macicior, H.; Miguel, O.; Cantero, I.; Fernandez de Arroiabe, P.; Ulacia, I. Thermal characterization of large size lithium-ion pouch cell based on 1d electro-thermal model. Journal of Power Sources 2014, 272, 476–484. [Google Scholar] [CrossRef]
- Sheng, L.; Su, L.; Zhang, H. Experimental determination on thermal parameters of prismatic lithium ion battery cells. International Journal of Heat and Mass Transfer 2019, 139, 231–239. [Google Scholar] [CrossRef]
- Cao, R.; Zhang, X.; Yang, H.; Wang, C. Experimental study on heat generation characteristics of lithium-ion batteries using a forced convection calorimetry method. Applied Thermal Engineering 2023, 219, 119559. [Google Scholar] [CrossRef]
- Tahir, M.W.; Merten, C. Multi-scale thermal modeling, experimental validation, and thermal characterization of a high-power lithium-ion cell for automobile application. Energy Conversion and Management 2022, 258, 115490. [Google Scholar] [CrossRef]
- E, J.; Yue, M.; Chen, J.; Zhu, H.; Deng, Y.; Zhu, Y.; Zhang, F.; Wen, M.; Zhang, B.; Kang, S. Effects of the different air cooling strategies on cooling performance of a lithium-ion battery module with baffle. Applied Thermal Engineering 2018, 144, 231–241. [Google Scholar] [CrossRef]
- Nie, P.; Zhang, S.W.; Ran, A.; Yang, C.; Chen, S.; Li, Z.; Zhang, X.; Deng, W.; Liu, T.; Kang, F.; Wei, G. Full-cycle electrochemical-thermal coupling analysis for commercial lithium-ion batteries. Applied Thermal Engineering 2021, 184, 116258. [Google Scholar] [CrossRef]
- Al-Zareer, M.; Ebbs-Picken, T.; Michalak, A.; Escobar, C.; Da Silva, C.M.; Davis, T.; Osio, I.; Amon, C.H. Heat generation rates and anisotropic thermophysical properties of cylindrical lithium-ion battery cells with different terminal mounting configurations. Applied Thermal Engineering 2023, 223, 119990. [Google Scholar] [CrossRef]
- Samad, N.A.; Wang, B.; Siegel, J.B.; Stefanopoulou, A.G. Parameterization of Battery Electrothermal Models Coupled With Finite Element Flow Models for Cooling. Journal of Dynamic Systems, Measurement, and Control 2017, 139, 071003. [Google Scholar] [CrossRef]
- Lin, X.; Perez, H.E.; Siegel, J.B.; Stefanopoulou, A.G.; Li, Y.; Anderson, R.D.; Ding, Y.; Castanier, M.P. Online Parameterization of Lumped Thermal Dynamics in Cylindrical Lithium Ion Batteries for Core Temperature Estimation and Health Monitoring. IEEE Transactions on Control Systems Technology 2013, 21, 1745–1755. [Google Scholar] [CrossRef]
- Farag, M.; Sweity, H.; Fleckenstein, M.; Habibi, S. Combined electrochemical, heat generation, and thermal model for large prismatic lithium-ion batteries in real-time applications. Journal of Power Sources 2017, 360, 618–633. [Google Scholar] [CrossRef]
- Bryden, T.S.; Dimitrov, B.; Hilton, G.; Ponce de León, C.; Bugryniec, P.; Brown, S.; Cumming, D.; Cruden, A. Methodology to determine the heat capacity of lithium-ion cells. Journal of Power Sources 2018, 395, 369–378. [Google Scholar] [CrossRef]
- Battery Data: Center for Advanced Life Cycle Engingeering (CALCE), University of Maryland, 2016. https://calce.umd.edu/battery-data#Storage [Accessed: 1 February 2024].
Figure 1.
Equivalent circuit model diagram for a cylindrical Li-ion cell.
Figure 1.
Equivalent circuit model diagram for a cylindrical Li-ion cell.
Figure 2.
Thermal array scheme for a cylindrical Li-ion cell.
Figure 2.
Thermal array scheme for a cylindrical Li-ion cell.
Figure 3.
The four cells tested: from left to right, Molicel P28A, P28B, P30B, and Sony Murata VTC5D.
Figure 3.
The four cells tested: from left to right, Molicel P28A, P28B, P30B, and Sony Murata VTC5D.
Figure 4.
The experimental set-up used at FIAMM lab consisting of (left to right): two cell holders, a thermal chamber, two cell cycler sets, a thermocouple array with data logger, a control and data processing pc.
Figure 4.
The experimental set-up used at FIAMM lab consisting of (left to right): two cell holders, a thermal chamber, two cell cycler sets, a thermocouple array with data logger, a control and data processing pc.
Figure 5.
OCV vs SoC curves of the tested cells, obtained as averages in charge and discharge tests performed at C/20 current.
Figure 5.
OCV vs SoC curves of the tested cells, obtained as averages in charge and discharge tests performed at C/20 current.
Figure 6.
Experimental and fitted fata for of the discharge GITT test for the P28B cell at 25 °C.
Figure 6.
Experimental and fitted fata for of the discharge GITT test for the P28B cell at 25 °C.
Figure 7.
Positive Adjustment Method (PAM) applied on P30B cell, in order to measure the profile of the entropic contribution : a step shaped current load is applied to the cell to reach the desired measurement point. Then, after a relaxation time, a thermal cycle is applied.
Figure 7.
Positive Adjustment Method (PAM) applied on P30B cell, in order to measure the profile of the entropic contribution : a step shaped current load is applied to the cell to reach the desired measurement point. Then, after a relaxation time, a thermal cycle is applied.
Figure 8.
Measured OCV at various temperature and
SoC : for each
SoC, the slope of the interpolation line is the
term (
a); the
vs
for the P30B cell is reported in (
b), showing good agreement with previous data from literature [
38,
39] .
Figure 8.
Measured OCV at various temperature and
SoC : for each
SoC, the slope of the interpolation line is the
term (
a); the
vs
for the P30B cell is reported in (
b), showing good agreement with previous data from literature [
38,
39] .
Figure 9.
P28A cell thermal characterization tests: (a) low convective testing condition; (b) high convective testing condition. The experimental and the modelled cell surface temperatures are reported.
Figure 9.
P28A cell thermal characterization tests: (a) low convective testing condition; (b) high convective testing condition. The experimental and the modelled cell surface temperatures are reported.
Figure 10.
The results of BJDST validation profile: (a) show the current profile, (b) shows the modelled and experimental for the P28A cell, (c) for the P28B cell, (d) for the P30B and (e) for the VTC5D cell.
Figure 10.
The results of BJDST validation profile: (a) show the current profile, (b) shows the modelled and experimental for the P28A cell, (c) for the P28B cell, (d) for the P30B and (e) for the VTC5D cell.
Figure 11.
The results of FUDS validation profile: (a) show the current profile, (b) shows the modelled and experimental for the P28A cell, (c) for the P28B cell, (d) for the P30B and (e) for the VTC5D cell.
Figure 11.
The results of FUDS validation profile: (a) show the current profile, (b) shows the modelled and experimental for the P28A cell, (c) for the P28B cell, (d) for the P30B and (e) for the VTC5D cell.
Figure 12.
The results of NDC validation profile: (a) show the current profile, (b) shows the modelled and experimental for the P28A cell, (c) for the P28B cell, (d) for the P30B and (e) for the VTC5D cell.
Figure 12.
The results of NDC validation profile: (a) show the current profile, (b) shows the modelled and experimental for the P28A cell, (c) for the P28B cell, (d) for the P30B and (e) for the VTC5D cell.
Figure 13.
The results of HPL validation profile: (a) show the current profile, (b) shows the modelled and experimental and for the P28A cell, (c) for the P28B cell, (d) for the P30B and (e) for the VTC5D cell.
Figure 13.
The results of HPL validation profile: (a) show the current profile, (b) shows the modelled and experimental and for the P28A cell, (c) for the P28B cell, (d) for the P30B and (e) for the VTC5D cell.
Table 1.
Parameters for the tested cells (Manufacturers data-sheets).
Table 1.
Parameters for the tested cells (Manufacturers data-sheets).
| |
|
P28A |
P28B |
P30B |
VTC5D |
| Nominal capacity [mAh] |
2800 |
2800 |
3000 |
2800 |
| Minimum capacity [mAh] |
2600 |
2650 |
2900 |
2500 |
| Upper cut-off voltage [V] |
4.2 |
| Lower cut-off voltage [V] |
2.5 |
| Max. continuous discharge current [A] |
35 |
40 |
30 |
30 |
| Discharge temperature range [°C] |
-40/+60 |
-40/+60 |
-40/+60 |
-20/+60 |
| Internal resistance [m] |
20 |
21 |
17 |
n.r. |
| Size [mm] |
≈ 18.6, h ≈ 65.2 |
| Mass [g] |
46 |
48 |
47 |
44 |
Table 2.
Capacity of the tested cells at different C-rate discharge currents and temperatures. Shown values are the averages and deviation among three cells per type and five discharges per each cell
Table 2.
Capacity of the tested cells at different C-rate discharge currents and temperatures. Shown values are the averages and deviation among three cells per type and five discharges per each cell
| |
Temperature |
0.5C |
1C |
3C |
5C |
| |
[°C] |
[mAh] |
[mAh] |
[mAh] |
[mAh] |
| |
5 |
2656 ± 20 |
2575 ± 10 |
2541 ± 10 |
2562 ± 10 |
| P28A |
25 |
2747 ± 60 |
2685 ± 70 |
2620 ± 70 |
2606 ± 70 |
| |
40 |
2687 ± 30 |
2658 ± 20 |
2575 ± 20 |
2561 ± 30 |
| |
5 |
2527 ± 30 |
2490 ± 20 |
2459 ± 10 |
2477 ± 20 |
| P28B |
25 |
2720 ± 100 |
2670 ± 100 |
2581 ± 60 |
2567 ± 60 |
| |
40 |
2542 ± 30 |
2547 ± 20 |
2499 ± 30 |
2504 ± 80 |
| |
5 |
2825 ± 60 |
2747 ± 40 |
2710 ± 30 |
2810 ± 20 |
| P30B |
25 |
3041 ± 30 |
2943 ± 10 |
2915 ± 20 |
2908 ± 30 |
| |
40 |
3015 ± 40 |
2961 ± 20 |
2890 ± 10 |
2893 ± 10 |
| |
5 |
2712 ± 50 |
2616 ± 20 |
2568 ± 50 |
2578 ± 50 |
| VTC5D |
25 |
2861 ± 20 |
2791 ± 5 |
2685 ± 20 |
2668 ± 10 |
| |
40 |
2749 ± 50 |
2704 ± 40 |
2618 ± 60 |
2607 ± 40 |
Table 3.
The thermal model parameters obtained from the thermal characterization tests for the four tested cell models.
Table 3.
The thermal model parameters obtained from the thermal characterization tests for the four tested cell models.
| |
Cc
|
Rc
|
Ru1
|
Ru2
|
| |
[J/K] |
[K/W] |
[K/W] |
[K/W] |
| P28A |
56.3 |
0.41 |
6.02 |
1.07 |
| P28B |
55.7 |
0.24 |
5.54 |
2.49 |
| P30B |
70.2 |
0.10 |
4.94 |
0.80 |
| VTC5D |
68.6 |
0.15 |
5.54 |
1.90 |
Table 4.
The RMS for the validation profiles considered for the P28A, P28B, P30B and VTC5D cell.
Table 4.
The RMS for the validation profiles considered for the P28A, P28B, P30B and VTC5D cell.
| |
BJDST |
FUDS |
NDC |
HPL |
| |
RMSE, Vt |
RMSE, Vt |
RMSE, Vt |
RMSE, Vt |
RMSE, Ts |
| |
[mV] |
[mV] |
[mV] |
[mV] |
[°C] |
| P28A |
4.4 |
7.3 |
17.7 |
15.4 |
0.21 |
| P28B |
5.7 |
14.7 |
12.9 |
16.5 |
0.30 |
| P30B |
13.4 |
13.5 |
18.9 |
17.8 |
0.20 |
| VTC5D |
5.3 |
8.8 |
13.6 |
15.9 |
0.25 |
|
Disclaimer/Publisher’s Note: The statements, opinions and data contained in all publications are solely those of the individual author(s) and contributor(s) and not of MDPI and/or the editor(s). MDPI and/or the editor(s) disclaim responsibility for any injury to people or property resulting from any ideas, methods, instructions or products referred to in the content. |
© 2020 by the authors. Licensee MDPI, Basel, Switzerland. This article is an open access article distributed under the terms and conditions of the Creative Commons Attribution (CC BY) license (https://creativecommons.org/licenses/by/4.0/).
