1. Introduction
The construction industry is a significant world waste generator that concerns many academic, regulatory, policymakers, and professional agencies worldwide. Construction waste is a high-level concept behind poor productivity and low innovation levels in the industry, and it is considered challenging to measure systematically [
1]. Also, most developed policies are based on classic traditional management, rooted in economic theories that ignore how waste is internally produced and abstract the unit of time from the formula of modeling its generation [
2]. Established methodologies and policies in planning and control functions primarily influence the push-production mindset in decision-making and reactive problem-solving. This approach often leads to a significant portion of non-added activities (NVA). According to the meta-analysis of Horman & Kenley [
3], NVA constitutes 49.6% of construction operations. Other evidence confirms that non-value-adding activities account for more than half of all activities in a construction project [
4,
5]. The literature has widely investigated different types of NVA according to the classification offered by Taichii Ohno [
6], including rework [
7], product defects [
8], waiting [
9], transportation [
10], intuitional waste [
11], and the relation between production waste and environmental waste [
12,
13,
14]. This disparity in measuring and defining waste measures increases the difficulty of formulating holistic frameworks for waste elimination and hurdles efforts of providing general guidelines for root causes analysis [
15]. Additionally, many reported types of waste are measured empirically at an operational level or professional experience, which challenges a comprehensive judgment on the nature of generated wastes, and their relationships with other types of waste remain context-specific and lack generalization.
Incorporating best construction management theories and practices reduces construction waste [
16]. Lean construction (LC) philosophy embraces waste as the central concept in its principles, methods, techniques, and tools; LC establishes a modern understanding of the construction processes, breaking them down into Transformation, Flow, and Value, where the flow term is central in this philosophy where it expresses the construction processes by NVA and Value-Adding-Activities (VA) [
17]. A general definition of NVA is any activity that absorbs resources (e.g., time, location, material, energy, among others) without adding value to internal and external customers [
18]. Based on the waste analysis by Taiichi Ohno [
6], a waste list can be used throughout organizations as a communication and guidance tool to categorize waste into overproduction, overprocessing, inventory, transportation, movement, waiting, and defects. This list has been widely studied and adapted within the construction industry [
19]. Besides this list, Lauri Koskela revealed the eighth type of waste, “Making-Do,” in construction in 2004. Making-Do (MD) waste is a core production waste resulting from initiating processes, operations, tasks, or assignments without acquiring standard input of resources or proceeding with task execution [
20,
21]. MD is widespread across the construction supply chain (CSC) but is still not widely recognized in the literature [
22]. Whereas the inefficiency caused by MD within the construction industry, other sectors undervalue its importance [
23], and few incentives aim to counteract the prevalent MD culture.
The previous research findings explored MD root causes to articulate mitigation strategies to limit its’ negative impact. The published research investigated MD categorization, categorization, and quantification [
21,
24,
25,
26,
27], production planning and control measures [
16,
20,
28,
29,
30], quality management and control measures [
23,
31,
32], information communication technologies [
33,
34], and social empowerment [
35]. Despite the numerous benefits of these approaches to targeting MD, several challenges hinder its effectiveness and widespread adoption in the market. On significant factor contributing to this limitation is the lack of advanced production planning and control methods that enable various project stakeholders to plan and manage production efficiently [
36]. In particular, inadequate coordination between construction site reality and planning directives has been identified as a significant obstacle, resulting in improper capture and analysis of the production constraints. The last Planner system (LPS) aims to shield the downstream from upstream variability by utilizing dynamic socio-technical factors to plan the construction flow, enable pull production, and resolve constraints in formalized matter using the language of promises to communicate commitment actions [
37]. Accounting for variability and uncertainties in cycle times, the LPS functions provide a methodological approach to limit the number of informal work packages and the number of improvisation actions without consensus among different teams in the project. Information communication technologies are recommended to manage the production information and mitigate MD effectively. Building Information Modeling (BIM) can achieve this objective by enhancing information management for digitally built assets, improving visual controls for the production process and product data, and enabling feedback from various project teams [
38].
Organizing construction processes entails sequential scheduling of a series of steps in the flow of time that mutually interact and share the use of resources. Conventional project planning and scheduling requirements are insufficient to track such a project. Moreover, formulating the construction process using mathematical linear or nonlinear models that address design, procurement, and construction activities is ineffective. Mathematical models are designed in such a way as to find the best solution that takes care of the decision variables as well as for the maximization or minimization of the objective functions and constraint conditions for optimizing the construction operations but fail to take into account the dynamic scenarios and resource constraints. Some limitations include that it can not capture time-varying effects and the various effects of different components in the model.
Therefore, this study aims to predict the outcomes of construction planning and control processes from an MD perspective by better understanding the dynamic structure of MD practices within three construction projects with different planning and MD skills. The paper seeks to identify how different variations of LPS and BIM parameters related to collaboration level and planners’ awareness and knowledge of MD practices can influence the MD outcome. A dynamic model is developed to achieve this objective, which portrays MD practices within a construction project. It depicts parameters relating to the level of collaboration and coordination, organization adaptation towards applying LPS and BIM, BIM functionalities, and project type. Moreover, the model identifies how different variations of LPS-BIM parameters influence emergent MD impacts. The developed model’s inputs were validated through data from two large construction projects and one rehabilitation project. Additionally, simulation experiments developed structural equation models and regression models that predict the results of MD practices’ results. The main contribution of this study lies in guiding construction planners and makers to better manage their production constraints by eliminating negative MD from their plans.
5. Discussion
Analysis of results from section 4.1 of the survey showed that making-do knowledge (MDL) is affected the most by production planning and control, and most lack of awareness and MD decisions are taken to complete tasks through MD. This assertion can mean planners with high knowledge and experience of LPS functions with the association of using BIM functionalities can only improve the accumulated knowledge of the organization in MD and then learn from the function constraints analysis within the LPS. Conversely, practitioners learn the most from the tasks they plan and operate collaboratively. BIM functionalities have low significance on a direct impact on MD but with LPS MD.
The proposed model has three theoretical implications agreeing with [
81] : (1) Managing as Organization and Pull Type of Production: this model posits that managing integrates between pull and push production through planning methods, wherein tasks are pulled from workable backlog according to tasks readiness or the availability of requisite resources. (2) Scientific experimentation model: integrating quality management principles with production planning and control is critical for successful MD reduction [
31]. This model centers on discovering the root causes of MD and deviations in the production system to prevent performance slippage, formalizing production actions by adding standardized procedures to handle constraints and potential improvisation actions taken by people in the system; it serves as a learning mechanism to maintain production stability. (3) Language/action perspective: This model involves two-way communication during execution, where promises as a language of commitments trigger actions, notifications to initiate a task occur considering the resources and the actual capabilities of production, and involving downstream players' knowledge in decision-making.
Considering practical implications. As noted, the model’s input was validated by considering four scenarios of three projects: baseline scenario with zero LPS and BIM, Scenario I fully utilized LPS technical factors, Scenario II added COO factors into LPS functions, Scenario III provided the full scale of factors of MDK in addition to COO and LPS, Scenario tested the full potential of LPS, BIM, COO, and MDK. In each project, MD incidents, project constraints, and MD impacts (Waste) were categorized based on their nature and attributed to substages.
After running a simulation experiment of each project, several outcomes are reported.
Table 10 and
Figure 16,
Figure 17 and
Figure 18 show the results of simulations for project A and four scenarios. The complete comparison between projects A, B, and C is in
Table S10, Figures S1, S2, S3, S4, S5, S6, S7, S8 and S9.
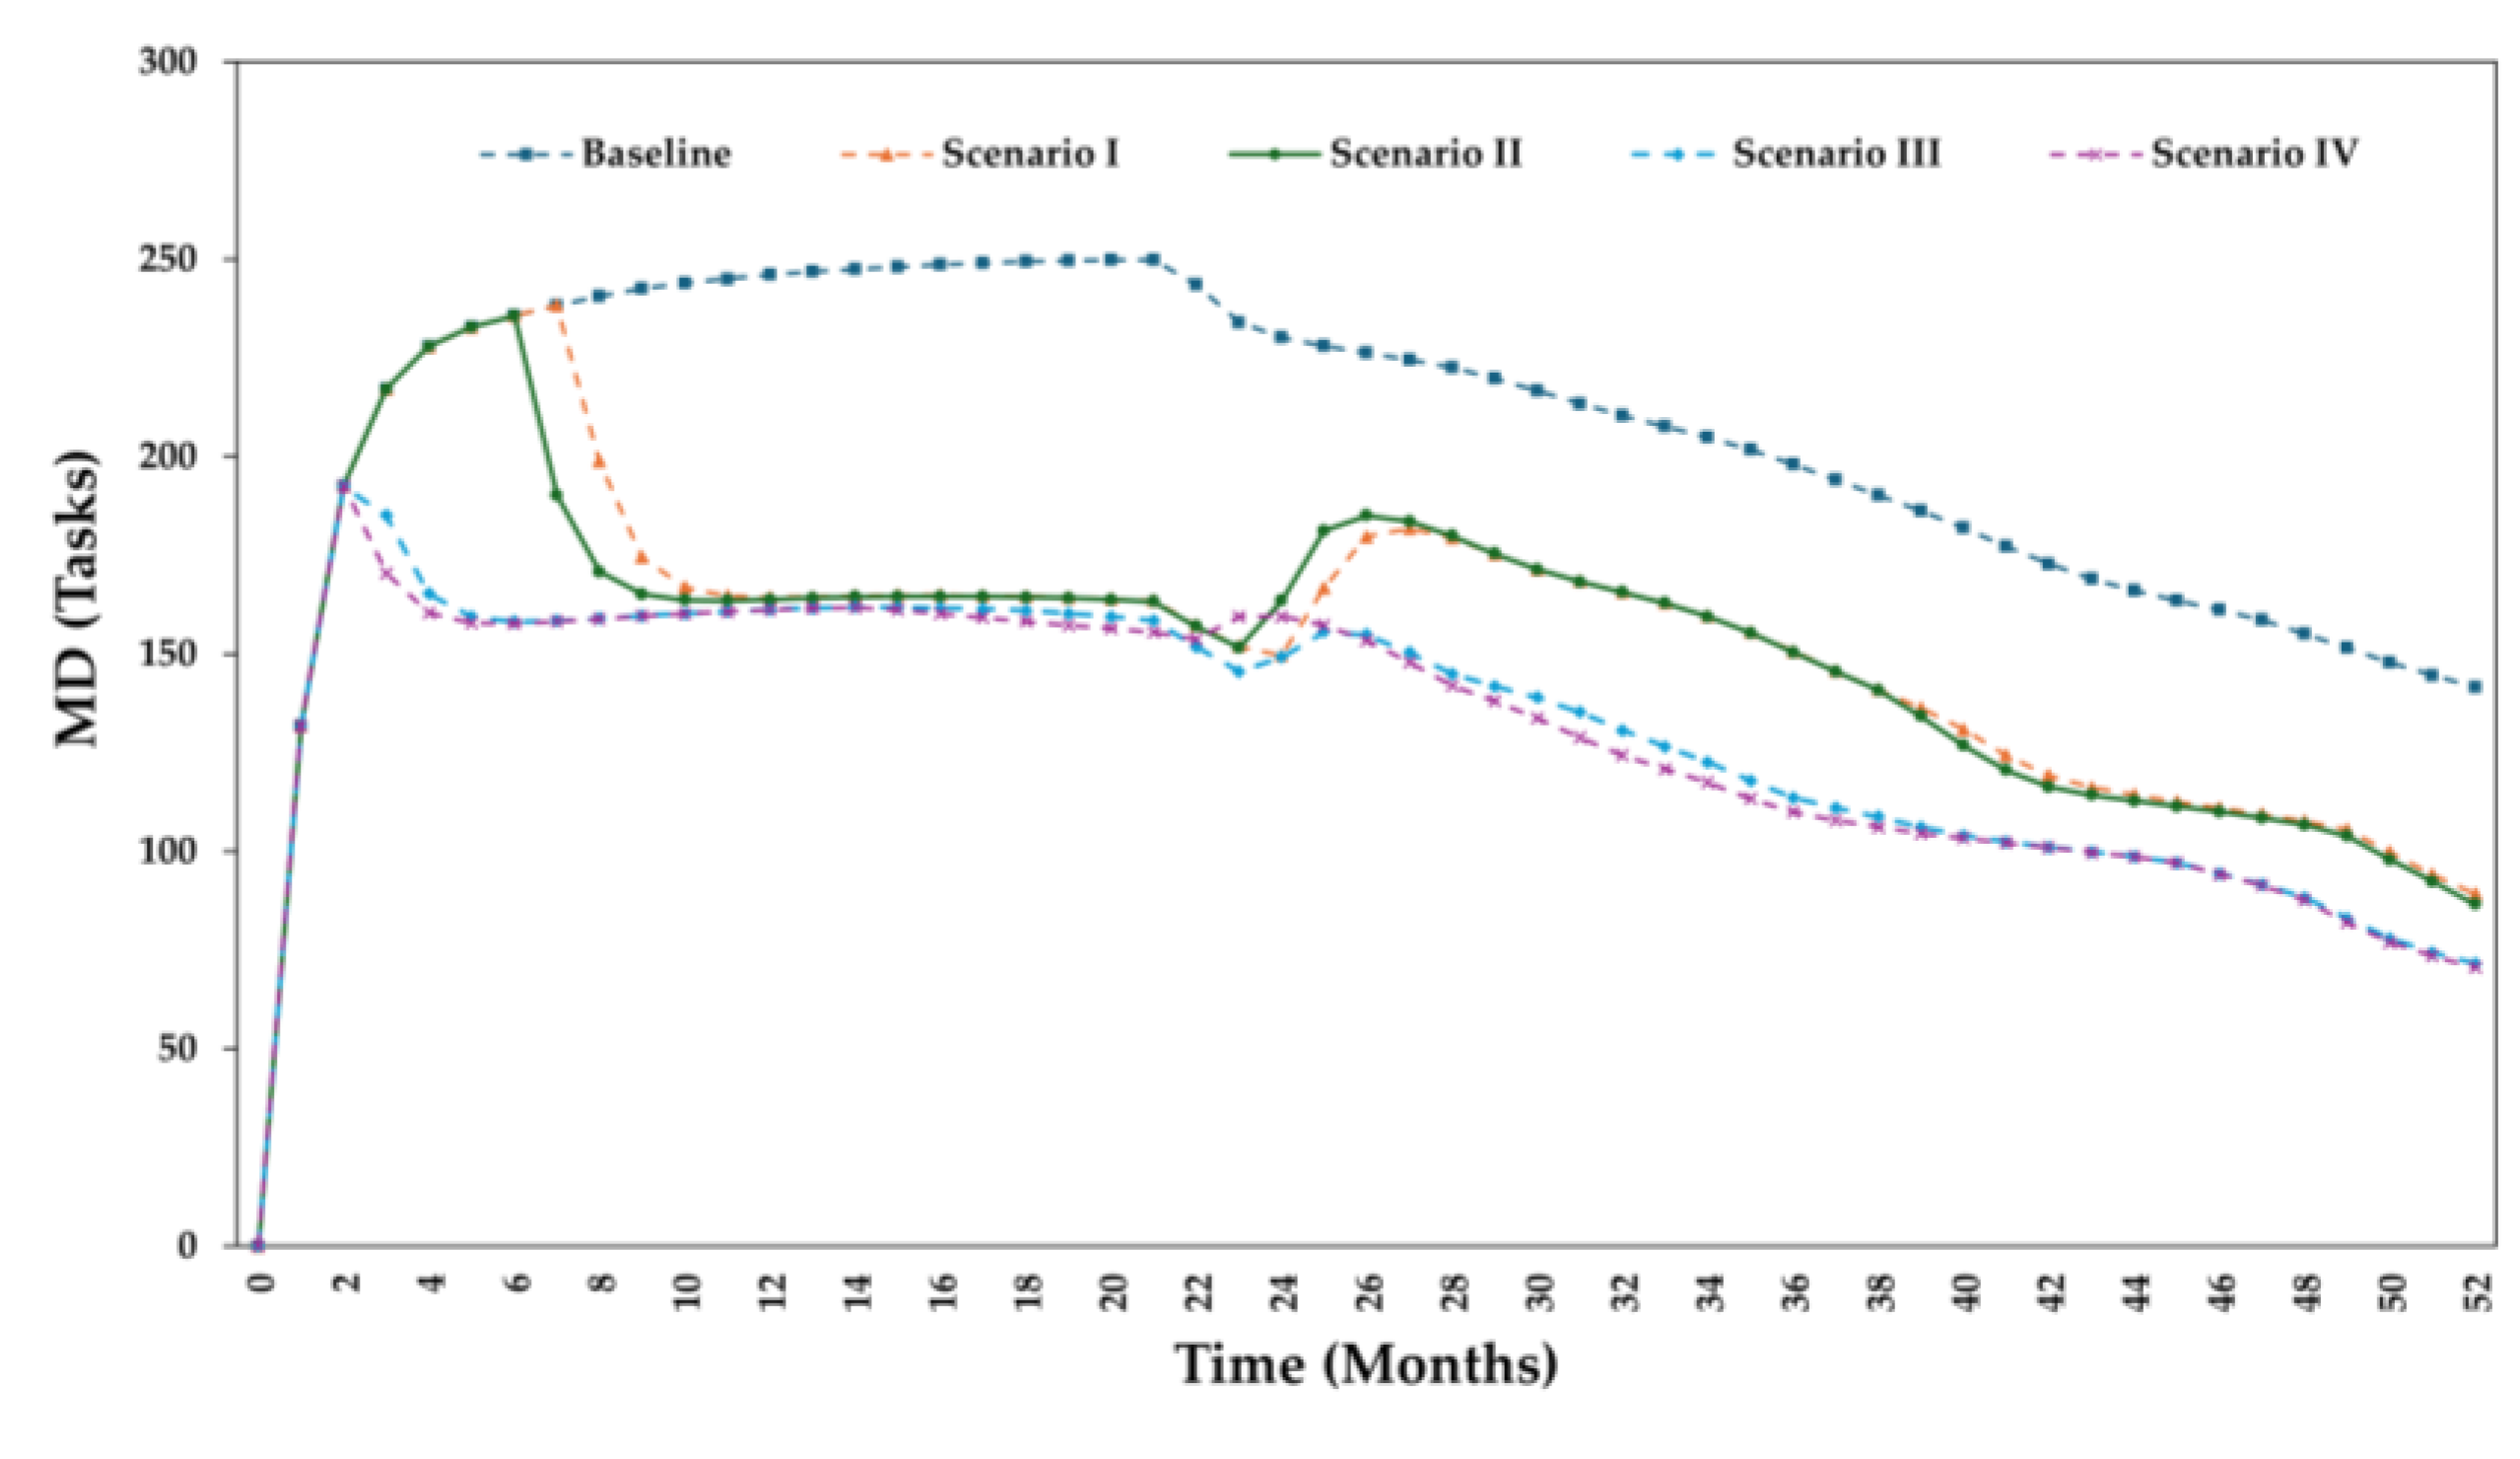
Project A lasts for 52 months; MD Categories CAT1 to CAT5, as shown in
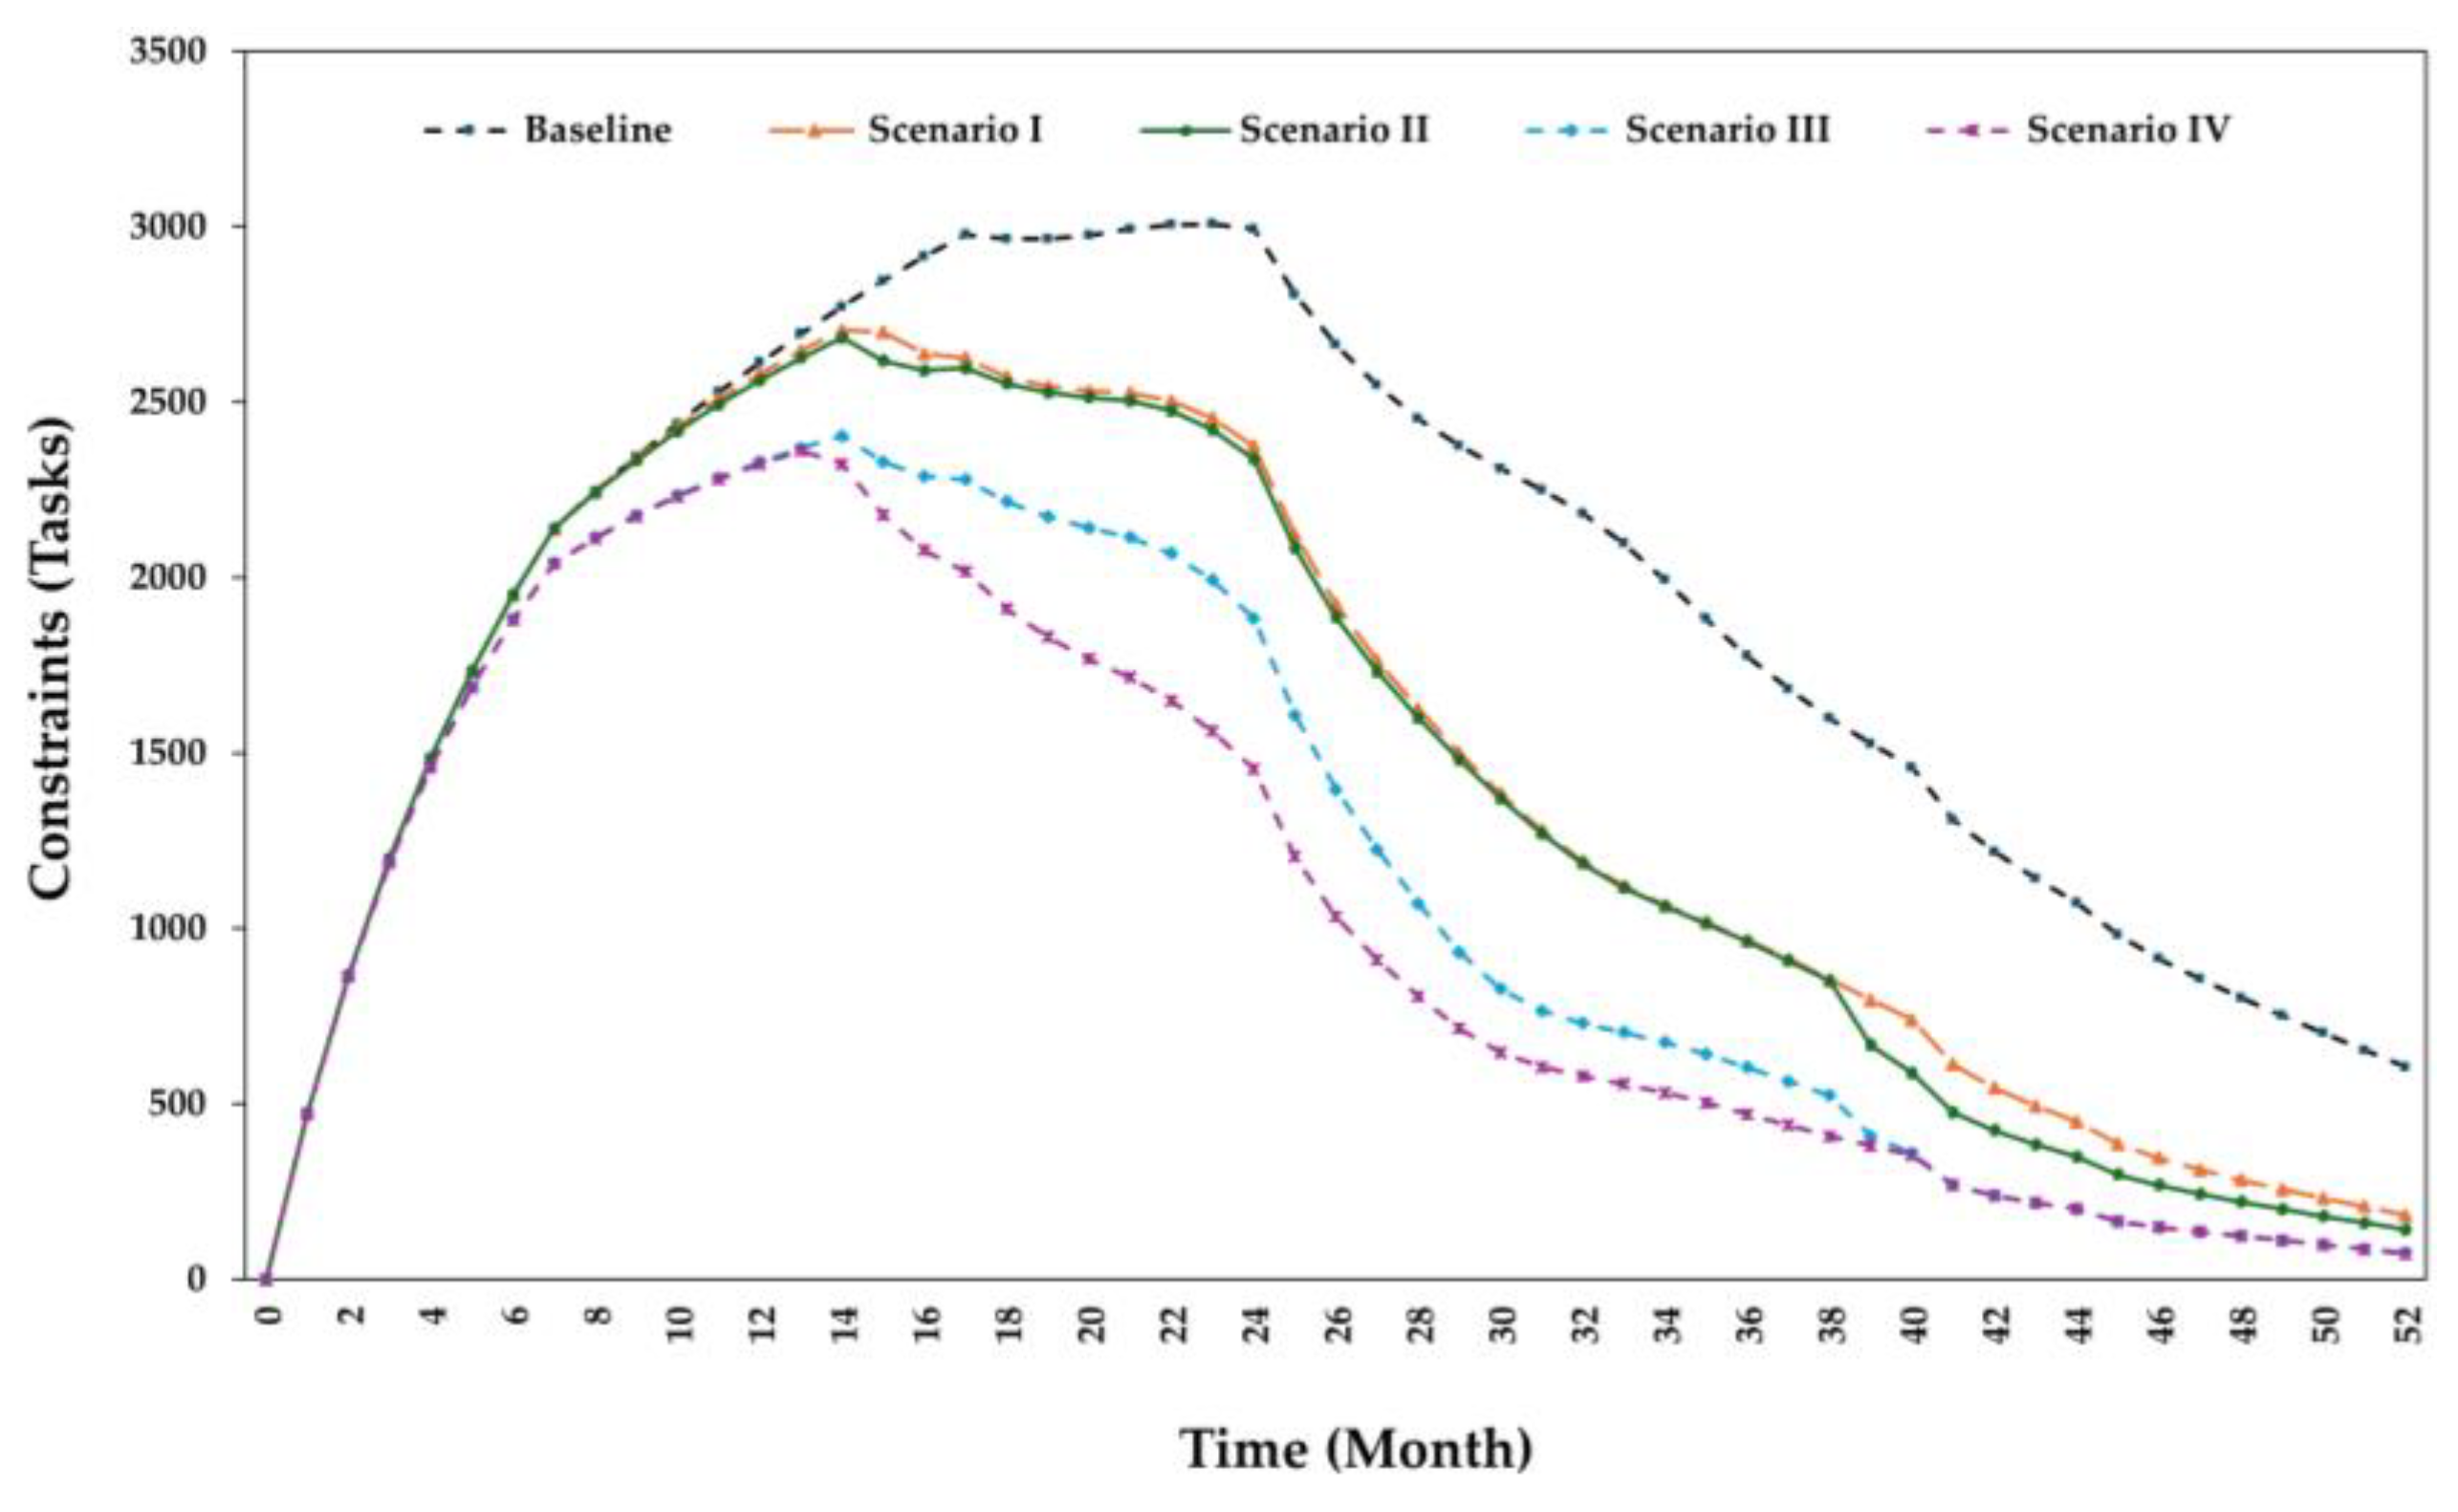
Figure 17, demonstrate varying trends, with the Access and Movement category of MD experiencing a decline from 23.754 in the baseline to 11.284 in Scenario IV, indicating potential improvements in MD-related issues. Component Adjustment, on the other hand, fluctuates across scenarios, peaking at 99.032 in the baseline before decreasing gradually. Equipment/Tools, Sequencing, and Workspace also display fluctuations, reflecting project constraints and priorities changes. Concerning constraints (P1 to P6) as depicted in
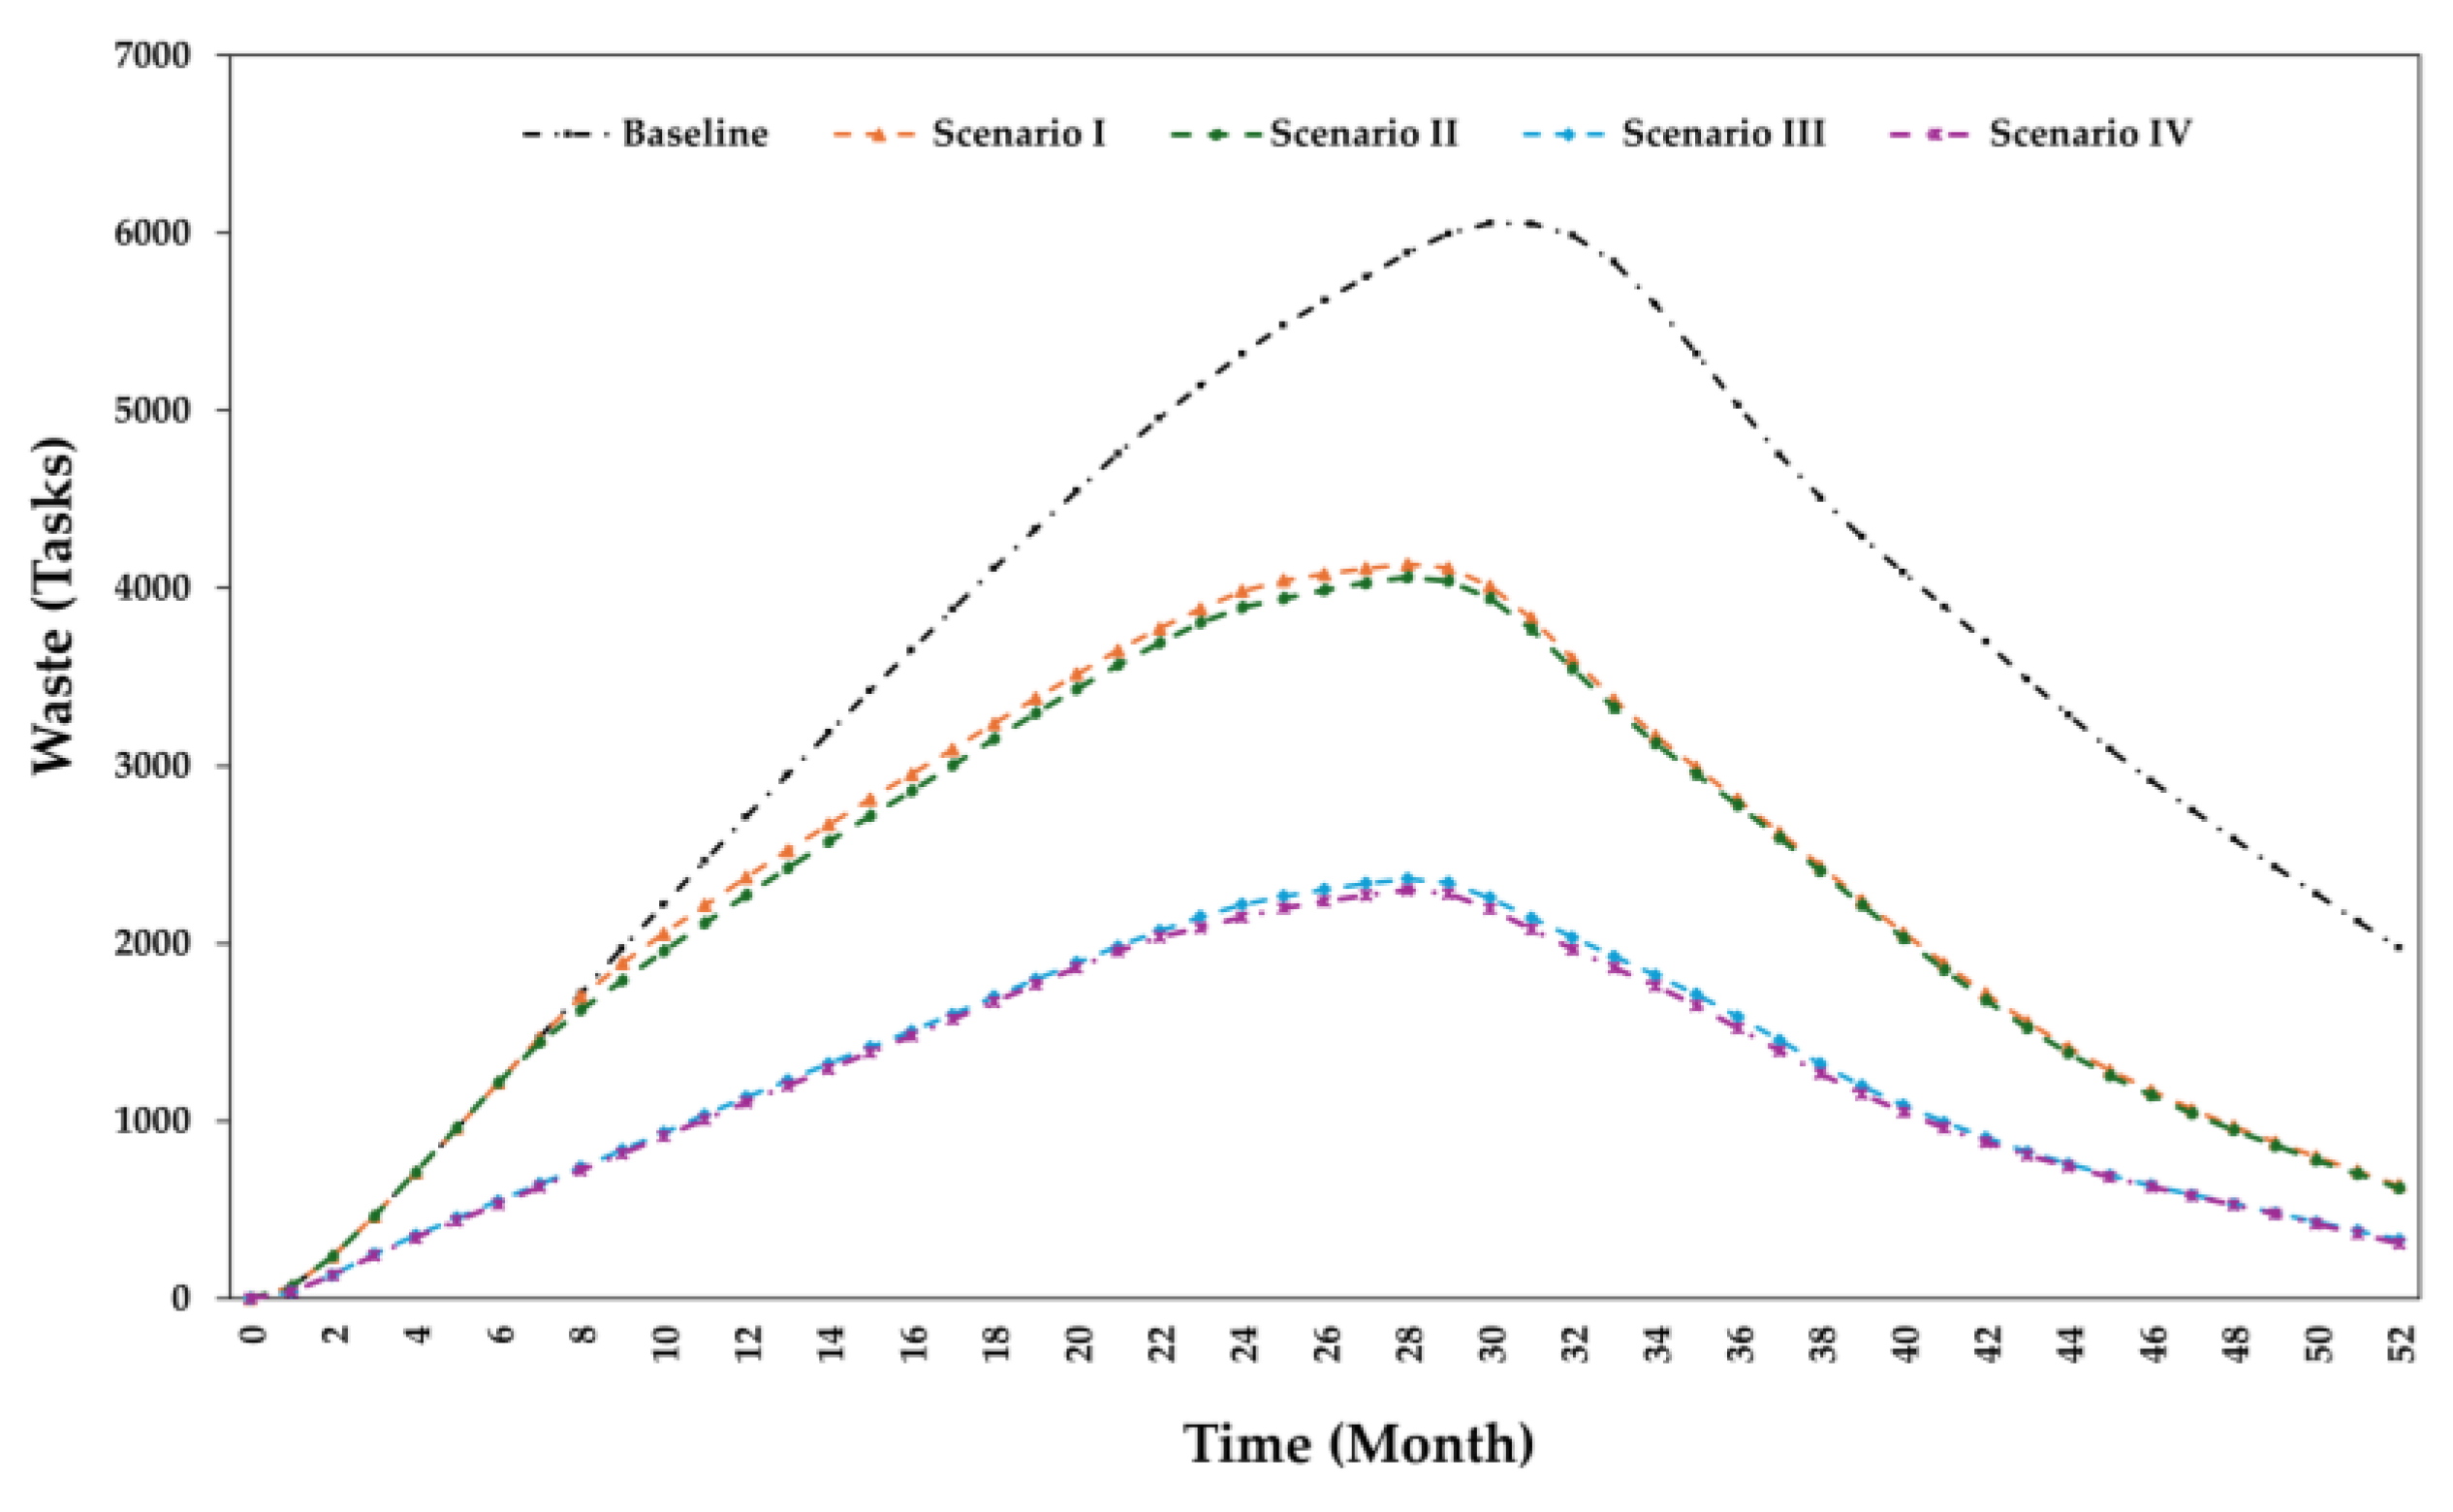
Figure 16, reductions are observed across scenarios, with Scenario IV consistently showing lower values than the baseline, suggesting effective constraint management strategies using the full potential of the LPS-BIM. MD impacts (I1 to I5) exhibit waste reductions across scenarios, as illustrated in
Figure 18, with Scenario IV displaying the most significant decrease in waste severity, ranging between 61.41% and 69.07% waste reductions. Completion rates fluctuate across scenarios, with Scenario IV recording the highest rate at 98.962%, indicating enhanced productivity of resources, hence increasing project efficiency. Lastly, additional cost reduction highlights potential cost-saving opportunities, with Scenario IV displaying the lowest cost at
$60,893.31, emphasizing the importance of LPS and BIM to eliminate the MD and optimize project outcomes.
Project B lasts 42 months; the simulations illustrate critical variables’ dynamic interplay. For instance, the Access and Movement MD category experiences a decrease from 16.990 in the baseline to 9.525 in Scenario III, suggesting an improvement in MD-related decisions. Conversely, Component Adjustment shows mitigations, peaking at 96.621 in Scenario II before declining to 63.459 in Scenario IV. Equipment, Tools, and Sequencing categories follow similar patterns of variation across scenarios, indicating shifts in project constraints and priorities. Constraints P1 to P6 also demonstrate changes, with Scenario IV consistently showing lower values than the baseline, implying effective LPS-BIM strategies in enhancing constraints analysis. In I1 to I5, MD impacts showcase reductions across scenarios, with Scenario I exhibiting an average 31.57% reduction and Scenario IV with 43.20%. Moreover, completion rates fluctuate across scenarios, with Scenario IV recording the highest rate at 98.303%, signifying enhanced project efficiency. Finally, cost fluctuations reveal potential cost-saving opportunities, with Scenario IV displaying the lowest cost at $19,912.27.
Project C lasts 24 months, and the simulation results reveal behavior similar to Project A’s across different scenarios. MD Categories CAT1 to CAT5 exhibit varying trends, with Access and Movement representing a decline from 13.816 in the baseline to 8.075 in Scenario IV, suggesting improvements in MD mitigation as LPS and BIM factors are applied. Conversely, Component Adjustment sees a reduction across scenarios, peaking at 93.780 in Scenario I before decreasing to 63.115 infected tasks in Scenario IV. The MD categories Equipment/Tools and Sequencing also demonstrate variations, indicating project constraints and priority changes. Regarding constraints (P1 to P6), reductions are observed across scenarios, with Scenario IV consistently revealing lower values than the baseline. MD impacts (I1 to I5) show reductions across scenarios, with Scenario IV exhibiting the most significant decrease in impact severity. Completion rates fluctuate across scenarios, with Scenario IV recording the highest rate at 95.005%, indicating improved project efficiency. Lastly, cost fluctuations reveal potential cost-saving opportunities, with Scenario IV displaying the lowest additional cost percentage at $7,171.63, highlighting the importance of LPS-BIM adoption to optimize project outcomes.
Scenario IV is the superior option when comparing scenarios across Projects A, B, and C, owing to its noteworthy advantages across multiple vital factors. Firstly, Scenario IV exhibits substantial mitigation rates in MD categories with an average 43.34%, 43.64%, and 44.42% reduction in total MD categories in Projects A, B, and C, respectively. The Equipment & Tools category is the most influenced by Scenario IV mitigation strategies, indicating effective mitigation of MD-related issues with a 60.64% reduction rate in Project A, 60.04% in Project B, and 56.13% in Project C. Secondly, Scenario IV demonstrates efficient constraint management, consistently maintaining lower values for constraints P1 to P6, facilitating smoother project execution and resource utilization. Moreover, Scenario IV showcases the most significant reductions in MD impacts, highlighting its efficacy in mitigating the severity of MD-related challenges and enhancing project resilience.
Furthermore, Scenario IV consistently yields higher completion rates, reflecting improved project efficiency and timeliness. Lastly, favorable cost outcomes are observed in Scenario IV, with the lowest cost percentages recorded across all projects, underscoring its potential for cost-saving opportunities through efficient resource allocation and management. Overall, the results of simulations emphasize the importance of strategic planning and adaptation to LPS and BIM strategies to mitigate MD and optimize project outcomes.
LPS-BIM, empowered with improved collaboration and MD knowledge, becomes the best option among I, II, and III scenarios when the three projects are compared because LPS-BIM has highly competitive advantages in almost all criteria of importance. Initially, scenario IV drastically reduced all MD categories and specifically improved Access and Movement categories by effectively alleviating MD-based problems. Similarly, Scenario IV reduced constraints discovered late in the projects, increased productivity levels, accelerated project delivery with less additional costs, and reduced related waste in tasks such as material waste, rework, and unfinished works, ensuring high levels of the project’s resilience. Overall, the simulation’s results reinforce lean policies and strategies based on LPS and BIM to avoid and minimize MD, resulting in optimal outcomes.
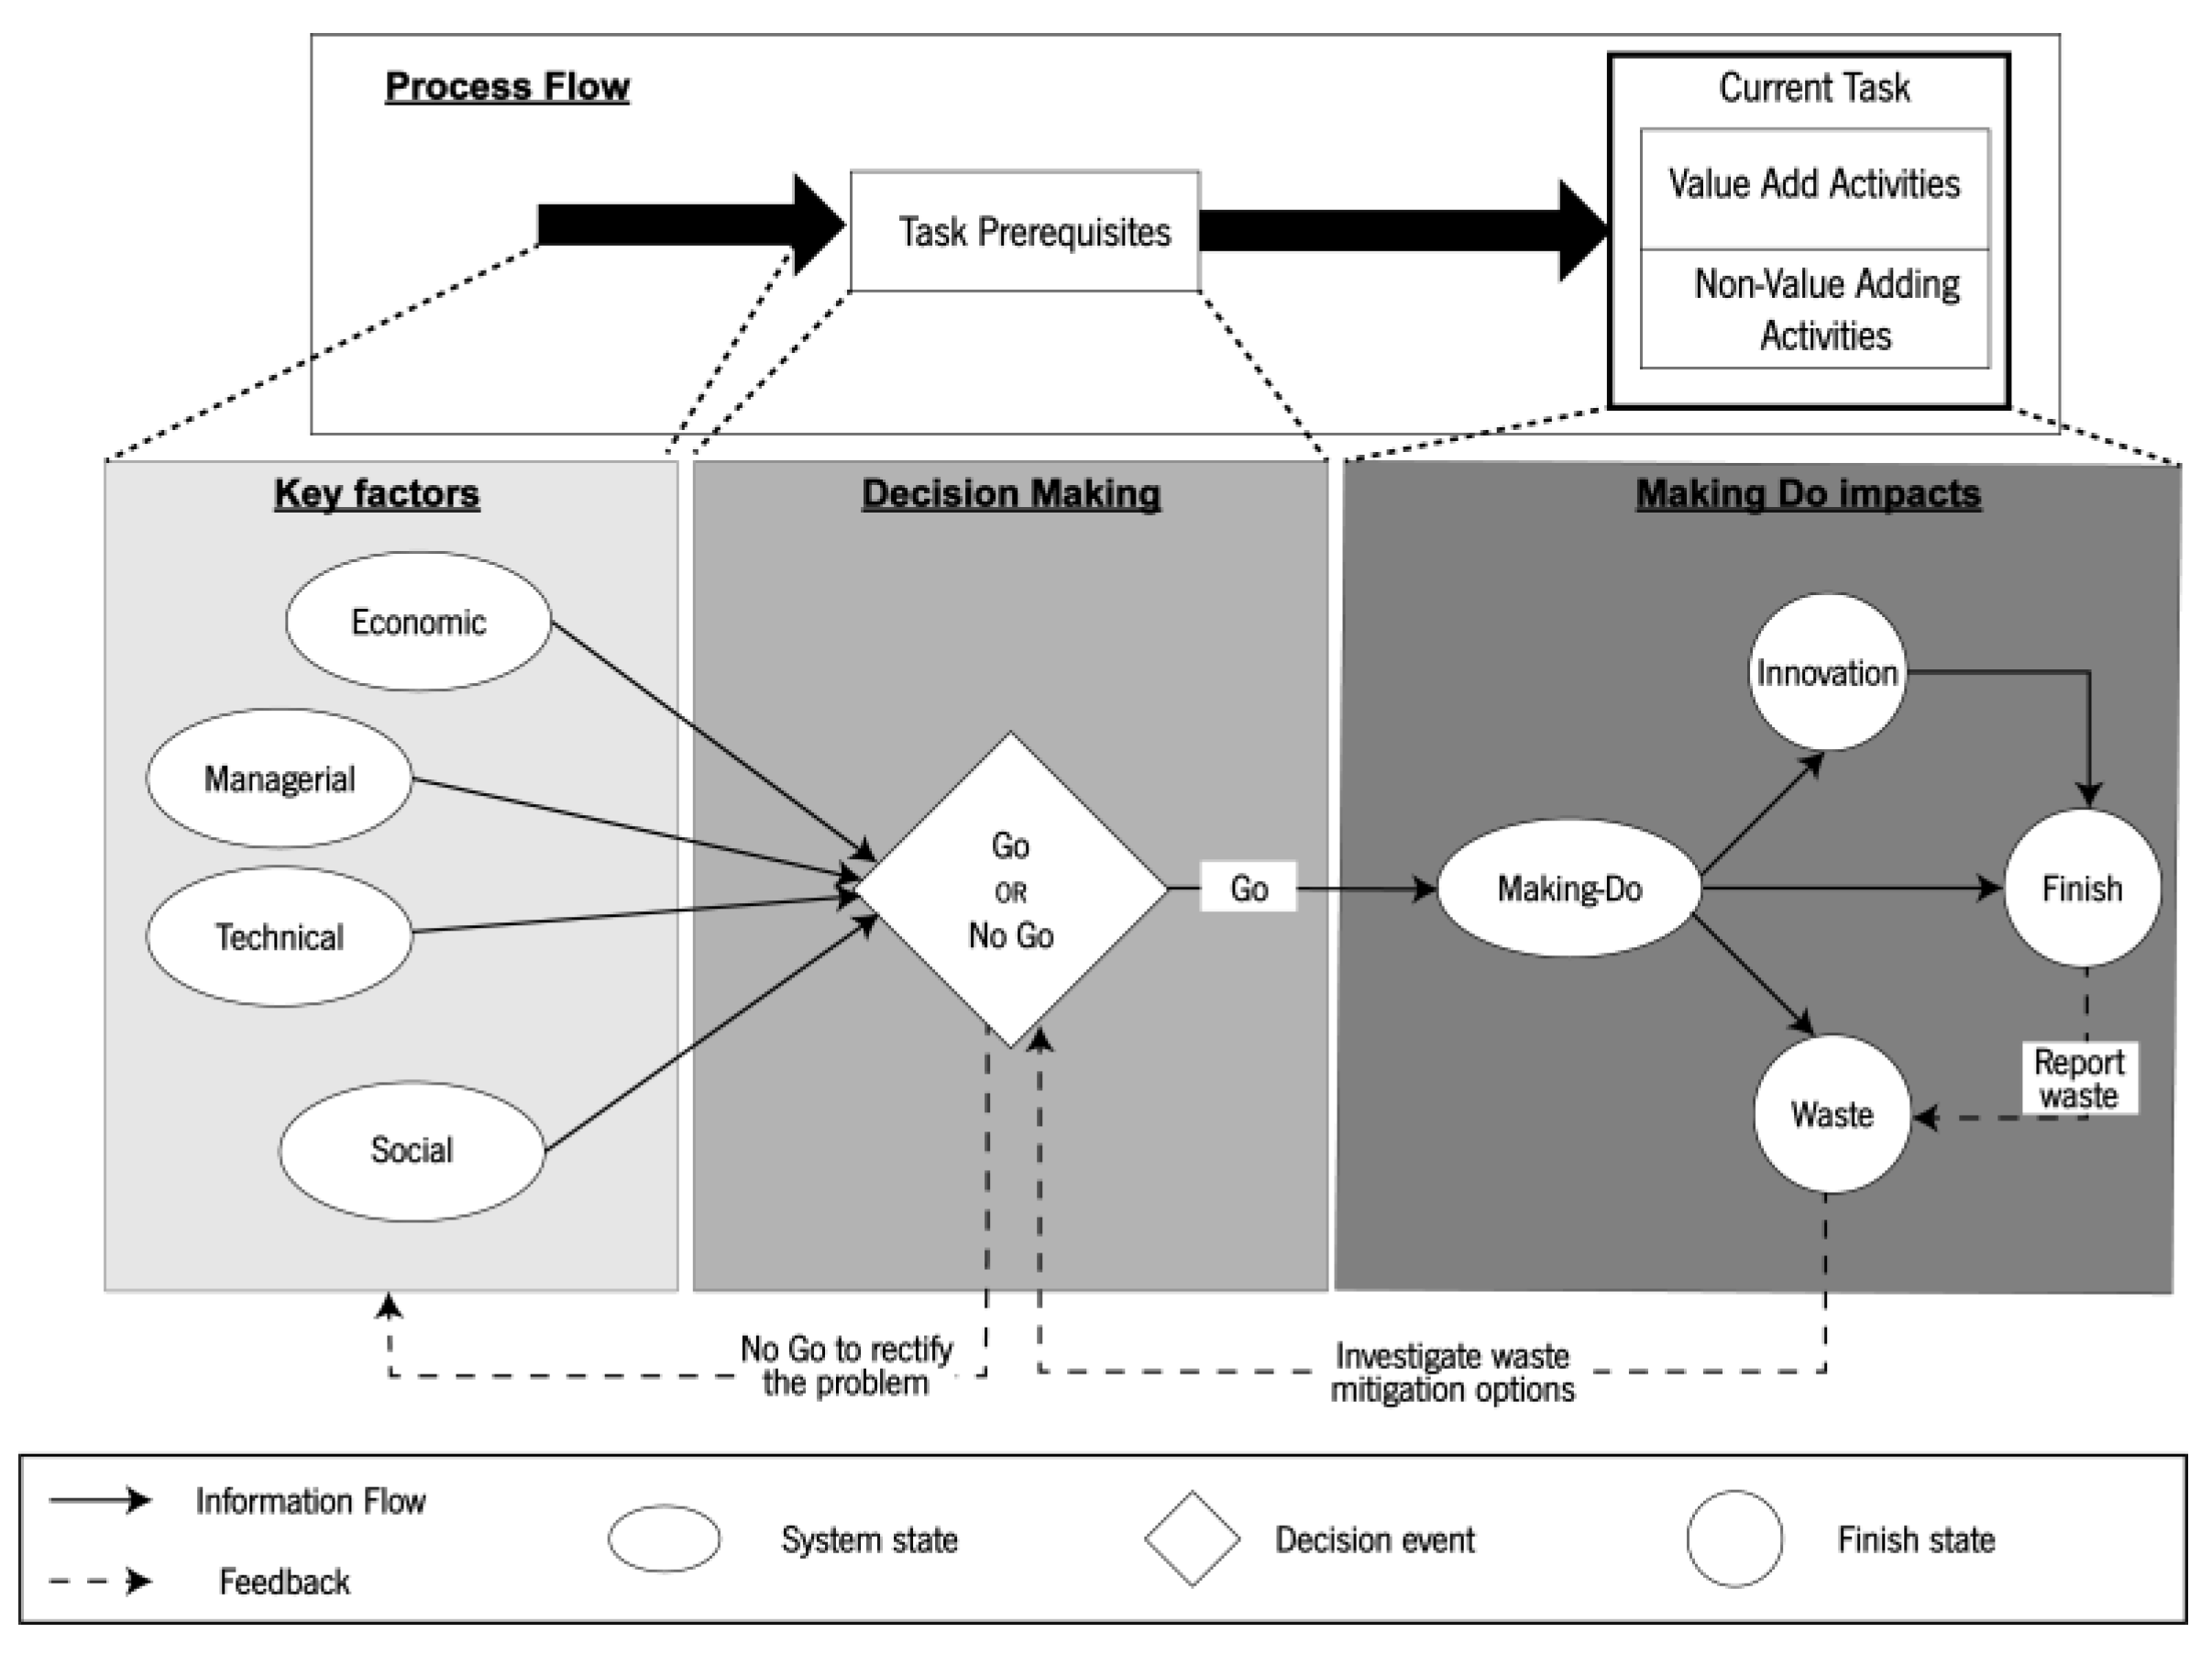
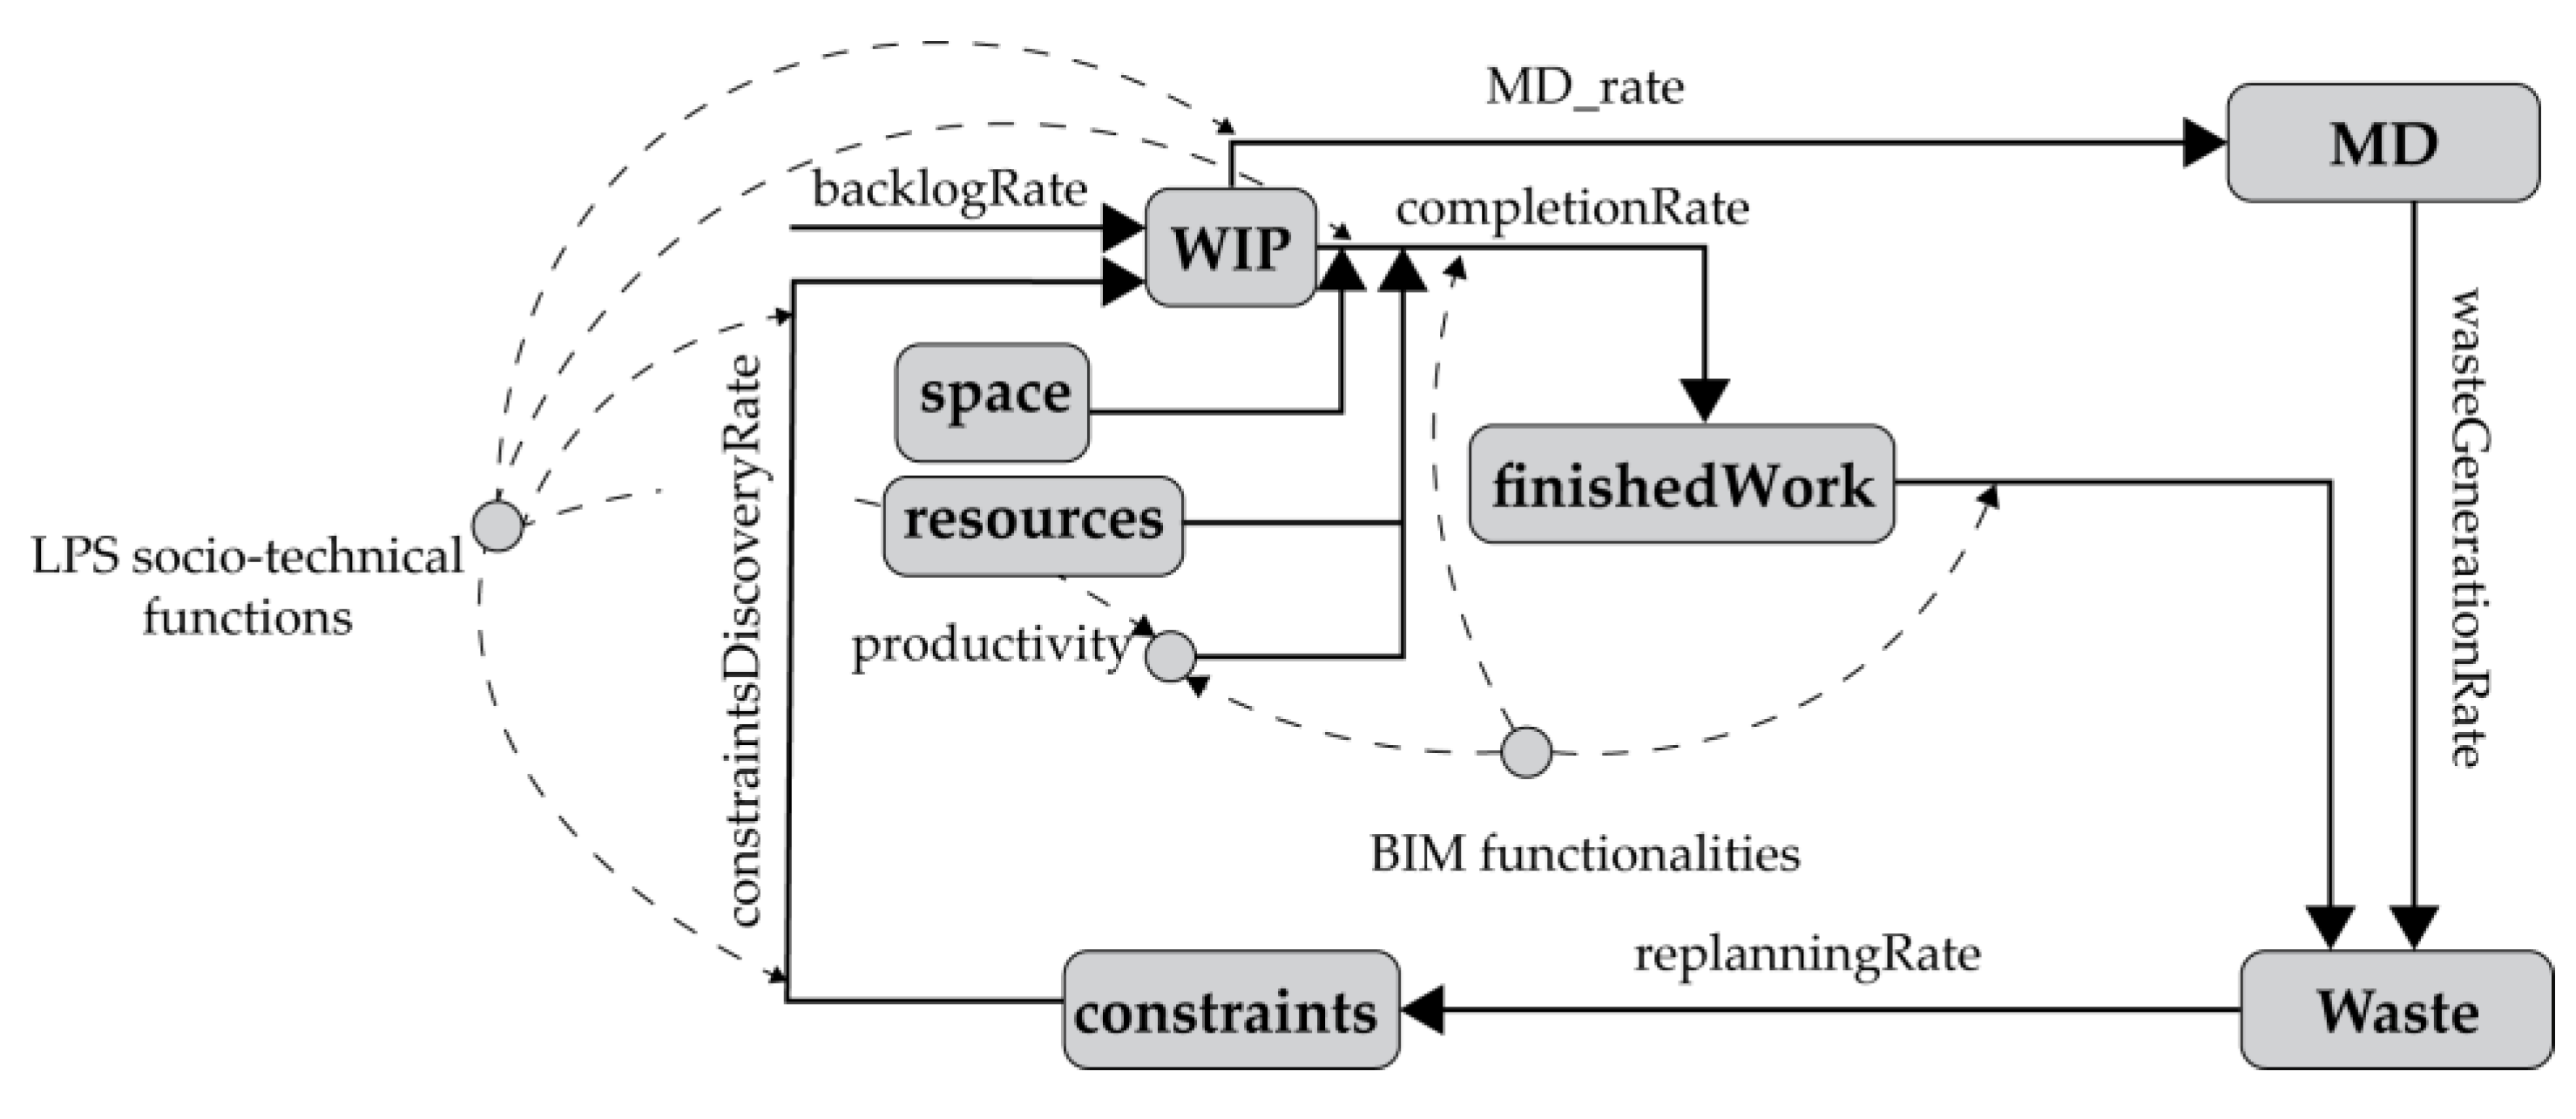
Figure 1.
A conceptual diagram of making-do phenomena.
Figure 1.
A conceptual diagram of making-do phenomena.
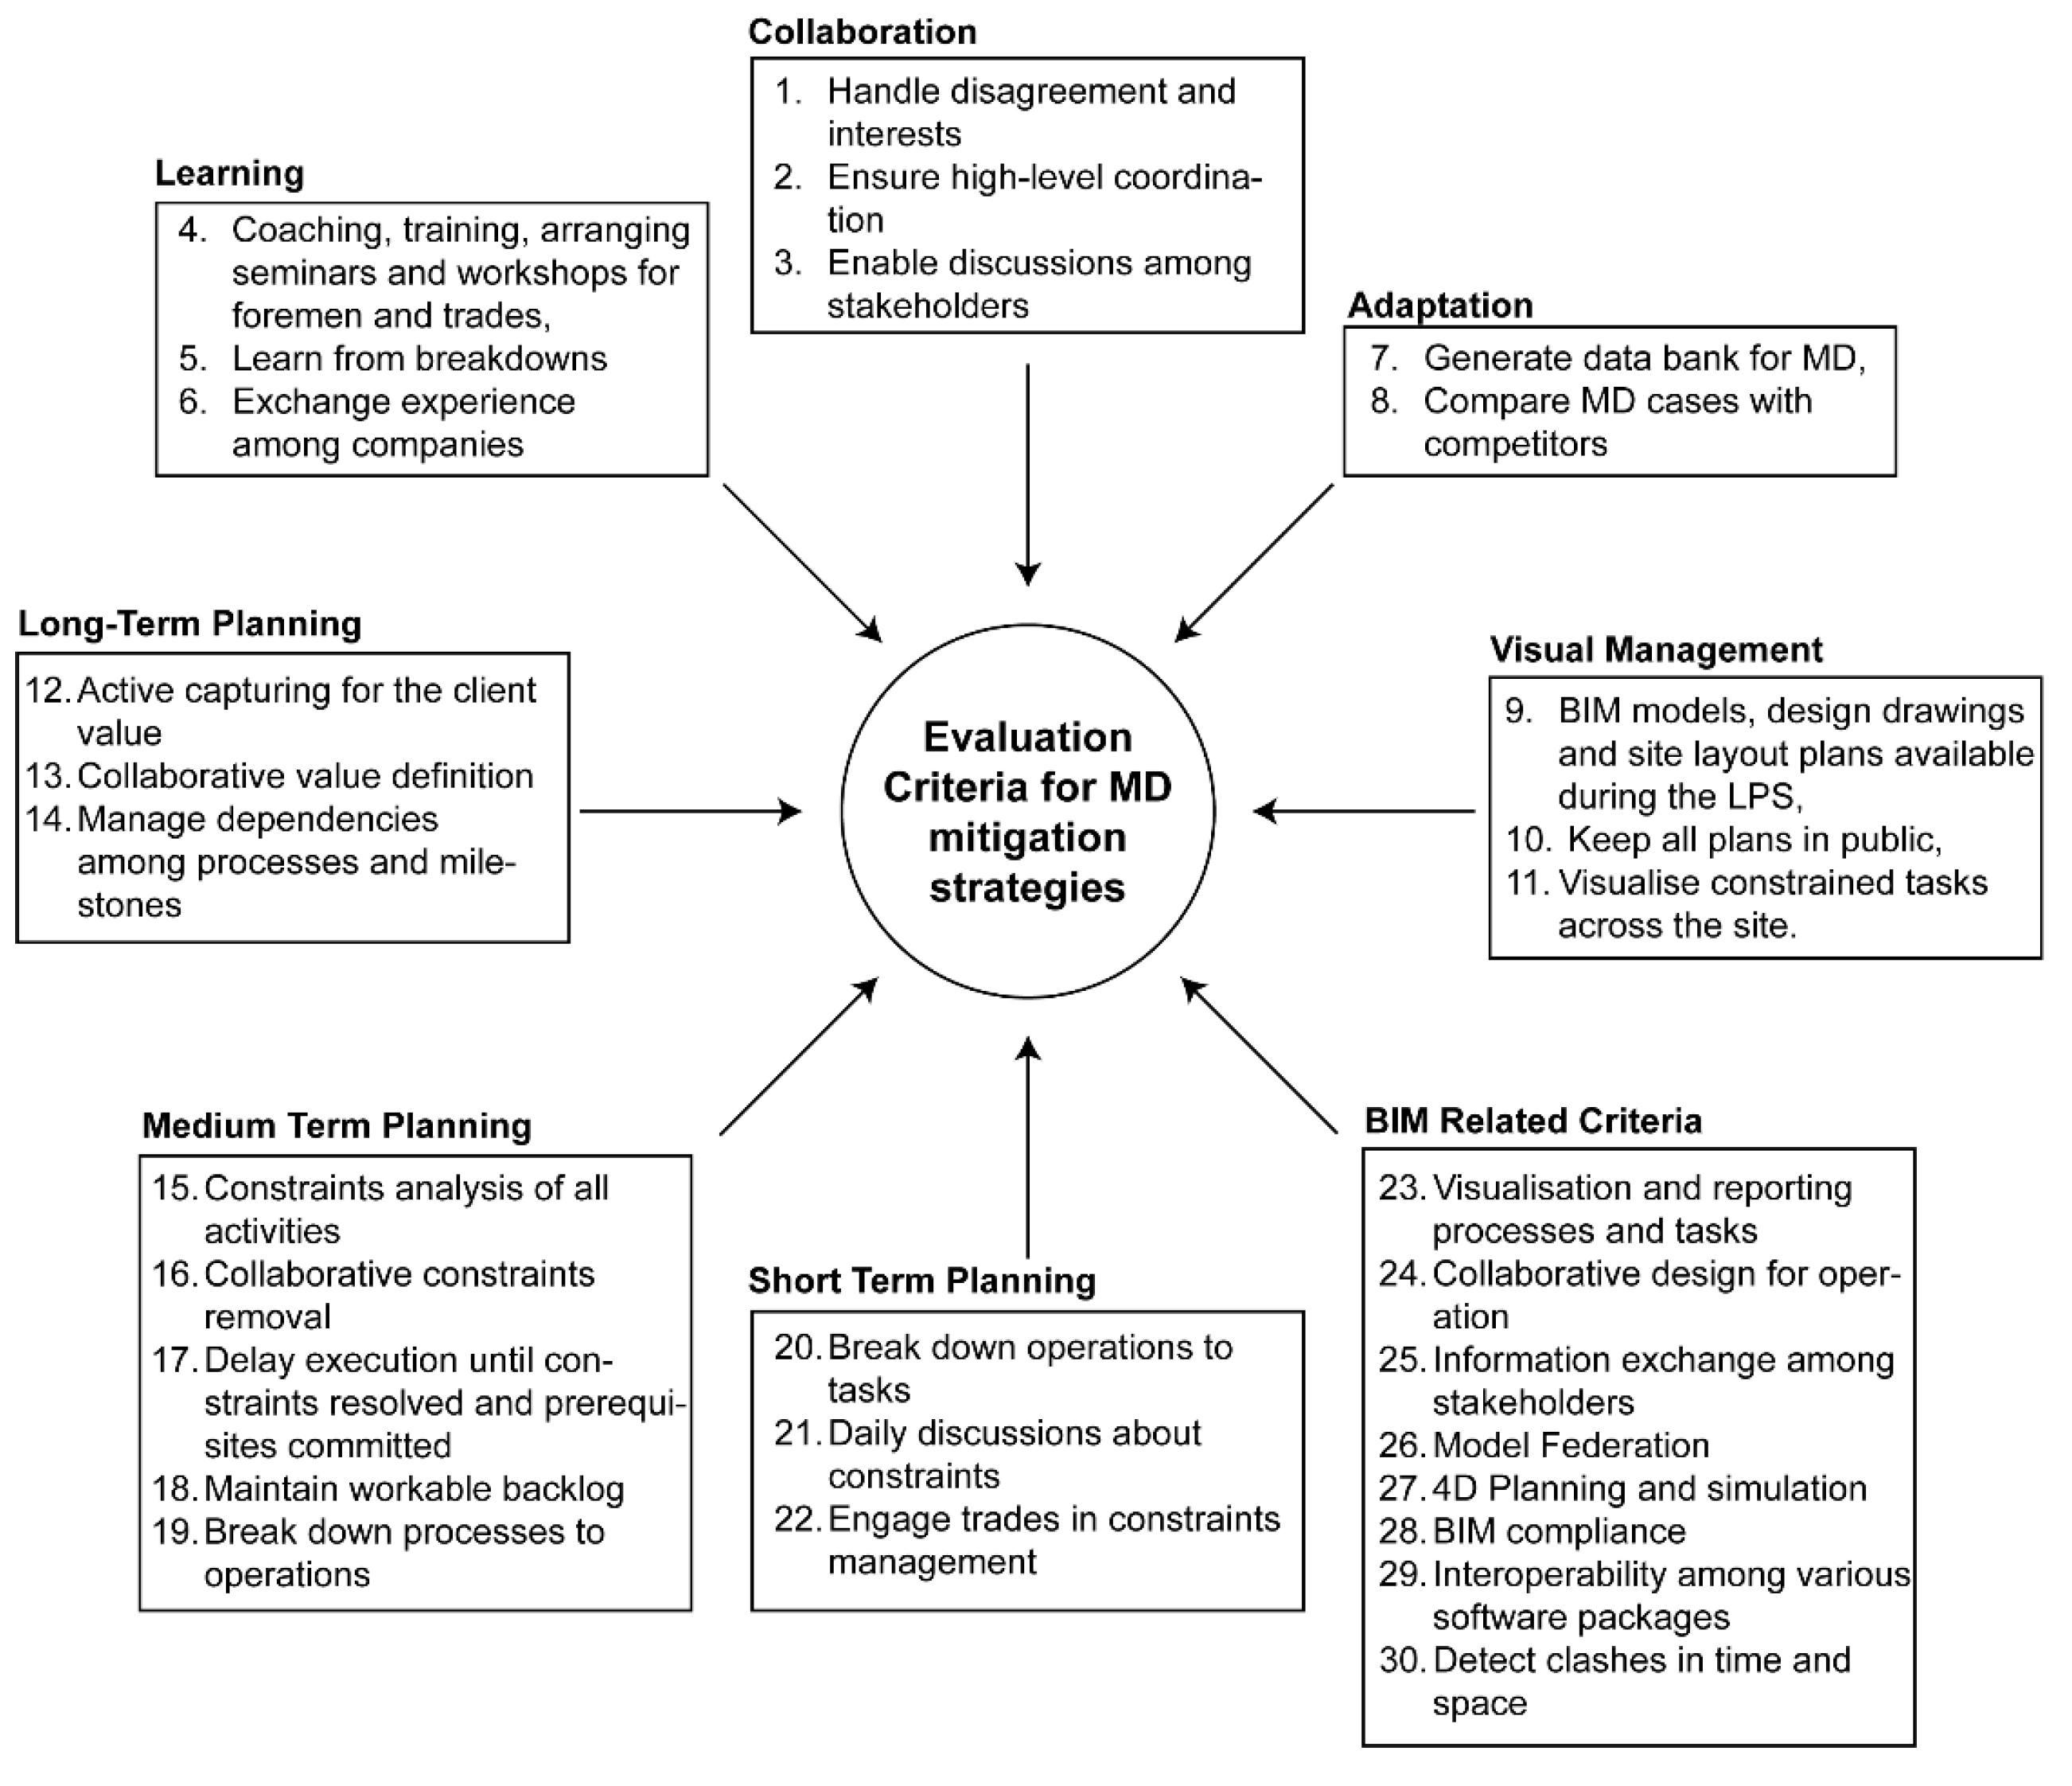
Figure 2.
Evaluation criteria for LPS-BIM mitigation strategies.
Figure 2.
Evaluation criteria for LPS-BIM mitigation strategies.
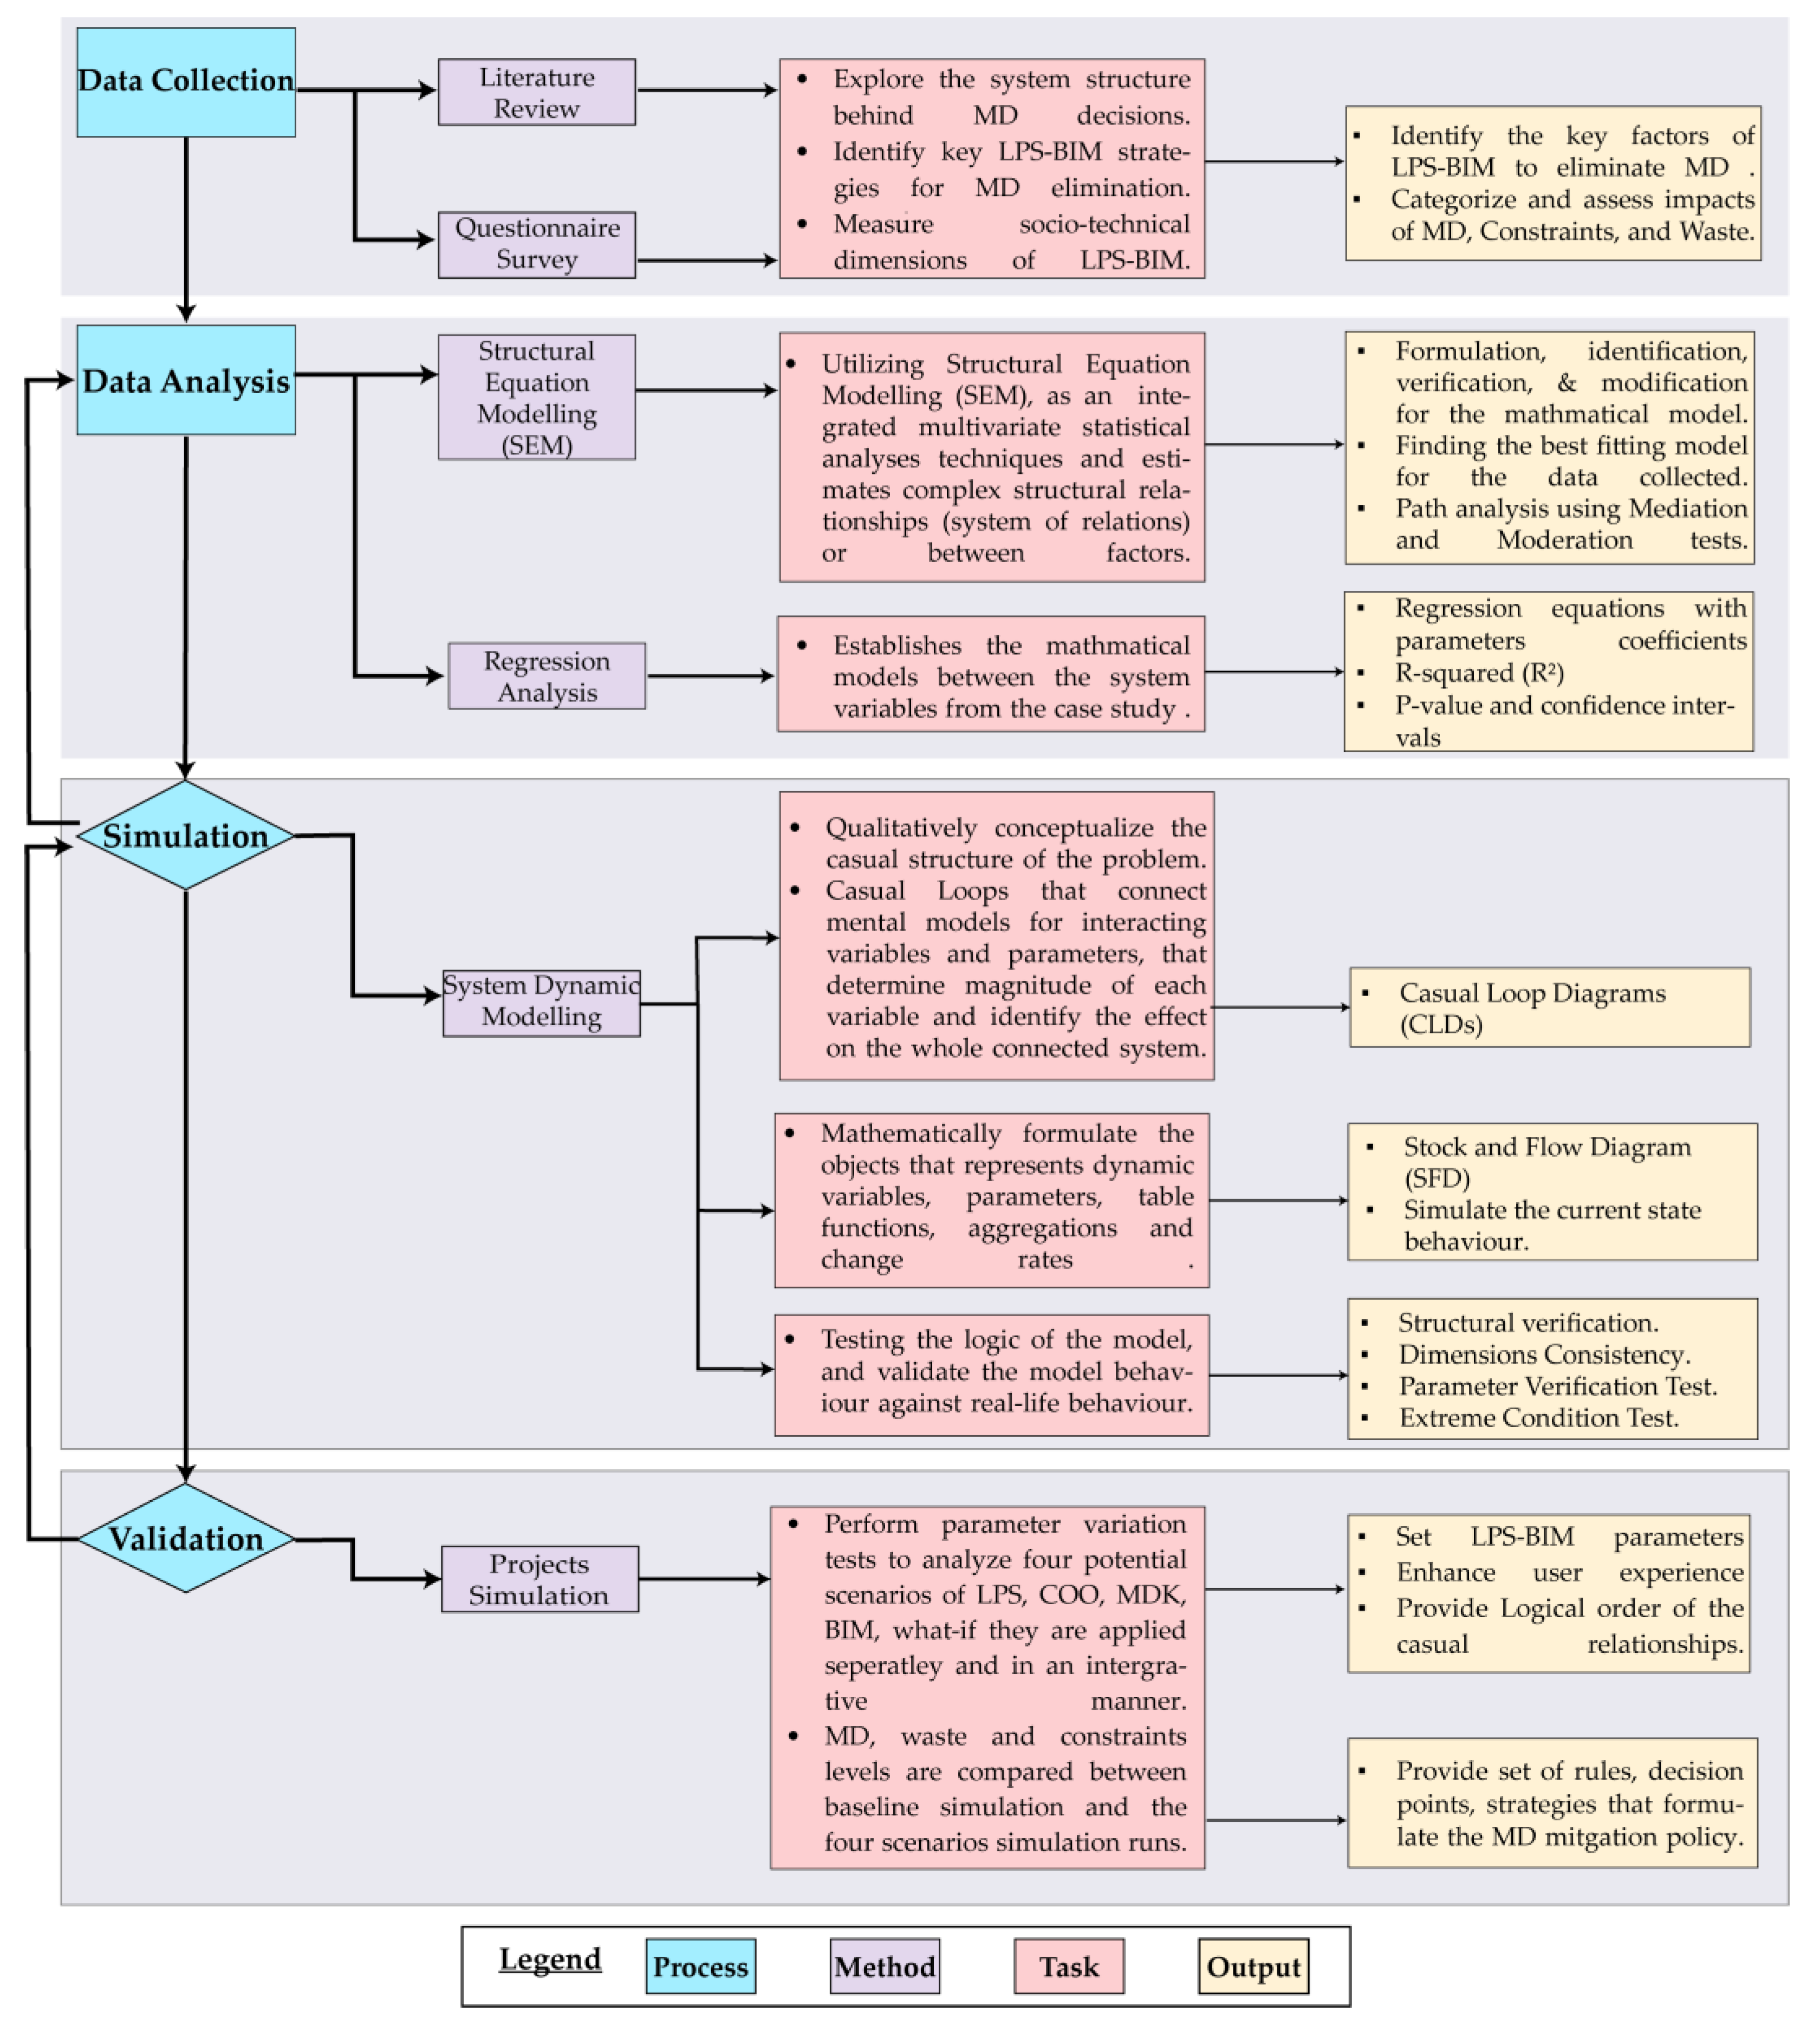
Figure 3.
The research methodology design.
Figure 3.
The research methodology design.
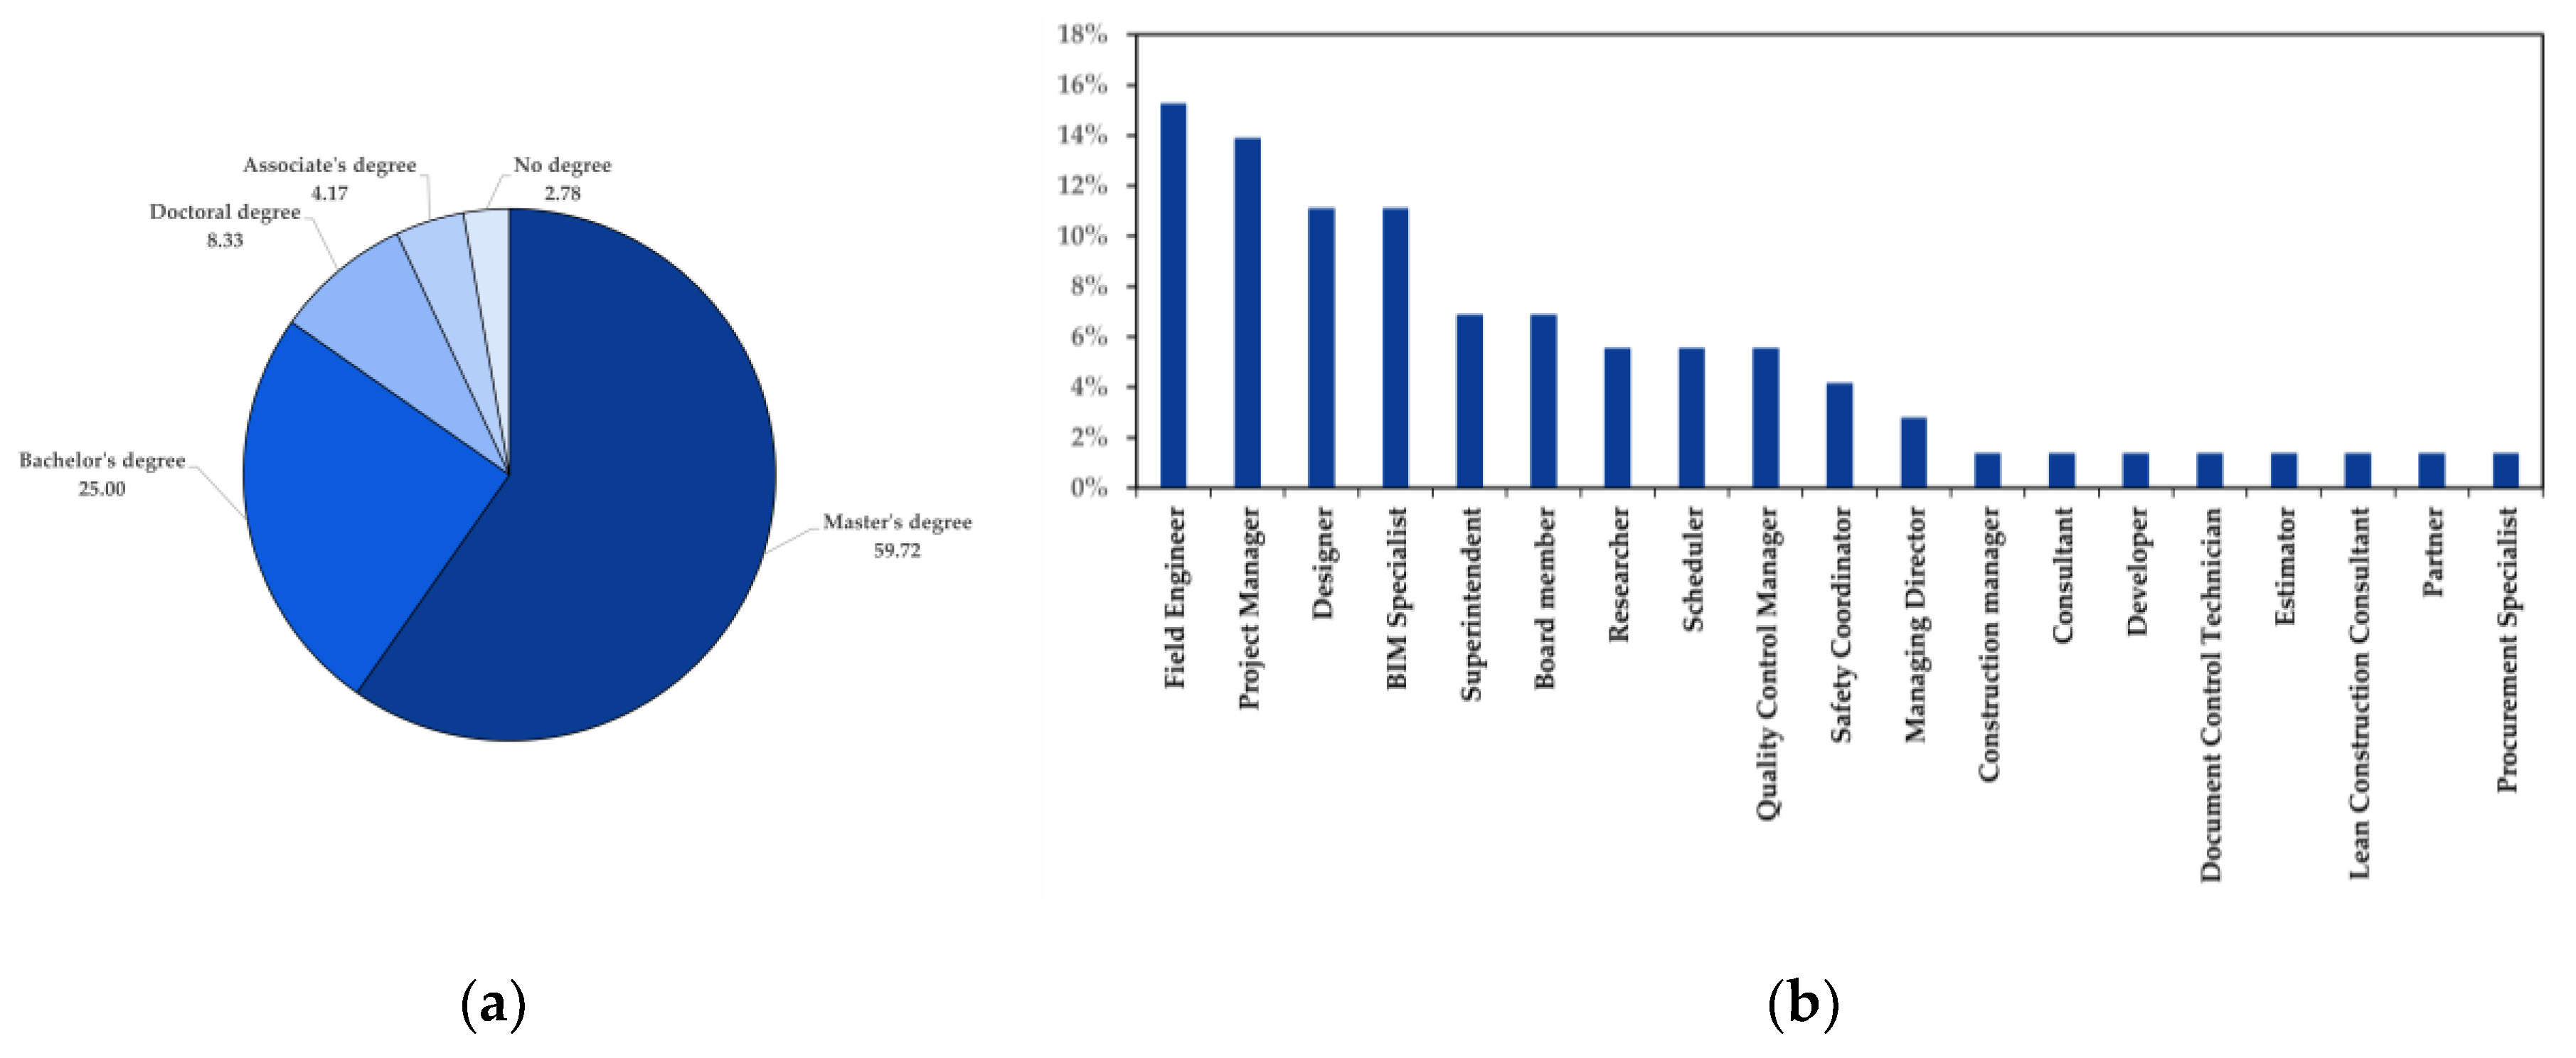
Figure 4.
(a) Education attainment of the respondents (b) Occupational roles within the respondent group.
Figure 4.
(a) Education attainment of the respondents (b) Occupational roles within the respondent group.
Figure 5.
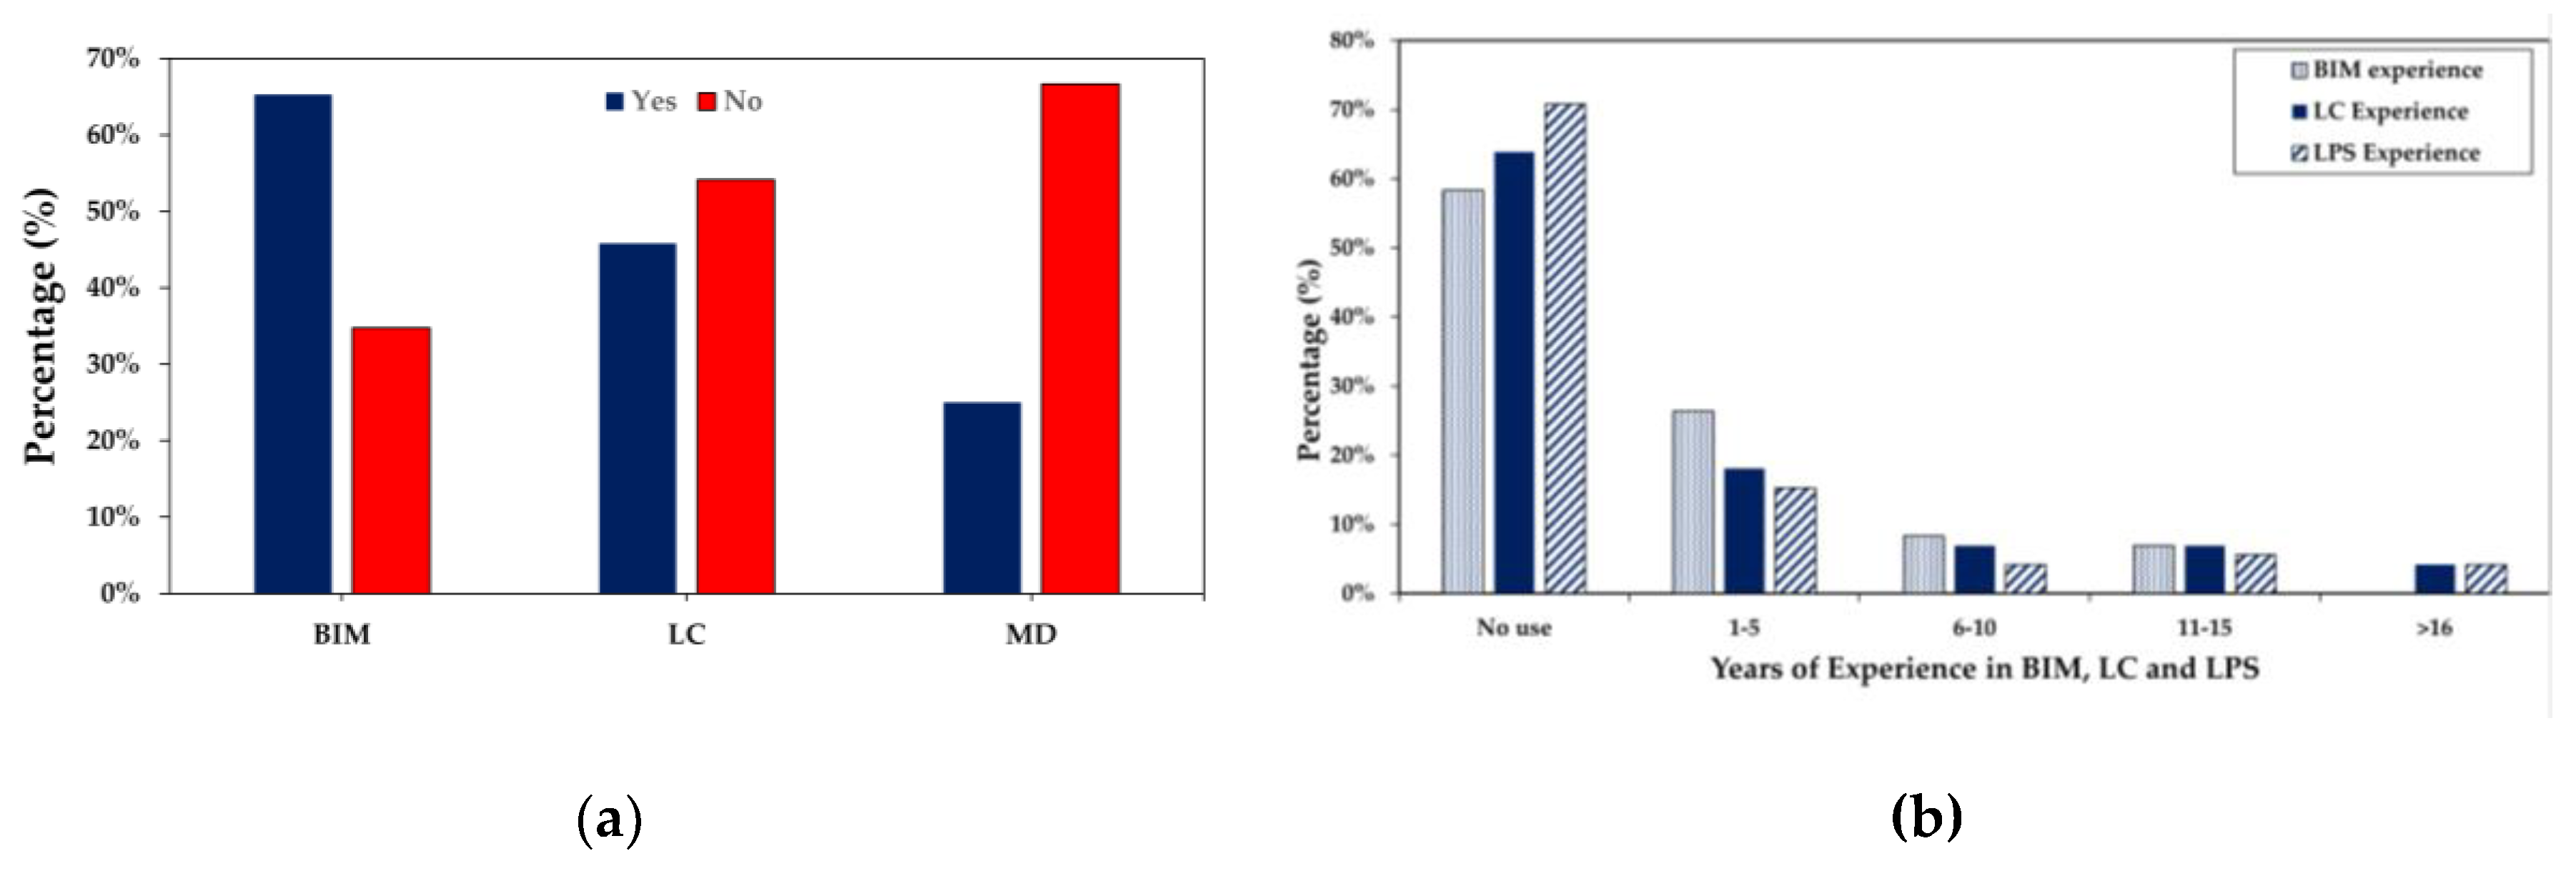
(a) The percentage of education or knowledge of Lean, BIM, and Making-Do terminology, as well as (b) experience in Lean and BIM (in years).
Figure 5.
(a) The percentage of education or knowledge of Lean, BIM, and Making-Do terminology, as well as (b) experience in Lean and BIM (in years).
Figure 6.
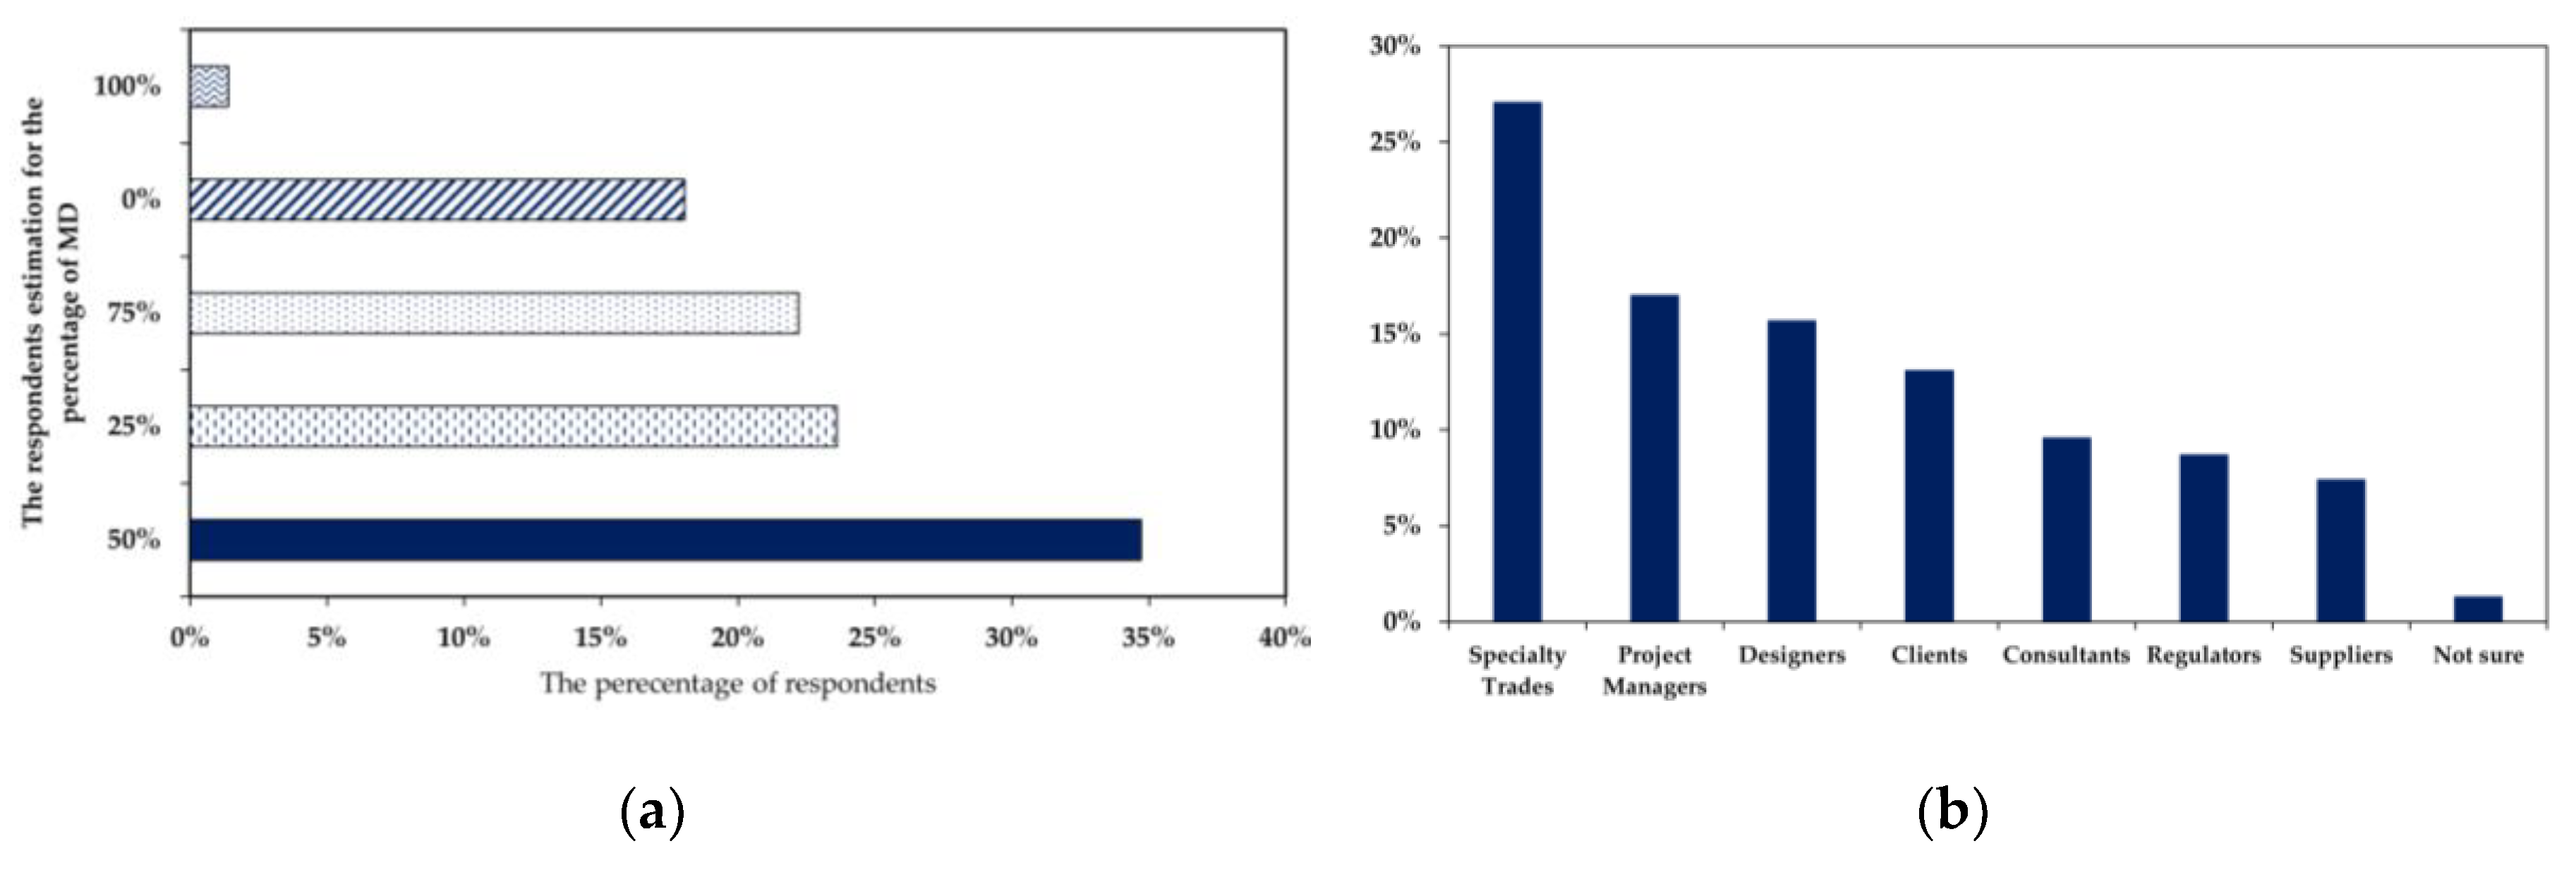
(a) Estimated Percentage of MD in construction workflows according to the respondents, (b) Examination of respondents’ perspectives on the entities accountable for Making-Do (MD) waste generation.
Figure 6.
(a) Estimated Percentage of MD in construction workflows according to the respondents, (b) Examination of respondents’ perspectives on the entities accountable for Making-Do (MD) waste generation.
Figure 7.
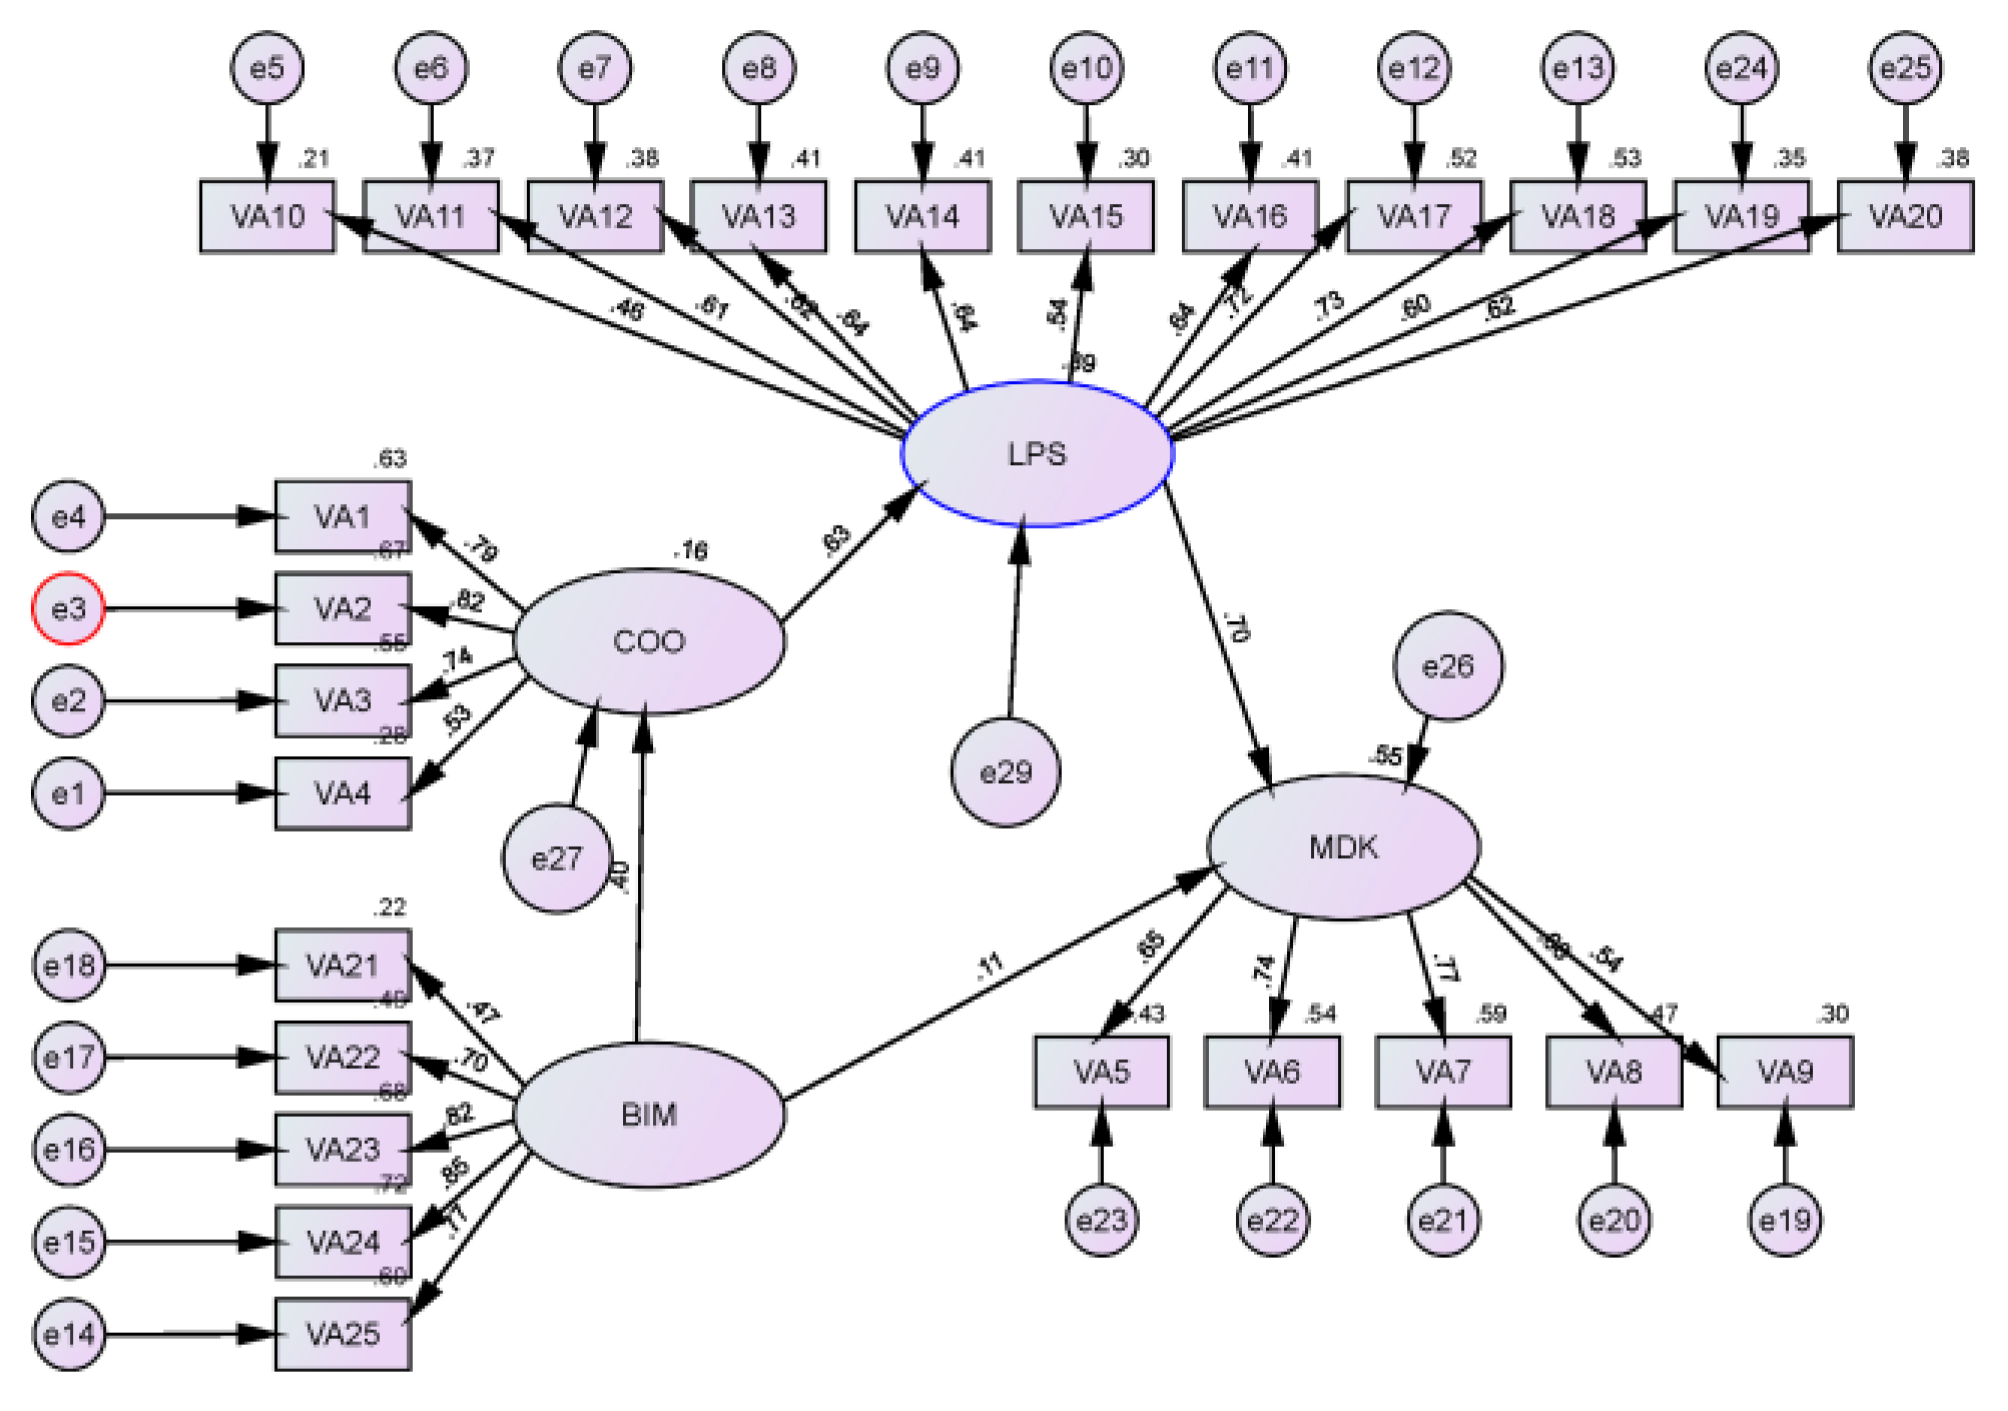
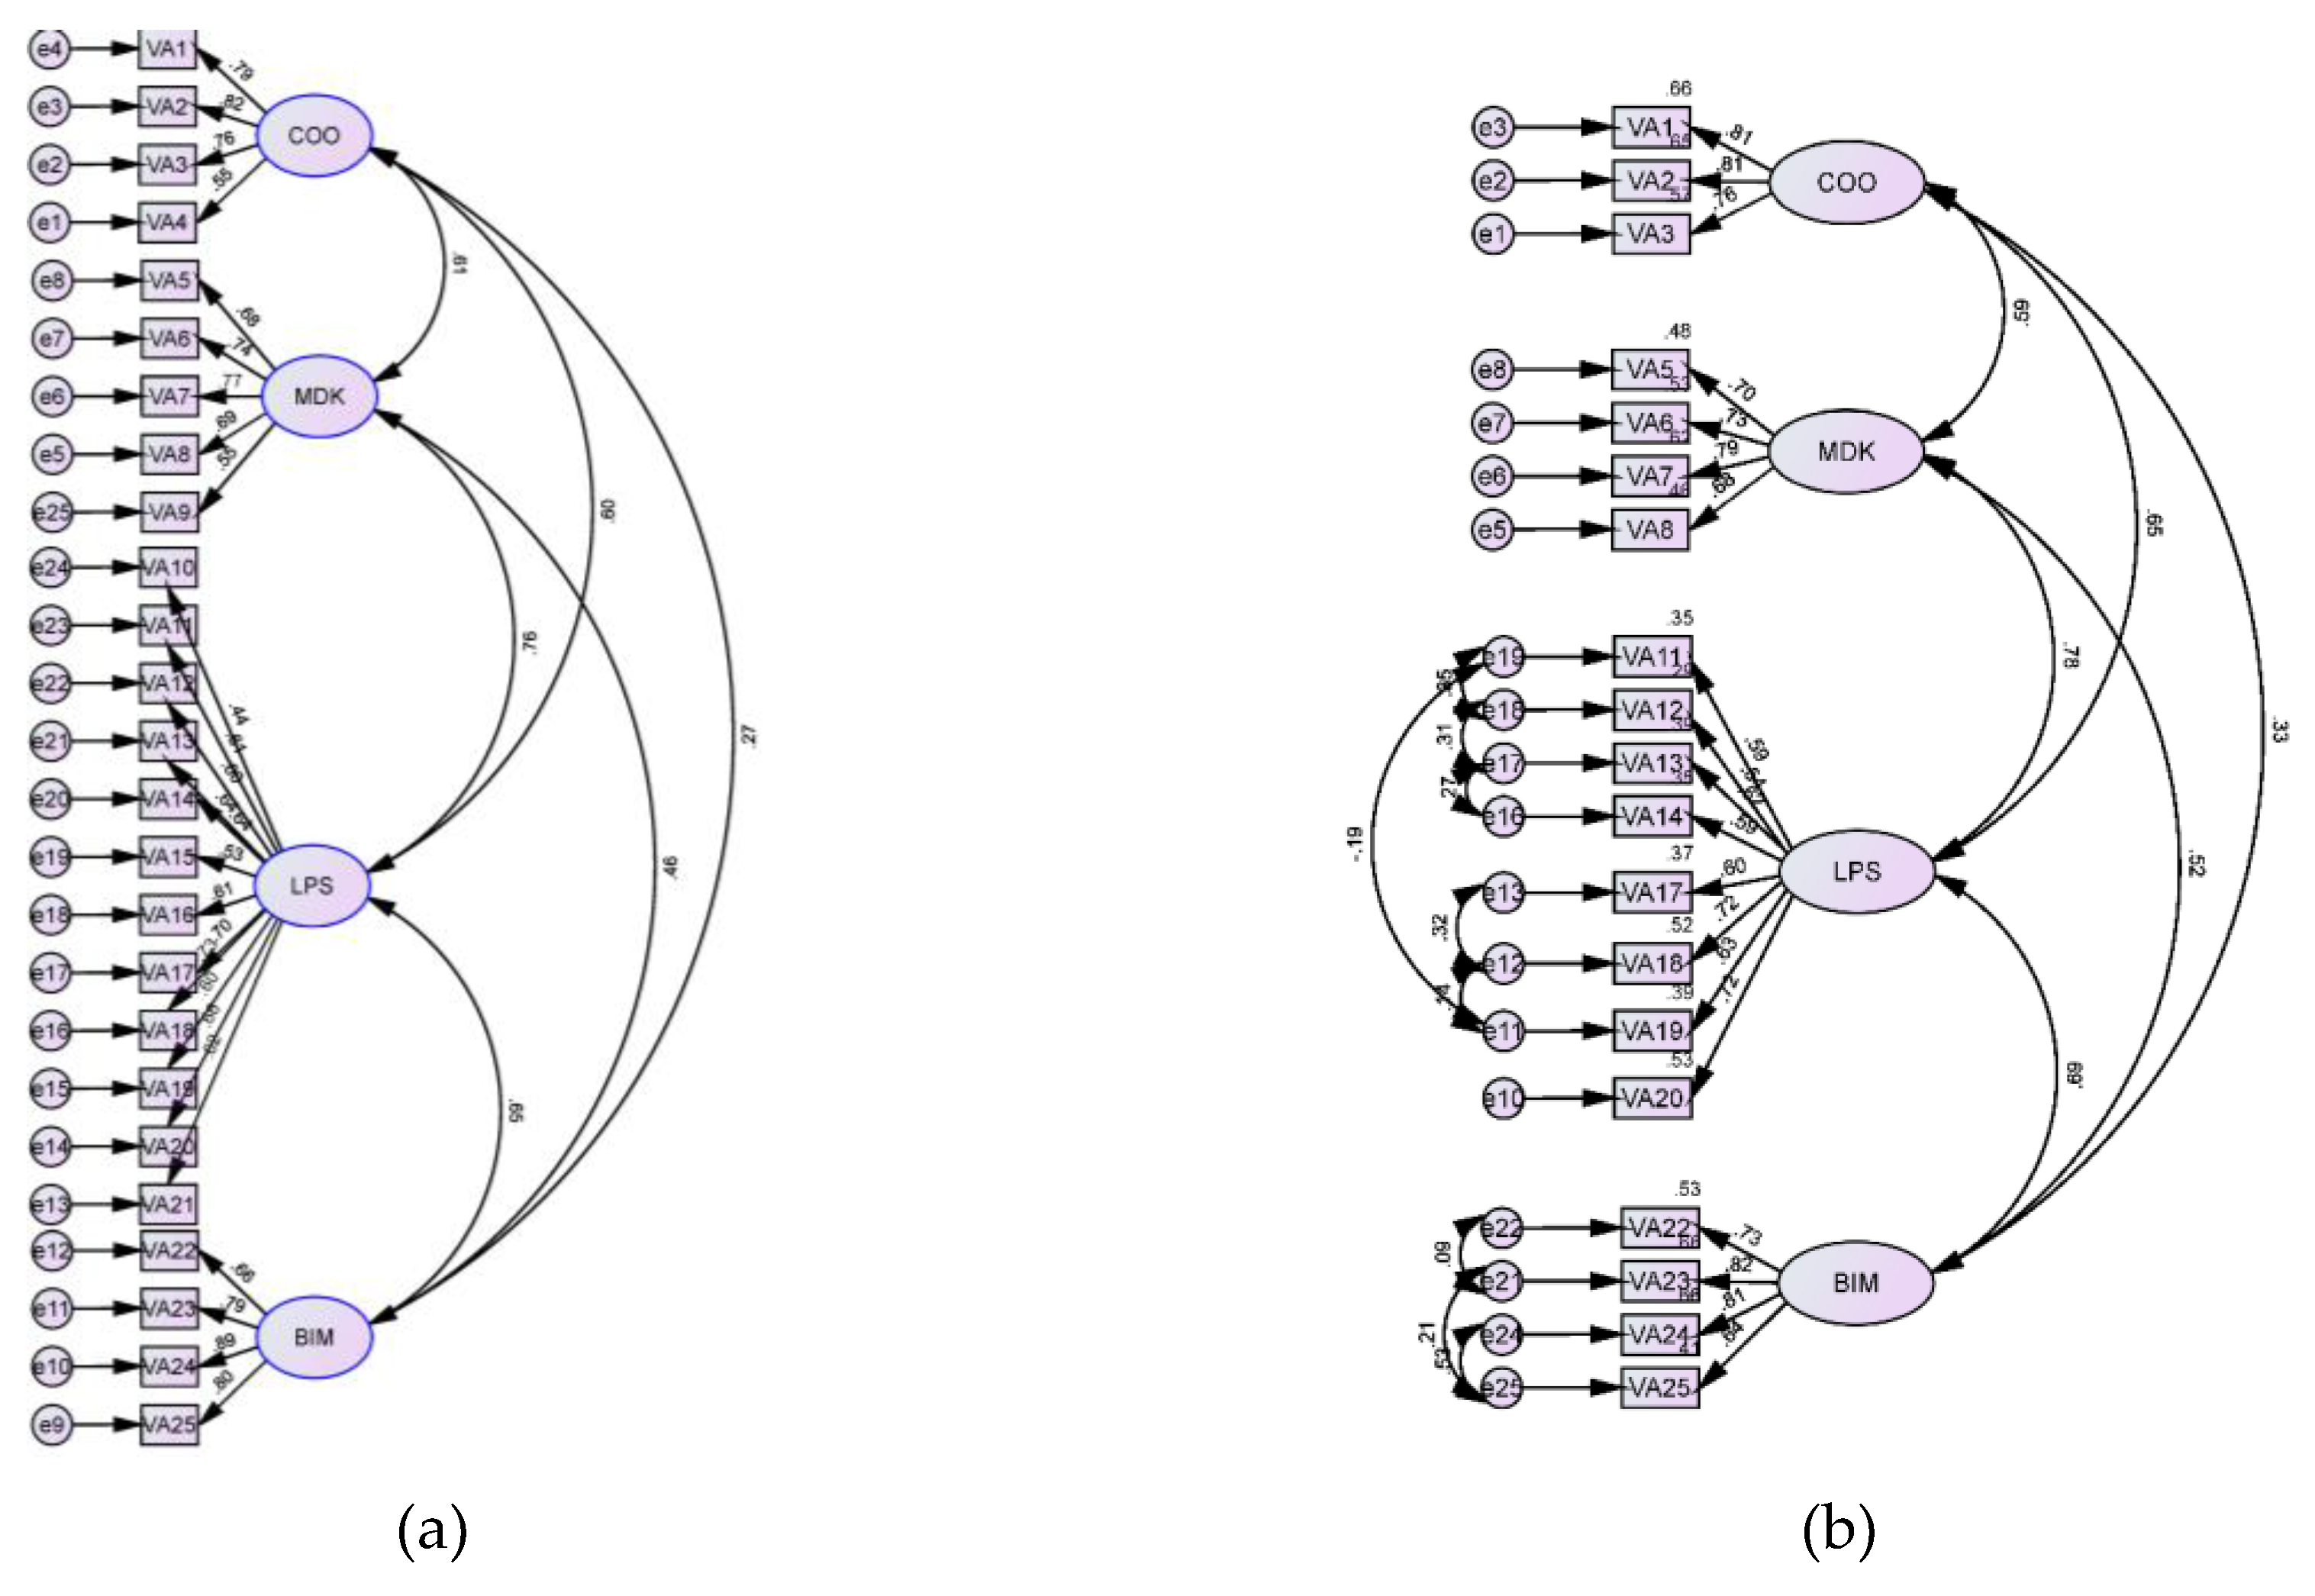
(a) Unadjusted Measurement Model (b) Adjusted Measurement Model.
Figure 7.
(a) Unadjusted Measurement Model (b) Adjusted Measurement Model.
Figure 9.
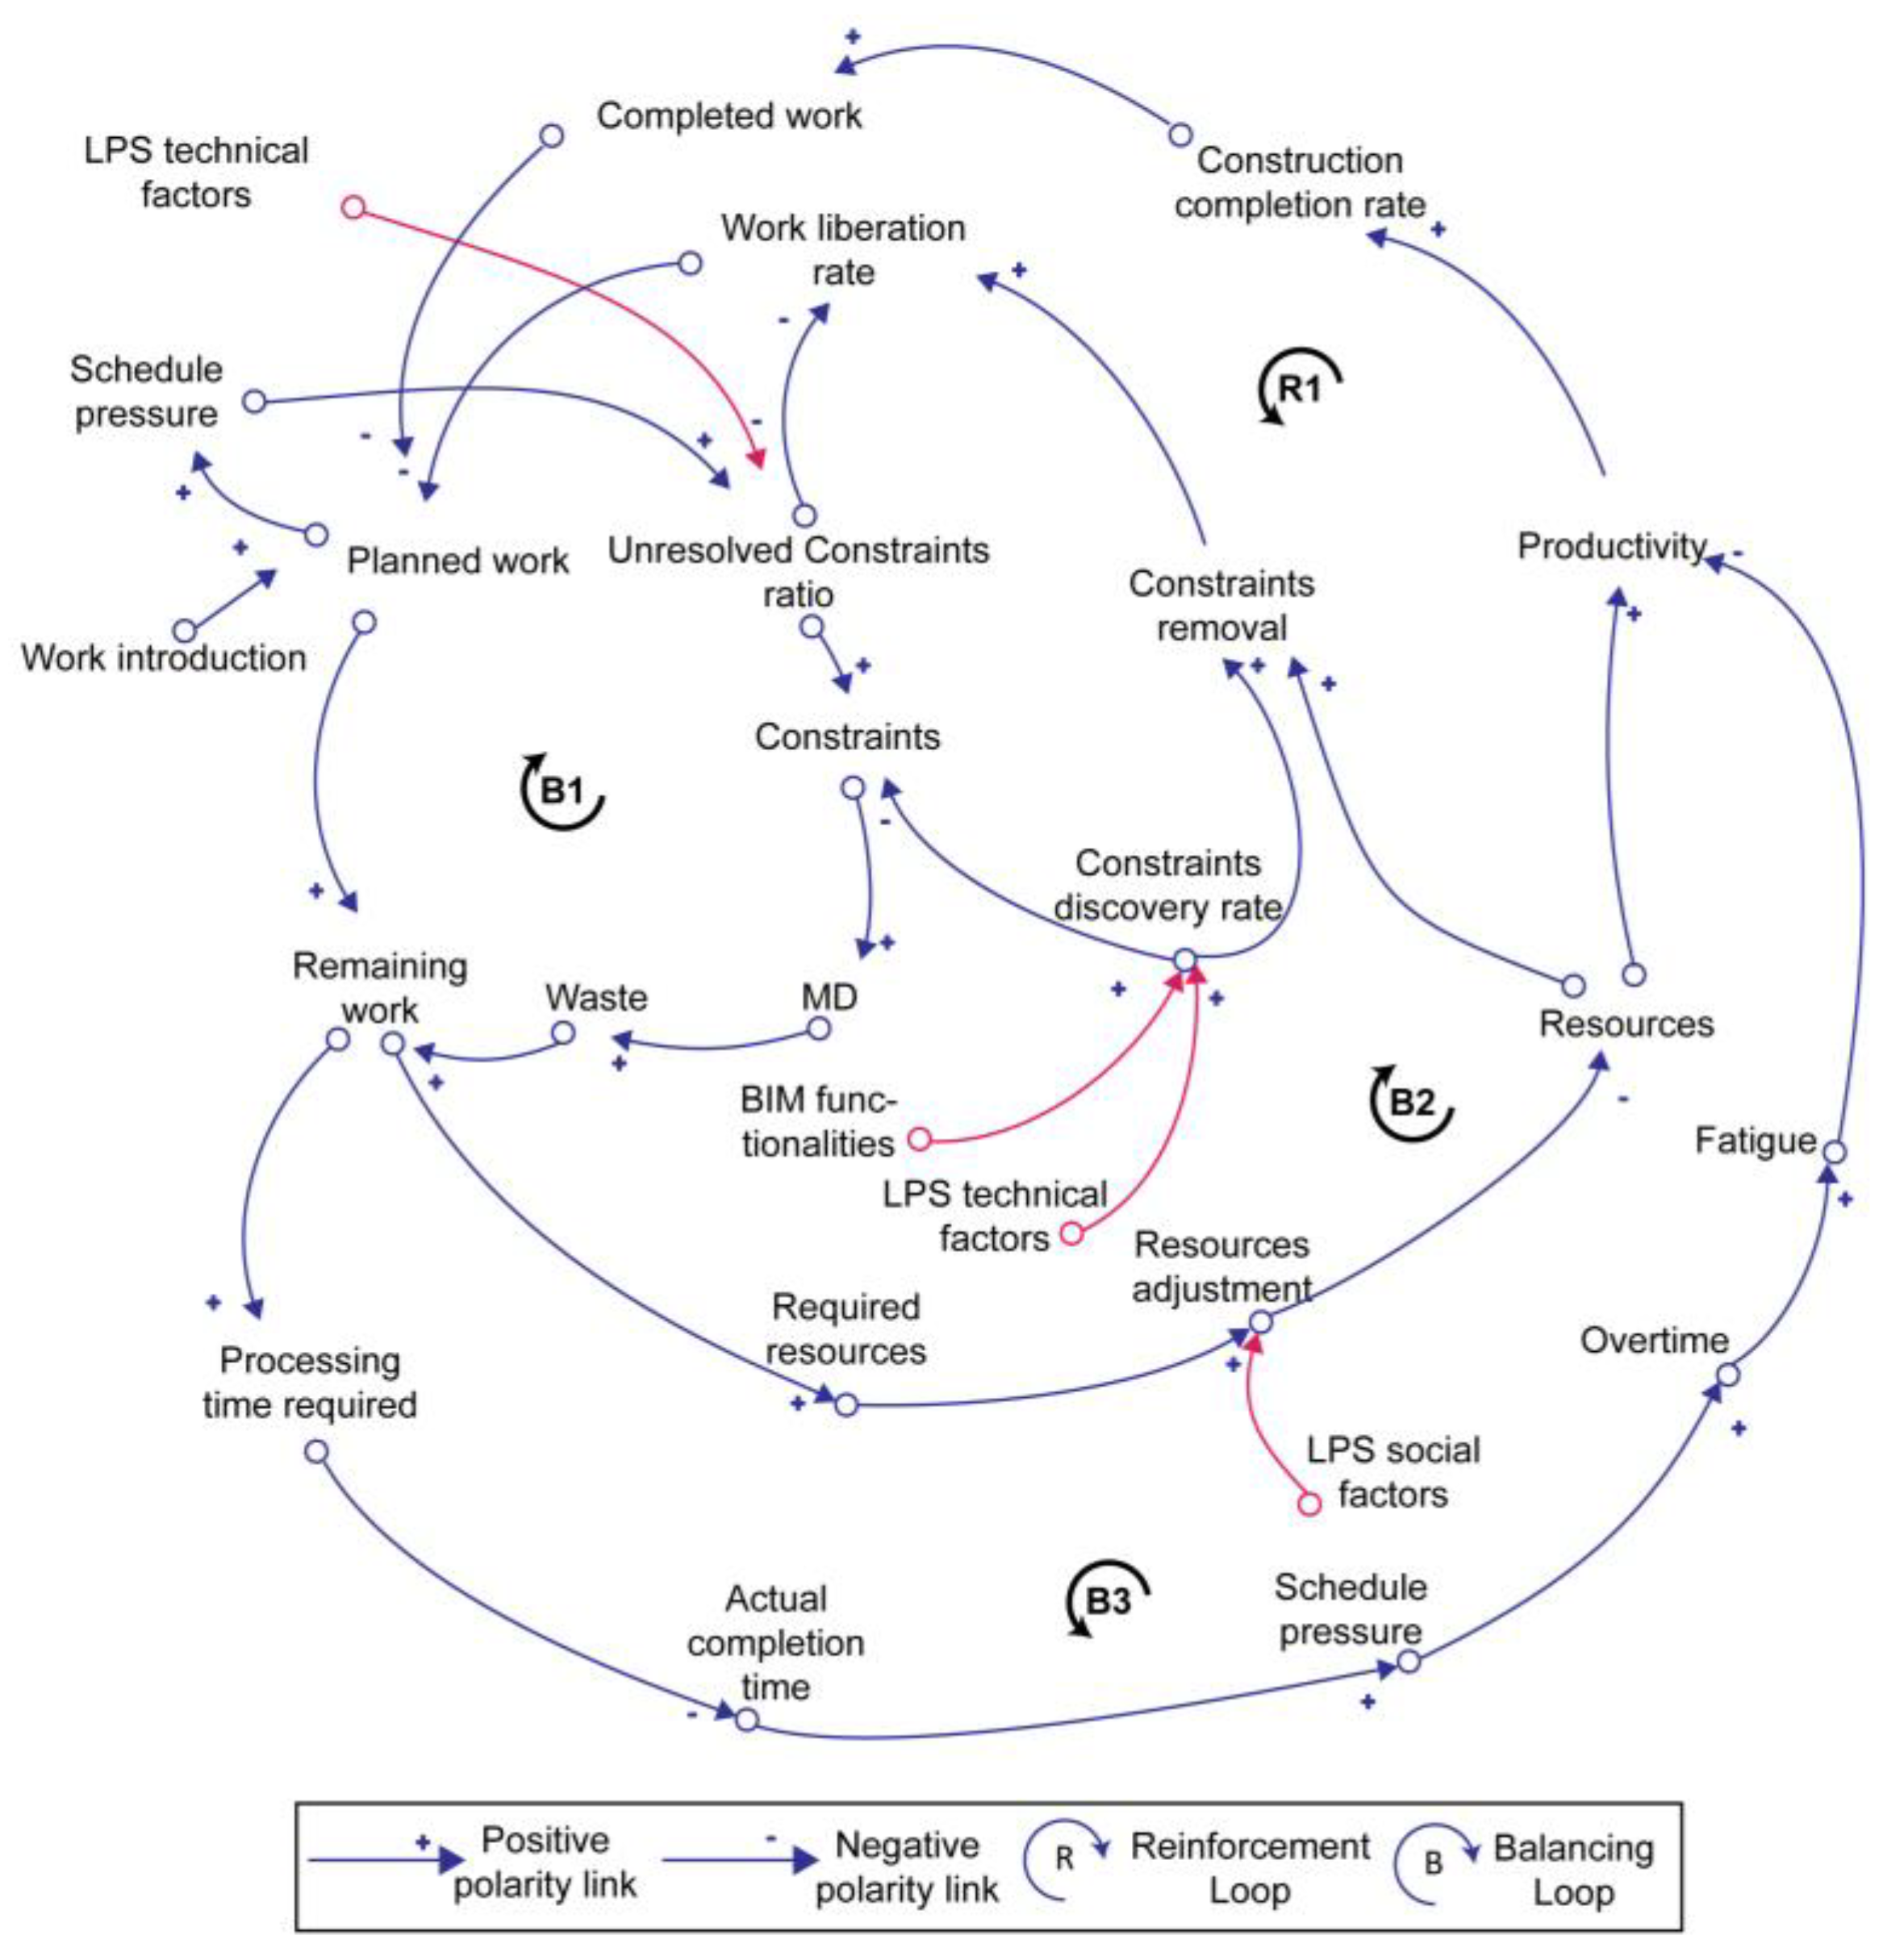
Casual Loop Diagram (CLD) of MD.
Figure 9.
Casual Loop Diagram (CLD) of MD.
Figure 10.
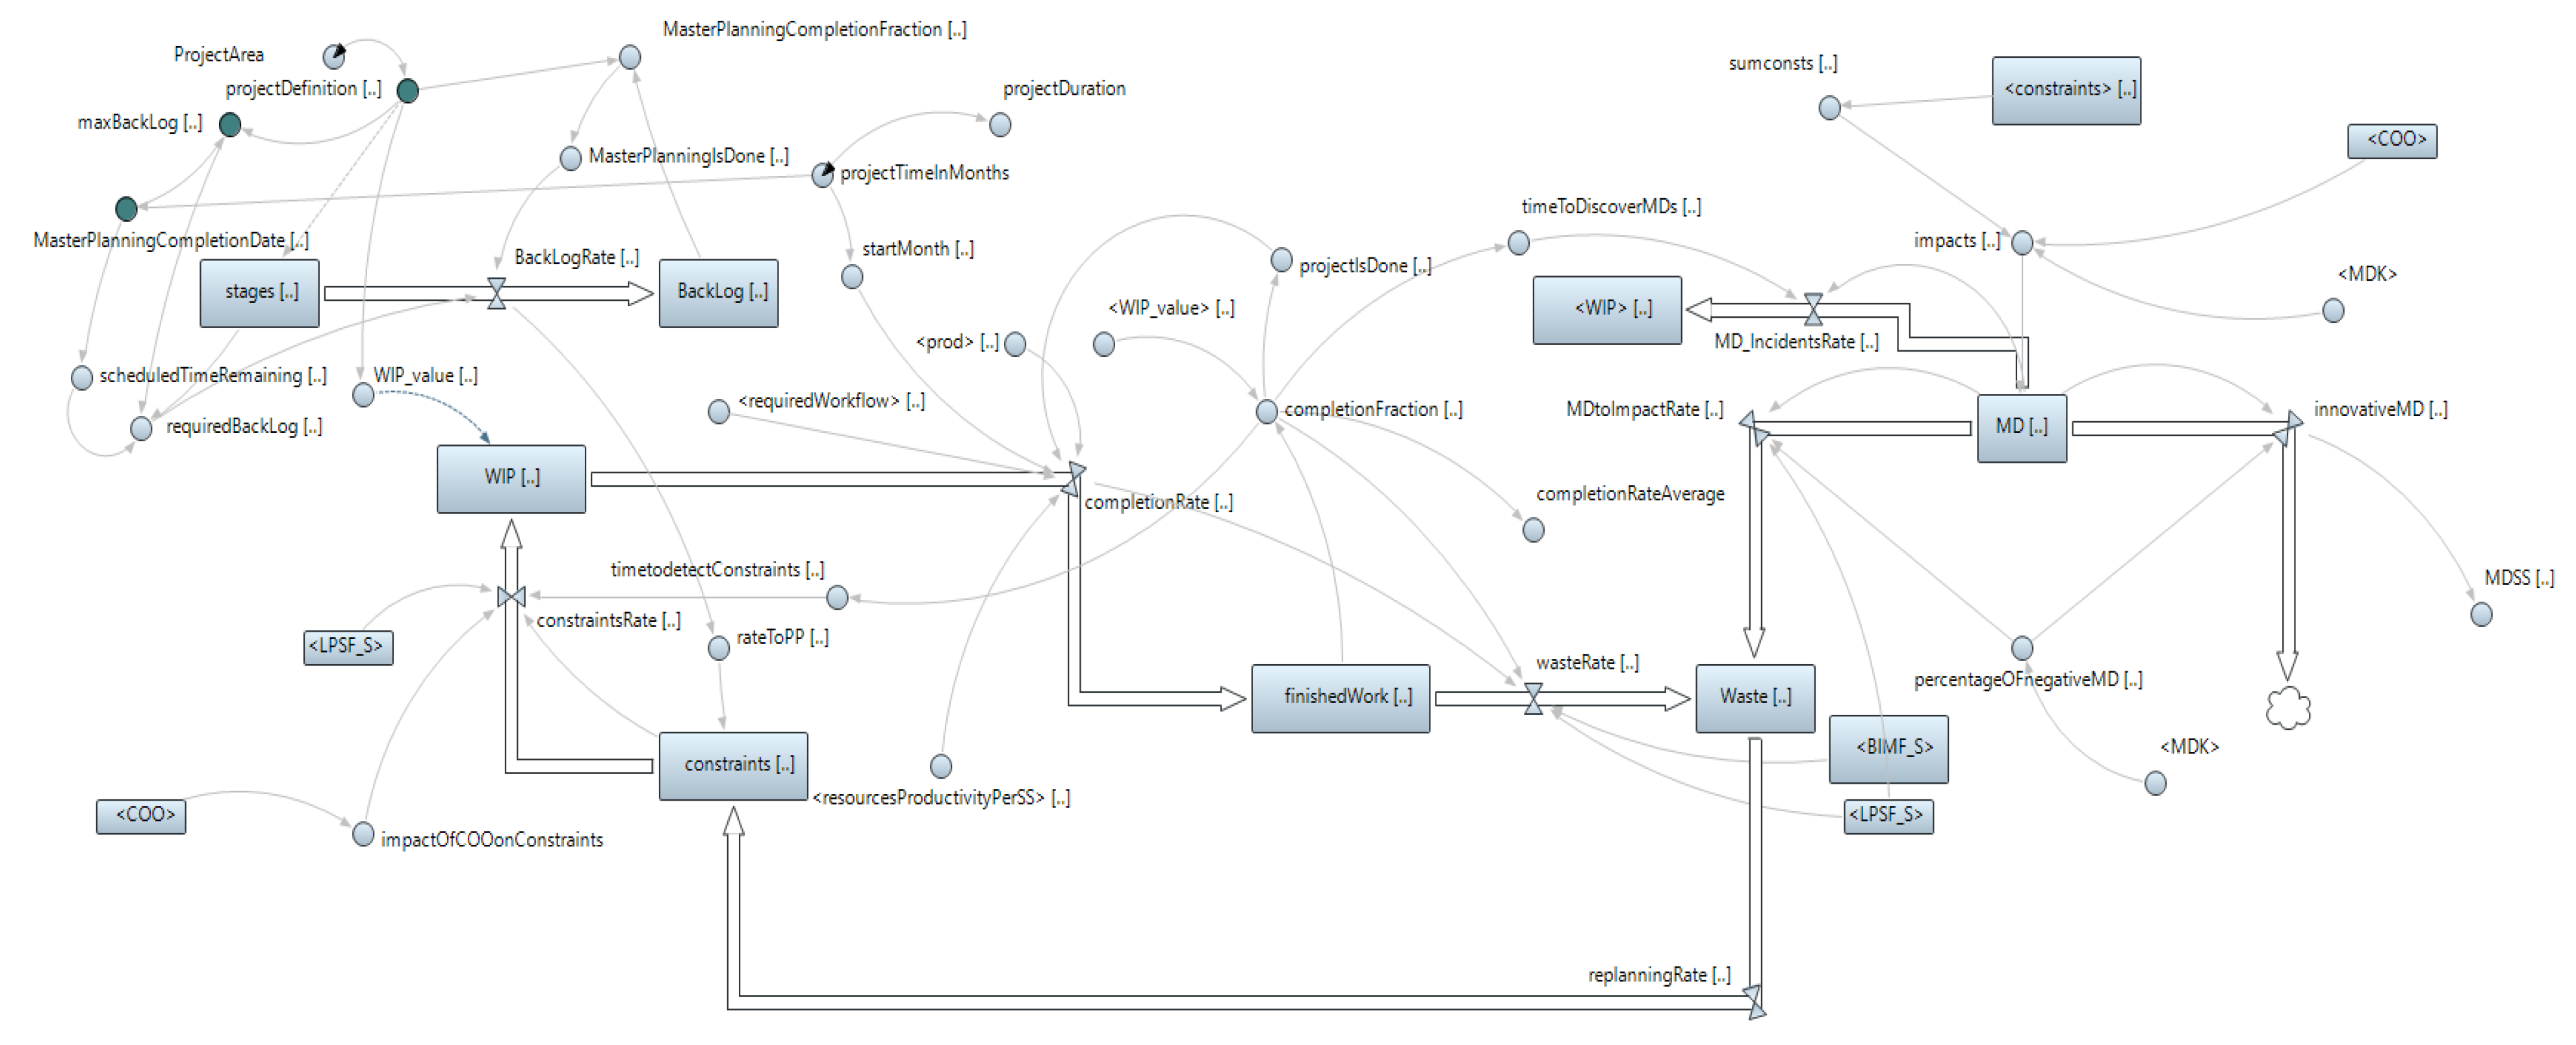
A generic view of the stock flow diagrams for MD waste.
Figure 10.
A generic view of the stock flow diagrams for MD waste.
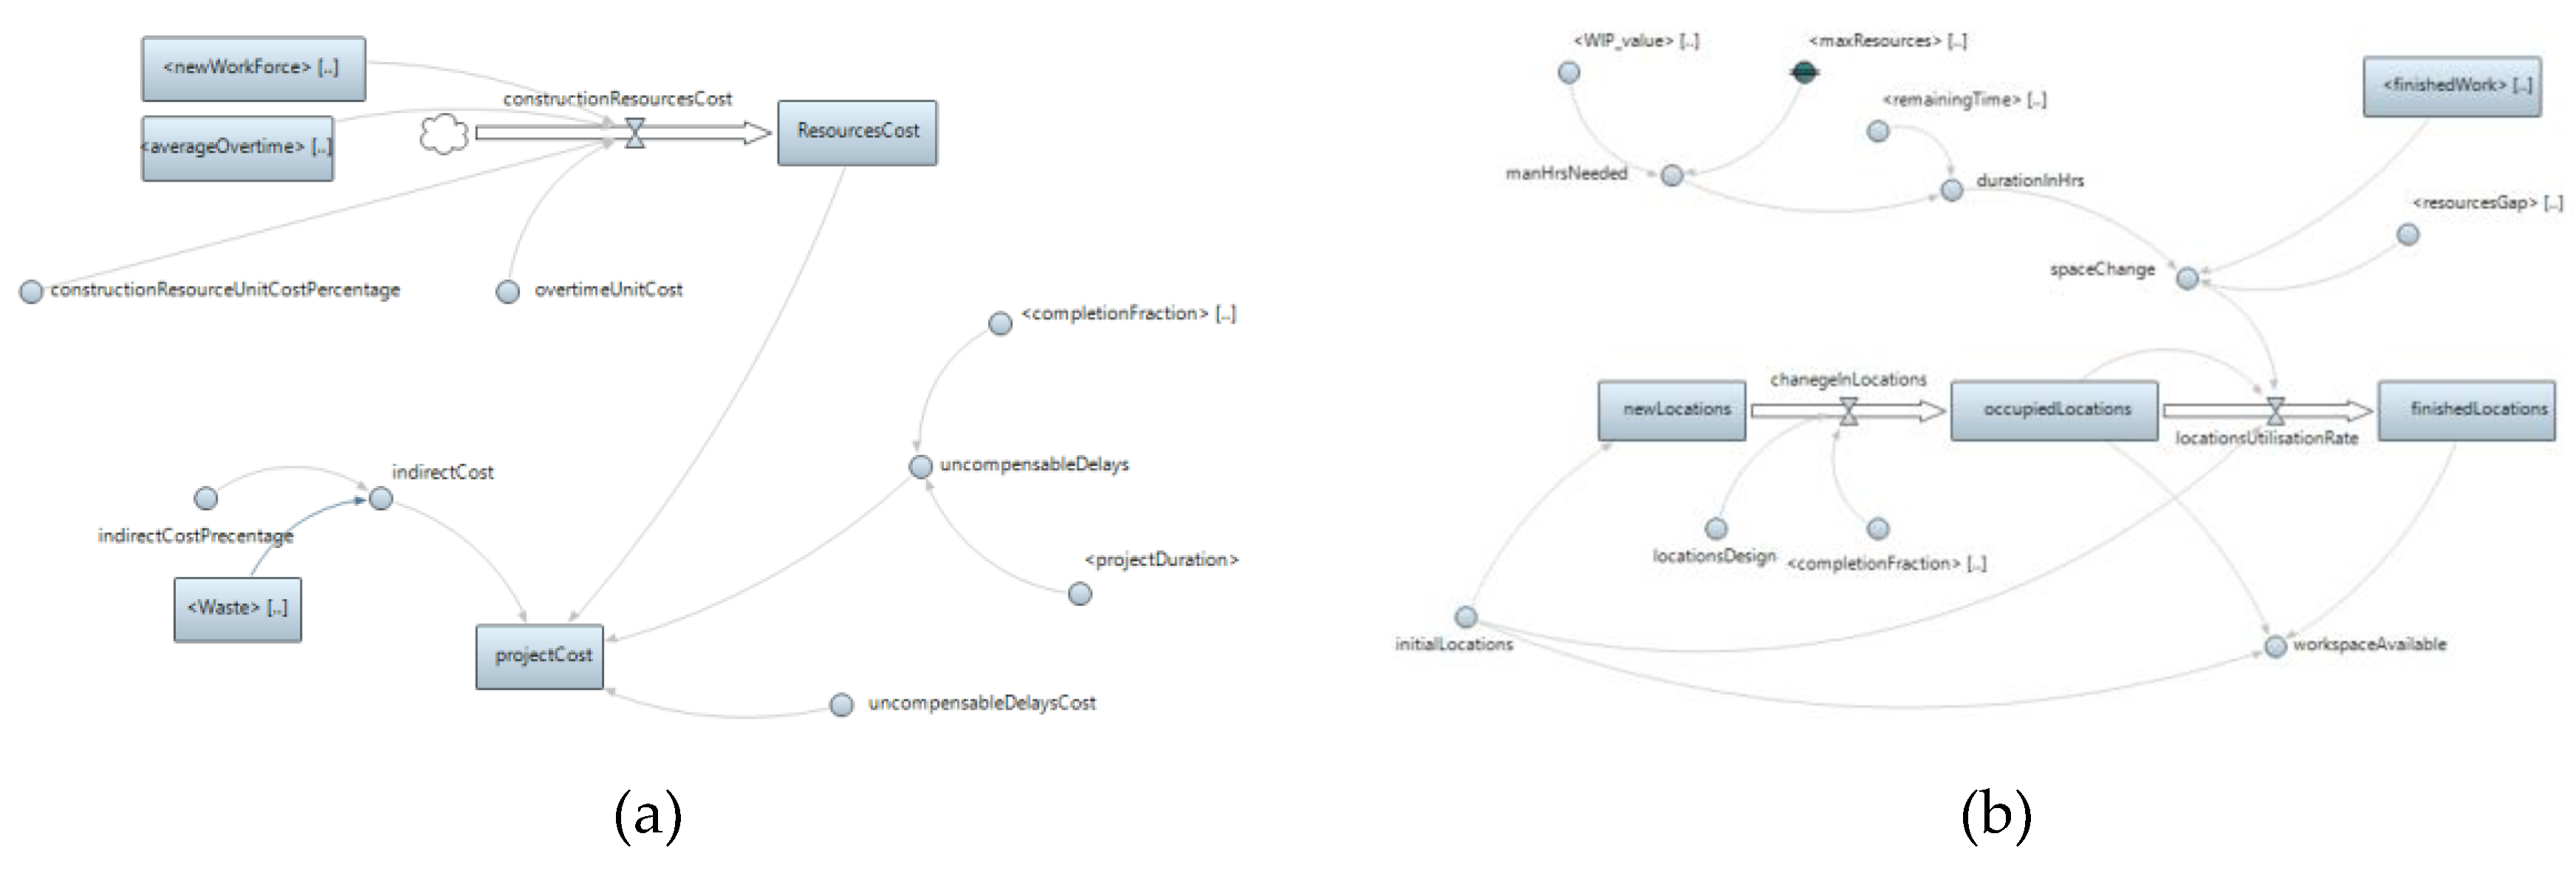
Figure 14.
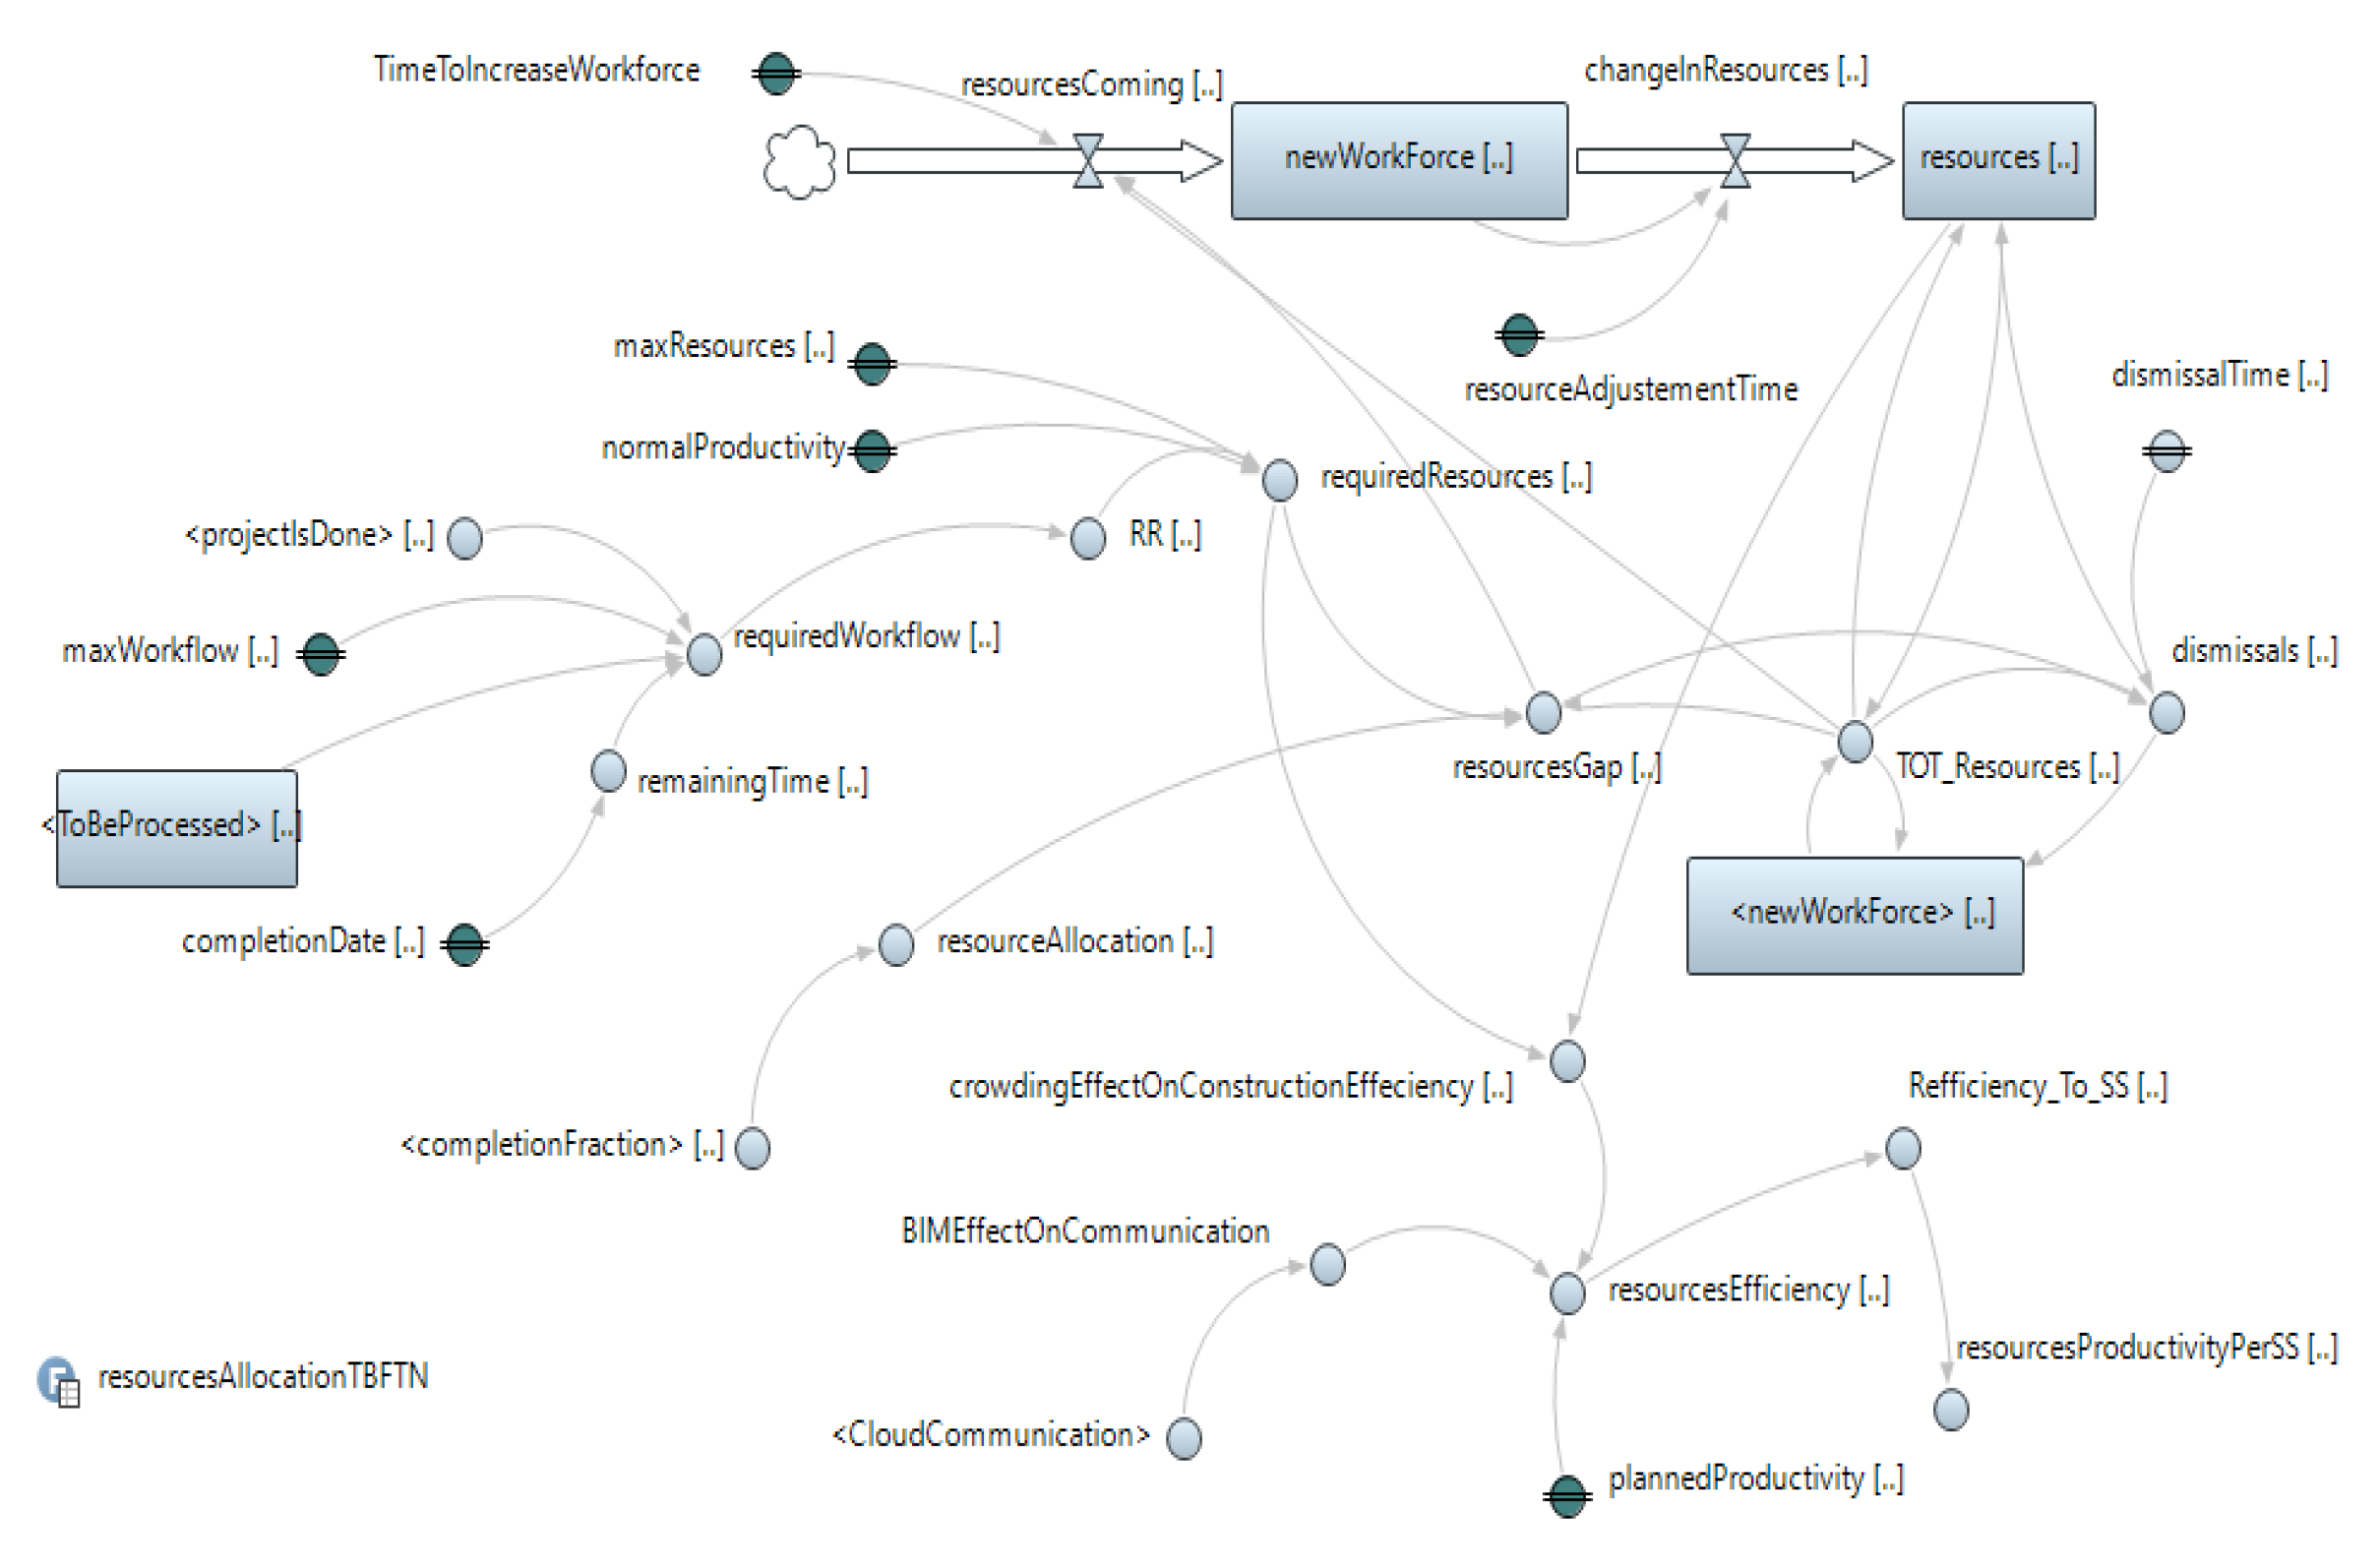
(a) cost; (b) Locations subsystems.
Figure 14.
(a) cost; (b) Locations subsystems.
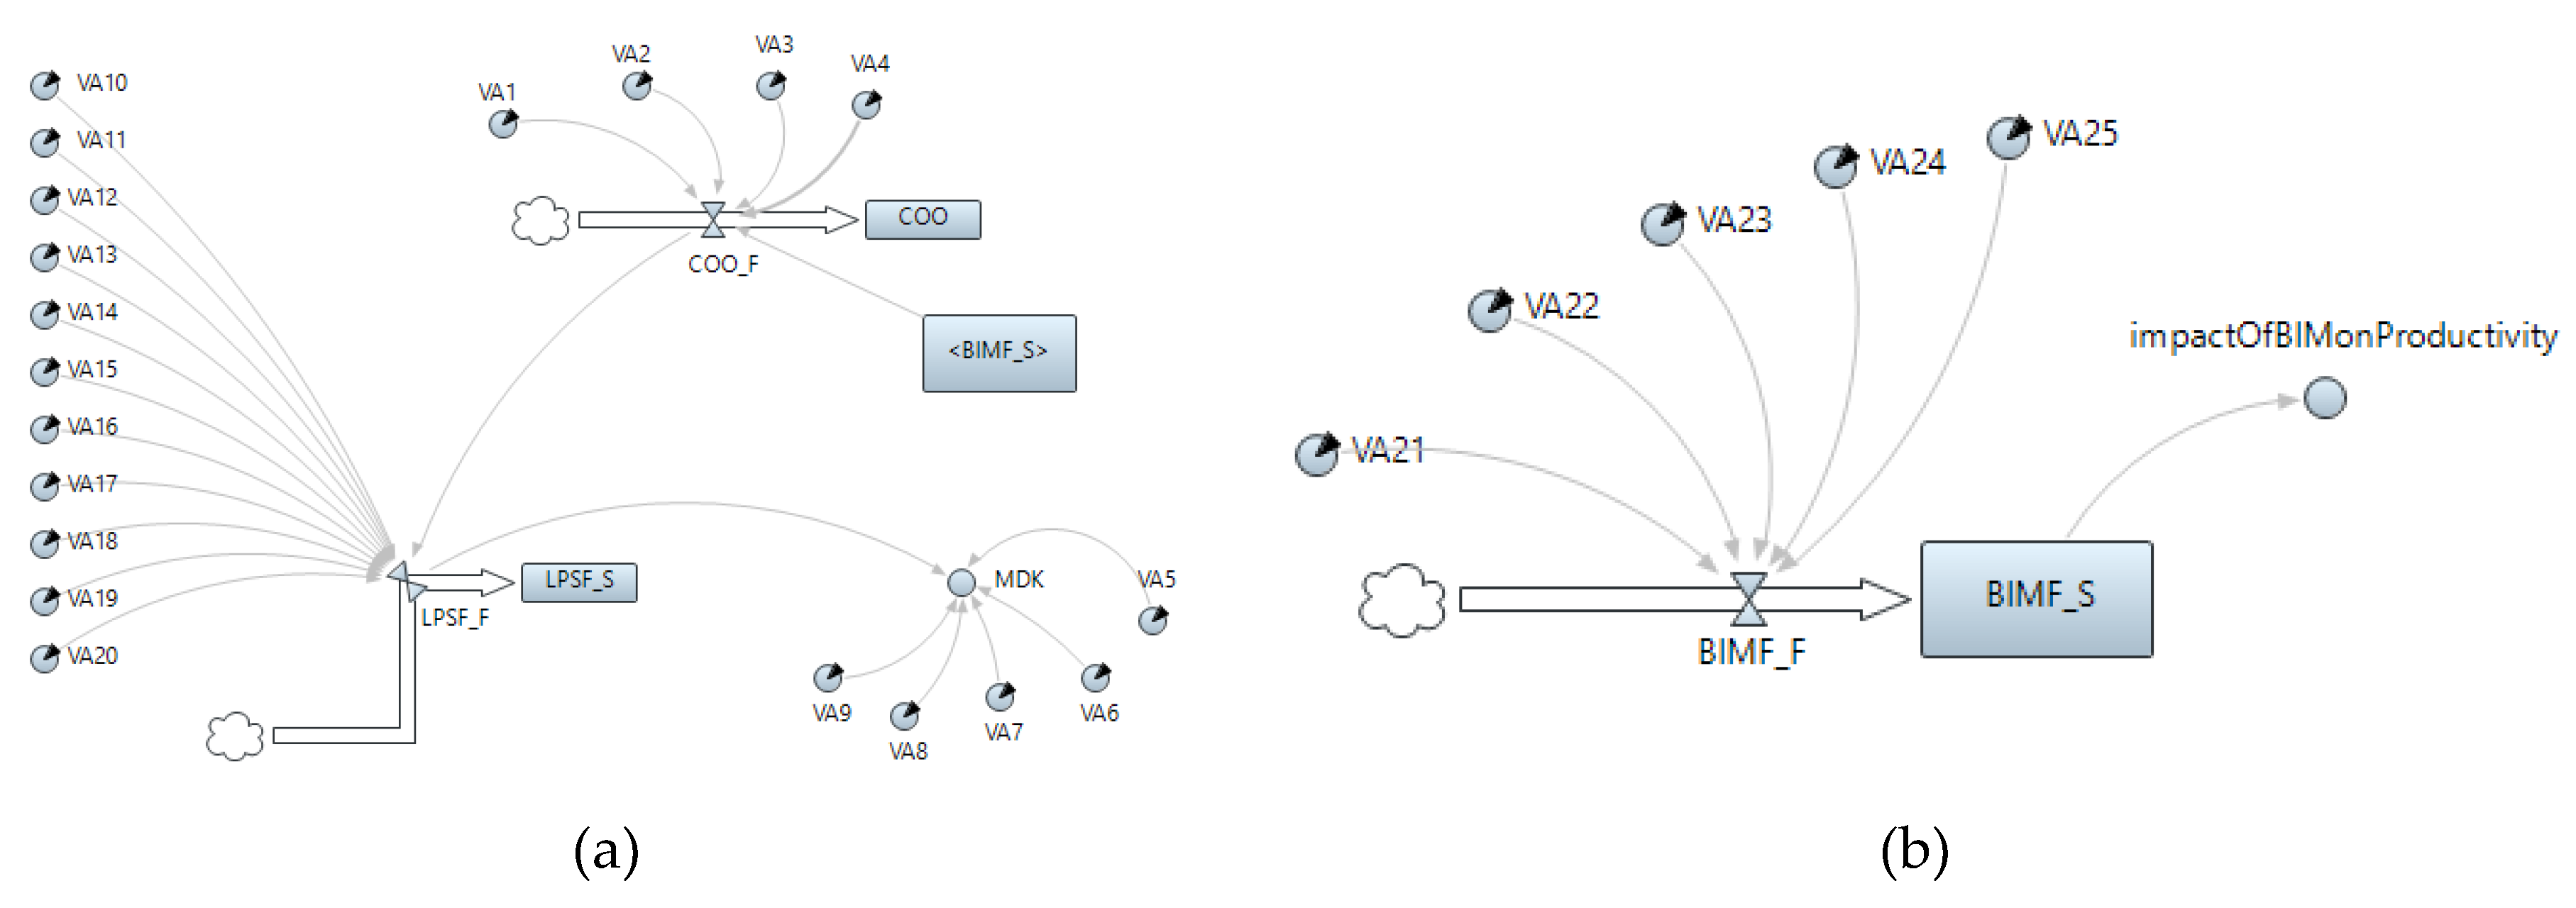
Figure 15.
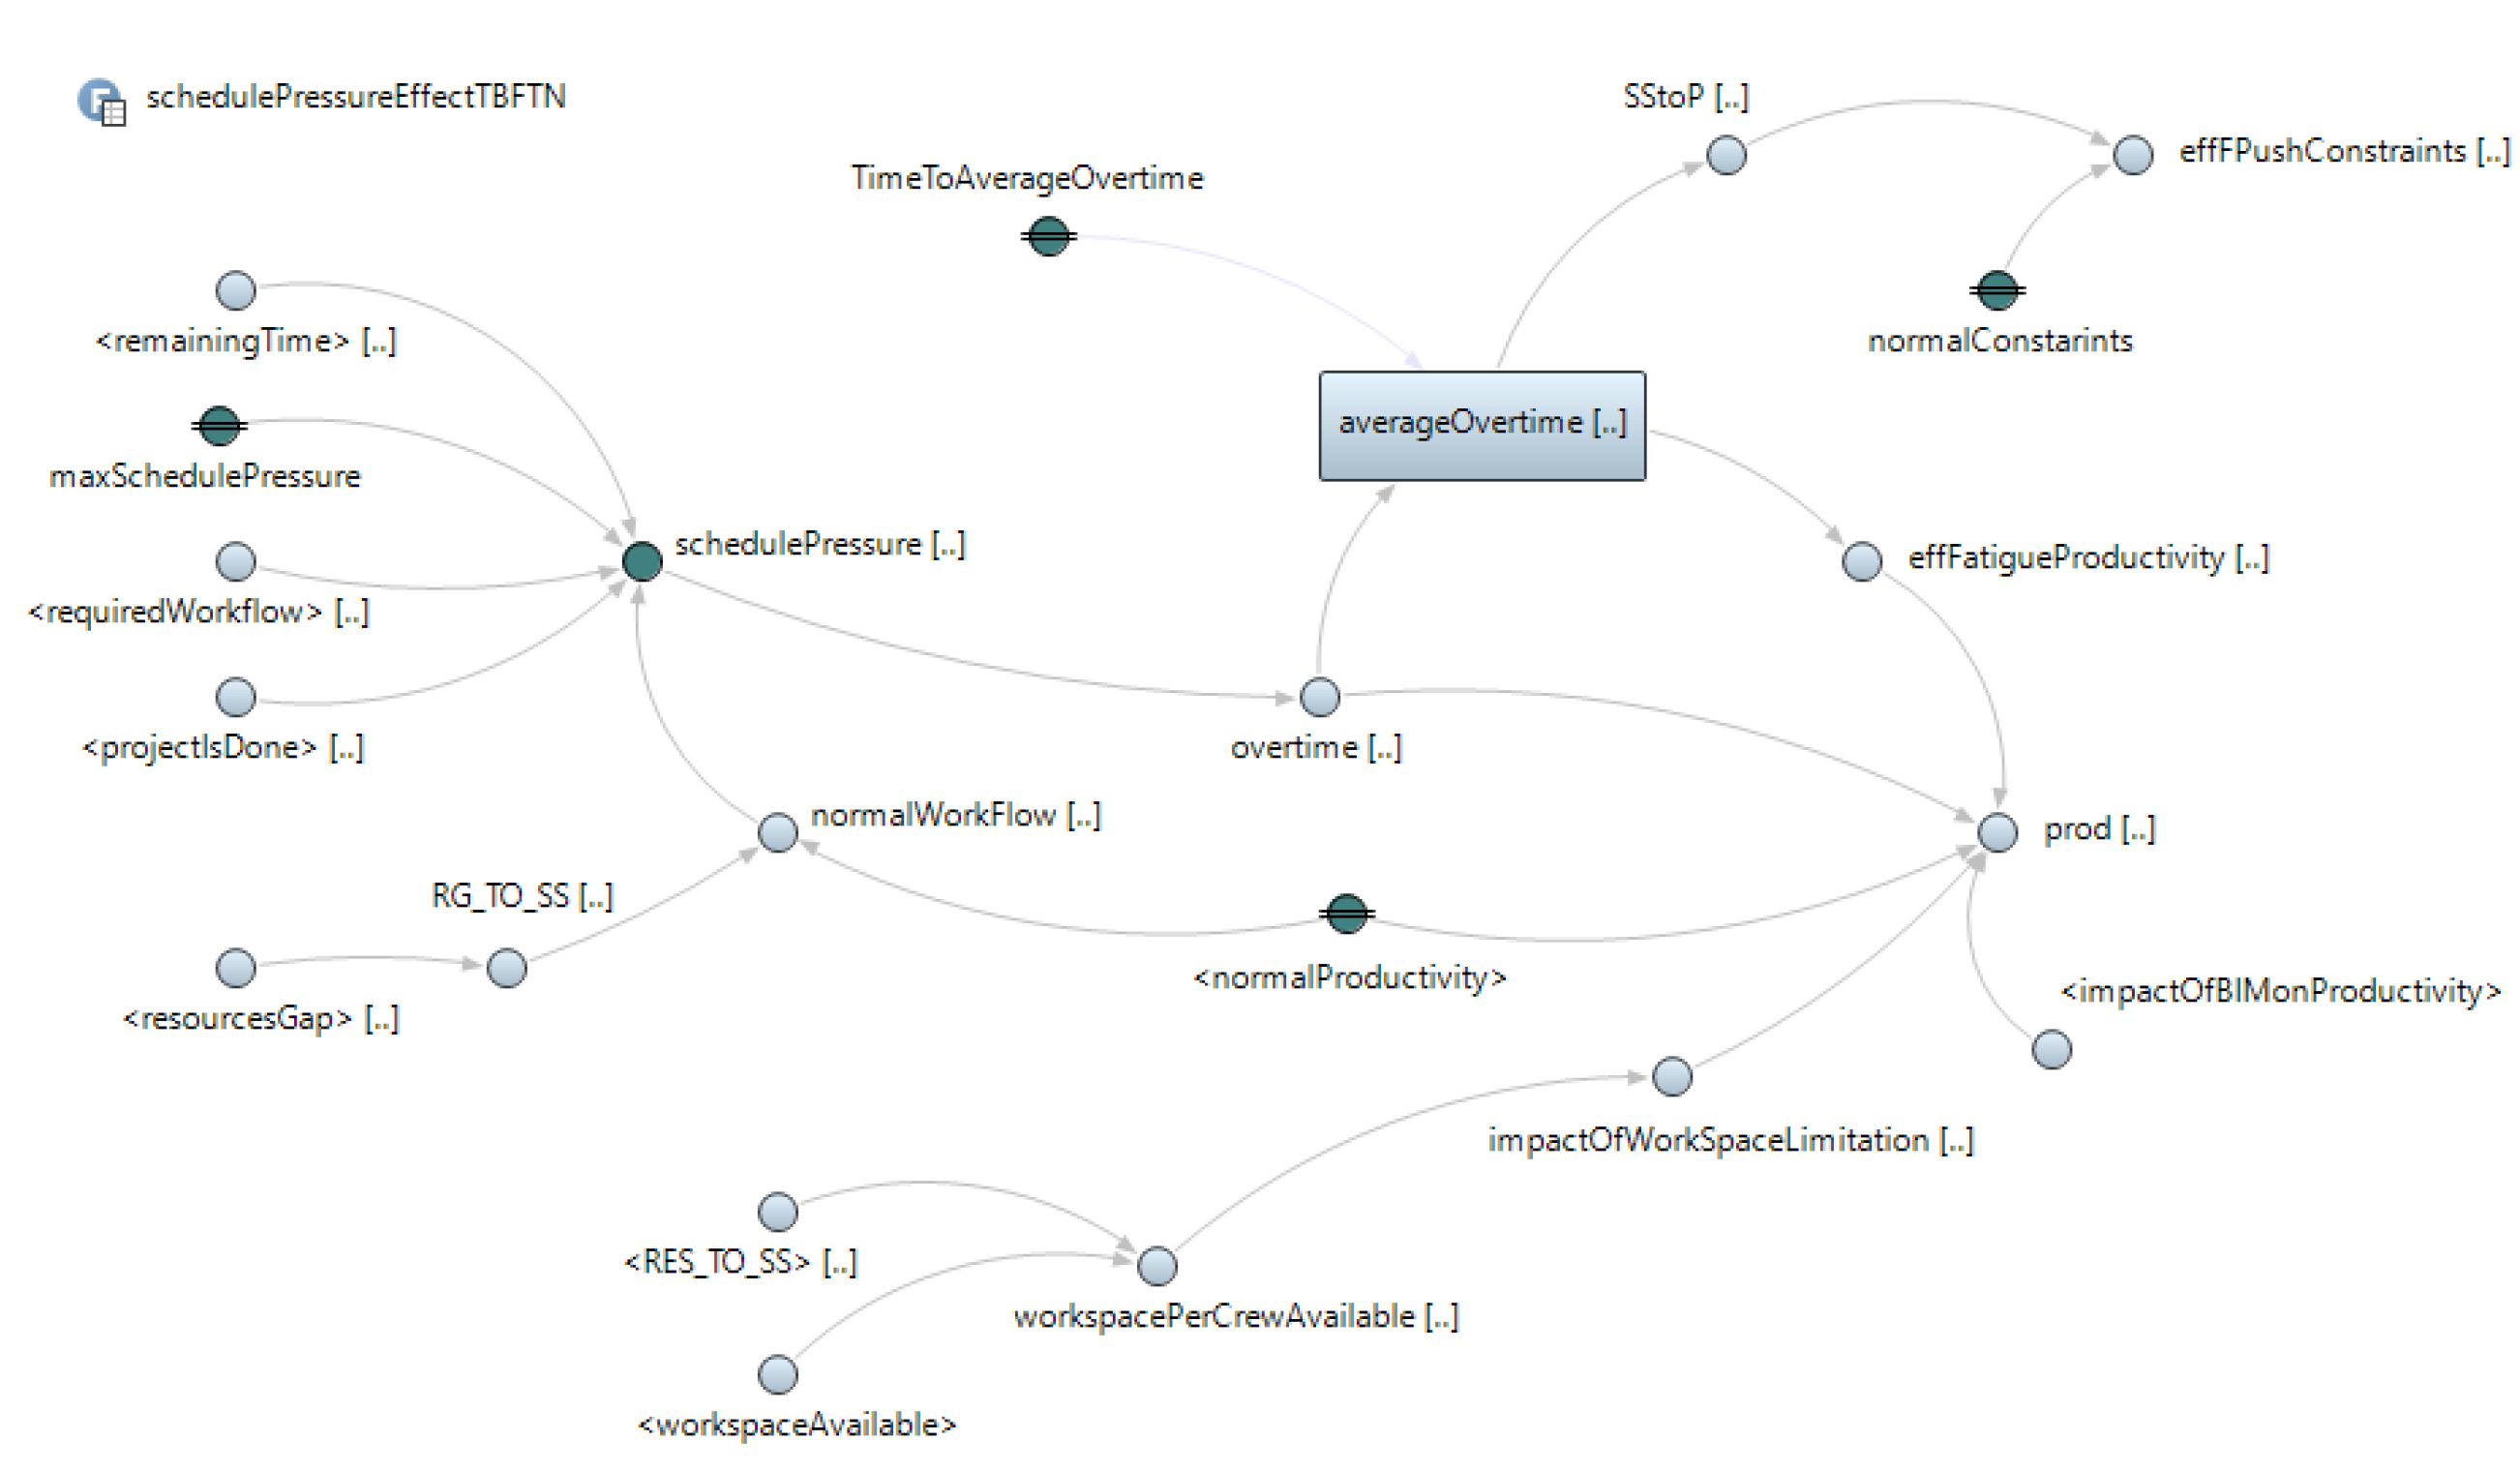
(a) LPS dynamic subsystem, (b) BIM dynamic subsystem.
Figure 15.
(a) LPS dynamic subsystem, (b) BIM dynamic subsystem.
Figure 16.
Comparative simulations for average constraints in project A between the baseline and scenarios I, II, III, and IV.
Figure 16.
Comparative simulations for average constraints in project A between the baseline and scenarios I, II, III, and IV.
Figure 17.
Comparative simulations for average MD categories in project A between the baseline and scenarios I, II, III, and IV.
Figure 17.
Comparative simulations for average MD categories in project A between the baseline and scenarios I, II, III, and IV.
Figure 18.
Comparative simulations for average Waste in project A between the baseline and scenarios I, II, III, and IV.
Figure 18.
Comparative simulations for average Waste in project A between the baseline and scenarios I, II, III, and IV.
Table 1.
Demographic characteristics of the survey respondents.
Table 1.
Demographic characteristics of the survey respondents.
| Responses |
Percentage |
| The total questionnaire was sent out. |
336 |
| Total submitted responses |
118 (35.12%) |
| Discarded responses |
2 |
| Total number of usable responses |
116 (34.52%) |
| Years of experience in the construction industry |
|
| 0-5 years |
23.61% |
| 6-10 years |
22.22% |
| 11-15 years |
19.44% |
| 16-20 years |
8.33% |
| Above 20 years |
12.50% |
Table 2.
Reliability analysis table with means and ranking of the LPS and BIM strategies for MD mitigation.
Table 2.
Reliability analysis table with means and ranking of the LPS and BIM strategies for MD mitigation.
| No |
Variable |
Mean |
Cronbach’s Alpha |
Rank |
| VA24 |
Identify and resolve time and space clashes using BIM Clash Detection tools. |
3.736 |
0.945 |
1 |
| VA23 |
Report task information in alignment with product specifications to ensure accuracy. |
3.722 |
0.945 |
2 |
| VA25 |
Facilitate the exchange and communication of Making-Do practices through online BIM models. |
3.722 |
0.944 |
3 |
| VA22 |
Utilize 4D planning to visualize constraints and their impact on project timelines. |
3.681 |
0.945 |
4 |
| VA5 |
Provide coaching, training, and seminars for superintendents and forepersons. |
3.653 |
0.945 |
5 |
| VA11 |
Ensure the availability of BIM models, design drawings, and site layout plans for reference during the Last Planner System implementation. |
3.611 |
0.944 |
6 |
| VA21 |
Facilitate daily discussions between trades to address constraints and coordinate activities. |
3.583 |
0.945 |
7 |
| VA2 |
Ensure high-level coordination among project stakeholders. |
3.542 |
0.946 |
8 |
| VA20 |
Collaboratively design operations using BIM for digital prototyping. |
3.486 |
0.945 |
9 |
| VA12 |
Maintain transparency by keeping all plans publicly accessible. |
3.472 |
0.945 |
10 |
| VA14 |
Apply constraints analysis proactively to identify and address potential issues as a team. |
3.472 |
0.945 |
11 |
| VA9 |
Facilitate knowledge exchange and sharing experiences among different companies. |
3.458 |
0.945 |
12 |
| VA3 |
Facilitate discussions to address concerns and foster consensus. |
3.444 |
0.945 |
13 |
| VA7 |
Establish a data bank to clarify misconceptions regarding Lean construction, Making-Do, and Last Planner System principles. |
3.444 |
0.946 |
14 |
| VA1 |
Handle disagreements and interests effectively to foster collaboration. |
3.431 |
0.947 |
15 |
| VA6 |
Process and translate knowledge from experiential learning into actionable insights. |
3.403 |
0.946 |
16 |
| VA13 |
Utilize guiding information across digital and physical environments to enhance understanding. |
3.403 |
0.946 |
17 |
| VA17 |
Involve stakeholders in constraints management processes to enhance Collaboration in Mitigating MD. |
3.347 |
0.944 |
18 |
| VA8 |
Learn from past incidents of making do. |
3.306 |
0.946 |
19 |
| VA16 |
Encourage stakeholders to communicate and share any constraints that may impede progress. |
3.278 |
0.945 |
20 |
| VA10 |
Compare and analyze multiple cases to understand how Making-Do is managed. |
3.264 |
0.946 |
21 |
| VA4 |
Adapt local adjustments to align with organizational requirements. |
3.181 |
0.947 |
22 |
| VA18 |
Maintain a workable backlog of tasks to prioritize and manage workload effectively. |
3.153 |
0.944 |
23 |
| VA15 |
Delay tasks with uncertain constraints to avoid potential disruptions. |
2.931 |
0.947 |
24 |
| VA19 |
Break down tasks from processes to operations and further to individual tasks for clarity of management and control. |
2.889 |
0.947 |
25 |
Table 3.
Measurement Model Validation.
Table 3.
Measurement Model Validation.
| Fit Indices |
Recommended Value |
Indices before adjustment |
Indices after adjustment |
|
Probability level
|
Insignificant |
0.000 |
0.000 |
|
CMIN (Chi-Square/df)
|
3-5 |
2.044 |
1.418 |
|
CFI
|
>0.90 |
0.803 |
0.946 |
|
TLI
|
>0.90 |
0.780 |
0.932 |
|
SRMR
|
<0.08 |
0.083 |
0.063 |
|
RMSEA
|
<0.08 |
0.094 |
0.060 |
Table 4.
Loadings, Reliability, and Convergent Validity.
Table 4.
Loadings, Reliability, and Convergent Validity.
| Items |
Alpha |
CR* |
AVE** |
|
Collaboration
|
0.815 |
0.835 |
0.628 |
|
Making-Do Knowledge
|
0.811 |
0.813 |
0.552 |
|
LPS Functions
|
0.873 |
0. 839 |
0. 397 |
|
BIM Functionalities
|
0.843 |
0.838 |
0.567 |
Table 5.
Mediation Analysis Summary.
Table 5.
Mediation Analysis Summary.
| Relationship |
Direct Effect |
Indirect Effect |
Confidence Interval |
P-value |
Conclusion |
| |
|
|
Lower Bound |
Upper Bound |
|
|
| COO → BIM → MDK |
0.262 |
0.033 |
-0.025 |
0.192 |
0.314 |
No Mediation |
| COO → LPS → MDK |
0.268 |
0.066 |
0.528 |
0.002 |
Partial Mediation |
Table 6.
Constraints, MD, and MD impacts.
Table 6.
Constraints, MD, and MD impacts.
| |
Constraints |
|
MD Categories |
|
MD impacts |
| P1 |
External Conditions |
CAT1 |
Access and Movement |
I1 |
Decreased Productivity |
| P2 |
Information |
CAT2 |
Component Adjustment |
I2 |
Material Waste |
| P3 |
Interdependent Tasks |
CAT3 |
Equipment/Tools |
I3 |
Quality Deviation |
| P4 |
Labor |
CAT4 |
Sequencing |
I4 |
Rework |
| P5 |
Materials and components |
CAT5 |
Workspace |
I5 |
Unfinished works |
| P6 |
Space |
|
|
|
|
Table 7.
Comparative Overview of Multistorey Condominium Projects: Case A, B, and C.
Table 8.
Comparison of baseline simulated data with project data.
Table 8.
Comparison of baseline simulated data with project data.
| Category |
Cost increase ($) |
Actual Completion Rate (%) |
Total MD (Tasks) |
Total Constraints (Tasks) |
Total Waste (Tasks) |
| Baseline A |
76,849.337 |
82.540 |
209.126 |
1956.066 |
3,600.587 |
| Project A data |
75,950.000 |
80.570 |
205 |
1951 |
3,590 |
| Baseline B |
29,094.560 |
87.996 |
182.637 |
973.859 |
2,427.597 |
| Project B data |
27,200.000 |
82.010 |
180 |
968 |
2,350 |
| Baseline C |
11,134.500 |
85.652 |
180.345 |
865.970 |
1,700.781 |
| Project C data |
11,100.000 |
83.213 |
177 |
861 |
1,699 |
Table 9.
The mix of variables to be tested in Scenarios I to IV.
Table 9.
The mix of variables to be tested in Scenarios I to IV.
| |
Tested variable |
Involved parameters |
Values |
| Scenario I |
LPS technical factors enabled |
VA10, VA11, VA12, VA13, VA14, VA15, VA16, VA17, VA18, VA19, VA20, VA21 |
All values set to five |
| Scenario II |
LPS technical factors enabled, associated with collaboration factors |
VA6, VA7, VA8, VA9, VA10, VA11, VA12, VA13, VA14, VA15, VA16, VA17, VA18, VA19, VA20, VA21 |
All values set to five |
| Scenario III |
LPS socio-technical factors enabled with the association of Making-Do Knowledge factors |
VA1, VA2, VA3, VA5, VA6, VA7, VA8, VA9, VA10, VA11, VA12, VA13, VA14, VA15, VA16, VA17, VA18, VA19, VA20, VA21 |
All values set to five |
| Scenario IV |
LPS socio-technical factors + BIM enabled |
VA1, VA2, VA3, VA5, VA6, VA7, VA8, VA9, VA10, VA11, VA12, VA13, VA14, VA15, VA16, VA17, VA18, VA19, VA20, VA21, VA22, VA23, VA24, VA25 |
All values set to five |
Table 10.
Project A - baseline simulation, results of four simulated scenarios, and percentage improvements from baseline.
Table 10.
Project A - baseline simulation, results of four simulated scenarios, and percentage improvements from baseline.
| Variable |
Baseline |
Scenario I |
Scenario II |
Scenario III |
Scenario IV |
| MD Categories |
CAT1 |
23.754 |
15.572 |
15.572 |
11.795 |
11.284 |
| CAT2 |
99.032 |
74.655 |
74.093 |
66.208 |
66.455 |
| CAT3 |
11.760 |
7.351 |
7.194 |
5.159 |
4.629 |
| CAT4 |
53.450 |
43.508 |
43.315 |
38.878 |
39.017 |
| CAT5 |
21.130 |
15.760 |
15.366 |
12.315 |
11.587 |
| Constraints |
P1 |
49.814 |
39.381 |
38.622 |
33.528 |
30.993 |
| P2 |
158.584 |
142.457 |
141.579 |
135.694 |
125.442 |
| P3 |
221.538 |
163.799 |
157.679 |
122.372 |
109.533 |
| P4 |
572.133 |
457.476 |
446.363 |
381.997 |
344.119 |
| P5 |
766.068 |
559.156 |
544.587 |
430.870 |
382.813 |
| P6 |
187.928 |
124.644 |
121.702 |
85.208 |
75.007 |
| MD Impacts |
I1 |
292.140 |
199.919 |
194.741 |
97.086 |
92.304 |
| I2 |
322.522 |
213.900 |
209.476 |
129.549 |
124.458 |
| I3 |
354.241 |
235.027 |
229.363 |
112.556 |
109.578 |
| I4 |
1,247.717 |
766.449 |
747.751 |
417.300 |
404.727 |
| I5 |
1383.967 |
941.289 |
941.289 |
507.161 |
498.680 |
| Completion Rate (%) |
82.540 |
94.845 |
94.794 |
95.351 |
98.962 |
| Cost |
$ |
76,849.337 |
73,566.85 |
69,040.08 |
61,036.00 |
60,893.31 |

