1. Introduction
Recently there has been considerable focus on metal diphosphate compounds with the stoichiometry AIFeIIIP
2O
7, where AI denotes a range of alkali cations such as lithium (Li), sodium (Na), silver (Ag), potassium (K), rubidium (Rb) and cesium (Cs) [
1].These materials have attracted considerable interest due to their diverse structures and configurations, making them a prominent subject of research within the field of materials science. Their adaptability has led topromising prospects for industrial applications and intriguing inherent physical properties[
2,
3,
4,
5,
6]. These compounds show potential in various fields, including nonlinear optical materials, high-temperature ionic conductors, solid electrolytes applicable in high energy density batteries, ion exchange materials and catalysts. In addition, some have been effectively used in nanoparticle form for purposes such as water purification and decontamination [
7,
8,
9].
In this context, substituted diphosphate compounds (A1-xA′xFeP
2O
7, where A and A′ represent monovalent cations) have been extensively studied due to their diverse physical and chemical properties [
10]. These compounds exhibit remarkable ion-conducting capabilities, making them suitable for applications in rechargeable alkaline batteries and piezoelectric devices [
11]. They also act as three-dimensional solid electrolytes exhibiting substantialionic conductivity [
12]. A key feature of these compounds is their highly adaptable structure, which allows different foreign cations to be incorporated to varying degrees within their framework. This feature offers extensive possibilities for co-substitution, facilitating the tailoring of material properties for a wide range of applications [
13].
In addition, recent studies have revealed the promising potential of using P
2O or P
2O
7 polyanions as membranes in advanced battery technologies. This breakthrough holds great promise for meeting the escalating demand for portable electronic devices, including personal computers PCs, mobile phones, medical equipment and other advanced electronics[
14].
Building on our prior investigations into substituted diphosphate materials, we have successfully synthesized a novel compound, Ag0.2Na0.8FeP2O7. A groundbreaking aspect of our study is the comprehensive examination of the compound's impedance spectroscopy properties across a wide range of temperatures and frequencies, achieved using an impedance analyzer for the first time. Through meticulous analysis and interpretation of the impedance spectroscopy parameters, we have gained valuable insights into the electrical behavior of the compound.
Furthermore, we delved into the ac conductivity and its associated conduction mechanism, taking into account various ac theories. These significant discoveries have deepened our comprehension of the potential applications of Ag0.2Na0.8FeP2O7, opening up exciting avenues for further exploration in this field.
2. Materials and Methods
The Ag0.2Na0.8FeP2O7 ceramic sample was synthesized using the traditional solid-state sintering method. High-purity starting powders, such as AgNO3 (Sigma-Aldrich, 99%), Na2CO3 (Sigma-Aldrich, 99%), Fe2O3 (Sigma-Aldrich, 99%), and NH4H2PO (Sigma-Aldrich, 99%), were utilized for this purpose.
The substances were mixed in the correct molar proportions and crushed using an agate mortar.The uniform powder was subsequently subjected to calcination at 573 K for 8 hours to remove NH3, CO2, and H2O. After regrounding, the powder was formed into cylindrical pellets and heated from room temperature to 1000 K for 8 hours.
X-ray powder diffraction (XRD) analyses were carried out at ambient temperature utilizing a Phillips powder diffractometer PW 1710 with CuKα radiation (λ=1.5405 Å) covering glancing angles from 10° to 90°. The XRD profile underwent Rietveld refinement employing the Foolproofprogram [
15].
Fourier-transform infraredspectroscopic examinations were conducted using an FTIR-100 Perkin Elmer spectrophotometer, covering the wave number range of 1600-400 cm-1. For Raman scattering investigation, a Horiba Jobin-Yvon T64000 spectrometer was employed to record Raman spectra at room temperature, ranging from 400 to 1400 cm-1.To evaluate the electrical characteristics, the Ag0.2Na0.8FeP2O7materialunderwent meticulous grinding in a mortar to achieve finely powdered particles. Subsequently, the powder was compressed into appropriately sized pellets under a pressure of approximately 3T/cm2. The resulting pellets exhibited a 1 mm thickness and an 8 mm diameter. These pellets were then placed between two platinum electrodes. The experimental investigation covered a range of temperatures from 540 to 700 K, with a frequency span of 209Hz to 1MHz, utilizing a Tegam 3550 ALF impedance analyzer.
3. Results and Discussions
3.1. X-ray Diffraction (XRD) Study
In
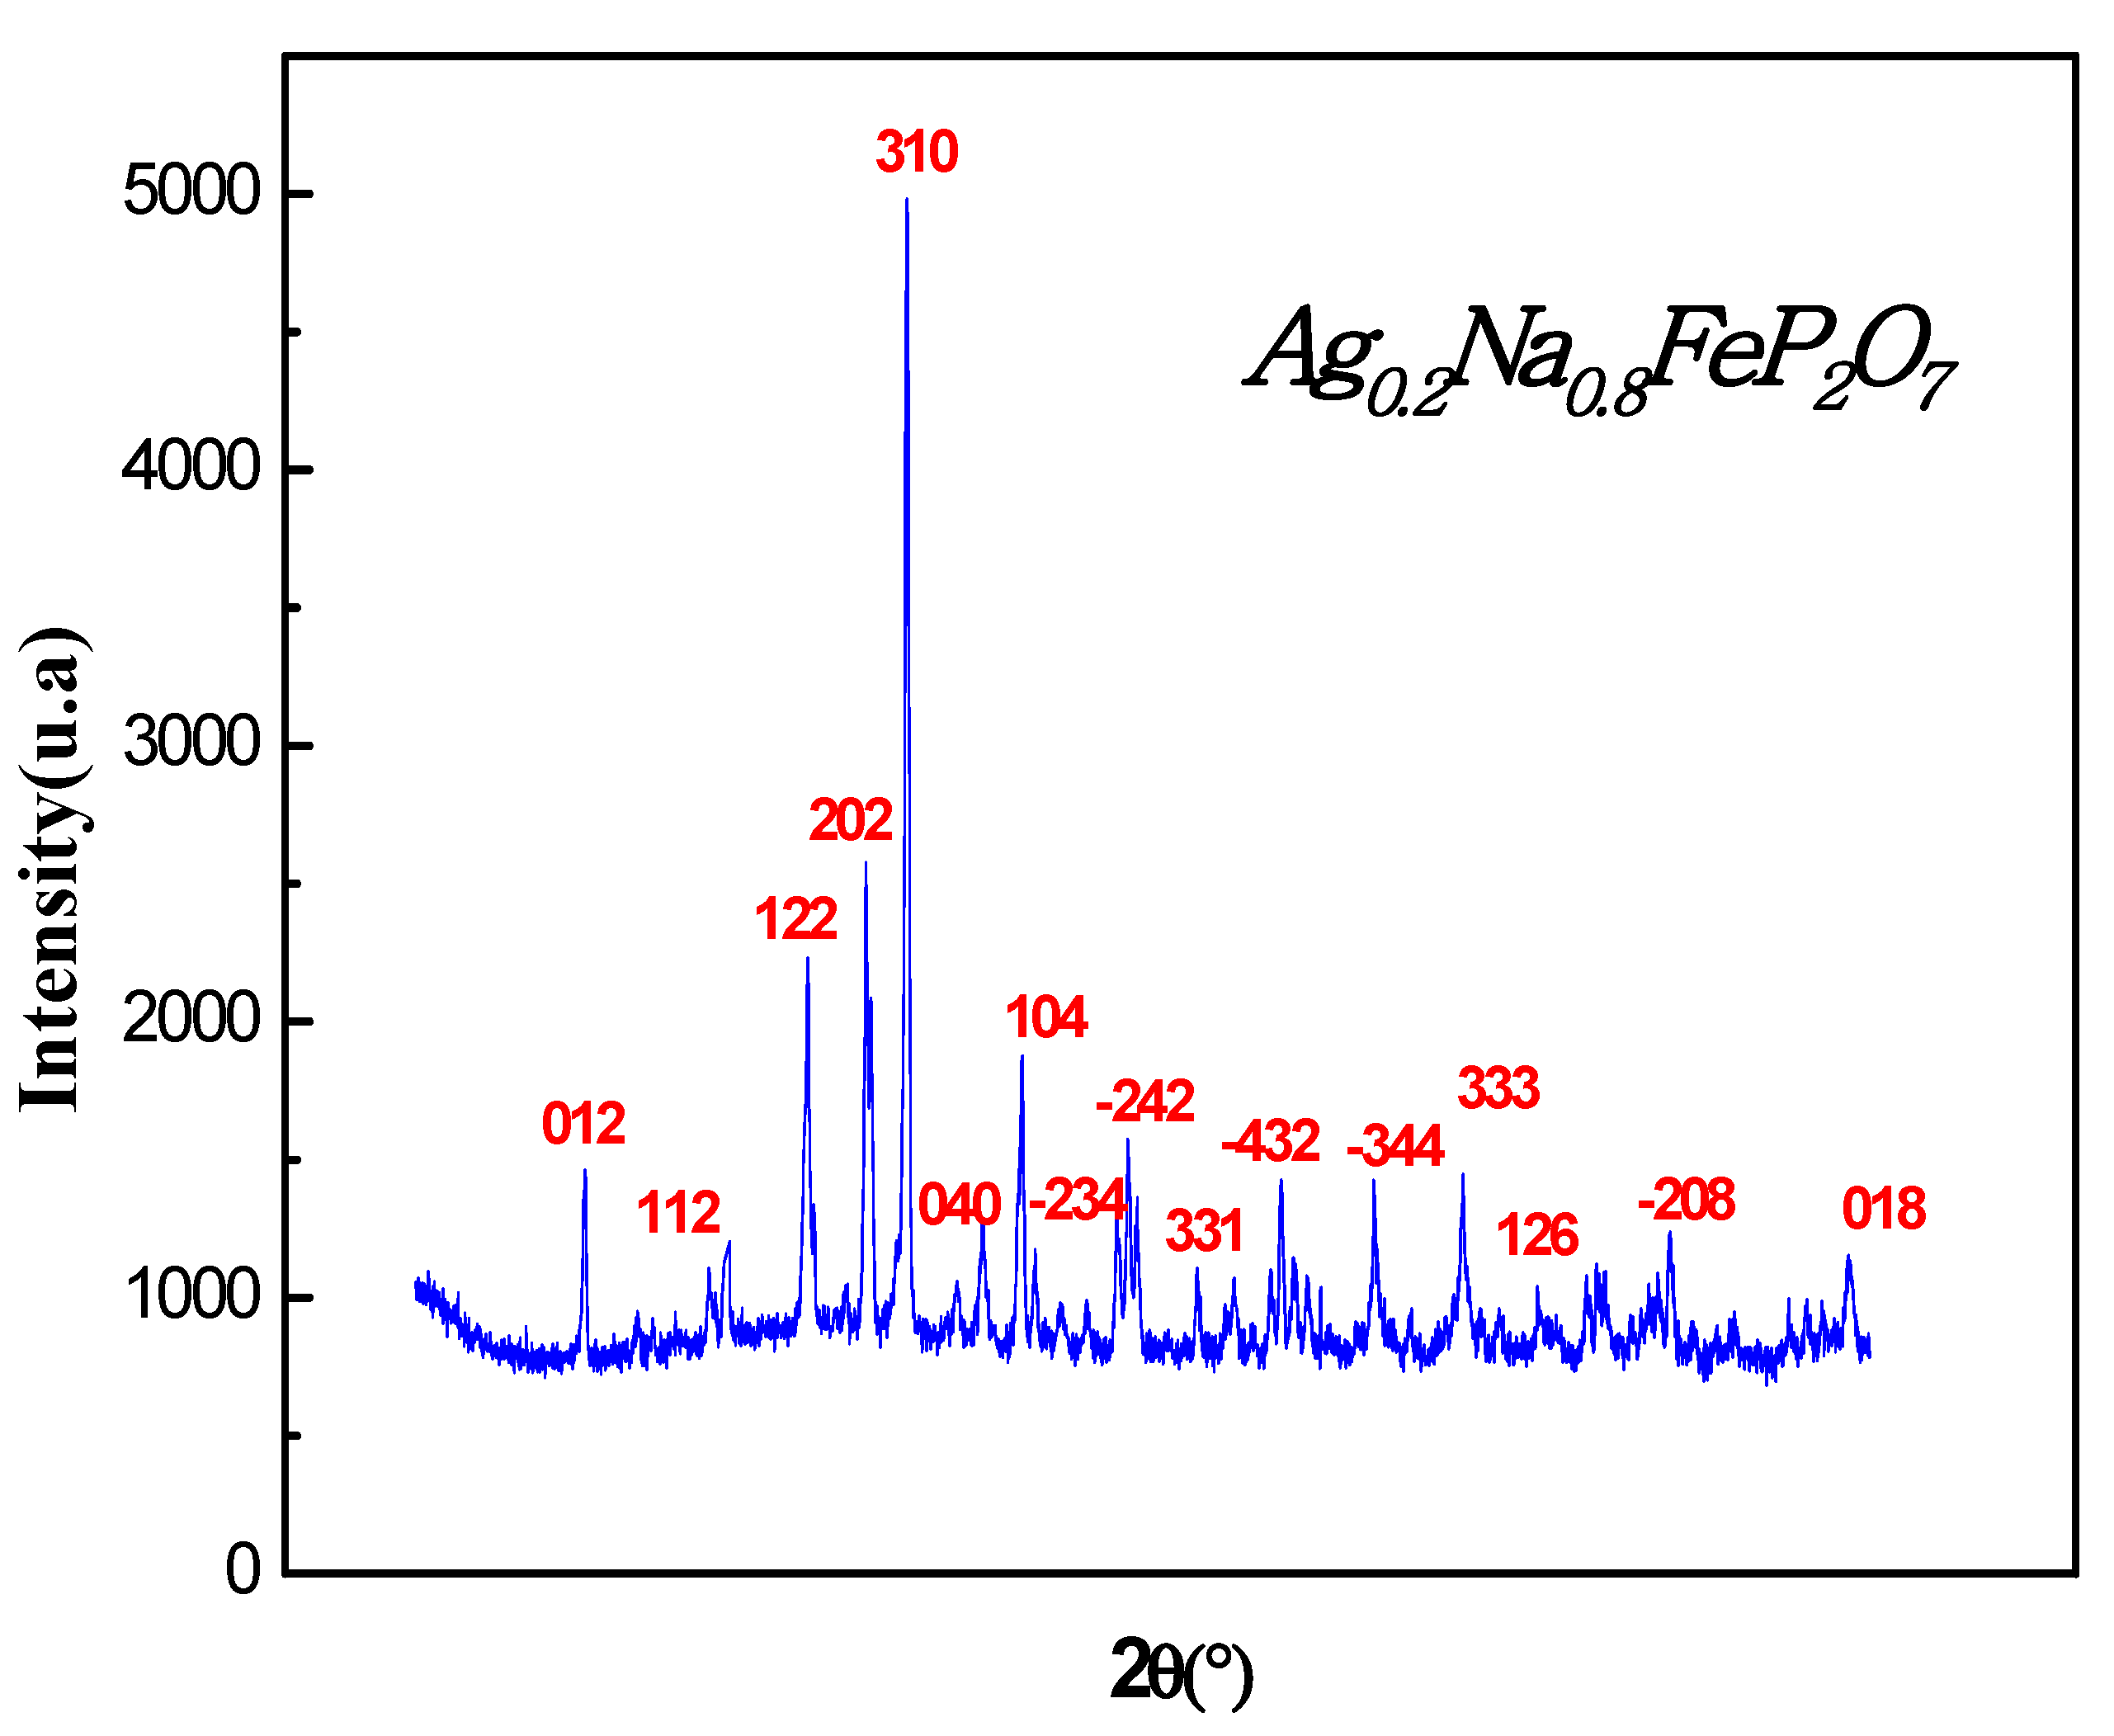
Figure 1, the X-ray diffractogram (XRD) pattern of the Ag
0.2Na
0.8FeP
2O
7 sample at ambienttemperature is depicted. The XRD analysis reveals that the sample is a single phase with diffraction peaks corresponding to the monoclinic space group P 21/c. The obtained monoclinic structure agreed with previously reported structures [
16,
17,
18], which were studied using the Rietveld refinement was conducted utilizingFULLPROF software[
19].
Experimental X-ray diffraction (XRD) data for the Ag
0.2Na
0.8FeP
2O
7 sample at room temperature were carefully examined using the standard Rietveld refinement technique, utilizing the Full PROF program.
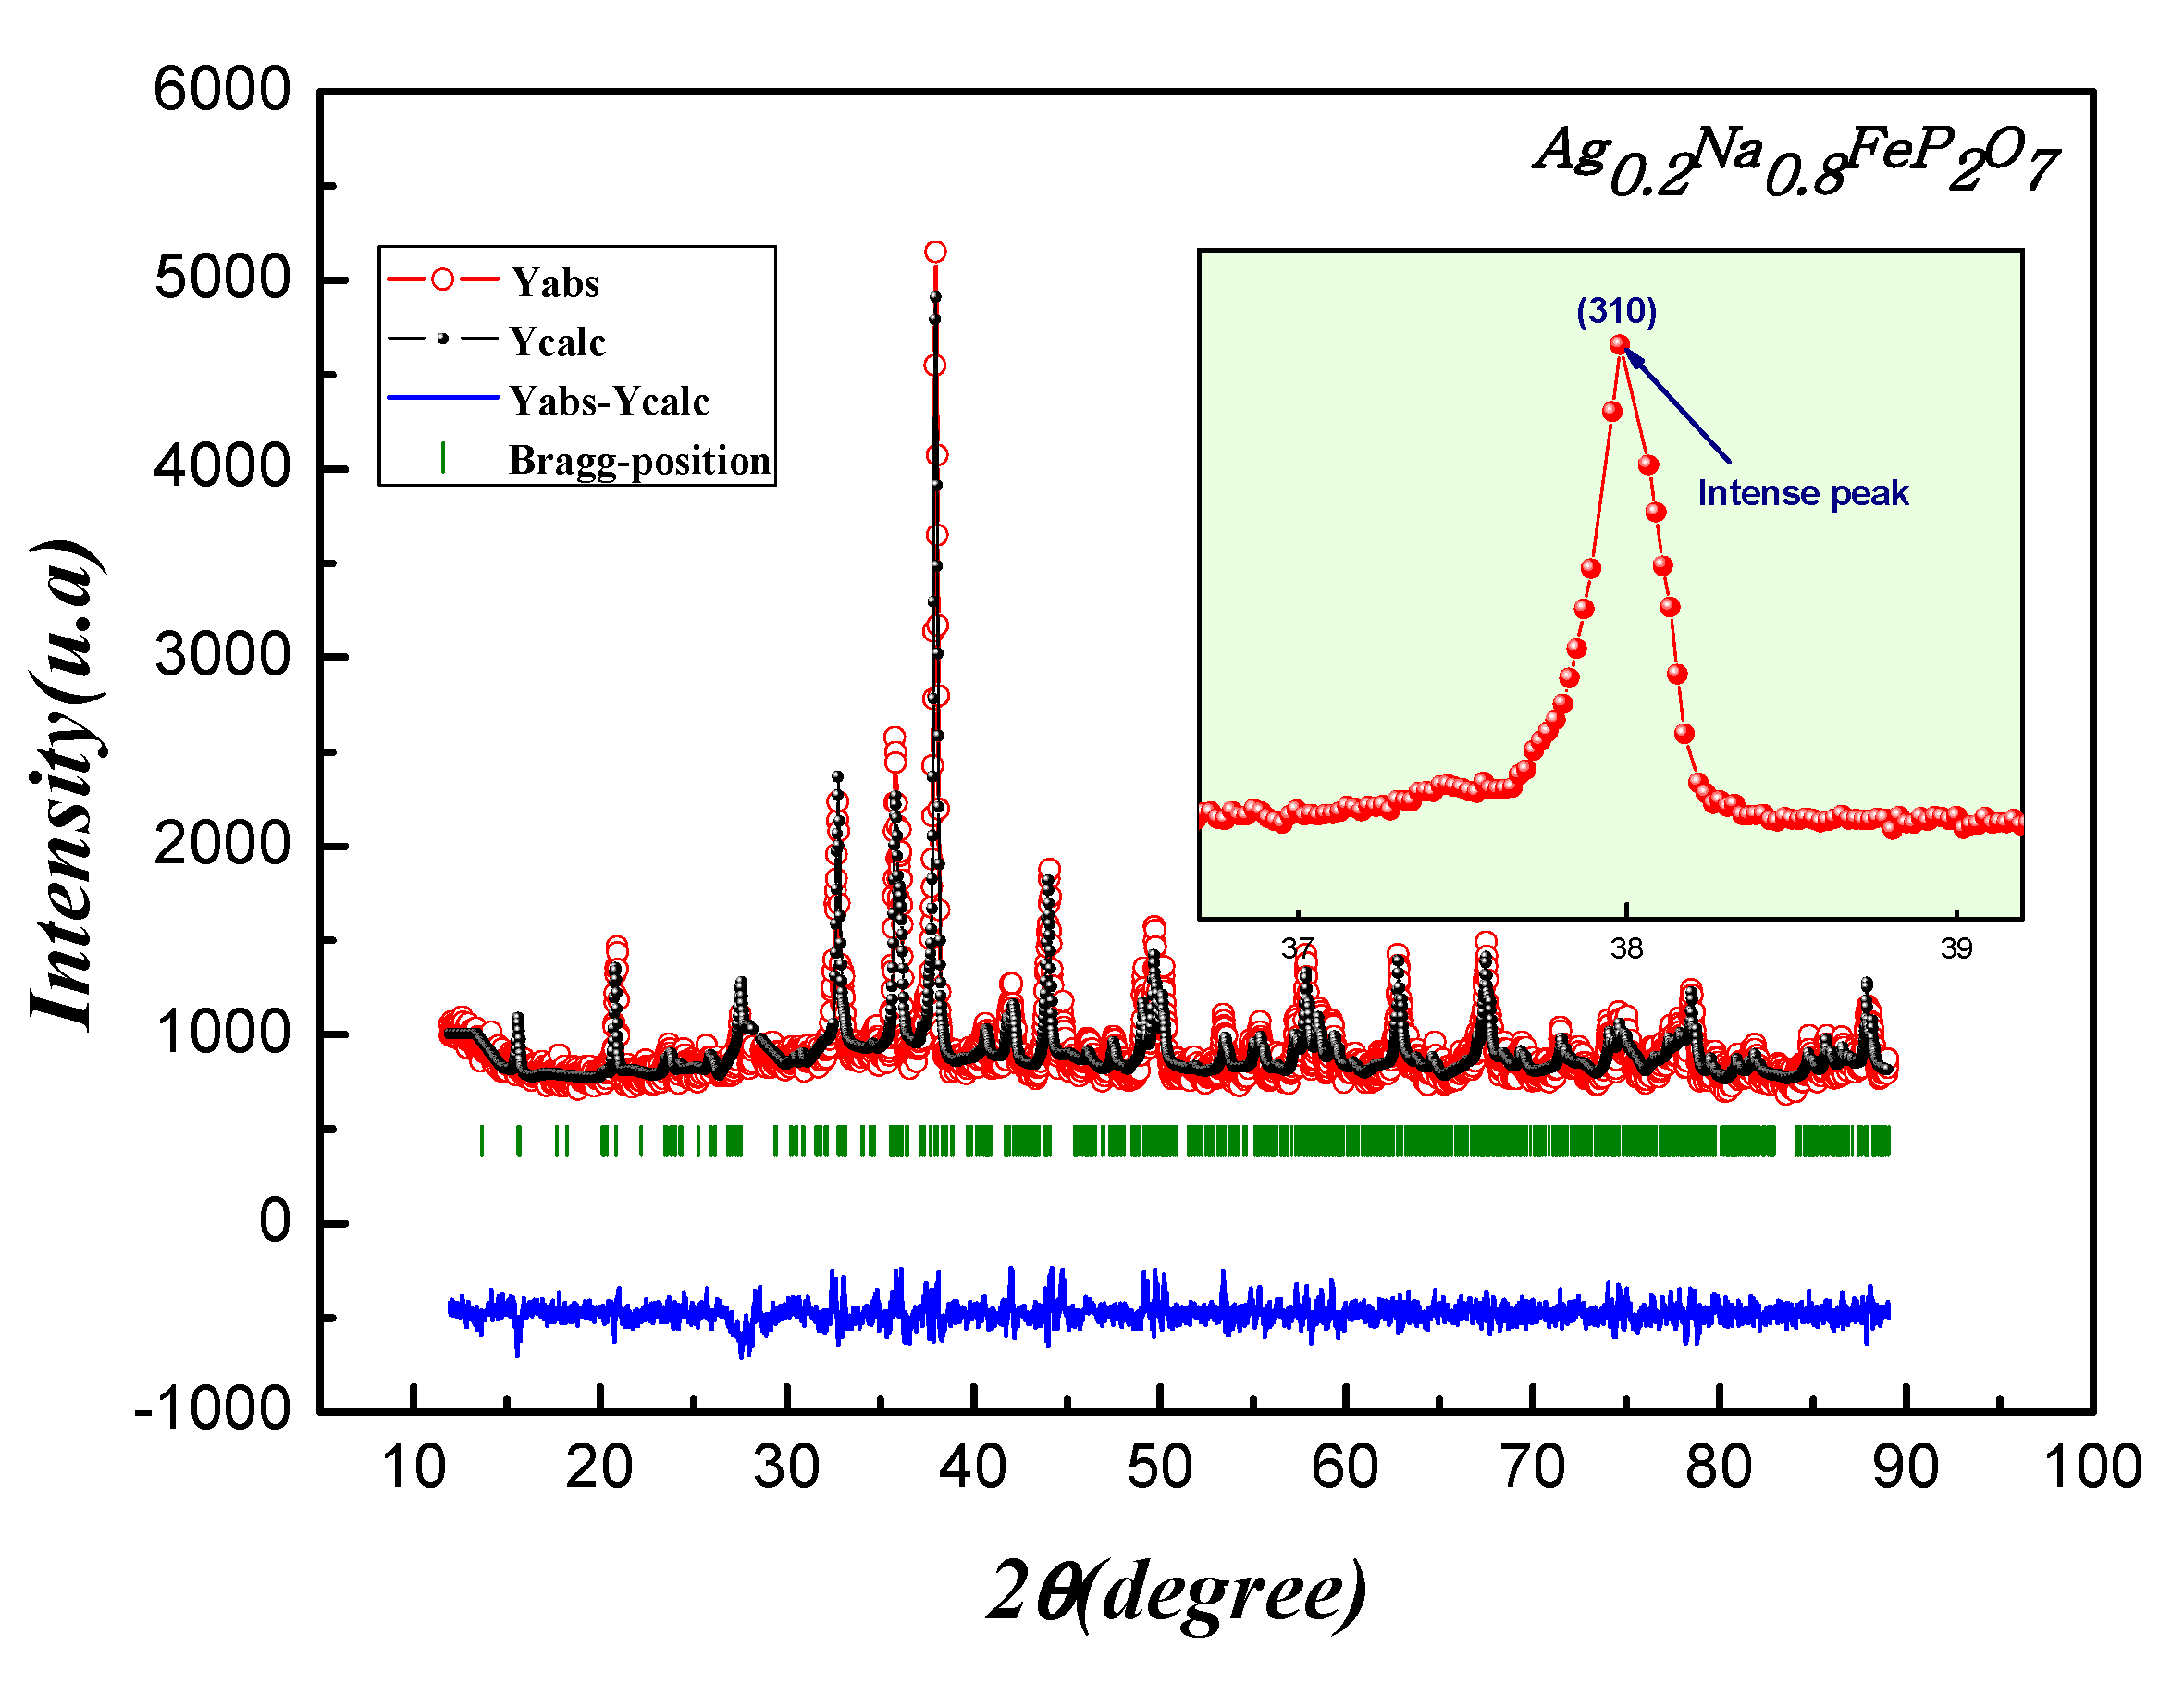
Figure 2 illustrates the final refined XRD pattern. Remarkably, all the peaks displayed exceptional clarity and sharpness, indicating a high level of crystallization for Ag
0.2Na
0.8FeP
2O
7.To describe the peak shapes accurately, a refined pseudo-Voigt function was employed, with adjustments made to cell parameters, zero factors, scale factor, and background function. This thorough analysis yielded valuable insights into the crystal structure and crystalline quality of the sample.
The results obtained from the Rietveld refinement analysis include the atomic positions, refined lattice parameters, and bond lengths, which can be found in
Table 1,
Table 2 and
Table 3, respectively. Notably, the lattice dimensions and cell volume exhibit a decrease compared to the parent compound AgFeP
2O
7[
17]. This reduction is attributed to the substitution of Na
+ ions (ionic radius of 0.095 nm), which have a smaller ionic radius than Ag
+ ions (ionic radius of 0.126 nm) [
20,
21].
In addition to the above findings,
Table 3 presents the results for the average ion radius of the A cation site <rA> and the mismatch σ2 for our sample. These measurements provide valuable insights into the structural changes caused by the incorporation of Na+ ions into the crystal lattice, leading to a smaller unit cell size and altered bond lengths.The crystallite size D was determined using the Scherrer equation, which utilizes the full width at half maximum and the integral width of the reflection (310). The calculated crystallite sizes are listed in
Table 2. The Scherrer equation used for this calculation is as follows:
In this context, the value of the constant "k" is contingent upon the geometry of the crystallite size (assuming circular grains with k=0.9). The Full Width at Half Maximum (FWHM) of the intensity versus profile, "λ" denoting the wavelength of Cu Kα1 radiation (0.15406 nm), and "θ" representing the Bragg diffraction angle of the most intense peak, all play crucial roles. The dislocation density "δ," indicating the level of imperfections within the sample, is characterized as the length of dislocation lines for each unit volume of the crystal. It is quantified using the following equation:
The strain-induced broadening in powders due to crystal imperfection and distortion was calculated using the formula,
The values of the dislocation densityδ and the strainɛ are listed in
Table 2.
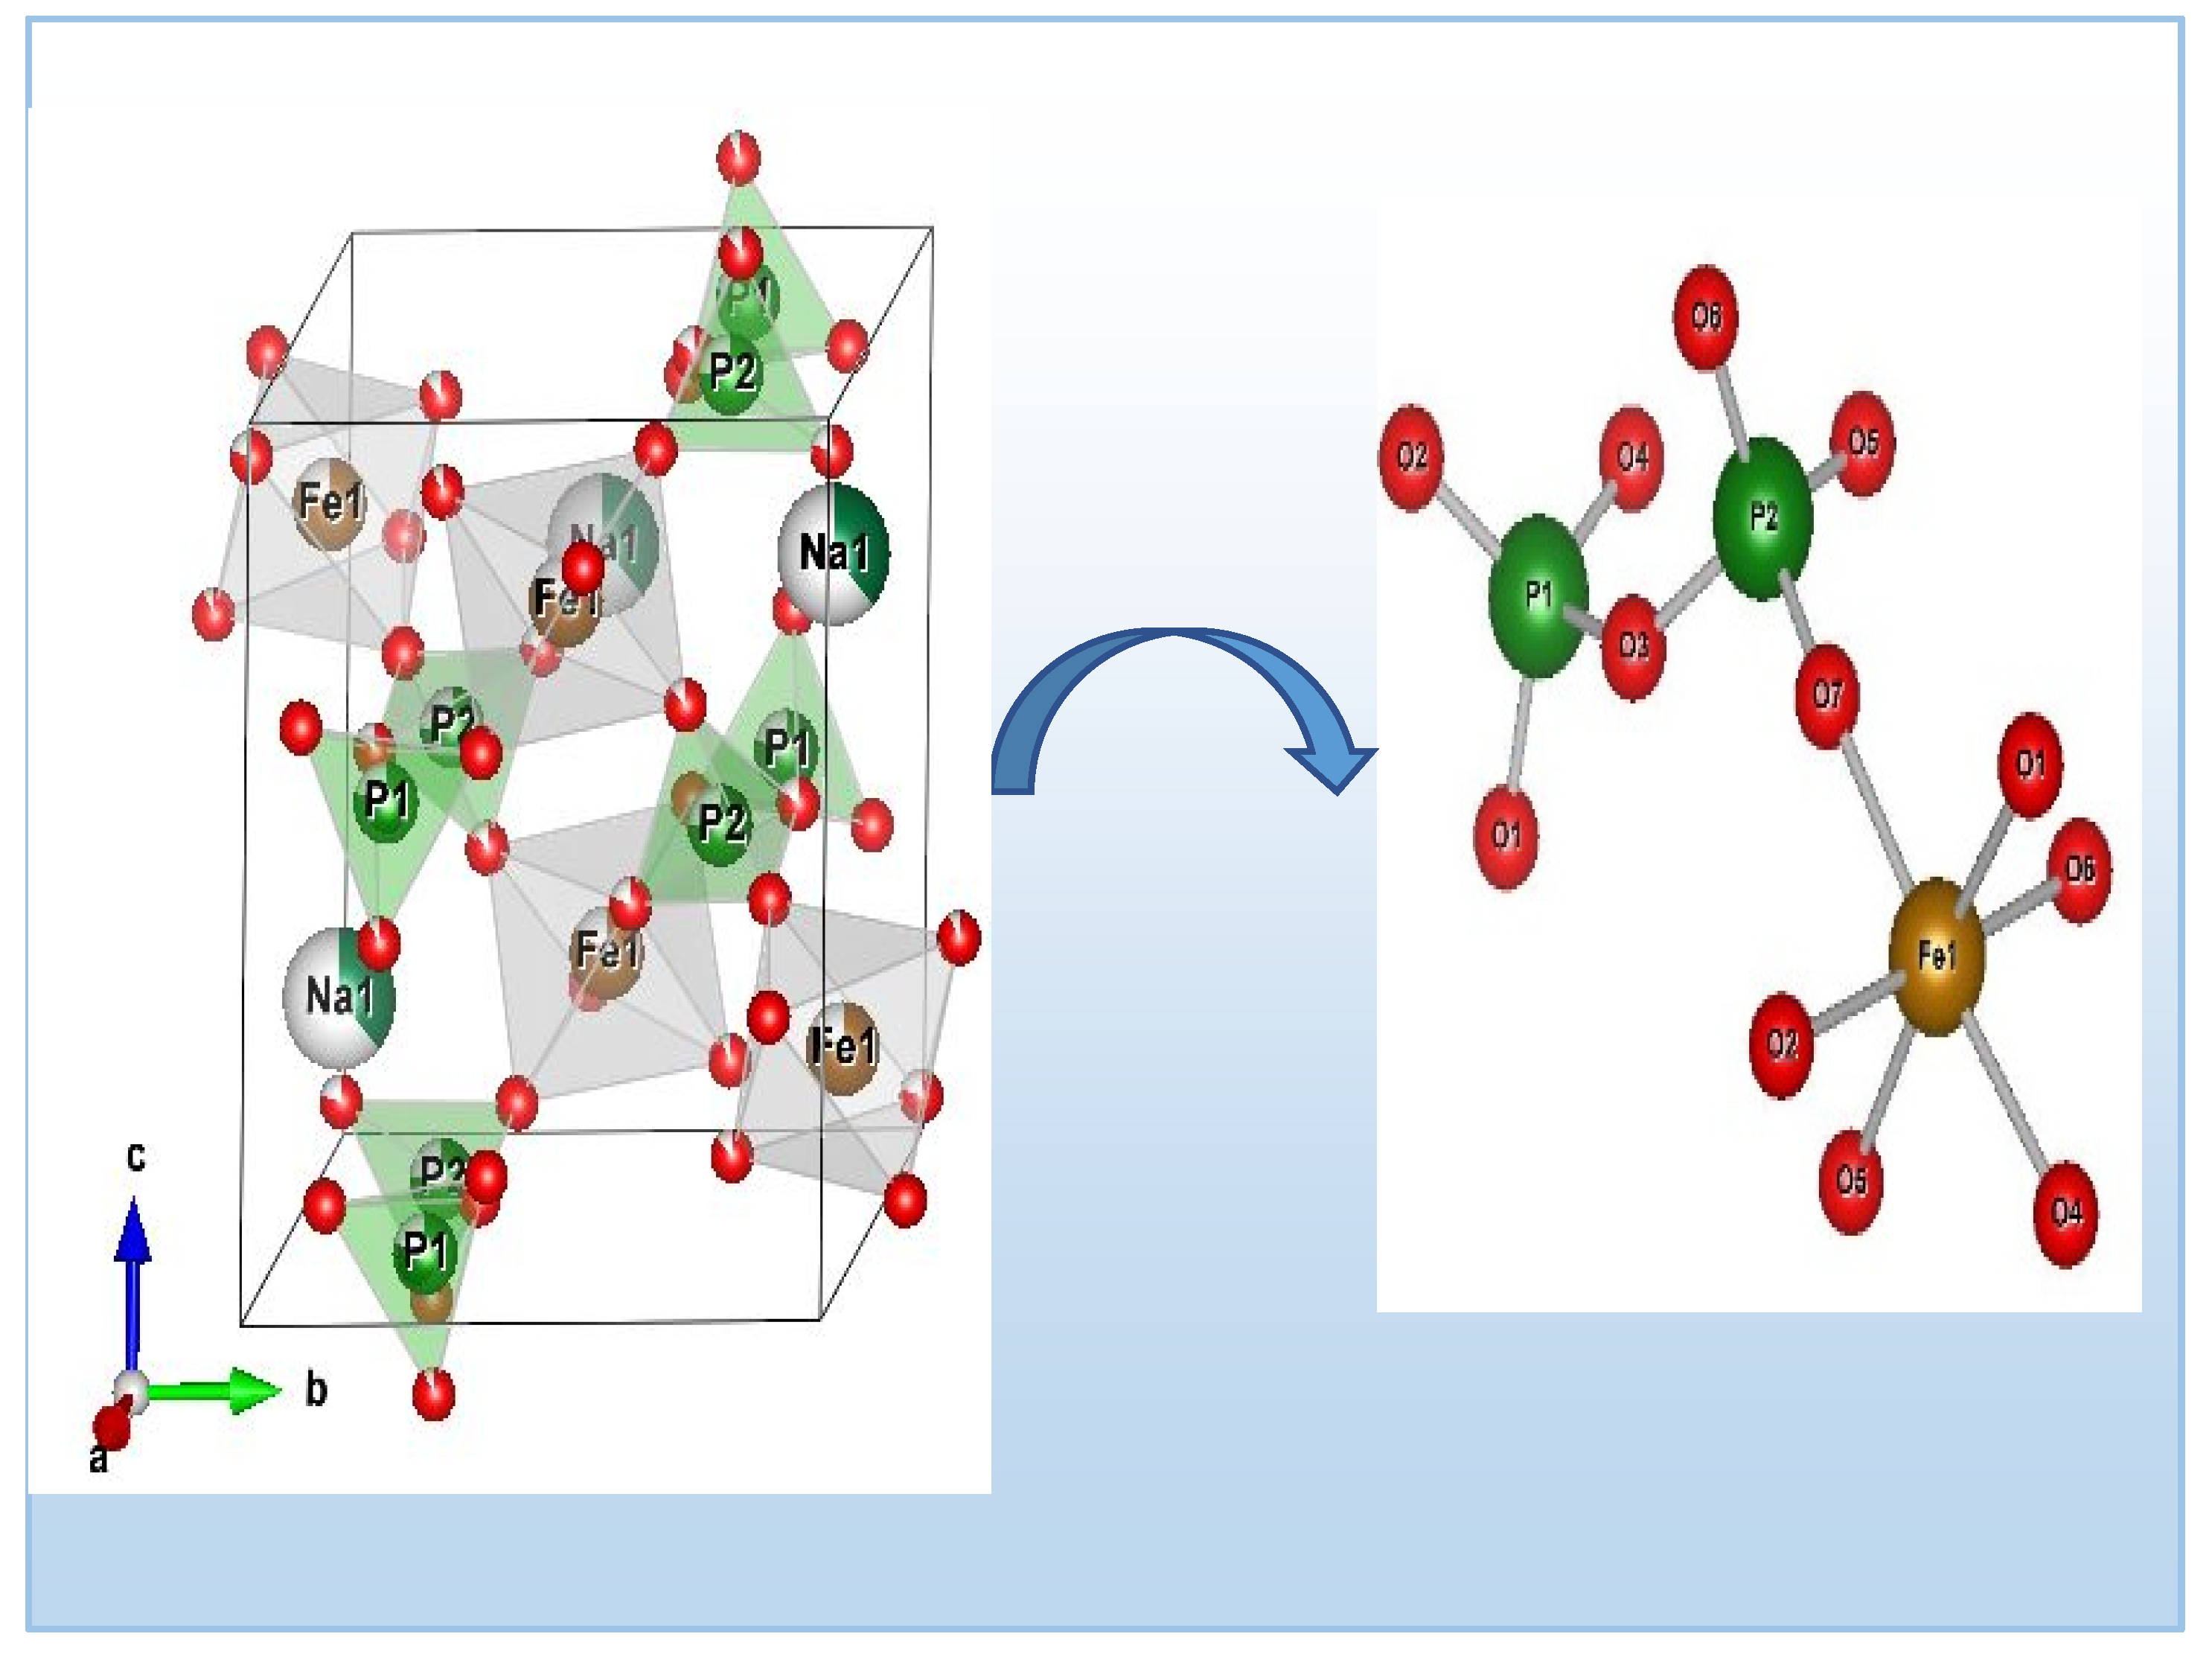
Figure 3 illustrates the arrangement of Ag
0.2Na
0.8FeP
2O
7. This configurationconsists of interconnected octahedral FeO
6 units and tetrahedral PO
4 units, forming a three-dimensional lattice with hexagonal channels aligned with the c axis. Each FeO6 octahedron is surrounded by six PO4 tetrahedra from five different P2O7 groups (shown in
Figure 3). Alongside, the sodium and silver cations are positioned within these channels and are bonded to seven oxygen atoms within the [FeP2O7] structure, exhibiting Ag–O and Na-O distances spanning 2.370 (2) to 3.45 Å (2).The diphosphate group comprises two [PO4] tetrahedra that exhibit slight distortion, with P-O distances spanning from 1.436 Å to 1.615 Å (as listed in
Table 3). In contrast, the [FeO
6] octahedra display substantial distortion (as depicted in
Figure 3), characterized by Fe-O distances fluctuating between 1.952 Å and 2.075 Å (as detailed in
Table 3) [
22].The structure of Ag
0.2Na
0.8FeP
2O
7 shares isotopic characteristics with the MIFeP
2O
7 (MI = Na, Ag) diphosphate family. Importantly, the arrangement of layers within the structure lacks compactness and showcases tunnels, as illustrated in
Figure 3. These tunnels, coupled with accompanying cavities, create an environment conducive to the potential movement of alkali metal ions within the framework. This, in turn, enables the insertion of extra alkali cations into the structure.
3.2. Hirshfeld Surface Analysis:
The Hirshfeld surfaces (HS) and their corresponding 2D fingerprint plots have been utilized to assess and quantify the array of intermolecular interactions within the molecule [
23]. This analysis was conducted using Crystal Explorer 3.1 [
24], which accepts a structure input file in CIF format.The Hirshfeld surface surrounding a molecule becomes evident through points where the electron density contribution from the specific molecule matches the contribution from all other molecules. The Hirshfeld surface of Ag
0.2Na
0.8FeP
2O
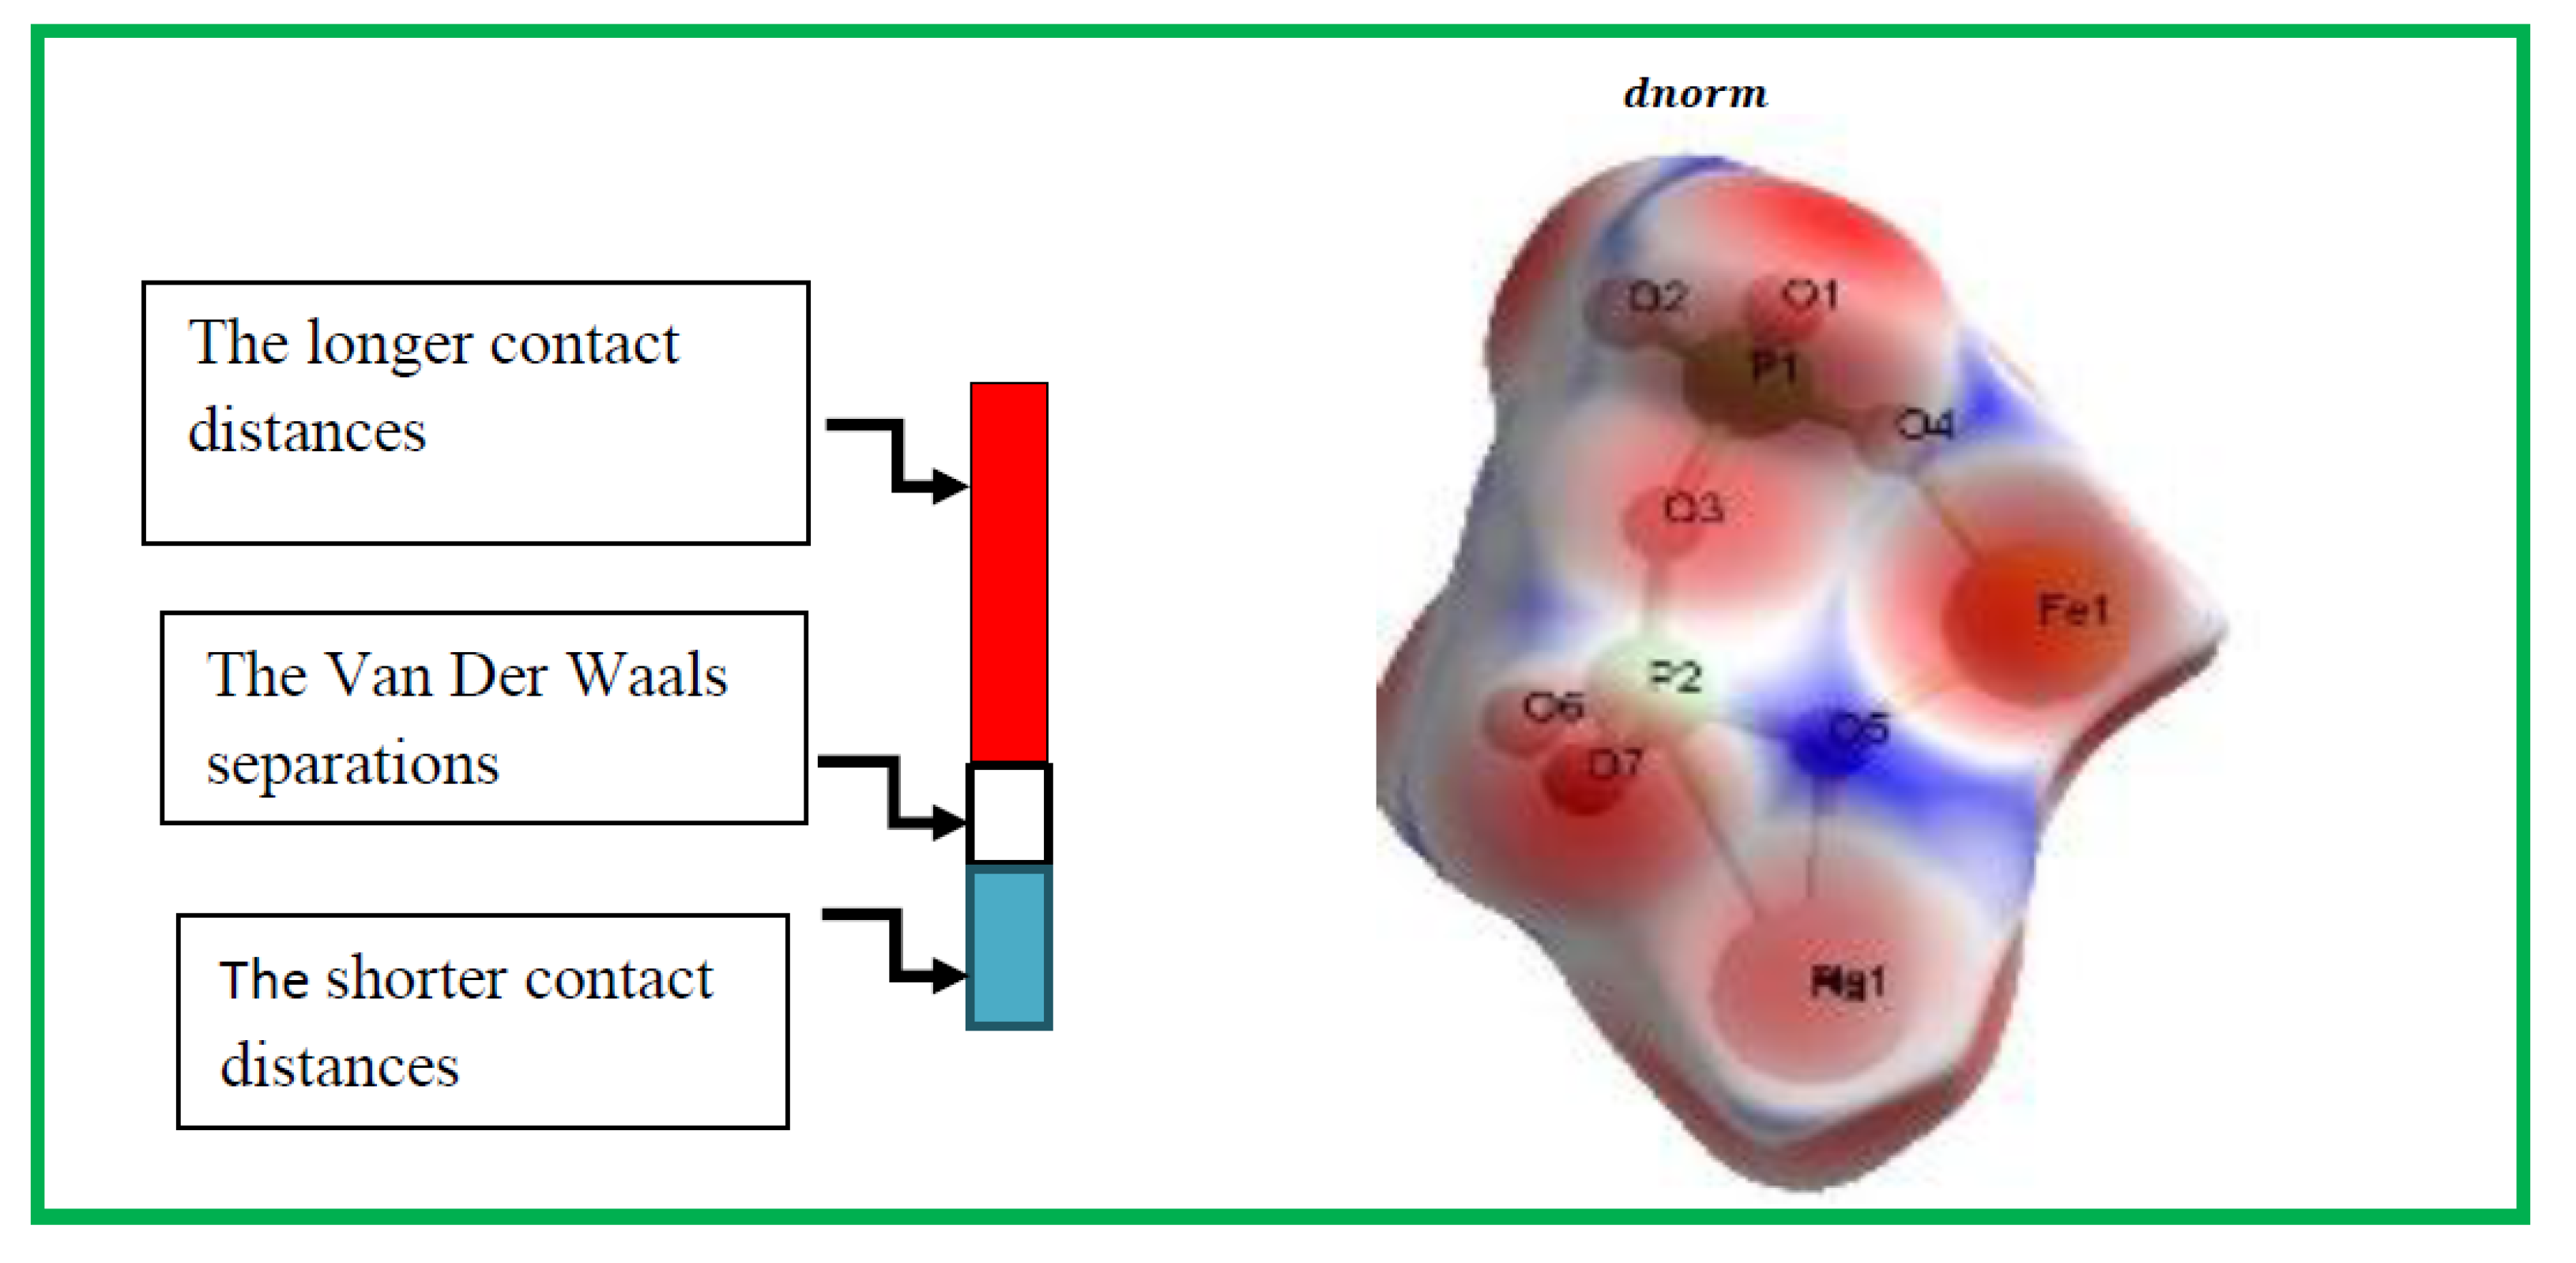
7 is illustrated in
Figure 4, revealing the surface that has been plotted onto it
. At every pointon this isosurface, two distances are evident: the first corresponds to 'de,' representing the distance from the point to the closest nucleus outside to the surface, and the second corresponds to 'di,' representing the distance to the nearest nucleus internal to the surface. The normalized contact distance (
) is derived from the distances 'de' and 'di' (the distances from the nearest external and internal nuclei to the Hirshfeld surface, respectively), as defined in Eq3
Where
and
are the Van Der Waals radii of the atoms. The value of
was either negative or positive according to intermolecular contacts, being shorter or longer than the Van Der Waals separations. Graphical plots of the molecular Hirshfeld surface mapped with dnorm use the blue–white–red colour scheme, with blue indicating the longer contact distances, white showing the contacts around the vdw separation and red highlighting the shorter intermolecular contacts [
25].The surface has been mapped over a dnorm range of −0. 873 to 0.447 Å and is presented in transparent mode to allow visualization of the molecular finasteride moiety. The Hirshfeld surface mapped to dnorm for our compound shows a larger red surface than the blue one and the value of dnorm is negative. Therefore, the intermolecular interactions are shorter -range. The combination between
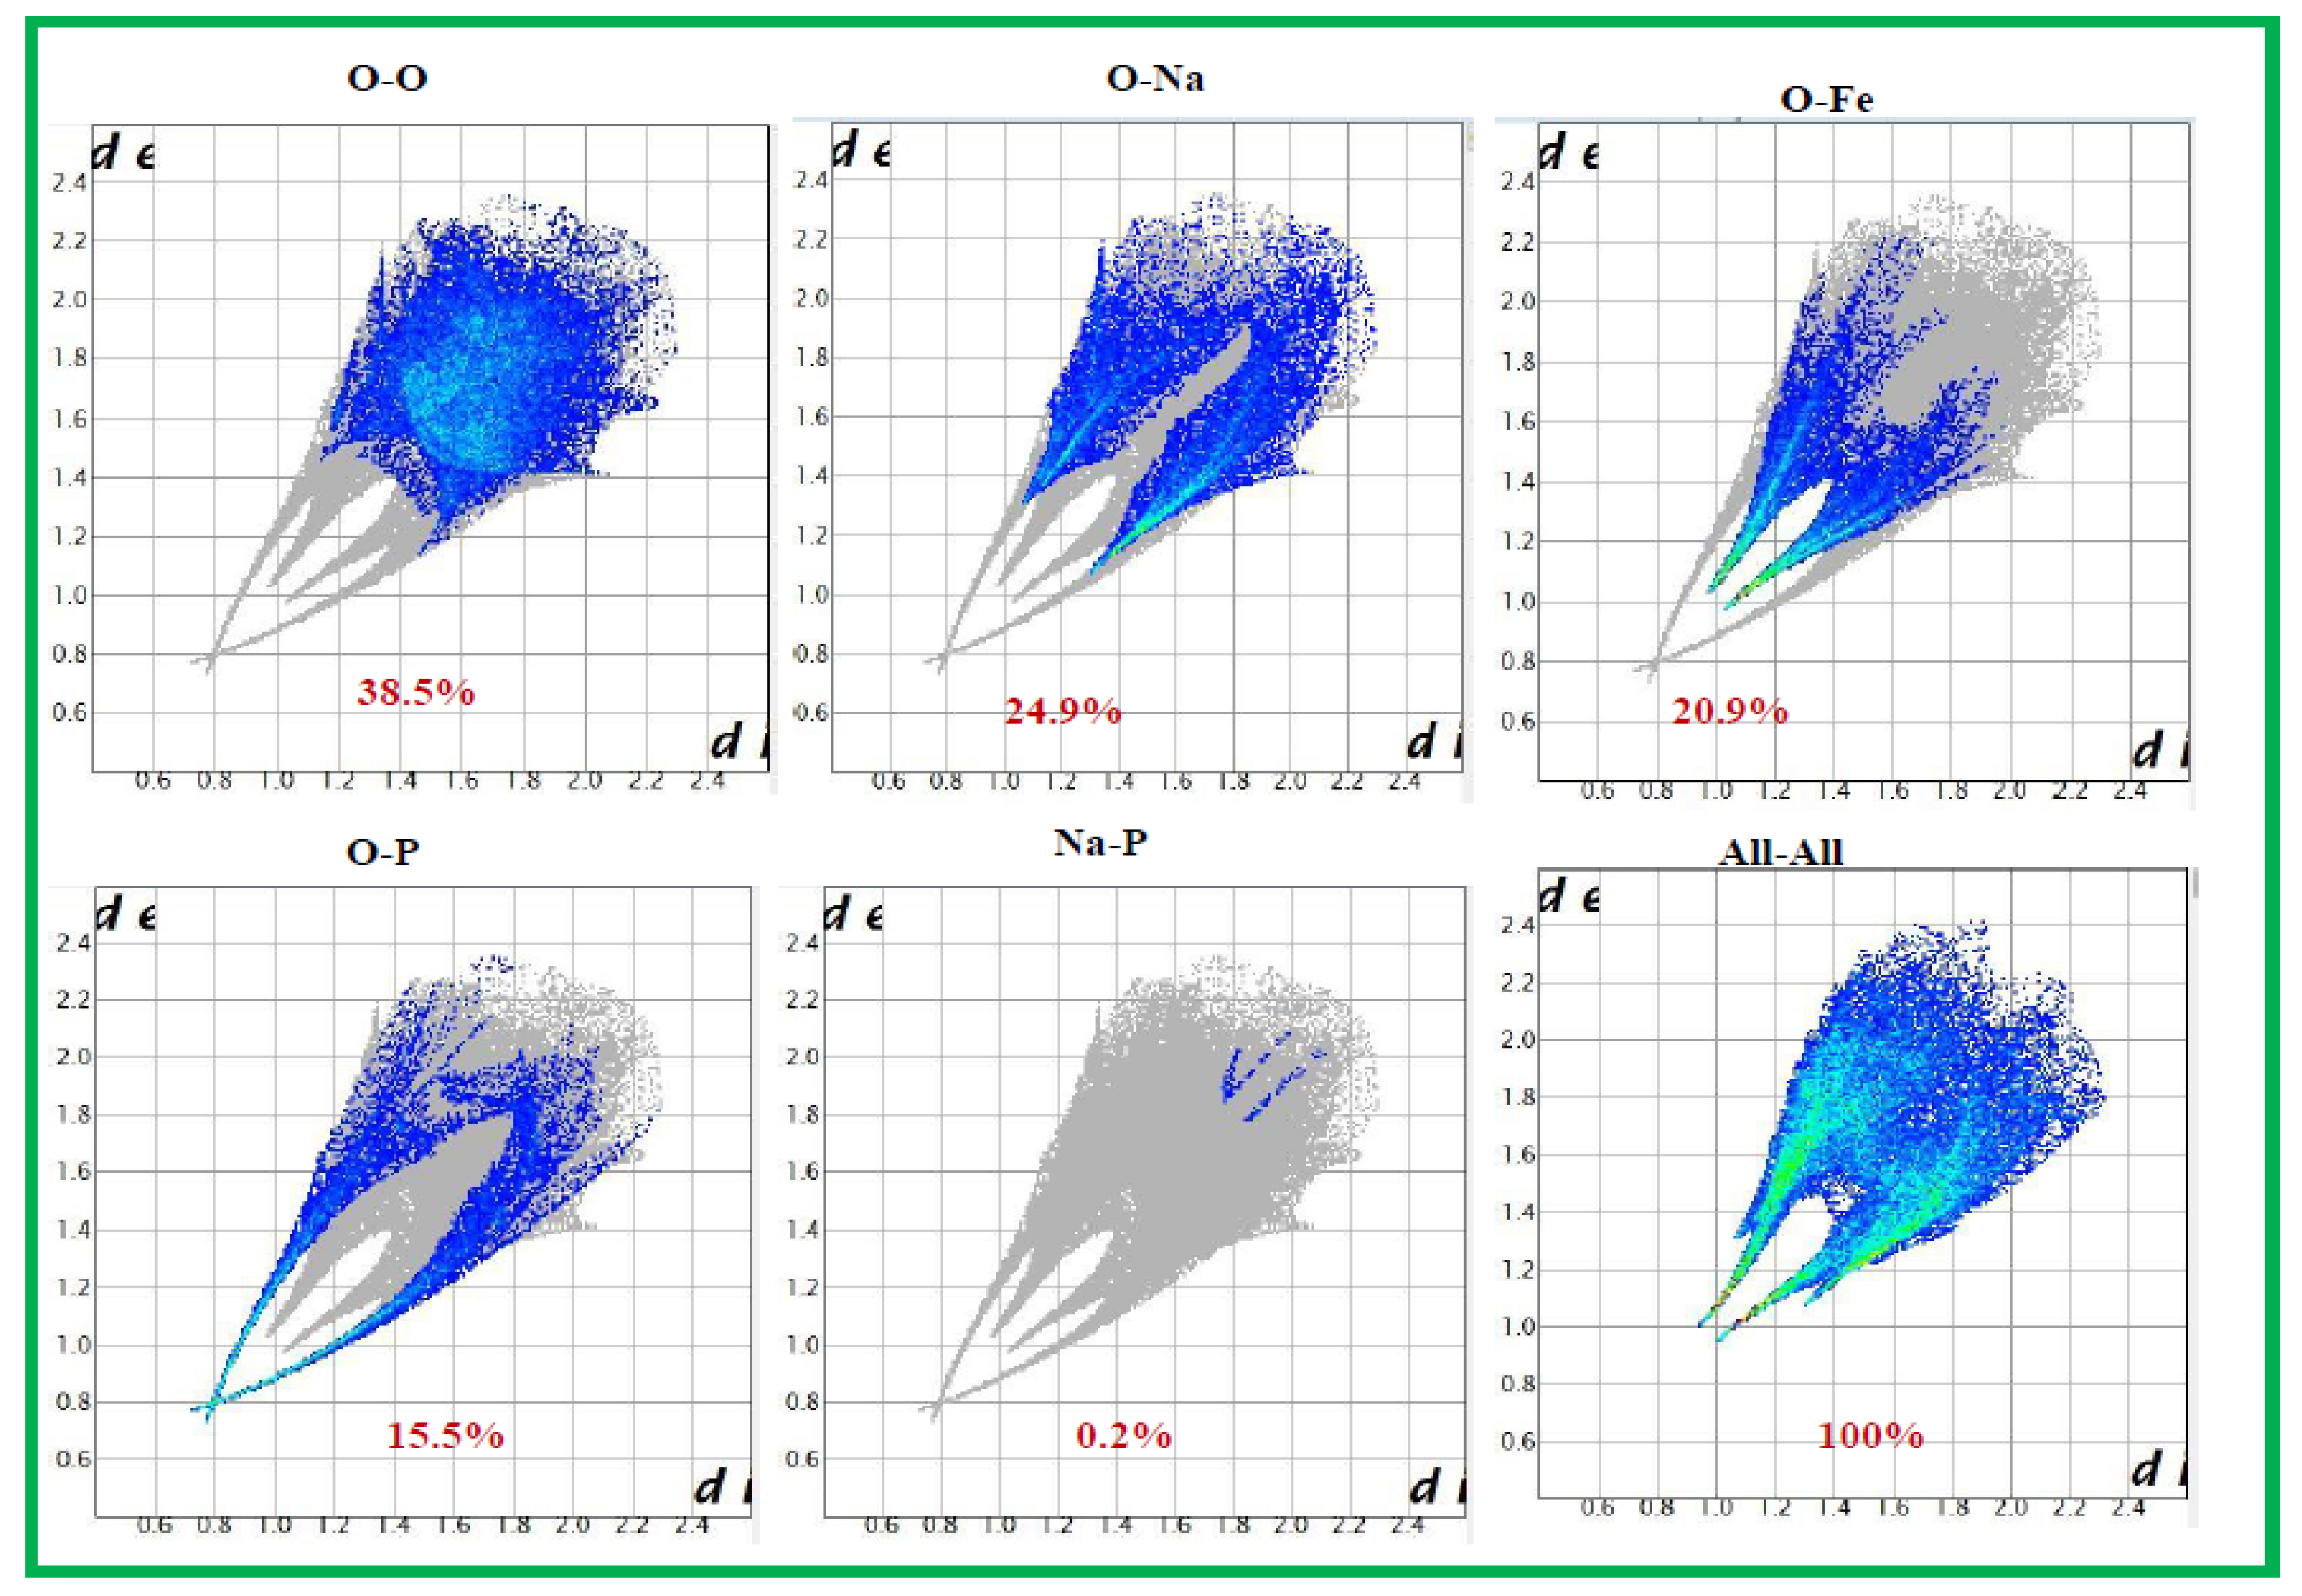
and
in the form of a two-dimensional fingerprint plot provides a concise summary of intermolecular contacts in the crystal (
Figure 5). Visible complementary regions are visible in the fingerprint plots, wherein one molecule acts as a donor (
>
) and the other as an acceptor (
<
). Each point on the 2D fingerprint plot corresponds to a unique (
,
) pair, and the color of each point corresponds to the relative area of the surface of that (
,
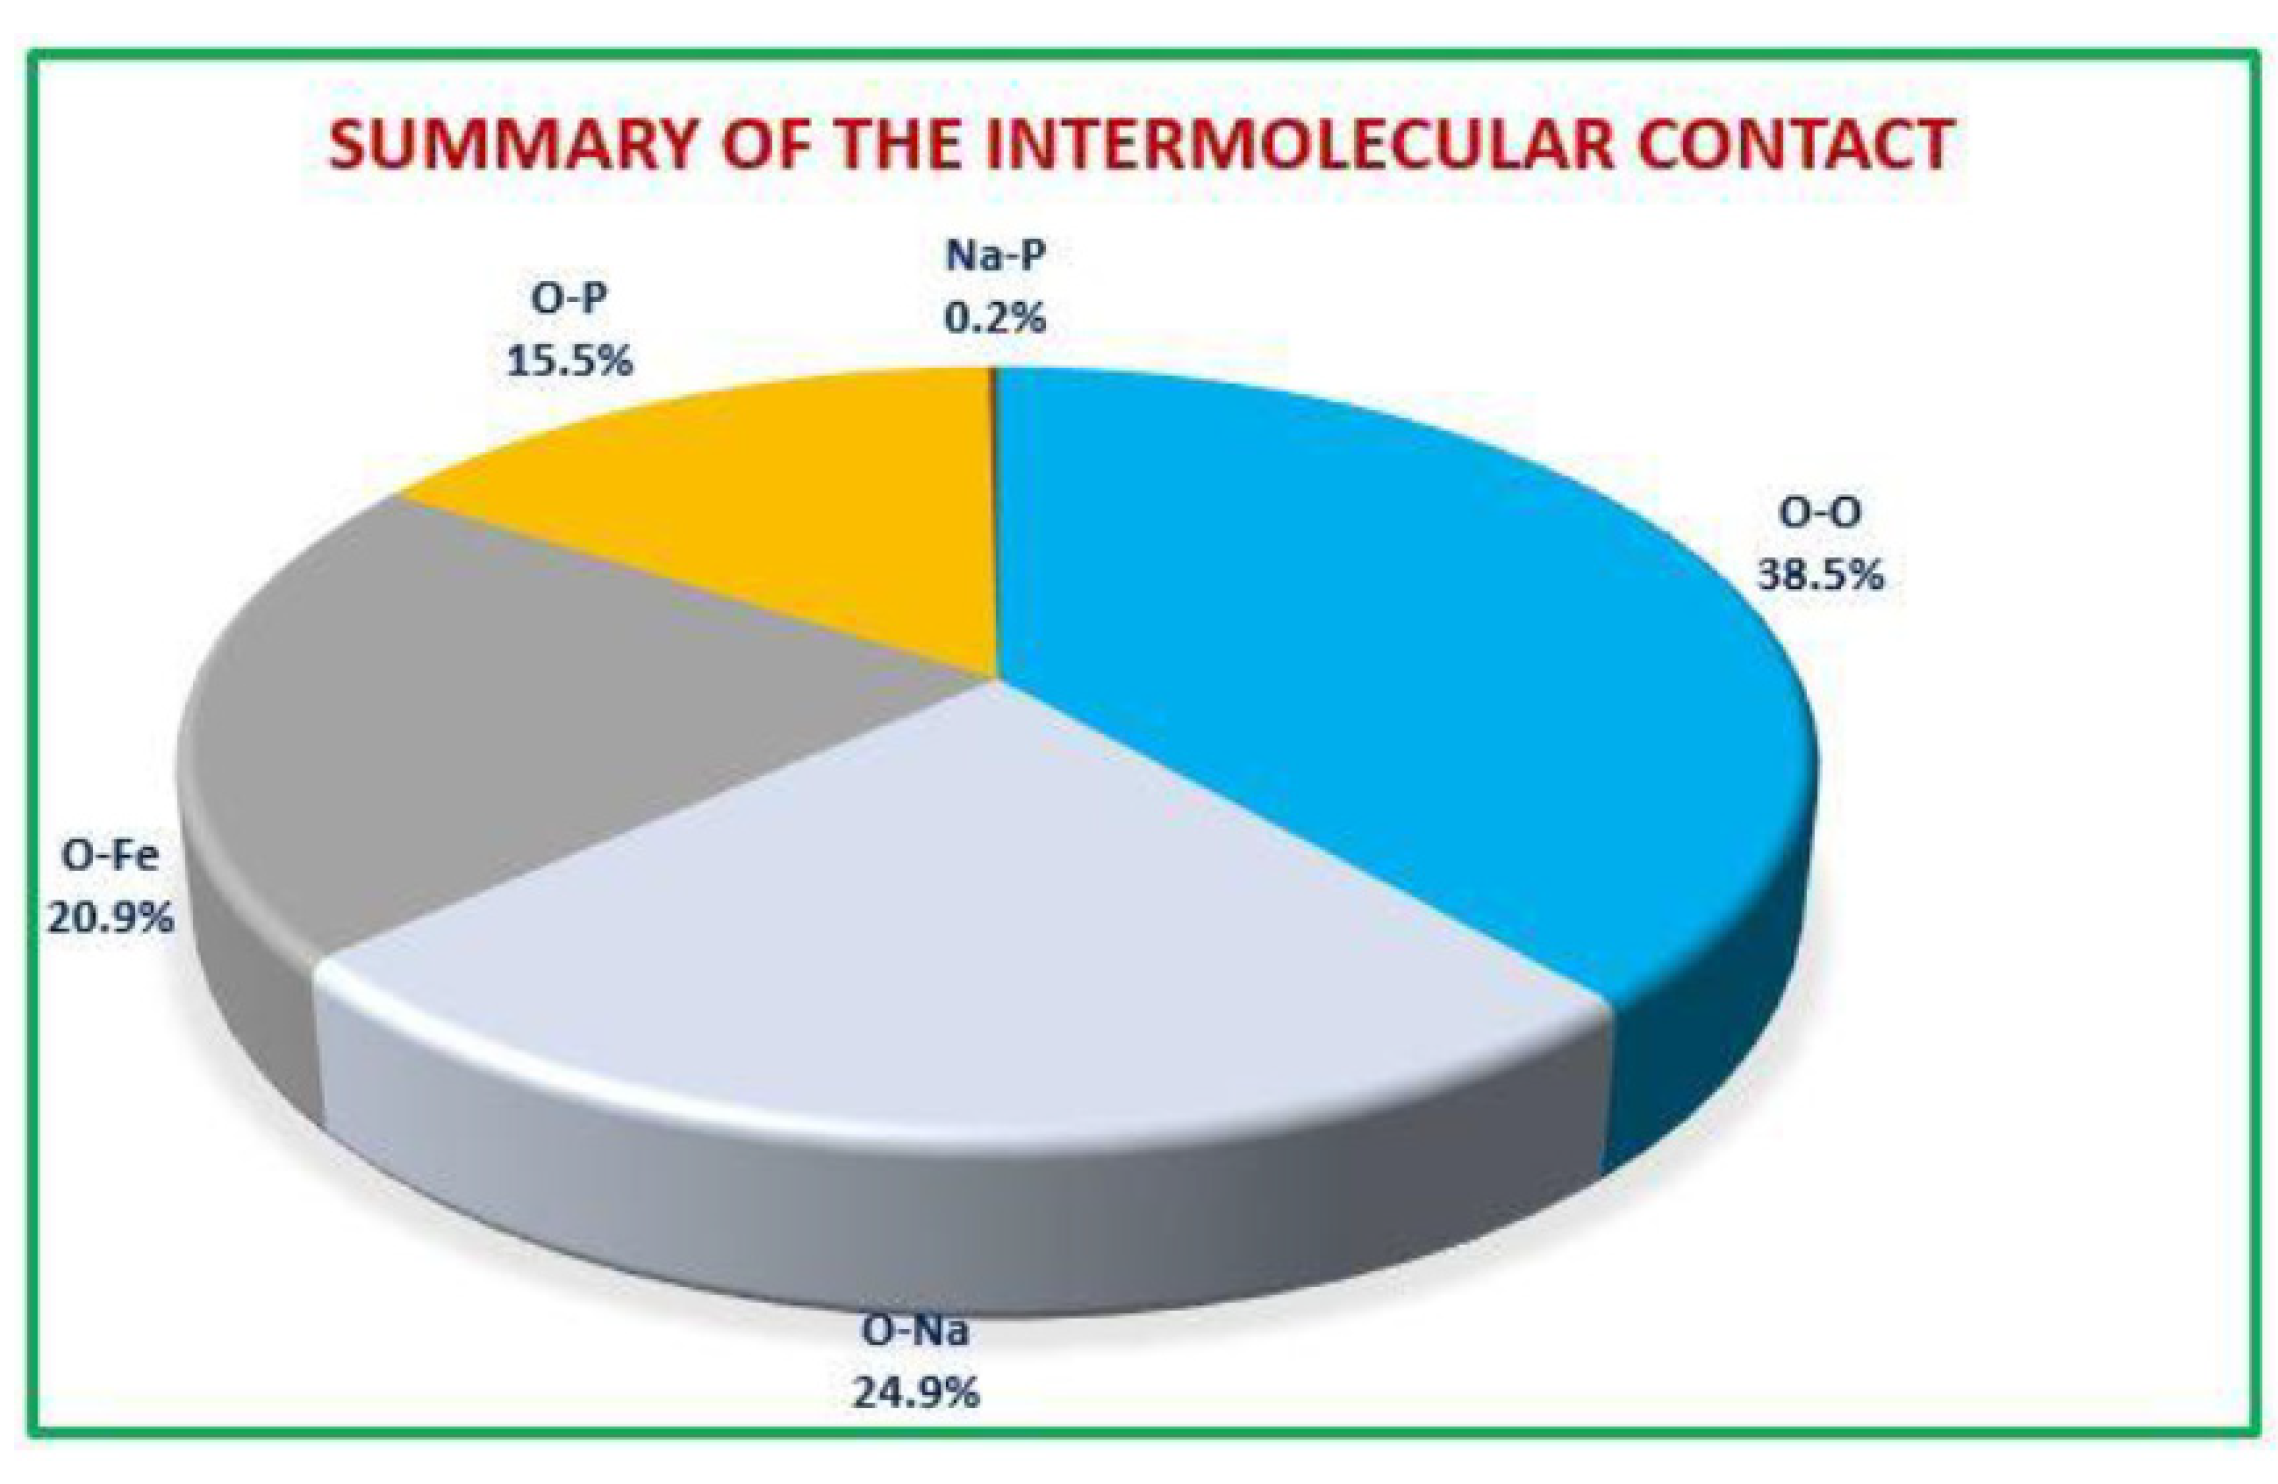
) pair. The relative contributions of various intermolecular contacts to the Hirshfeld surface area in all finasteride structure is shown in
Figure 6.
3.3. Infrared and Raman Spectroscopy
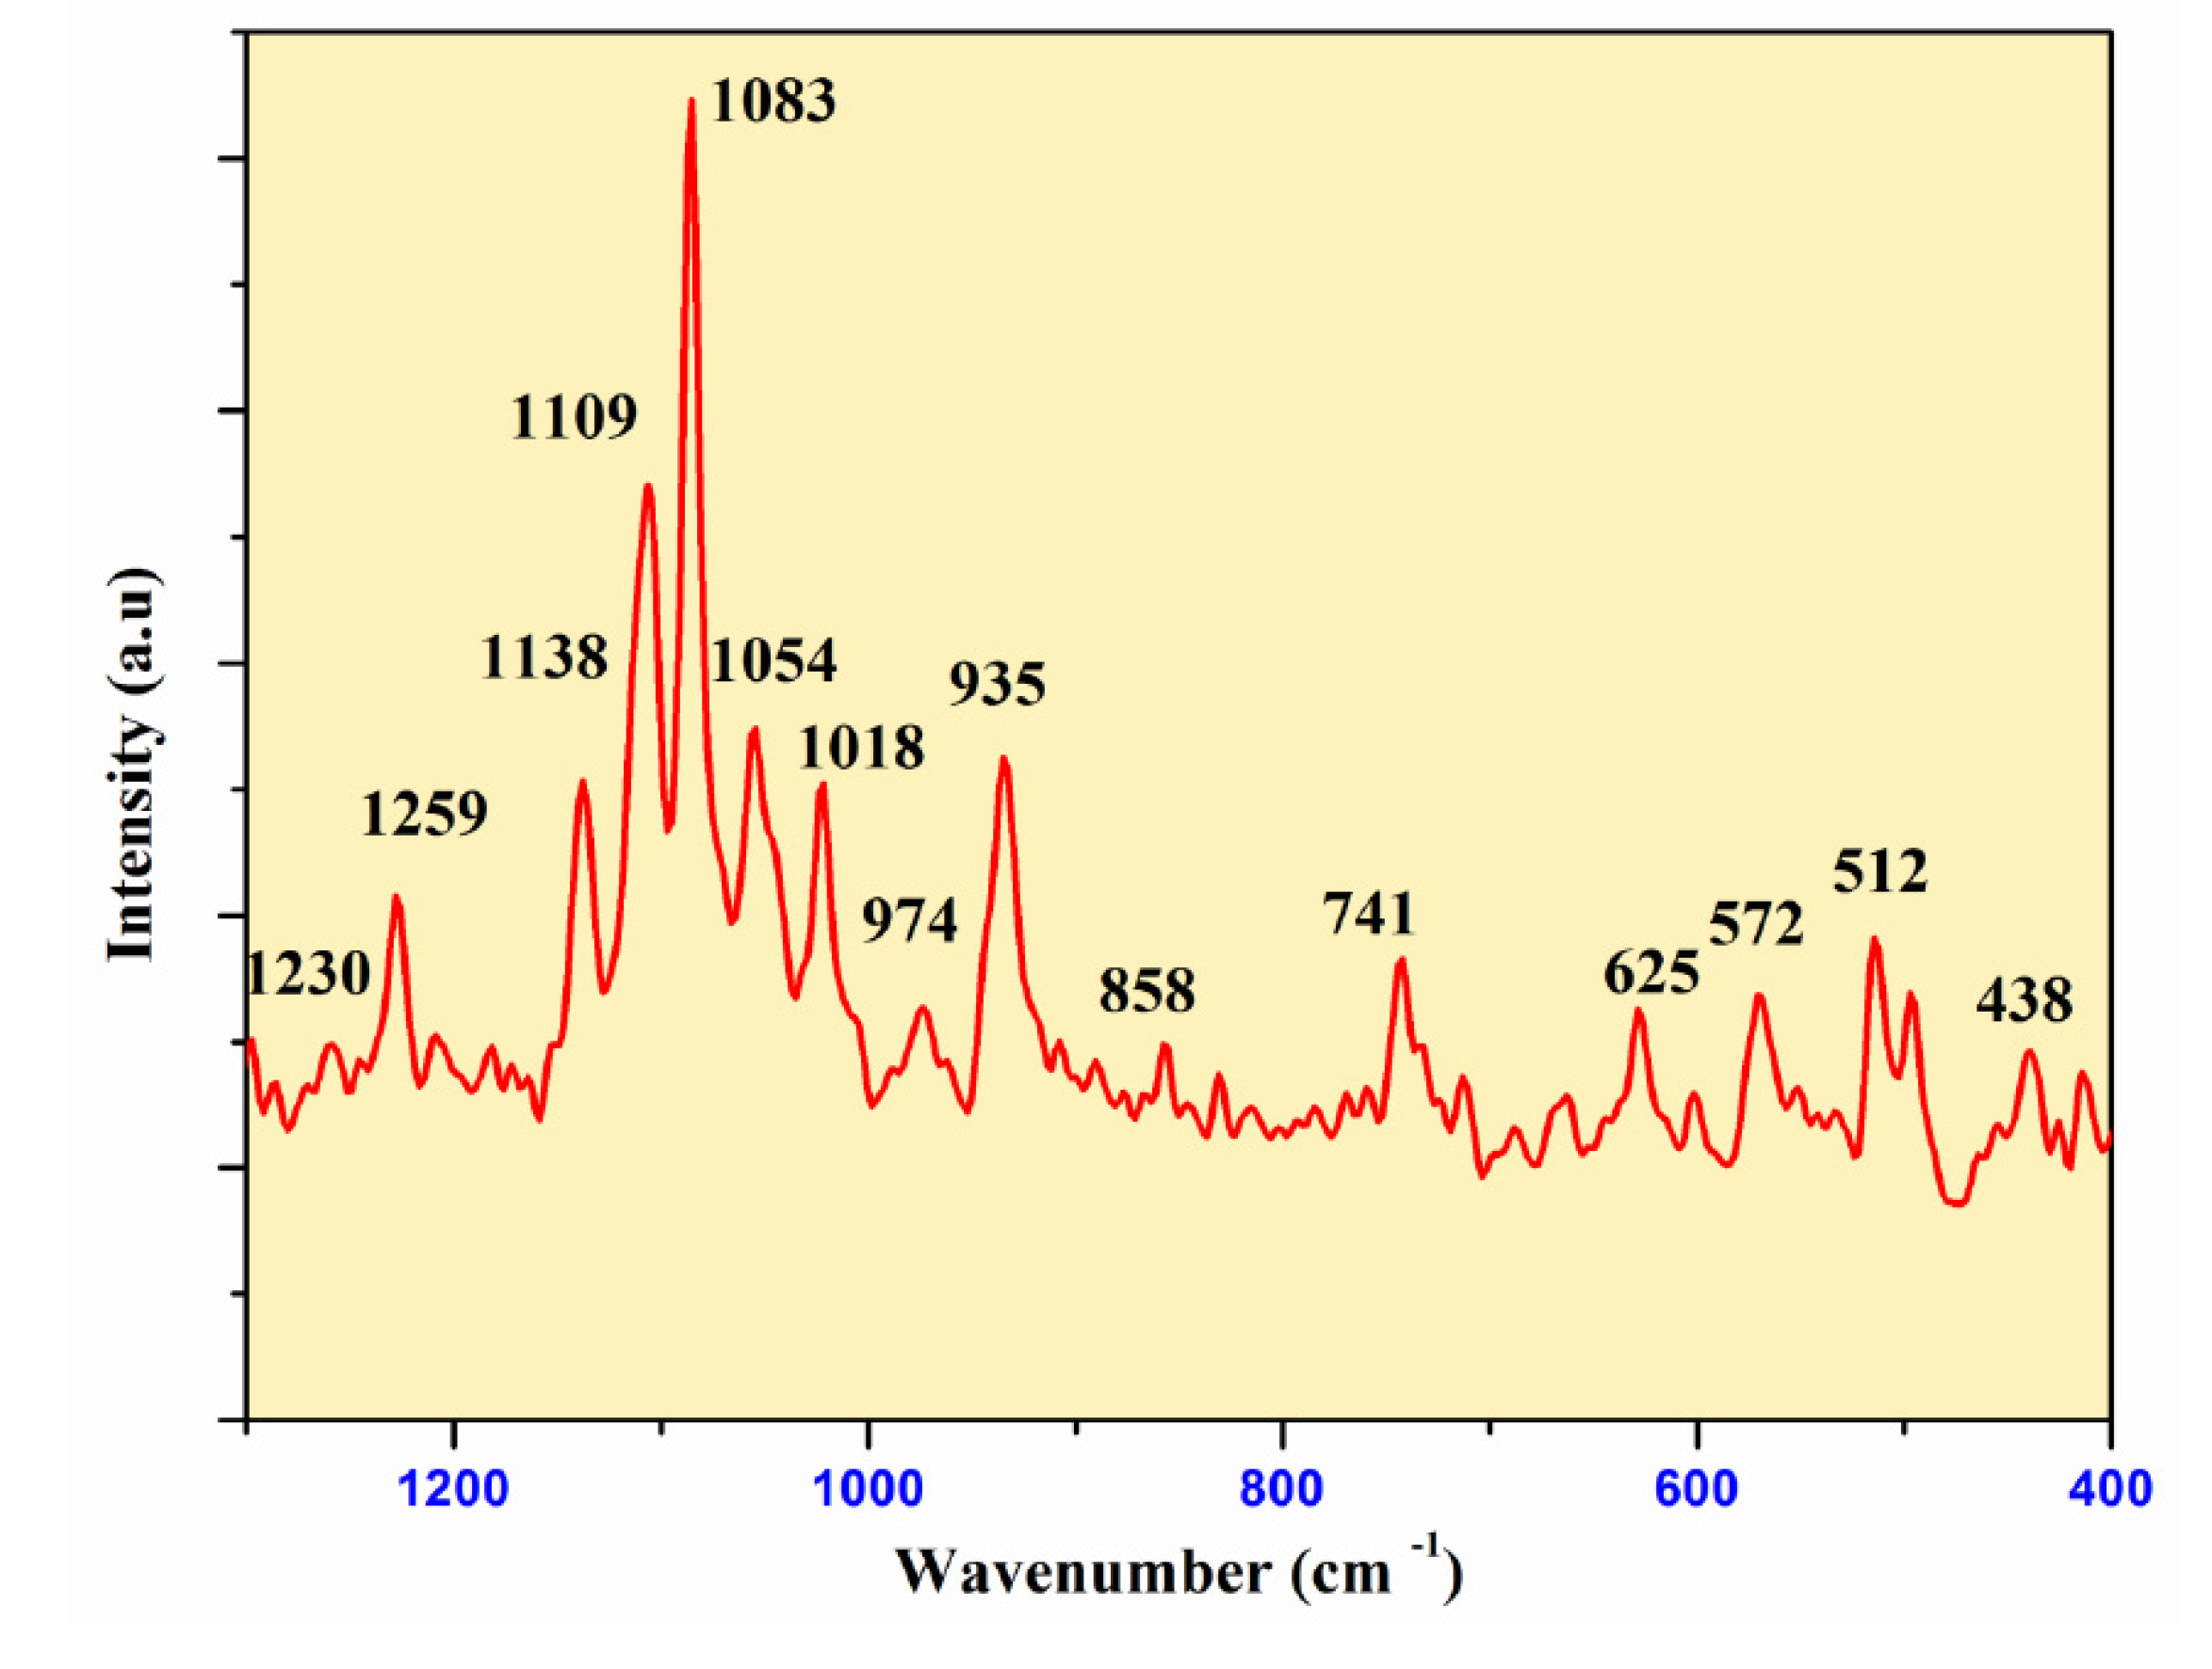
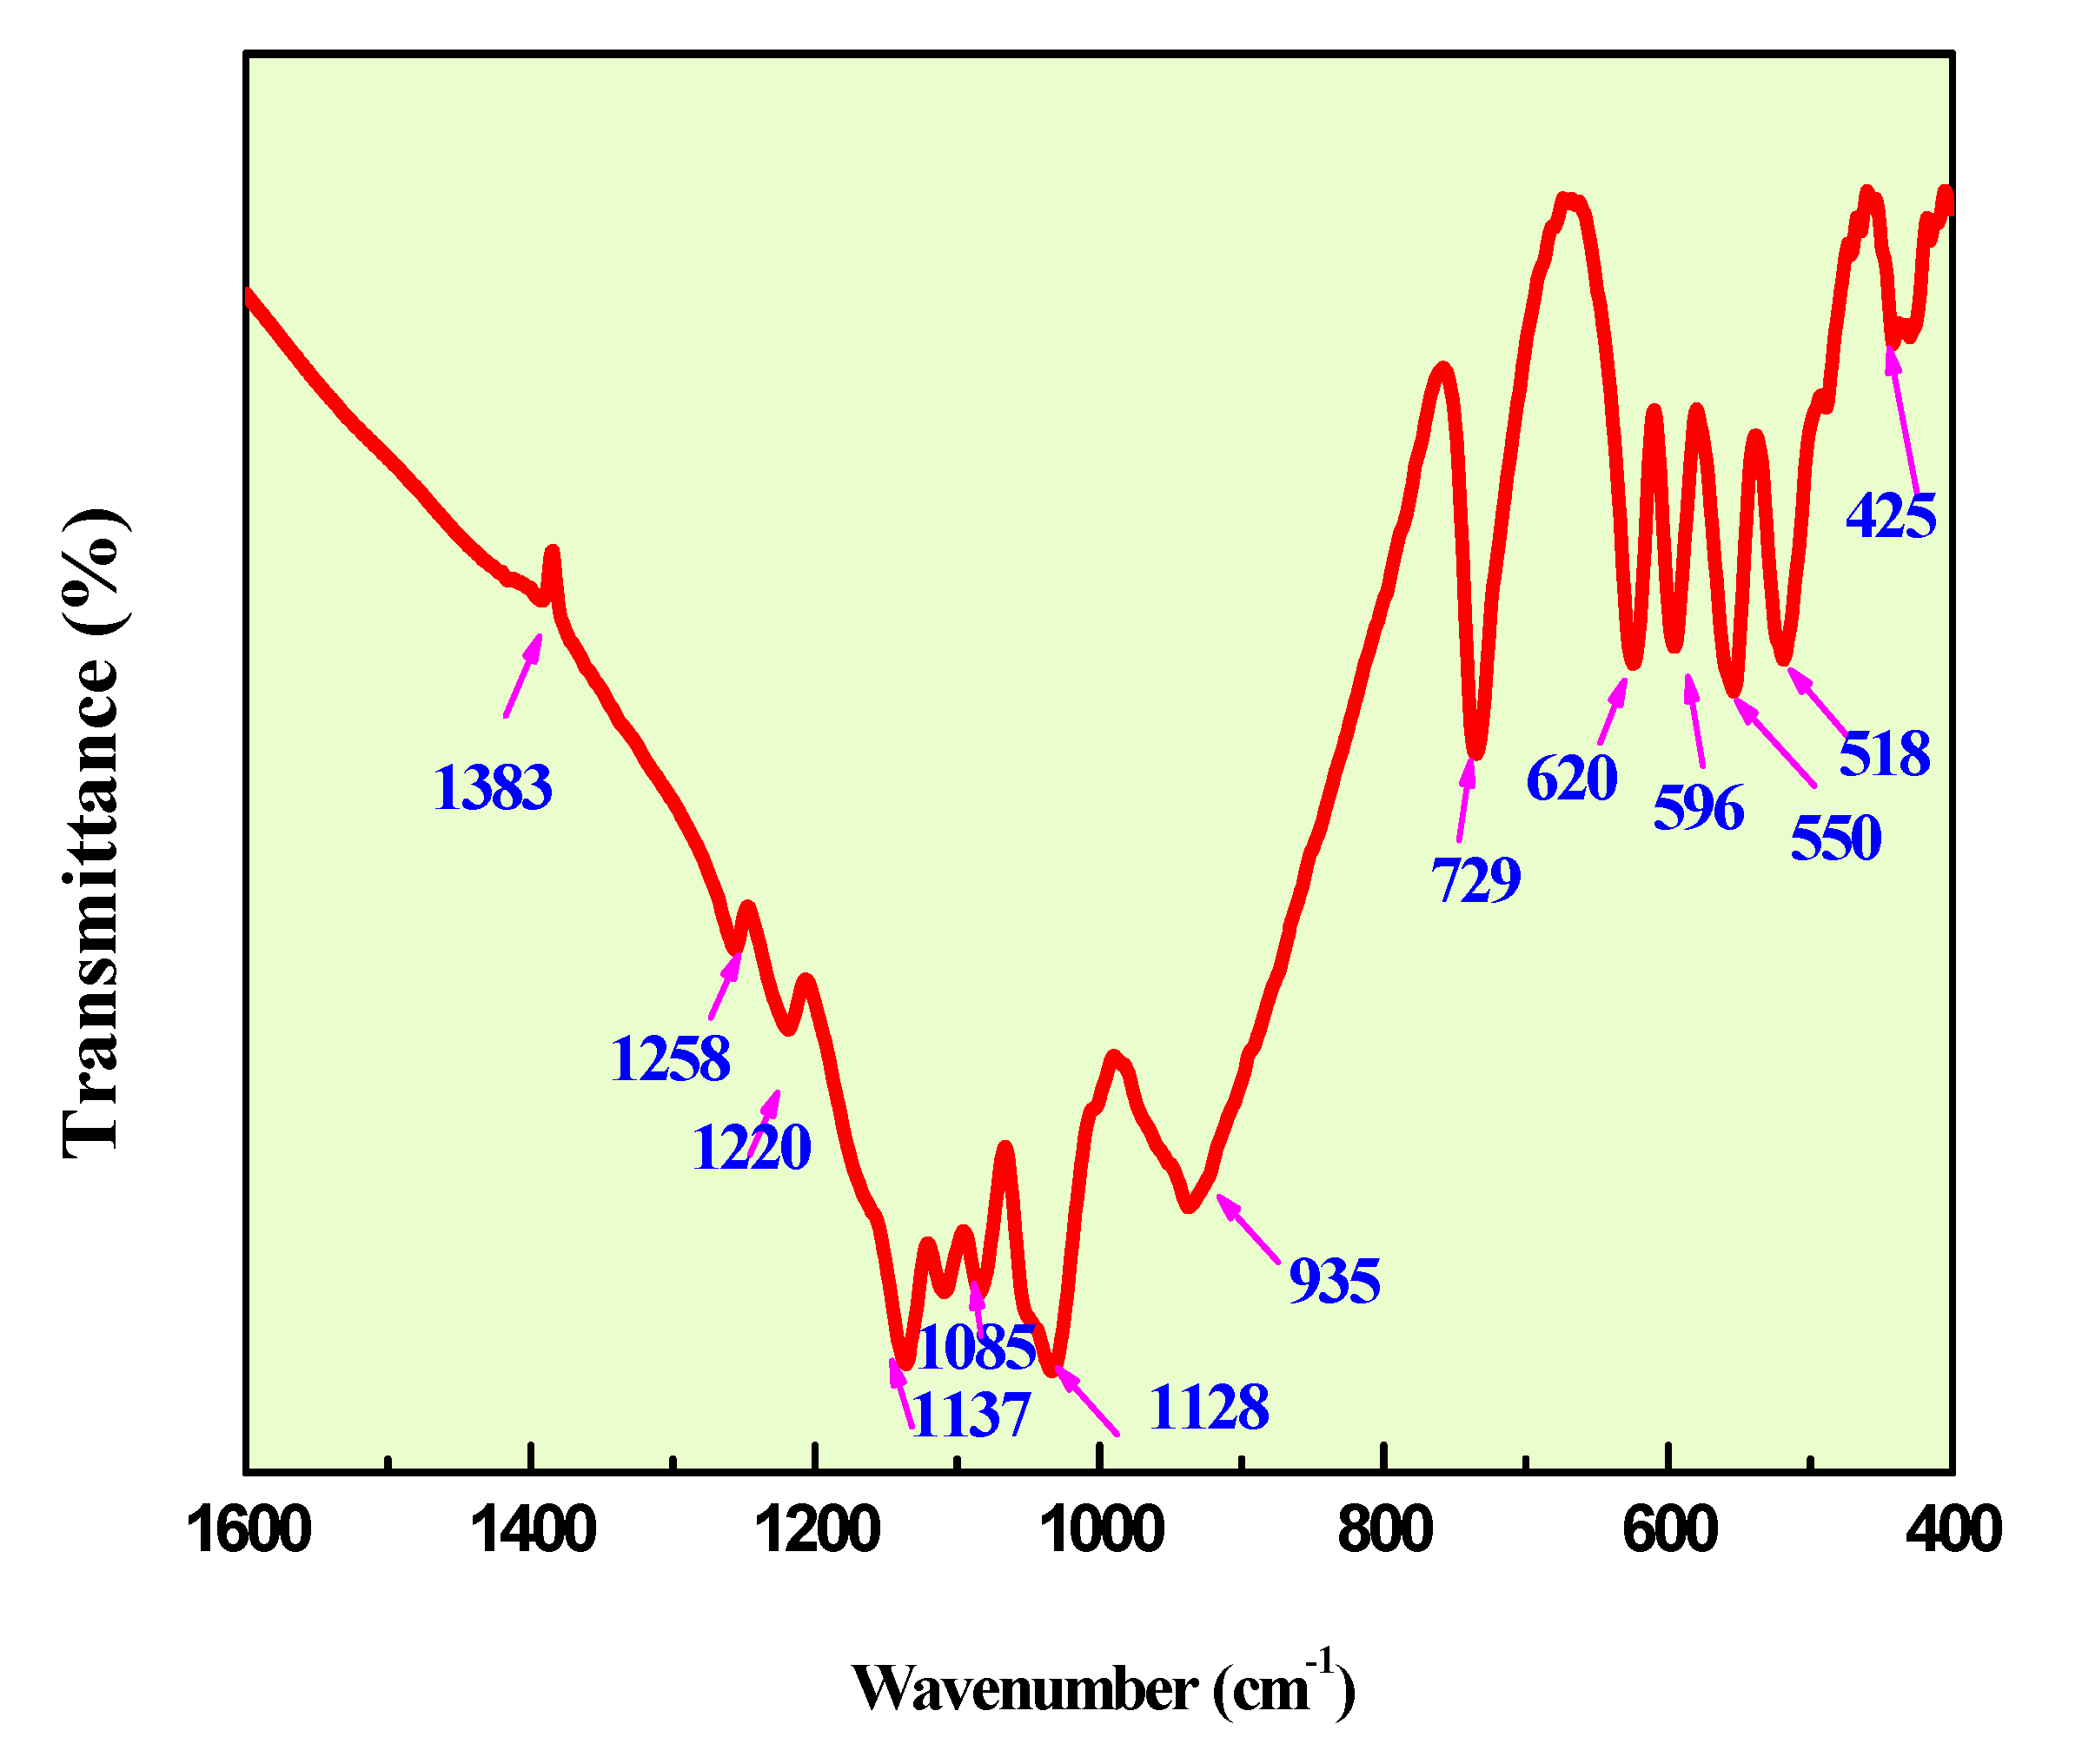
Figure 7 and
Figure 8 show the infrared and Raman spectra of Ag
0.2Na
0.8FeP
2O
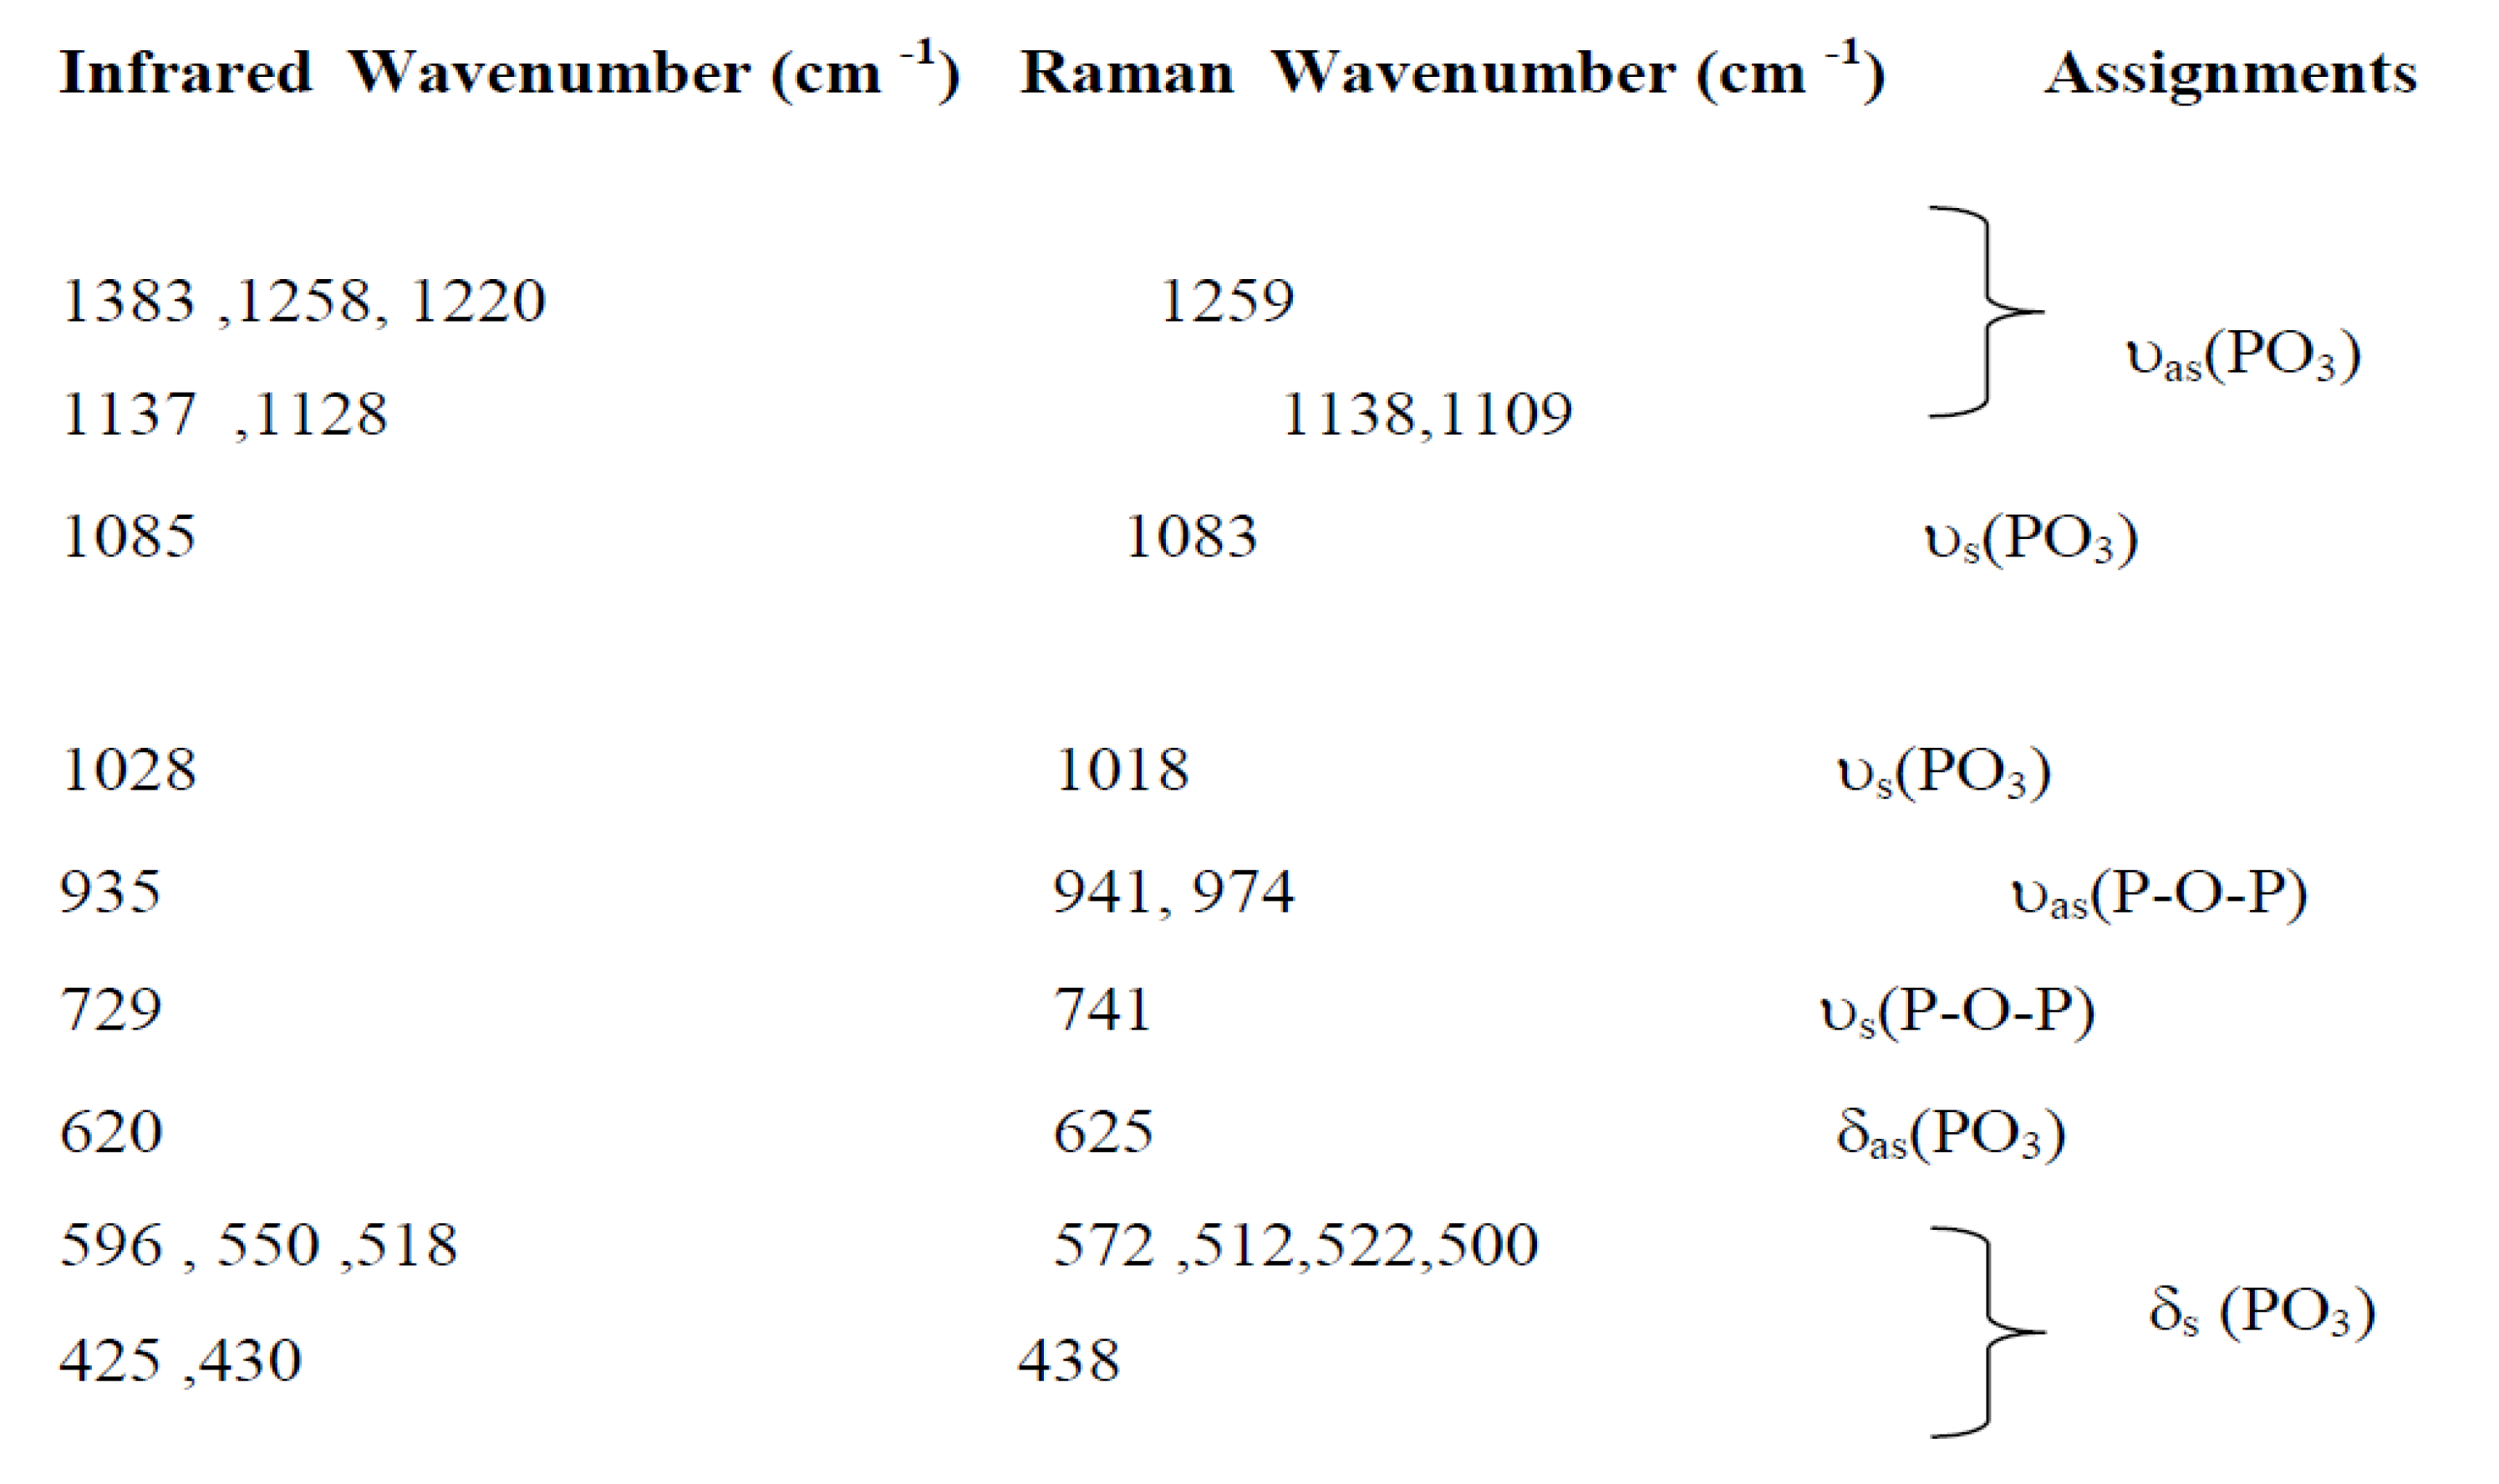
7. The frequencies and labels of the IR and Raman bands are given in
Table 4. The identification of the observed spectral features is based on the comparison with structurally similar materials[
26], following the pattern of diphosphate vibrations in descending frequency.
υas(PO3) >υs (PO3) >υas (POP)>υs (POP)>δas(PO3) >δs(PO3) >δs(POP)
Here, the notations νas and νs represent the asymmetric and symmetric stretching vibrations of the terminal (PO3) or bridging (POP) bonds, respectively. Conversely, δ signifies the associated bond-binding vibrations, typically characterized by lower frequencies.
Indeed, the bands associated with the symmetric and antisymmetric stretching frequencies of PO
3 in P
2O
74− tend to appear within the range of 1270–1020 cm
−1. Additionally, the bands observed between 970–765 cm
−1 are assigned to the antisymmetric and symmetric stretching modes of P–O–P. Notably, the O–P–O bending vibration manifests as a triplet within the 430–583 cm-1 range. As a result, the frequencies and designations for both IR and Raman bands are detailed in
Table 4.A similar situation has been documented in other diphosphates [
27],along with arsenates[
28] and divanadates [
29].
3.4. Impedance Spectroscopy Results
Complex impedance spectroscopy (CIS) stands as a prominent and effective technique employed to examine the electrical characteristics of a substance. It furnishes insights into the mobility of ions within Ag
0.2Na
0.8FeP
2O
7, the time taken for relaxation, and the level of electrical conductivity [
30].
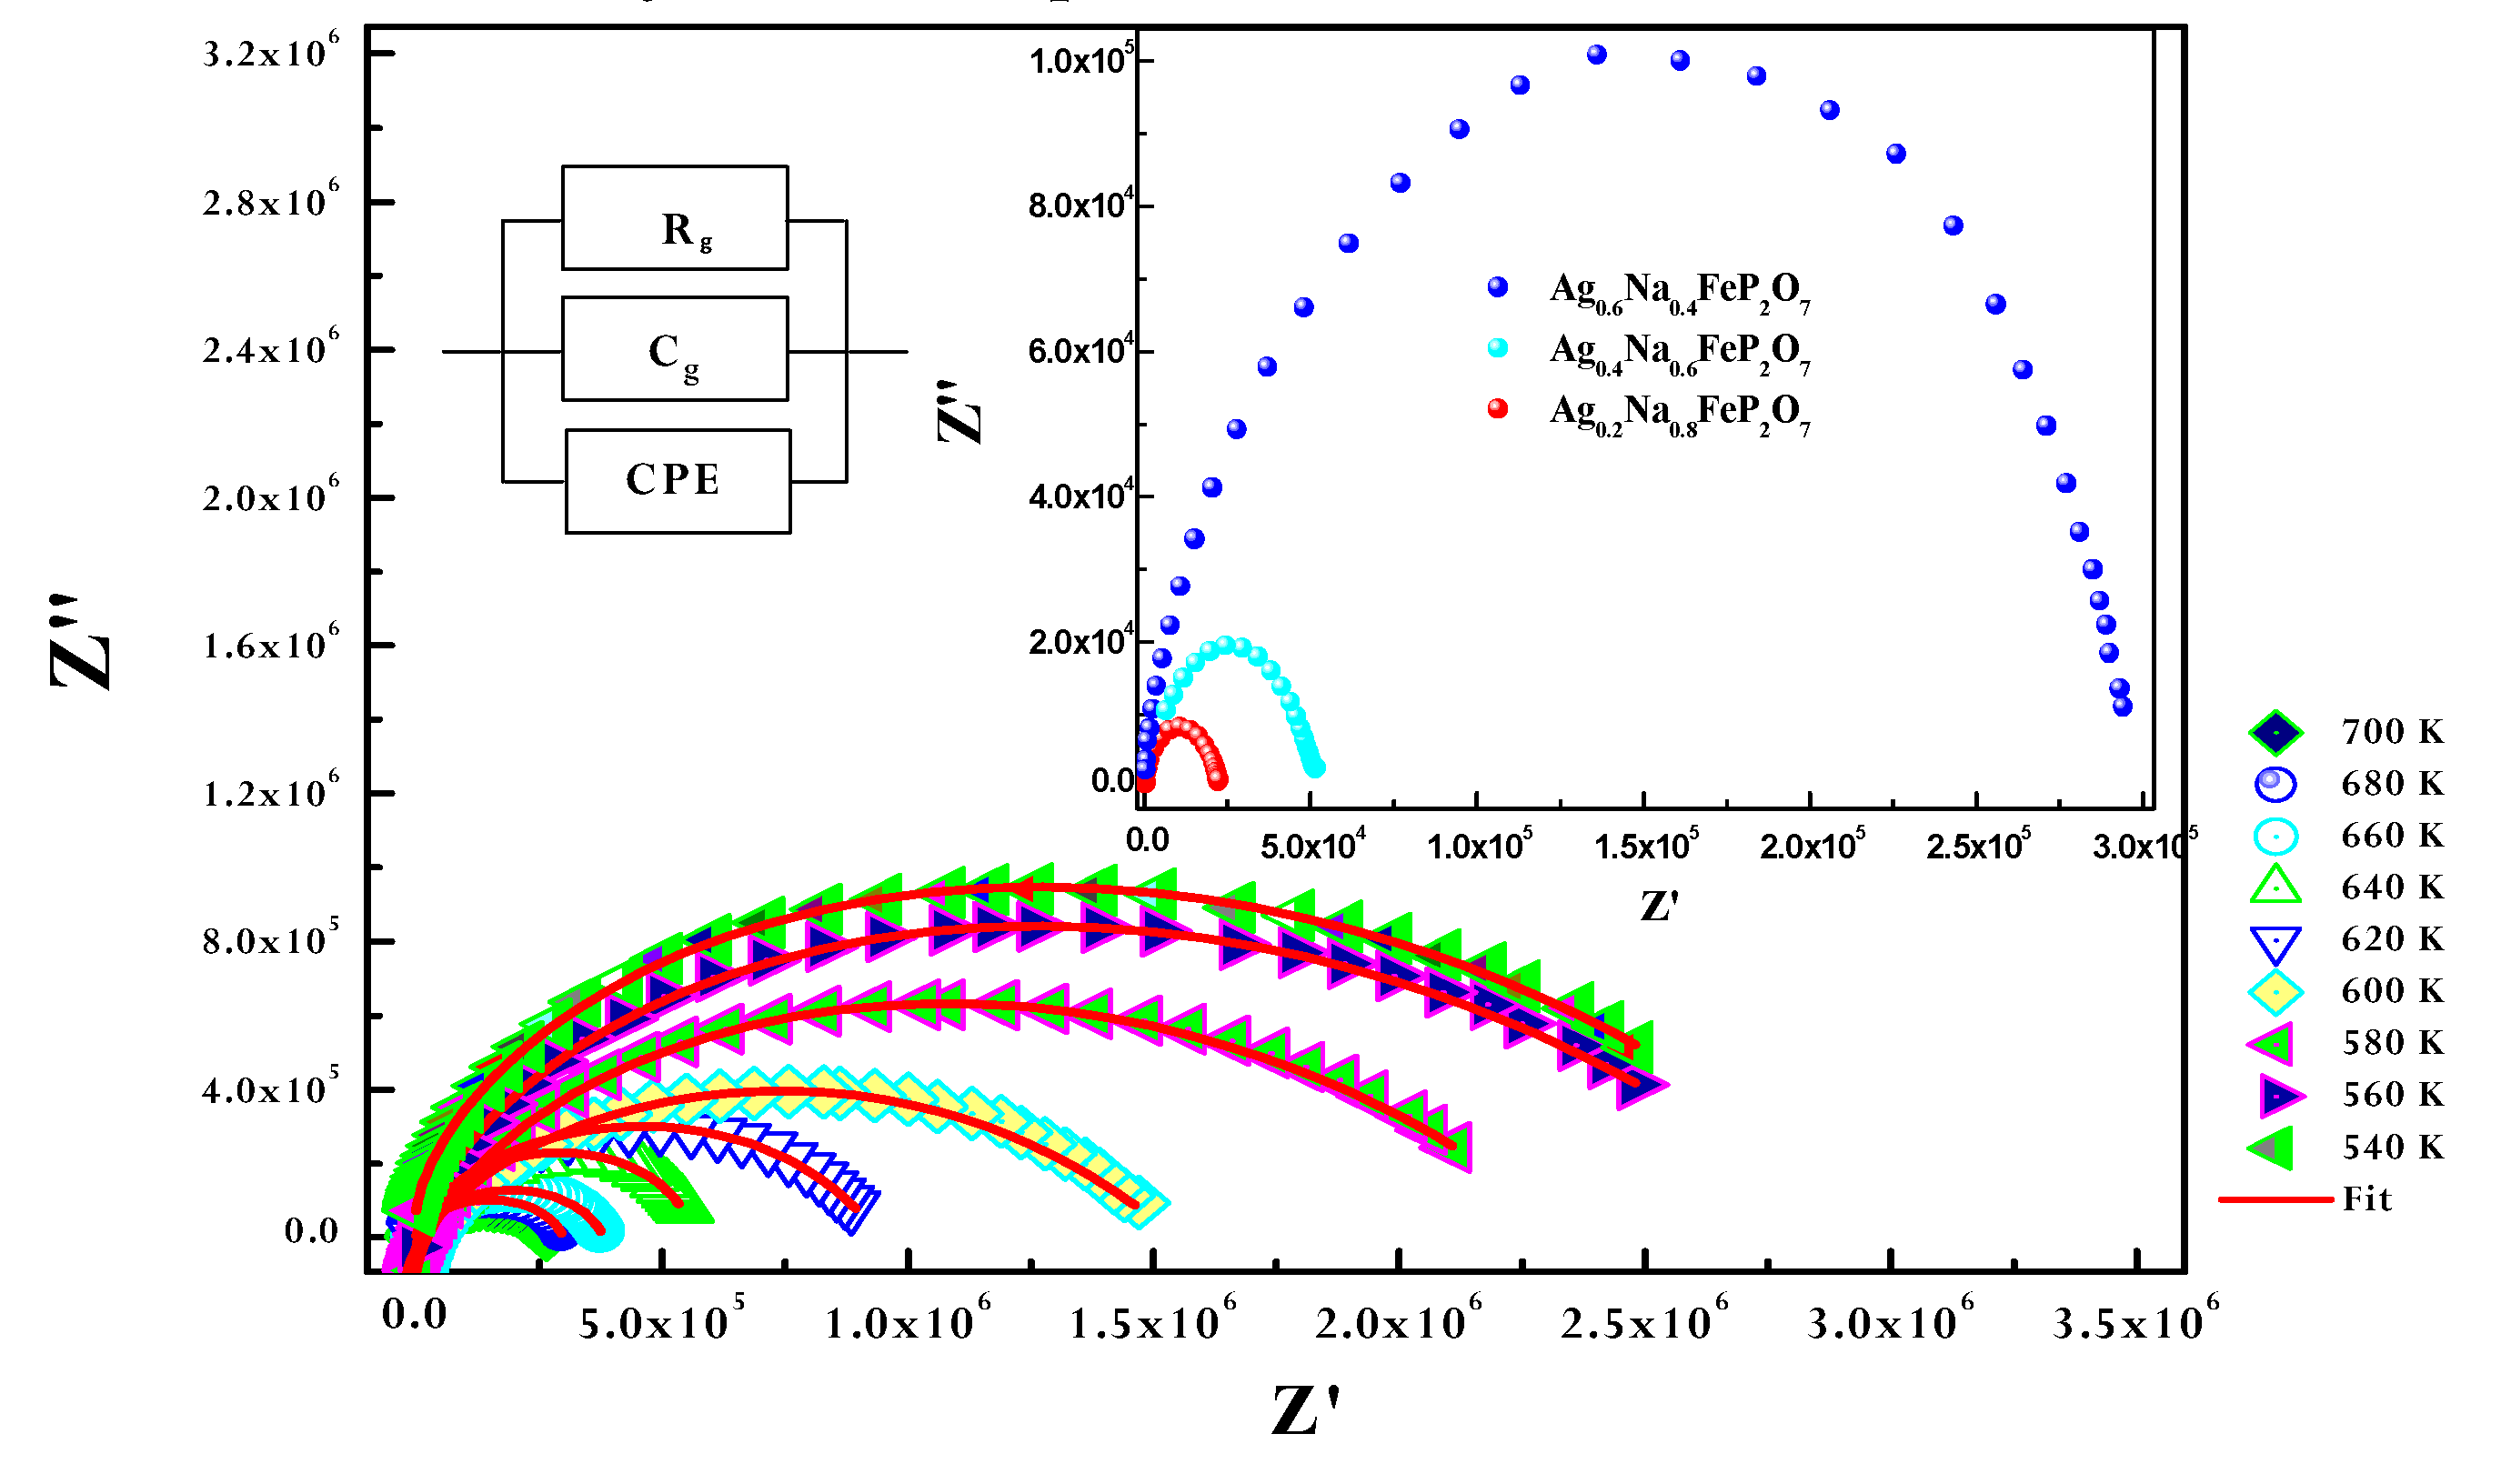
Figure 9 illustrates a standard complex impedance plane representation at various temperatures. Evidently, singular semicircular arcs emerge at higher frequencies, with rising temperatures;the radii of the arcs associated with the bulk resistivity of the sample decrease, signifying an activated thermal conduction mechanism. This observation unveils insights into the electrical behavior taking place within the sample and its interconnection with the sample's microstructure, as elucidated through an electrical equivalent circuit model [
31]. Moreover, this enables the establishment of connections between parameters of the electrochemical system and the characteristics of impedance elements.The Nyquist plots of the Ag
1-xNa
xFeP
2O
7 (x=0.4, x=0.6, and x=0.8) samples at 640 K are presented in the inset of
Figure 9. As the amount of (Na) substitution in the samples increases (x increases), the radius of the arc representing the bulk resistance of the samples decreases. This decrease in radius indicates that the conductivity of the samples increases as the amount of sodium substitution increases.
Z-view software was utilized to fit the curves, and the most accurate fit was achieved by implementing an equivalent circuit. This approach facilitates the identification of connections between the electrochemical system parameters and traits of the impedance elements.The equivalent circuit configuration forAg
0.2Na
0.8FeP
2O
7consists of resistance, capacitance, and fractal capacitance ( as shown in the inset of Fig. 9 The CPE impedance is given by the subsequent relationship [
32]:
Where α is associated with the departure from the vertical alignment of the line in the plot of − Z'' against Z'. A value of α = 1 signifies ideal capacitance, whereas smaller α values directly correspond to the irregularity or roughness of the electrode, where the real (Z’) and imaginary (Z’) of the total impedance of the equivalent circuit are determined as follows:
The continuous line depicts the best alignment with the experimental data as per Equations (5) and (6) ocross all frequencies.. The interface between the pellet and the electrolyte is thus accurately described by the suggested equivalent circuit. The electrical conductivity σg is calculated using the acquired values of grain resistance (Rg), which correspond to the grain, in the manner described below [
33]:
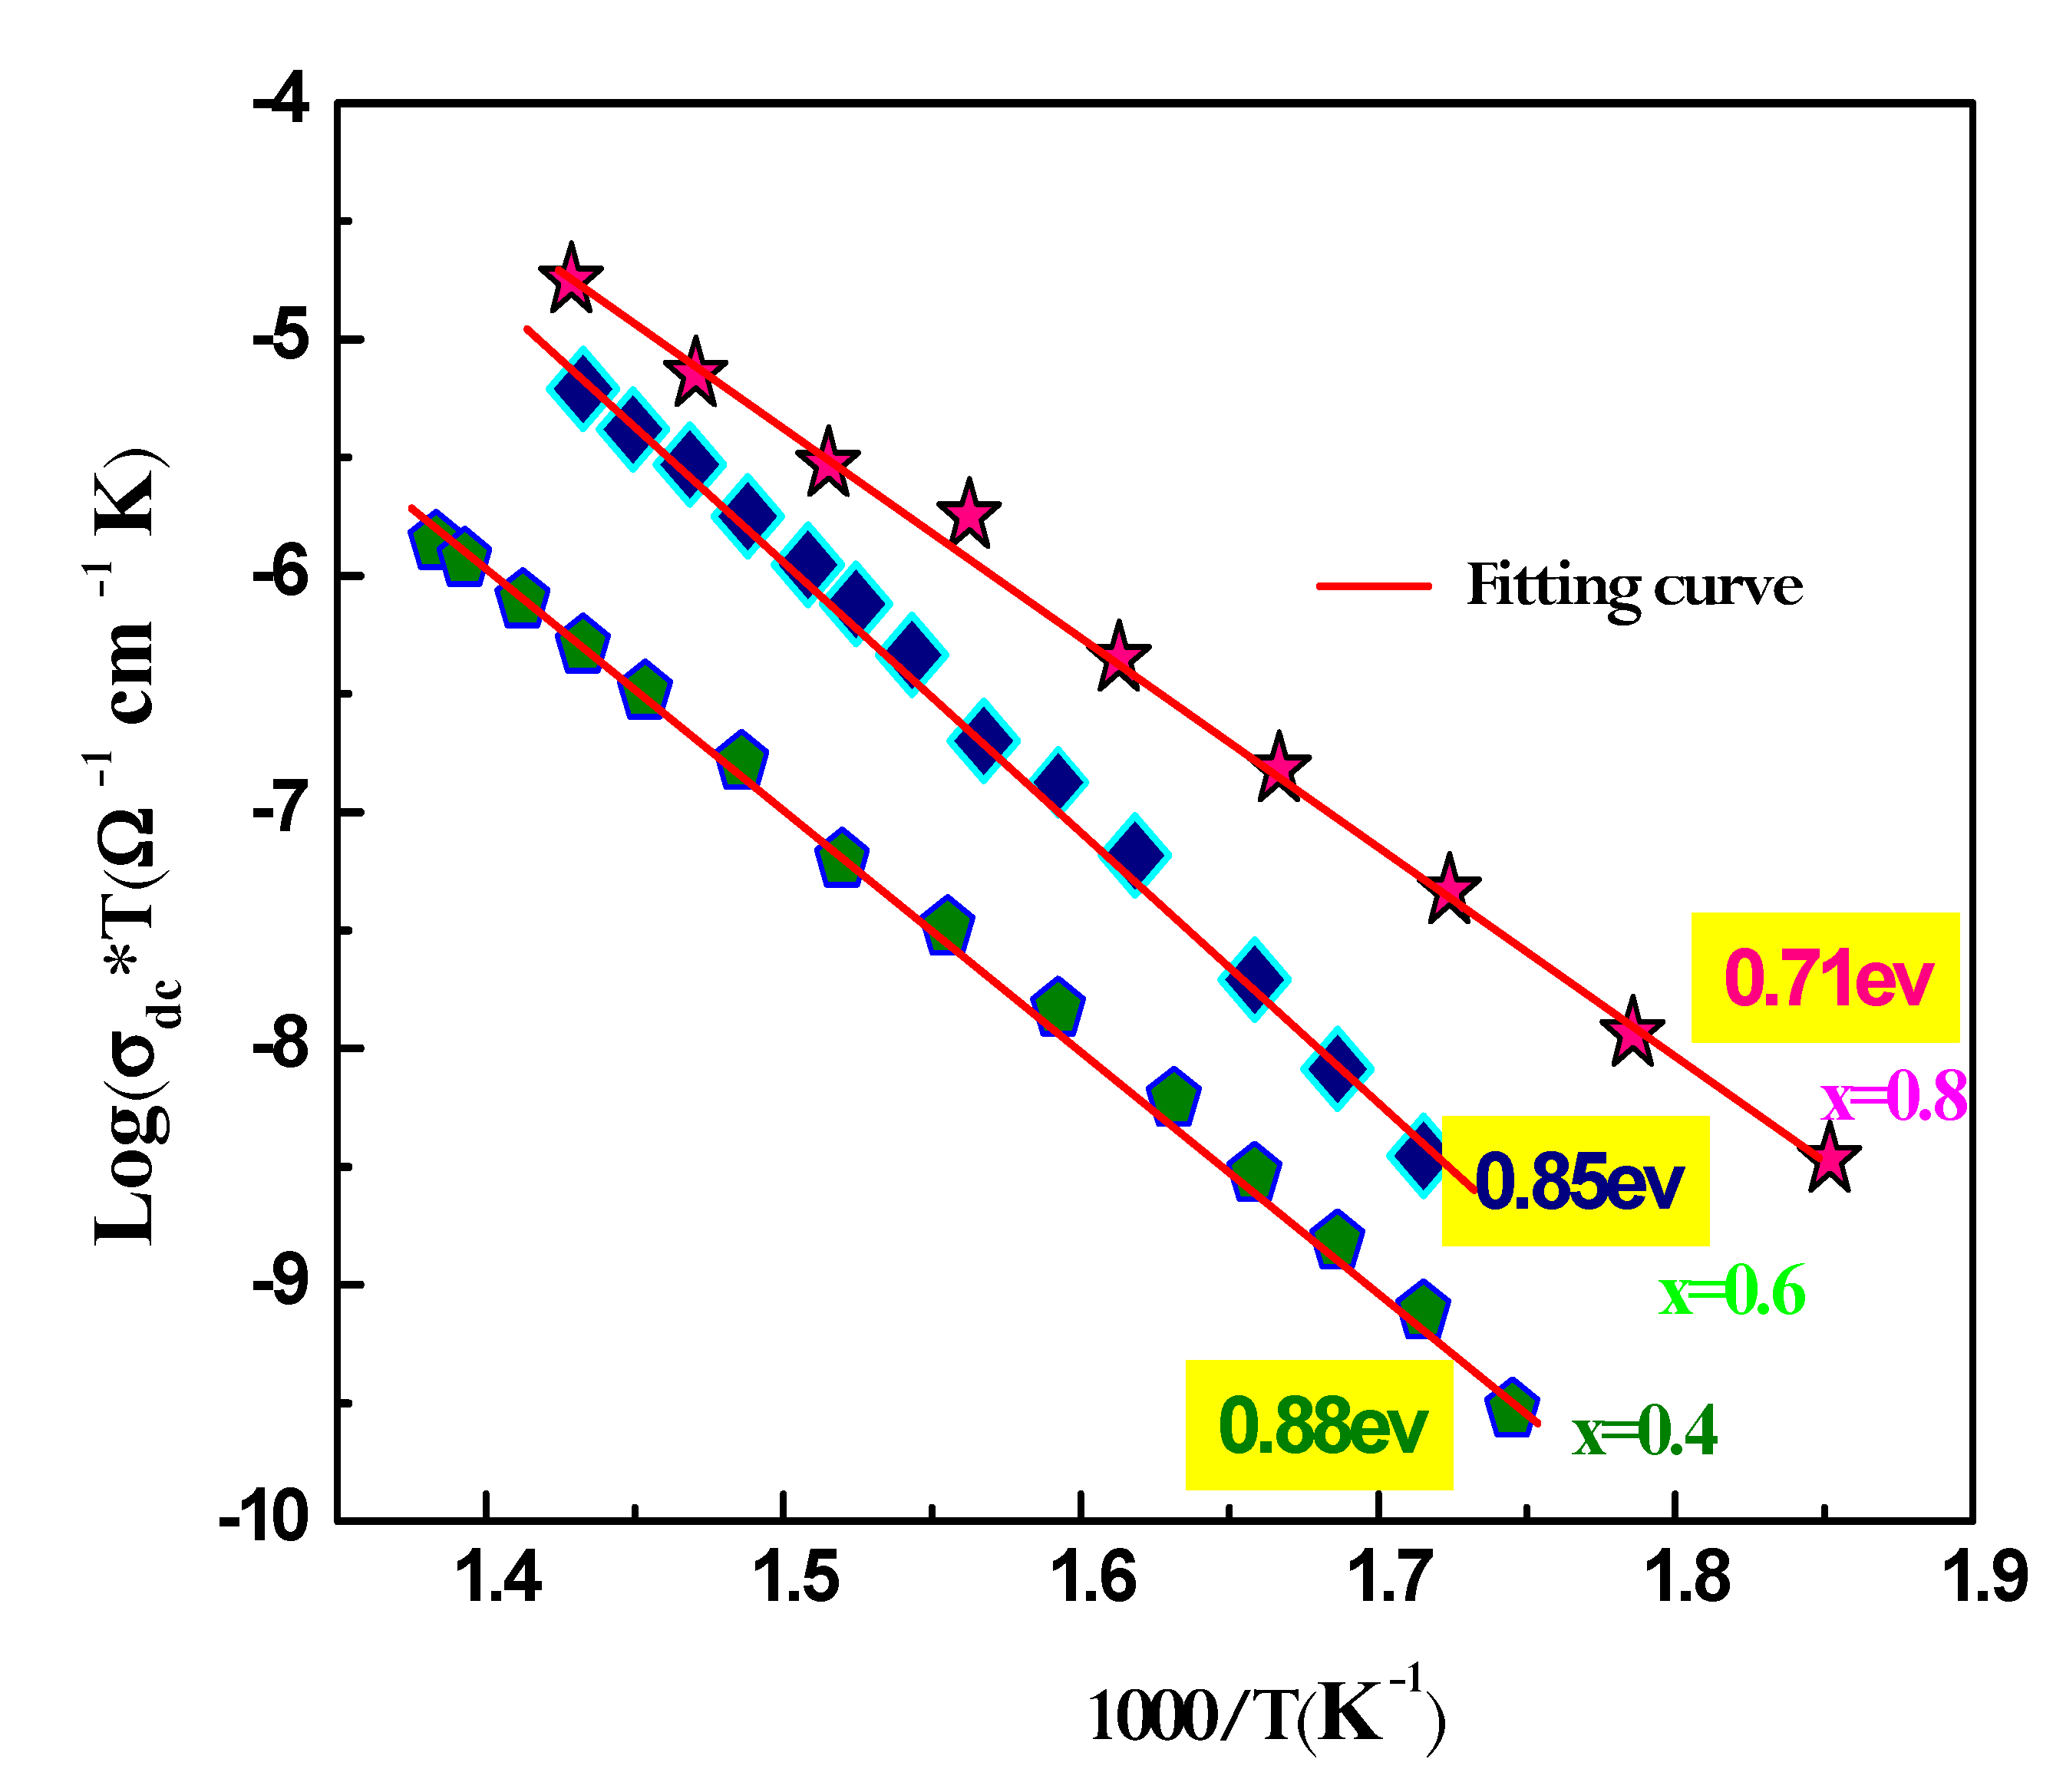
where e is the sample’s the thickness, and S is the pellet's flat face's surface area.The temperature evolution of the specific conductivity Ln (dc*T) vs 1000/T for Ag1-xNaxFeP2O7 (x=0.4; 0.6; 0.8) is shown in Figure. 10, suggesting an Arrhenius-type behavior that may be described as follows:
In this equation, Ea is the activation energy of the DC conductivity, kB is Boltzmann's constant, T is the temperature, dc is the DC conductivity, and A is the pre-exponential factor. As depicted in
Figure 10, the slight increase in DC conductivity with increasing temperature is caused by an increase in the thermally stimulated mobility of the ions in accordance with hopping conduction.The activation energy value, obtained from the Arrhenius plot, is presented in the inset of the figure.The activation energy Ea also decreases as the Na ion content increases in the sample. This decrease in activation energy suggests that the potential barrier that ions have to overcome to hop between available equivalent sites is gradually decreasing as the Na content increases. This is because the formation of more Na+ ions reduces the number of available equivalent sites, which in turn reduces the potential barrier that ions have to overcome [
34].
3.5. AC Conduction Measurements
3.5.1. Variations of AC Conductivity with Frequency and Temperature
AC measurements hold significant importance for any dielectric substance, as they provide extensive insights into dynamic characteristics like capacitance, conductivity, and dissipation factor. Furthermore, AC assessments play a crucial role in discerning the underlying conduction mechanism. In the current study, the AC electrical conductivity was determined using the subsequent equation [
35]:
Here, Z' and Z'' represent the real and imaginary components of complex impedance, while e and s denote the thickness and area, respectively, of the current pellet.
The AC conductivity is commonly characterized using Jonscher's universal power law attribute:
Where
is the direct current conductivity of the sample, A is a constant temperature dependent and s is the power law exponent, where 0 < s< 1[
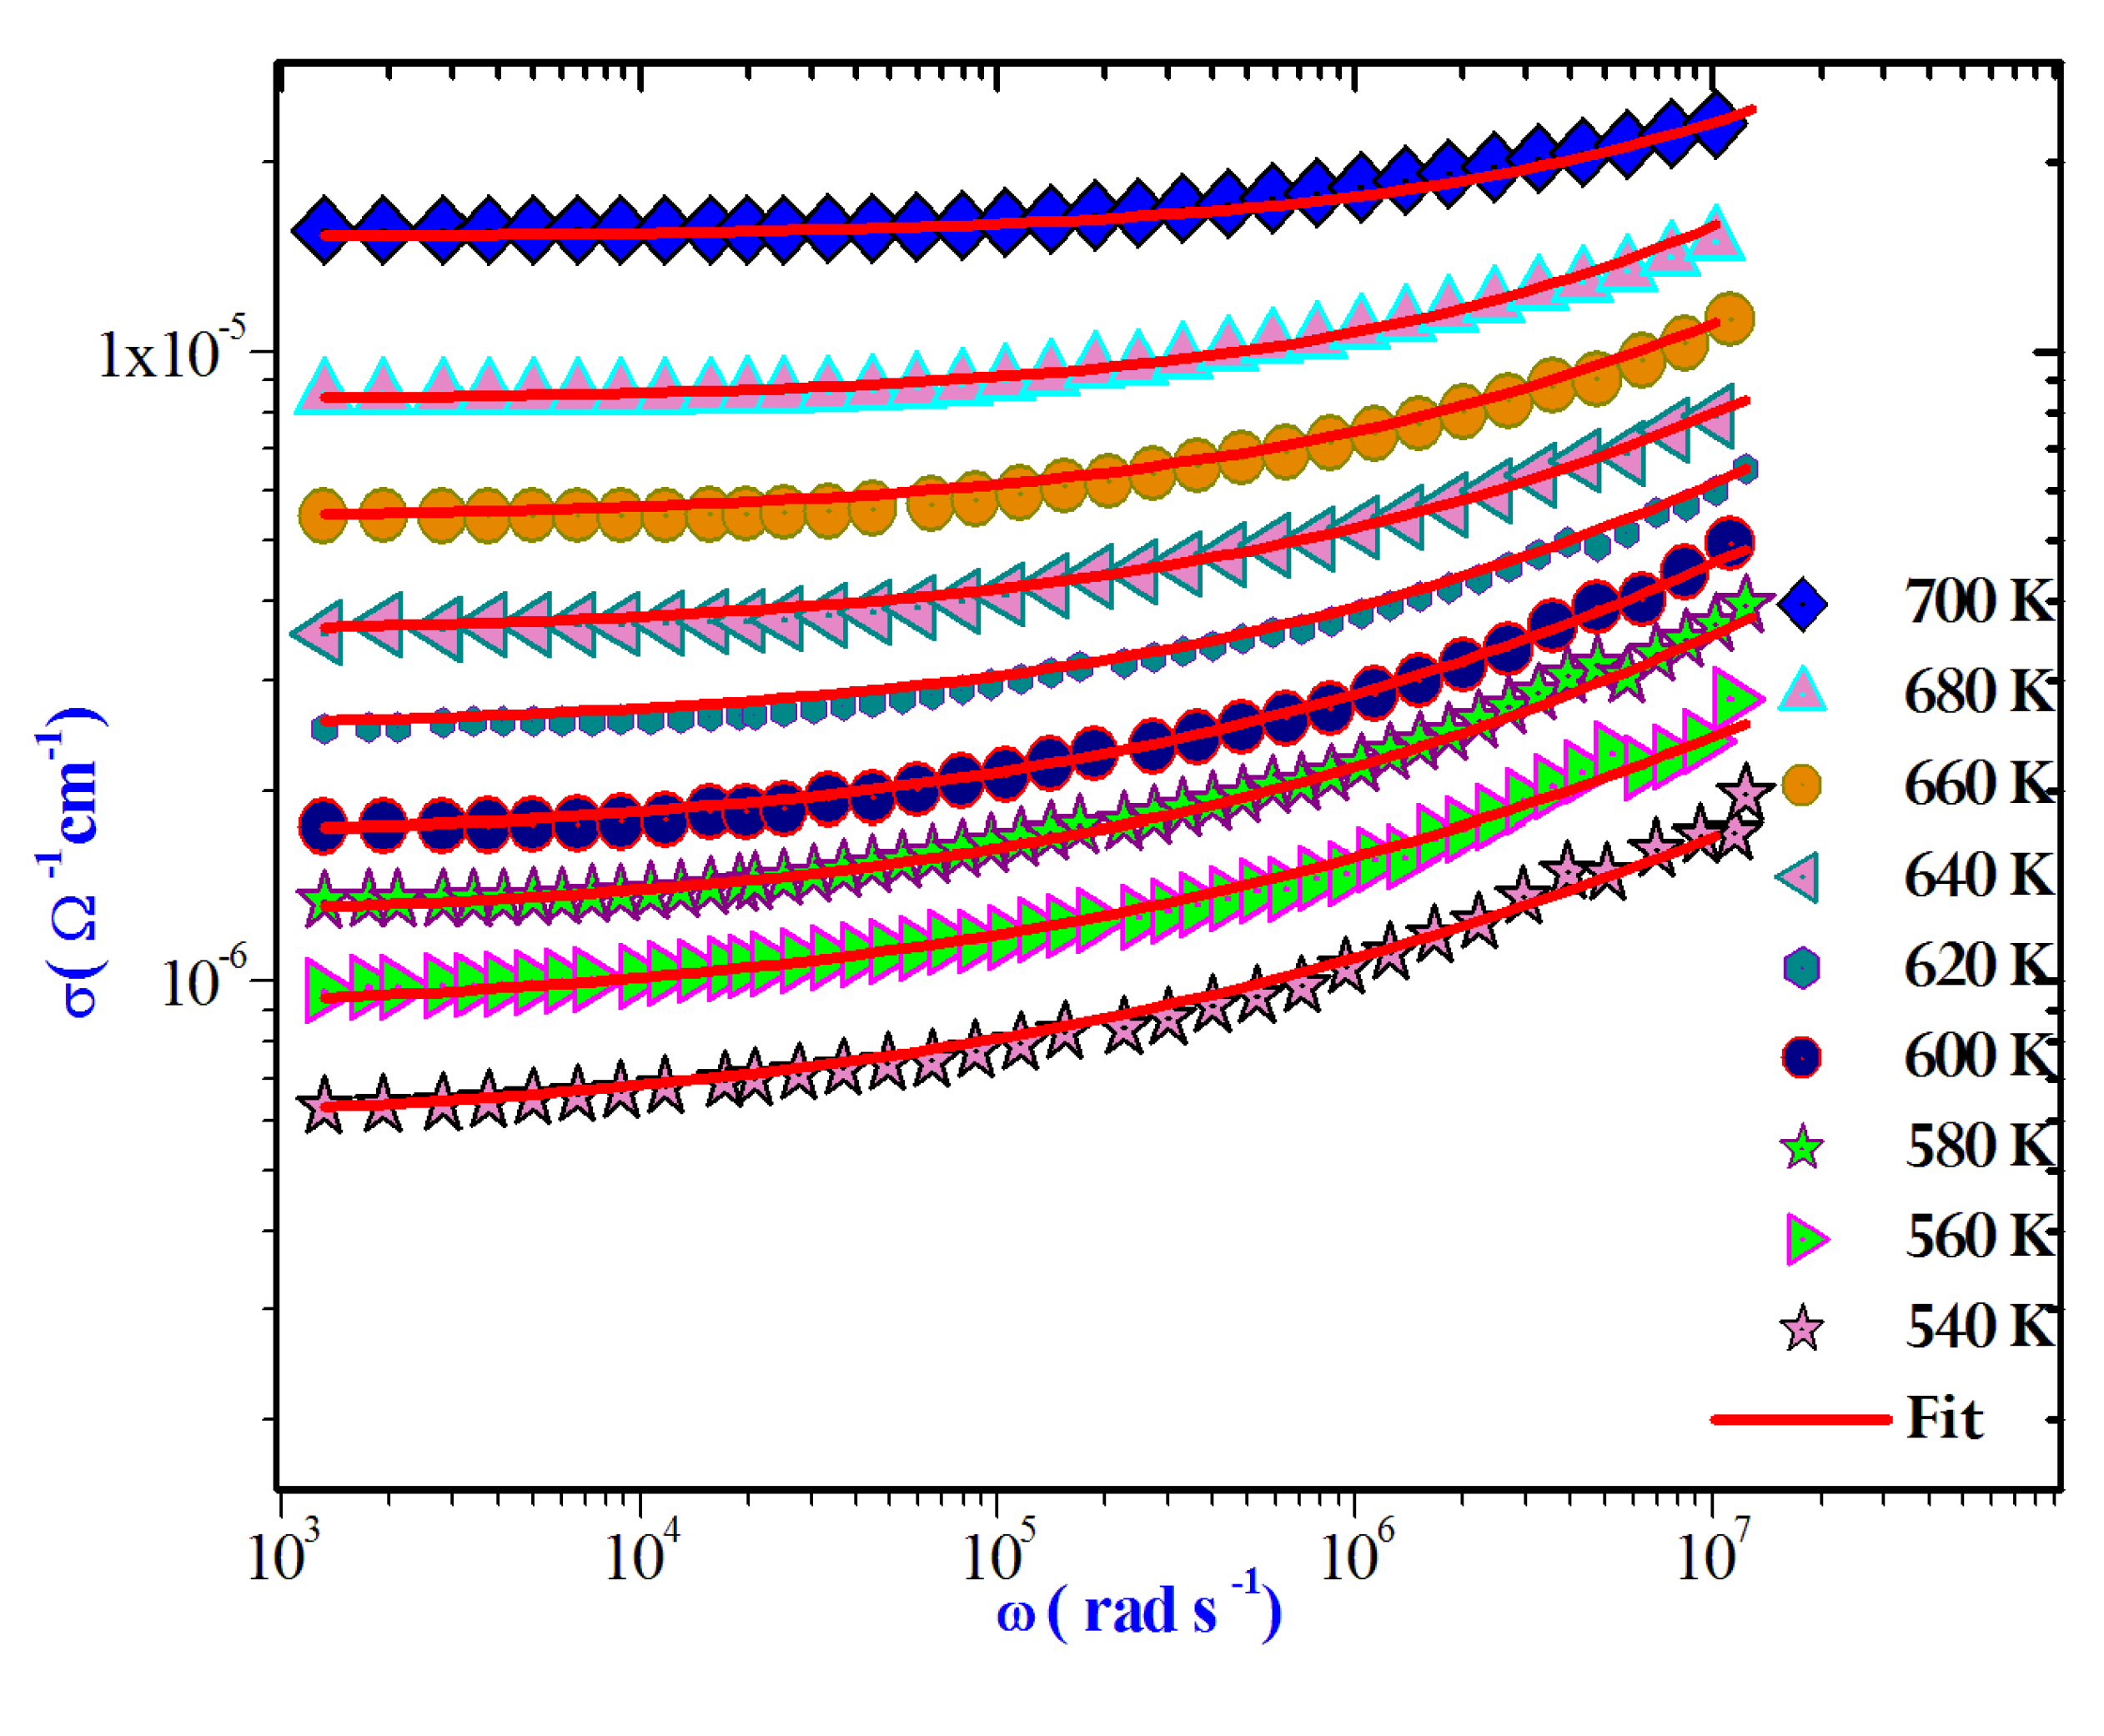
36].This equation is employed to model the AC conductivity data. Notably, during the fitting process, the values of A and s were simultaneously adjusted to achieve the most optimal fits.
Figure 11.
3.5.2. Theoretical Exploration of Conduction Mechanisms
The variation in the frequency exponent s with temperature offers insight into the underlying conduction mechanism in various materials. Numerous theoretical models have been introduced, centered on two fundamental processes: classical hopping over energy barriers and quantum-mechanical tunneling. Some models encompass the variations or combinations of these mechanisms. Notably, the carriers responsible for conduction have been suggested to be either polarons or atoms from different viewpoints.
These diverse models include the following.
The Correlated Barrier Hopping (CBH) model, wherein exponent s diminishes as the temperature increases [
37].
Overlapping large-polaron tunneling (OLPT) model, where the frequency exponent s is contingent on both temperature and frequency. It decreases from unity at room temperature to a minimum value at a specific temperature, and subsequently increases with a further increase in temperature [
38].
The Non-Overlapping Small Polaron Tunneling (NSPT) model associates the exponent s with temperature. It increased as the temperature increased [
39].
The Quantum Mechanical Tunneling (QMT) model, featuring an exponent s of approximately 0.8, displays a slight increase with increasing temperature or remains independent of temperature [
40].
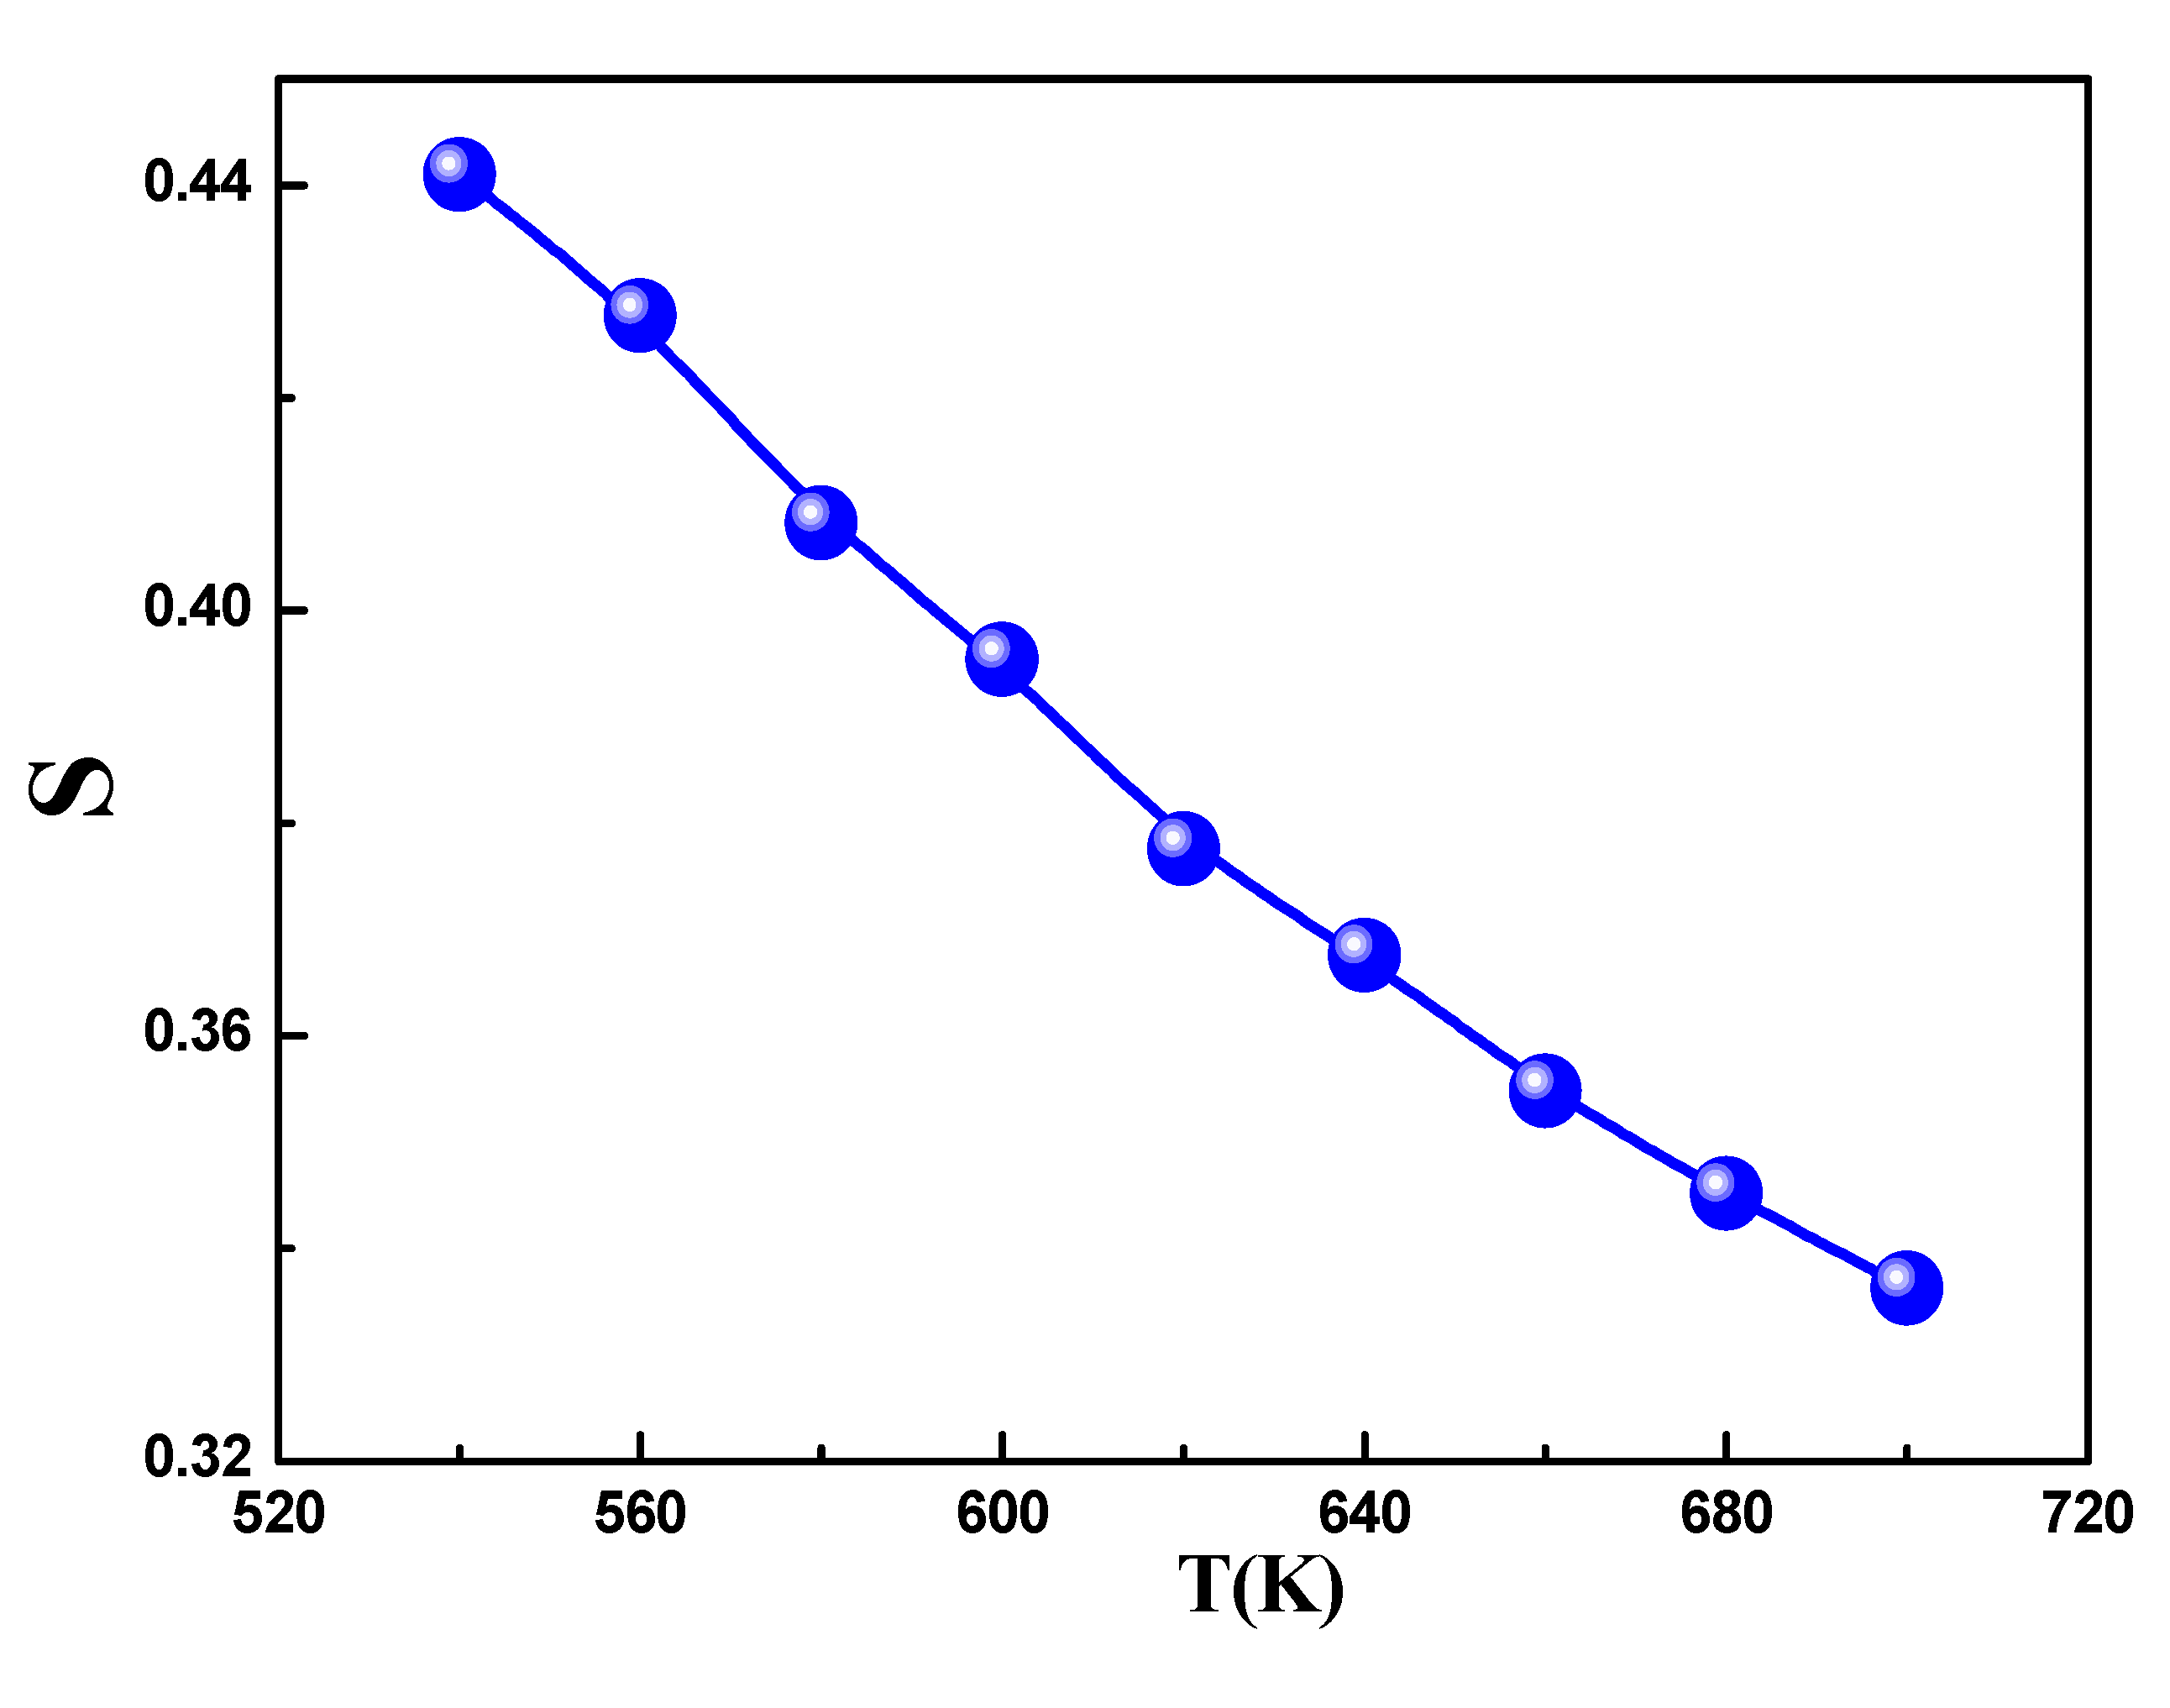
The temperature-dependent behavior of exponent s is shown in
Figure 12. The graph clearly demonstrates that s decreased as the temperature increased. Based on the previously discussed theories, it is apparent that this trend in the data is in line with the characteristics of the Correlated Barrier Hopping (CBH) model. In this model, conduction arises from the polaron hopping process over the potential barrier between two charged defect states, and the barrier height is associatedwith the inter-site separation via Coulombic interactions. Initially proposed by Pike for single-polaron hopping, this model was later expanded by Elliot[
41]for simultaneous two-polaronhopping. Indeed, conduction in the system can be ascribed to the translational-type hopping of charge carriers between sites over a potential barrier that separates them. In accordance with this model, (s) varies with temperature, following the equation:
The results described above can be explained using a modified version of the Correlated Barrier Hopping (CBH) model [
42], According to this model,
In this model, the number of polarons involved in the hopping process is denoted by n. The quantity NNp is proportional to the square of the concentration of states, and the dielectric constant is represented by ε'. The hopping distance for conduction denoted by Rω.[
43]:
NNp can be expressed as:
NNp = NT2 (for bipolaron hopping),
NNp =NT2exp((−Ueff/2kT) (for single-polaron hopping).
The AC conductivity is generally described by the following equation:(14)
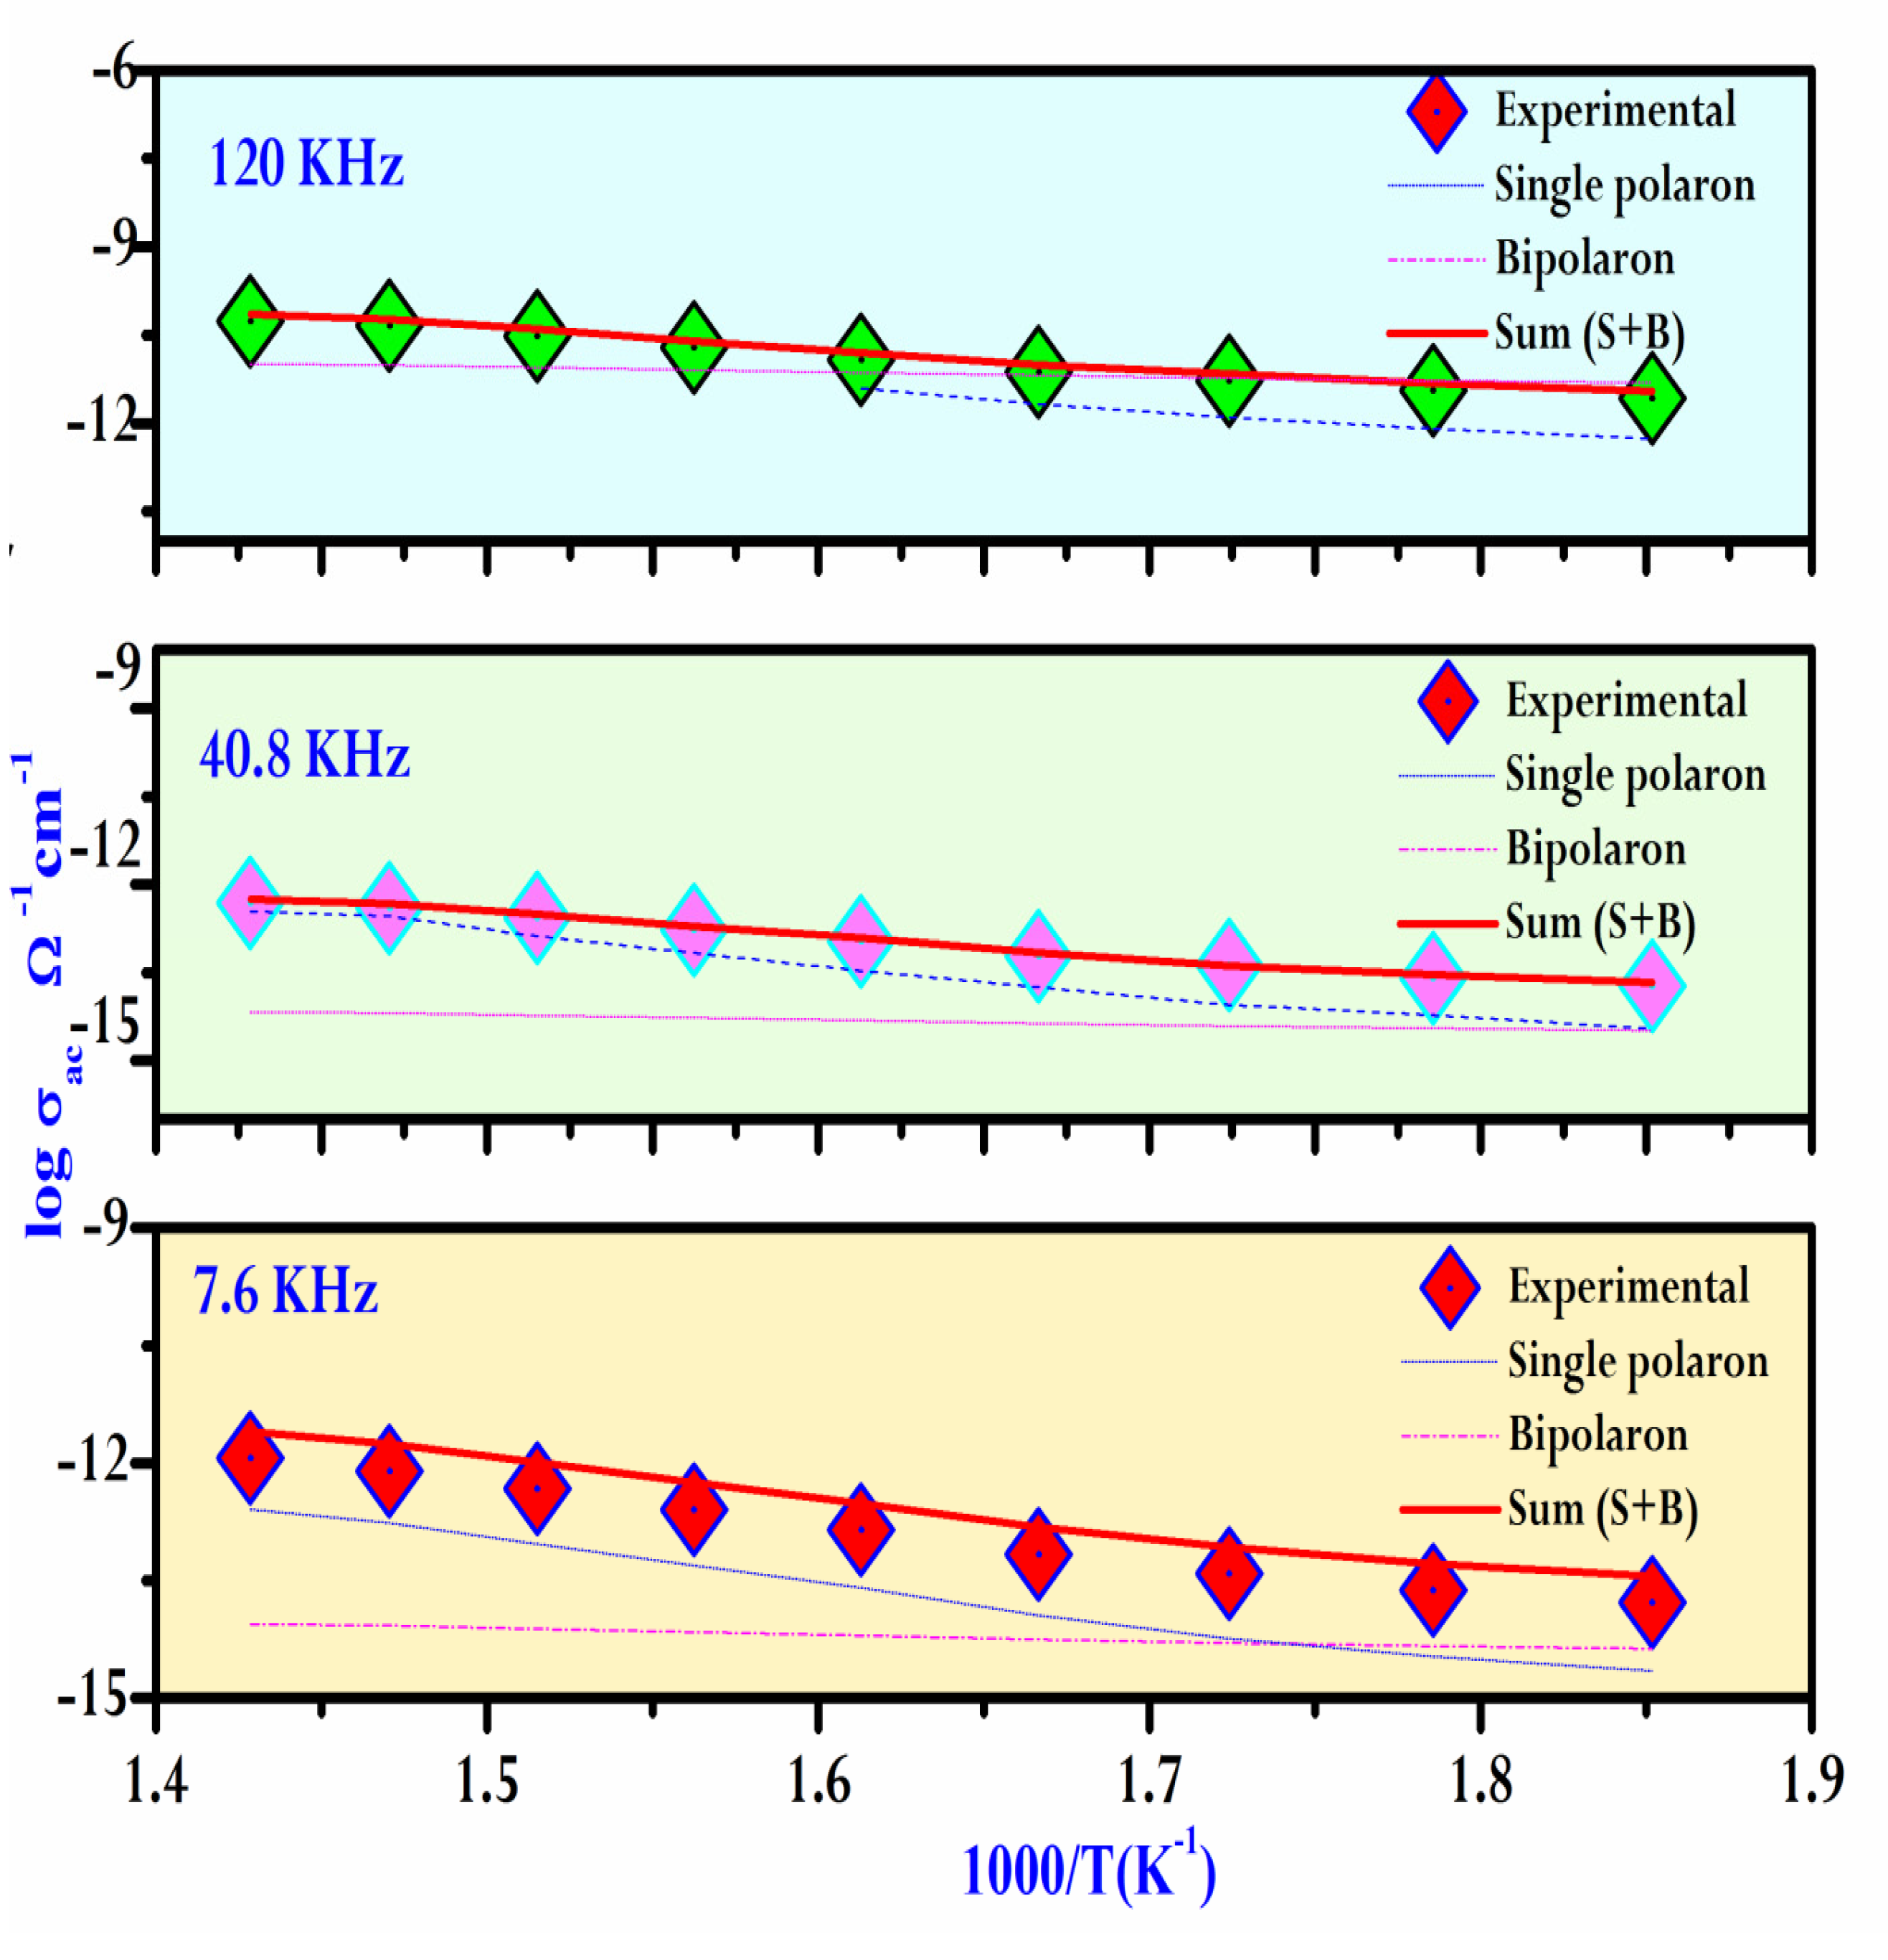
As a result, the variation of the AC conductivity (log(σac)) as a function of temperature at different frequencies is given in
Figure 13.The graph clearly indicates that the theoretical calculations match well with the experimental data.
Table 5 summarizes the parameters used in the fitting process. A decrease in Ueff is observed with an increase in frequency, which is consistent with the findings in the literature [
44]. This frequency and temperature range apply throughout the entire space, indicating a consistent trend in polaronic conduction.
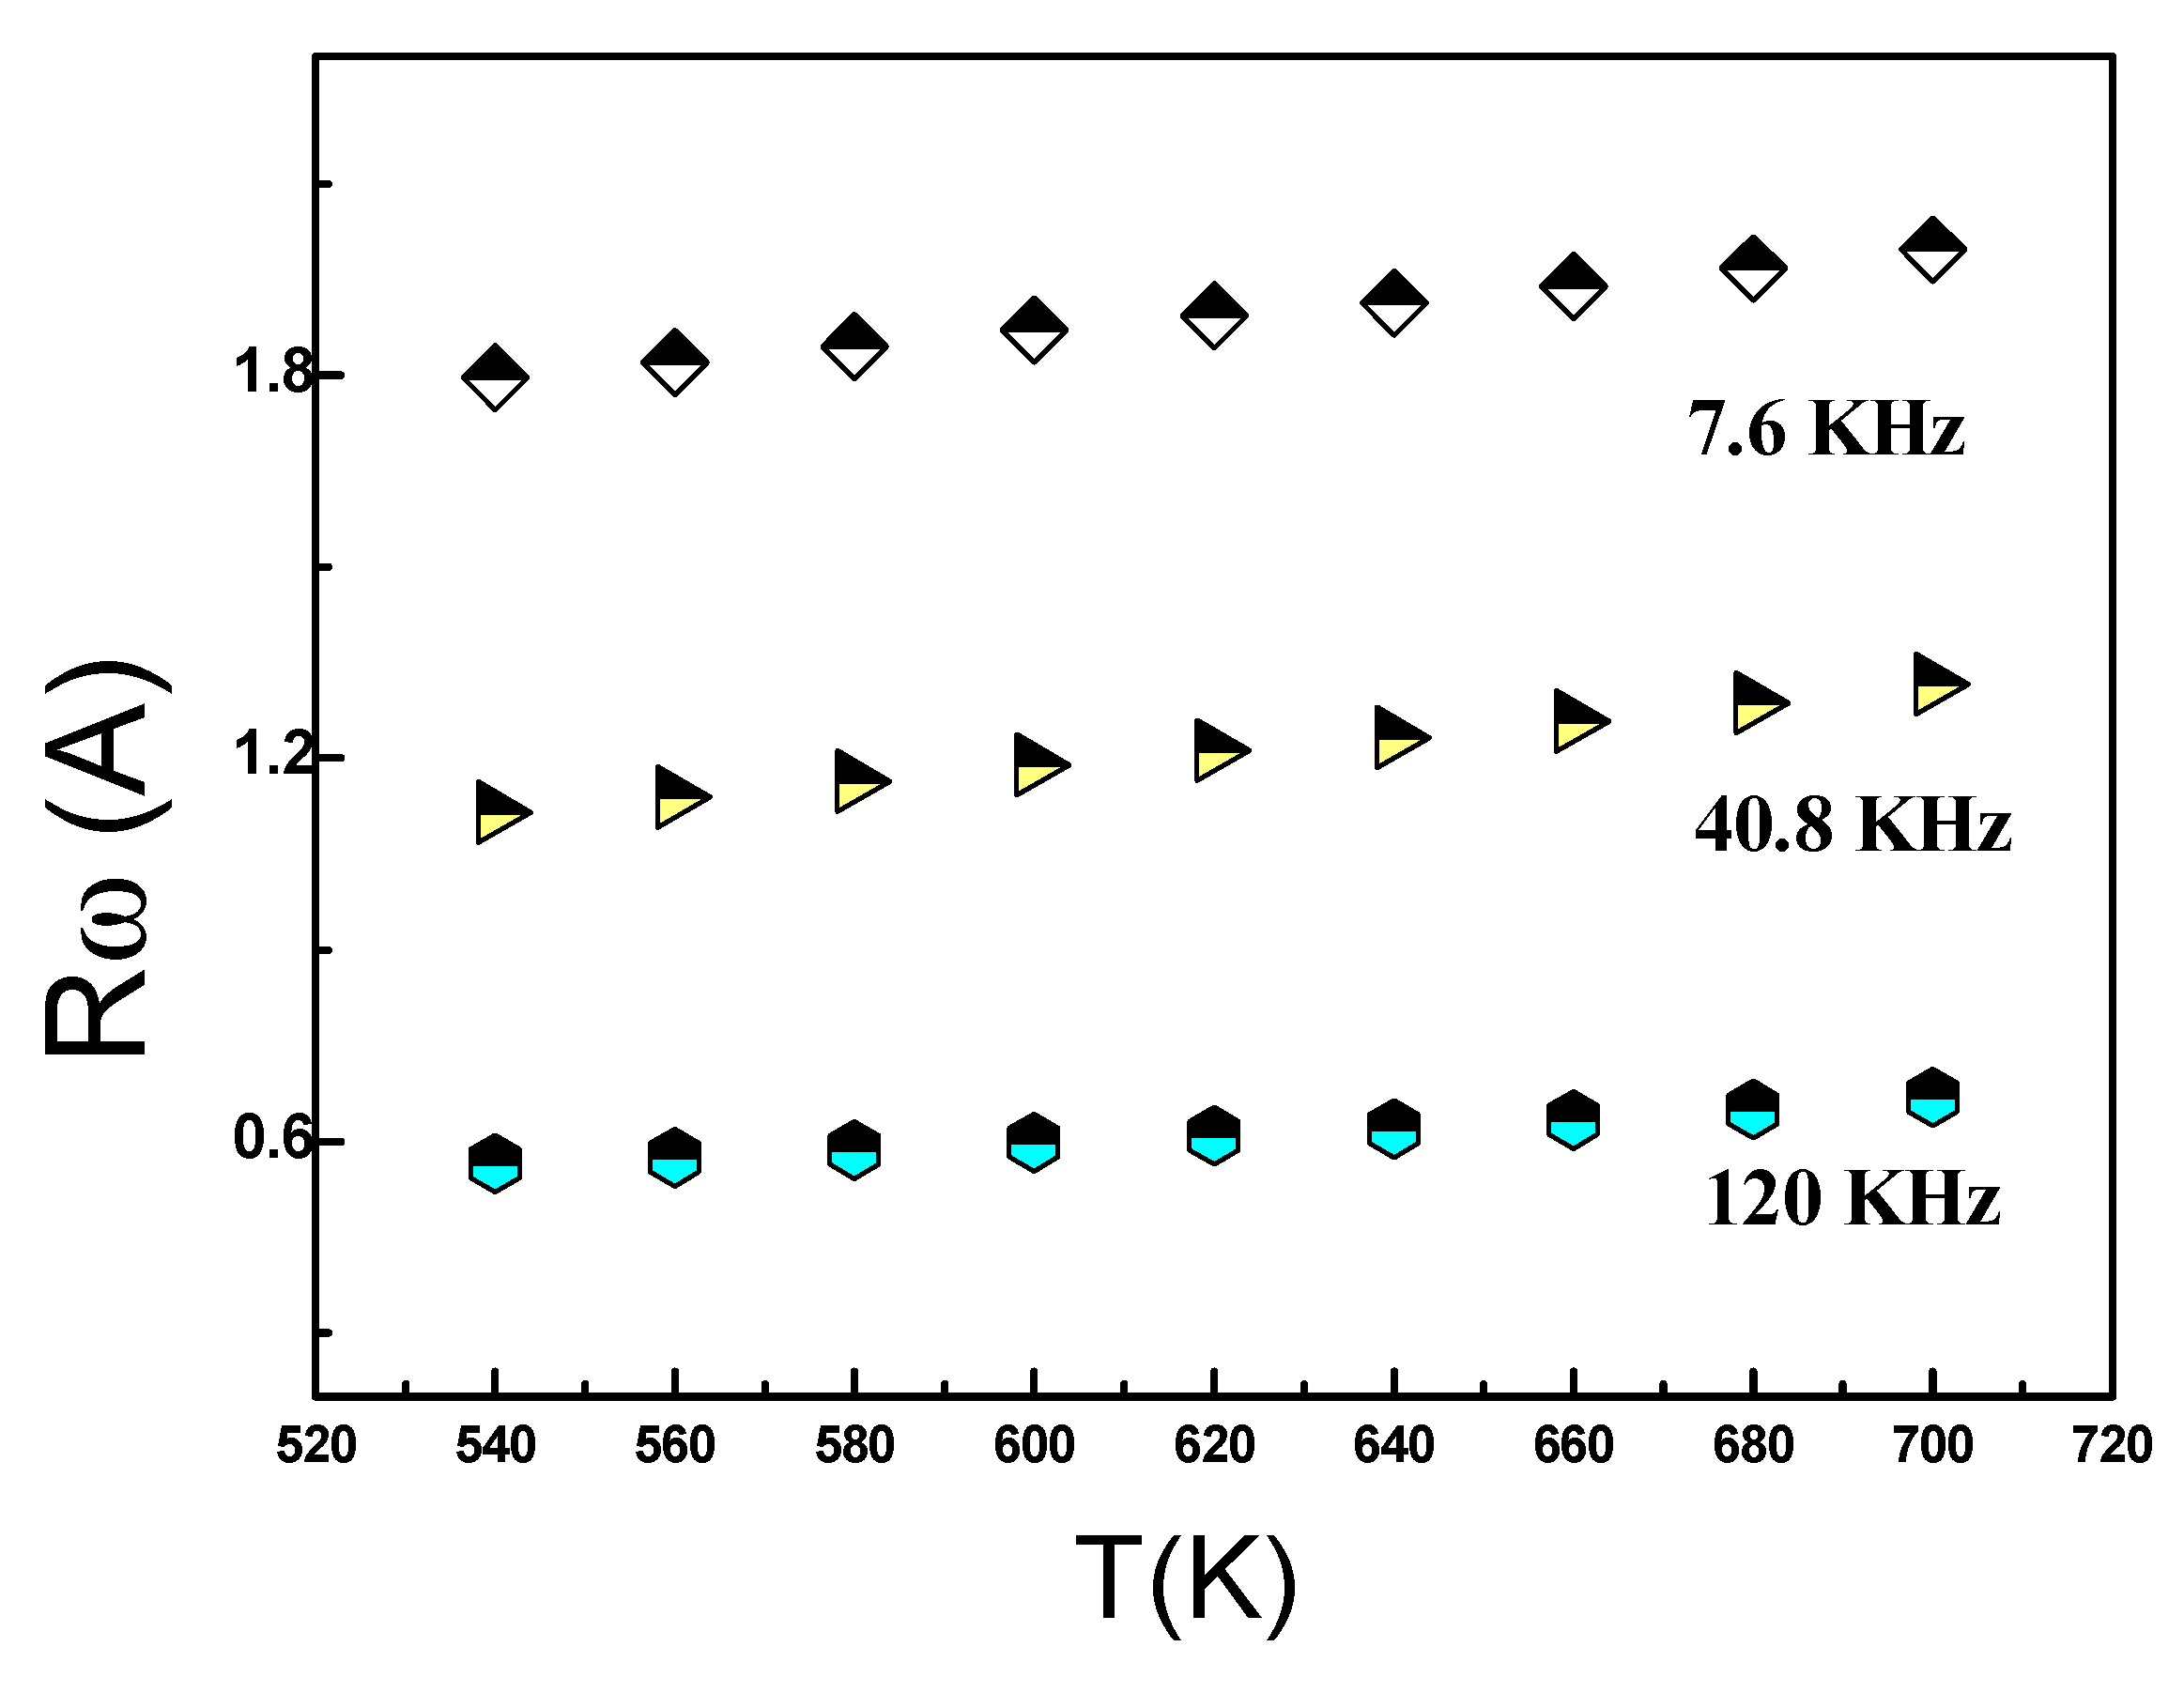
As shown in
Figure 14, we can observe a variation in Rω as a function of temperature across different frequencies. Apparently, at higher frequenciesthe hopping distance Rω exhibits greater sensitivity to temperature, and this sensitivity diminishes with decreasing frequency. As a result, Rω and the temperature were nearly constant at low frequencies. In this specific case, the temperature rise imparts thermal energy to the polarons, leading to their migration and facilitating leaps as a result of interactions between chains.
The jumping process is also influenced by the abundance of the localized states. The values of Np used in the analysis are listed in Table 5. It is clear from these results that the density of charged defect states increases with frequency, supporting the previously mentioned trend that AC conductivity increases with frequency.
4. Conclusion
In summary, structural examination employing X-ray diffraction of Ag0.2Na0.8FeP2O7confirmed that the powder had a monoclinic structure with space group P21/c. Analysis of the frequency dispersion of the real and imaginary components of the complex impedance allowed the determination of an equivalent electrical circuit for the electrochemical cell with the title compound. AC conductivity adheres to the universal power law, with the correlated barrier hopping (CBH) model being instrumental in explaining the observed behavior of the exponent. Notably, a combination of single-polaron and bipolaron hopping mechanisms satisfactorily accounted for the AC conductivity of the ceramic compound under study. Furthermore, analyses were conducted on the density of localized states, hopping distance, and maximum barrier height. Additionally, the relationship between the electrical and structural properties was investigated.
Acknowledgment
The authors would like to thank the Deanship of scientific Research at Shaqra University for supporting this work.
References
- H. Bih et al., “Synthesis, Rietveld refinements, Infrared and Raman spectroscopy studies of the sodium diphosphate NaCryFe1−yP2O7 (0 ≤ y ≤ 1),” Journal of Molecular Structure, vol. 1103, pp. 103–109, Jan. 2016. [CrossRef]
- H. Bih, I. H. Bih, I. Saadoune, H. Ehrenberg, and H. Fuess, “Crystal structure, magnetic and infrared spectroscopy studies of the LiCryFe1−yP2O7 solid solution,” Journal of Solid State Chemistry, vol. 182, no. 4, pp. 821–826, Apr. 2009. [CrossRef]
- F. Hamrit, R. F. Hamrit, R. Chtourou, D. Taloub, I. Gharbi, and A. Oueslati, “Synthesis, morphological, electrical, and conduction mechanism studies of a sodium cerium diphosphate compound,” RSC Advances, vol. 13, no. 22, pp. 15356–15365, 2023. [CrossRef]
- M. Ajili, I. M. Ajili, I. Gharbi, and A. Oueslati, “Synthesis, morphological, and ionic conduction studies of a copper potassium phosphate compound,” Ionics, vol. 29, no. 1, pp. 353–361, Oct. 2022. [CrossRef]
- R. Ternane, M. R. Ternane, M. Ferid, Y. Guyot, M. Trabelsi-Ayadi, and G. Boulon, “Spectroscopic properties of Yb3+ in NaYbP2O7 diphosphate single crystals,” Journal of Alloys and Compounds, vol. 464, no. 1–2, pp. 327–331, Sep. 2008. [CrossRef]
- Y. B. Taher, A. Y. B. Taher, A. Oueslati, K. Khirouni, and M. Gargouri, “Dielectric Spectroscopy and Modulus Study of Aluminum Diphosphate AgAlP2O7,” Journal of Cluster Science, vol. 26, no. 5, pp. 1655–1669, Feb. 2015. [CrossRef]
- M. M. El-Nahass, A. A. M. M. El-Nahass, A. A. Atta, E. F. M. El-Zaidia, A. A. M. Farag, and A. H. Ammar, “Electrical conductivity and dielectric measurements of CoMTPP,” Materials Chemistry and Physics, vol. 143, no. 2, pp. 490–494, Jan. 2014. [CrossRef]
- N. Weslati, I. N. Weslati, I. Gharbi, M. Hamdi, A. Oueslati, M. Gargouri, and K. Khirouni, “Investigation of optical and electrical conduction mechanism of AgYP2O7 prepared by solid state process,” Materials Research Bulletin, vol. 143, p. 111444, Nov. 2021. [CrossRef]
- S. Nasri, M. S. Nasri, M. Megdiche, and M. Gargouri, “AC impedance analysis, equivalent circuit, and modulus behavior of NaFeP2O7 ceramic,” Ionics, vol. 21, no. 1, pp. 67–78, Jun. 2014. [CrossRef]
- S. Nasri, R. S. Nasri, R. Mendil, and A. Oueslati, “Investigation of structural, morphology, dielectric relaxation, and conduction mechanism of sodium diphosphate ε Na4P2O7 compound,” Ionics, vol. 28, no. 3, pp. 1199–1209, Jan. 2022. [CrossRef]
- S. Nasri, A. S. Nasri, A. Oueslati, I. Chaabane, and M. Gargouri, “AC conductivity, electric modulus analysis and electrical conduction mechanism of RbFeP2O7 ceramic compound,” Ceramics International, vol. 42, no. 12, pp. 14041–14048, Sep. 2016. [CrossRef]
- M. Sahu, S. M. Sahu, S. Hajra, J. Bijelic, D. Oh, I. Djerdj, and H. J. Kim, “Triple perovskite-based triboelectric nanogenerator: a facile method of energy harvesting and self-powered information generator,” Materials Today Energy, vol. 20, p. 100639, Jun. 2021. [CrossRef]
- M. Sassi, A. M. Sassi, A. Bettaibi, A. Oueslati, K. Khirouni, and M. Gargouri, “Electrical conduction mechanism and transport properties of LiCrP2O7 compound,” Journal of Alloys and Compounds, vol. 649, pp. 642–648, Nov. 2015. [CrossRef]
- R. Jemai, K. R. Jemai, K. Khirouni, and M. Gargouri, “Synthesis, structural and electrical properties of two congruent isotypic diphosphates: Li2Na2P2O7 and Li3NaP2O7,” Applied Physics A, vol. 129, no. 2, Jan. 2023. [CrossRef]
- J. Rodríguez-Carvajal, “Recent advances in magnetic structure determination by neutron powder diffraction,” Physica B: Condensed Matter, vol. 192, no. 1–2, pp. 55–69, Oct. 1993. [CrossRef]
- S. Nasri, M. S. Nasri, M. Megdiche, and M. Gargouri, “Electrical conduction and dielectric properties of a newly synthesized single phase: Ag0.4Na0.6FeP2O7,” Physica B: Condensed Matter, vol. 451, pp. 120–127, Oct. 2014. [CrossRef]
- S. Nasri, M. S. Nasri, M. Megdiche, M. Gargouri, and K. Guidara, “Electrical conductivity and dielectric relaxation behavior of AgFeP2O7 compound,” Ionics, vol. 20, no. 3, pp. 399–407, Sep. 2013. [CrossRef]
- R. Ben Said, B. R. Ben Said, B. Louati, K. Guidara, J. Alloys Compd. 672 (2016) 521.Theoretical and experimental study of Ac electrical conduction mechanisms of KZn1. 5P2O7 compound. [CrossRef]
- J. A. Alonso, M. T. J. A. Alonso, M. T. Casais, M. J. Martínez-Lope, J. L. Martínez, and M. T. Fernández-Díaz, “A structural study from neutron diffraction data and magnetic properties of (R = La, rare earth),” Journal of Physics: Condensed Matter, vol. 9, no. 40, pp. 8515–8526, Oct. 1997. [CrossRef]
- L. K. Joy et al., “Size effect on the colossal thermoelectric power in charge ordered small band width manganites based on Gd-Sr,” Materials Research Express, vol. 2, no. 5, p. 055504, May 2015. [CrossRef]
- H. Felhi, M. H. Felhi, M. Smari, A. Bajorek, K. Nouri, E. Dhahri, and L. Bessais, “Controllable synthesis, XPS investigation and magnetic property of multiferroic BiMn2O5 system: The role of neodyme doping,” Progress in Natural Science: Materials International, vol. 29, no. 2, pp. 198–209, Apr. 2019. [CrossRef]
- W. Dong et al., “Te3O3(PO4)2: a phosphate crystal with large birefringence activated by the highly distorted [TeO5] group and antiparallel [PO4] pseudo-layer,” Journal of Materials Chemistry C, vol. 8, no. 28, pp. 9585–9592, 2020. [CrossRef]
- R. Soman et al., “Intermolecular Interactions in Fluorinated Tetraarylporphyrins: An Experimental and Theoretical Study,” European Journal of Inorganic Chemistry, vol. 2014, no. 16, pp. 2653–2662, May 2014. [CrossRef]
- Ajili, B. Louati, K. Guidara, J. Appl. Phys. A 119 (2015) 1119e1125. Conductivity and dielectric studies on K2SrP2O7 compound.
- J. J. Koenderink and A. J. van Doorn, “Surface shape and curvature scales,” Image and Vision Computing, vol. 10, no. 8, pp. 557–564, Oct. 1992. [CrossRef]
- B. S. Parajón-Costa, R. C. B. S. Parajón-Costa, R. C. Mercader, and E. J. Baran, “Spectroscopic characterization of mixed cation diphosphates of the type MIFeIIIP2O7 (with MI=Li, Na, K, Rb, Cs, Ag),” Journal of Physics and Chemistry of Solids, vol. 74, no. 2, pp. 354–359, Feb. 2013. [CrossRef]
- D. D. Edwards, J.-H. D. D. Edwards, J.-H. Hwang, S. J. Ford, and T. O. Mason, “Experimental limitations in impedance spectroscopy:Part V. Apparatus contributions and corrections,” Solid State Ionics, vol. 99, no. 1–2, pp. 85–93, Aug. 1997. [CrossRef]
- M. Ben Bechir, M. Houcine Dhaou and S. M. Altri, Photoluminescence, Raman and Photosensitive Dielectric Properties of Lead-Free Antimony-Based Cs3Sb2Br9 Single Crystals for Energy Storage Devices, Mater. Res. Bull., 2023,.
- Ben Rhaiem, K. Guidara, M. Gargouri, and A. Daoud, “Electrical properties and equivalent circuit of trimethylammonium monobromodichloromercurate,” Journal of Alloys and Compounds, vol. 392, no. 1–2, pp. 68–71, Apr. 2005. [CrossRef]
- M. Ben Bechir and M. H. Dhaou, “Study of charge transfer mechanism and dielectric relaxation of all-inorganic perovskite CsSnCl3,” RSC Advances, vol. 11, no. 35, pp. 21767–21780, 2021. [CrossRef]
- P. S. Sahoo, A. P. S. Sahoo, A. Panigrahi, S. K. Patri, and R. N. P. Choudhary, “Impedance spectroscopy of Ba3Sr2DyTi3V7O30 ceramic,” Bulletin of Materials Science, vol. 33, no. 2, pp. 129–134, Apr. 2010. [CrossRef]
- M. Hajbi, M. M. Hajbi, M. Abdi, and M. Loukil, “Synthesis, crystal structure, Hirshfeld surface analysis, spectroscopic studies, electric and dielectric properties of the new Hg(II) complex with N,N-dimethy-p-toluidine ligand: [C9H14N]HgCl3,” Ionics, vol. 24, no. 8, pp. 2355–2366, Dec. 2017. [CrossRef]
- Daidouh, C. Durio, C. Pico, M. L. Veiga, N. Chouaibi, and A. Ouassini, “Structural and electrical study of the alluaudites (Ag1−xNax)2FeMn2(PO4)3 (x=0, 0.5 and 1),” Solid State Sciences, vol. 4, no. 4, pp. 541–548, Apr. 2002. [CrossRef]
- L. ANDERSON and D. A. STUART, “Calculation of Activation Energy of Ionic Conductivity in Silica Glasses by Classical Methods,” Journal of the American Ceramic Society, vol. 37, no. 12, pp. 573–580, Dec. 1954. [CrossRef]
- S. R. Elliott, “A.c. conduction in amorphous chalcogenide and pnictide semiconductors,” Advances in Physics, vol. 36, no. 2, pp. 135–217, Jan. 1987. [CrossRef]
- Ben Rhaiem, F. Hlel, K. Guidara, and M. Gargouri, “Electrical conductivity and dielectric analysis of AgNaZnP2O7 compound,” Journal of Alloys and Compounds, vol. 485, no. 1–2, pp. 718–723, Oct. 2009. [CrossRef]
- X. He, Y. X. He, Y. Zhu, and Y. Mo, “Origin of fast ion diffusion in super-ionic conductors,” Nature Communications, vol. 8, no. 1, Jun. 2017. [CrossRef]
- M. Megdiche, C. M. Megdiche, C. Perrin-pellegrino, and M. Gargouri, “Conduction mechanism study by overlapping large-polaron tunnelling model in SrNiP2O7 ceramic compound,” Journal of Alloys and Compounds, vol. 584, pp. 209–215, Jan. 2014. [CrossRef]
- K. Karoui, M. B. Bechir, A. Bulou, K. Guidara and A. B. Rhaiem, [N(CH3)3H]2CuCl4: ab initio calculations and characterization of phase transitions by Raman spectroscopy, J. Mol. Struct., 2016, 1114, 161–170. [CrossRef]
- Y. Ben Taher, R. Y. Ben Taher, R. Hajji, A. Oueslati, and M. Gargouri, “Infra-red, NMR Spectroscopy and Transport Properties of Diphosphate NaAlP2O7,” Journal of Cluster Science, vol. 26, no. 4, pp. 1279–1294, Nov. 2014. [CrossRef]
- Zolanvari, N. Goyal, and S. K. Tripathi, “Electrical properties of a-GexSe100-x,” Pramana, vol. 63, no. 3, pp. 617–625, Sep. 2004. [CrossRef]
- S. A. Keneman, “Hologram Storage in Arsenic Trisulfide Thin Films,” Applied Physics Letters, vol. 19, no. 6, pp. 205–207, Sep. 1971. [CrossRef]
- M. Afifi, N. M. Afifi, N. Hegab, and A. Bekheet, “Effect of annealing on the electrical properties of ln2Se3 thin films,” Vacuum, vol. 46, no. 4, pp. 335–339, Apr. 1995. [CrossRef]
- L. Murawski, C.H. L. Murawski, C.H. Chung, J.D. Mackenzie, “Electrical properties of semiconducting oxide glasses ‘’ J. Non-Cryst. Solids 32 (1979) 91.
Figure 1.
Examining the X-ray diffraction pattern of the Ag0.2Na0.8FeP2O7sample under ambient conditions.
Figure 1.
Examining the X-ray diffraction pattern of the Ag0.2Na0.8FeP2O7sample under ambient conditions.
Figure 2.
Performing Rietveld refinement on the Ag0.2Na0.8FeP2O7sample: Displaying experimental data in red, calculated data in black, their difference in blue, and Bragg positions highlighted in green. Inset illustrates the shifting and broadening of the (310) peak correlating with the rise in Na content.
Figure 3.
Illustrating the crystal structure of Ag0.2Na0.8FeP2O7, highlighting potential conducting pathways within the tunnels.
Figure 3.
Illustrating the crystal structure of Ag0.2Na0.8FeP2O7, highlighting potential conducting pathways within the tunnels.
Figure 4.
Hirshfeld surfaces depicting with dnorm for Ag0.2Na0.8FeP2O7.
Figure 4.
Hirshfeld surfaces depicting with dnorm for Ag0.2Na0.8FeP2O7.
Figure 5.
Diagram outlining the process of generating fingerprint plots from a Hirshfeld surface. At every point on the surface, distances to the nearest atom within the surface (di) and outside the surface (de) are determined. These (di, de) pairs are then grouped into a two-dimensional histogram, forming the fingerprint plot..
Figure 6.
The proportional contributions to the Hirshfeld surface area for different intermolecular contacts in Ag0.2Na0.8FeP2O7.
Figure 6.
The proportional contributions to the Hirshfeld surface area for different intermolecular contacts in Ag0.2Na0.8FeP2O7.
Figure 7.
Raman Spectra ofAg0.2Na0.8FeP2O7diphosphate.
Figure 7.
Raman Spectra ofAg0.2Na0.8FeP2O7diphosphate.
Figure 8.
IR Spectra ofAg0.2Na0.8FeP2O7diphosphate.
Figure 8.
IR Spectra ofAg0.2Na0.8FeP2O7diphosphate.
Figure 9.
Experimental and calculated Nyquist plots as a function of temperature with electrical equivalent circuit (inset). The inset is the evolution of Nyquist plots with composition x=0.4, x=0.6, x=0.8.
Figure 9.
Experimental and calculated Nyquist plots as a function of temperature with electrical equivalent circuit (inset). The inset is the evolution of Nyquist plots with composition x=0.4, x=0.6, x=0.8.
Figure 10.
Plot of Ln(σT) versus 1000/T of the conductivity data for Na1-xAgxAlP2O7 (x=0.4, x=0.6, x=0.8) samples.
Figure 10.
Plot of Ln(σT) versus 1000/T of the conductivity data for Na1-xAgxAlP2O7 (x=0.4, x=0.6, x=0.8) samples.
Figure 11.
Frequency dependence of AC conductivity at various temperatures.
Figure 11.
Frequency dependence of AC conductivity at various temperatures.
Figure 12.
Variation of the universal exponent S as a function of temperature.
Figure 12.
Variation of the universal exponent S as a function of temperature.
Figure 13.
Plots of log σa.c. vs. 1000/T for Ag0.2Na0.8FeP2O7at selective frequencies.
Figure 13.
Plots of log σa.c. vs. 1000/T for Ag0.2Na0.8FeP2O7at selective frequencies.
Figure 14.
T he temperature dependence of Rω(A) of Ag0.2Na0.8FeP2O7at different frequency.
Figure 14.
T he temperature dependence of Rω(A) of Ag0.2Na0.8FeP2O7at different frequency.
Table 1.
Structural parameters for Ag0.2Na0.8FeP2O7 obtained from Rietveld refinement analysis.
Table 1.
Structural parameters for Ag0.2Na0.8FeP2O7 obtained from Rietveld refinement analysis.
| Atom |
x |
y |
Z |
site |
Sym |
| O1 |
0.046 |
1.5860 |
0.8467 |
4e |
x,y,z |
| O2 |
0.1936 |
0.8012 |
0.6185 |
4e |
x,y,z |
| O3 |
0.374 |
0.8434 |
0.4412 |
4e |
x,y,z |
| O4 |
0.14153 |
0.61954 |
0.39744 |
4e |
x,y,z |
| O5 |
0.5117 |
0.5808 |
0.3605 |
4e |
x,y,z |
| O6 |
0.708 |
0.706 |
0.6220 |
4e |
x,y,z |
| O7 |
0.694 |
0.8520 |
0.4025 |
4e |
x,y,z |
| P1 |
0.1720 |
0.7873 |
0.4575 |
4e |
x,y,z |
| P2 |
0.5744 |
0.7449 |
0.4601 |
4e |
x,y,z |
| Fe1 |
0.2399 |
0.4928 |
0.2495 |
4e |
x,y,z |
| Ag1 |
0.7906 |
0.5266 |
0.3050 |
4e |
x,y,z |
| Na |
0.7906 |
0.5266 |
0.3050 |
4e |
x,y,z |
Table 2.
Lattice parameters, unit cell volume and goodness of fit for Ag0.2Na0.8FeP2O7 obtained from Rietveld refinement.
Table 2.
Lattice parameters, unit cell volume and goodness of fit for Ag0.2Na0.8FeP2O7 obtained from Rietveld refinement.
| Parameters |
Ag0.2Na0.8FeP2O7
|
| Symmetry |
Monoclinic |
| Space Group |
P 21/c |
| a(Å) |
7.30569 |
| b(Å) |
7.97188 |
| c(Å) |
9.52315 |
| Unit cell volume (V) (Å3) |
514.9076 |
| α(ᵒ) |
90 |
| β(ᵒ) |
111.8160 |
| γ(ᵒ) |
90 |
| <rA> (Å) |
1.012 |
|
<> (Å2)
|
0.015376 |
| Scherrer method (D) (nm) |
63.9908 |
|
ε%
|
0.2070 |
|
(nm-2)
|
2.4421 |
Table 3.
Bond lengths for Ag0.2Na0.8FeP2O7 structure obtained from Rietveld refinement.
Table 3.
Bond lengths for Ag0.2Na0.8FeP2O7 structure obtained from Rietveld refinement.
| eO6 Polyhedra |
P2O7 Group |
| Fe–O(1) |
2.051 Å |
P(1)–O(1) |
1.505 Å |
P(2)–O(3) |
1.615 Å |
| Fe–O(2) |
2.014 Å |
P(1)–O(2) |
1.496 Å |
P(2)–O(5) |
1.580 Å |
| Fe–O(4) |
2.075 Å |
P(1)–O(3) |
1.610 Å |
P(2)–O(6) |
1.528 Å |
| Fe–O(5) |
2.005 Å |
P(1)–O(4) |
1.436 Å |
P(2)–O(7) |
1.470 Å |
| Fe–O(6) |
1.952 Å |
|
|
|
|
| Fe–O(7) |
2.033 Å |
|
|
|
|
Table 4.
Assignments of IR and Raman bands forAg0.2Na0.8FeP2O7.
Table 4.
Assignments of IR and Raman bands forAg0.2Na0.8FeP2O7.
|
Disclaimer/Publisher’s Note: The statements, opinions and data contained in all publications are solely those of the individual author(s) and contributor(s) and not of MDPI and/or the editor(s). MDPI and/or the editor(s) disclaim responsibility for any injury to people or property resulting from any ideas, methods, instructions or products referred to in the content. |
© 2024 by the authors. Licensee MDPI, Basel, Switzerland. This article is an open access article distributed under the terms and conditions of the Creative Commons Attribution (CC BY) license (http://creativecommons.org/licenses/by/4.0/).
