Preprint
Article

Climate Change Impacts on Mediterranean Coral Oculina Patagonica: Reproductive Resilience and Thermal Performance

Altmetrics

Downloads

193

Views

145

Comments

0

A peer-reviewed article of this preprint also exists.

Submitted:

21 May 2024

Posted:

22 May 2024

You are already at the latest version

Alerts
Abstract
Global climate change, particularly rising sea surface temperatures, profoundly impacts coral ecosystems, disrupting reproduction synchrony, symbiotic relationships with algae from the Symbiodiniceae family, and causing widespread bleaching and mortality among coral populations.  Oculina patagonica, a temperate scleractinian coral dominant in Mediterranean coastal waters, tolerates an annual temperature range of 10- 31°C. Moreover, in the past three decades, sea surface temperatures have rapidly risen in the Eastern Mediterranean Sea. O. patagonica offers insight into evolutionary adaptation to rapid environmental changes. This study investigated the effects of temperature changes on O. patagonica reproductive development, synchrony, and thermal sensitivity. Monthly monitoring of O. patagonica colonies for a year reveals no disruption in gonad development compared to previous studies, suggesting an unaffected sexual reproduction capacity. Thermal performance
Keywords: 
Subject: Biology and Life Sciences  -   Ecology, Evolution, Behavior and Systematics

1. Introduction

Stony corals, or Scleractinia, are the main builders of coral reefs worldwide. These reefs constitute the most diverse marine ecosystems, playing a significant ecological role. They provide a habitat for roughly a quarter of all marine species, food sources, support tourism, and coastline protection [1,2]. The ecological success of these ecosystems is made possible by the symbiotic relationship with endosymbiotic dinoflagellates algae of the family Symbiodiniaceae [3].
Photosynthetic Symbiodiniaceae residing within coral tissues can supply over 90% of host’s daily carbon requirements through the translocation of metabolites [4]. Corals also obtain carbon through heterotrophic feeding on a variety of sources. They actively prey upon zooplankton and consume bacteria, picoplankton, nanoplankton, suspended particulate matter, and directly absorb dissolved organic matter from the water column [5].
However, reef-building corals face substantial threats. In recent decades, climate change has progressed due to the release of greenhouse gases, particularly carbon dioxide (CO2), into the atmosphere from burning fossil fuels (coal, oil, and natural gas). Deforestation has contributed to elevated air and ocean temperatures resulting in increased ocean temperatures and repeated heatwaves, with increasing occurrences of ocean heatwaves, which have become more frequent and prolonged over the past century [6], significantly affecting marine ecosystems [7,8,9].
Stony corals predominantly inhabit tropical oligotrophic seas and have thus evolved in an environment with minor fluctuations in surface water temperature. However, with current global warming trends, corals are experiencing temperatures that exceed their thermal tolerance [10,11,12]. This increase in temperature can lead to coral bleaching. During bleaching, corals lose their symbiotic algae, resulting in deficiencies of energy source, and translocated nutrients, the loss of color and potential death [13].
Unlike tropical corals, where photo-symbionts are obligatory, temperate coral species found in environments like the Mediterranean Sea do not depend strictly on their symbionts. They utilize heterotrophic feeding strategies, allowing them to thrive in diminished light conditions and a broader spectrum of water temperatures [5]. The Mediterranean coral Oculina patagonica is an example of such a species. O. patagonica was first reported in the Mediterranean in 1966 in the Gulf of Genoa in Italy [14]. O. patagonica has high growth rates, early reproduction age, and high stress tolerance. It can be found along most of the shallow Mediterranean coasts, including northwest coasts, where sea surface temperatures (SST) can go below 10°C in the winter, and the Levant east coast (Israel and Lebanon), where SST can rise up to 31°C in the summer months (July-August) (Data available: http://reco.ruppin.ac.il/eng/). Along the Levant coast, O. patagonica exhibits a seasonal bleaching phenomenon. During the summer months (July to September) when temperatures soar above 29°C, the coral undergoes a substantial loss of its algae symbionts. It gains them back in the following months when the temperature decreases again [15,16]. Interestingly, on the northwestern coasts, O. patagonica seasonal bleaching occurs during the winter when the temperature drops below 15°C [17]. Recently, Martinez et al. (2021) reported the migration of O. patagonica to deeper and cooler depths in the Eastern Mediterranean. The migration of corals to mesophotic depths might be an adaptation strategy employed by some coral species in response to environmental stressors [18]. Mesophotic depths typically refer to the part of the ocean between 30 meters and 150 meters deep. This zone is characterized by low light levels, cooler temperatures, and higher pressure compared to shallow reefs. Mesophotic reefs are often considered a transition zone between shallow reefs and deep-sea habitats. They are increasingly being recognized as important ecosystems that support a diverse range of marine life. Mesophotic reefs offer several advantages for corals. They experience more stable temperatures, reduced exposure to harmful UV radiation, and lower susceptibility to bleaching events compared to shallow reefs. These conditions can create a refuge for corals facing stress. These deeper reefs can serve as refuges and reservoirs of biodiversity, contributing to coral conservation efforts in the face of global environmental challenges [19,20]. For successful mesophotic migration to accrue, the coral needs to have additional energy sources besides photosynthesis that will enable it to exist and reproduce [21]. Corals' ability to transition to a heterotrophic diet in response to environmental changes may enable migration to deeper depths [5].
The remarkable ability of O. patagonica to withstand a broad spectrum of temperatures, undergo seasonal bleaching, and thrive in a wide range of light intensities [22] makes it a fascinating model for investigating thermal stress and its impact on the coral host, the algae symbionts, and their symbiosis relationship.
O. patagonica corals are gonochoric broadcast spawners, meaning that male and female individuals release their gametes into the water column, where fertilization occurs [16,23]. This annual event occurs over two nights following the full moon of September [16]. The fertilized egg develops into a swimming planula larva that will eventually settle and undergo metamorphosis into a primary polyp, which further buds and grows to form the encrusting colony. In O. patagonica, as in many other coral species, the seasonal rise in water temperature (May to August) together with a longer photoperiod, drives the development of gonads. It is thought that the drop in water temperature in September, combined with the full moonlight, may be the cue for gamete release (spawning). Fine et al. (2001) reported that during 1994-1999 female gonads of O. patagonica were first observed in May and male gonads in July. Both reached maturity in late August and early September [16]. Interestingly, in this study, no gonads were observed in colonies that underwent bleaching during the reproduction season [16]. In the last three decades, the SST of the Eastern Mediterranean Sea has increased by about 3°C and is expected to increase significantly in the future, with estimations of 0.12 ± 0.07°C rise per year [24]. Consequently, prolonged elevated temperatures may lead to a potential reproductive period or timing shift, as already observed in various species and locations [25,26].
Coral reproductive success is essential for coral reef survival, thus, the potential impact of bleaching on coral reproduction has profound long-term implications, especially if bleaching events are repeated seasonally. Interestingly, the seasonal bleaching of O. patagonica in the Levant occurs in the months that male and female gonads are developing, a process that requires significant energy investment. In light of the rapid temperature changes in the Eastern Mediterranean Sea, this study will investigate the seasonal bleaching events in O. patagonica, re-visit the reproductive cycle and gonad development throughout the year, and assess the heat stress tolerance of the coral O. patagonica.

2. Materials and Methods

2.1. Sample Collection

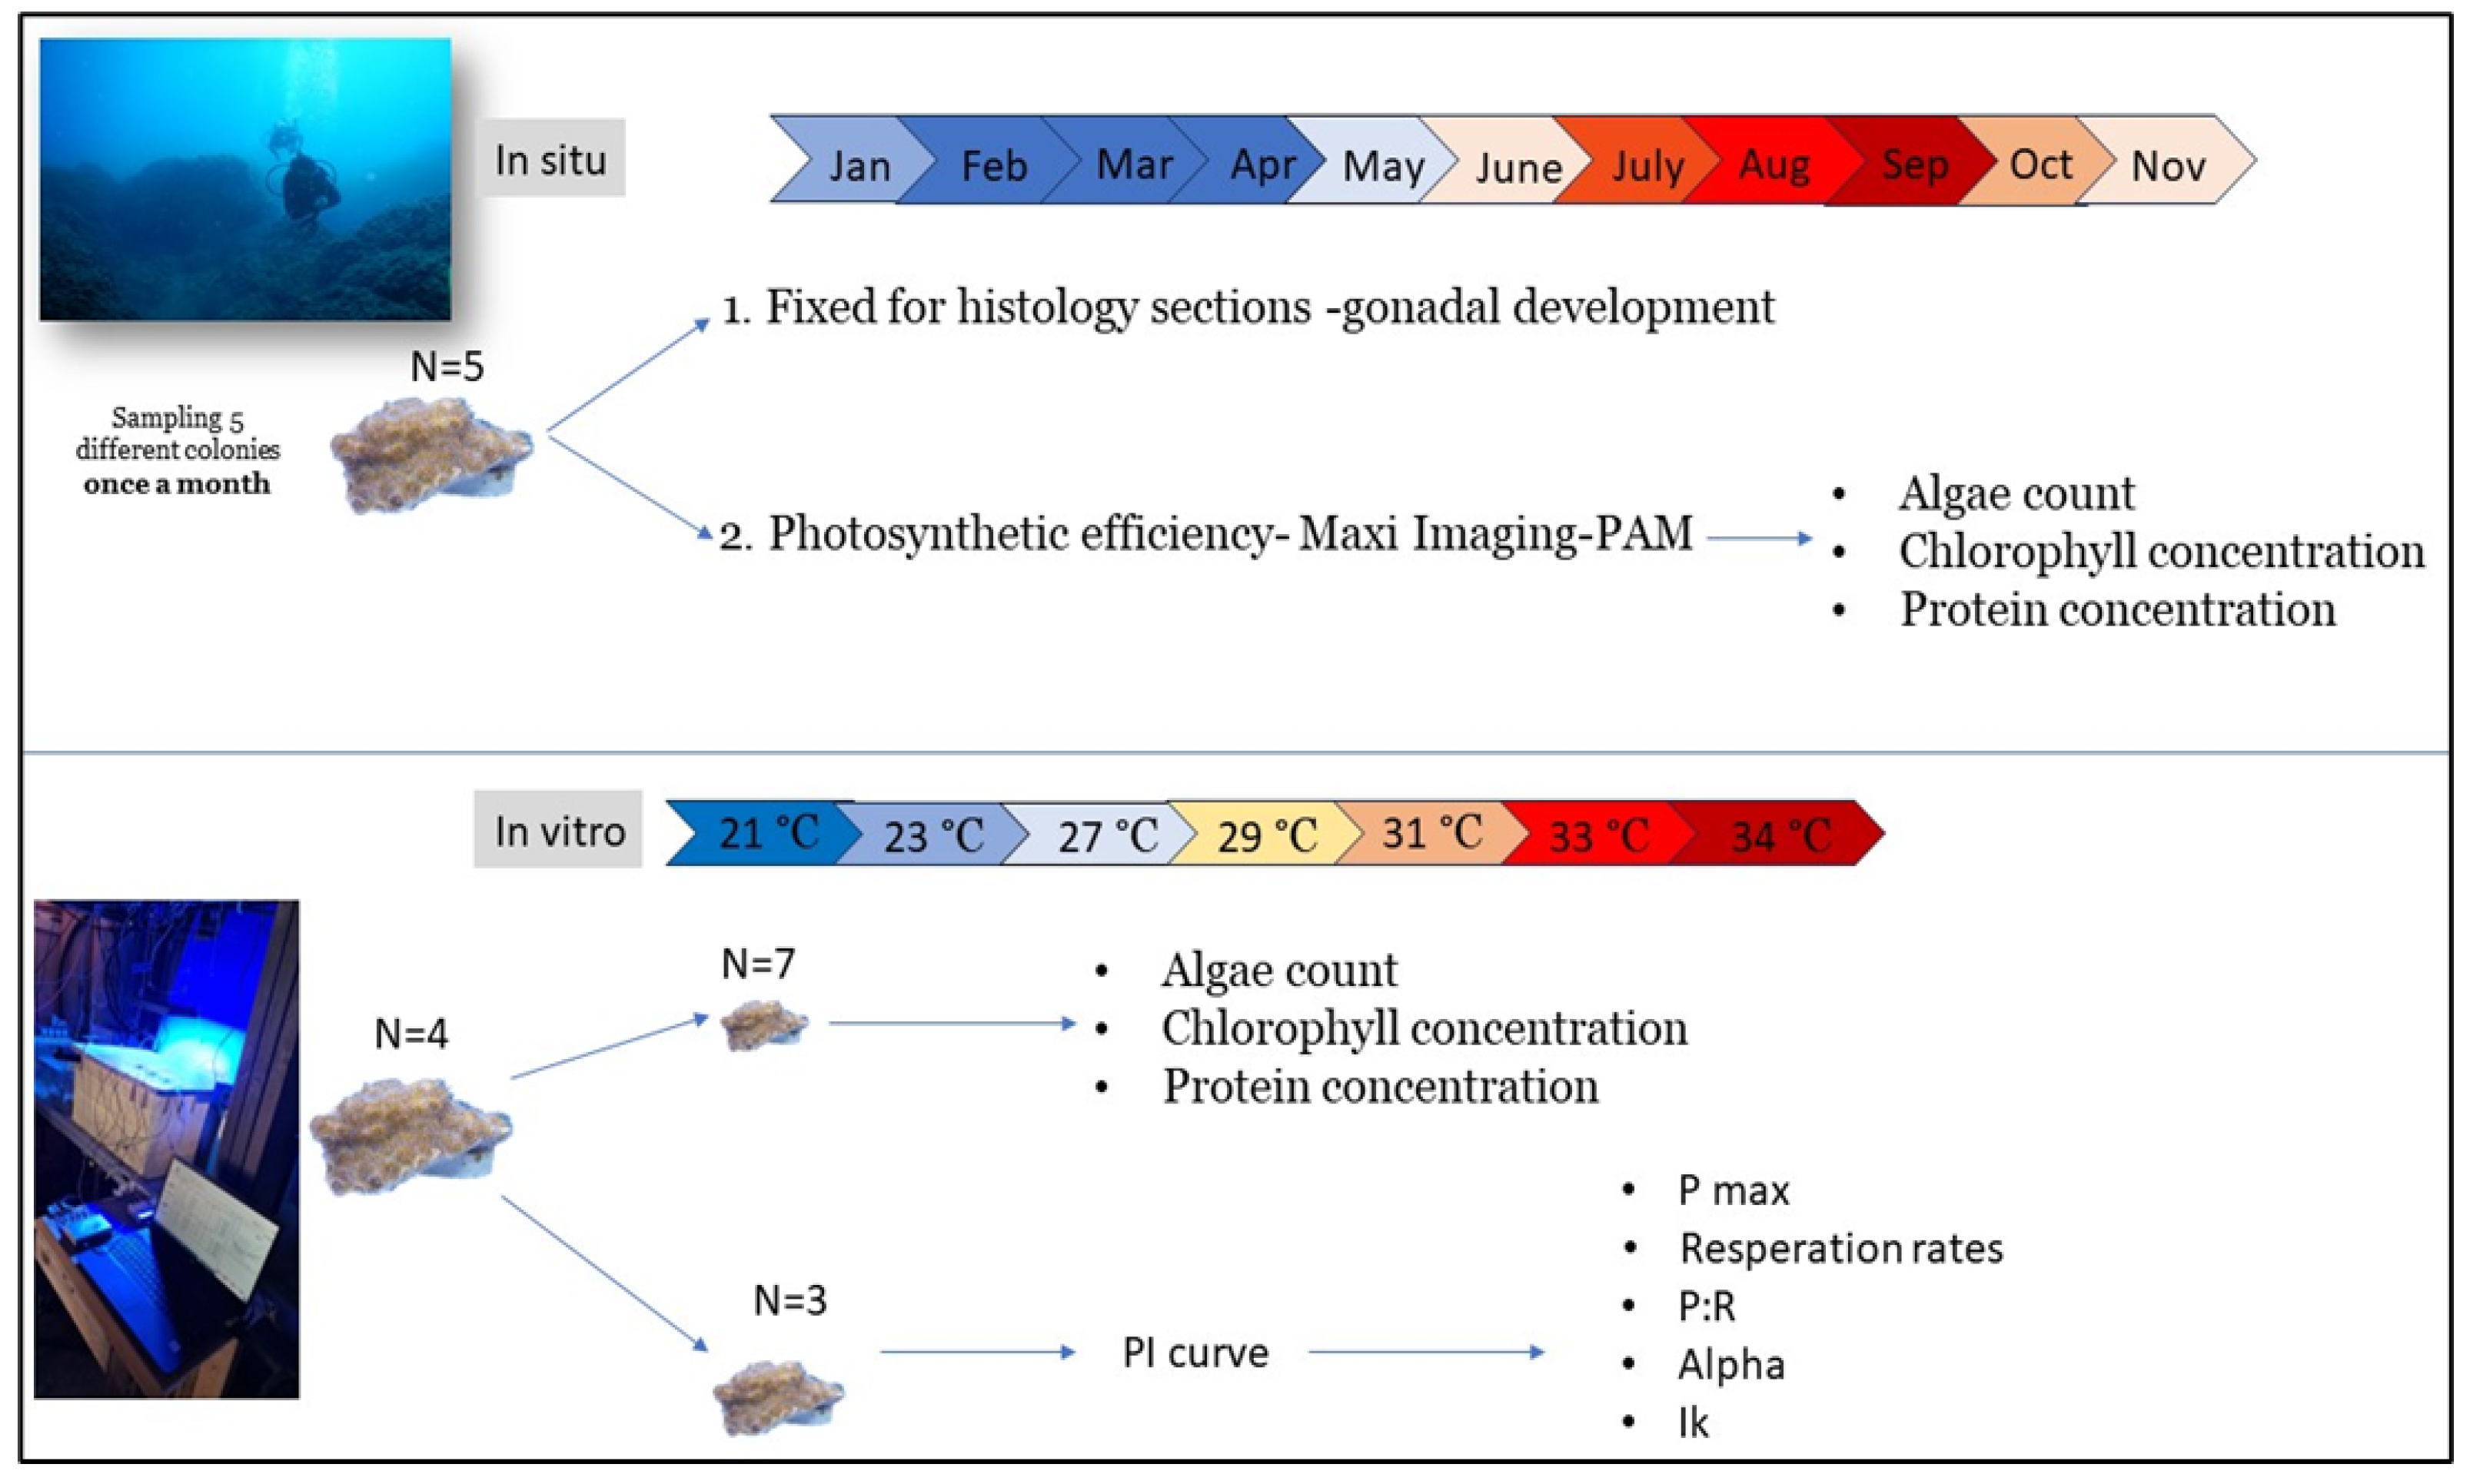
Samples of O. patagonica were collected from the Israeli Mediterranean Sea at Michmoret (Figure 1). Five colonies of O. patagonica were sampled monthly from 2-3 meters depth from January 2021 until November 2021. Each sample was divided into two fragments. One fragment was fixed with formaldehyde for histology sections to identify and monitor gonadal development. The second fragment was used for physiology parameters as described below (Figure 2). long-term temperature measurements at 2m were conducted at the same location by the Israeli School of Marine Sciences in Michmoret. (Data available: http://reco.ruppin.ac.il/eng/ (Figure 1). Within one hour post collection, the photochemistry of algae symbionts of each colony was accessed using a Maxi Imaging-PAM (Walz, Germany) [27]. Live coral samples were first dark acclimated for 30 min before photosynthetic efficiency was measured to determine the ratio of variable fluorescence (Fv) to maximum fluorescence (Fm) denoted Fv/Fm. A light curve with 13 incremental steps between 0-701 µmol photons mˉ² sˉ¹ was conducted to infer the relative electron transport rate (rETR). Data collected was used to calculate photosystem II (PSII) maximal quantum yield (Fv/Fm), initial slope of the light response curve (α), relative maximal electron transport rate (rETRmax), and minimum saturating irradiance (Ek). After the measurements, all fragments were kept at −80◦C for further physiologic analysis.

2.2. Physiology

The tissue of each coral fragment was removed using an airbrush and suspended in 3 ml of phosphate buffer saline (PBS) solution inside a sterile ziplock bag. Coral skeletons were used to calculate the surface area of the coral fragment for normalization. The tissue was transferred into 15 ml centrifuge tubes and electrically homogenized for 20 sec. The homogenate was centrifuged at 5000 g for 5 min at 4°C to separate the debris and the symbiont cells from the coral host tissue. The protein concentration of the coral host was determined using the fluorometric BCA protein kit (Pierce BCA, United States) following the manufacturer's protocol. A PerkinElmer (2300 EnSpire R, United States) plate reader was used to determine the total protein concentration with a 540 nm wavelength emission.
The density of symbiont cells in the homogenate was determined by counting cells using a hemocytometer and imaging with a Nikon Eclipse (Nikon Eclipse Ti–S Inverted Microscope System) microscope to excite the chlorophyll autofluorescence with blue light. For each sample, five replicates of 1 mm2 each were counted. Each replica was photographed in fluorescent light using 440 nm emission to identify chlorophyll. The color threshold of images was adjusted to isolate algal cells using ImageJ software and the number of cells in five replicate corner squares was counted using the 'Analyse Particles' function [28]. For measuring chlorophyll-a concentrations, a pellet of 1 ml tissue homogenate was resuspended with 1 ml of 90% cold acetone and was incubated overnight at 4°C. A NanoDrop (Thermo-Fisher, United States) was used for reading the spectrophotometric measurements at wavelengths of 630, 647, 664, and 691 nm, and the light absorbance results were used to calculate the chlorophyll-a concentration following the equation of Ritchie, 2008 [29].

2.3. Gametogenesis

Gametogenesis was assessed using histology sections of corals throughout the year. Following collection, sampled coral fragments were immediately placed in 15 ml tubes with 10 ml filtered sea water and 2 ml of 1M MgCl2 for 15 minutes to prevent contraction of the polyps. The samples were fixed in a solution of 4% formaldehyde in seawater for 24 hours, rinsed in PBS solution, and preserved in 70% ethanol. Decalcification of the coral skeleton was done using a solution of 1:1 formic acid (50% in DDW) and sodium citrate (20% in DDW) [30]. Following decalcification, the tissue was rinsed in PBS. Next, the tissue was dehydrated in graded ethanol solutions, cleaned through a series of graded butanol, and then embedded in paraffin. The paraffin has been sectioned and mounted on glass slides. Following deparaffinization, the cross-sections (10 µm thick) were stained with hematoxylin and eosin and analyzed under a light microscope to determine the number and developmental state of gonads. The diameters of all oocytes or the number of sperm sacs in a given polyp were measured.

2.4. Thermal Stress Experiment

Five different O. patagonica colonies were collected from the shallow water (depth of 5m) near the coast of Michmoret. Each colony was fragmented into 3 individual ramet nubbins with an average size of 5cm² (for metabolic measurements), and 10 smaller fragments with an average size of 1cm² (for physiological tests) (Figure 2). All epiphytes (other animals and algae) were removed from the coral skeletons, and nubbins were acclimated for two weeks in a water table with continuously flowing seawater. Two days before the experiment, nubbins were transferred into an aquarium with a light intensity of 100 Photosynthetically Active Radiation (PAR; µmol photons m²s¹) and seawater at an ambient temperature of 23°C. Water was recirculated and controlled for temperature using a thermostat system (STC-1000 Temperature controller, covvy-06-061-072) with an accuracy of ± 0.2°C. Throughout the experiment, data on the water temperatures was collected using a logger (HOBO Pendant MX Temperature/Light Data Logger MX2202 ), while light intensities were quantified using a full spectrum underwater quantum meter for PAR measurements (Quantum Flux, apogee instruments, model MQ-500).

2.5. Thermal Stress Experiment Design

Coral fragments from four colonies (A, B, C, D) were raised in ambient conditions (23°C, 39‰, 100 µmol photons mˉ² sˉ¹) in an aquarium with circulated temperature-controlled seawater. Metabolic responses of the coral nubbins were measured at eight different water temperatures (21°C, 23°C, 25°C, 27°C, 29°C, 31°C, 32°C, 34°C). The water temperature was raised by two degrees every 48 hours. 24 hours after temperature elevation, photosynthesis rates were measured by generating photosynthesis vs. irradiance (PI) curves for each. For conducting the measurements, fragments were placed in individual acrylic respiration chambers (620 ml) with a magnetic stir bar and the ambient seawater, with individual fiber optic oxygen and temperature probs (PyroScience Optical Oxygen & Temp Meter FireSting-O2, FSO2-C4).
Oxygen concentrations were measured first in the dark (after 30 min of dark acclimation) to calculate respiration rates and then followed by measurements in six different light intensities (20, 40, 80, 160, 250, 320, 360, and 430 µmol photons mˉ² sˉ¹), for 15 min in each intensity. After measurements, the fragments were returned to the experiment aquarium at the same temperature as was tested. The temperature raised again 24 hours later. In each temperature tested, a small fragment (~1cm²) from each colony was collected for additional physiological tests (protein concentration, algae count, chlorophyll concentrations). This procedure was repeated for every temperature treatment at the same hour of the day. To minimize the accumulated light stress of the fragments, different fragments from the same colony were tested in each temperature treatment. Coral fragments were pictured to monitor and calculate the bleaching area percentage during the experiment using ImageJ [28].
Data was collected simultaneously using two supported devices of Optical Oxygen & Temp Meter FireSting-O2, 4 Channels each, and the Pyroscience software. All calibrations were done according to the manufacturer’s manual.
Rates of oxygen flux were extracted following the methods described above and gross photosynthesis (GP) was calculated as the absolute values of net photosynthesis plus dark respiration per surface area. Surface area of each fragment was measured using scaled pictures in ImageJ [28].

3. Results

3.1. Seasonal Patterns in O. patagonica Physiology and Photosynthetic Activity

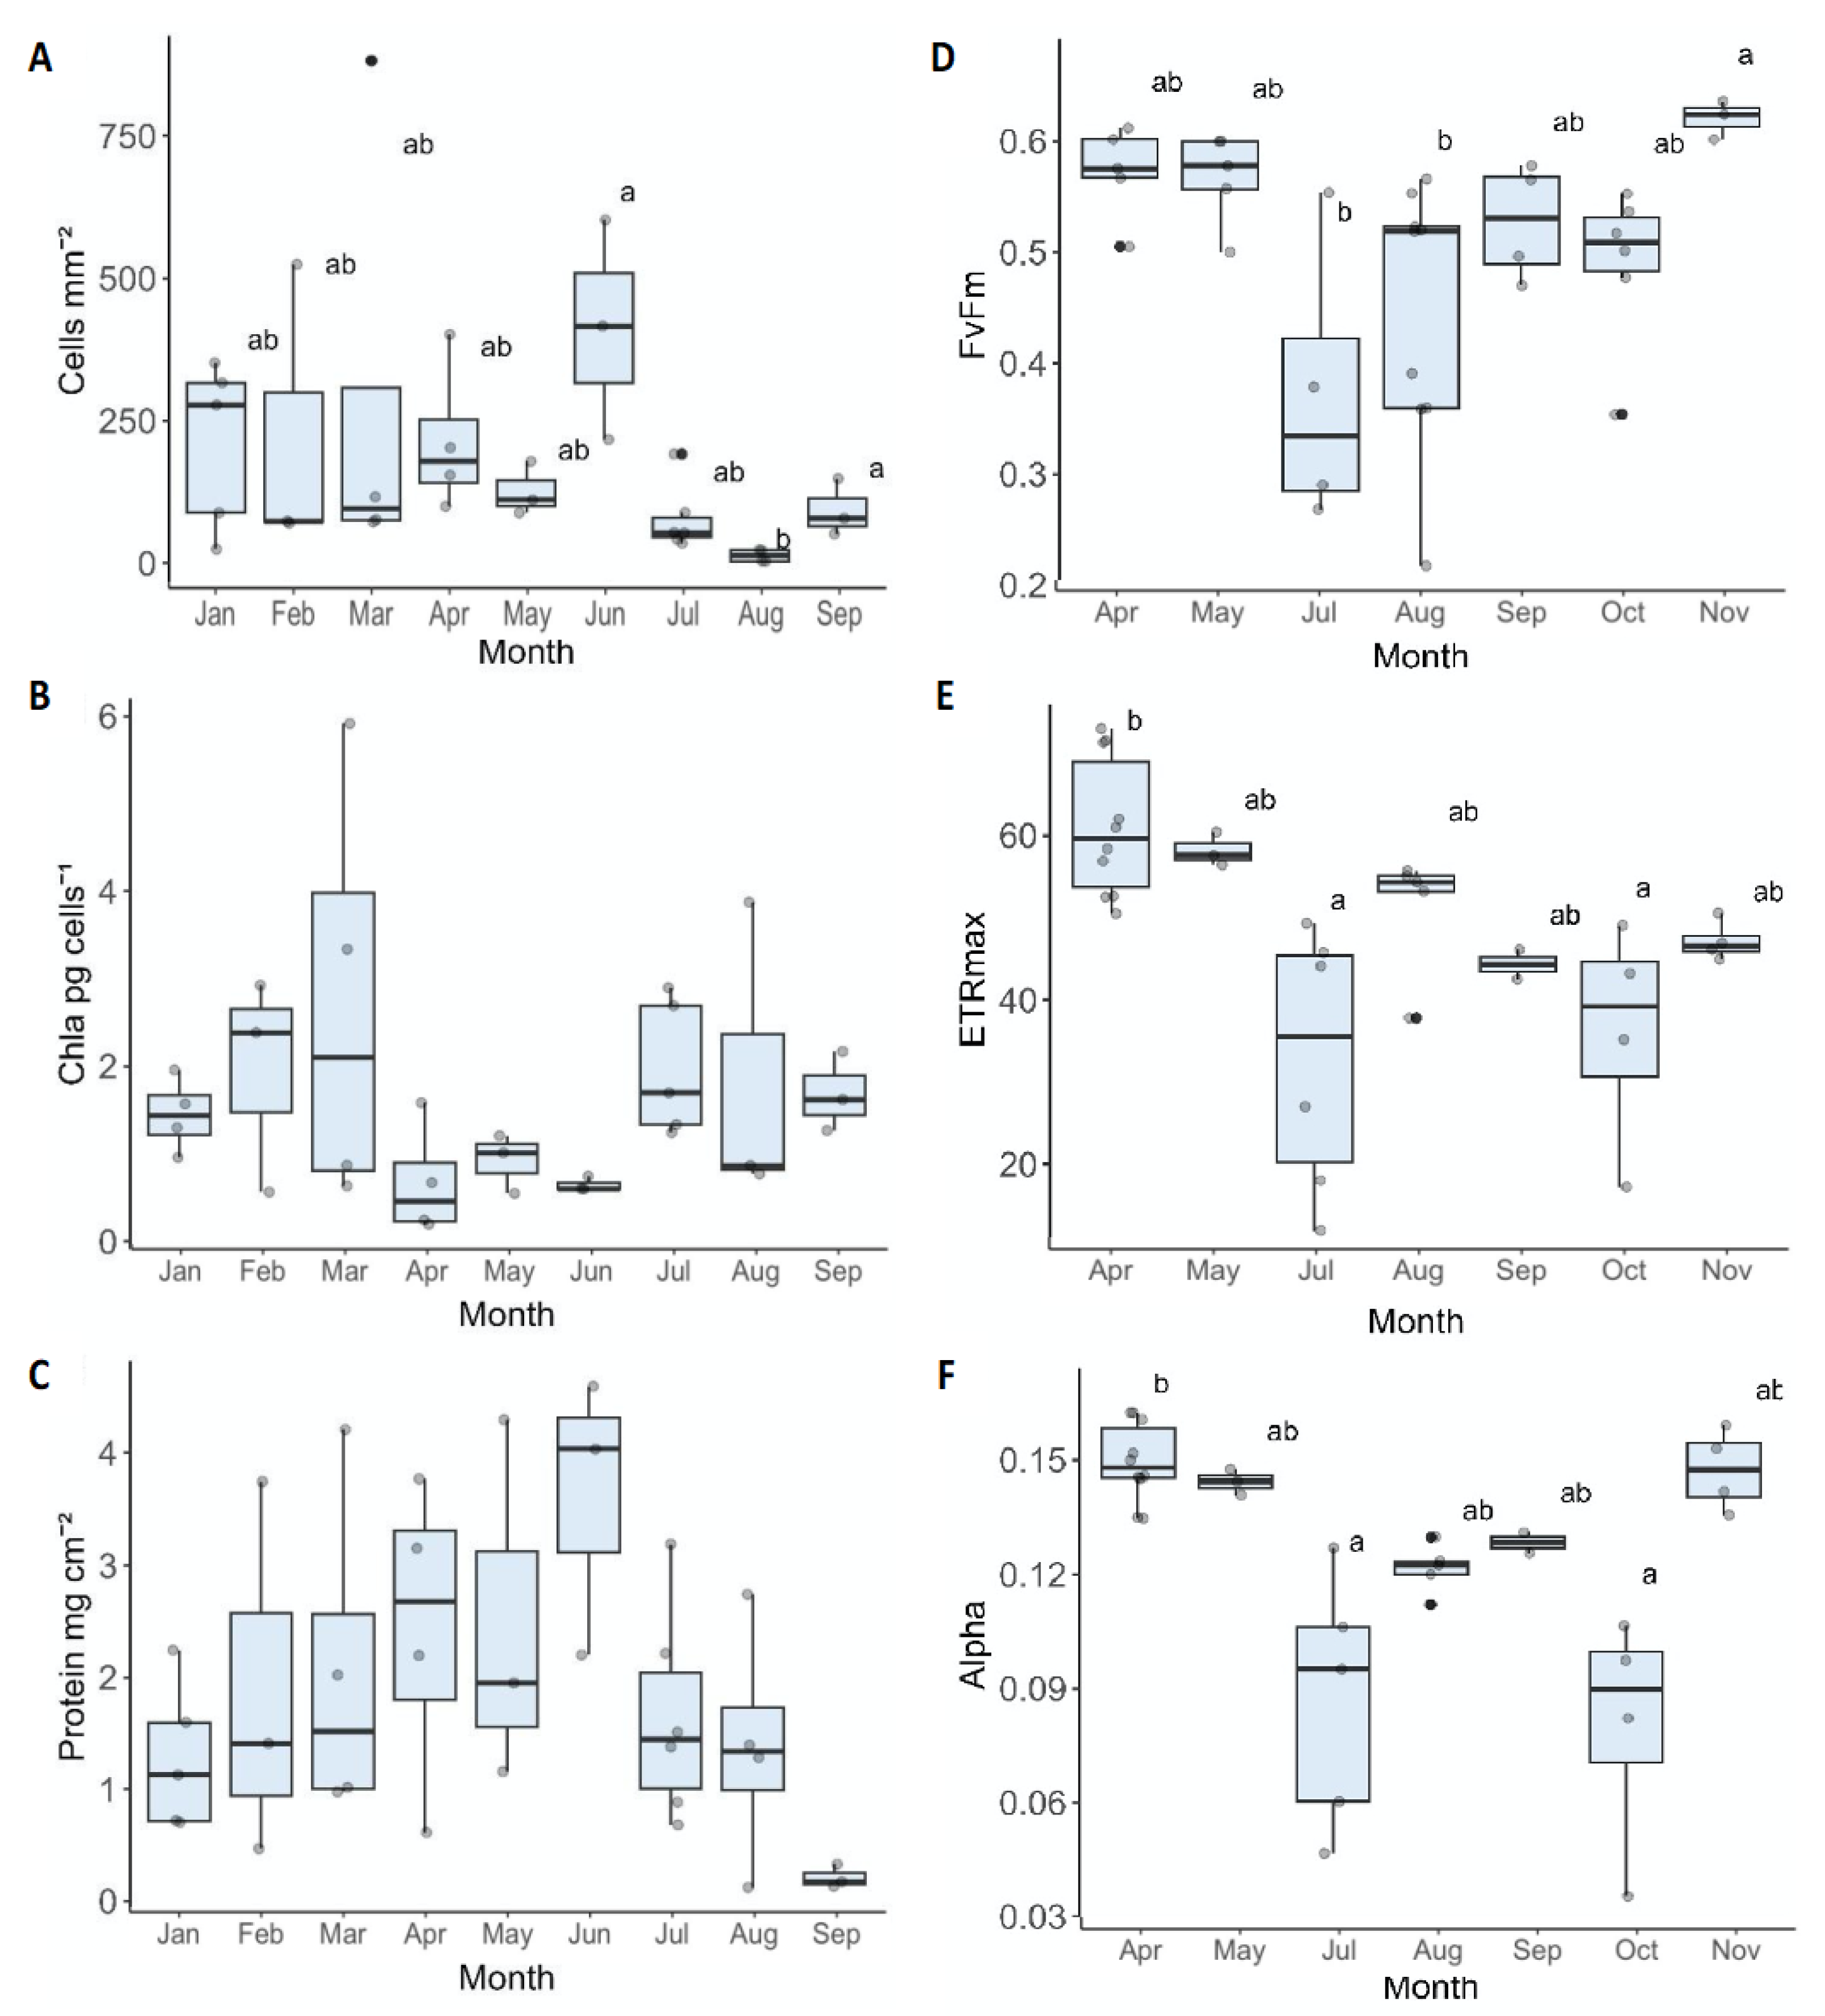
We evaluate the physiological and photochemical parameters of O. patagonica throughout the year. The algae cells (per unit area) remained consistent from January to June, showing no discernible differences. However, a significant difference was observed from June to August (Kruskal-Wallis χ2=18.771, df = 8, p= 0.01613), which is the months of the O. patagonica seasonal bleaching occurs in the Eastern Mediterranean Sea (Figure 3A). The lowest median of chlorophyll concentration per algae cell occurs in April- June, coinciding with the peak algae cell count per unit area (Figure 3A,B). The protein concentration in the coral tissue gradually increases from January, reaching the maximum median concentration in June. However, from June onwards, there is a decrease in protein concentration, reaching a minimum in September (Figure 3C).
Due to the natural occurrence of partial bleaching in O. patagonica, the variability between colonies within a single month is considerable. As a result, some of the findings lack statistical significance. The photosynthetic efficiency, indicated by the maximum quantum yield (Fv/Fm), demonstrated distinct seasonal patterns. During the summer months of July and August, there was a significant reduction in efficiency (Kruskal-Wallis χ2= 19.221, df = 6, p = 0.003807), suggesting a potential impact on photosynthetic processes during this period. In contrast, at the beginning of winter in November, the efficiency reached its highest point of 0.621± 0.0172, indicating an optimization of photosynthetic performance (Figure 3D). Moreover, when examining the relative maximum electron transport rate (rETRMAX) lower values in July and October imply a decreased capacity for electron transport and reduced photosynthetic efficiency under those conditions. The highest values were observed in April (Figure 3E). In essence, these results highlight the dynamic variations of photosynthetic efficiency and electron transport rate throughout the year, with notable low efficiency during the summer, when water temperatures increase above 25°C. No significant change in EK values was observed throughout the year (statistically). Therefore, when ETR values decrease, photosynthesis efficiency under light limiting irradiances (alpha) values also decrease accordingly (Figure 3F).

3.2. Seasonal Patterns in O. patagonica Gametogenesis

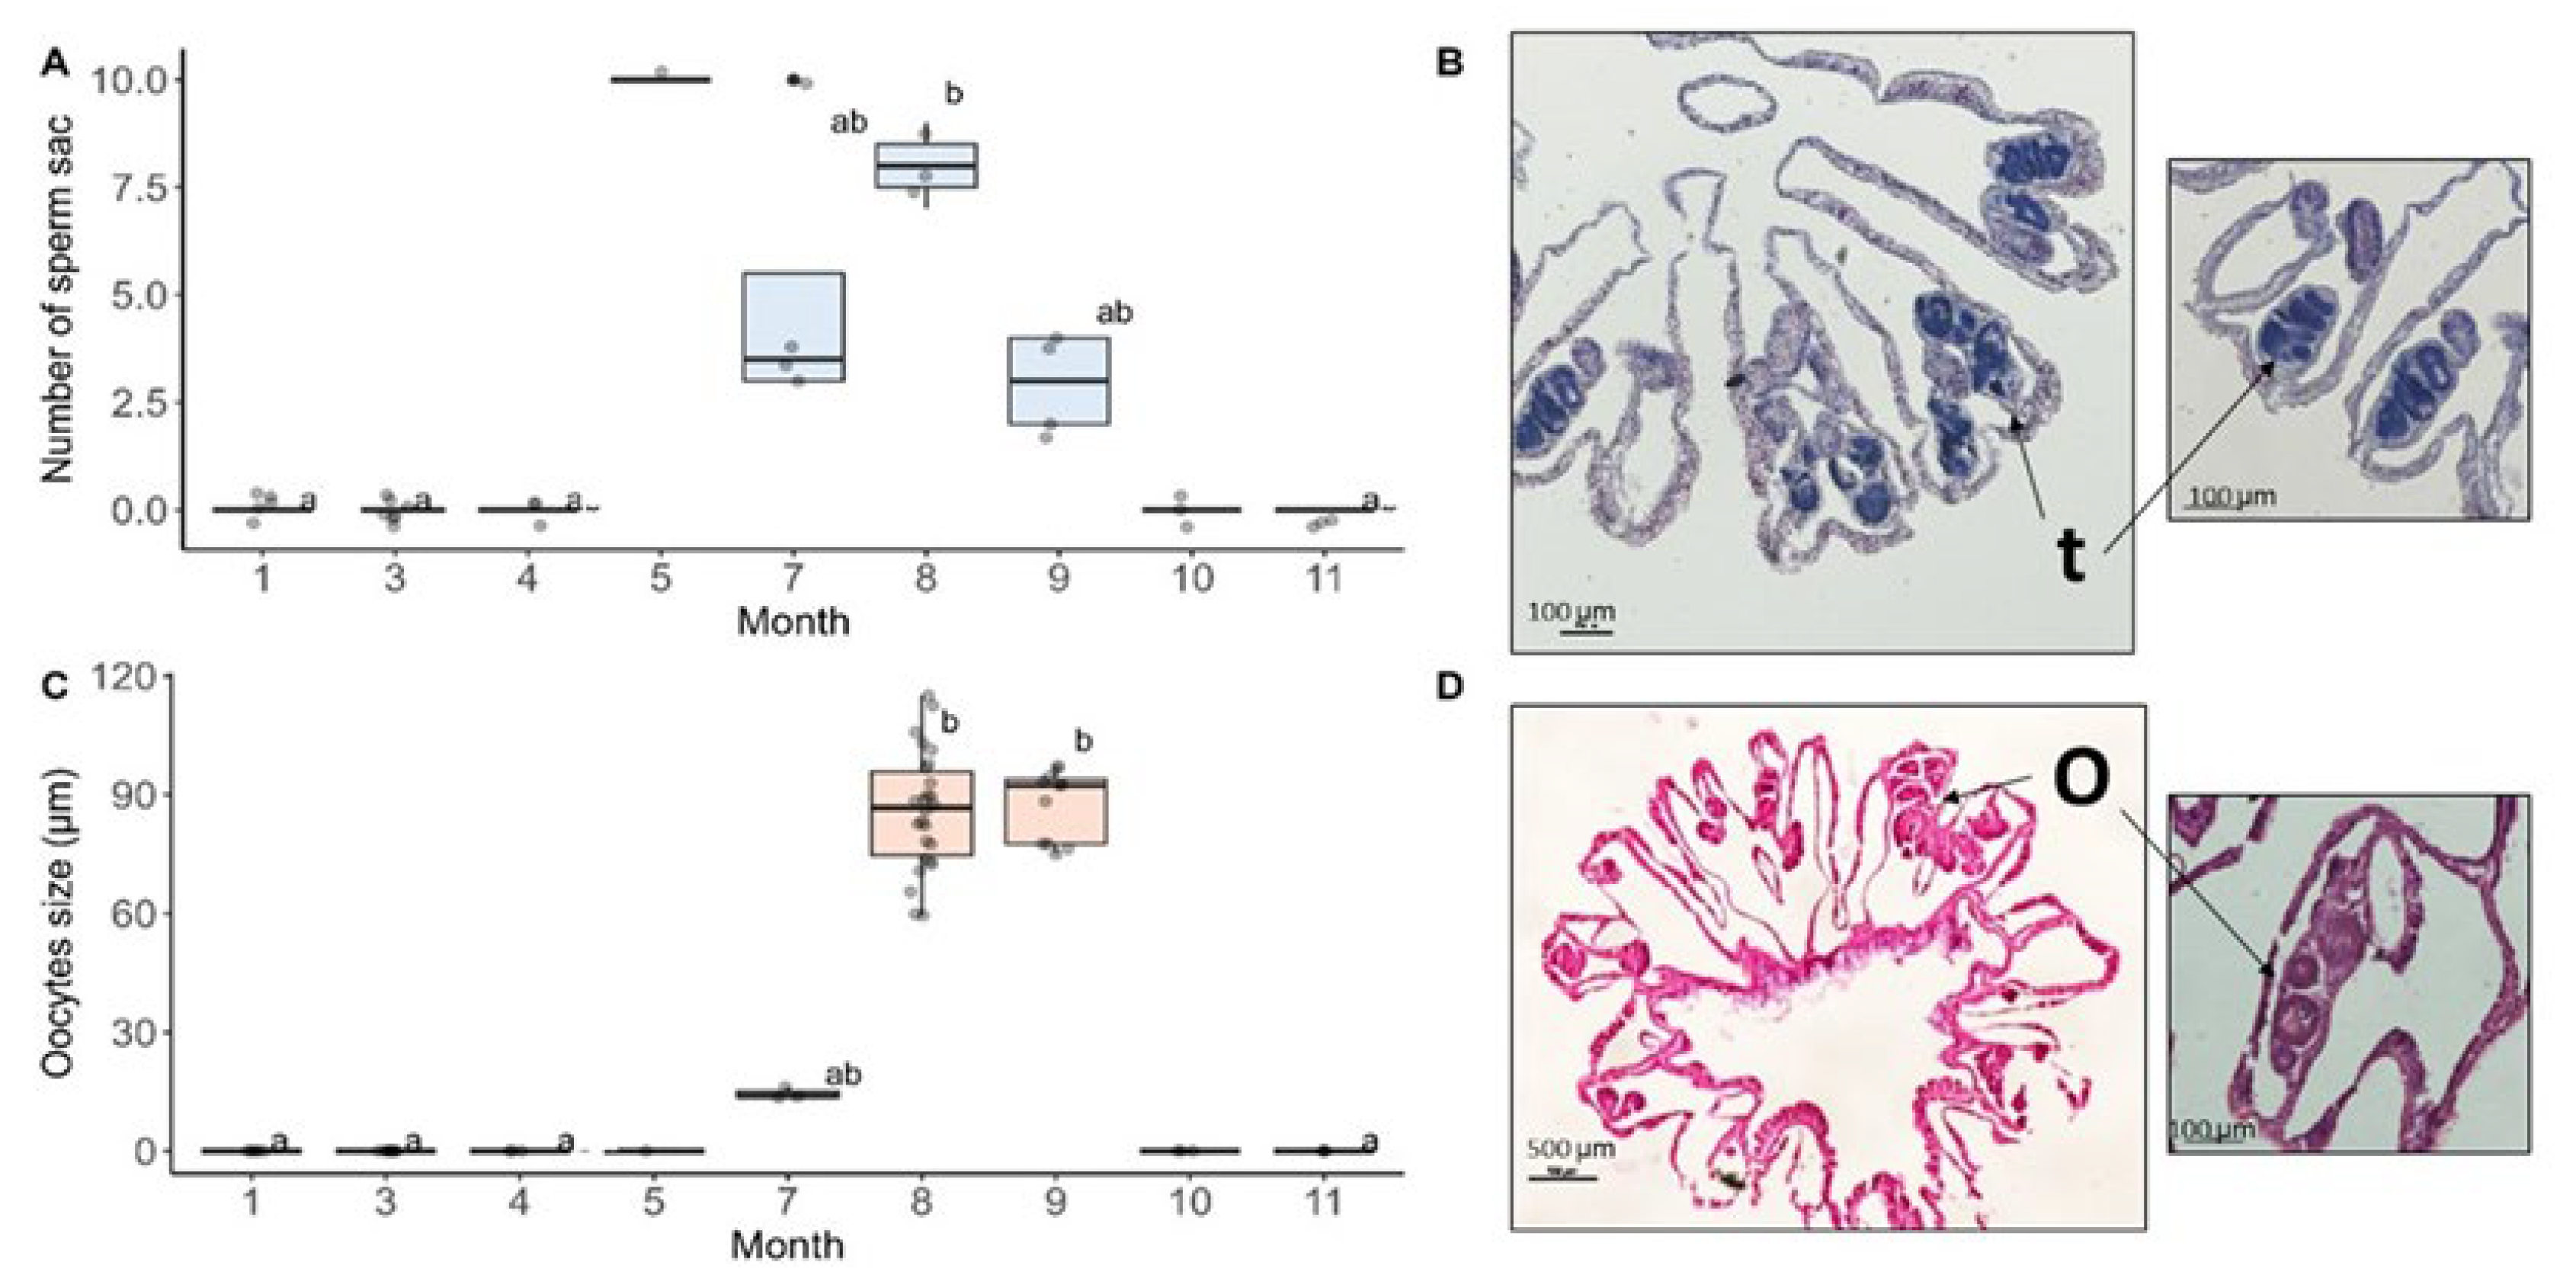
To address whether there are changes in the seasonal pattern of O. patagonica reproduction and population synchrony, histological cross-sections of O. patagonica colonies that were collected from the wild each month throughout the year were screened for female and male gonads. Screening revealed that sperm sacs started to develop in May and were observed until September, while oocytes were first noticed in July and persisted until September. It is important to note that we were unable to generate sections from the samples collected in June; therefore, the results for this month are missing. The size of the oocytes in July was significantly smaller than those observed in August and September (Kruskal-Wallis chi-squared = 47.5, df = 8, p-value = 1.231e-07). From October through May, no sperm sacs or oocytes were observed (Figure 4). Contrary to expectations; there was no discernible alteration in reproductive development or synchrony attributed to the rise in water temperature compared to previous results.

3.3. Thermal Stress Experiment: Physiology and Photosynthetic Activity

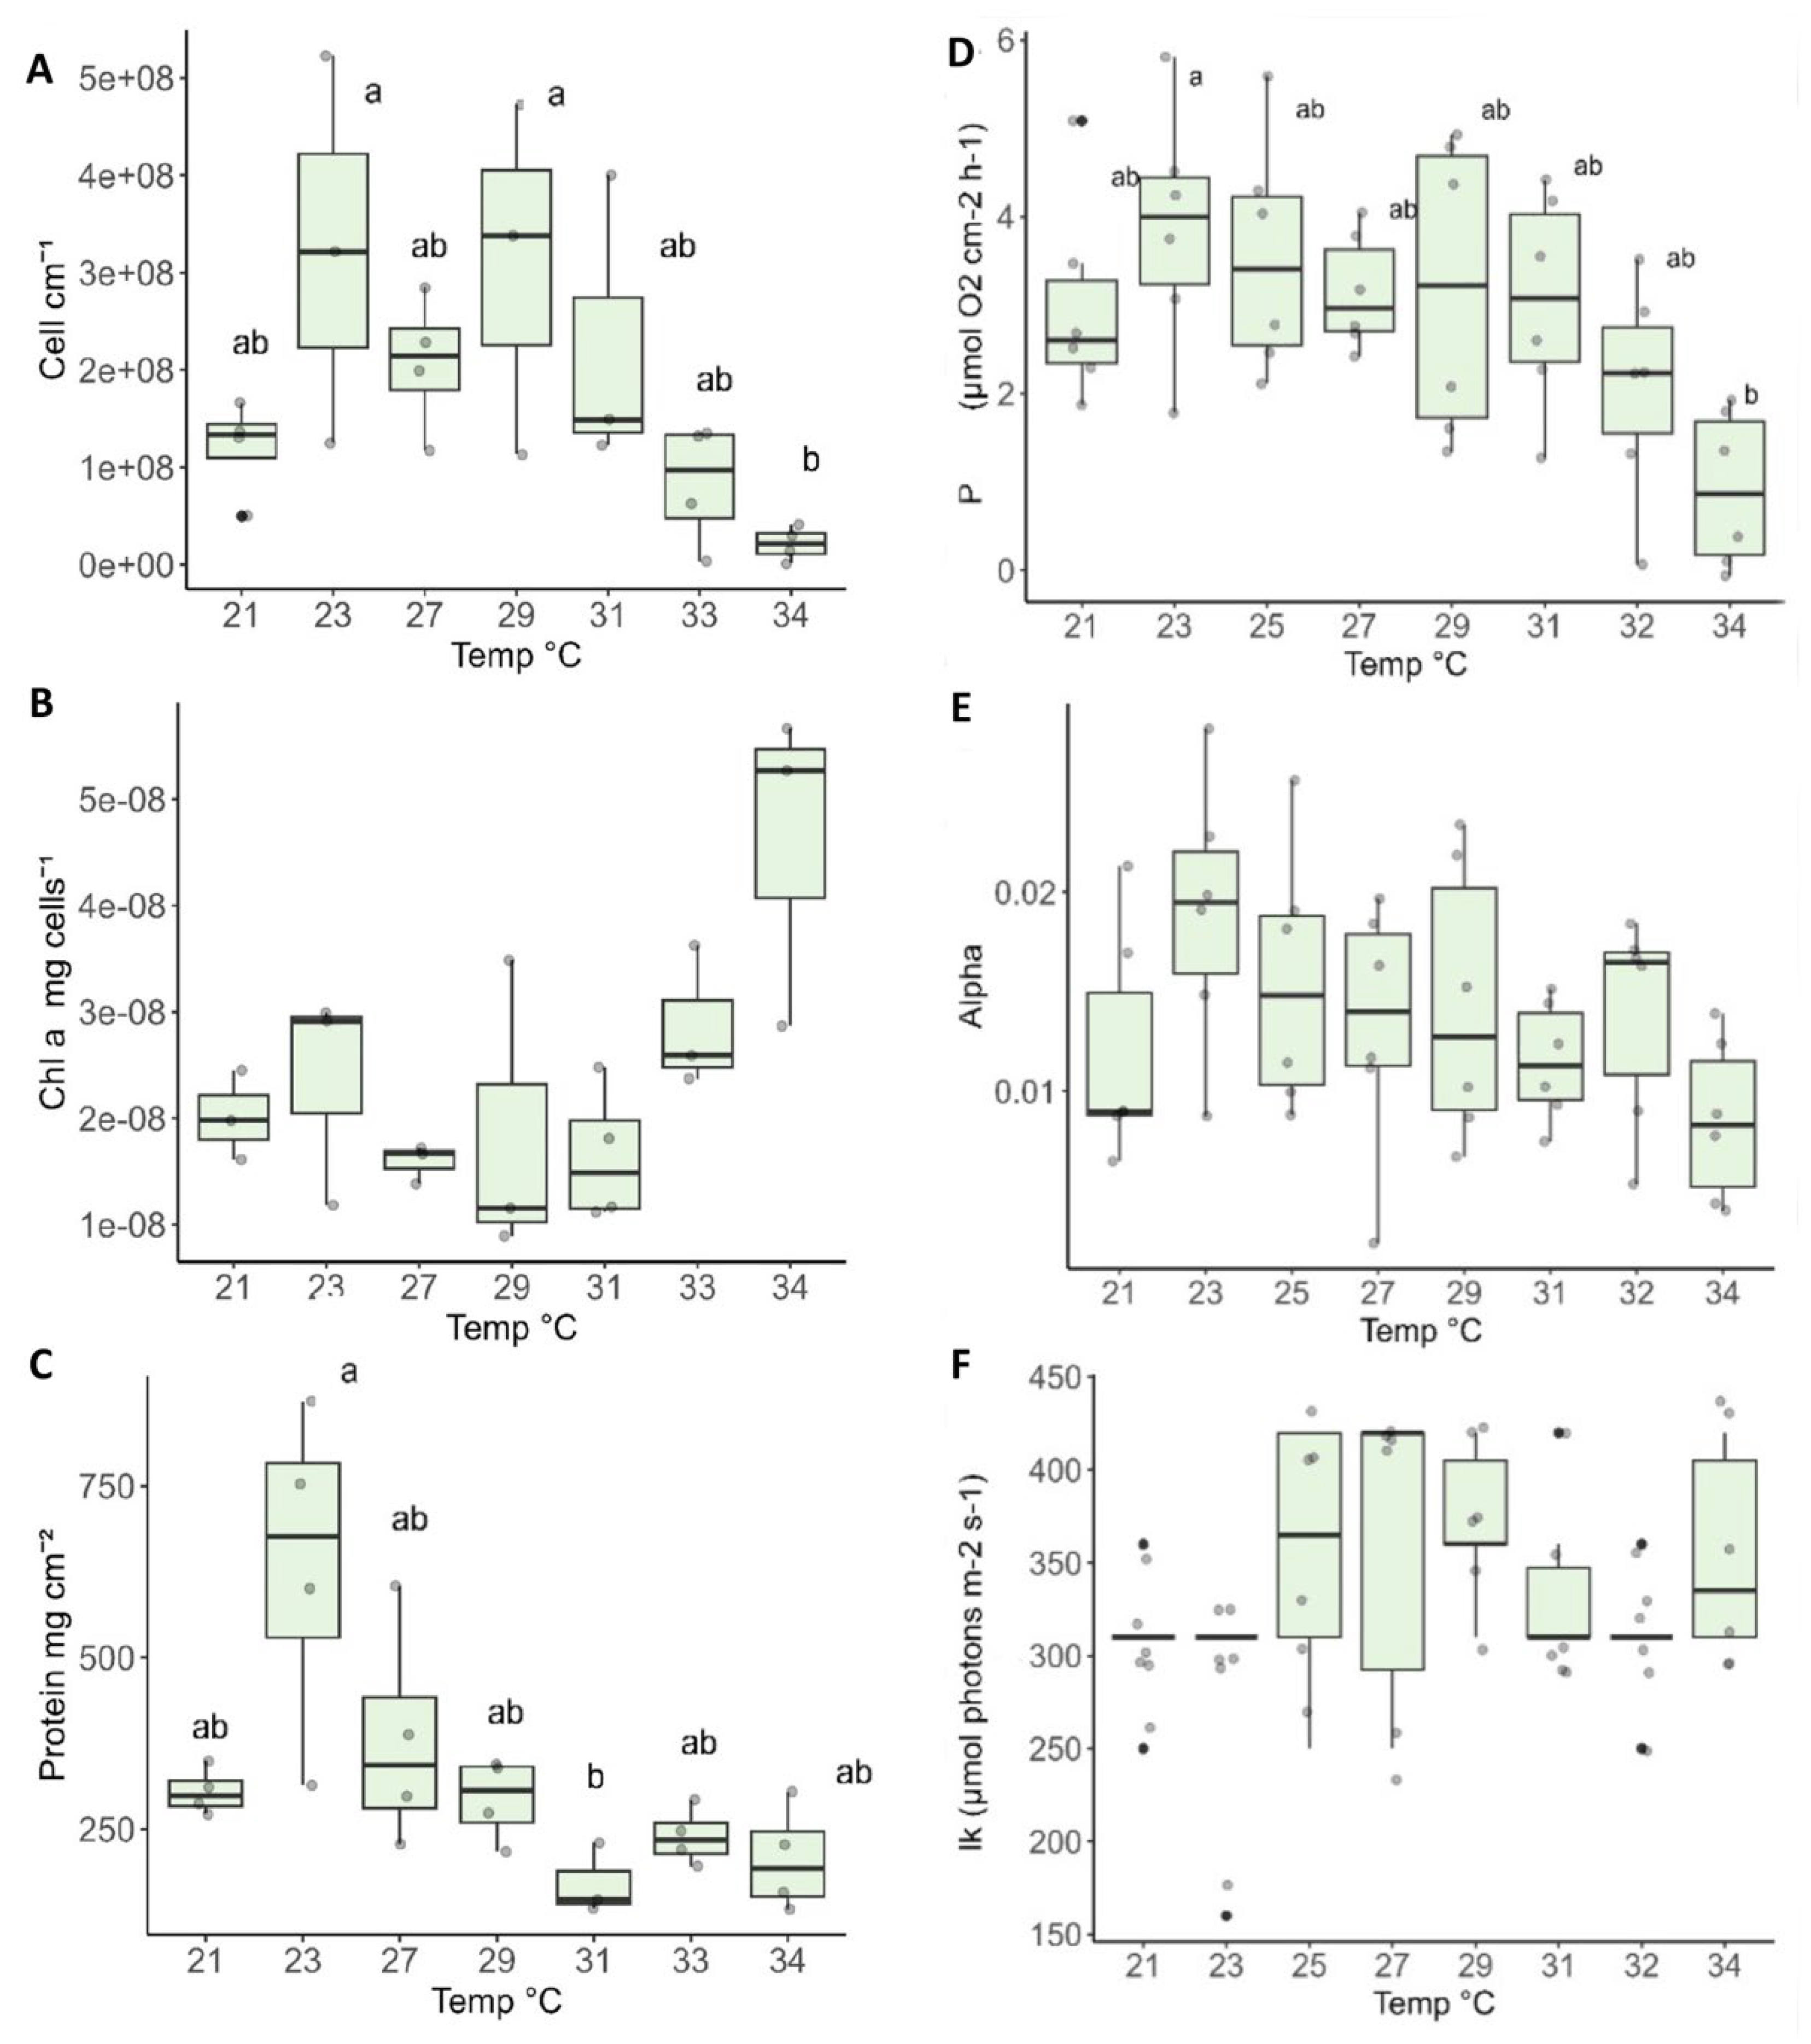
To examine the thermal tolerance of O. Patagonia, we measured physiology parameters after exposure to a range of temperatures: cell count per area, chlorophyll concentration per cell, and host protein per area (Figure 5A–C). There was an increase in symbiont density (cells cm−2) from 21°C to 23°C. The maximum number of algae cells was at 23°C and from 29°C to 34°C there was a significant decrease in the number of cells (Kruskal-Wallis χ2= 13.118, df = 6, p = 0.04119). Chlorophyll-a concentration increased as algal density decreased. The highest protein concentration was observed at 23°C (Kruskal-Wallis χ2= 15.782, df = 6, p=0.01497), the same temperature at which the highest concentration of algae cells was found. As the temperature increased above 23°C, the protein concentration decreased, reaching a minimum at 31°C.
Gross photosynthesis values, measured by P values under the light of 250 PAR (optimal light for the symbionts), were highest at 23°C -25°C, with a significant decline in photosynthesis values at 34°C (Figure 5D). The photosynthetic parameters, alpha and Ik, have no significant difference between the various temperatures (Figure 5E,F).

3.4. Thermal Stress Experiment: Photosynthesis Performance Parameters

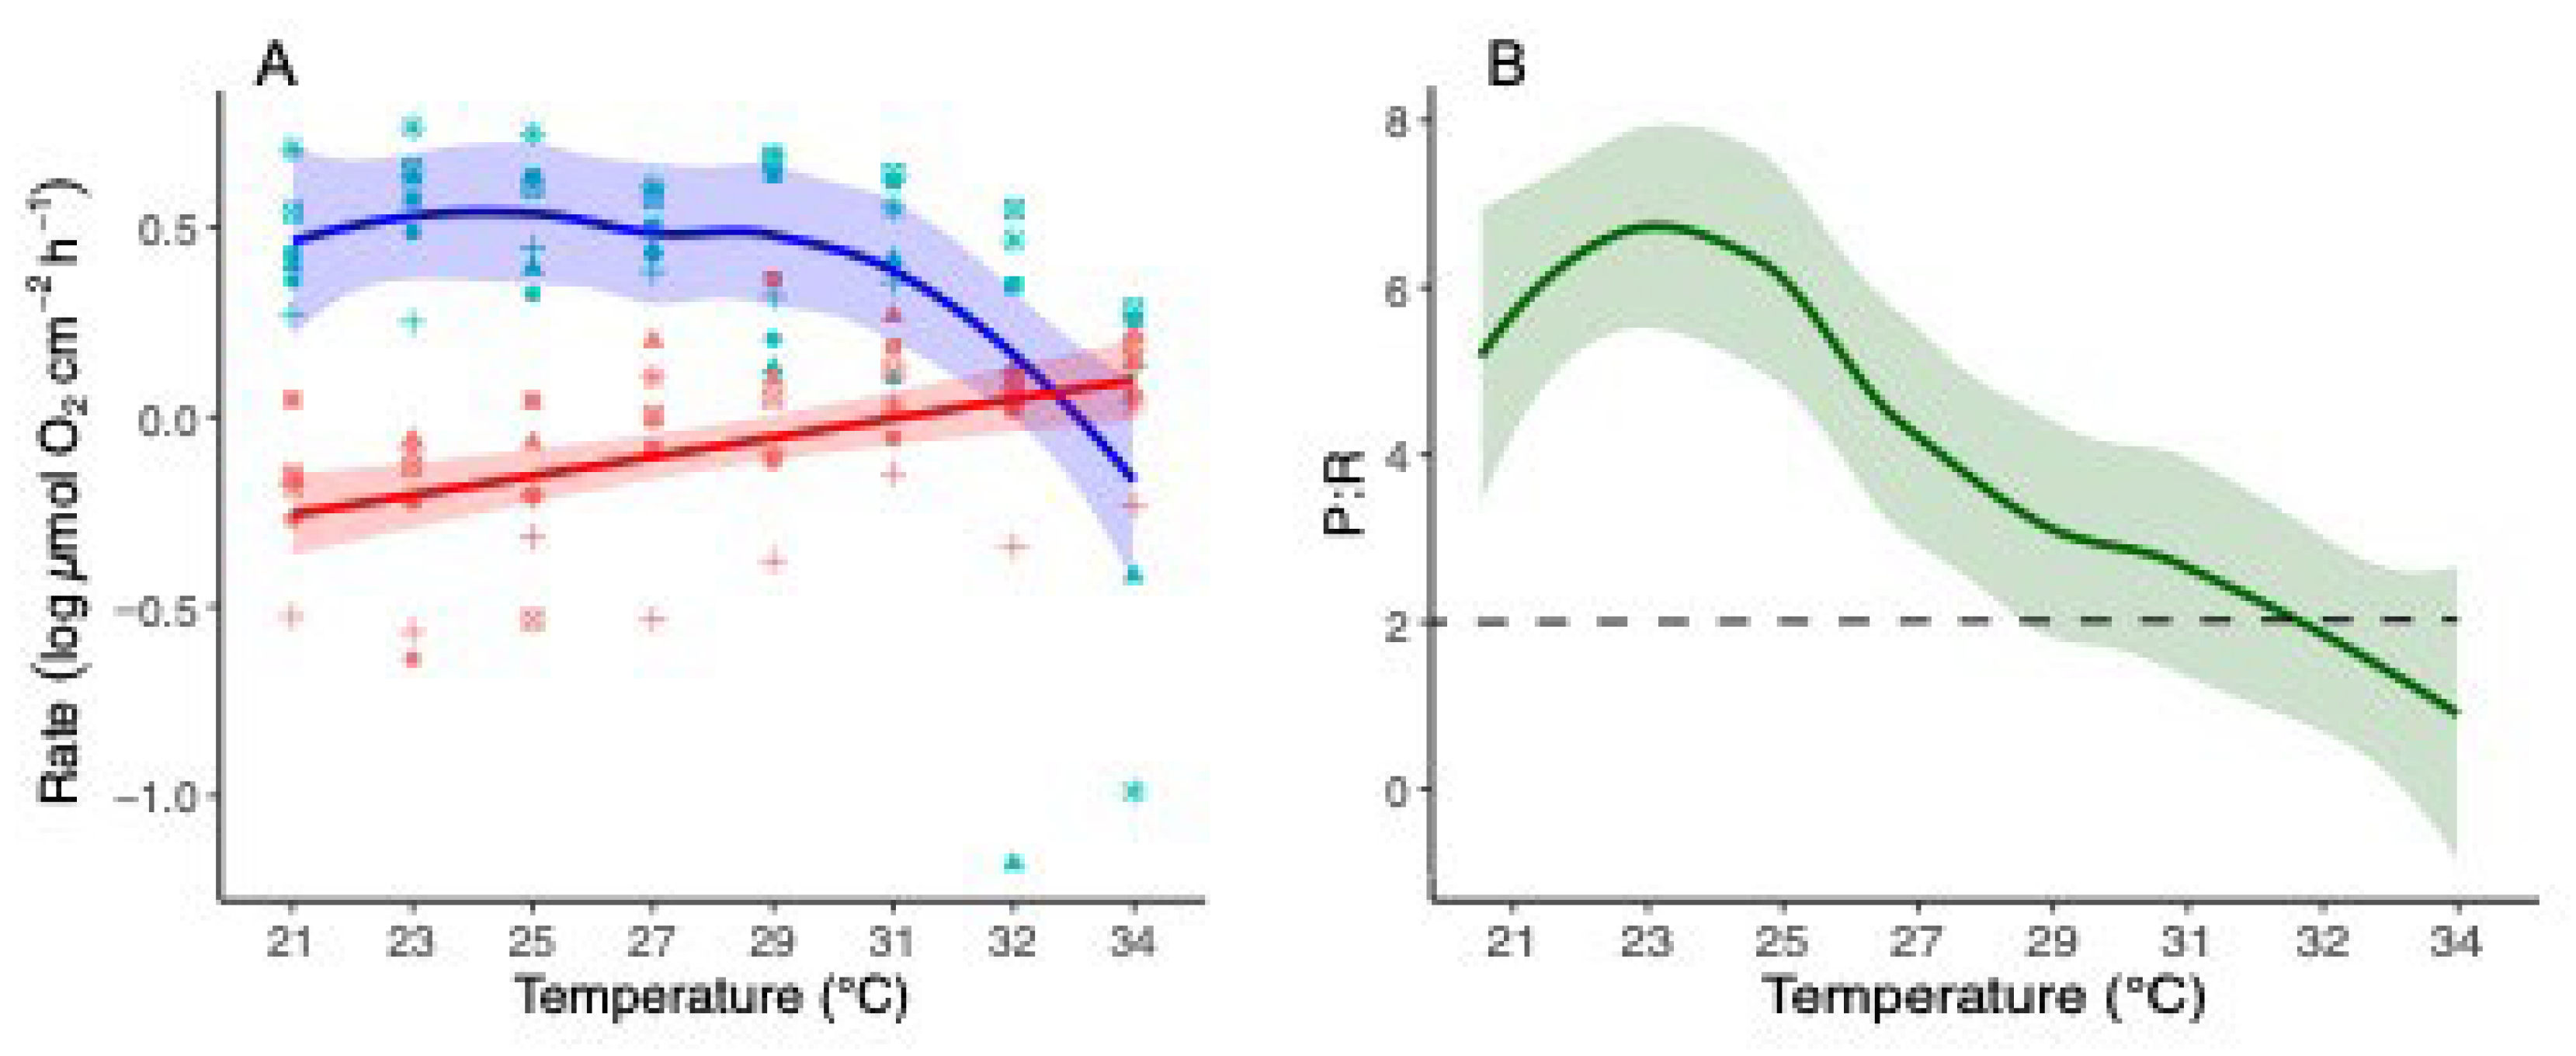
Gross photosynthesis was calculated from the values of P max for each temperature from the PI curve measured by the changes in oxygen. There were no significant differences in gross photosynthesis between 21°C- 29°C. However, a decrease was observed from 29°C to 34°C, with the latter showing a significantly lower level (Kruskal-Wallis χ2= 14.466, p= 0.04349). Respiration was measured by changes in oxygen concentration in darkness. There was a non-significant increase in the respiration rate with the rising temperature (Figure 6A). The maximum value of the P:R ratio between photosynthesis and respiration was reached between 23°C and 25°C. It decreased with the decrease in temperature. At a temperature of 34°C, there was a significant decrease (Kruskal-Wallis χ2= 24, p= 0.001139) below a relative value of 2 (Figure 6B).

3.5. Thermal Stress Bleaching

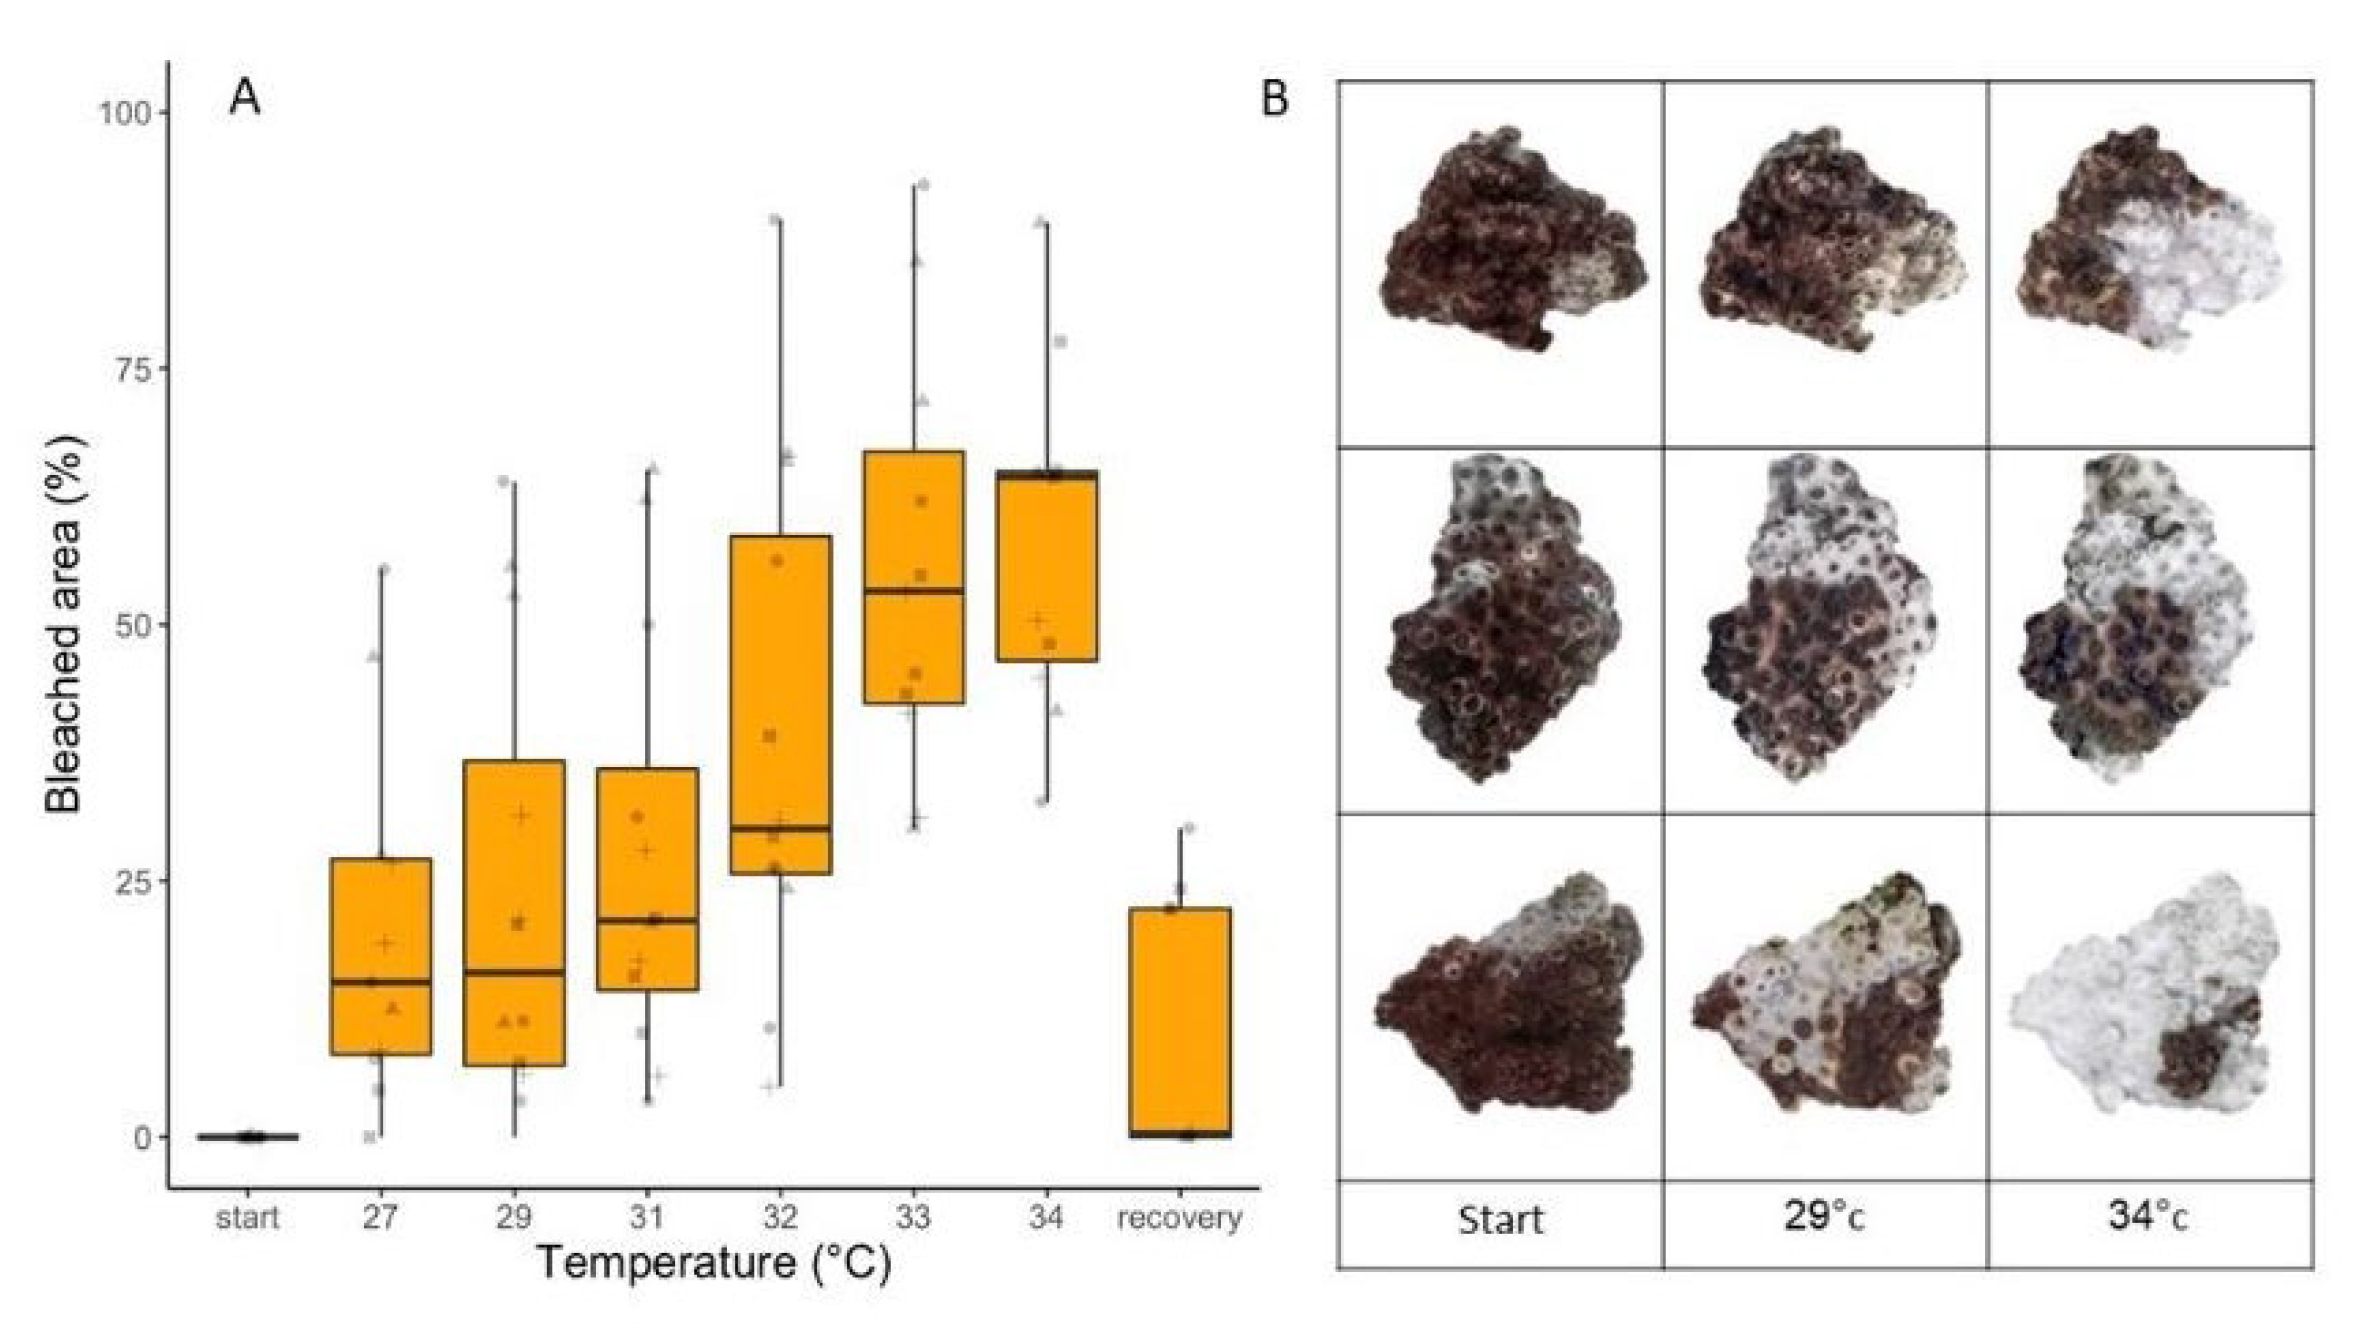
There is a significant difference between the bleaching percentage at 21-31°C and the bleaching percentage at 31-34°C (Figure 7). The corals underwent bleaching at an average rate of 1.273% new bleached area per 1 °C rise up to 31°C. From 31°C to 34°C, the corals experienced bleaching at a rate of 16.509% new bleached area per 1 °C temperature increase. After ninety days of regrowth at 21°C, all coral colonies had fully recovered, returning to their unbleached status prior to the start of the experiment.

4. Discussion

This study demonstrated that O. patagonica successfully acclimates and reproduces in the field following wide seasonal variations in temperature, despite increased SST in the Eastern Mediterenian Sea in the last three decades.
Our findings show a significant decrease in the number of algae per surface area during the summer months (from July to September, Figure 3), which aligns with seasonal bleaching of O. patagonica documented in previous studies [15,16]. During this time, colonies undergo bleaching, losing their algal symbionts, yet the gonads are well-developed (Figure 4), ready to release gametes. These findings corroborate earlier research on O. patagonica, which documented an annual spawning event occurring on the night of the full moon in September [16]. Our results demonstrate that gametes were well-developed in September but absent in October, suggesting that gamete release occurred between September and October.
Temperature strongly influences coral gametogenic and spawning cycles [31]. Recent thermal stress events have underscored that bleaching and heat stress can depress coral reproduction, as has been documented in different places around the world [32]. In contrast to these data, O. patagonica continues to produce mature gametes despite seasonal bleaching events.
Oocyte size is a standard metric used to assess reproductive output because of its positive relationship with fertilization success [33]. Individuals with greater energy reserves provide more proteins and lipids to their oocytes and thus produce larger oocytes [33,34]. The size of the oocyte observed in O. pataginica throughout the breeding season was similar to the sizes documented in previous studies for this species [16,35]. Therefore, it can be inferred that despite the rise in water temperature and bleaching processes the O. patagonica continued to invest its energy reserves in reproduction.
Protein concentration per surface area, a proxy for coral tissue biomass [32], increased during the colder months. The lowest protein concentration was observed in September when the water temperature reached its maximum of 31°C (Figure 3). Low coral biomass could result from the loss of symbionts in the summer and their carbon-rich, photosynthetic products which are typically shared with the coral host [36]. Additionally, this could be a part of the coral's reproductive strategy. Gonad development is an energy-consuming process, prompting the coral to invest all its energy, possibly converting reserves and body mass into developing gonads [32]. Proteins are the abundant energy reserves in corals for physiological processes [37]. It is not ideal for coral to lose most of its symbionts during the most valuable and energy-demanding process unless the symbionts can harm more than they can contribute.
Factors such as light and temperature can damage the photosystems and lead to the production of reactive oxygen species (ROS) during photosynthesis, resulting in oxidative stress [38]. If not adequately managed by the coral host, oxidative stress may negatively impact various physiological processes, including reproduction. Oxidative stress has been linked to impaired gonadal development in some coral species [38,39]. Therefore, our demonstration that the efficiency of photosynthesis decreased with a rise in water temperature suggests that the coral may expel the algae to prevent oxidative stress, which could harm the crucial process of gamete development. During this period, it is likely that the corals switch to a more heterotrophic mode. This hypothesis is supported by the findings of Martinez et al. (2021) [21], who discovered that, during the summer, O. patagonica near the Israeli shores has a high trophic position, dominantly heterotrophic, relying less on photo assimilates compared to other symbiotic corals, whose trophic index is typically closer to autotrophic organisms.
Photosynthetic efficiency is often evaluated based on the highest achievable conversion of light energy to chemical energy, measured as the maximum quantum yield, and on the electron transport rate (ETR). As photosynthetic efficiency provides insights into the overall performance and health of the photosynthetic apparatus, our results indicate that during the warm summer months, the performance of the symbionts is impaired (Figure 3) This could be attributed to high water temperatures and elevated irradiance levels. This impairment results in coral bleaching, during which there is a loss of photosynthetic symbionts from coral tissues. Our annual survey supports this observation, demonstrating a significant decrease in algae concentrations per surface area in July when water temperatures rise above 28°C - 29°C. The remaining algal symbionts respond by producing more chlorophyll to enhance photosynthetic rates and compensate for the reduced photosynthetic capacity (Figure 3). The additional chlorophyll can also serve as a photoprotective mechanism, helping to dissipate excess light energy and reduce damage from photooxidation [40,41].
The heat stress experiment results demonstrate that bleaching initiates when temperatures rise above 25°C and significantly intensifies when temperatures reach 31°C (Figure 7). These findings align with our annual physiology analysis and previous observations [35,42,43], which indicated seasonal bleaching of O. patagonica starting in July, coinciding with the rise in water temperatures above 25°C. The bleaching further intensifies in August and September when temperatures can peak at 31°.
Thermal performance curves (TPC) define the performance rates through the ratio between photosynthesis and respiration (P:R). These rates facilitate the comprehensive characterization of the corals' thermal sensitivity ranges as they estimate the extent to which algal production of organic material surpasses the combined consumption by the holobiont (algae and coral) [44] O. patagonica exhibited the highest P:R ratio, Pmax, and photosynthetic efficiency at a temperature of 23°C (Figure 6). These results are corroborated by the annual physiology data, where in June, when water temperatures rise to 23°C, algae density is at its peak, along with protein concentration, while chlorophyll content per algae is relatively low (Figure 3). When temperatures exceeded the thermal optimum of 23°C, P:R curves typically decreased. For corals to survive long-term, P:R values of 2 or higher are essential [44,45,46]. In our study, the temperature at which P:R fell below 2 was 34°C (Figure 6); however, all corals, including those exposed to 34°C for 48 hours, survived and exhibited complete recovery.
The relatively high but eventually limited thermal tolerance of O. patagonica shown herein fits the hypothesis of Martinez et al. (2021) [21] that this species is beginning to migrate to deeper and colder water due to the recent increase in SST at this site. In recent years the temperatures in the shallow water of the Eastern Mediterranean Sea have exceeded 31°C (Data available: http://reco.ruppin.ac.il/eng/). Therefore, the descent into the mesophotic zone can be a suitable refuge where the temperatures can be 2°C lower [21].
This study shows that the O. patagonica exhibits remarkable potential for surviving and adapting to high temperatures during the summer. This species reaches its maximum thermal tolerance and fully recovers while continuing to reproduce. However, the unabated rise in water temperature in the Mediterranean Sea due to climate change is likely continuing to force this species to migrate as its thermal tolerance is exceeded.

Author Contributions

Conceptualization, T.S. and T.M.; methodology, T.S, A.E. and S.L.; formal analysis, T.S. I.K, S.L. and J.B.; resources, T.M.; writing—original draft preparation, T.S, S.L, and T.M.; writing—review and editing, T.S, S.L, J.B., I.K. and T.M.; visualization, T.S. and J.B.; supervision, T.M.; funding acquisition, T.M. All authors have read and agreed to the published version of the manuscript.

Funding

This research was funded by the Ministry of Innovation, Science and Technology, Israel.

Institutional Review Board Statement

Not applicable,

Informed Consent Statement

Not applicable.

Data Availability Statement

All data needed to evaluate the conclusions of this paper are present in the paper.

Acknowledgments

We thank Rafi Yavetz and Liel Uziahu for the technical support, and the School of Mevoot-Yam for the facility.

Conflicts of Interest

The authors declare no conflicts of interest.

References

  1. Torda, G.; Donelson, J.M.; Aranda, M.; Barshis, D.J.; Bay, L.; Berumen, M.L.; Bourne, D.G.; Cantin, N.; Foret, S.; Matz, M.; et al. Rapid Adaptive Responses to Climate Change in Corals. Nat Clim Chang 2017, 7, 627–636. [Google Scholar] [CrossRef]
  2. Mumby, P.J.; Steneck, R.S. Coral Reef Management and Conservation in Light of Rapidly Evolving Ecological Paradigms. Trends Ecol Evol 2008, 23, 555–563. [Google Scholar] [CrossRef] [PubMed]
  3. Putnam, H.M.; Barott, K.L.; Ainsworth, T.D.; Gates, R.D. The Vulnerability and Resilience of Reef-Building Corals. Current Biology 2017, 27, R528–R540. [Google Scholar] [CrossRef]
  4. Muscatine, L.; Falkowski, P.G; Porter, J.W; Dubinsky, Z. Fate of Potosynthetic Fixed Carbon in Light and Shade-Adapted Colonies of The Symbiotic Coral Stylophora Pistillata. Proceedings of the Royal Society of London Series B. Biological Sciences 1984, 222, 181–202. [Google Scholar] [CrossRef]
  5. Hoogenboom, M.; Rodolfo-Metalpa, R.; Ferrier-Pagès, C. Co-Variation between Autotrophy and Heterotrophy in the Mediterranean Coral Cladocora Caespitosa. Journal of Experimental Biology 2010, 213, 2399–2409. [Google Scholar] [CrossRef] [PubMed]
  6. Oliver, E.C.J.; Donat, M.G.; Burrows, M.T.; Moore, P.J.; Smale, D.A.; Alexander, L. V.; Benthuysen, J.A.; Feng, M.; Sen Gupta, A.; Hobday, A.J.; et al. Longer and More Frequent Marine Heatwaves over the Past Century. Nat Commun 2018, 9. [Google Scholar] [CrossRef] [PubMed]
  7. Drake, J.L.; Mass, T.; Stolarski, J.; Von Euw, S.; van de Schootbrugge, B.; Falkowski, P.G. How Corals Made Rocks through the Ages. Glob Chang Biol 2020, 26, 31–53. [Google Scholar] [CrossRef]
  8. Oliver, E.C.J.; Benthuysen, J.A.; Darmaraki, S.; Donat, M.G.; Hobday, A.J.; Holbrook, N.J.; Schlegel, R.W.; Gupta, A. Marine Heatwaves. Sen Annual Review of Marine Science 2021. [Google Scholar]
  9. Oakley, C.A.; Davy, S.K. Cell Biology of Coral Bleaching. Coral Bleaching. Ecological Studies 2018, 233, 189–211. [CrossRef]
  10. Baker, A.C.; Glynn, P.W.; Riegl, B. Climate Change and Coral Reef Bleaching: An Ecological Assessment of Long-Term Impacts, Recovery Trends and Future Outlook. Estuar Coast Shelf Sci 2008, 80, 435–471. [Google Scholar] [CrossRef]
  11. Hoegh-Guldberg, O. Climate Change, Coral Bleaching and the Future of the World’s Coral Reefs. Mar Freshw Res 1999, 50, 839–866. [Google Scholar] [CrossRef]
  12. Rodolfo-Metalpa, R.; Hoogenboom, M.O.; Rottier, C.; Ramos-Esplá, A.; Baker, A.C.; Fine, M.; Ferrier-Pagès, C. Thermally Tolerant Corals Have Limited Capacity to Acclimatize to Future Warming. Glob Chang Biol 2014, 20, 3036–3049. [Google Scholar] [CrossRef] [PubMed]
  13. Hughes, T.P.; Kerry, J.T.; Álvarez-Noriega, M.; Álvarez-Romero, J.G.; Anderson, K.D.; Baird, A.H.; Babcock, R.C.; Beger, M.; Bellwood, D.R.; Berkelmans, R.; et al. Global Warming and Recurrent Mass Bleaching of Corals. Nature 2017, 543, 373–377. [Google Scholar] [CrossRef]
  14. Zibrowius, H. Oculina Patagonica Scléractiniaire Hermatypique Introduit en Méditerranée. Helgolander Marine Research Wiss 1974, 26, 153–173. [Google Scholar] [CrossRef]
  15. Fine, M.; Loya, Y. The Coral Oculina Patagonica: A New Immigrant to the Mediterranean Coast of Israel. Isr J Zool 1995, 41. [Google Scholar] [CrossRef]
  16. Fine, M.; Zibrowius, H.; Loya, Y. Oculina Patagonica: A Non-Lessepsian Scleractinian Coral Invading the Mediterranean Sea. Mar Biol 2001, 138, 1195–1203. [Google Scholar] [CrossRef]
  17. Serrano, E.; Ribes, M.; Coma, R. Recurrent Partial Mortality Events in Winter Shape the Dynamics of the Zooxanthellate Coral Oculina Patagonica at High Latitude in the Mediterranean. Coral Reefs 2017, 36, 27–38. [Google Scholar] [CrossRef]
  18. Bongaerts, P.; Ridgway, T.; Sampayo, E.M.; Hoegh-Guldberg, O. Assessing the “deep Reef Refugia” Hypothesis: Focus on Caribbean Reefs. Coral Reefs 2010, 29, 309–327. [Google Scholar] [CrossRef]
  19. Semmler, R.F.; Hoot, W.C.; Reaka, M.L. Are Mesophotic Coral Ecosystems Distinct Communities and Can They Serve as Refugia for Shallow Reefs? Coral Reefs 2017, 36, 433–444. [Google Scholar] [CrossRef]
  20. Shlesinger, T.; Grinblat, M.; Rapuano, H.; Amit, T.; Loya, Y. Can Mesophotic Reefs Replenish Shallow Reefs? Reduced Coral Reproductive Performance Casts a Doubt. Ecology 2018, 99, 421–437. [Google Scholar] [CrossRef] [PubMed]
  21. Martinez, S.; Bellworthy, J.; Ferrier-Pagès, C.; Mass, T. Selection of Mesophotic Habitats by Oculina Patagonica in the Eastern Mediterranean Sea Following Global Warming. Sci Rep 2021, 11, 1–15. [Google Scholar] [CrossRef]
  22. Zaquin, T.; Zaslansky, P.; Pinkas, I.; Mass, T. Simulating Bleaching: Long-Term Adaptation to the Dark Reveals Phenotypic Plasticity of the Mediterranean Sea Coral Oculina Patagonica. Front Mar Sci 2019, 6. [Google Scholar] [CrossRef]
  23. Brooke, S.; Young, C.M. Embryogenesis and Larval Biology of the Ahermatypic Scleractinian Oculina Varicosa. Mar Biol 2005, 146, 665–675. [Google Scholar] [CrossRef]
  24. Ozer, T.; Gertman, I.; Kress, N.; Silverman, J.; Herut, B. Interannual Thermohaline (1979–2014) and Nutrient (2002–2014) Dynamics in the Levantine Surface and Intermediate Water Masses, SE Mediterranean Sea. Glob Planet Change 2017, 151, 60–67. [Google Scholar] [CrossRef]
  25. Lin, C.H.; Nozawa, Y. The Influence of Seawater Temperature on the Timing of Coral Spawning. Coral Reefs 2023, 42, 417–426. [Google Scholar] [CrossRef]
  26. Shlesinger, T.; Loya, Y. Breakdown in Spawning Synchrony: A Silent Threat to Coral Persistence. Science (1979) 2019, 365, 1002–1007. [Google Scholar] [CrossRef]
  27. Ralph, P.J.; Gademann, R.; Larkum, A.W.D.; Schreiber, U. In Situ Underwater Measurements of Photosynthetic Activity of Coral Zooxanthellae and Other Reef-Dwelling Dinoflagellate Endosymbionts, Marine Ecology Progress Series 1999, 180, 139-147. [CrossRef]
  28. Schneider, C.A.; Rasband, W.S.; Eliceiri, K.W. NIH Image to ImageJ: 25 Years of Image Analysis. Nat Methods 2012, 9, 671–675. [Google Scholar] [CrossRef]
  29. Ritchie, R.J. Universal Chlorophyll Equations for Estimating Chlorophylls a, b, c, and d and Total Chlorophylls in Natural Assemblages of Photosynthetic Organisms Using Acetone, Methanol, or Ethanol Solvents, Photosynthetica 2008, 46, 115–126. [CrossRef]
  30. Rinkevich, B.; Loya, Y. The Reproduction of the Red Sea Coral Stylophora Pistillata. I. Gonads and Planulae. Mar Ecol Prog Ser 1979, 133–144. [Google Scholar] [CrossRef]
  31. Jones, A.M.; Berkelmans, R. Tradeoffs to Thermal Acclimation: Energetics and Reproduction of a Reef Coral with Heat Tolerant Symbiodinium Type-D. J Mar Biol 2011, 1–12. [Google Scholar] [CrossRef]
  32. Leinbach, S.E.; Speare, K.E.; Rossin, A.M.; Holstein, D.M.; Strader, M.E. Energetic and Reproductive Costs of Coral Recovery in Divergent Bleaching Responses. Sci Rep 2021, 11. [Google Scholar] [CrossRef]
  33. Levitan, D.R. The Relationship between Egg Size and Fertilization Success in Broadcast-Spawning Marine Invertebrates. Integrative and Comparative Biology 2006, 46, 298–311. [Google Scholar] [CrossRef]
  34. Michalek-Wagner, K.; Willis, B.L. Impacts of Bleaching on the Soft Coral Lobophytum Compactum. II. Biochemical Changes in Adults and Their Eggs, Coral Reefs 2001, 19, 240–246. [CrossRef]
  35. Armoza-Zvuloni, R.; Segal, R.; Kramarsky-Winter, E.; Loya, Y. Repeated Bleaching Events May Result in High Tolerance and Notable Gametogenesis in Stony Corals: Oculina Patagonica as a Model. Mar Ecol Prog Ser 2011, 426, 149–159. [Google Scholar] [CrossRef]
  36. Lesser, M.P.; Weis, V.M.; Patterson, M.R.; Jokiel, P.L. Effects of Morphology and Water Motion on Carbon Delivery and Productivity in the Reef Coral, Pocillopora Damicornis (Linnaeus): Diffusion Barriers, Inorganic Carbon Limitation, and Biochemical Plasticity. J Exp Mar Biol Ecol 1994, 178, 153–179. [Google Scholar] [CrossRef]
  37. Lesser, M.P. Using Energetic Budgets to Assess the Effects of Environmental Stress on Corals: Are We Measuring the Right Things? Coral Reefs 2013, 32, 25–33. [Google Scholar] [CrossRef]
  38. Yakovleva, I.; Bhagooli, R.; Takemura, A.; Hidaka, M. Differential Susceptibility to Oxidative Stress of Two Scleractinian Corals: Antioxidant Functioning of Mycosporine-Glycine. Comp Biochem Physiol B Biochem Mol Biol 2004, 139, 721–730. [Google Scholar] [CrossRef] [PubMed]
  39. Lesser, M.P.; Stochaj, W.R.; Tapley, D.W.; Shick, J.M. Bleaching in Coral Reef Anthozoans: Effects of Irradiance, Ultraviolet Radiation, and Temperature on the Activities of Protective Enzymes against Active Oxygen, Coral Reefs 1990, 8, 225–232. [CrossRef]
  40. Hoegh-Guldber, O.; Jones, R.J. Photoinhibition and Photoprotection in Symbiotic Dinoflagellates from Reef-Building Corals, Marine Ecology Progress Series 1999, 183, 73-86. [CrossRef]
  41. Reinbothe, S.; Reinbothe, C. Evolution of Chlorophyll Biosynthesis-The Challenge to Survive photooxidation. Minireview 1996, 86. [Google Scholar] [CrossRef]
  42. Kushmarol, A.; Rosenberg2, E.; Fine1, M.; Haim2, Y. Ben; Loyal, Y. Effect of Temperature on Bleaching of the Coral Oculina Patagonica by Vibrio AK-1. Marine Ecology Progress Series 1998, 17, 131–137. [Google Scholar] [CrossRef]
  43. Shenkar, N.; Fine, M.; Kramarsky-Winter, E.; Loya, Y. Population Dynamics of Zooxanthellae during a Bacterial Bleaching Event. Coral Reefs 2006, 25, 223–227. [Google Scholar] [CrossRef]
  44. Coles, S.L.; Jokiel, P.L. Effects of Temperature on Photosynthesis and Respiration in Hermatypic Corals. Mar. Biol 1977, 43, 209–216. [Google Scholar] [CrossRef]
  45. Silbiger, N.J.; Goodbody-Gringley, G.; Bruno, J.F.; Putnam, H.M. Comparative Thermal Performance of the Reef-Building Coral Orbicella Franksi at Its Latitudinal Range Limits. Mar Biol 2019, 166. [Google Scholar] [CrossRef]
  46. Gould, K.; Bruno, J.F.; Ju, R.; Goodbody-Gringley, G. Upper-Mesophotic and Shallow Reef Corals Exhibit Similar Thermal Tolerance, Sensitivity and Optima. Coral Reefs 2021, 40, 907–920. [Google Scholar] [CrossRef]
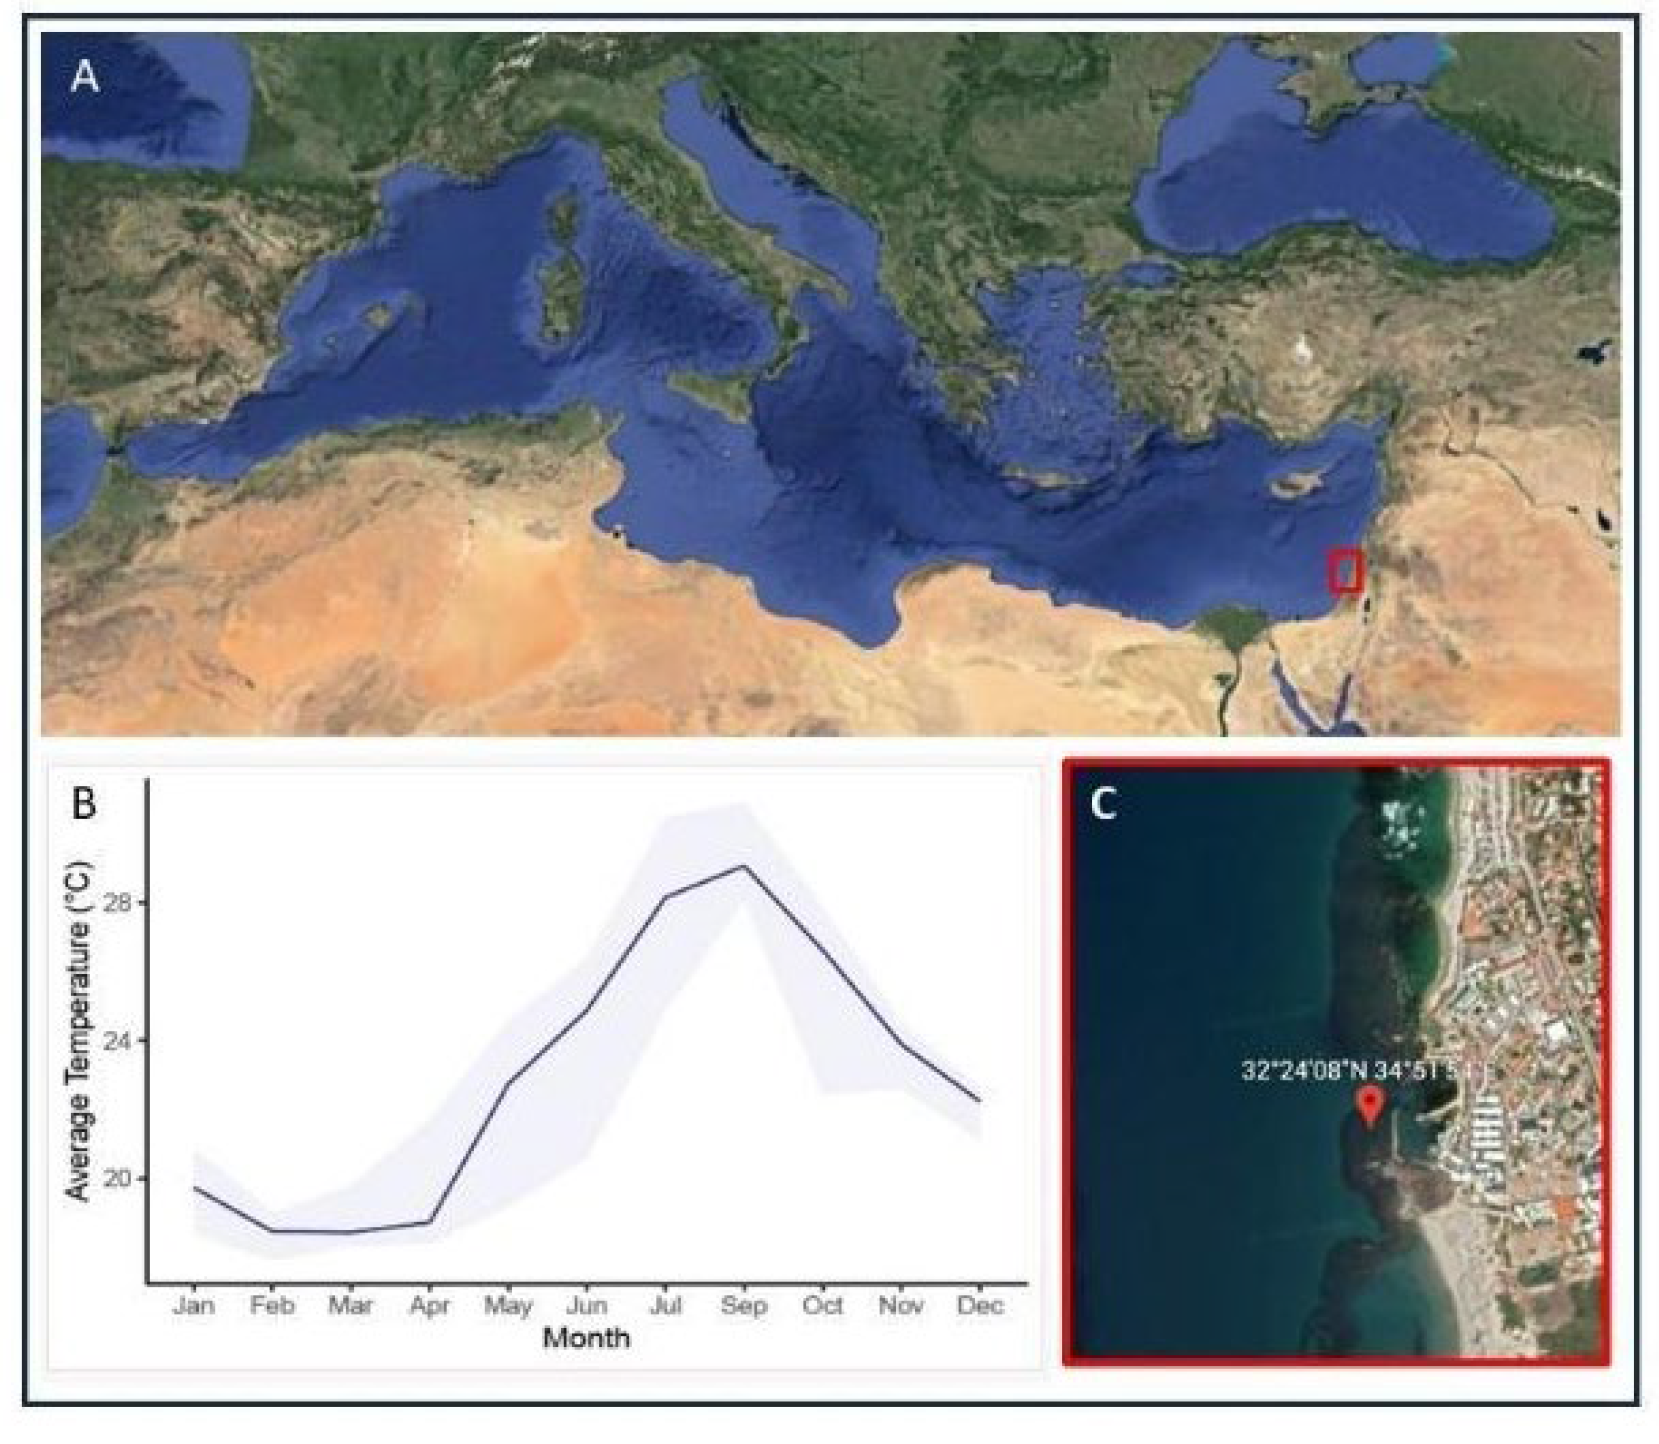
Figure 1. The sampling location, situated in Michmoret, Israel (A,C). The graph shows the water temperature record sampled in front of the Israeli School of Marine Sciences in Michmoret during the year off the study- 2021 (B). Data available: http://reco.ruppin.ac.il/eng/ satellite image by Google.
Preprints 107098 g001
Figure 2. Experimental design.
Preprints 107098 g002
Figure 3. Physiological analyses of O. Patagonica from January to September 2021 (A-C). (A) algal cells density per skeletal surface area. (B) Chlorophyll concentration per algal cell. (C) Protein concentration of coral tissue. Photosynthesis performance of O. Patagonica from April to November 2021 (D-F). (D) Maximum quantum yield (Fv/Fm). (E) Relative maximum electron transport rate (ETR). (F) Photosynthetic efficiency at light limiting irradiances (alpha). Horizontal black lines within boxes are median values, and box limits represent first and third quartiles. Whiskers represent 1.5 times the interquartile range. Round black points are individual sample data. Different lower-case letters indicate statistically significant differences between treatments within that sampling time point (adjusted p < 0.05).
Preprints 107098 g003
Figure 4. O. patagonica reproductive parameters. (A) Number of sperm sac from January to November 2021. (B) Cross-sections of a male with developed testes (t). (C) Oocyte size from January to November 2021. (D) cross- sections of a female with mature oocytes (o). Horizontal black lines within boxes are median values, and box limits represent the first and third quartiles. Whiskers represent 1.5 times the interquartile range. Round black points are individual sample data. Different lower-case letters indicate statistically significant differences between treatments within that sampling time point (adjusted p < 0.05).
Preprints 107098 g004
Figure 5. Physiological analyses of O. patagonica thermal stress experiment (A-C). (A) Algal cells density per skeletal surface area. (B) Chlorophyll concentration per algal cell. (C) Protein concentration per skeletal surface area. Thermal stress experiment photosynthesis performance parameters (D-F). (D) Photosynthesis at 250 PAR (µmol O2 m−2 h−1). (E) Photosynthetic efficiency at light limiting irradiances. (F) Saturating irradiance (µmol m−2 s−1). Horizontal black lines within boxes are median values, and box limits represent first and third quartiles. Whiskers represent 1.5 times the interquartile range. Round black points are individual sample data. Different lower-case letters indicate statistically significant differences between treatments within that sampling time point (adjusted p < 0.05).
Preprints 107098 g005
Figure 6. (A) Thermal performance curves of log gross photosynthesis (blue line) and dark respiration (red line) rates (µmol O2 cm−2 h−1) for O. patagonica. Each dot represents an individual fragment from 5 different colonies across 8 temperatures. Lines are means. (B) Photosynthesis respiration ratios by temperature. Solid lines represent the average fitted values and the gray bands are 95% confidence interval. The horizontal dotted line is where P:R = 2 (i.e., the lower threshold for long-term survival).
Preprints 107098 g006
Figure 7. (A) Bleaching percentage of O. patagonica colonies varies at eight different temperatures, including bleaching percentage of the colonies recovered at 21°C for 90 days. (B) Bleaching progression of three fragments, starting from 21°C at the beginning of the experiment, progressing through 29°C, and reaching 34°C at the end.
Preprints 107098 g007
Disclaimer/Publisher’s Note: The statements, opinions and data contained in all publications are solely those of the individual author(s) and contributor(s) and not of MDPI and/or the editor(s). MDPI and/or the editor(s) disclaim responsibility for any injury to people or property resulting from any ideas, methods, instructions or products referred to in the content.
Copyright: This open access article is published under a Creative Commons CC BY 4.0 license, which permit the free download, distribution, and reuse, provided that the author and preprint are cited in any reuse.
Prerpints.org logo

Preprints.org is a free preprint server supported by MDPI in Basel, Switzerland.

Subscribe

© 2024 MDPI (Basel, Switzerland) unless otherwise stated