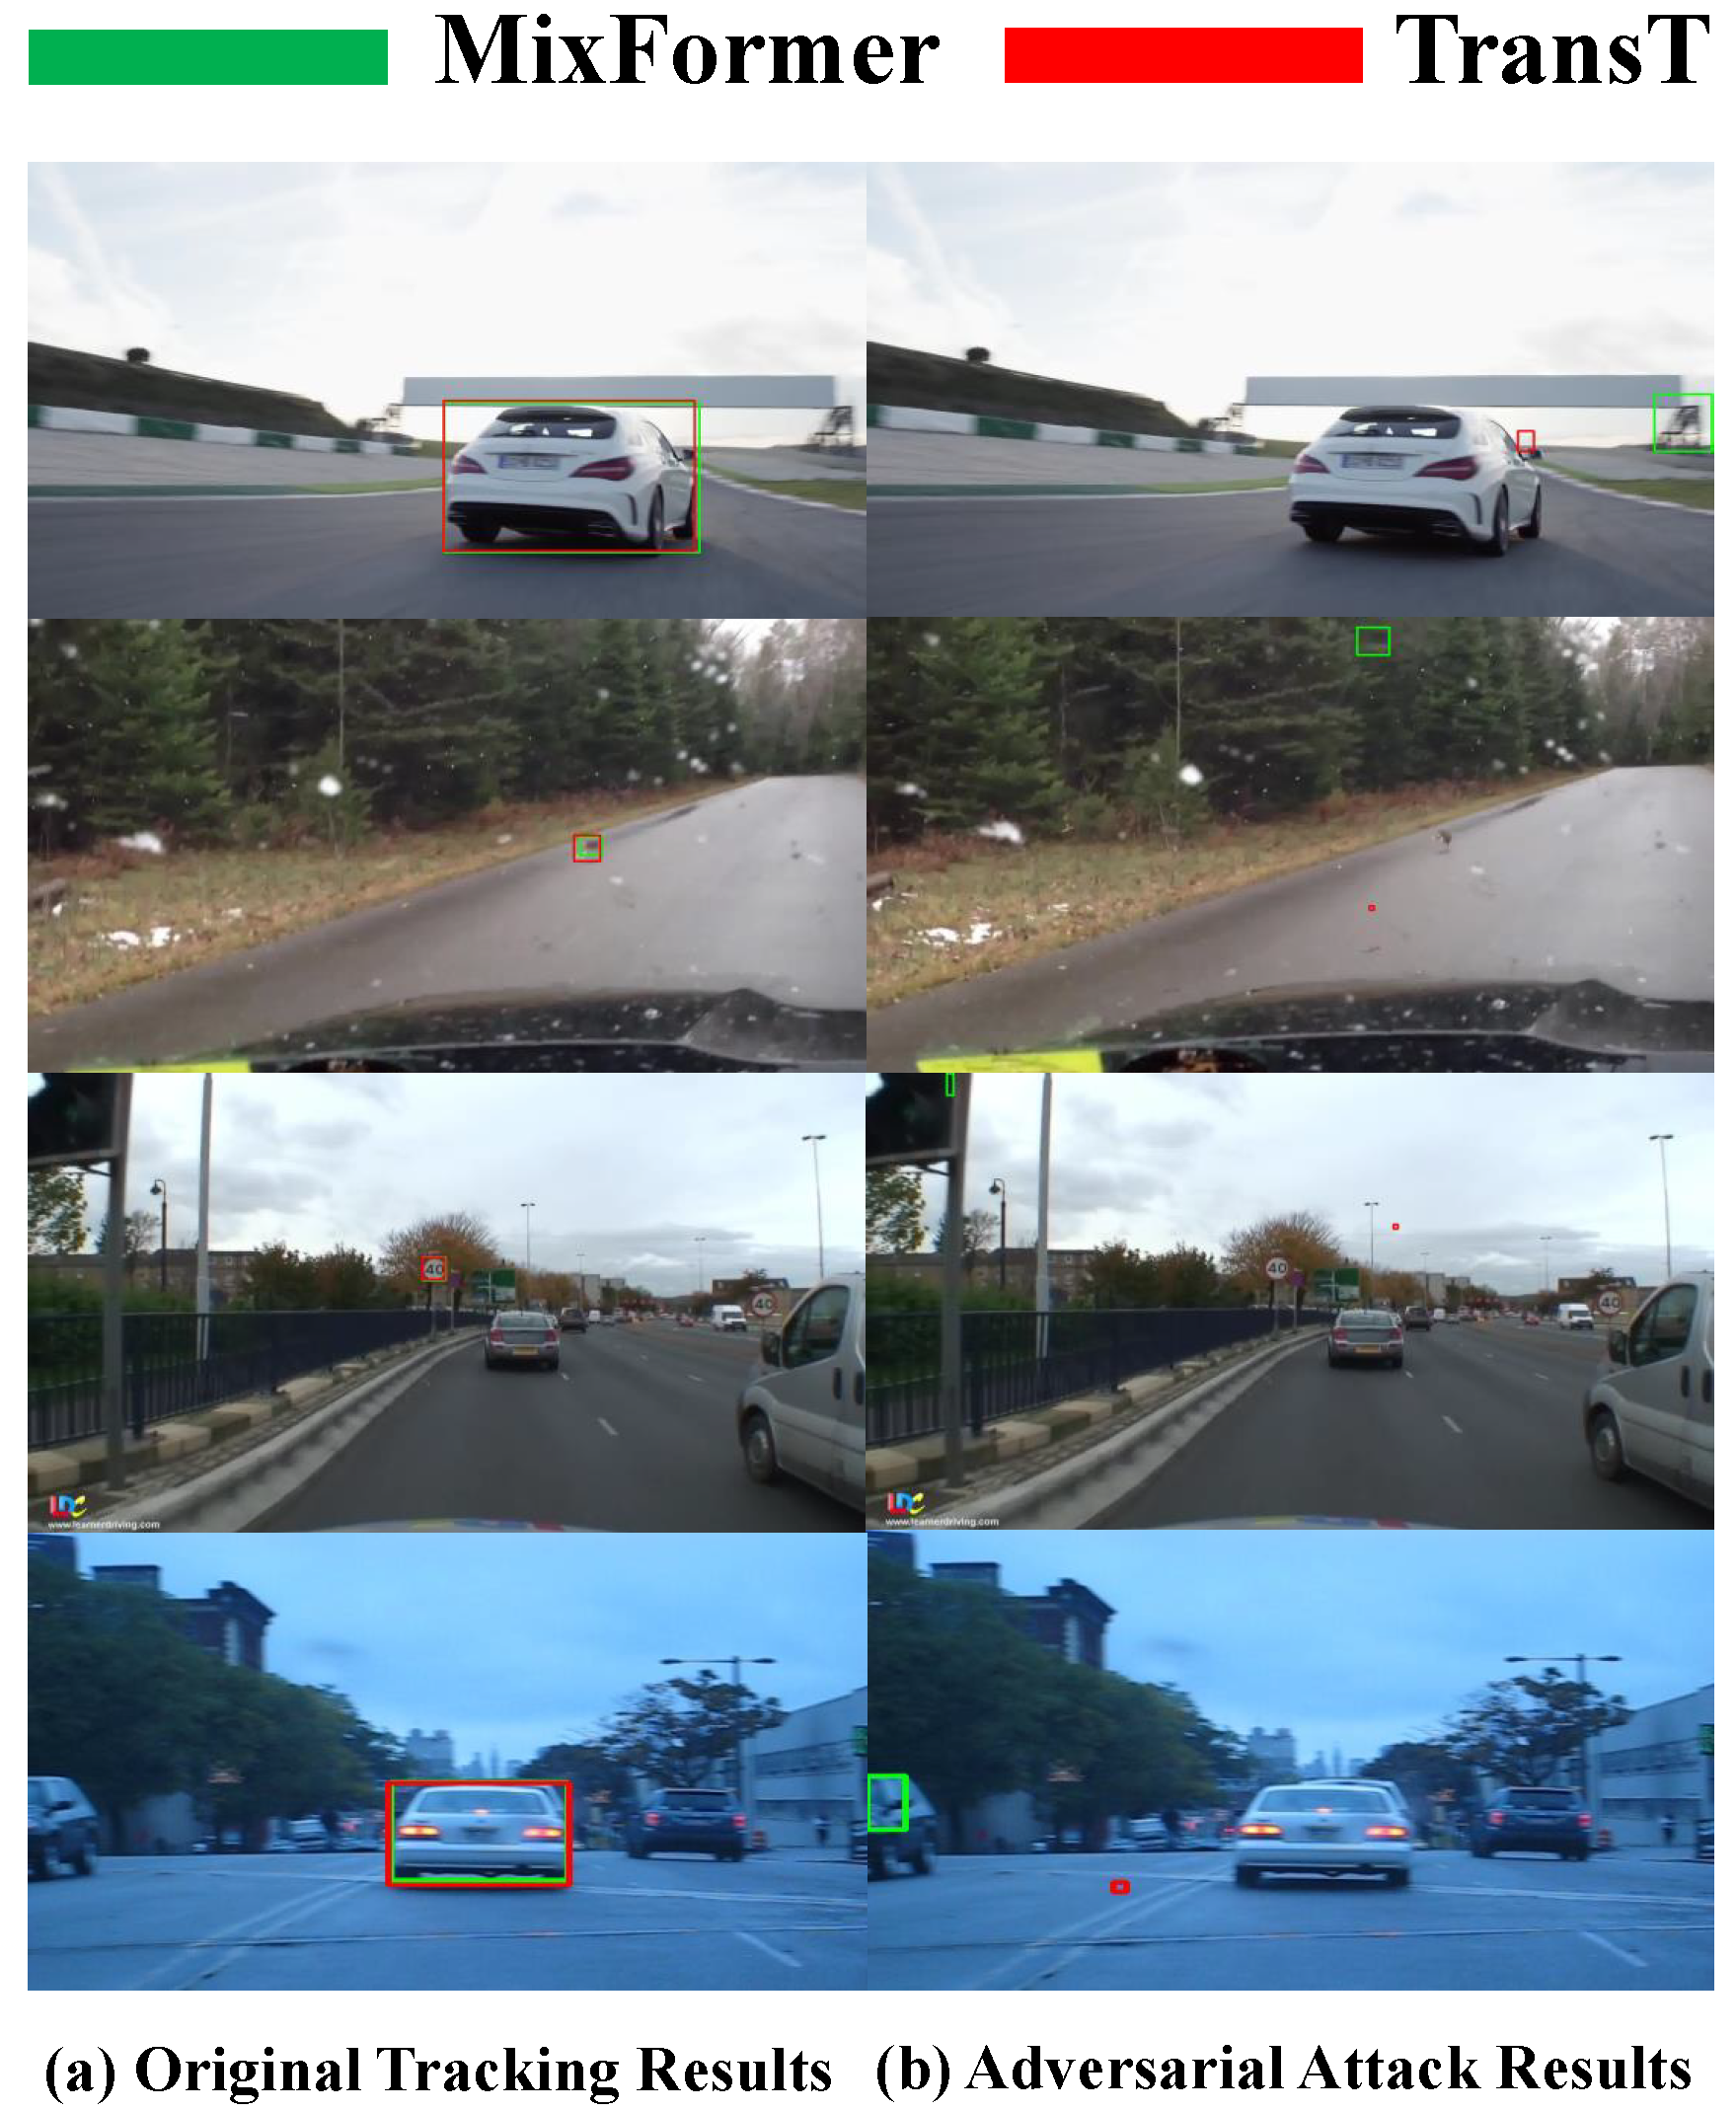
3.1. Attack Principles
The attack principles of three attack methods are analyzed in detail as follows.
Cooling-shrinking attack’s principle. In the cooling-shrinking attack, the proposed adversarial perturbation generator aims to deceive the SiamRPN++ tracker by making the target invisible and leading to tracking drift. This is achieved by training the generator with a cooling-shrinking loss. The generator is designed to attack either the search regions or the template, where the search regions are the target located, and the template is given in the initial frame.
The designed cooling-shrinking loss is composed of the cooling loss to interfere the heat maps , and the shrinking loss to interfere the regression maps , where the heat maps and the regression maps are important components of the SiamRPN++ tracker.
In the generator, the cooling loss is designed to cool down the hot regions where the target may exist on, causing the tracker to lose the target, and the shrinking loss is designed to force the predicted bounding box to shrink, leading to error accumulation and tracking failure.
IoU attack’s principle. The IoU attack method aims to decrease the IoU scores between the predicted bounding boxes and ground truth bounding boxes in a video sequence, indicating the degradation of tracking performance. It is designed to counter existing black-box adversarial attacks that target static images for image classification. Unlike the existing black-box adversarial attacks, the IoU attack generates perturbations by considering predicted IoU scores from both current and previous frames. By decreasing the IoU scores, the IoU attack reduces the frame-by-frame accuracy of coherent bounding boxes in video streams. During the IoU attack, learned perturbations are utilized and transferred to subsequent frames to initiate a temporal motion attack. In the IoU attack, there is an increase in noise level as the IoU scores decrease, but this relationship is not linear: in an IoU attack, a clean input frame is subjected to the addition of heavy uniform noise, resulting in a heavily-noised image with a low IoU score. During the addition process, the IoU scores gradually decline as the noise level increases.
The following employed strategy achieves the effectiveness and imperceptibility of the IoU attack in video streams: there exists a positive correlation between the direction of decrease in IoU and the direction of increase in noise. However, this relationship is not linear. The IoU attack gradually reduces the IoU score for each frame in a video stream by adding the minimum amount of noise. It identifies the specific noise perturbation that results in the lowest IoU score among an equal amount of noise levels through orthogonal composition.
RTAA attack’s principle. The RTAA attack takes temporal motion into consideration over the estimated tracking results frame-by-frame.
The RTAA attack creates a pseudo classification label and a pseudo regression label, and both labels are used to design the adversarial loss. The adversarial loss is set to make and be the same when correct and pseudo labels are used separately, where the denotes the binary classification loss, and the is the bounding box regression loss, and they are two important parameters in deep visual tracking algorithms.
In deep visual tracking, the binary classification loss is a measure used to evaluate the performance of a visual tracking algorithm. Visual tracking is often framed as a binary classification problem, where the goal is to distinguish between the target and the background. The binary classification loss function in visual tracking measures the difference between the predicted class probabilities and the true class labels. In this case, the two classes are the target and the background. The loss function is used to train the visual tracking algorithm and adjust its parameters so that it improves its ability to accurately track the target over time. Moreover, the bounding box regression loss in visual tracking is a measure used to evaluate the performance of a visual tracking algorithm in predicting the location and the size of the bounding box that encloses the target. In visual tracking, the goal is to track the target of interest over time, and the bounding box regression loss function is used to adjust the parameters of the tracking algorithm so that it can accurately predict the location and size of the bounding box that encloses the target in each frame of the video sequence.
3.2. Advantages and Weaknesses of Attacks
Cooling-shrinking attack’s advantages. There are two advantages: (i) the use of a cooling-shrinking loss allows for fine-tuning of the generator to generate imperceptible perturbations while still effectively deceiving the tracker, and (ii) the method is able to attack the SiamRPN++ tracker, which is currently one of the most powerful trackers, achieving the state-of-the-art performance on almost all tracking data sets.
Cooling-shrinking attack’s weaknesses. There are three weaknesses: (i) the method is specifically designed to attack the SiamRPN++ tracker, and may not be effective against other types of trackers, and (ii) the generator is trained with a fixed threshold, so it may not be effective against different scenarios or environments, and (iii) the attack method may have limited use in real-world applications, as adding adversarial perturbations to targets being tracked.
IoU attack’s advantages. There are three advantages: (i) the IoU attack involves both spatial and temporal aspects of target motion, making it more comprehensive and challenging for visual tracking, (ii) the method uses a minimal amount of noise to gradually decrease the IoU scores, making it more effective in terms of computational costs, and (iii) the IoU attack can be applied to different trackers as long as they predict one bounding box for each frame, making it more versatile.
IoU attack’s weaknesses. There are three weaknesses: (i) the exact relationship between the noise level and the decrease of IoU scores is not explicitly modeled, making it difficult to optimize the noise perturbations, (ii) the method involves a significant amount of computation during each iteration, which might affect its efficiency in real-world applications, and (iii) the method relies on the assumption that the trackers use a single bounding box prediction for each frame, which might not always be the case in some complex scenarios.
RTAA attack’s advantages. There are three advantages: (i) the RTAA attack generates adversarial perturbations based on the input frame and the output response of deep trackers, which makes the adversarial examples more effective and realistic, (ii) the attack uses the tracking-by-detection framework, which is widely used in computer vision tasks and helps to increase the robustness of the attack, and (iii) the method can effectively confuse the classification and regression branches of the deep tracker, which results in rapid degradation in performance.
RTAA attack’s weaknesses. There are four weaknesses: (i) the method relies on a fixed weight parameter , which may not be optimal for different types of deep trackers and attack scenarios, (ii) the method uses a random offset and scale variation for the pseudo regression label, which may not be effective for all tracking scenarios, (iii) the method requires multiple iterations to produce the final adversarial perturbations, which increases the computational complexity of the attack, and (iv) the method considers the adversarial attacks in the spatiotemporal domain, which may limit its applicability to other computer vision tasks that do not have a temporal aspect.
3.3. Transformer Tracking Principles
TransT’s principle. Correlation acts as an important role in tracking. However, the correlation operation is a local linear matching process, which easily leads to lose semantic information and falls into local optimum. To address this issue, inspired by transformer architecture, TransT [
13] is proposed with the attention-based feature fusion network, and it combines the template and search region features solely using an attention-based fusion mechanism.
TransT consists of three components: backbone network, feature fusion network and prediction head. The backbone network extracts the features of the template and the search region, separately. With the extracted features, then, the features are enhanced and fused by the proposed feature fusion network. Finally, the prediction head performs the binary classification and bounding box regression on the enhanced features to generate the tracking results.
MixFormer’s principle. To simplify the multi-stage pipeline of tracking, and unify the process of feature extraction and target information integration, a compact tracking framework is proposed in [
14], termed as MixFormer, which is built upon transformers.
MixFormer utilizes the flexibility of attention operations, and uses a mixed attention module, for simultaneous feature extraction and target information integration. This synchronous modeling scheme allows to extract target-specific discriminative features, and performs the extensive communication between the target and search areas. MixFormer simplifies the tracking framework by stacking multiple mixed attention modules, with embedding progressive patches and placing a localization head on top. In addition, to handle multiple target templates during online tracking, an asymmetric attention scheme is designed in the mixed attention module, to reduce computational cost, and an effective score prediction module is proposed to select high-quality templates.
3.4. Investigation Experiments and Analyses
Investigation experiments evaluate the robustness of tracker models based on the transformer framework, namely Transformer and MixFormer, against three distinct adversarial attack methods, and the evaluation is performed on three foundational benchmark datasets: OTB2015 [
10], VOT2018 [
11], and GOT-10k [
12]. The investigated attack methods encompass white-box attack (RTAA attack), semi-white-box attack (CSA attack), and black-box attack (IoU attack). The objective is to comprehensively assess the vulnerability of these trackers under varying degrees of adversarial perturbations, shedding light on their limitations and potential defense strategies. The findings from this study contribute to enhancing the overall reliability and security of transformer-based trackers in real-world scenarios.
Standard evaluation methodologies are adopted on the benchmark datasets. For the OTB2015 [
10] dataset, the one-pass evaluation (OPE) is utilized, which employs two key metrics: precision curve and success curve. The precision curve quantifies the center location error between the tracked results and the ground truth annotations, computed using a threshold distance, such as 20 pixels. The success curve measures the overlap ratio between the detected bounding boxes and the ground truth annotations, reflecting the accuracy of the tracker at different scales.
This study evaluates object tracking algorithms on the VOT2018 [
11] dataset using accuracy, robustness, failures, and expected average overlap (EAO) as evaluation metrics. Accuracy measures the precision of tracking algorithms in predicting the target’s position, while robustness assesses the algorithm’s resistance to external disturbances. Failures count the number of times the tracking process fails, and expected average overlap provides a comprehensive metric considering both accuracy and robustness, calculated by integrating the success rate curve to evaluate the overall performance of the object tracking algorithms.
The average overlap (AO) and success rate (SR) are adopted as evaluation metrics on the GOT-10k [
12] dataset. The average overlap measures the average degree of the overlap between the tracking results and the ground truth annotations, reflecting the accuracy of the tracker’s predictions regarding the target’s locations. The success rate assesses the success detection rate of the tracker at specified thresholds, where the thresholds are set at 0.5 and 0.75. SR
0.5 and SR
0.75 represent the success rate with overlaps greater than 0.5 and 0.75, respectively. A higher SR value indicates that the tracker successfully detects the target within a larger overlapping range.
In
Table 1, Precision is a measure of accuracy, and it is calculated as the Equation
1.
Precision is calculated by taking the reciprocal (1 divided by) of the average center location error across all frames. Each frame’s center location error represents how far off the predicted bounding box’s center is from the ground truth bounding box’s center. This error is found by calculating the Euclidean distance between these two centers for each frame. The Precision is obtained by adding up these errors for all frames and then dividing by the total number of frames (denoted as `f’).
Success measures how well the predicted bounding box overlaps with the ground truth bounding box. To calculate the Success, the reciprocal (1 divided by) of the average overlap degree is taken across all frames. The overlap degree for each frame is determined by dividing the area of intersection between the predicted bounding box and the ground truth bounding box by the area of their union. The Success metric is calculated by adding up these overlap degrees for all frames and then dividing by the total number of frames (`f’).
In the dataset VOT2018 [
11], visual attributes (e.g., partial occlusion, illumination changes) are annotated for each sequence, to evaluate the performance of trackers under different conditions. An evaluation system should detect errors (failures), when a tracker loses the track, and re-initialize the tracker after 5 frames following the failure for effectively utilizing the dataset. Five frames for the re-initialization are chosen, because the immediate initialization after failure leads to subsequent tracking failures. Additionally, since occlusions in videos typically do not exceed 5 frames, this setting is established. It is a distinctive mechanism to enable “reset” or “re-initialize”, where a portion of frames after the reset cannot be used for evaluation.
In
Table 2, the Accuracy metric evaluates how well the predicted bounding box (referred to as
) aligns with the ground truth bounding box (referred to as
) for a given frame in a tracking sequence, denoted as the
frame. This accuracy metric is symbolically represented as
. Furthermore,
represents the accuracy of the
frame within the
repetition of a particular tracking method, where the total number of repetitions is indicated as
. To calculate the average accuracy for this specific tracking method (
tracker), the mean accuracy over all valid frames (
),
, needs to be determined:
is computed as the sum of all
values divided by the total number of valid frames,
, where
t ranges from 1 to
. The Robustness, conversely, gauges how stable a tracking method is when following a target, and a higher robustness value indicates a lower level of stability. The Robustness is quantified by using the following mathematical expression:
is calculated as the sum of tracking failures
in the
repetition of the
tracking method, divided by the total number of repetitions,
. In
Table 3, the “Failures” index counts the instances of tracking failures that occur during the tracking process of a tracking algorithm. These failures are typically related to tracking errors and do not include specific restarts or skipped frame numbers.
In
Table 3, the expected average overlap (EAO), it is denoted as
. This metric is designed to quantify the expected average coverage rate, specifically for tracking sequences up to an intended maximum length (
). To compute the EAO, the average intersection over union (IoU) value is considered, denoted as
, for frames ranging from the first frame to the
frame in the sequence, even including the frames where tracking may have failed, and
represents the total sequence length. In the context of the VOT2018 [
11] dataset, the calculation of expected average overlap involves taking the average of EAO values within an interval
, which corresponds to typical short-term sequence lengths, and the expected average overlap is denoted as
and is calculated by Equation
2.
where the
ranges from
to
, and the
captures the expected average overlap across a range of sequence lengths, providing valuable insights into tracking performance.
In
Table 4, a metric called average overlap (AO) is utilized to gauge the extent of overlap occurring during the tracking process. The AO is determined by assessing the degree of overlap for each individual frame and subsequently computing the average of these individual overlaps. The AO is the average level of overlap, and it takes the sum of the overlap values for each frame, and then it is divided by the total number of frames (
N) in the sequence. Each “
” represents the extent of overlap for the
frame. Additionally,
Table 4 and
Table 5 employ a metric known as success rate (SR) to assess how well the tracker performs under various overlap threshold conditions, and the SR quantifies the ratio of frames in which the tracker successfully keeps track of the target, considering a specific overlap threshold. The SR is a measure of how effectively the tracker follows the target. To compute it, an indicator function (
I) applied to each frame’s overlap value is summed up. If the overlap (
) is greater than or equal to the specified threshold (Threshold),
I equals 1; otherwise, it equals 0. The resulting sum is then divided by the total number of frames (
N) in the sequence. For example,
refers to the scenario where the overlap threshold is set to
, and
corresponds to a threshold of
. These metrics offer valuable insights into how well the tracking system performs at different levels of overlap.
Experimental results are shown as follows:
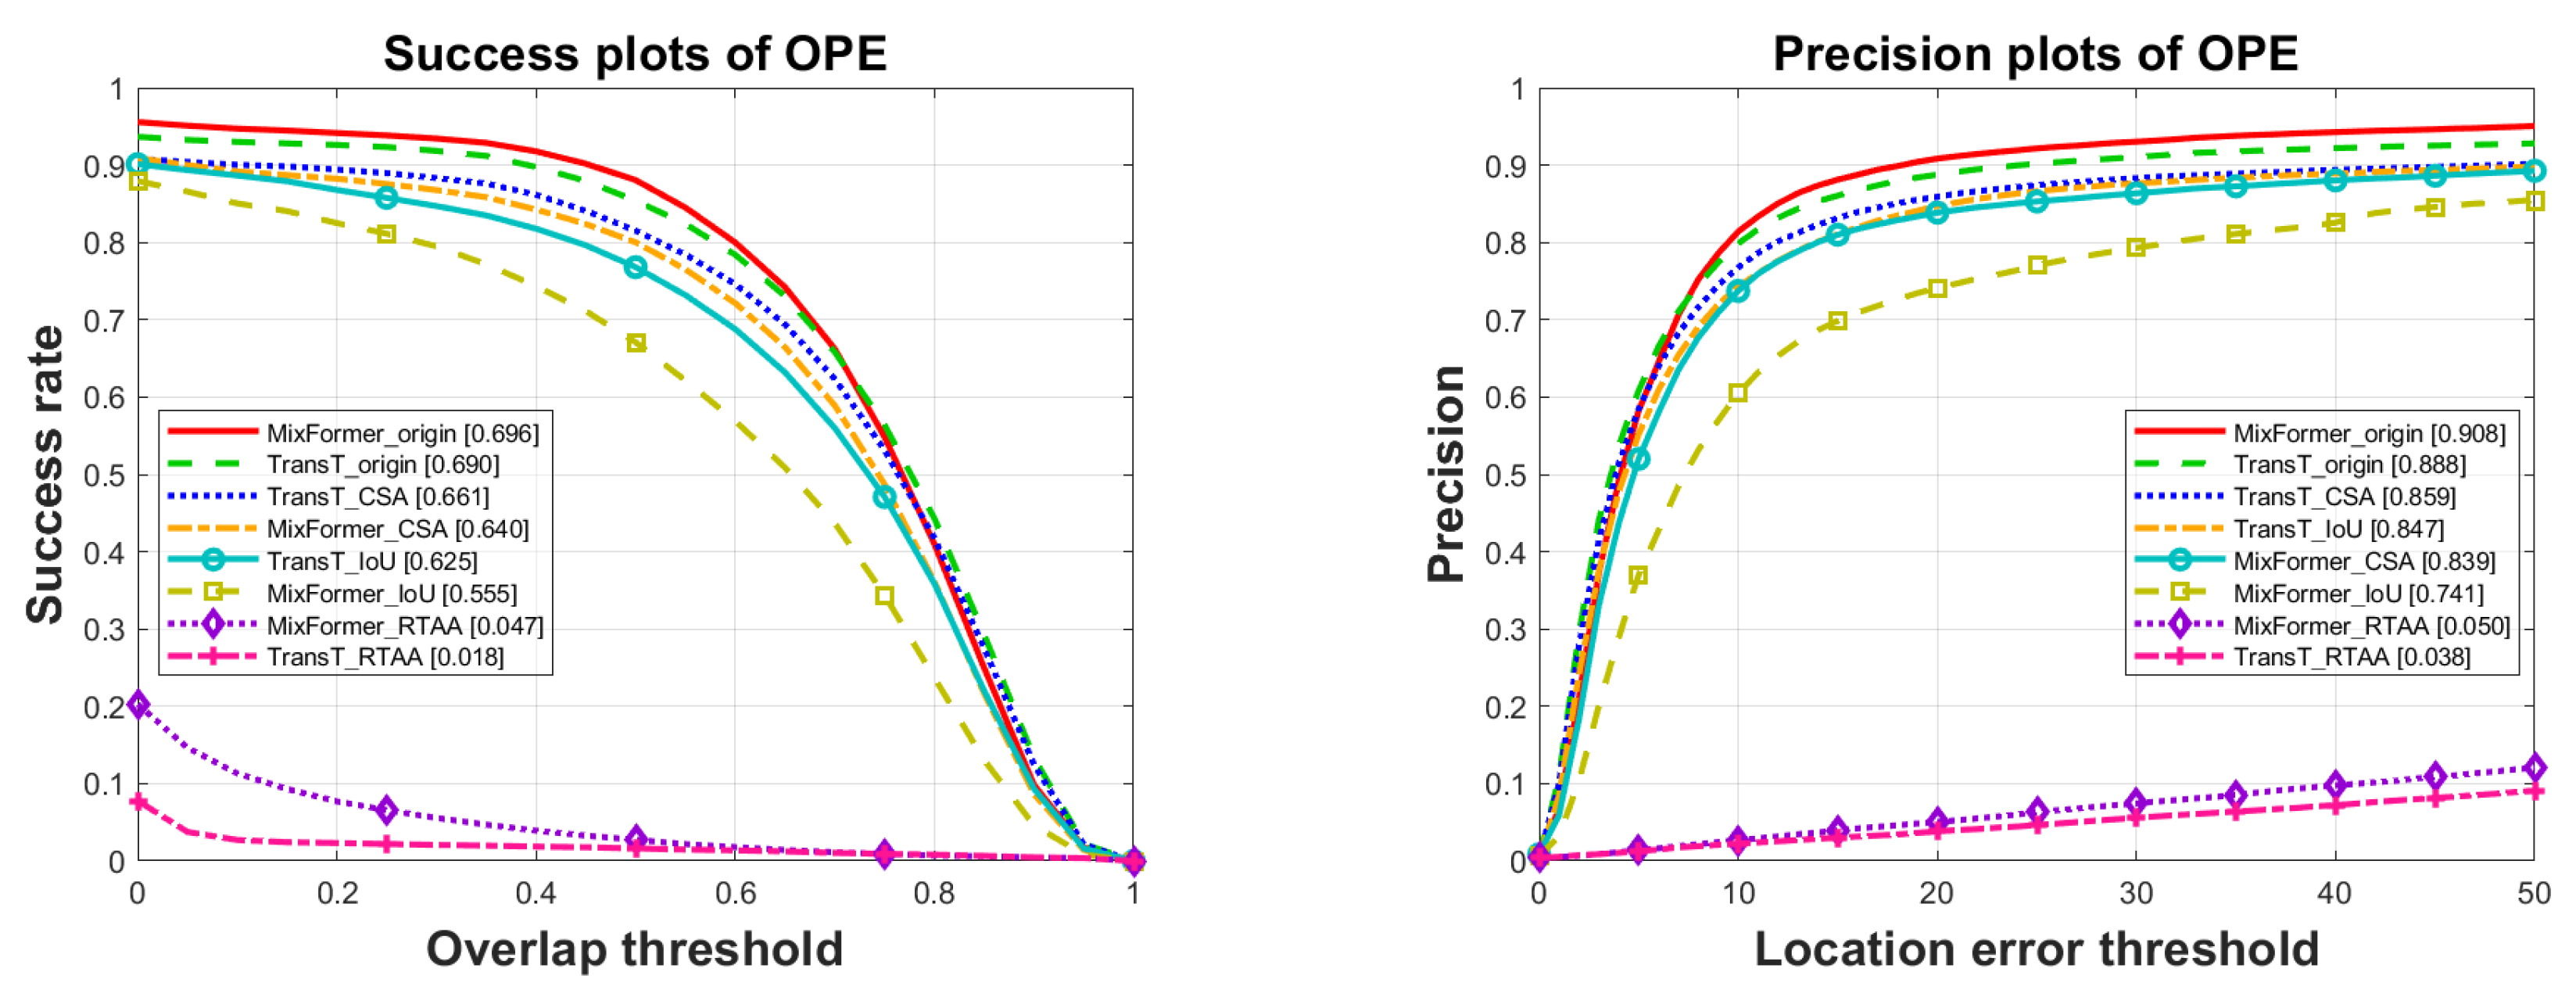
Results on the dataset OTB2015 (shown in Table 1 and Figure 2).
The original results shown in
Table 1 and
Figure 2, along with the results under three types of adversarial attacks, are compared. It is observed that all three attacks have certain impacts. In terms of success rate and precision, the white-box attack RTAA performed the best, causing the decrease of
and
in success rate and the drop of
and
in precision for MixFormer and TransT, respectively. The next is the black-box attack IoU, which resulted in the success rate decrease of
and
, and the precision decrease of
and
for MixFormer and TransT, respectively. Finally, the impact of the semi-black-box attack CSA, trained by SiamRPN++, is the least pronounced, with minimal influence on the tracking results. When attacking the MixFormer and TransT models, they are based on the transformer framework, and their success rates are dropped by
and
, and their precision values are decreased by
and
, respectively.
As shown in
Table 2, the RTAA attack achieves the best performance, followed by the IoU attack, and the CSA attack has the lowest effectiveness. Specifically, both trackers’ accuracies are significantly reduced after being subjected to adversarial attacks, indicating a noticeable deviation between the tracking results after adversarial attacks and the original results. In
Table 3, ranked in the order of RTAA, IoU, and CSA adversarial attacks, the main metric EAO scores for MixFormer decrease by
,
, and
, respectively, while for TransT, they decrease by
,
, and
.
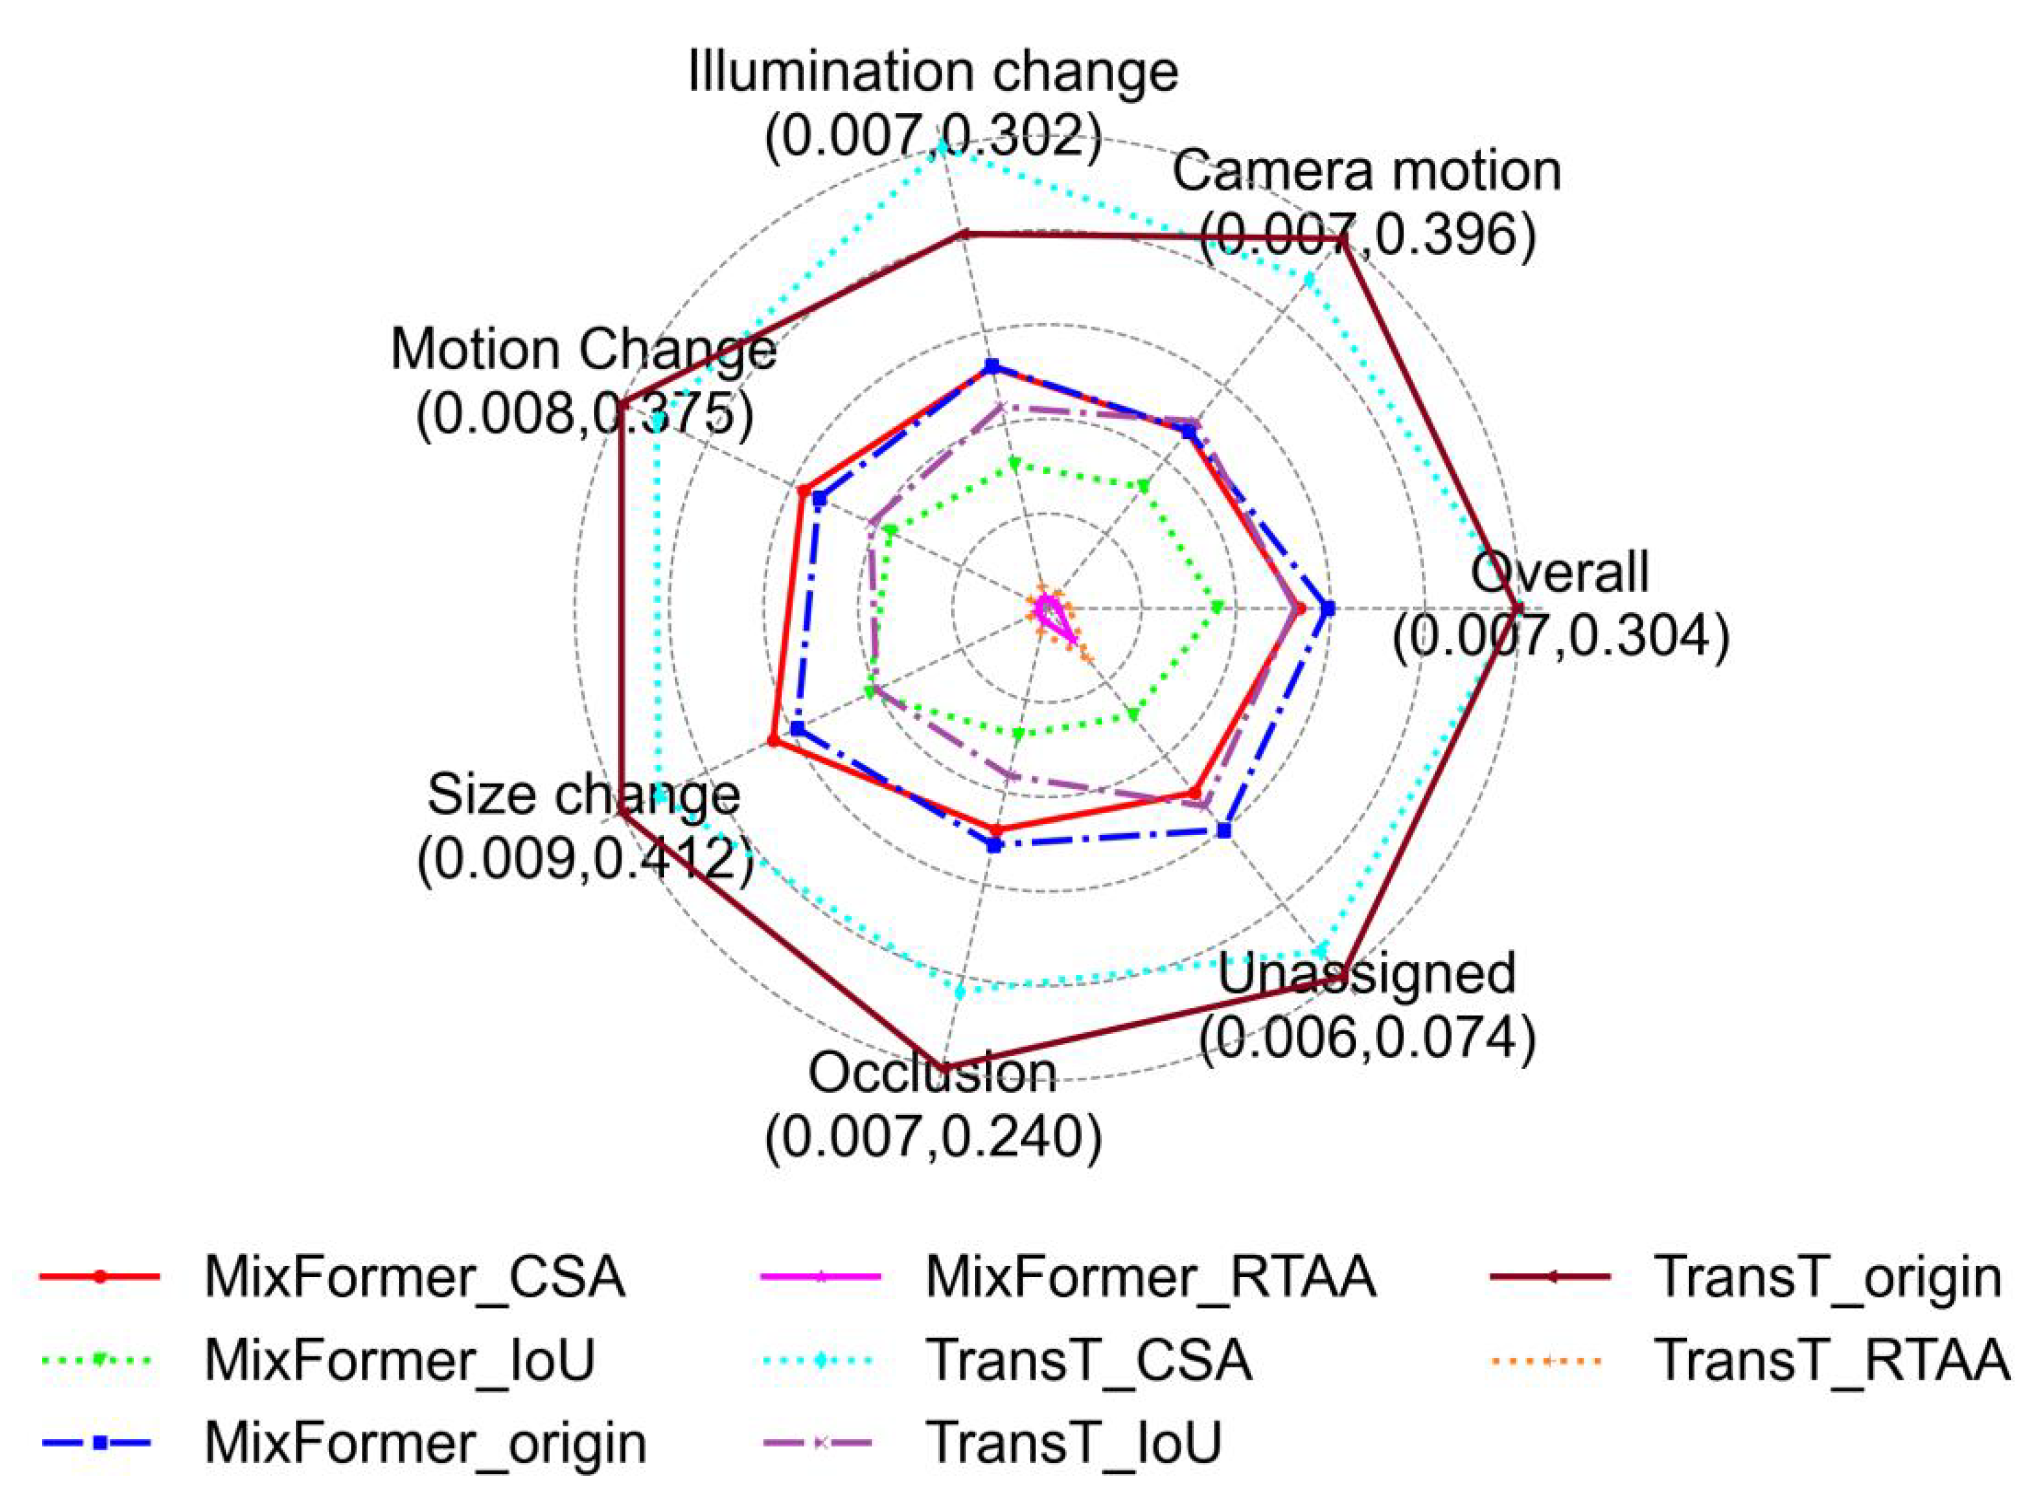
Figure 3 presents the performance of different attributes on the VOT2018 [
11] dataset, comparing the tracking results under three types of adversarial attacks with the original results in various specific scenarios. In the radar chart, the closer a point is to the center, the worse the algorithm performs on the attribute, while points farther from the center indicate better performance.
Upon observing the target radar chart on the VOT2018 [
11] dataset, a decline is clear in tracking performance when facing the three types of adversarial attacks, including scenarios involving occlusion, unassigned and overall. Among them, the RTAA attack has the strongest effect, as it exhibits nearly the worst performance in all scenarios, where the preselected box does not cover the tracking target. The IoU attack comes next, showing a comprehensive performance decrease across all scenarios. As for the CSA attack, it exhibits enhancement in certain scenarios, because the CSA attack mainly targets the SiamRPN++ model and exhibits significant attack effectiveness on this model. It means that the transferability of the CSA attack is not good to TransT and MixFormer models.
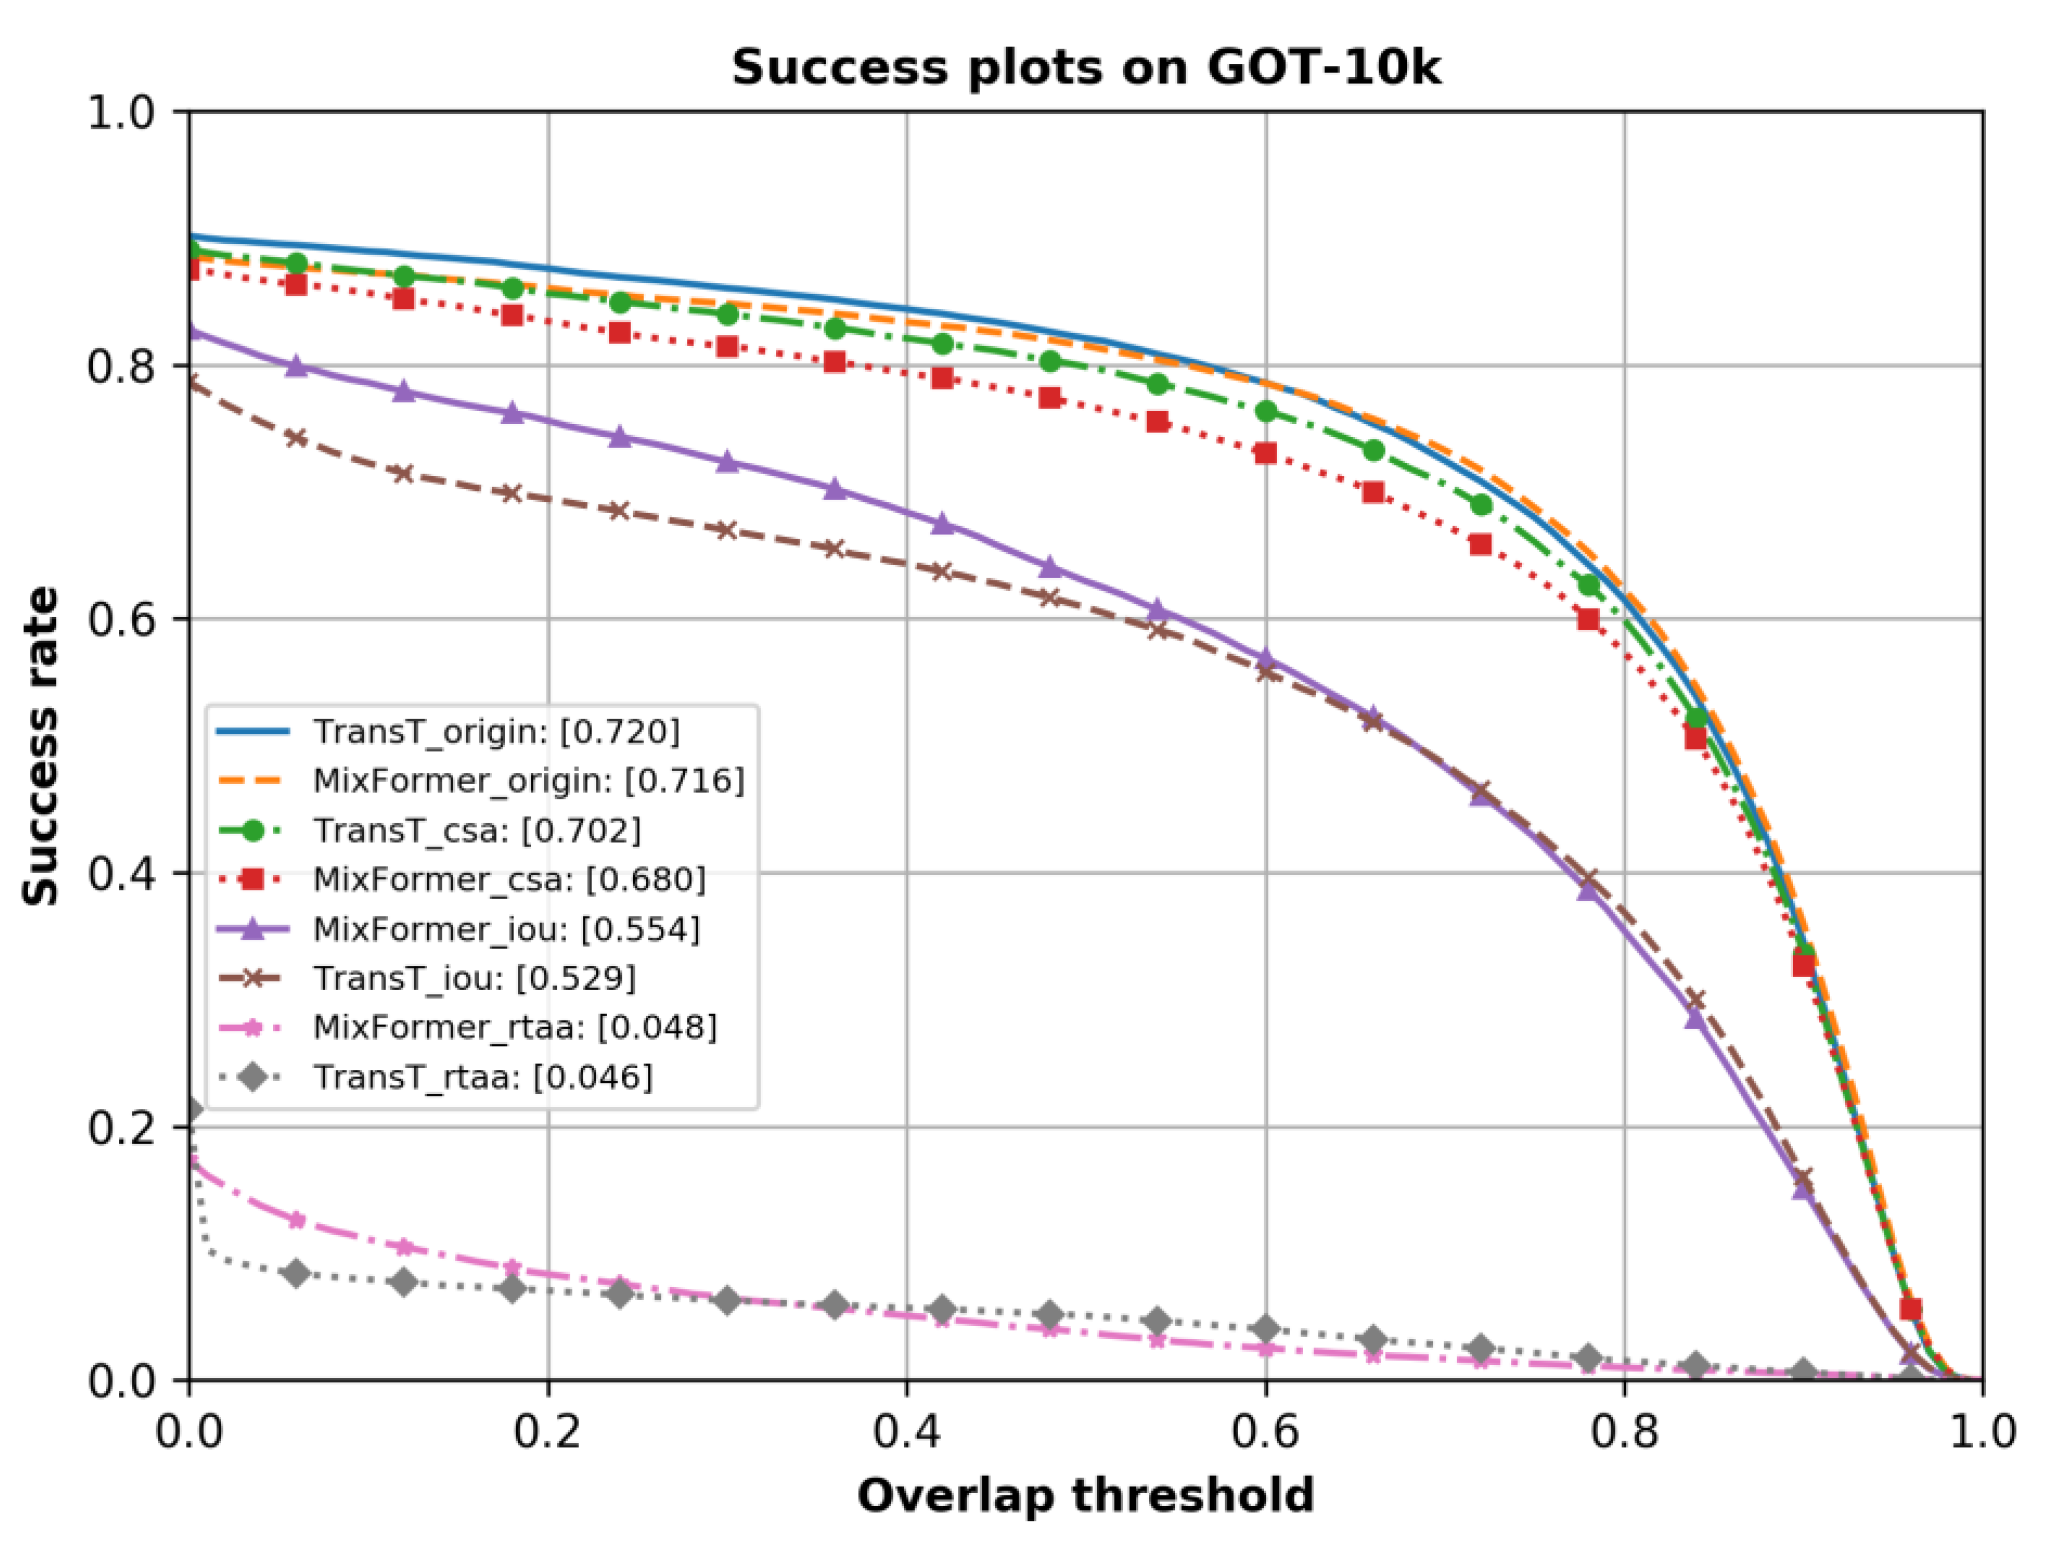
As shown in
Table 4,
Table 5 and
Figure 4, three types of adversarial attacks on both trackers are conducted on the GOT-10k [
12] dataset. By observing the metrics of average overlap (AO), success rate at
overlap (
), and success rate at
overlap (
), it is evident that the overall performance of these trackers has been decreased. Specifically, the MixFormer and TransT trackers experience a decline in the average overlap (AO) of
,
,
, and
,
, and
under the RTAA attack, the IoU attack, and the CSA attack, respectively.


