1. Introduction
The mechanical properties used in the calculation of agricultural silos, such as the internal friction angle, apparent cohesion, friction coefficient, bulk density or Young’s modulus, among others, have been extensively studied for many materials over the years [
1,
2,
3,
4,
5,
6,
7,
8,
9,
10,
11,
12,
13,
14]. The knowledge of these parameters is essential to perform the calculation of structures related to the storage and handling of granular or powdery agricultural materials, either using classical silo theories [
15], or resorting to more modern technologies through the application of numerical methods, either by performing finite [
16,
17,
18,
19,
20,
21,
22,
23] or discrete [
24,
25,
26,
27,
28,
29,
30,
31,
32,
33,
34,
35,
36,
37] element analysis, or a combination of both [
17,
33,
38,
39]. These data refer to samples of the material under normal environmental conditions, i.e., dry samples. However, it has long been known that these material properties depend to a large extent on the moisture content of the material [
31,
40,
41,
42,
43,
44,
45,
46,
47,
48,
49,
50,
51,
52].
In spite of the above, to date not many papers have been published in the literature studying the influence of moisture when the material is subjected to intermediate liquid contents. Most of these studies focus on the analysis of the pendular state, but very few focus on the funicular state [
53,
54,
55,
56]. In humid conditions, water molecules are located between the grains of the material thanks to capillary forces, affecting both the cohesion and the friction of the material [
47,
57,
58]. The capillary bridges established between the grains are determined by the amount of water present in the granular medium. Therefore, it is the amount of water that determines whether the pendular, funicular or capillary states are reached in each case. In addition, as the material moves from a wetter to a drier state, or vice versa, capillary bonds, capillary bridges and/or liquid bridges are created or destroyed. Recent studies are focused on understanding the cohesive behavior of the material under these circumstances [
59,
60,
61]. This behavior conditions the tensile strength, the friction between particles, the role of water as a lubricant, the solid fraction in the medium, etc., which, in turn, determine the behavior of granular materials when subjected to normal and shear stresses. Therefore, there is still a lack of knowledge to better understand the mechanical behavior of unconsolidated granular materials under the influence of moisture.
The goal of this research was, therefore, the determination of the values of internal friction angle, apparent cohesion, dilatancy angle and apparent specific weight of maize (Zea mays) at different moisture contents. The results obtained here will be added to those previously published by other authors except in the case of the dilatancy angle, for which no similar studies have been carried out before. These parameters could be useful for studying the mechanical behavior of maize as its moisture content varies.
2. Materials and Methods
The assays carried out in this work were performed in the geotechnical laboratory of the University Center of Plasencia (University of Extremadura). The material used was maize, provided by the company Leonea Astur de Piensos, S.A. (LESA), located in the province of León (Spain).
The mechanical properties of the material determined in this work were the angle of internal friction (φ), the apparent cohesion (C), the angle of dilatancy (ψ) and the apparent specific weight (γ).
Since the different tests carried out to determine the values of these parameters have been described in detail in previous works [
49,
62], the information relating to the specific conditions of the tests carried out on the maize sample is given below.
2.1. Climatic Chamber
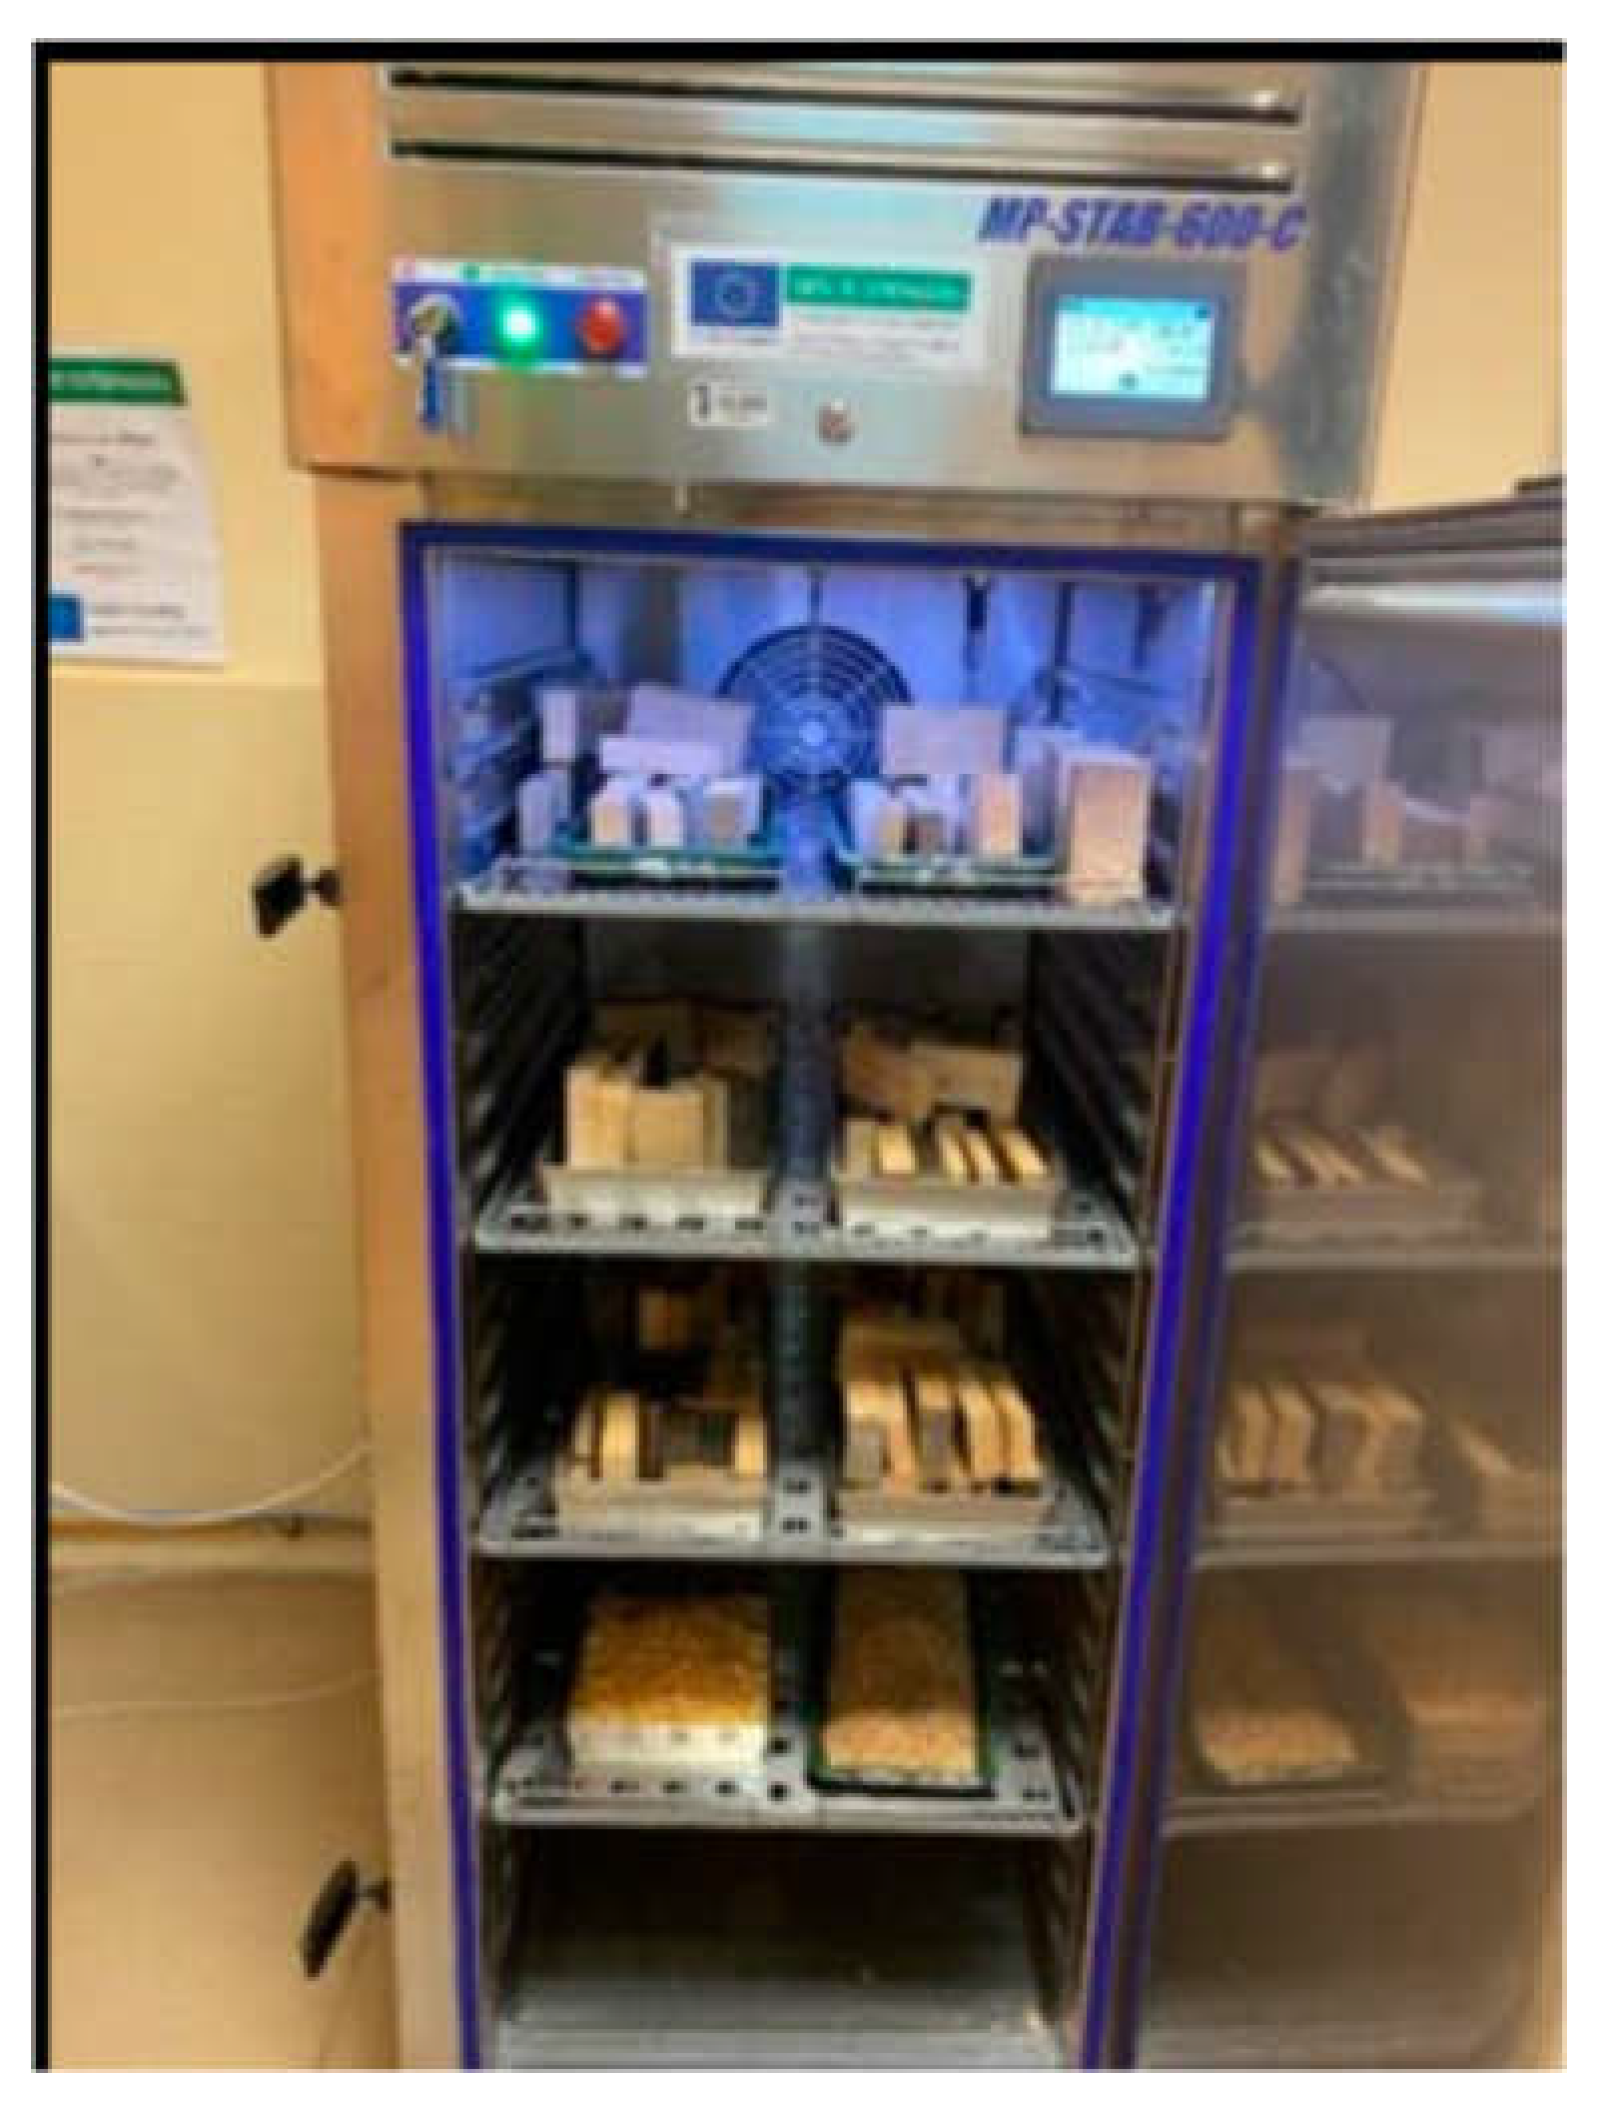
The geotechnical laboratory where the tests were carried out is equipped with a climatic chamber, which allows different humidities to be applied to the samples used in the assays. This chamber has a touch screen that allows to select the relative humidity (expressed as a percentage) and the temperature to be applied to the material deposited inside (in degrees Celsius). In this work, the minimum temperature selected was 20°C and at this temperature, humidity percentages of 35, 45, 65 and 90% were chosen. In addition, in order to obtain a lower moisture content in the material, the maize sample was acclimatized at a temperature of 55°C and a relative humidity of 25%. These temperature and humidity conditions were maintained for a minimum of 72 hours to achieve a homogeneous humidity in the material used immediately before starting the corresponding assays.
Figure 1 shows the climatic chamber used.
2.2. Determination of Moisture Content
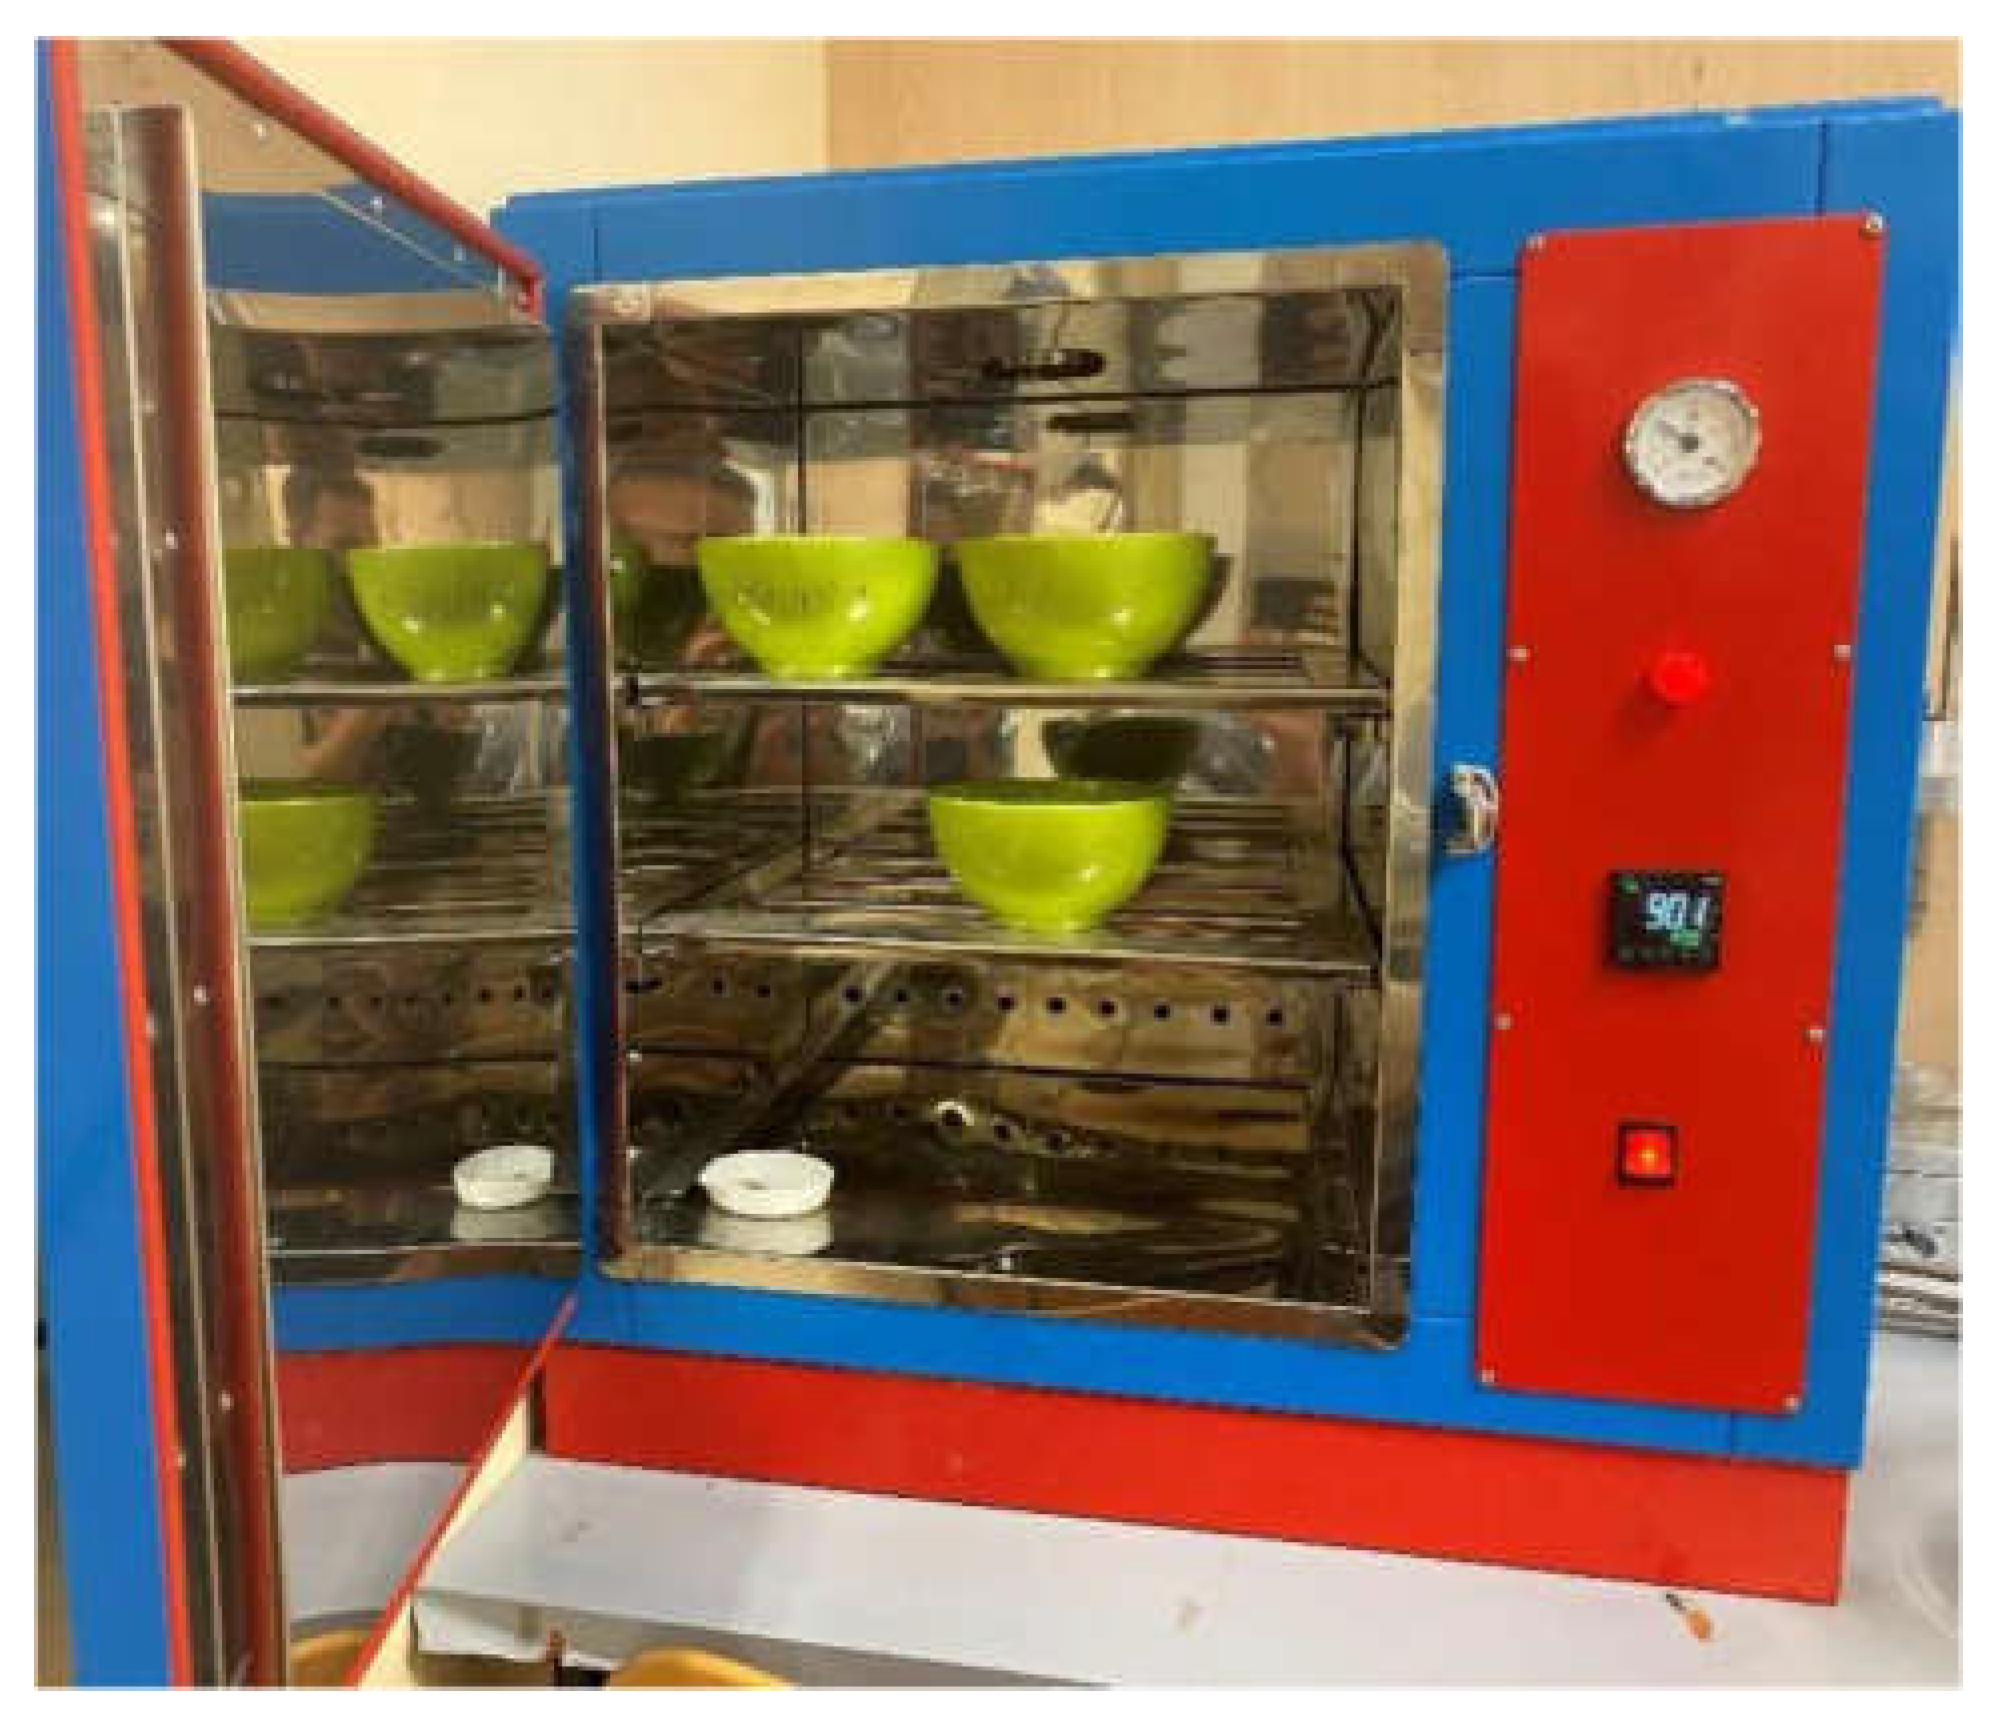
To determine the moisture content of the samples, an oven was used at a temperature of 105-110° C (see
Figure 2). The tests were carried out in accordance with Part 1 of Standard UNE-EN ISO 17892 [
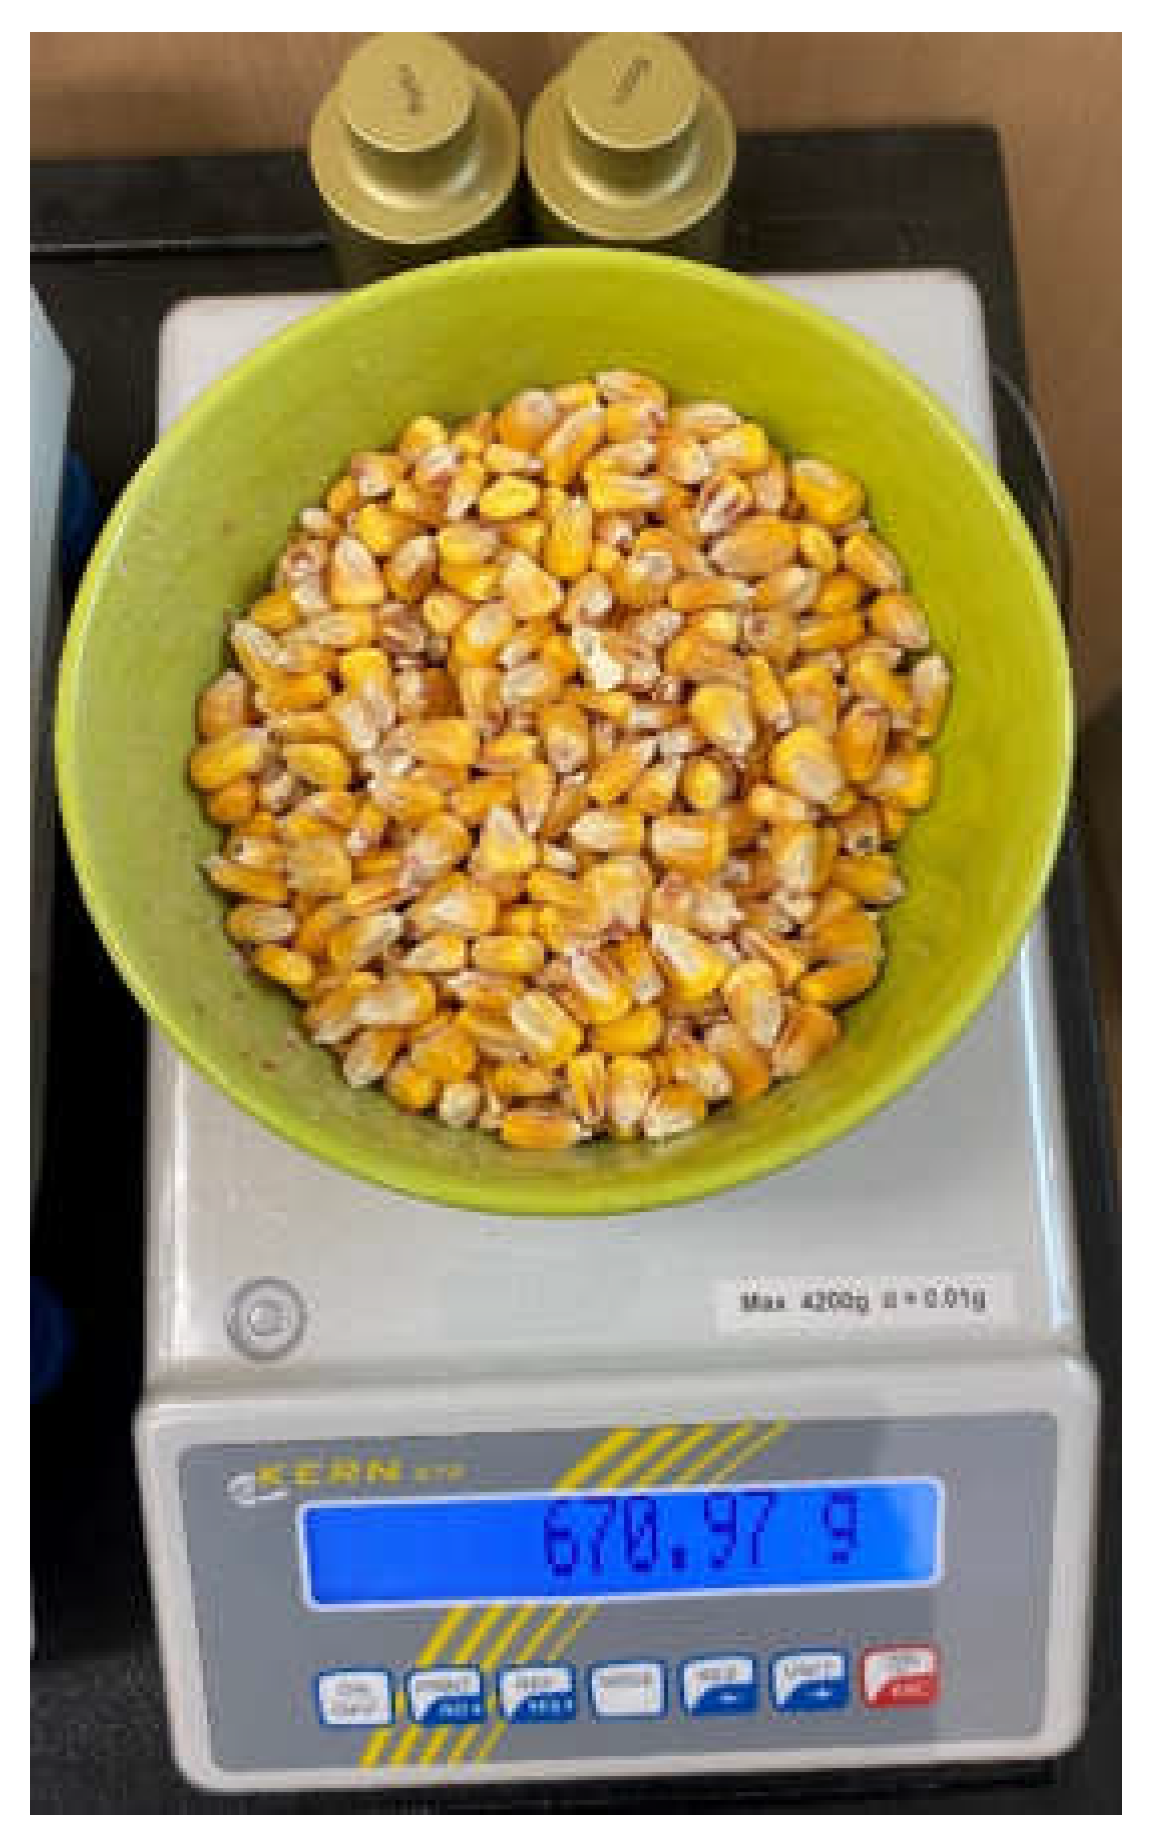
63]. For this purpose, the samples were weighed on an electronic balance with a precision of 0.01 g every 24 hours until a constant weight was reached.
Figure 3 shows the electronic balance used in this work.
2.3. Direct Shear Assays
The mechanical properties determined with this test were the internal friction angle, the apparent cohesion and the dilatancy angle. The corresponding assays were carried out in accordance with Part 10 of the UNE-EN ISO 17892 Standard [
64]. The characteristics of the equipment used, as well as the procedure for processing the data collected and obtaining the corresponding results were described in previous works [
49,
62].
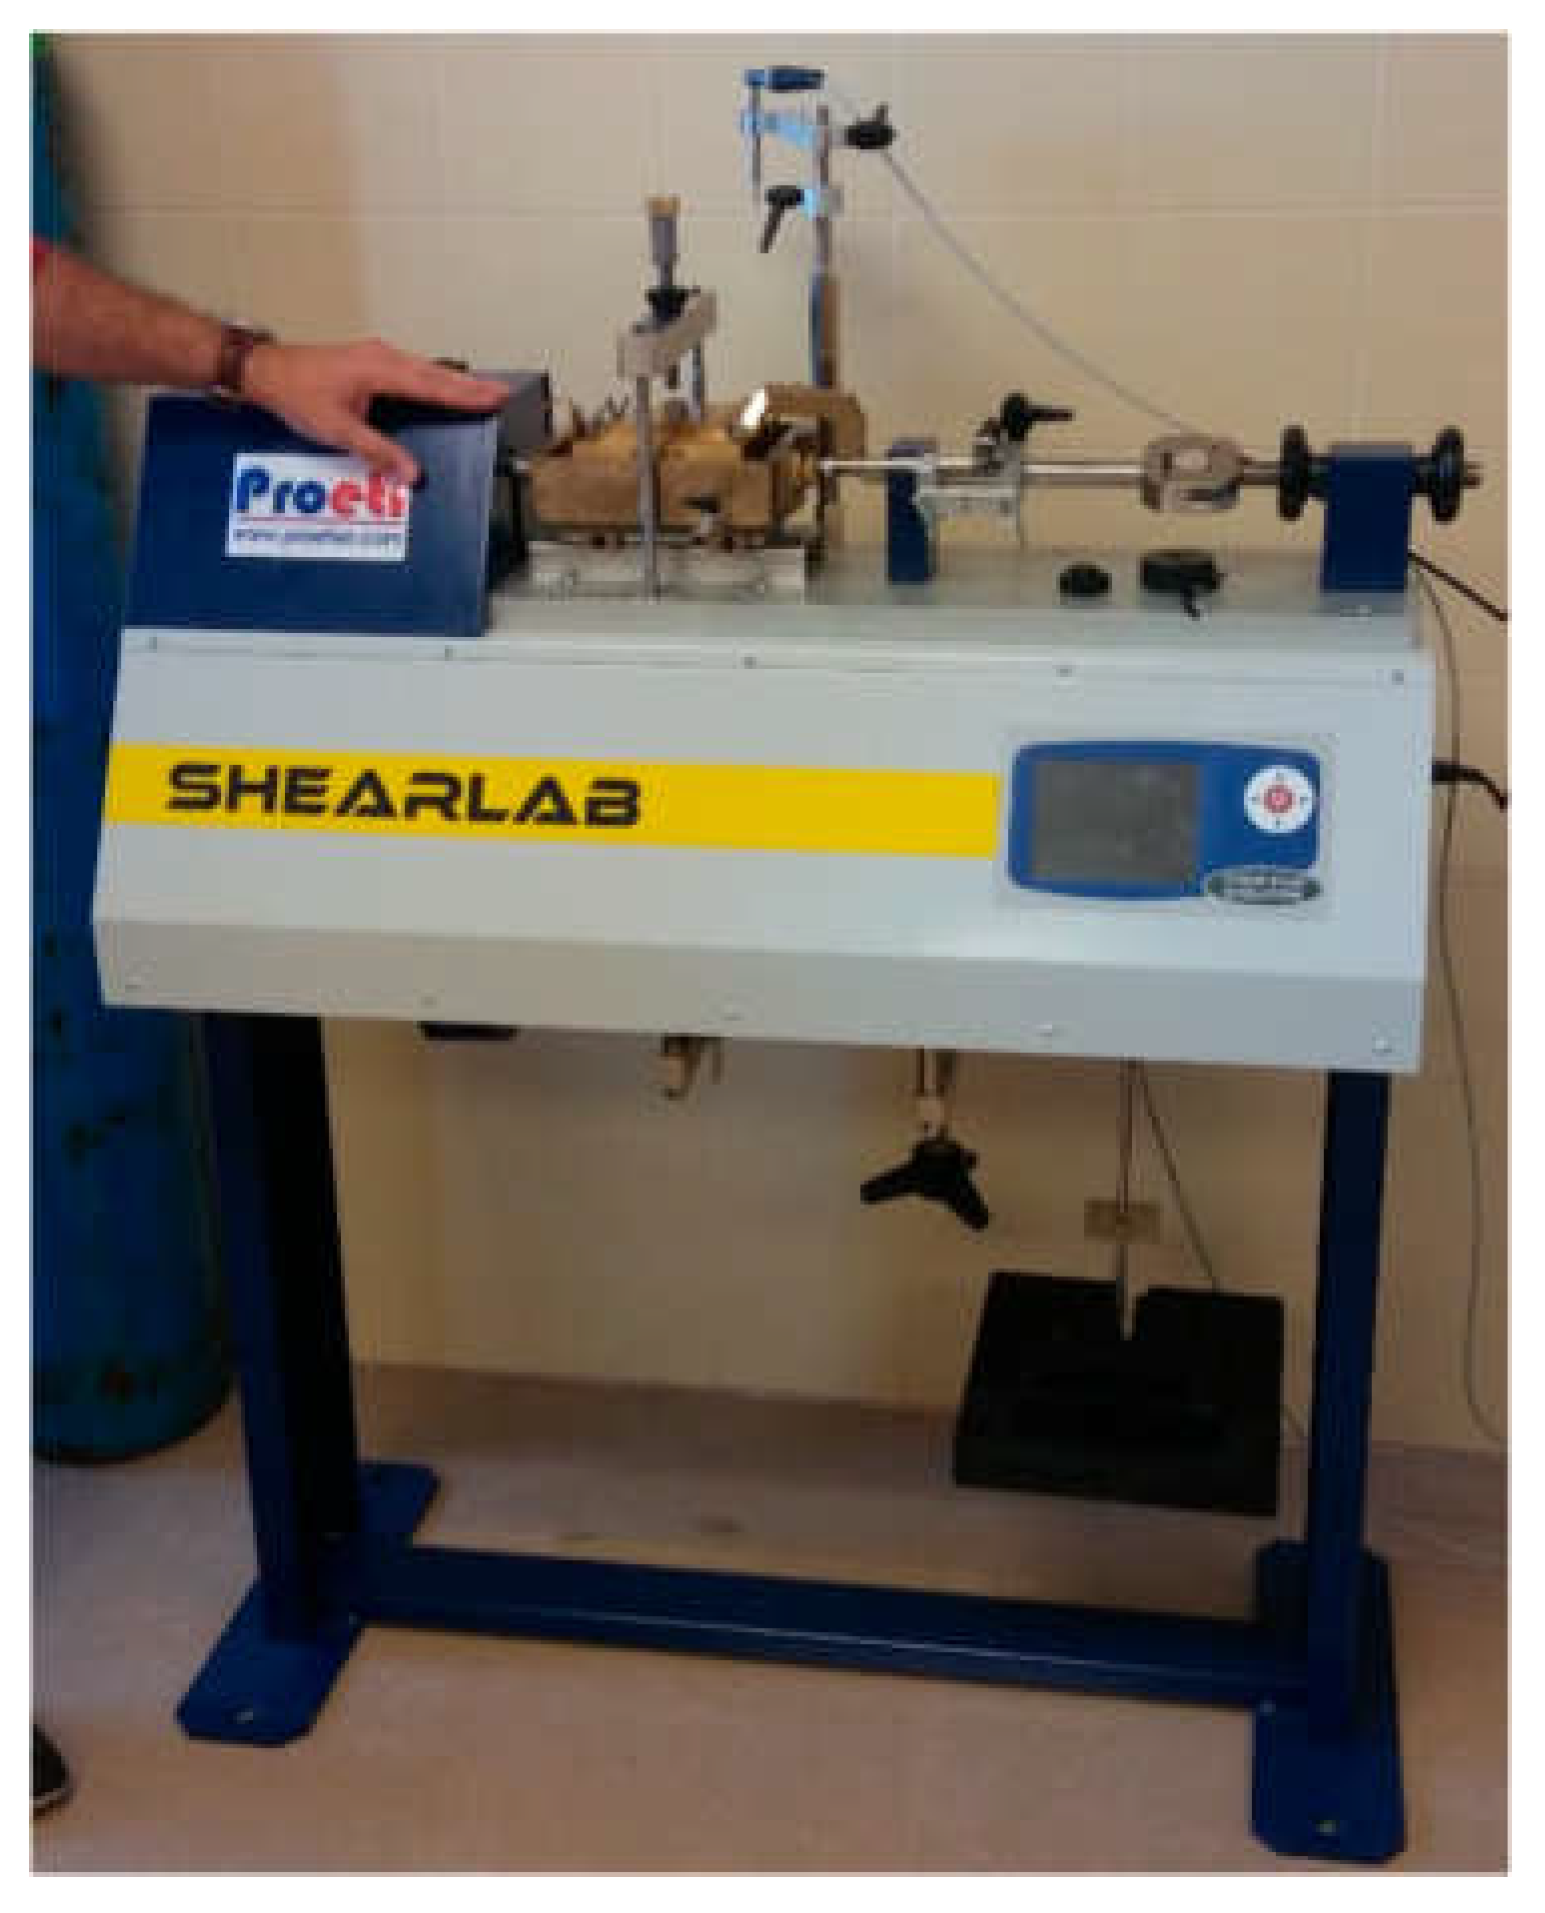
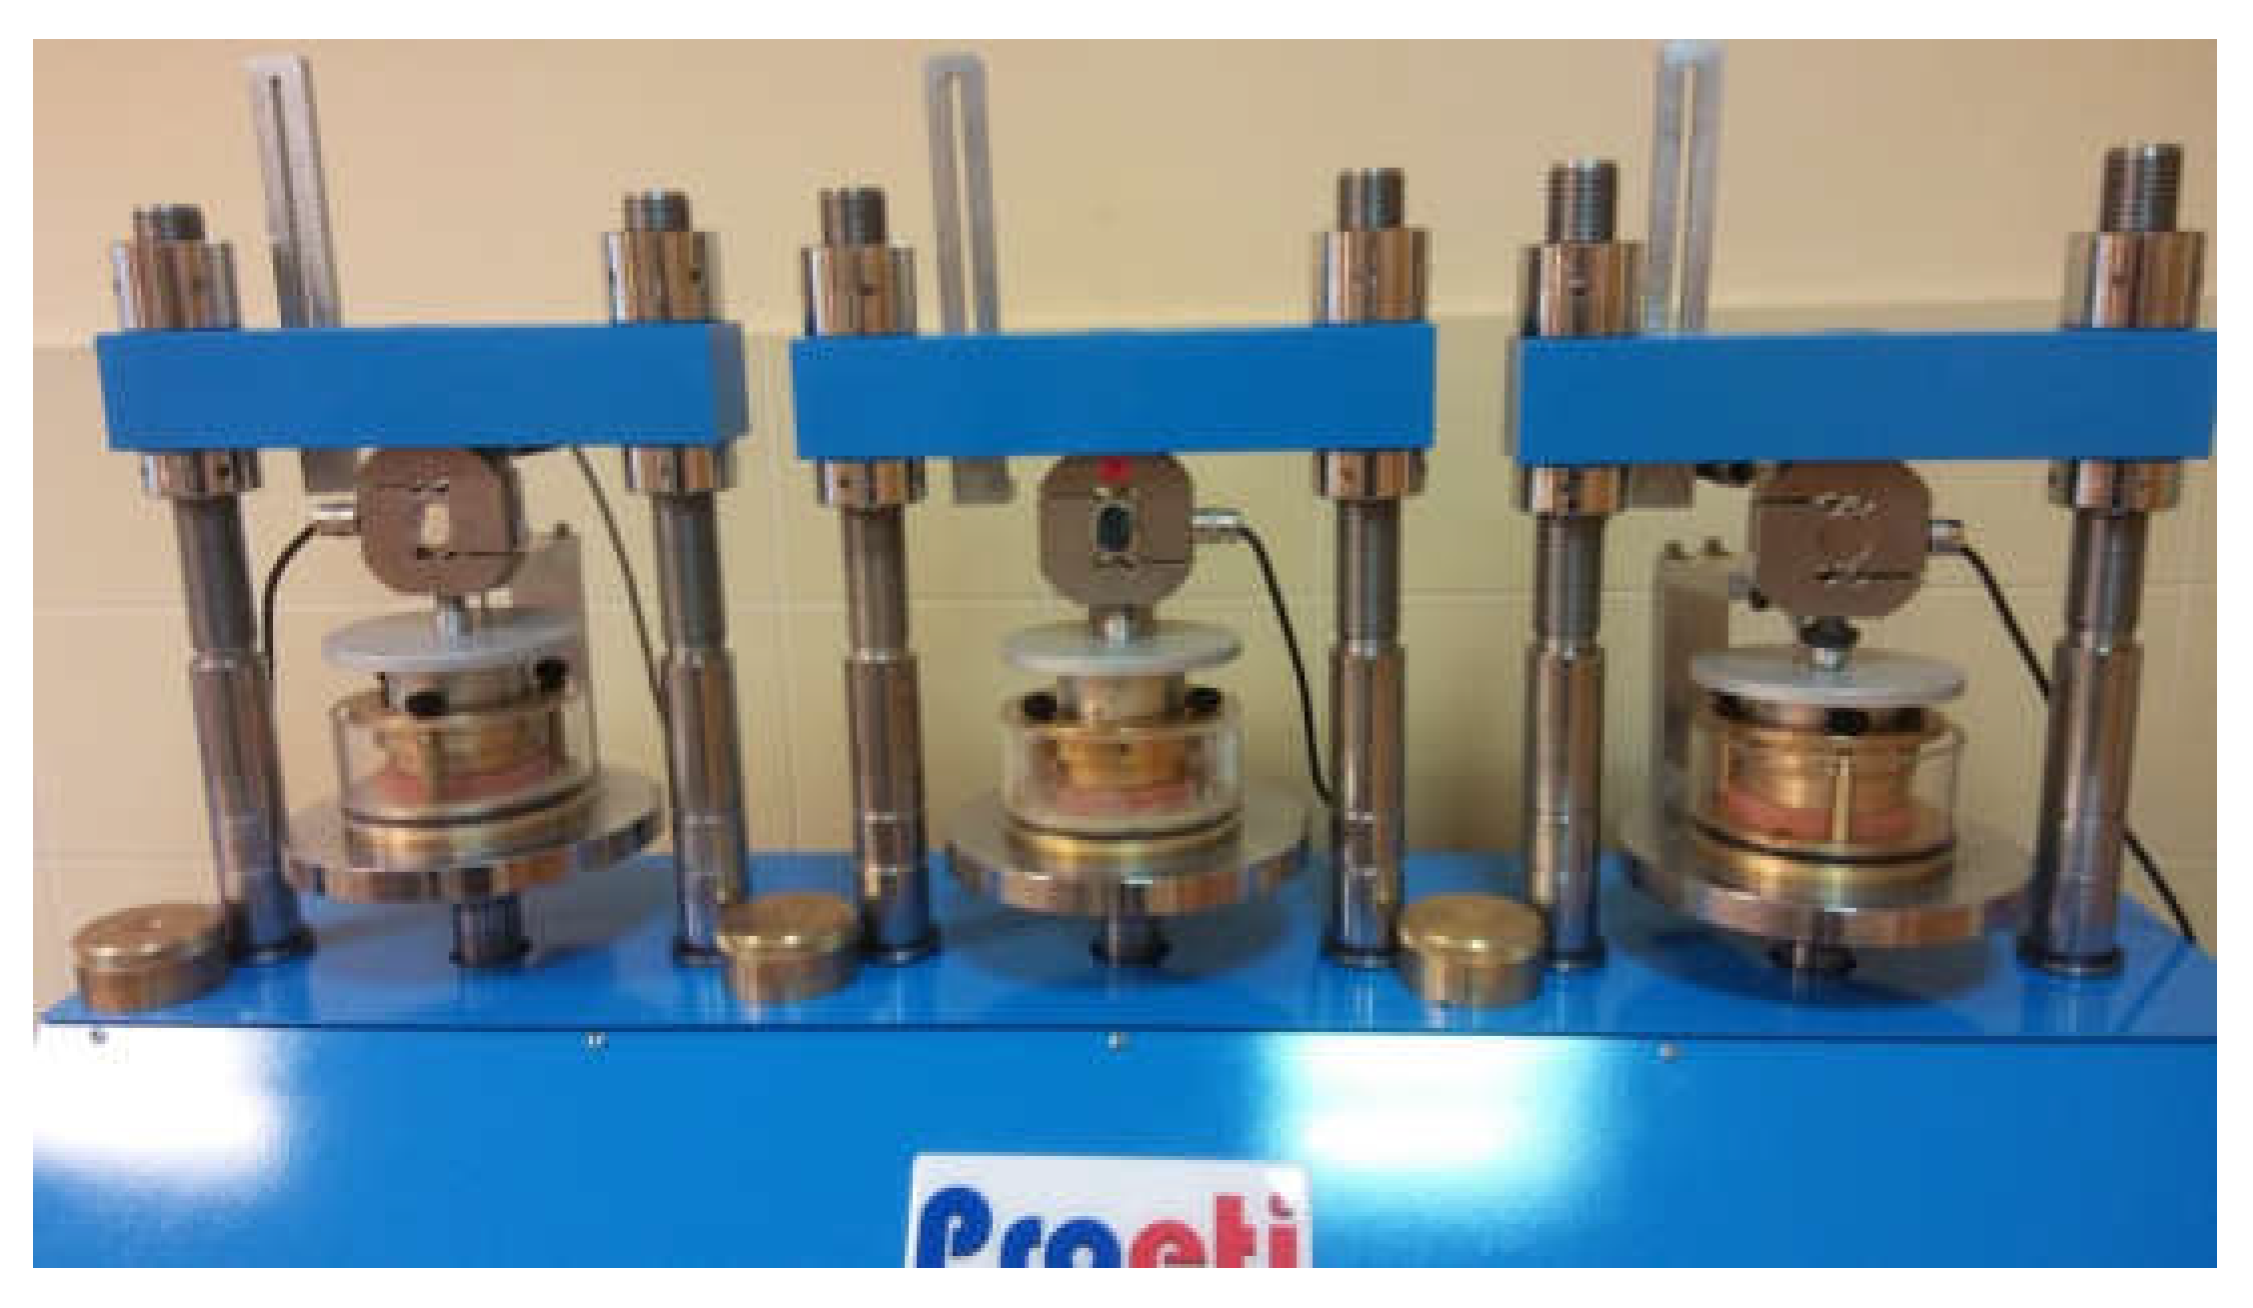
Figure 4 shows an image of the direct shearing equipment used. The normal stresses applied in this work were 10, 20, 50, 100, 200 and 300 kPa. The tests were carried out at a speed of 4 mm/min, since it was considered that this was a sufficiently high speed to minimize the loss of moisture from the sample during the assays, but at the same time to obtain a sufficient amount of data for subsequent data processing and for the graphical representation of the stress-strain curves. Two replications of each test were carried out for each of the normal stresses applied to the maize sample.
2.4. Oedometric Assays
The mechanical property determined with this equipment was the apparent specific weight of the material. The tests were carried out following the specifications in part 5 of the UNE-EN ISO 17892 standard [
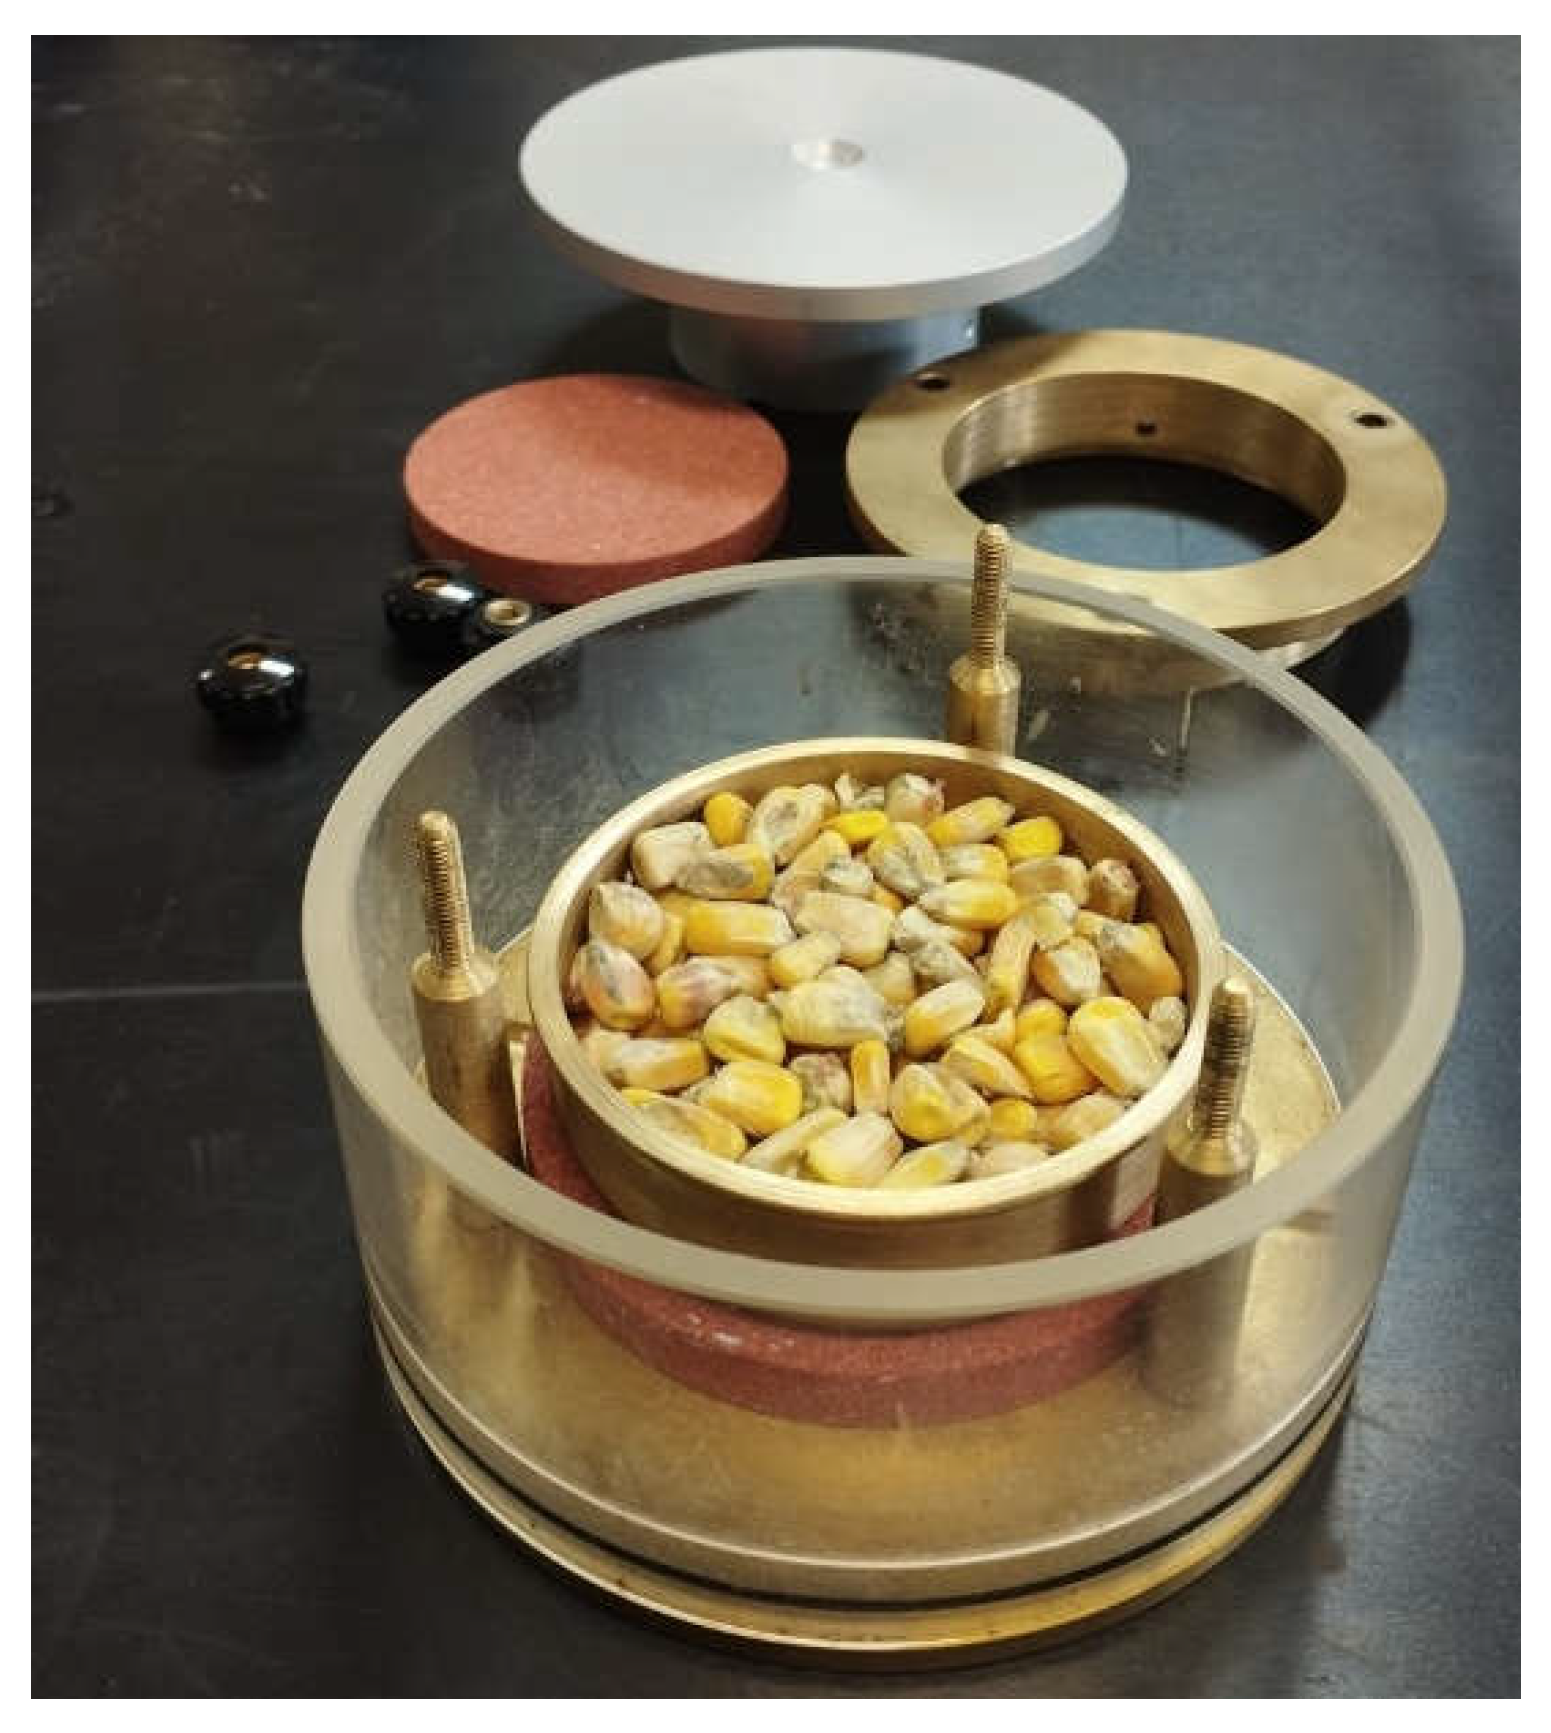
65]. As mentioned for the previous test, since the oedometric equipment, shown in
Figure 5 and
Figure 6, was described in previous works [
49,
62], only the specific characteristics of the assays performed in this work will be discussed below. In order to speed up the tests as much as possible to avoid moisture loss of the material, abbreviated oedometric assays were carried out. For this purpose, the equipment was programmed to apply each loading or unloading step when a maximum deformation of 0.1 mm was reached for three consecutive hours, assuming that primary consolidation was reached in that time interval. The normal stresses applied were 8, 16, 32, 64, 128 and 256 kPa. Three replications were carried out with the maize samples for the different moisture conditions applied to them.
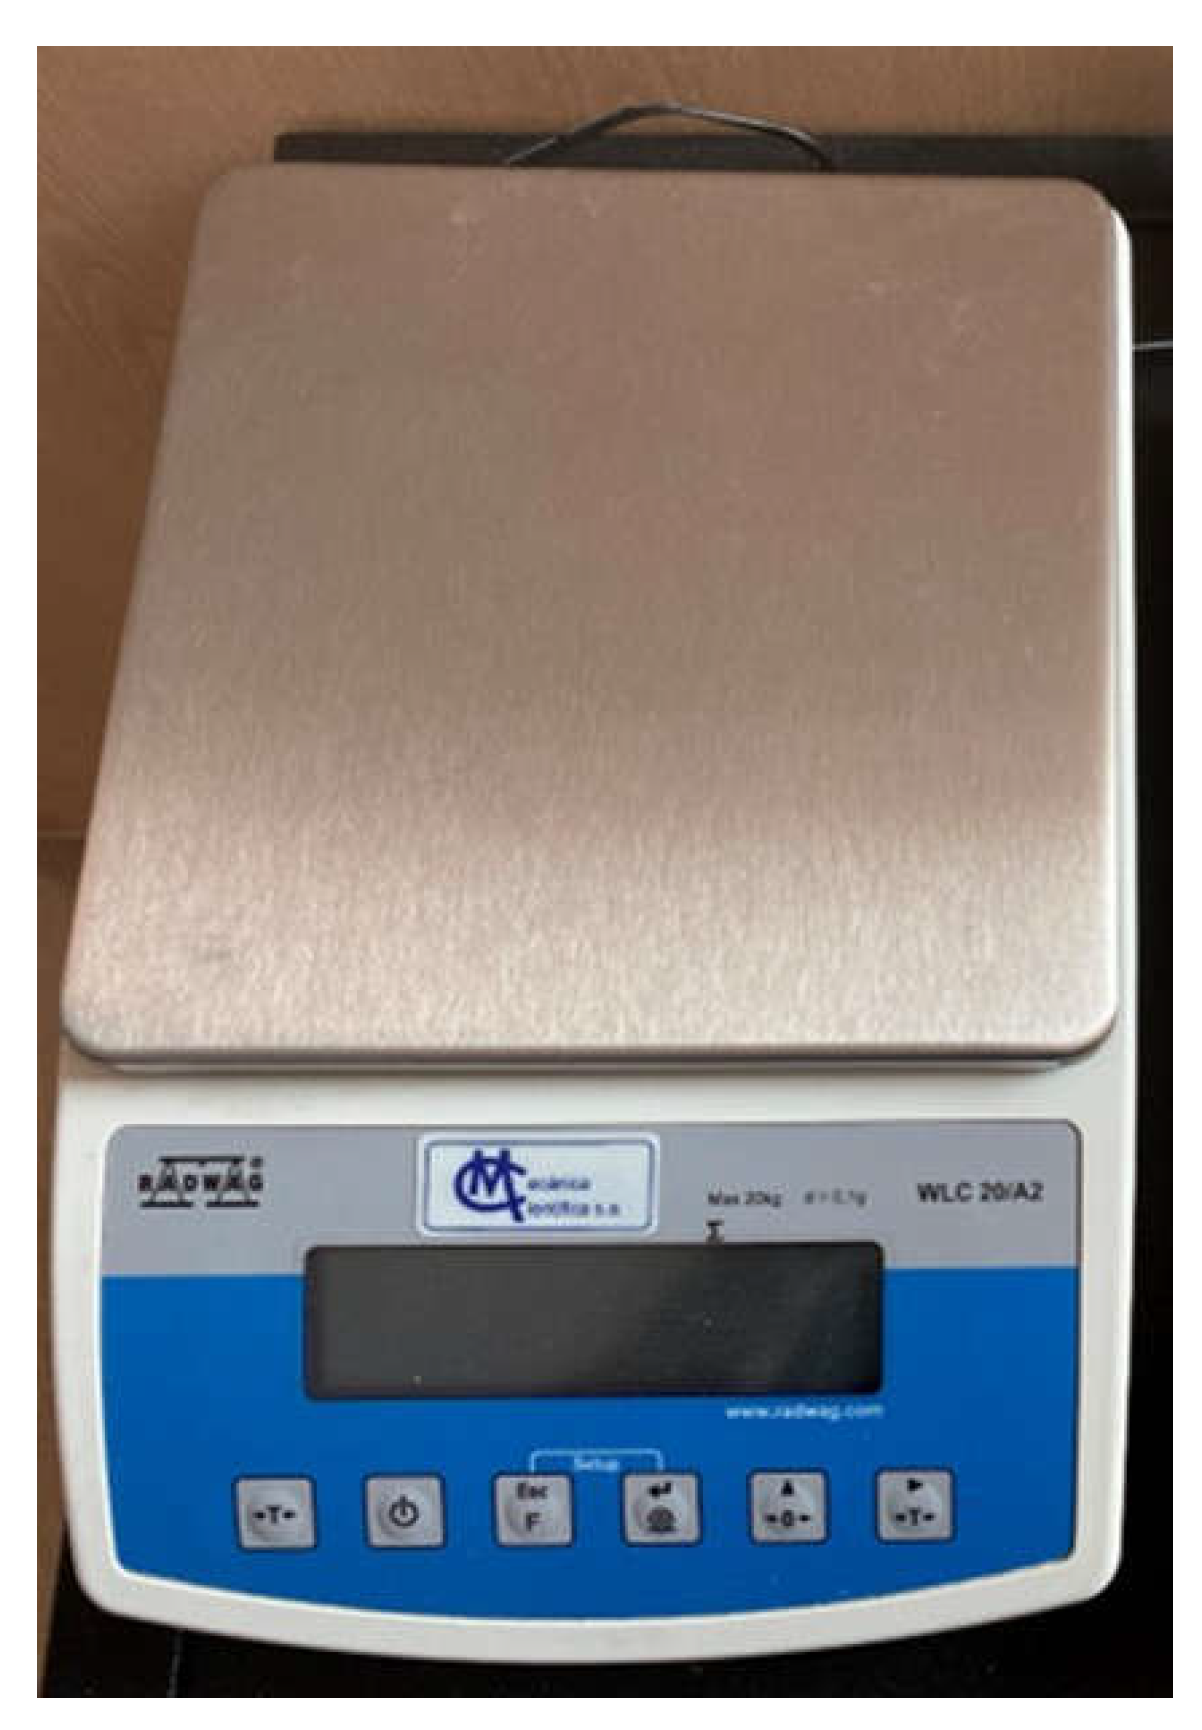
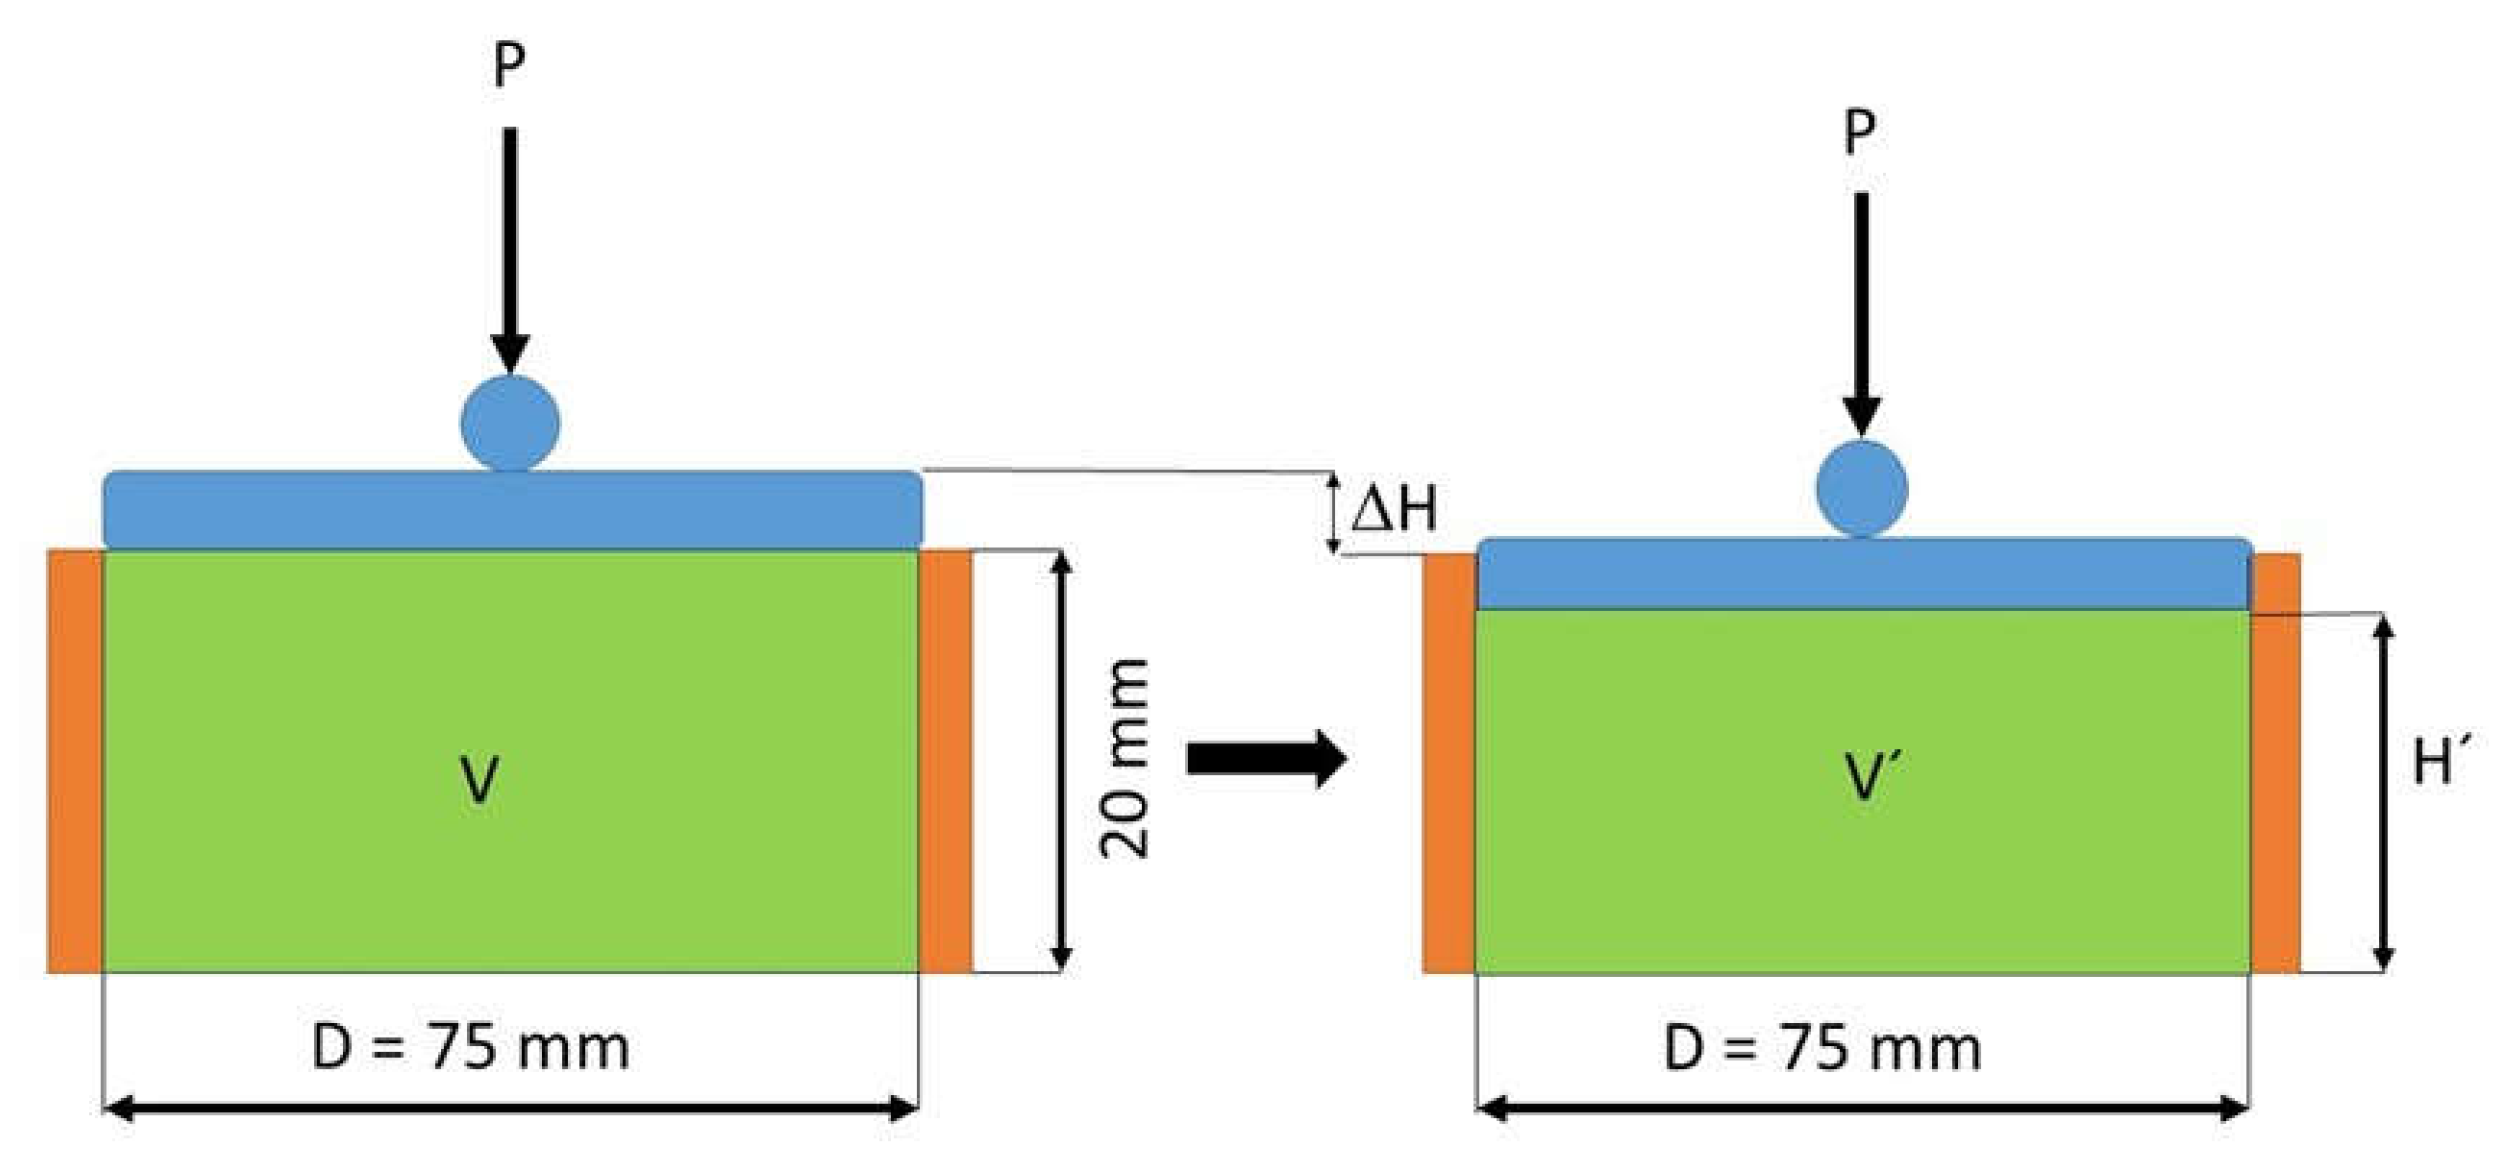
The apparent specific weight of the sample could be determined at all times as follows: the volume of the oedometric cell in which the material is deposited is known because it is standardized. Since the weight of the maize sample was determined immediately before beginning each test with the aid of an electronic balance having an accuracy of 0.1 g (see
Figure 7), it was possible to determine its initial apparent specific weight. With the help of a displacement transducer, it was possible to determine the height reached by the sample inside the oedometric cell at each moment for each loading or unloading step applied, and, thus its apparent specific weight, as shown in
Figure 8.
3. Results
3.1. Moisture Content
As mentioned in the previous section, the corn used was subjected to different combinations of temperature (° C) and humidity (%) in the climatic chamber in order to carry out the direct shear and oedometric assays at different humidities. In all cases, immediately before the start of the tests, the moisture content was determined by drying the samples in an oven.
Table 1 shows the different combinations of temperature and humidity applied to the maize samples, as well as the actual moisture content of the material in each case after the oven drying process:
As can be seen in the table above, the moisture content selected to analyze the mechanical properties of maize ranged from 9.3 to 17.4%. This range is within those used by other researchers [
42,
45,
48,
66].
3.2. Direct Shear Assays
3.2.1. Angle of Internal Friction and Apparent Cohesion
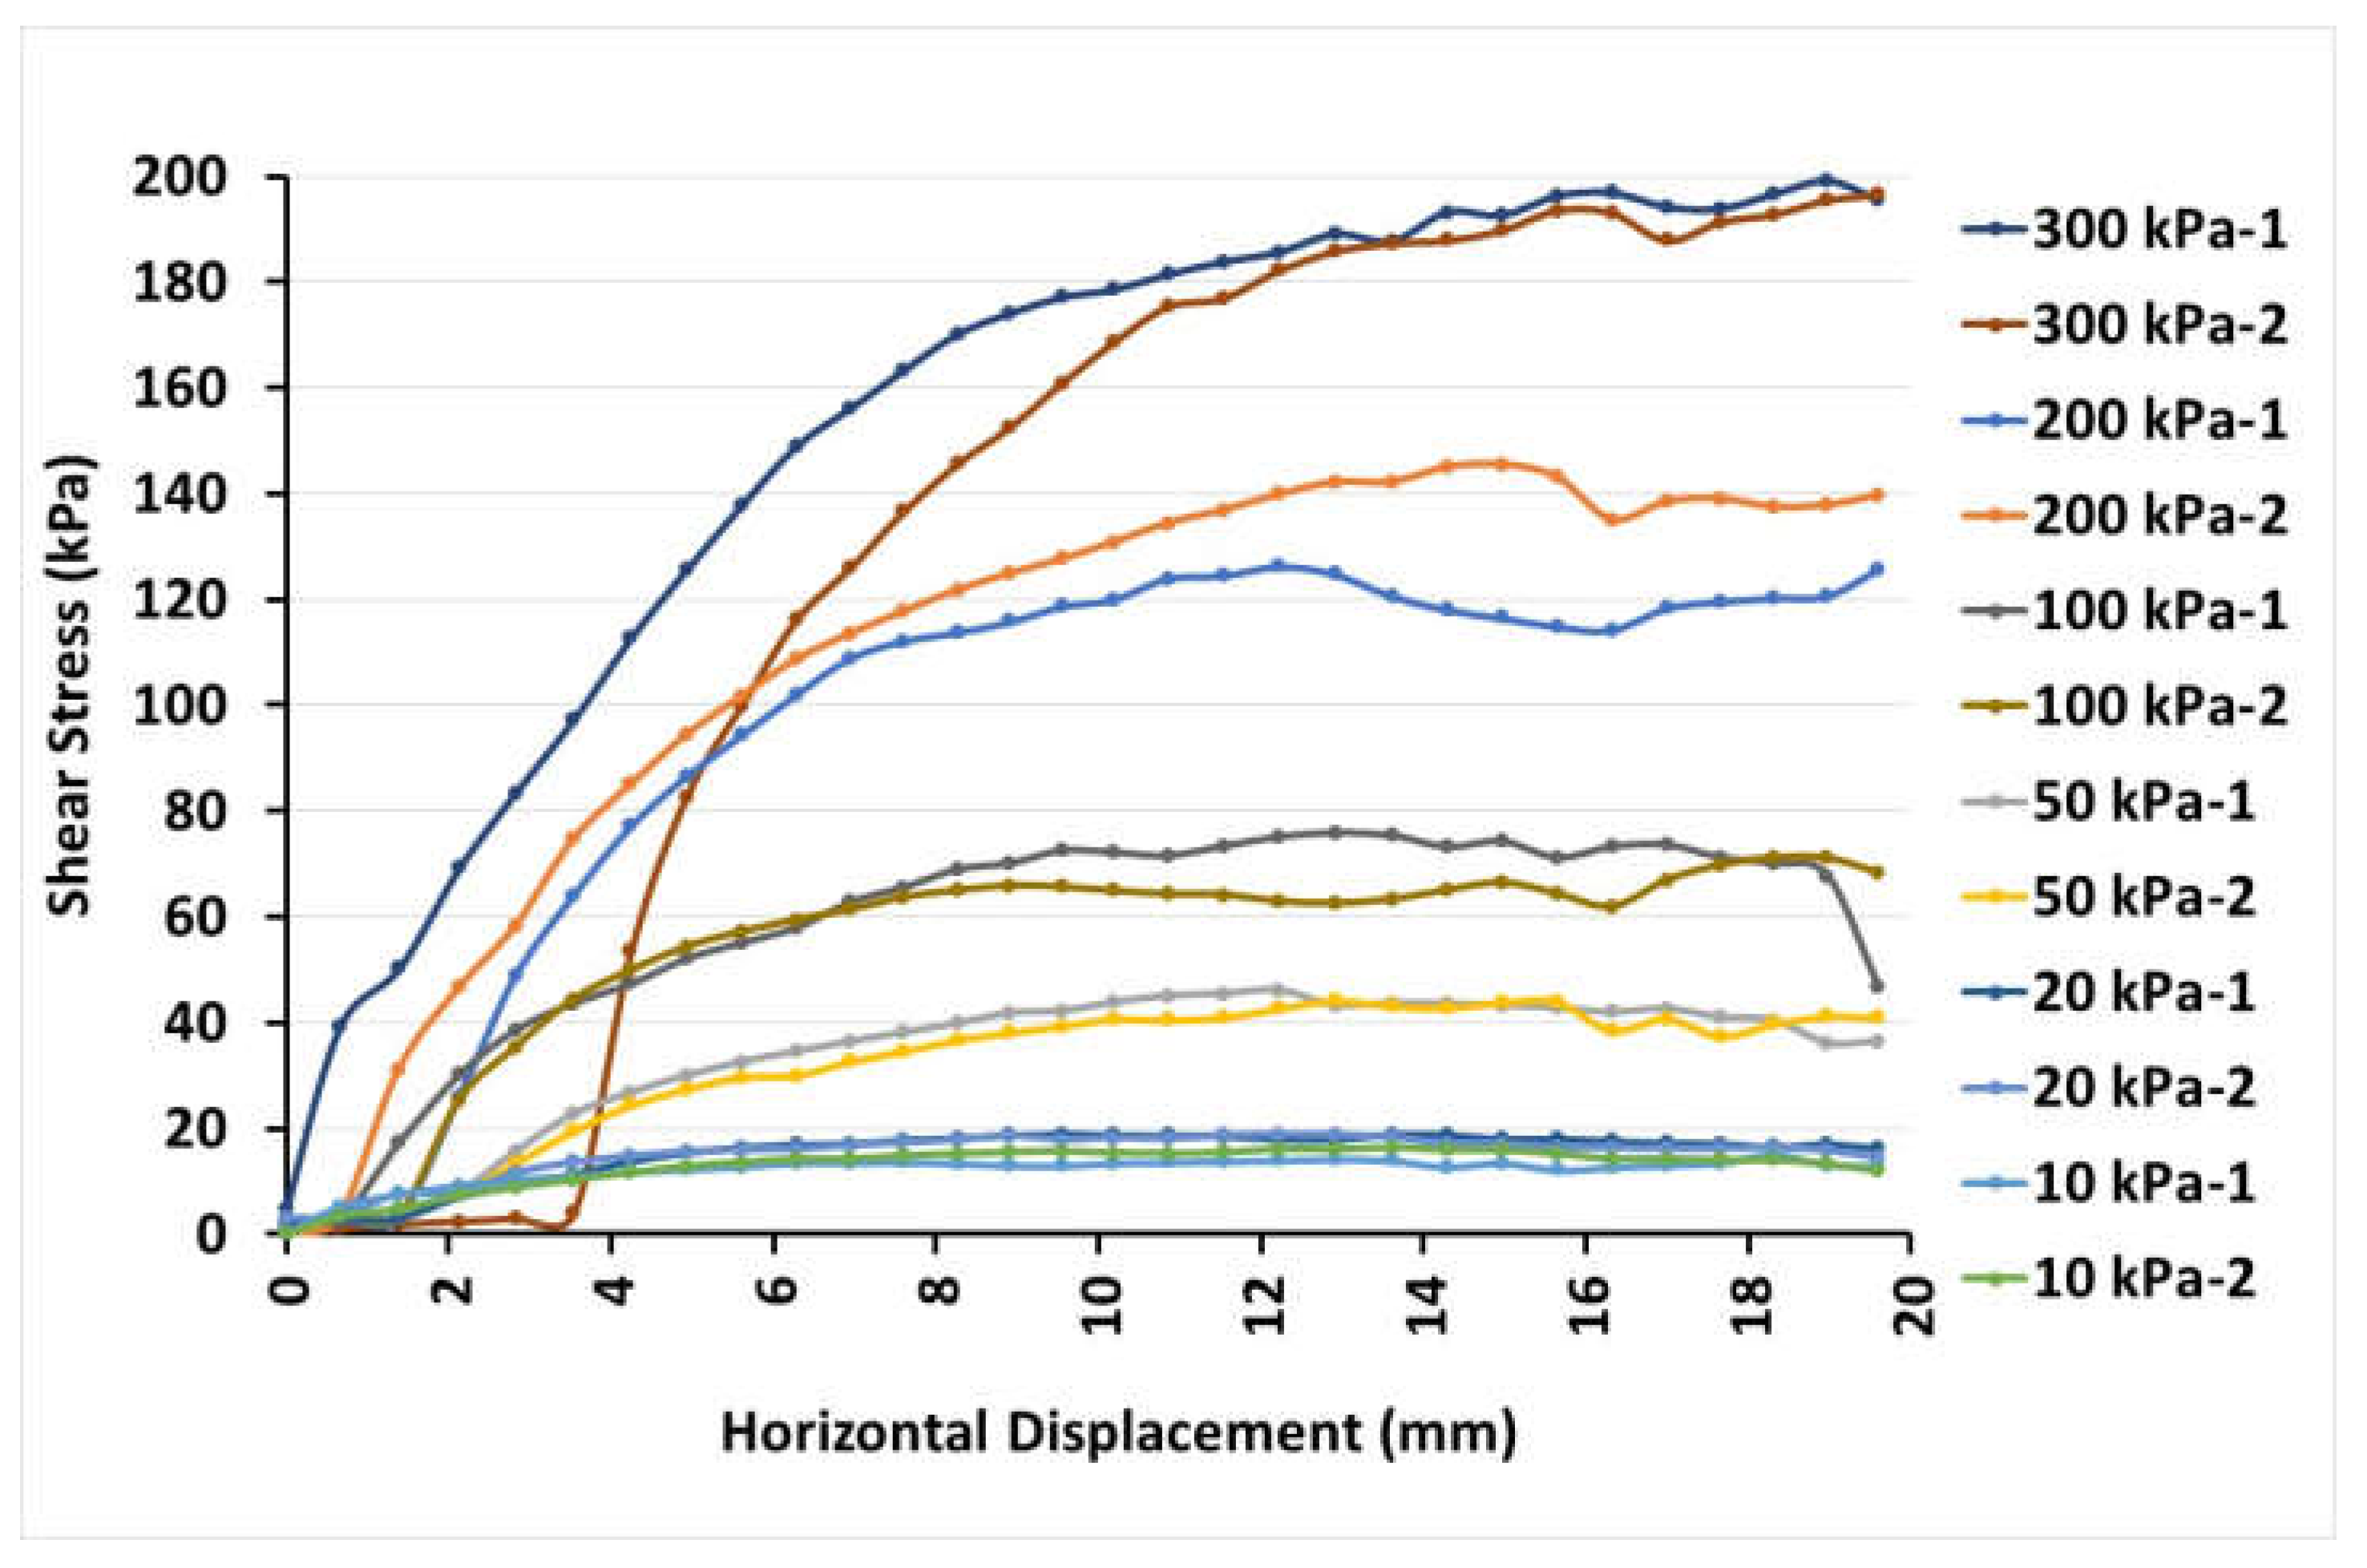
The stress-strain curves at the different normal stresses applied to the maize samples are plotted at moisture contents of 17.4% (
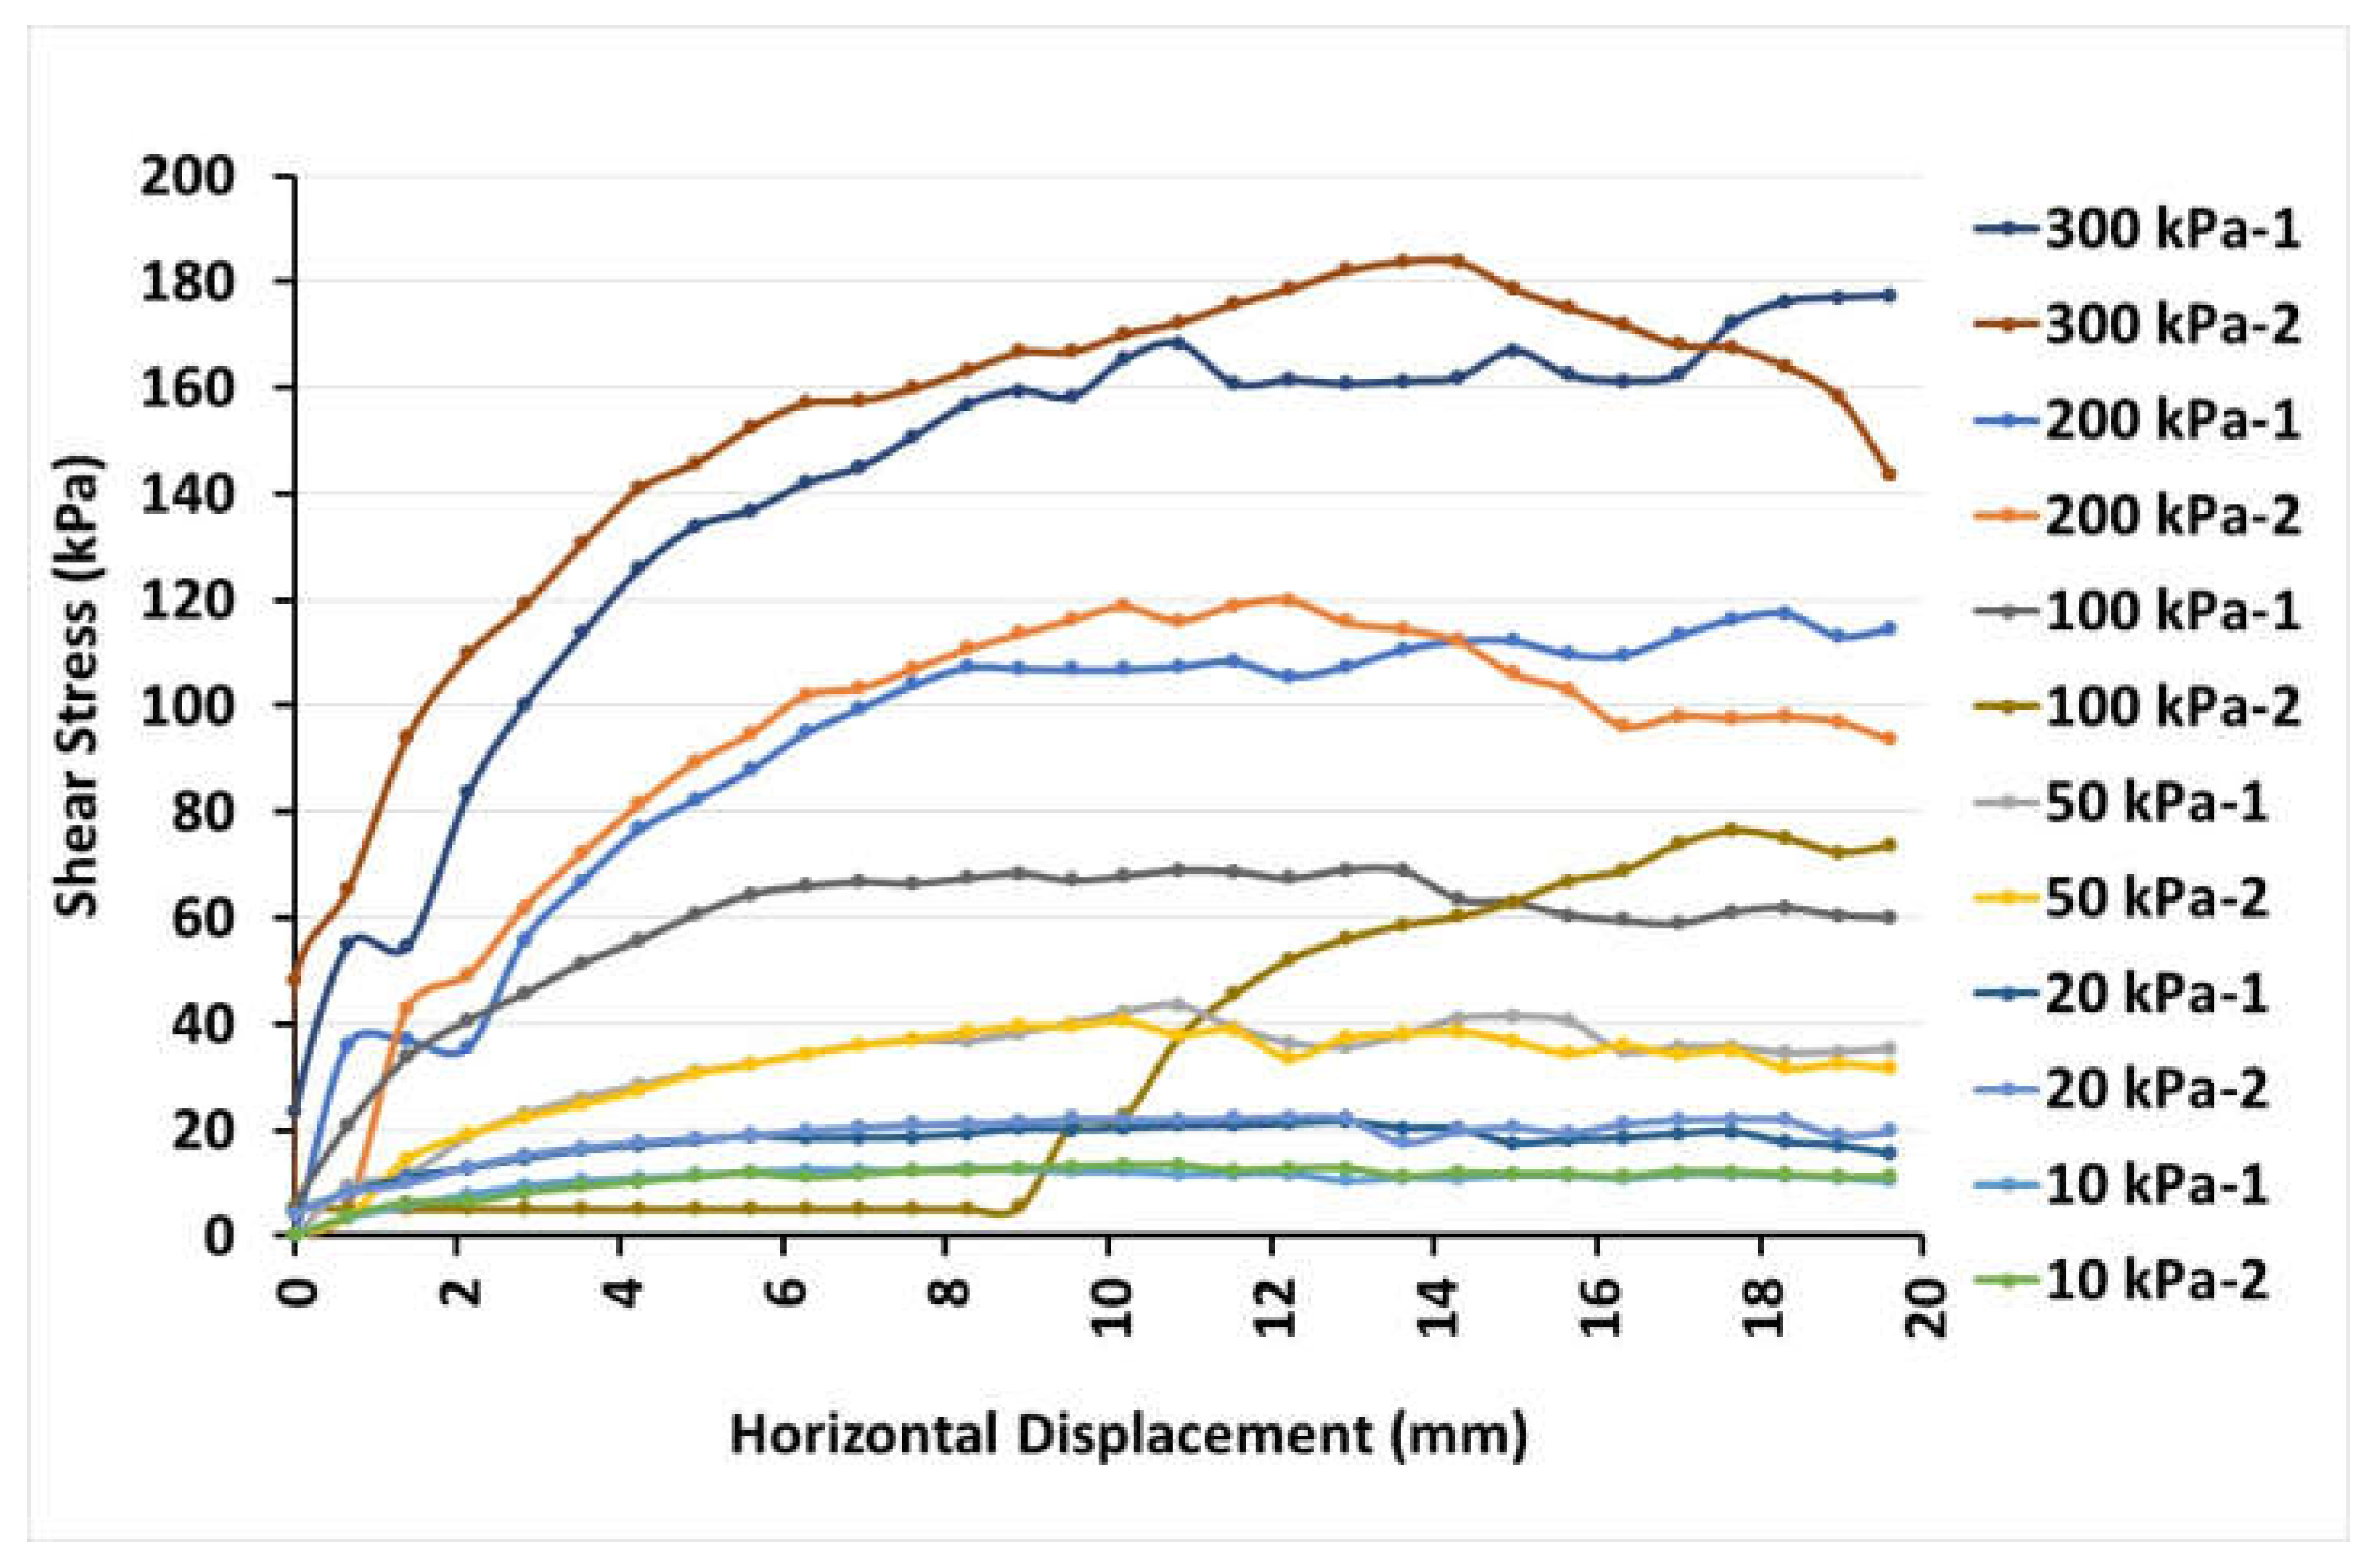
Figure 9) and 9.3% d.b. (
Figure 10), respectively, for the two replications carried out:
From the previous figures it can be deduced that the value obtained for the maximum lateral stress when the moisture content is 17.4% (199.08 kPa) is 8.3% higher than that corresponding to a moisture content of 9.3% (183.83 kPa). For a normal stress of 200 kPa, this value is 21.2% higher at 17.4% humidity compared to that obtained at 9.3%, while for a normal stress of 100 kPa, this value is 1% higher at 9.3% humidity compared to that obtained at 17.4%. Finally, when analyzing the differences obtained by applying the lowest normal stresses, higher values of the maximum shear stress of 6.1% and 22.3% were observed at normal stresses of 50 and 10 kPa, respectively, at a humidity of 17.4% with respect to the value obtained at 9.3%. The exception to this trend was at a normal stress of 20 kPa, since the values obtained were 18.5% higher at 9.3% humidity than those obtained at 17.4% humidity. Therefore, it can be stated that the tendency seems to be that the shear stress increases with the normal stress applied and with the moisture content of the sample, although this tendency is not generalized, since there are exceptions when applying normal stresses of 20 and 100 kPa.
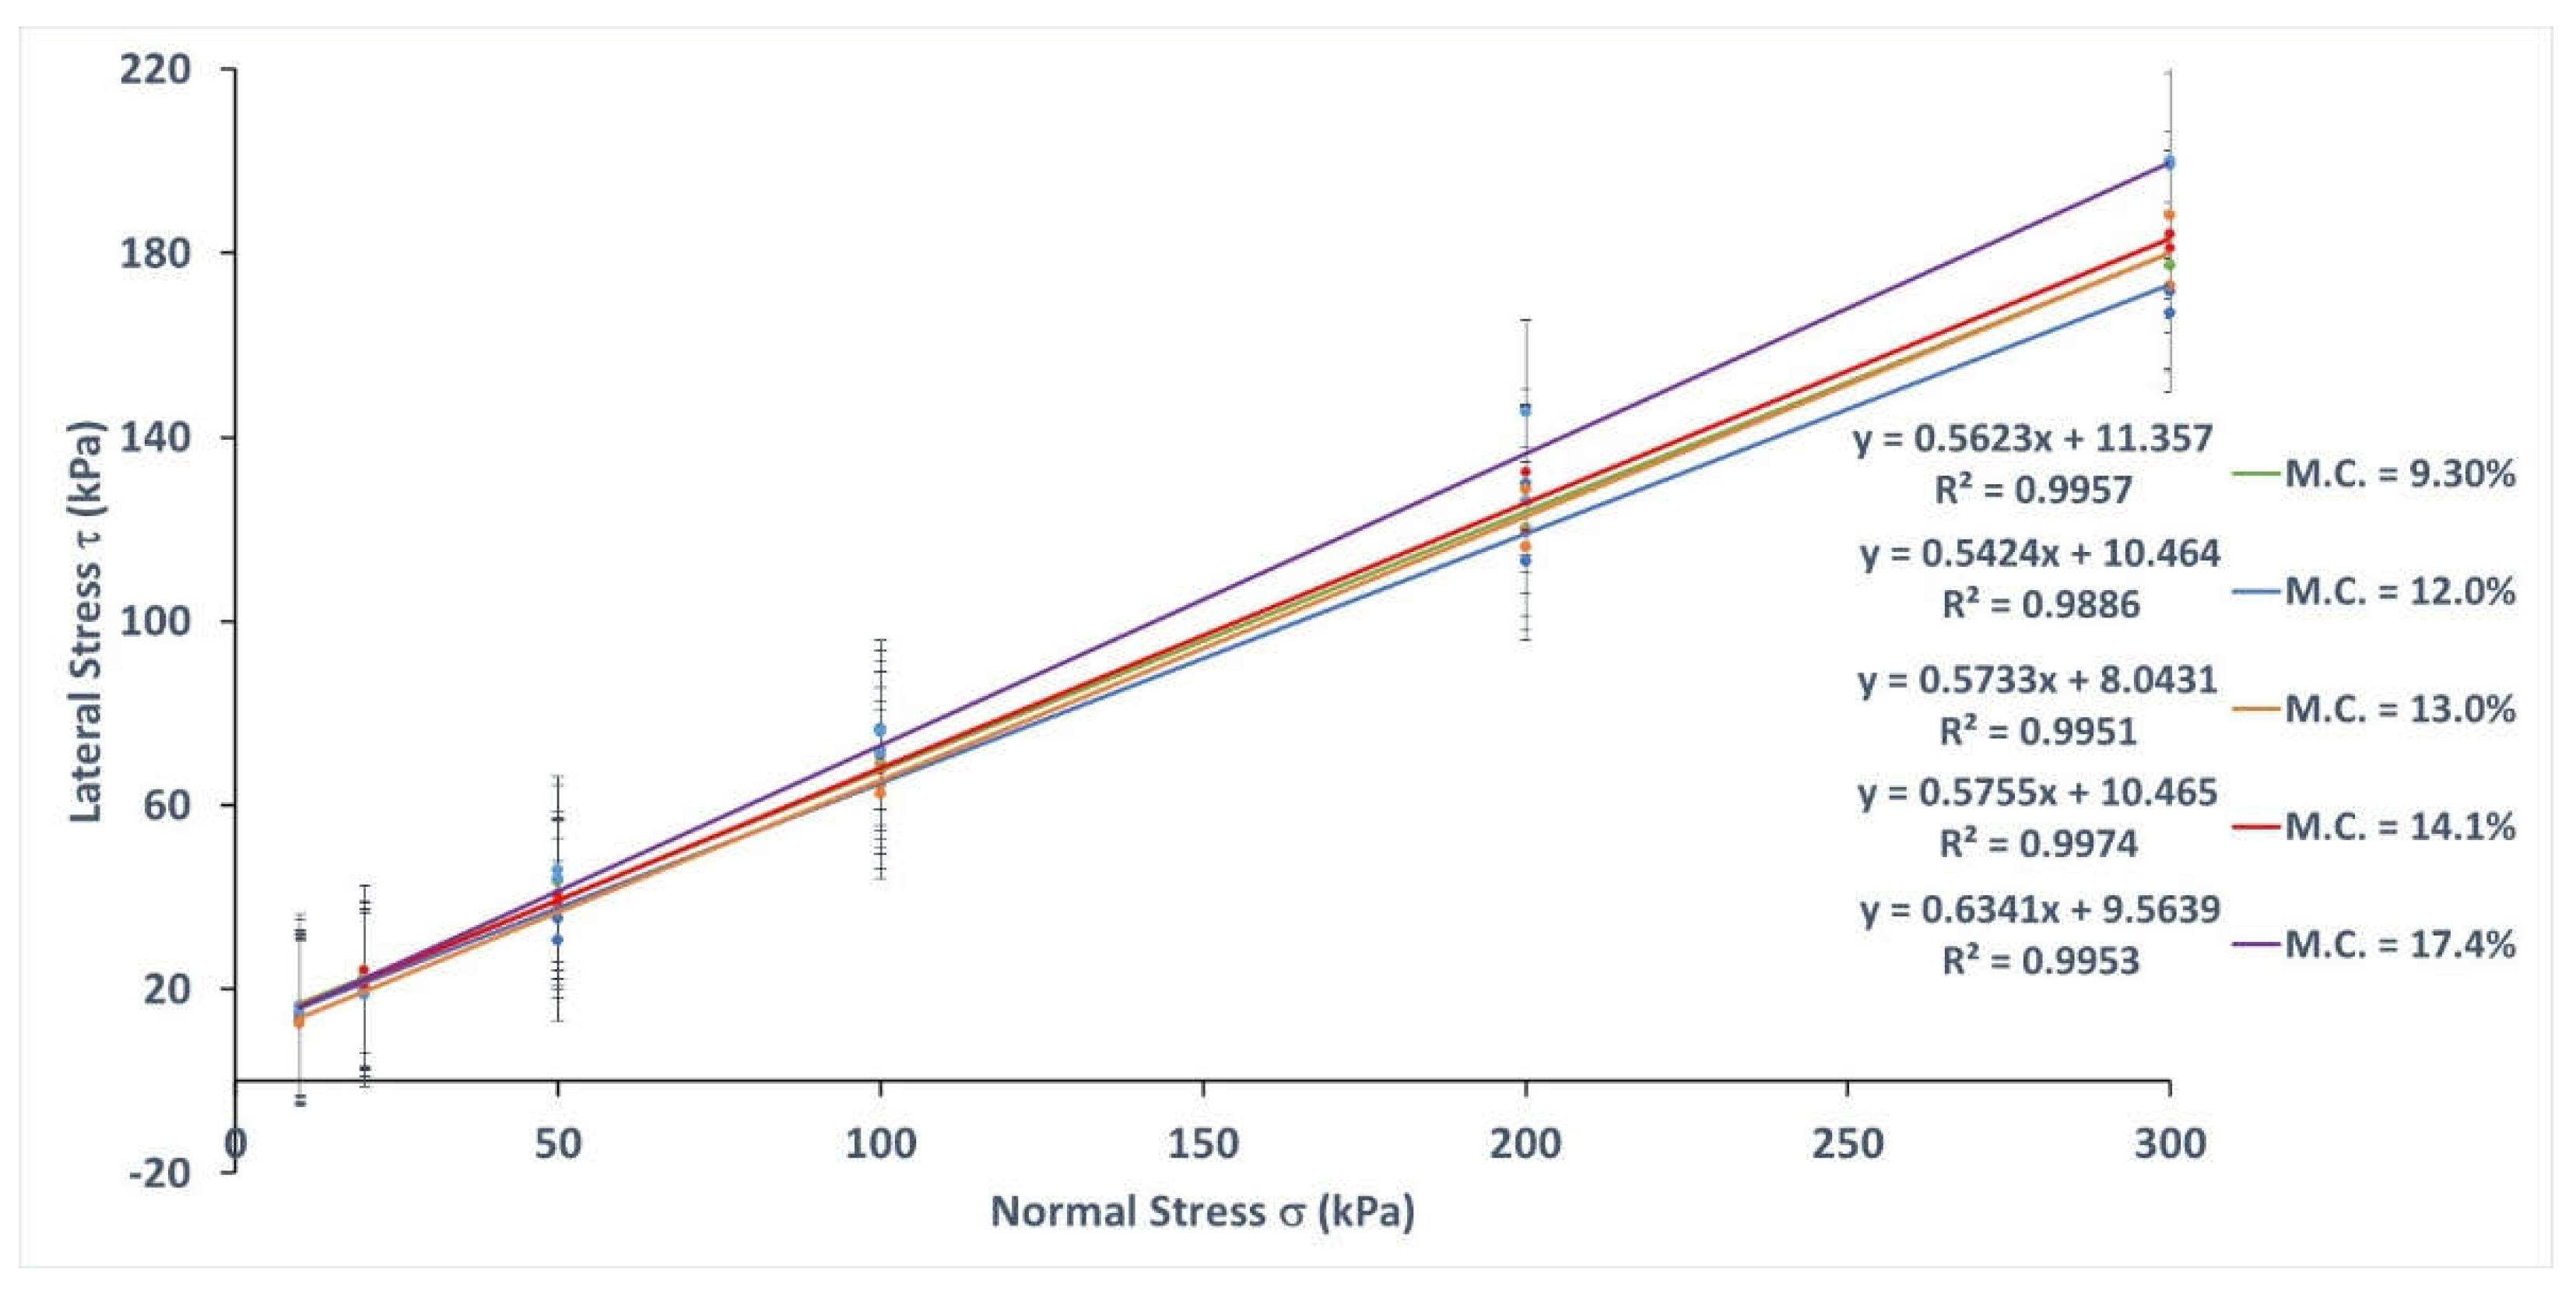
Figure 11 shows the regression lines for the Mohr-Coulomb strength envelopes of the assays carried out at the different normal stresses and moisture content applied to the maize samples.
The mathematical expressions of the different regression lines obtained are given in the figure above. From them, the values of the angle of internal friction and apparent cohesion have been determined and are shown in
Table 2:
From the above table it can be deduced that the maximum internal friction angle was reached at the highest applied humidity (17.4%). This value was 13.7% higher than the minimum recorded for this parameter, which was obtained at 12% moisture content. The general trend observed was that the shear strength increased as the moisture content of the samples used increased, with the only exception of the behavior observed at 12% moisture content, for which there was a small reduction of 3% in the value obtained with respect to that obtained at 9.3% moisture content. This anomaly could perhaps be due to the fact that the value obtained at the latter moisture content was slightly higher than expected.
With regard to the values obtained for apparent cohesion, it can be observed that very high values were not obtained in any of the cases. Nor was there a general tendency to increase or decrease the values recorded as the moisture content of the samples tested increased.
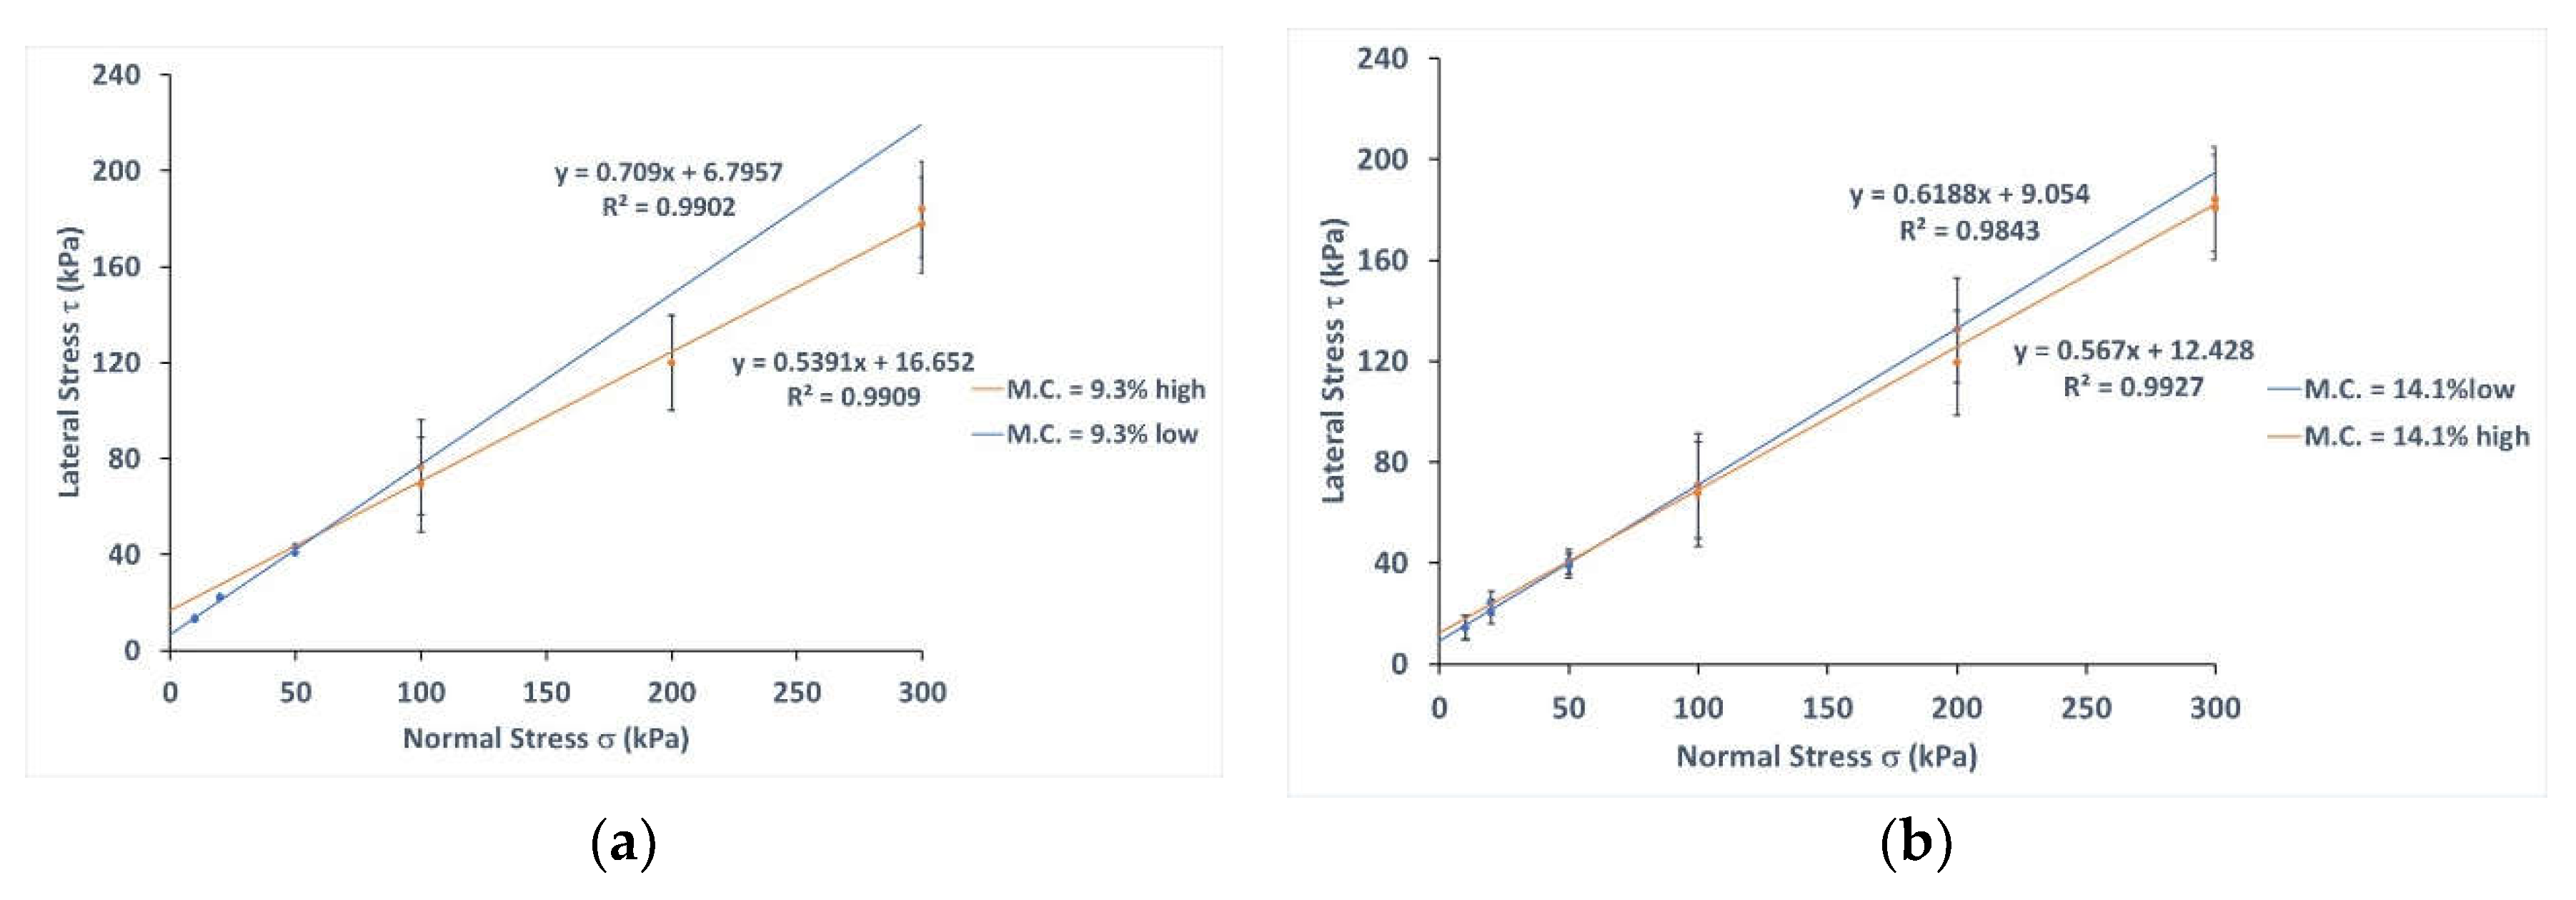
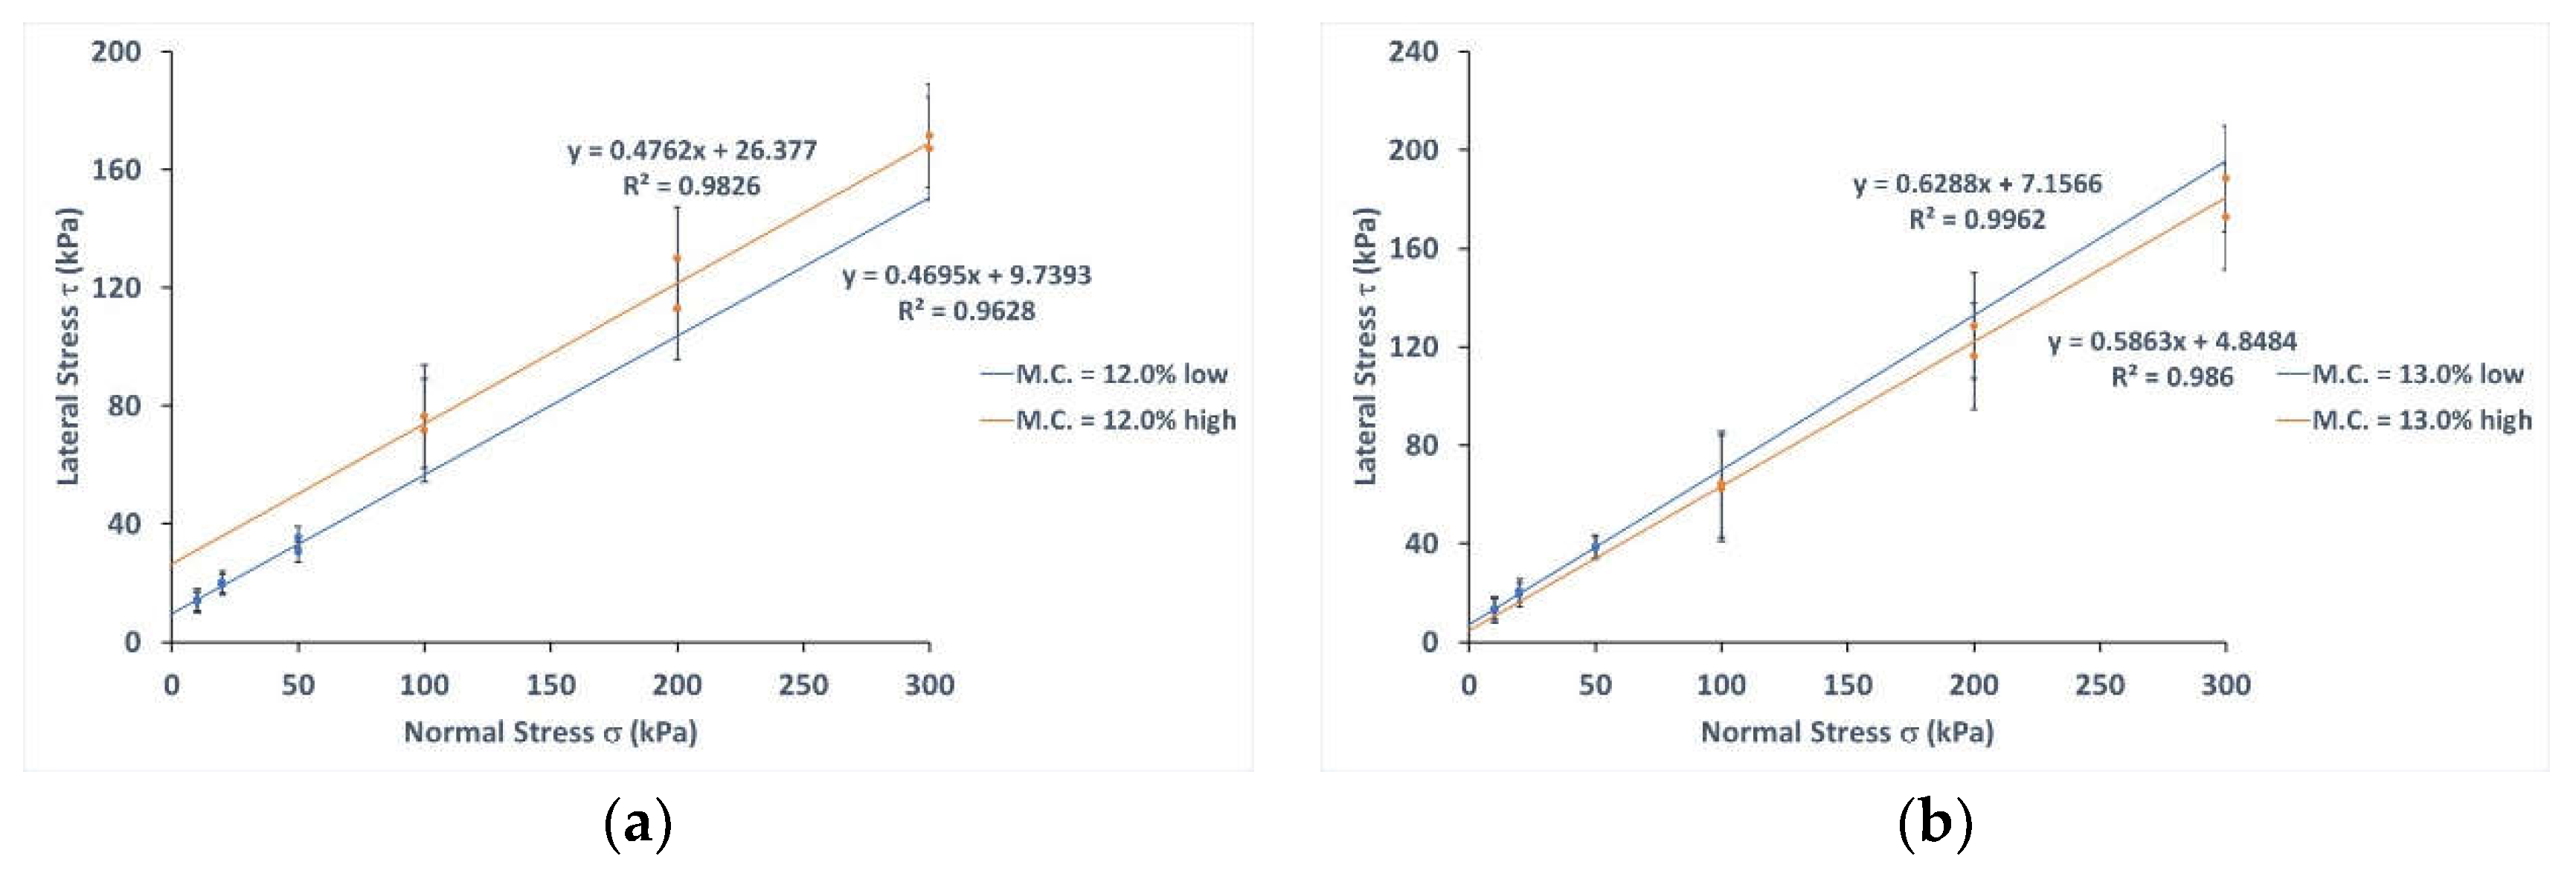
When comparing the regression lines of the Mohr-Coulomb strength envelopes obtained at high (100, 200 and 300 kPa) and low (10, 20 and 50 kPa) normal stresses, it was found that in some cases these lines intersected at a point, as occurred at moisture contents of 9.3, 14.1 and 17.4% (see
Figure 12), while in others no such intersection occurred, as happened at moisture contents of 12.0 and 13.0% (see
Figure 13).
Logically, as in the previous figures the slopes of the regression lines varied for the same moisture content depending on the range of normal stresses considered (high or low), the internal friction angles obtained were different. Similarly, this variation also affected the apparent cohesion values obtained at high and low normal stresses for each moisture content applied, since the points of intersection of the corresponding regression lines with the ordinate axis were also different in each case.
Table 3 shows the values of internal friction angle and apparent cohesion obtained at high and low normal stresses for each of the moisture contents applied to the maize samples.
From the above table it can be seen that, in general, the values of the internal friction angle are higher in the low normal stress range than in the high normal stress range. When considering the range of low normal stresses, the maximum value of the internal friction angle (37.5°) was obtained at the highest moisture content (17.4%), while the minimum value for this parameter was obtained when applying a moisture content of 12.0% (25.1°). Moreover, in all the moisture ranges analyzed, the value of this parameter exceeded 30°, the only exception being the value recorded at the 12.0% moisture content. In fact, the difference between the maximum and minimum values obtained in the different humidity intervals applied, except for the value obtained at 12.0% humidity, was 15.5%, and this difference increased to 33.1% when considering the value obtained at 12.0% humidity. On the other hand, when analyzing the values obtained in the high normal stress interval, again the highest value (32.2°) is reached at the highest applied humidity (17.4%), with the 12.0% humidity also providing the minimum value of this parameter (25.5°). In this case, 30° was only exceeded at humidities of 13.0 and 17.4%, with a difference of 20.8% between the maximum and minimum values.
Regarding the values of apparent cohesion, these were generally higher in the high normal stress range. The only exception was the value obtained at 13.0% moisture content, although in this case the standard deviation obtained could not be disregarded. The difference was 37.4% between the maximum and minimum values in the low normal stress range, while it was 81.6% in the high normal stress range.
3.2.2. Dilatancy Angle
For the determination of the dilatancy angle, it is necessary to know the vertical deformation (ε
v) of the material as the direct shear test is performed.
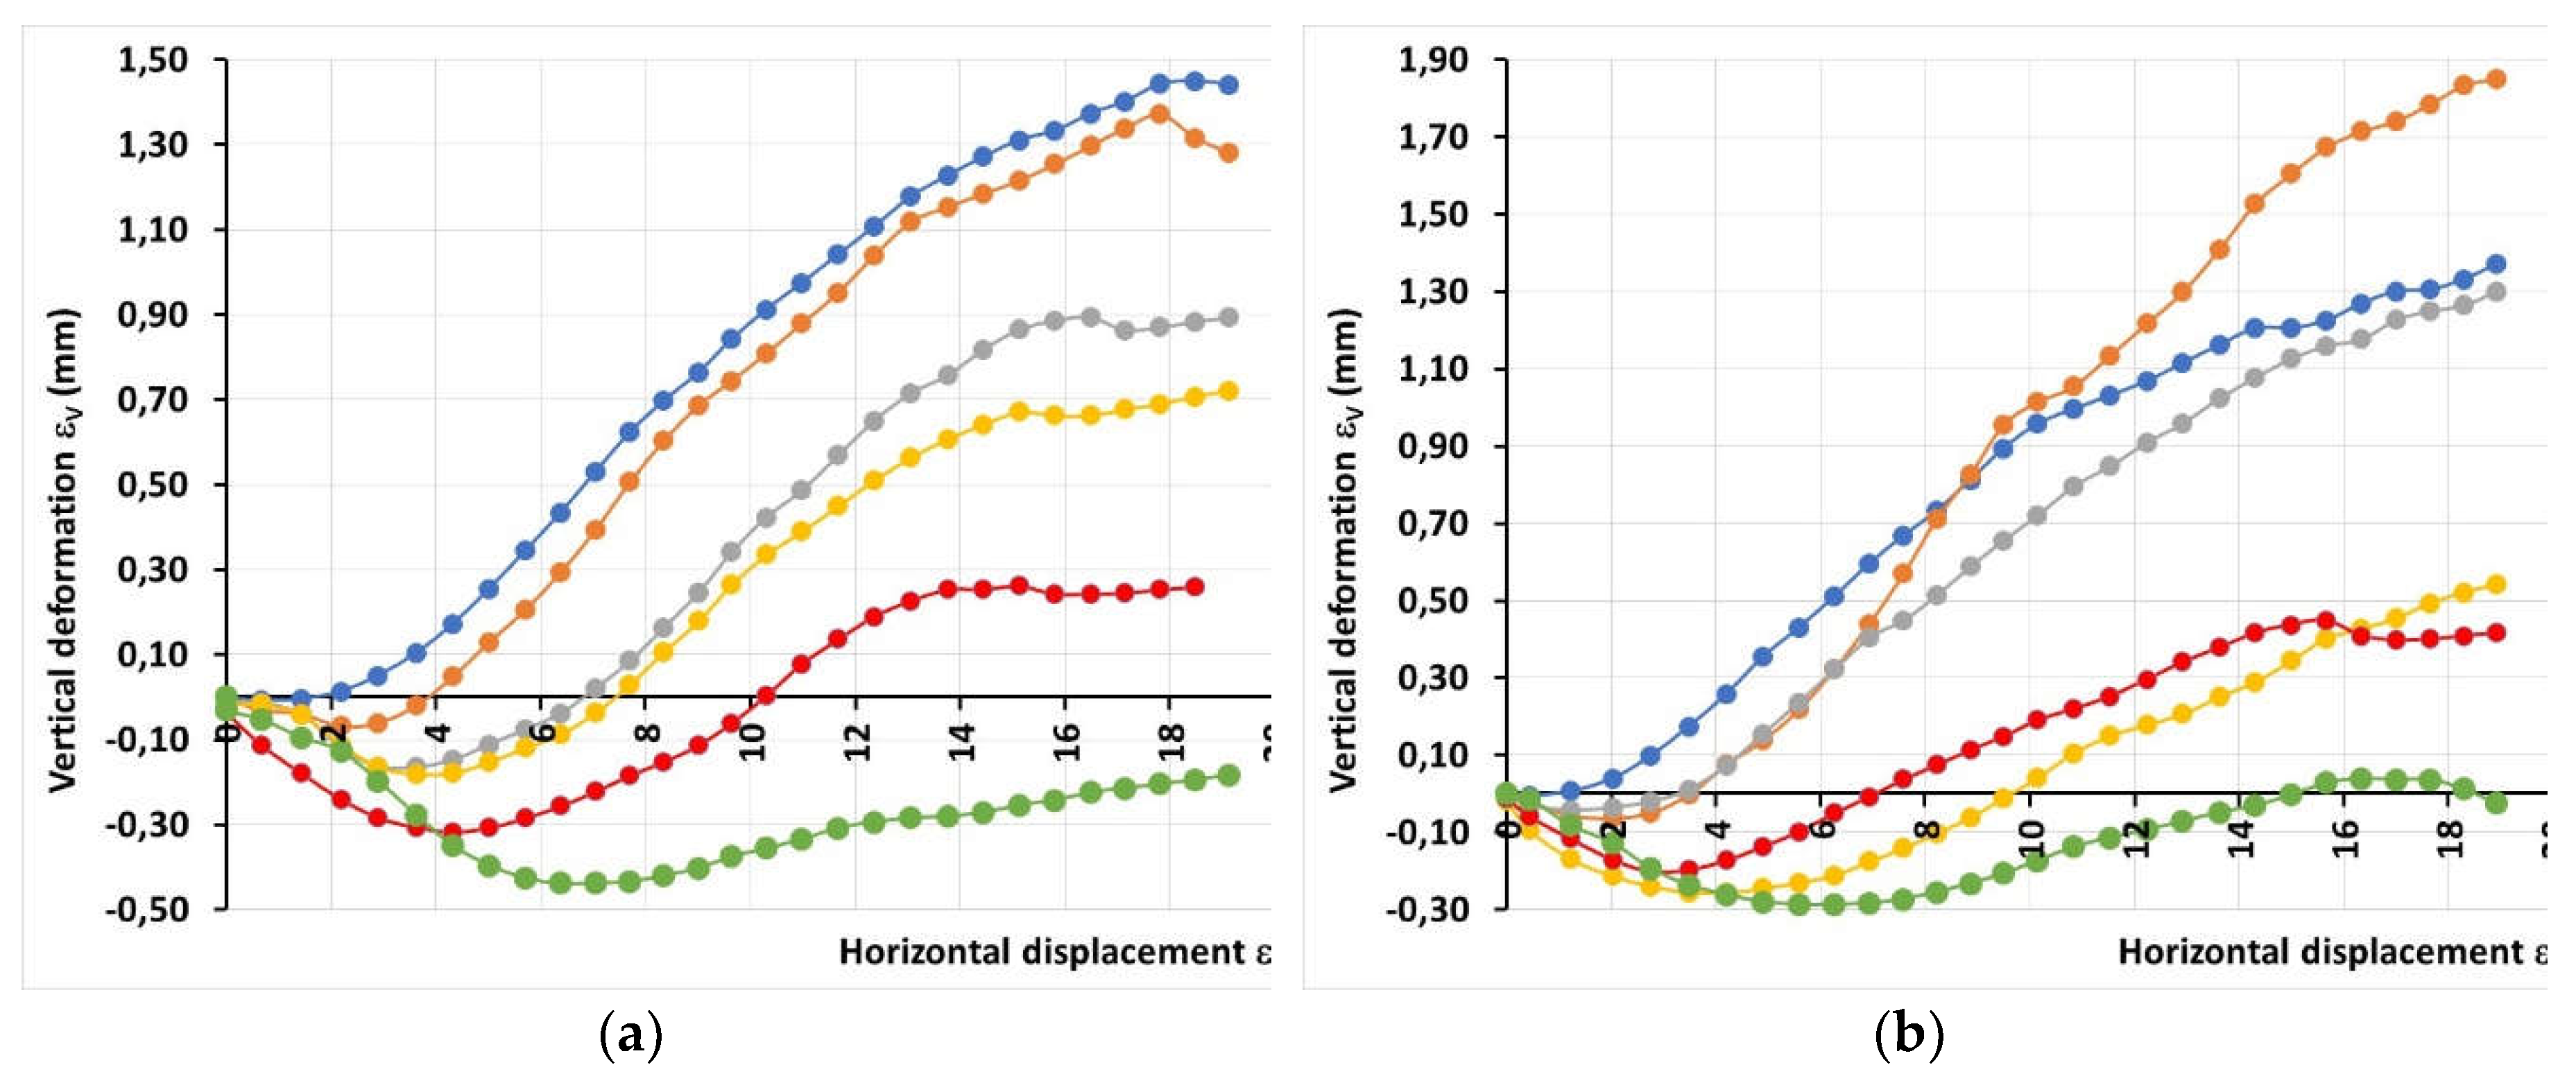
Figure 14 shows the mean values obtained for each of the two repetitions carried out in the corresponding assays with the maize sample and for the different normal stresses applied (10, 20, 50, 100, 200 and 300 kPa) at moisture contents of 17.4% (
Figure 14a) and 13.0% (
Figure 14b), respectively. They show the vertical deformation on the ordinate axis and the horizontal deformation (ε
H) on the abscissa axis.
The figures above show the different behavior of the material. Thus, at 17.4% humidity, the dilatancy of the direct shear assays was greater the lower the normal stress applied, as would be expected a priori. However, at 13.0% moisture content, the previous trend was not observed. In this case, when a horizontal displacement of 9 mm is reached, the curve obtained at a normal stress of 20 kPa is above that obtained at 10 kPa. Similarly, until 15 mm of horizontal displacement was exceeded, the curve obtained at a normal stress of 100 kPa did not exceed that obtained at 200 kPa. A similar trend in which the curve at 20 kPa exceeded that at 10 kPa was observed in the tests carried out applying a moisture content of 14.1%, while at 12.0% moisture content the curve obtained when applying a normal stress of 200 kPa experienced greater dilatancy than that provided when the normal stress was 100 kPa. Finally, in the tests carried out at 9.3% humidity, it was the normal stress of 50 kPa that provided the greatest dilatancy, while the curve corresponding to a normal stress of 20 kPa was exceeded up to 11 mm of horizontal displacement by that obtained by applying a normal stress of 100 kPa. These erratic trends observed in some cases can be seen in the data shown in
Table 4:
The highest value for this parameter (30.7°) was obtained in tests carried out at a moisture content of 17.4% and applying a normal stress of 10 kPa, while the lowest value (4.4°) was obtained at a normal stress of 300 kPa and a moisture content of 9.3%. It should also be noted that in all the assays carried out at the different moisture contents applied to the maize samples, dilatancy was observed at the maximum normal stress applied (300 kPa).
By comparing the maximum and minimum values obtained for the dilatancy angle for each of the moisture contents applied to the samples, the percentage drop of this parameter was obtained. The results showed that the highest percentage drop (81.7%) was recorded at a moisture content of 9.3%, since the maximum value of this parameter at this moisture content was 24.1° while the minimum value was 4.4°. This was followed by that corresponding to a moisture content of 17.4%, for which the percentage drop was 75.9%. This was followed by percentages of 69.8% and 69.2% at moisture contents of 14.1% and 13.0%, respectively. Finally, the lowest percentage (64.4%) was obtained when applying a moisture content of 12.0%, since at this humidity the maximum value was 21.5°, while the minimum was 8.1°.
3.3. Oedometric Assays
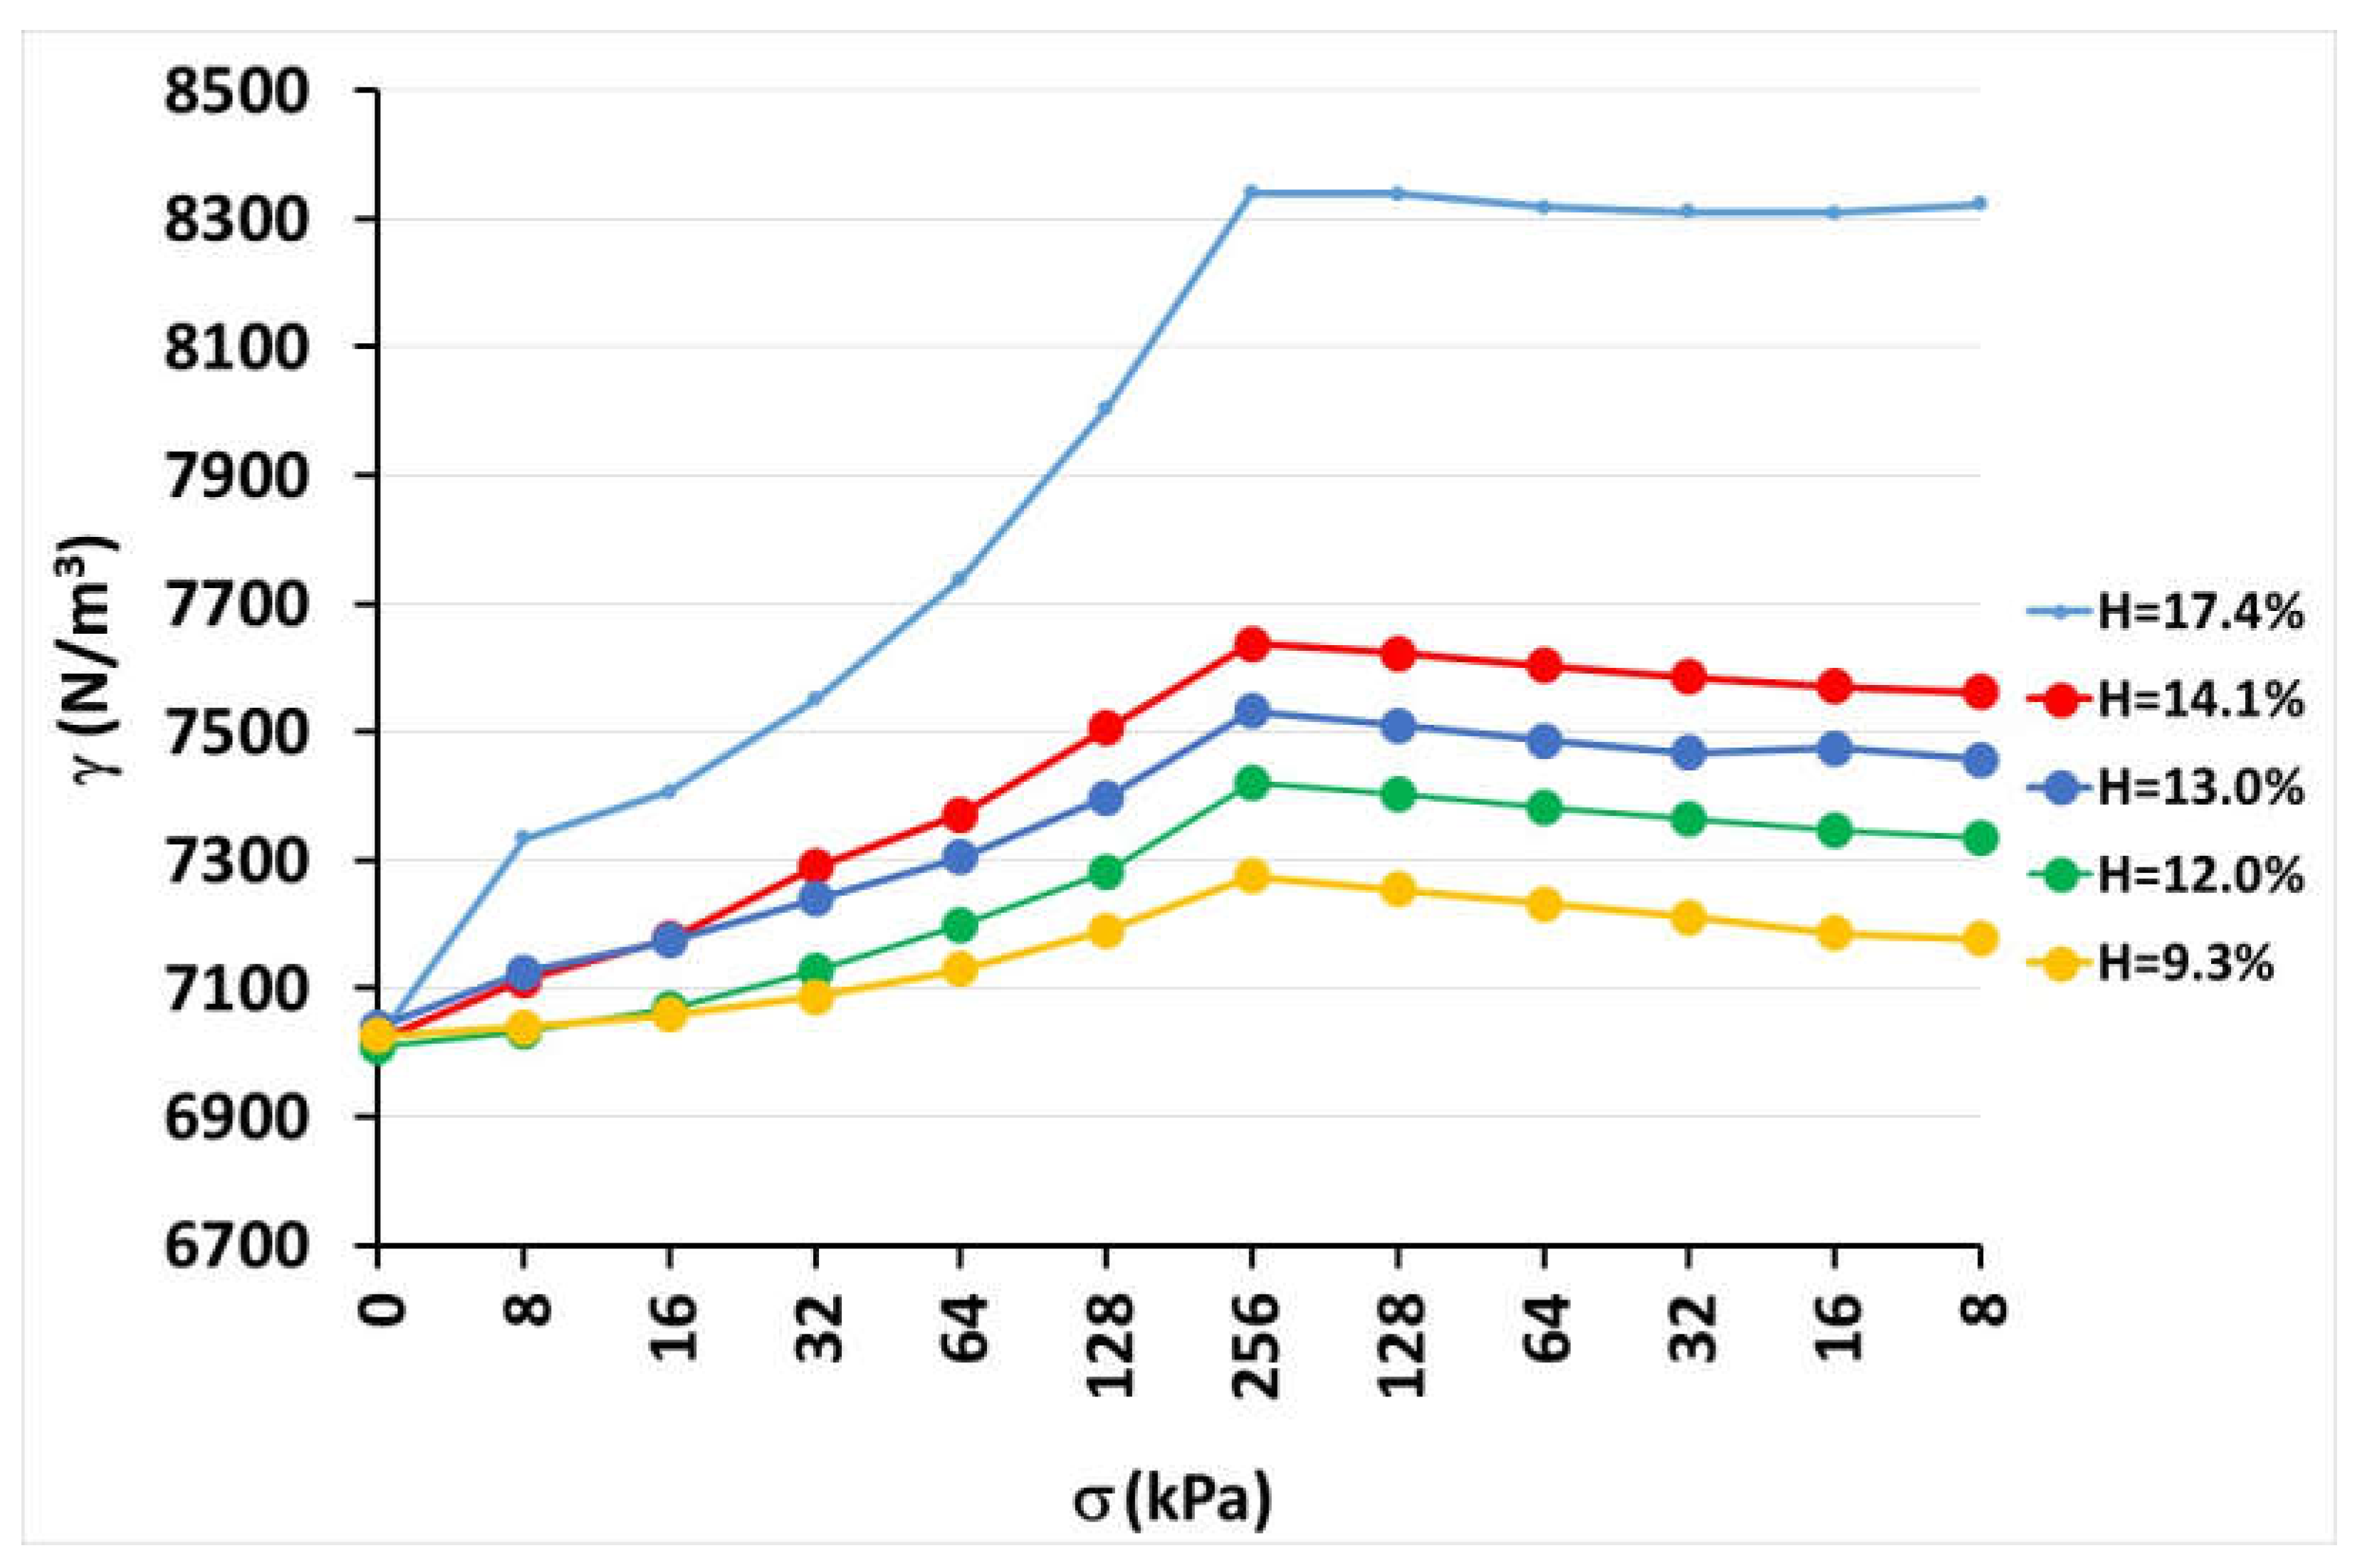
Figure 15 shows the curves obtained at the different moisture contents applied to the maize samples by representing the variation of the apparent specific weight, whose values are provided on the ordinate axis, with the applied normal stress, whose values are provided on the abscissa axis. The moisture contents applied were the same as those applied to the maize samples in the direct shear assays, i.e., 9.3, 12.0, 13.0, 14.1 and 17.4%, respectively. These curves correspond to the mean values obtained from the three repetitions carried out for each of the normal stresses and moisture content applied to the samples.
The curves shown in
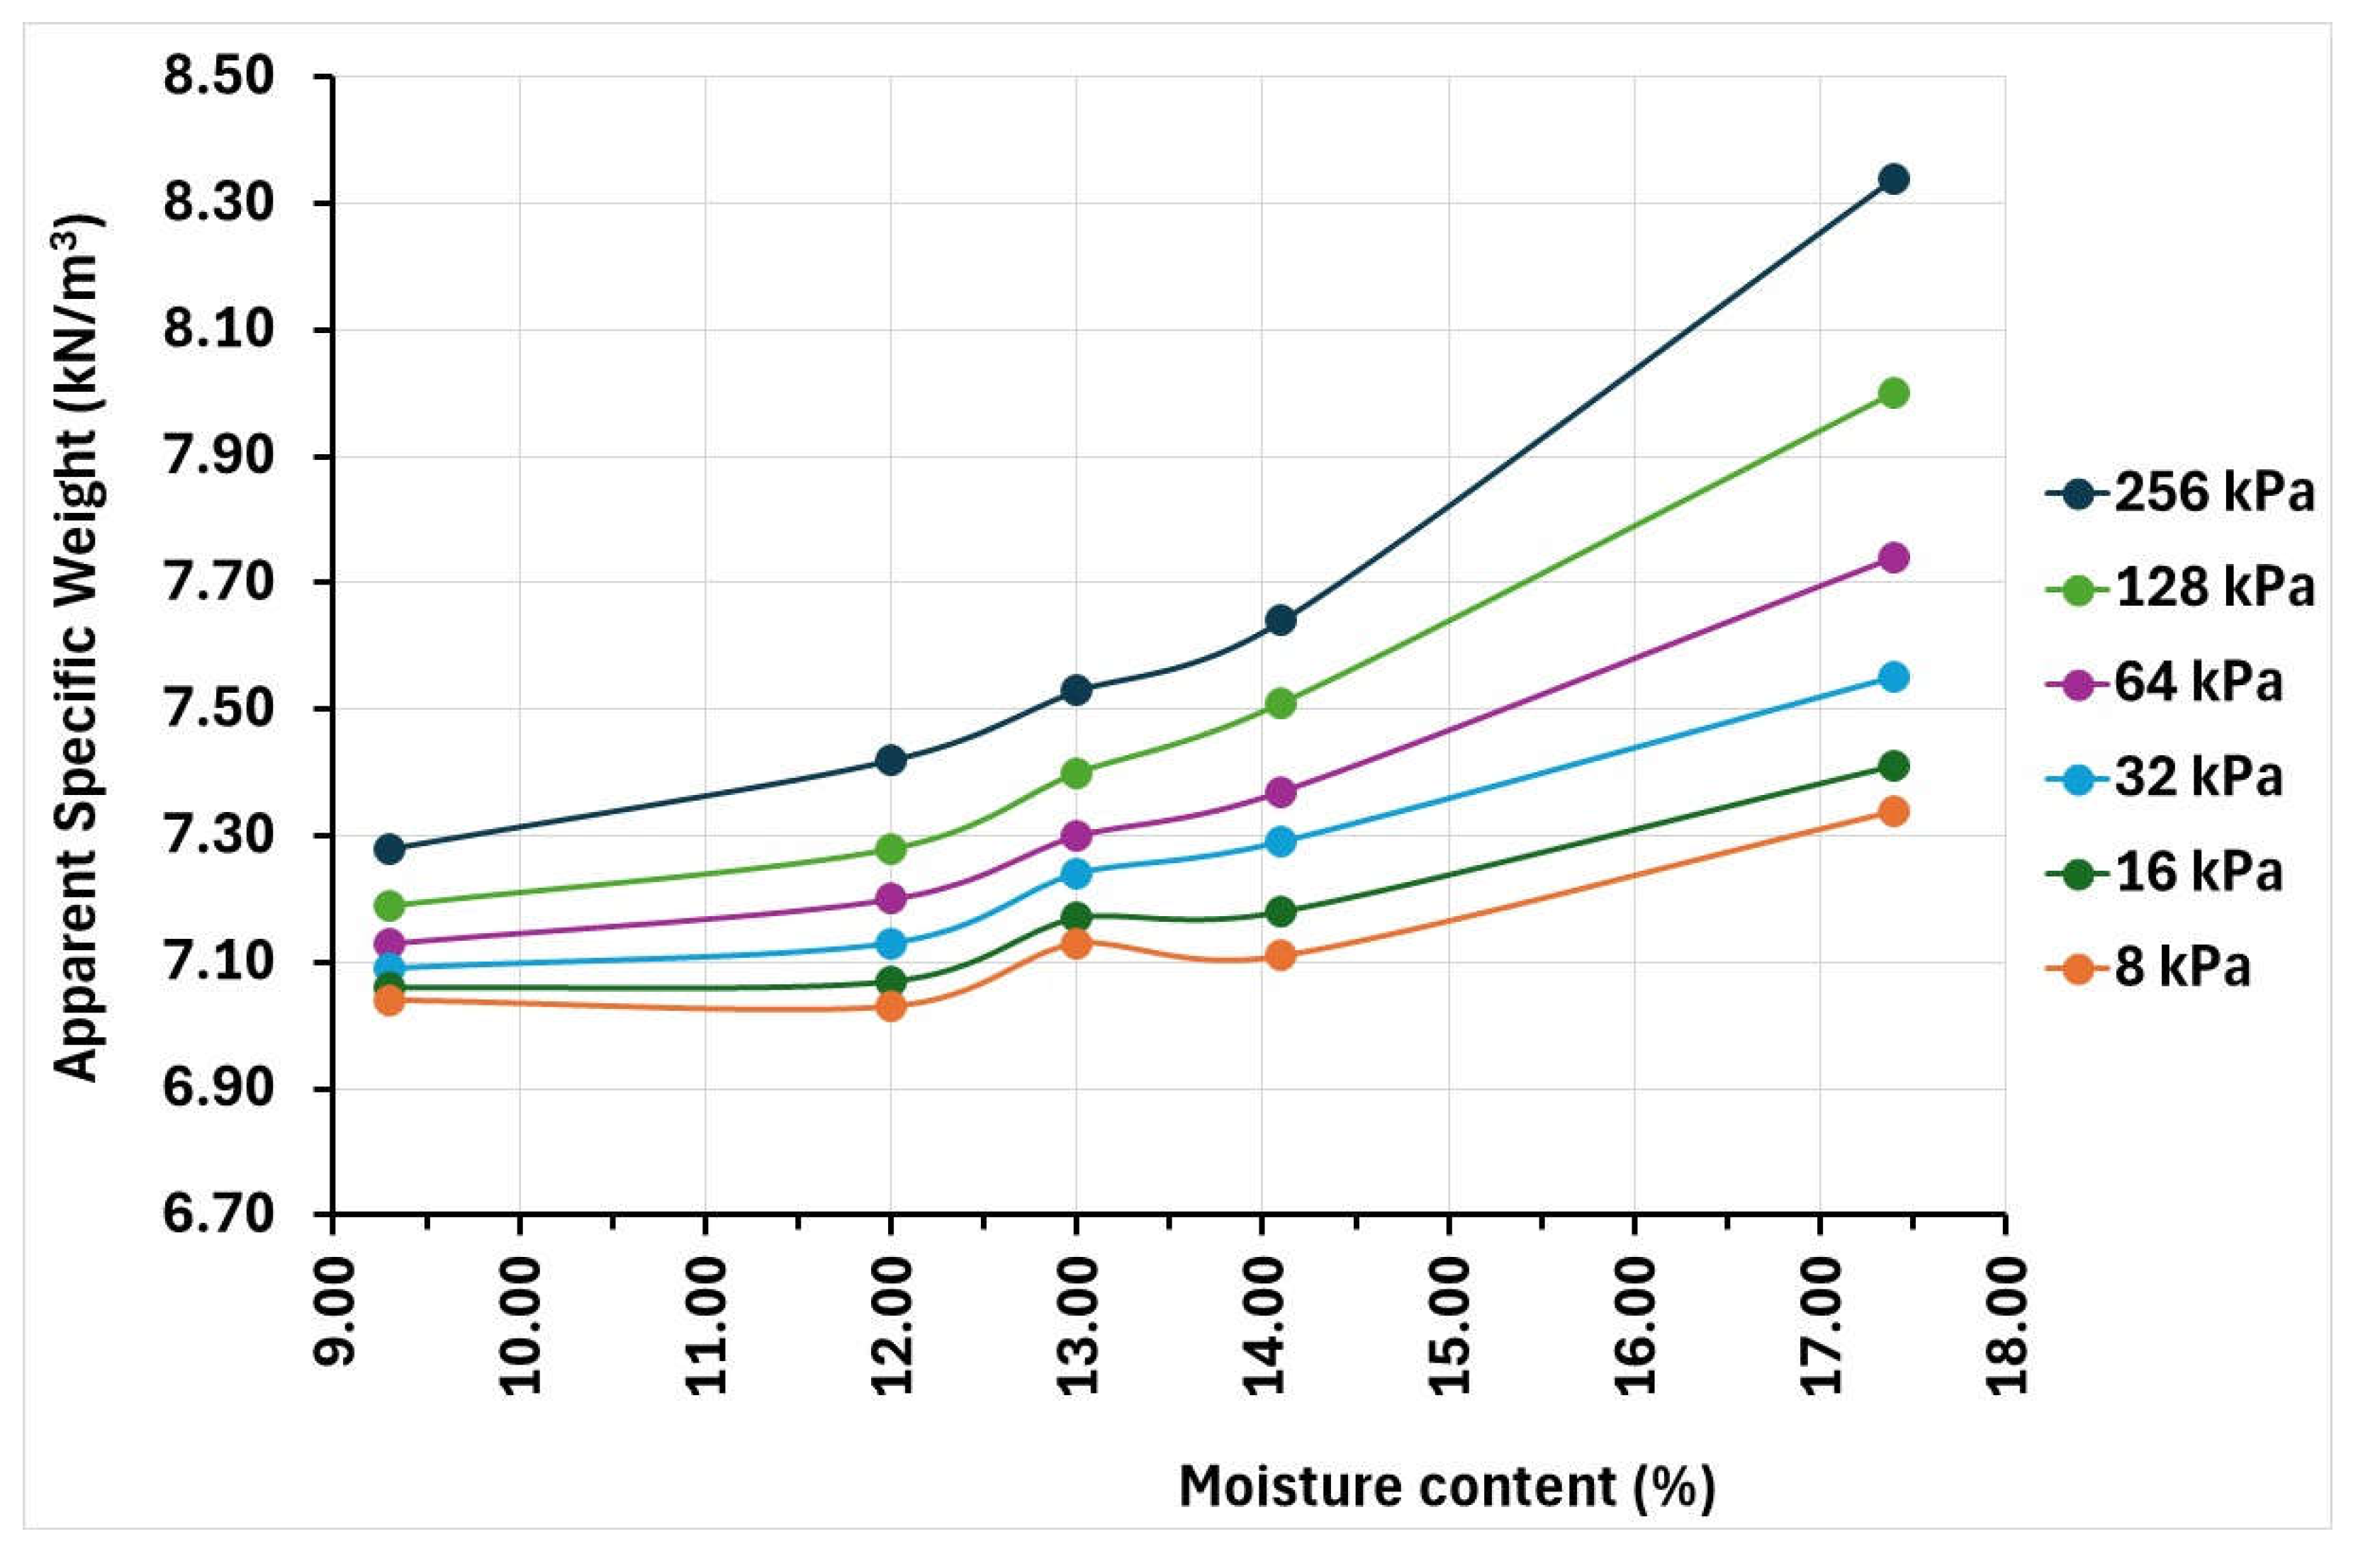
Figure 16 show the variation of apparent specific weight, represented on the ordinate axis, with moisture content, represented on the abscissa axis, for different applied normal stresses.
As expected, from the previous figures it is generally deduced that the higher the normal stress applied, the higher the values of the apparent specific weight obtained, these values also being higher as the moisture content of the samples increases. The only exception was the lower value obtained at a humidity of 14.1% with respect to that obtained at 13.0% humidity for a normal stress of 8 kPa.
Table 5 below shows the mean values and standard deviation of the apparent specific weight at the different normal stresses and moisture contents applied to the maize samples:
From the above data, when comparing the initial value of the apparent specific weight determined immediately before starting the test (normal stress equal to 0 kPa) with that corresponding to the maximum normal stress applied (256 kPa), the greatest increase in this parameter (18.8%) was recorded at a moisture content of 17.4%, followed by that obtained at a humidity of 14.1% (8.8%) and that corresponding to a moisture content of 13.0% (7.0%). In addition, the increase was 5.8% at 12.0% moisture content and, finally, the smallest variation (3.6%) was recorded at 9.3%. On the other hand, when comparing the maximum values obtained for this parameter at the different humidities applied, the greatest difference was recorded, as expected, between the one reached at 17.4% humidity (8.34 kN/m3) and the one corresponding to 9.3% (7.28 kN/m3), reaching a percentage of 14.6%.
4. Discussion
4.1. Moisture Content
The range of moisture contents selected in this work was within those used by other authors [
8,
42,
48,
66]. Therefore, the results shown in this work will be contrasted with those found in the literature whenever they exist.
4.2. Direct Shear Assays
4.2.1. Angle of Internal Friction and Apparent Cohesion
The curves obtained when plotting shear stress versus horizontal deformation are similar to those obtained in similar tests with other granular or powdered agricultural materials [
11,
12,
49].
Since the material used is the same as that used in previous works [
62], the results obtained can be compared with those published at ambient humidity (12.77%). From this comparison, it has been determined that the value of the internal friction angle is similar to that obtained in direct shear assays at ambient conditions (29.0°) at all moisture contents applied to the maize sample, except at 17.4% humidity. Thus, this value ranges from 28.5° (at 12% moisture) to 29.9° (at 14.1% moisture), while at 17.4% moisture a value of 32.4° was obtained, which is 11.7% higher than that obtained under ambient conditions.
When comparing these values with those obtained in the triaxial assays carried out with the material under ambient conditions, it is observed that the minimum value obtained (28.5°) at 12.0% humidity is 61.0% lower than that obtained at 10% axial strain in the triaxial assay (46.7°), and 59.9% lower than that obtained at 20% axial strain (47.6°). However, the maximum value obtained at 17.4% humidity (32.4°) was 69.4% and 68.1% lower than that obtained at 10% and 20% axial strain, respectively.
On the other hand, when comparing the values obtained in this work with those published by other authors [
8] at different humidities, it is observed that the value obtained at 9.3% humidity (29.0°) is 10% higher than that determined by them at 10% humidity (26.7°), while the maximum value obtained here (32.4°) is 3% lower than that provided by them at 17.5% humidity (33.6°). Furthermore, when analyzing the values reported in other works [
1,
12,
67,
68], referring to ambient conditions, it is observed that the minimum value is, at most, 13.1% higher than the minimum published, while the highest value obtained here is, at most, 8.0% higher than the one provided by those authors, most of the values being in the range of those reported in those conditions.
When analyzing the values obtained for this parameter as a function of the range of values of the normal stress applied, the following is observed: in the interval of low normal stresses (10, 20 and 50 kPa), the differences are similar to those previously mentioned for most of the moisture contents tested. In this case, it should be noted that the maximum value obtained in this interval (37.5°) at 17.4% moisture content is 12.2% higher than that obtained at 17.5% by other authors [
8]. In addition, this percentage is increased by approximately 39%, as a maximum, with respect to the maximum values published in other works under ambient conditions [
1,
12,
67,
68]. On the other hand, in the high normal stress range (100, 200 and 300 kPa), the values obtained at the different applied humidities are similar to those published by other authors at different humidities [
8] and, at most, 19% higher than those published under ambient conditions [
1,
12,
67,
68].
Finally, with all these results the trend observed was that, in general, the value of the internal friction angle increased with increasing moisture content of the sample, with the only exception of the value obtained at 12.0% moisture. A similar trend was observed in other works [
8,
42], although in the latter the published data referred to the angle of repose, a parameter that is closely related to the internal friction angle of the material.
The relatively small differences found between all these values can be attributed to differences in moisture content of the samples used, particle arrangement, bulk density, particle orientation within the shear box, shear banding, consolidation time and particle shape [
8].
Regarding the apparent cohesion, the range of values obtained here are slightly lower (8%) than those provided for the same material subjected to environmental conditions [
62] and overlaps with those reported by other authors [
12]. No significant values have been obtained in any case since the maximum value was 11.36 kPa. Similar differences were obtained when analyzing the resulting values at high and low normal stresses. In this case, the highest value obtained at high normal stresses was 26.38 kPa at 12.0% humidity, a value that in this case cannot be disregarded but overlaps with those reported in the referred literature.
4.2.2. Dilatancy Angle
As there are no similar works in the literature in which this parameter has been determined for this same material at different moisture contents, the only values with which it has been possible to establish a certain comparison are those published in previous works with the material subjected to environmental conditions [
12,
62]. In these cases, the environmental humidities determined were 13.71 and 12.77%, respectively. The values obtained here overlap with those reported in those works. In general, the trend observed is that the dilatancy angle decreases as the applied normal stress increases, coinciding with that corroborated in other works using granular agricultural materials [
12,
49,
69]. Finally, no direct relationship was observed between the dilatancy angle and the moisture content of the samples.
4.2.3. Oedometric Assays
The values obtained in this work ranged between 7.01 and 8.34 kN/m
3, within the values reported by other authors in previous works [
1,
8,
62,
67,
68,
70]. When analyzing the values of the apparent specific weight obtained just before starting the assays (with zero normal stress), they ranged between 7.01 and 7.04 kN/m
3, thus being within the range provided by other authors for this material in a humidity range between 10 and 20% [
8].
On the other hand, in the assays carried out, it was determined that the apparent specific weight increased as the moisture content of the samples increased. Thus, the highest values were reached at the highest applied moisture content (17.4%), reaching the maximum value (8.34 kN/m
3) at the highest applied normal stress (256 kPa). However, this tendency does not correspond to that observed in other studies with other granular agricultural materials in which it was found that the value of this parameter decreases with increasing moisture content [
22,
27,
28,
29,
43]. In addition, in work carried out with corn kernels [
24,
48] the bulk density increased as the moisture content of the sample increased. This trend could not be corroborated by the authors in tests on wheat samples [
26]. In the same sense, the trend observed in the present work also disagrees with the predictions made with some numerical models for wheat [
48,
49]. These models consider that this material is more compressible as its moisture content increases, predicting a reduction in bulk density as the moisture content of the sample increases. However, in the case of maize, some authors have obtained values with compacted material that do not follow this trend [
8]. Other authors [
50] have even shown that without applying any normal stress, bulk density decreases with increasing moisture content, whereas when increasing normal stress is applied, as occurs in the assays developed here, bulk density increases until it approaches to the same maximum value regardless of moisture content of the sample. The results obtained in this work may have been influenced by the orientation of the grains in the presence of water, as well as by the disposition of the particles of the material inside the edometric cells used.
Nowadays, society is increasingly aware of the need to optimize the use of natural resources and to minimize the occupational risks, costs and environmental impacts of all construction projects and industrial processes. Therefore, with regard to the design of facilities and infrastructures for the handling and storage of granular and powdered materials, it is essential that they are adequate, efficient and economical [
48]. In this sense, numerous studies have been carried out in which the fundamental role played by the mechanical properties determined in this work in the behavior of the material both when it is stored and when it flows has been found [
48,
49,
50,
51,
52,
53]. These properties depend to a large extent on certain factors, such as the humidity of the material when it is stored, the temperature, the relative humidity of the air, etc. Therefore, in order to increase the level of existing knowledge and facilitate the design and management of these facilities, it is necessary to develop similar tests with other granular agricultural materials.
5. Conclusions
From the direct shear assays, it was found that the values obtained for the angle of internal friction and apparent cohesion were similar to those reported in the literature.
The values of the internal friction angle were approximately 60% lower than those obtained in triaxial tests under ambient conditions. In addition, the values obtained for this parameter increased with increasing moisture content of the samples, which coincides with the trend found in other published works.
Since there are no similar works in the literature, it was not possible to compare the dilatancy angle values for maize at different moisture contents. However, the results obtained here are similar to those reported for the same material under ambient conditions. It was possible to corroborate that the dilatancy angle decreases as the applied normal stress increases. Nevertheless, it was not possible to confirm that there is a direct relationship between the values of this parameter and the moisture content of the sample.
In general, the values obtained for the apparent specific weight are in the range of the values found in the literature. These values increased as the moisture content of the sample increased, which differed with those published in some works.
The values obtained may be useful for optimizing the design of structures and equipment for handling bulk solids.
Author Contributions
Conceptualization, M.M.; methodology, M.M. and J.R.V.; software, M.M.; validation, M.M., J.R.V., D.S. and J.A.R.; formal analysis, M.M., D.S. and J.A.R.; investigation, M.M., J.R.V., D.S. and J.A.R.; data curation, M.M., D.S. and J.A.R.; writing—original draft preparation, M.M.; writing—review and editing, M.M., J.R.V., D.S. and J.A.R.; supervision, M.M., J.R.V., D.S. and J.A.R.; funding acquisition, M.M. and J.R.V. All authors have read and agreed to the published version of the manuscript.
Funding
This research and APC was funded by the Spanish “Agencia Estatal de Investigación” via the research project “Study of the structural behavior of corrugated wall silos using Discrete Element Models (SILODEM)”, grant number PID2019-107051GB-I00/AEI/10.13039/501100011033.
Data Availability Statement
Not applicable.
Acknowledgments
The authors thank Leonesa Astur de Piensos, S.A. (LESA) company for providing the wheat used in this research.
Conflicts of Interest
The authors declare no conflict of interest. The funders had no role in the design of the study; in the collection, analyses, or interpretation of data; in the writing of the manuscript, or in the decision to publish the results.
References
- Lebègue, Y.; Boudakian, A. Bases Des Règles « Silos » Du SNBATI—Essais Sur Les Produits et Principes Des Formules « Silos ». Ann. ITBTP 1989, 69–113. [Google Scholar]
- Thompson, S. A.; Bucklin, R. A.; Batich, C.D. Variation in the Apparent Coefficient of Friction of Wheat on Galvanized Steel. Transactions of the American Society of Agricultural Engineers 1988, 31, 1518–1524. [Google Scholar] [CrossRef]
- Bucklin, R.A.; Thompson, S.A.; Ross, I.J.; Biggs, R.H. Apparent Dynamic Coefficient of Friction of Corn on Galvanized Steel Bin Wall Material. Transactions of the American Society of Agricultural Engineers 1993, 36, 1915–1918. [Google Scholar] [CrossRef]
- Bucklin, R.A.; Molenda, M.; Bridges, T.C.; Ross, I.J. Slip-Stick Frictional Behavior of Wheat on Galvanized Steel. Transactions of the American Society of Agricultural Engineers 1996, 39, 649–653. [Google Scholar] [CrossRef]
- Thompson, S.A.; Ross, I.J. Compressibility and Frictional Coefficients of Wheat. Transactions of the ASAE 1983, 26, 1171–1176. [Google Scholar] [CrossRef]
- Molenda, M.; Thompson, S.A.; Ross, I.J. Friction of Wheat on Corrugated and Smooth Galvanized Steel Surfaces. Journal of Agricultural and Engineering Research 2000, 77, 209–219. [Google Scholar] [CrossRef]
- Horabik, J.; Molenda, M. Mechanical Properties of Granular Materials and Their Impact on Load Distribution in Silo: A Review. Scientia Agriculturae Bohemica 2014, 45, 203–211. [Google Scholar] [CrossRef]
- Molenda, M.; Horabik, J. Mechanical Properties of Granular Agro-Materials and Food Powders for Industrial Practice. Part I: Characterization of Mechanical Properties of Particulate Solids for Storage and Handling; Horabik, J., Laskowski, J., Eds.; Institute of Agrophysics Polish Academy of Science: Lublin (Poland), 2005. [Google Scholar]
- Stasiak, M.; Molenda, M.; Horabik, J. Determination of Modulus of Elasticity of Cereals and Rapeseeds Using Acoustic Method. J Food Eng 2007, 82, 51–57. [Google Scholar] [CrossRef]
- Molenda, M.; Horabik, J.; Ross, I.J.; Montross, M.D. Friction of Wheat: Grain-on-Grain and on Corrugated Steel. Transactions of the American Society of Agricultural Engineers 2002, 45, 415–420. [Google Scholar] [CrossRef]
- Ramírez, A.; Moya, M.; Ayuga, F. Determination of the Mechanical Properties of Powdered Agricultural Products and Sugar. Particle and Particle Systems Characterization 2010, 26, 220–230. [Google Scholar] [CrossRef]
- Moya, M.; Aguado, P.J.; Ayuga, F. Mechanical Properties of Some Granular Agricultural Materials Used in Silo Design. Int Agrophys 2013, 27, 181–193. [Google Scholar] [CrossRef]
- Moya, M.; Guaita, M.; Aguado, P.; Ayuga, F. Mechanical Properties of Granular Agricultural Materials, Part 2. Trans ASABE 2006, 49, 479–489. [Google Scholar] [CrossRef]
- Wójcik, A.; Frączek, J. The Problem of Standardising the Static Friction Force Measurement in Plant Granular Materials. Powder Technol 2022. [Google Scholar] [CrossRef]
- Janssen, H. Versuche Über Getreidebruck in Silozellen. Zeitschrift des Vereines deutscher Ingenieure 1895, 1045–1049. [Google Scholar]
- Jofriet, J.C.; Lelievre, B.; Fwa, T.F. Friction Model for Finite Element Analyses of Silos. Transactions of the American Society of Agricultural Engineers 1977, 735–740. [Google Scholar] [CrossRef]
- Rotter, J.M.; Holst, J.M.F.G.; Ooi, J.Y.; Sanad, A.M. Silo Pressure Predictions Using Discrete-Element and Finite-Element Analyses. Philosophical Transactions of the Royal Society A: Mathematical, Physical and Engineering Sciences 1998, 356, 2685–2712. [Google Scholar] [CrossRef]
- Ai, J.; Chen, J.F.; Rotter, J.M.; Ooi, J.Y. Finite Element Prediction of Progressively Formed Conical Stockpiles. 1–13.
- Briassoulis, D. Finite Element Analysis of a Cylindrical Silo Shell under Unsymmetrical Pressure Distributions. Comput Struct 2000, 78, 271–281. [Google Scholar] [CrossRef]
- Holst, J.; Doerich, C.; Rotter, J. Accurate Determination of the Plastic Collapse Loads of Shells When Using Finite Element Analyses; 2005; ISBN 9780080446370.
- Ayuga, F.; Guaita, M.; Aguado, P. Static and Dynamic Silo Loads Using Finite Element Models. Journal of Agricultural and Engineering Research 2001, 78, 299–308. [Google Scholar] [CrossRef]
- Gao, M.; Cheng, X.; Du, X. Simulation of Bulk Density Distribution of Wheat in Silos by Finite Element Analysis. J Stored Prod Res 2018, 77, 1–8. [Google Scholar] [CrossRef]
- Vidal, P.; Gallego, E.; Guaita, M.; Ayuga, F. Simulation of the Filling Pressures of Cylindrical Steel Silos with Concentric and Eccentric Hoppers Using 3-Dimensional Finite Element Models. Trans ASABE 2006, 49, 1881–1895. [Google Scholar] [CrossRef]
- Patwa, A.; Ambrose, R.P.K.; Casada, M.E. Discrete Element Method as an Approach to Model the Wheat Milling Process. Powder Technol 2016, 302, 350–356. [Google Scholar] [CrossRef]
- González-Montellano, C.; Ayuga, F.; Ooi, J.Y. Discrete Element Modelling of Grain Flow in a Planar Silo: Influence of Simulation Parameters. Granular Matter 2011, 13, 149–158. [Google Scholar] [CrossRef]
- González-Montellano, C.; Gallego, E.; Ramírez-Gómez, Á.; Ayuga, F. Three Dimensional Discrete Element Models for Simulating the Filling and Emptying of Silos: Analysis of Numerical Results. Comput Chem Eng 2012, 40, 22–32. [Google Scholar] [CrossRef]
- Höhner, D.; Wirtz, S.; Scherer, V. Experimental and Numerical Investigation on the Influence of Particle Shape and Shape Approximation on Hopper Discharge Using the Discrete Element Method. Powder Technol 2013, 235, 614–627. [Google Scholar] [CrossRef]
- Höhner, D.; Wirtz, S.; Scherer, V. A Study on the Influence of Particle Shape on the Mechanical Interactions of Granular Media in a Hopper Using the Discrete Element Method. Powder Technol 2015, 278, 286–305. [Google Scholar] [CrossRef]
- Markauskas, D.; Ramírez-Gómez, Á.; Kačianauskas, R.; Zdancevičius, E. Maize Grain Shape Approaches for DEM Modelling. Comput Electron Agric 2015, 118, 247–258. [Google Scholar] [CrossRef]
- Kobyłka, R.; Molenda, M. DEM Modelling of Silo Load Asymmetry Due to Eccentric Filling and Discharge. Powder Technol 2013, 233, 65–71. [Google Scholar] [CrossRef]
- Wiacek, J.; Molenda, M. Moisture-Dependent Physical Properties of Rapeseed - Experimental and DEM Modeling. Int Agrophys 2011, 25, 59–65. [Google Scholar]
- Wiącek, J.; Parafiniuk, P.; Molenda, M.; Horabik, J.; Gallego, E. DEM Study of Microstructural Effects in Friction of Wheat on Corrugated Steel Surface. Tribol Int 2023, 183. [Google Scholar] [CrossRef]
- Bagherzadeh Kh., A.; Mirghasemi, A.A.; Mohammadi, S. Numerical Simulation of Particle Breakage of Angular Particles Using Combined DEM and FEM. Powder Technol 2011, 205, 15–29. [Google Scholar] [CrossRef]
- Liu, Y.; Liu, H.; Mao, H. DEM Investigation of the Effect of Intermediate Principle Stress on Particle Breakage of Granular Materials. Comput Geotech 2017, 84, 58–67. [Google Scholar] [CrossRef]
- Sarnavi, H.J.; Noor Mohammadi, A.; Modares Motlagh, A.; Rahmani Didar, A. Dem Model of Wheat Grains in Storage Considering the Effect of Moisture Content in Direct Shear Test. Research Journal of Applied Sciences, Engineering and Technology 2013, 5, 829–841. [Google Scholar] [CrossRef]
- Kruszelnicka, W.; Diviš, J.; Hlosta, J.; Gierz, Ł.; Žurovec, D. Calibration of Selected Bulk Biomaterials Parameters for DEM Simulation of Comminution Process. Case Study – Corn and Rice Grains. Advances in Science and Technology Research Journal 2022, 16, 64–77. [Google Scholar] [CrossRef]
- Horabik, J.; Parafiniuk, P.; Molenda, M. Stress Profile in Bulk of Seeds in a Shallow Model Silo as Influenced by Mobilisation of Particle-Particle and Particle-Wall Friction: Experiments and DEM Simulations. Powder Technol 2018, 327, 320–334. [Google Scholar] [CrossRef]
- Zheng, Z.; Zang, M.; Chen, S.; Zhao, C. An Improved 3D DEM-FEM Contact Detection Algorithm for the Interaction Simulations between Particles and Structures. Powder Technol 2017, 305, 308–322. [Google Scholar] [CrossRef]
- Rotter, J.M.; Holst, J.M.F.G.; Ooi, J.Y.; Sanad, A.M. Silo Pressure Predictions Using Discrete-Element and Finite-Element Analyses. Philosophical Transactions of the Royal Society A: Mathematical, Physical and Engineering Sciences 1998, 356, 2685–2712. [Google Scholar] [CrossRef]
- Rodrigues, G.B.; Resende, O.; Oliveira, D.E.C. de; Silva, L.C. de M.; Junior, W.N.F. Mechanical Properties of Grains Sorghum Subjected to Compression at Different Moisture Contents. Journal of Agricultural Science 2019, 11, 279. [Google Scholar] [CrossRef]
- Zhu, X.; Chi, R.; Ma, Y. Effects of Corn Varieties and Moisture Content on Mechanical Properties of Corn. Agronomy 2023, 13. [Google Scholar] [CrossRef]
- Seifi, M.R.; Alimardani, R. The Moisture Content Effect on Some Physical and Mechanical Properties of Corn (Sc 704). Journal of Agricultural Science 2010, 2. [Google Scholar] [CrossRef]
- Zaalouk, A.K.; Zabady, F.I. Effect of Moisture Content on Angle of Repose and Friction Coefficient of Wheat Grain. Misr Journal of Agricultural Engineering 2009, 26, 418–427. [Google Scholar] [CrossRef]
- Kibar, H.; Öztürk, T.; Esen, B. The Effect of Moisture Content on Physical and Mechanical Properties of Rice (Oryza Sativa L.). Spanish Journal of Agricultural Research 2010, 8, 741–749. [Google Scholar] [CrossRef]
- Chandio, F.A.; Li, Y.; Ma, Z.; Ahmad, F.; Syed, T.N.; Shaikh, S.A.; Tunio, M.H. Influences of Moisture Content and Compressive Loading Speed on the Mechanical Properties of Maize Grain Orientations. International Journal of Agricultural and Biological Engineering 2021, 14, 41–49. [Google Scholar] [CrossRef]
- Tabatabaeefar, A. Moisture-Dependent Physical Properties of Wheat. Int Agrophys 2003, 17, 207–211. [Google Scholar]
- Davies, R.M.; El-Okene, A.M. Moisture-Dependent Physical Properties of Soybeans. Int Agrophys 2009, 23, 299–303. [Google Scholar]
- Kruszelnicka, W.; Chen, Z.; Ambrose, K. Moisture-Dependent Physical-Mechanical Properties of Maize, Rice, and Soybeans as Related to Handling and Processing. Materials 2022, 15. [Google Scholar] [CrossRef] [PubMed]
- Moya, M.; Sánchez, D.; Romero, J.Á.; Villar-García, J.R. Influence of Moisture Content on Some Mechanical Properties of Wheat. Agronomy 2024, 14. [Google Scholar] [CrossRef]
- Carman, K. Some Physical Properties of Lentil Seeds. J. agric. Engng Res 1996, 63, 87–92. [Google Scholar] [CrossRef]
- Dutta, S.K.; Nema, V.K.; Bhardwaj, R.K. Physical Properties of Gram. Journal of Agricultural Engineering Research 1988, 39, 259–268. [Google Scholar] [CrossRef]
- Shepherd·, H. ; Bhardwaj·, ; R K Moisture-Dependent Physical Properties of Pigeon Pea; 1986; Vol. 35;
- Gorji, A.; Rajabipour, A.; Tavakoli, H. Fracture Resistance of Wheat Grain as a Function of Moisture Content, Loading Rate and Grain Orientation. Aust J Crop Sci 2010, 4, 448–452. [Google Scholar]
- Landi, G.; Barletta, D.; Poletto, M. Modelling and Experiments on the Effect of Air Humidity on the Flow Properties of Glass Powders. Powder Technol 2011, 207, 437–443. [Google Scholar] [CrossRef]
- Louati, H.; Oulahna, D.; de Ryck, A. Effect of the Particle Size and the Liquid Content on the Shear Behaviour of Wet Granular Material. Powder Technol 2017, 315, 398–409. [Google Scholar] [CrossRef]
- Louati, H.; Oulahna, D.; de Ryck, A. Apparent Friction and Cohesion of a Partially Wet Granular Material in Steady-State Shear. Powder Technol 2015, 278, 65–71. [Google Scholar] [CrossRef]
- Frye, K.M.; Marone, C. Effect of Humidity on Granular Friction at Room Temperature. J Geophys Res Solid Earth 2002, 107. [Google Scholar] [CrossRef]
- Nokhodchi, A. An Overview of the Effect of Moisture on Compaction and Compression. Pharmaceutical Technology 2005, 29, 46–66. [Google Scholar]
- Delenne, J.; El Youssoufi, M.; Cherblanc, F.; Bénet, J. Mechanical Behavior and Failure of Cohesive Granular Materials. Int J Numer Anal Methods Geomech 2004, 1577–1594. [Google Scholar] [CrossRef]
- Delenne, J.Y.; Soulié, F.; El Youssoufi, M.S.; Radjai, F. From Liquid to Solid Bonding in Cohesive Granular Media. Mechanics of Materials 2011, 43, 529–537. [Google Scholar] [CrossRef]
- Jiang, M.J.; Yu, H.S.; Harris, D. Bond Rolling Resistance and Its Effect on Yielding of Bonded Granulates by DEM Analyses. Int J Numer Anal Methods Geomech 2006, 30, 723–761. [Google Scholar] [CrossRef]
- Moya, M.; Sánchez, D.; Villar-García, J.R. Values for the Mechanical Properties of Wheat, Maize and Wood Pellets for Use in Silo Load Calculations Involving Numerical Methods. Agronomy 2022, 12. [Google Scholar] [CrossRef]
- UNE-EN ISO 17892-1 Geotechnical Investigation and Testing. Laboratory Testing of Soil. Part 1: Determination of Water Content. 2015.
- UNE-EN ISO 17892-10 Geotechnical Investigation and Testing. Laboratory Testing of Soil. Part 10: Direct Shear Tests 2018.
- UNE-EN ISO 17892-5 Geotechnical Investigation and Testing. Laboratory Testing of Soil. Part 5: Incremental Loading Oedometer Test 2017.
- Bhise, S.; Kaur, A.; Manikantan, M. Moisture Dependent Physical Properties of Maize (PMH-1). Acta Aliment 2014, 43, 394–401. [Google Scholar] [CrossRef]
- Horabik, J.; Molenda, M.; Ross, I.J. Comparison of Load Distribution in Two Similar Grain Bins. Transactions of the ASAE 1995, 38, 1875–1879. [Google Scholar] [CrossRef]
- Reimbert, M.; Reimbert, A. Silos.Theory and Practice; Lavoisier, 1987; ISBN 9782852063655.
- Zeng, C.; Gu, H.; Wang, Y. Stress-Strain Response of Sheared Wheat Granular Material Stored in Silos Using Triaxial Compression Tests. Int Agrophys 2020, 34, 103–114. [Google Scholar] [CrossRef]
- Thompson, S.A.; Galili, N.; Williams, R.A. Vertical Floor Pressures during Filling of a Full-Scale Grain Bin. Transactions of the ASAE 1996, 39, 1093–1100. [Google Scholar] [CrossRef]
Figure 1.
Climatic chamber device used in this work.
Figure 1.
Climatic chamber device used in this work.
Figure 2.
Oven used to determine the moisture content of the sample.
Figure 2.
Oven used to determine the moisture content of the sample.
Figure 3.
Electronic balance of 0.01 g accuracy used in the determination of moisture content.
Figure 3.
Electronic balance of 0.01 g accuracy used in the determination of moisture content.
Figure 4.
Direct shear device available at the geotechnical laboratory.
Figure 4.
Direct shear device available at the geotechnical laboratory.
Figure 5.
Apparatus used in oedometric assays.
Figure 5.
Apparatus used in oedometric assays.
Figure 6.
Oedometric cell used with the maize sample.
Figure 6.
Oedometric cell used with the maize sample.
Figure 7.
Electronic balance of 0.1 g accuracy used in oedometric assays.
Figure 7.
Electronic balance of 0.1 g accuracy used in oedometric assays.
Figure 8.
Scheme of the oedometric assay carried out to determine the apparent specific weight of maize.
Figure 8.
Scheme of the oedometric assay carried out to determine the apparent specific weight of maize.
Figure 9.
Stress-strain curves of maize at the different normal stresses applied and for the two replications carried out at a moisture content of 17.4%. d.b.
Figure 9.
Stress-strain curves of maize at the different normal stresses applied and for the two replications carried out at a moisture content of 17.4%. d.b.
Figure 10.
Stress-strain curves of maize at the different normal stresses applied and for the two replications carried out at a moisture content of 9.3%. d.b.
Figure 10.
Stress-strain curves of maize at the different normal stresses applied and for the two replications carried out at a moisture content of 9.3%. d.b.
Figure 11.
Regression lines obtained for Mohr-Coulomb strength envelopes in direct shear assays at different normal stresses and moisture contents applied to maize samples.
Figure 11.
Regression lines obtained for Mohr-Coulomb strength envelopes in direct shear assays at different normal stresses and moisture contents applied to maize samples.
Figure 12.
Regression lines for the Mohr–Coulomb strength envelopes obtained from direct shear assays conducted at low (10, 20 and 50 kPa) and high (100, 200 and 300 kPa) normal stresses and moisture contents of 9.3% (a) and 14.1% (b), respectively.
Figure 12.
Regression lines for the Mohr–Coulomb strength envelopes obtained from direct shear assays conducted at low (10, 20 and 50 kPa) and high (100, 200 and 300 kPa) normal stresses and moisture contents of 9.3% (a) and 14.1% (b), respectively.
Figure 13.
Regression lines for the Mohr–Coulomb strength envelopes obtained from direct shear assays conducted at low (10, 20 and 50 kPa) and high (100, 200 and 300 kPa) normal stresses and moisture contents of 12.0% (a) and 13.0% (b), respectively.
Figure 13.
Regression lines for the Mohr–Coulomb strength envelopes obtained from direct shear assays conducted at low (10, 20 and 50 kPa) and high (100, 200 and 300 kPa) normal stresses and moisture contents of 12.0% (a) and 13.0% (b), respectively.
Figure 14.
Deformation curves for maize samples with (a) 17.4% moisture content and (b) 13.0% moisture content.
Figure 14.
Deformation curves for maize samples with (a) 17.4% moisture content and (b) 13.0% moisture content.
Figure 15.
Variation of apparent specific weight with applied normal stress for each of the moisture contents assayed with maize samples.
Figure 15.
Variation of apparent specific weight with applied normal stress for each of the moisture contents assayed with maize samples.
Figure 16.
Variation of apparent specific weight with moisture content for each of the normal stresses applied to maize samples.
Figure 16.
Variation of apparent specific weight with moisture content for each of the normal stresses applied to maize samples.
Table 1.
Combinations of temperature (°C) and humidity (%) and actual moisture content of maize samples (d.b.) after oven drying at 105–110 °C.
Table 1.
Combinations of temperature (°C) and humidity (%) and actual moisture content of maize samples (d.b.) after oven drying at 105–110 °C.
| Climatic Chamber Conditions |
Moisture Content (d.b.)
(%) |
| Temperature (°C) |
Relative Humidity (%) |
| 55 |
25 |
9.3 |
| 20 |
35 |
12.0 |
| 20 |
45 |
13.0 |
| 20 |
65 |
14.1 |
| 20 |
90 |
17.4 |
Table 2.
Mean ± standard deviation for the angle of internal friction and the apparent cohesion at the different moisture contents assayed.
Table 2.
Mean ± standard deviation for the angle of internal friction and the apparent cohesion at the different moisture contents assayed.
Moisture Content
(%) (d.b.) |
Angle of Internal Friction (ϕ) |
Apparent Cohesion (C, kPa) |
| 9.3 |
29.4° ± 0.5 |
11.36 ± 1.80 |
| 12.0 |
28.5° ± 0.8 |
10.46 ± 2.84 |
| 13.0 |
29.8° ± 0.5 |
8.04 ± 1.97 |
| 14.1 |
29.9° ± 0.4 |
10.47 ± 1.42 |
| 17.4 |
32.4° ± 0.6 |
9.56± 2.14 |
Table 3.
Mean ± standard deviation for the angle of internal friction and the apparent cohesion at the different moisture contents tested (d.b.) for ranges of low (10, 20 and 50 kPa) and high (100, 200 and 300 kPa) normal stresses.
Table 3.
Mean ± standard deviation for the angle of internal friction and the apparent cohesion at the different moisture contents tested (d.b.) for ranges of low (10, 20 and 50 kPa) and high (100, 200 and 300 kPa) normal stresses.
Moisture
Content
(%) (d.b.) |
Angle of Internal Friction (ϕ) |
Apparent Cohesion (C, kPa) |
| Low Normal Stresses |
High Normal Stresses |
Low Normal Stresses |
High Normal Stresses |
| 9.3 |
35.3° ± 1.3 |
28.3° ± 1.1 |
6.80 ± 1.11 |
16.65 ± 5.57 |
| 12.0 |
25.1° ± 2.2 |
25.5° ± 1.5 |
9.74 ± 1.46 |
26.38 ± 6.85 |
| 13.0 |
32.2° ± 0.8 |
30.4° ± 1.5 |
7.16 ± 0.61 |
4.85 ± 7.55 |
| 14.1 |
31.7° ± 1.6 |
29.6° ± 1.1 |
9.05 ± 1.24 |
12.43 ± 5.25 |
| 17.4 |
37.5° ± 2.1 |
32.2° ± 1.4 |
6.10 ± 1.88 |
10.16± 7.57 |
Table 4.
Mean ± standard deviation for the dilatancy angle under the normal stresses assayed.
Table 4.
Mean ± standard deviation for the dilatancy angle under the normal stresses assayed.
Normal Stress
(kPa) |
Dilatancy Angle (Ψ) |
| Moisture Content (d.b.) |
|---|
| 9.3% |
12.0% |
13.0% |
14.1% |
17.4% |
| 10 |
19.3° ± 3.6 |
20.8° ± 1.0 |
29.9° ± 1.6 |
24.8° ± 6.7 |
30.7° ± 0.7 |
| 20 |
22.1° ± 2.5 |
21.5° ± 1.3 |
27.0° ± 2.9 |
24.8° ± 1.3 |
20.3° ± 4.7 |
| 50 |
24.1° ± 7.2 |
19.4° ± 0.7 |
20.4° ± 1.5 |
20.8° ± 3.3 |
22.4° ± 6.1 |
| 100 |
16.7° ± 0.8 |
17.5° ± 0.9 |
13.9° ± 1.6 |
17.1° ± 4.0 |
18.9° ± 2.4 |
| 200 |
11.1° ± 0.5 |
9.9° ± 1.1 |
12.7° ± 0.4 |
10.2°± 3.6 |
15.3°± 4.3 |
| 300 |
4.4° ± 2.5 |
8.1° ± 2.2 |
9.2° ± 0.5 |
7.5° ± 0.8 |
7.4° ± 2.2 |
Table 5.
Mean ± standard deviation for the apparent specific weight under the normal stresses assayed.
Table 5.
Mean ± standard deviation for the apparent specific weight under the normal stresses assayed.
Normal Stress
(kPa) |
Apparent Specific Weight (γ) (kN/m3) |
| Moisture Content |
|---|
| 9.3% |
12.0% |
13.0% |
14.1% |
17.4% |
| 0 |
7.03 ± 0.01 |
7.01 ± 0.01 |
7.04 ± 0.07 |
7.02 ± 0.01 |
7.02 ± 0.01 |
| 8 |
7.04 ± 0.01 |
7.03 ± 0.03 |
7.13 ± 0.01 |
7.11 ± 0.01 |
7.34 ± 0.09 |
| 16 |
7.06 ± 0.02 |
7.07 ± 0.03 |
7.17 ± 0.02 |
7.18 ± 0.01 |
7.41 ± 0.11 |
| 32 |
7.09 ± 0.02 |
7.13 ± 0.02 |
7.24 ± 0.03 |
7.29 ± 0.03 |
7.55 ± 0.12 |
| 64 |
7.13 ± 0.04 |
7.20 ± 0.03 |
7.30 ± 0.03 |
7.37 ± 0.03 |
7.74 ± 0.13 |
| 128 |
7.19 ± 0.04 |
7.28 ± 0.05 |
7.40 ± 0.04 |
7.51 ± 0.05 |
8.00 ± 0.12 |
| 256 |
7.28 ± 0.04 |
7.42 ± 0.06 |
7.53 ± 0.07 |
7.64 ± 0.05 |
8.34 ± 0.13 |
| 128 |
7.25 ± 0.04 |
7.40 ± 0.06 |
7.51 ± 0.07 |
7.62 ± 0.05 |
8.34 ± 0.14 |
| 64 |
7.23 ± 0.03 |
7.38 ± 0.06 |
7.49 ± 0.07 |
7.60 ± 0.05 |
8.32 ± 0.14 |
| 32 |
7.21 ± 0.03 |
7.36 ± 0.06 |
7.47 ± 0.06 |
7.59 ± 0.04 |
8.31 ± 0.13 |
| 16 |
7.19 ± 0.02 |
7.35 ± 0.06 |
7.47 ± 0.02 |
7.57 ± 0.04 |
8.31 ± 0.14 |
| 8 |
7.18 ± 0.04 |
7.33 ± 0.06 |
7.46 ± 0.01 |
7.56 ± 0.03 |
8.32 ± 0.14 |
|
Disclaimer/Publisher’s Note: The statements, opinions and data contained in all publications are solely those of the individual author(s) and contributor(s) and not of MDPI and/or the editor(s). MDPI and/or the editor(s) disclaim responsibility for any injury to people or property resulting from any ideas, methods, instructions or products referred to in the content. |
© 2024 by the authors. Licensee MDPI, Basel, Switzerland. This article is an open access article distributed under the terms and conditions of the Creative Commons Attribution (CC BY) license (https://creativecommons.org/licenses/by/4.0/).
