Preprint
Article

Prediction of Changes in Laver (Gim) Aquaculture Based on IPCC Projected Scenarios on Climate Change: A Case in the Republic of Korea

Altmetrics

Downloads

110

Views

34

Comments

0

This version is not peer-reviewed

Submitted:

21 May 2024

Posted:

23 May 2024

You are already at the latest version

Alerts
Abstract
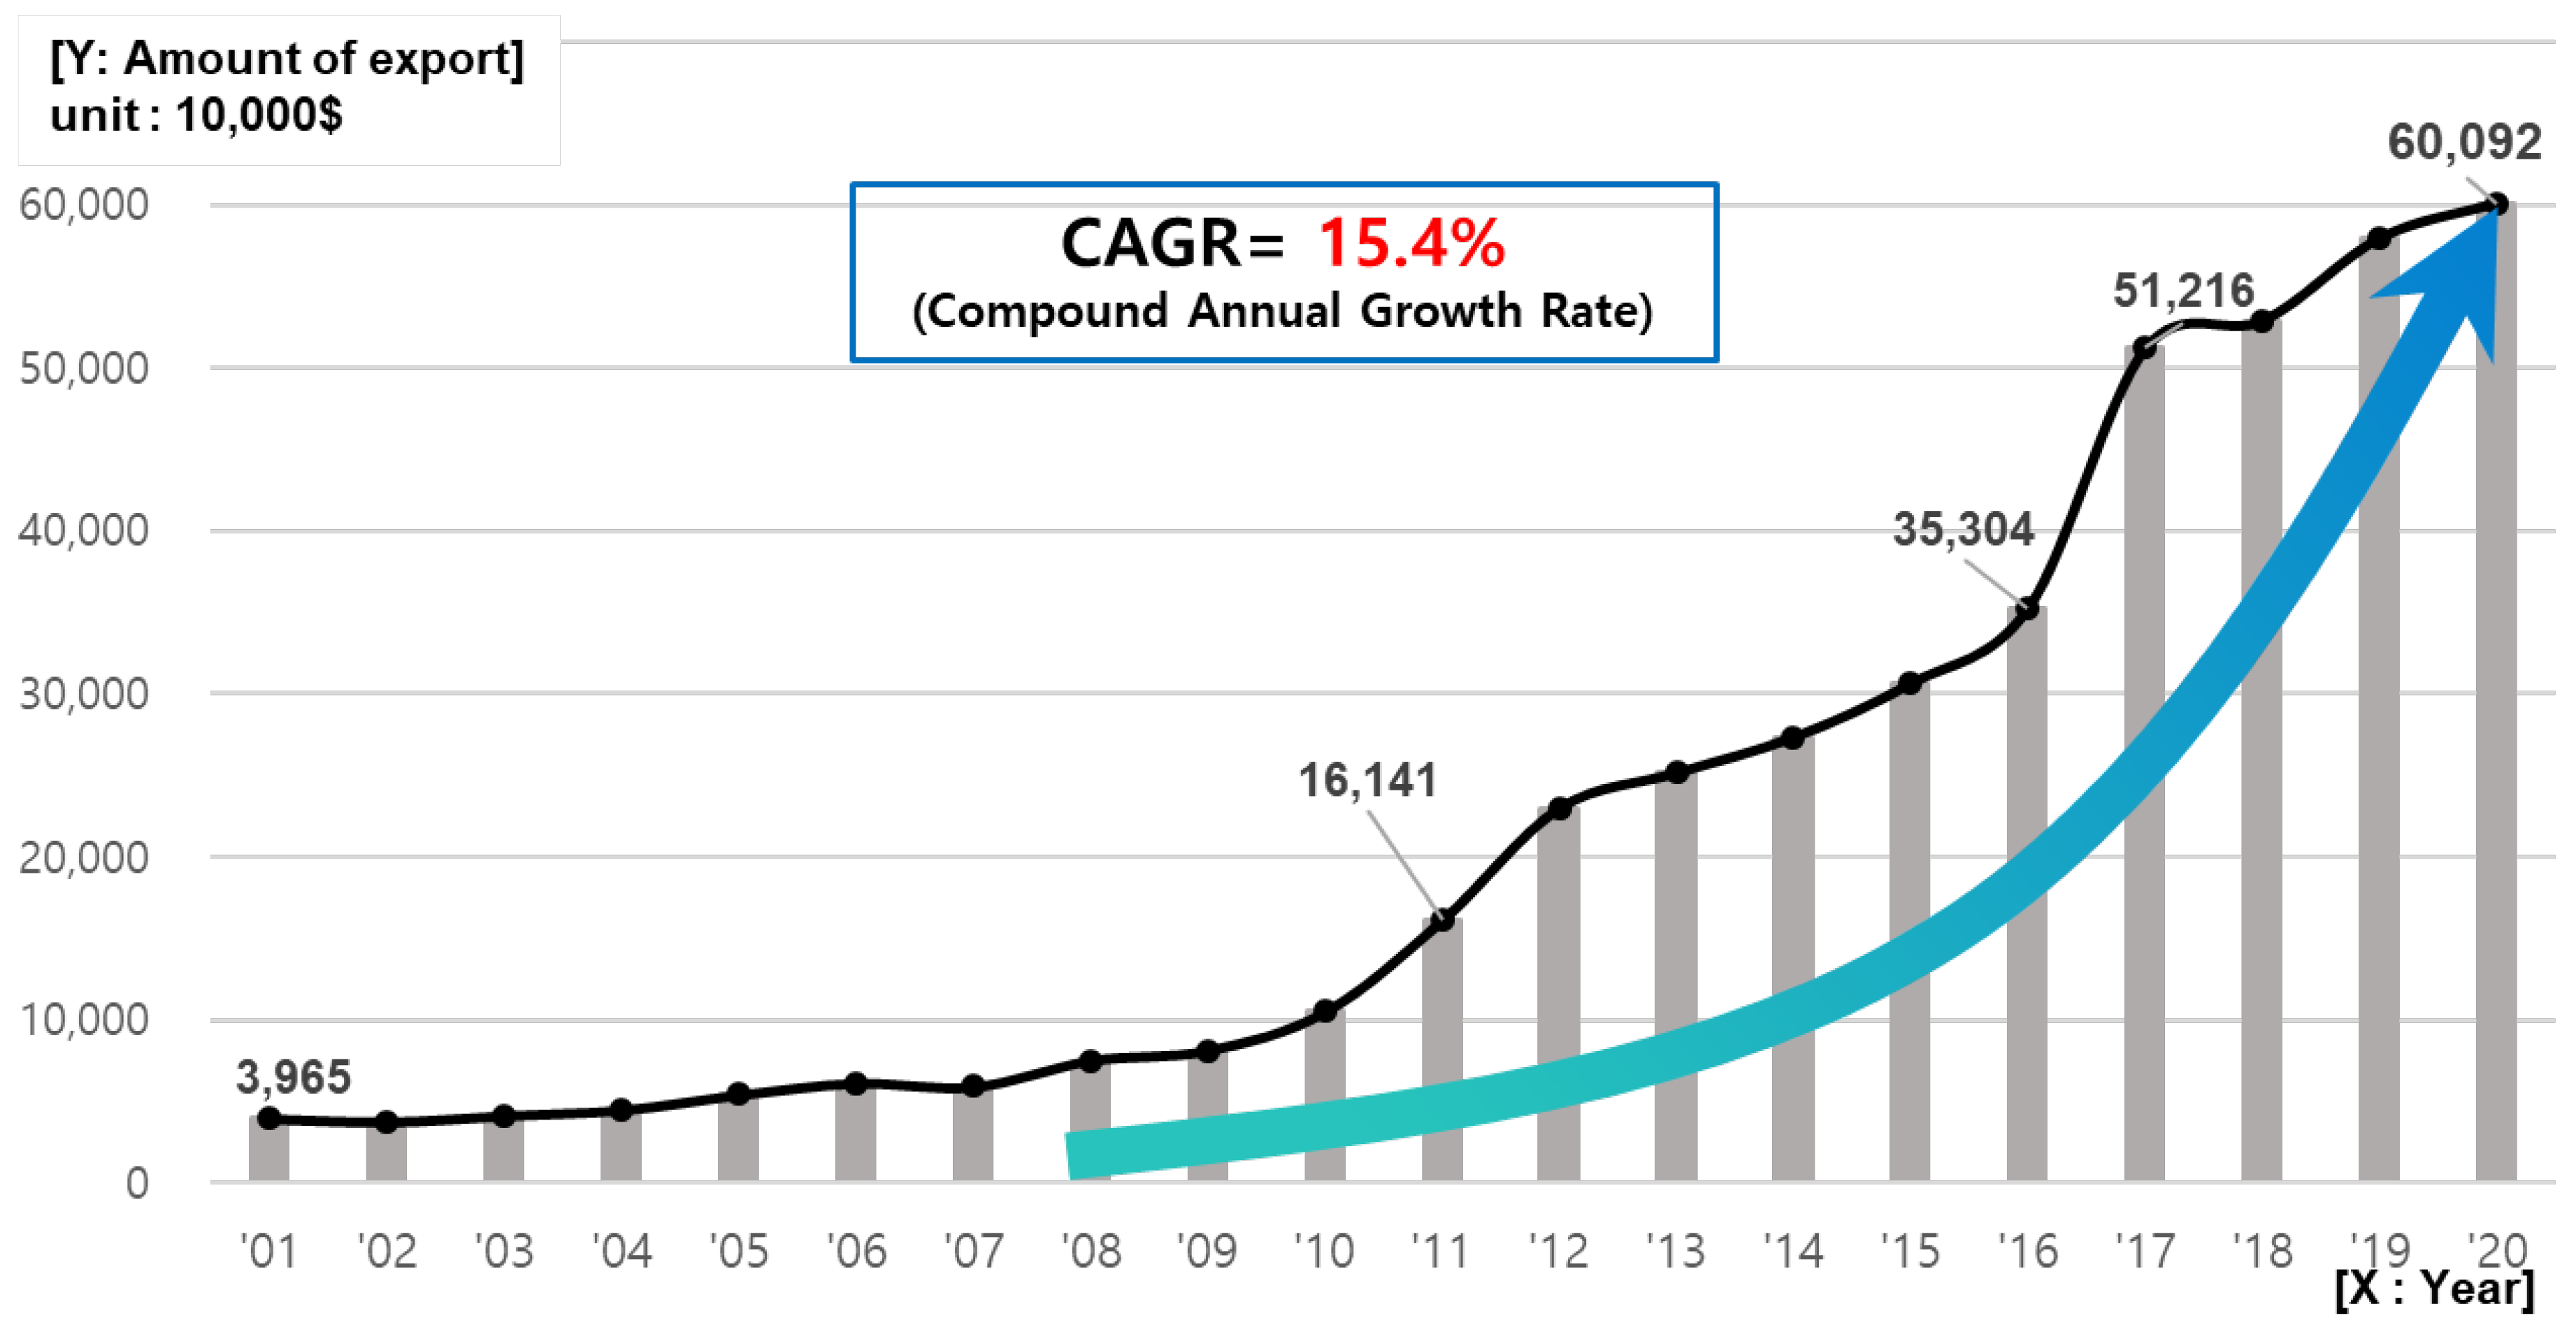
In Korea, laver (Gim) is the leading traded marine product and an important food source, accounting for 82.0% of the world’s exports. Laver exports reached $100 million in 2010 and steadily increased to $600 million in 2020. An increase in laver exports improves the income of laver farmers and promotes the growth of fisheries. However, marine algae are vulnerable to climate change. In this study, we aimed to predict changes in laver production due to climate change using environmental variables, including water temperature, rainfall, and sunlight duration. The results showed that water temperature considerably affected laver production; when water temperature increased by 1 °C, production decreased by 13.78% (t) in the same month. By contrast, when sunlight duration and rainfall increased by 1 h and 1 mm, respectively, 1 month before harvesting laver, production increased by 0.32% (t-1) and 0.13% (t-1), respectively. Using four scenarios based on climate change published by the Intergovernmental Panel on Climate Change in a modeling exercise, we found that laver production in 2100 in Wando in Korea may decline by 73.3% owing to water temperature changes (based on 2020 production), threatening food security. Accordingly, short-, mid-, and long-term countermeasures are needed for sustainable laver aquaculture. Appropriate water temperature (21–22 °C) during seeding is necessary to control environmental variables, based on scientific data and activation of land-based seeding methods. Moreover, mid- and long-term countermeasures should include development of high-temperature resistant laver seeds, identification of suitable new laver aquaculture grounds, and research on seeds that can adapt to climate change.
Keywords: 
Subject: Social Sciences  -   Other

1. Introduction

The global demand for laver (Gim)1 has been increasing, and Korea accounts for approximately 82% of the world’s laver production, making it the leading laver producer, followed by China and Japan. Thus, changes in laver production in Korea have a considerable impact on the global laver food industry. In recent years, the increase in sea level due to climate change has threatened the aquaculture industry, and its unprecedented impact on aquaculture products and marine life is increasing [1,2,3,4]. A global mean temperature rise of 2 °C could lead to a sea level rise of ≥1 m, and certain parts of the world, including countries in the South Pacific, are expected to be submerged by seawater [5,6]. No country is spared the effects of climate change, and a close association between climate change and food, population, resources, and environmental crises will eventually lead to a national crisis in Korea [7,8]. Accordingly, climate change is an important issue that must not be overlooked because not only does it affect fisheries production, but it also accelerates export, resource, and food crises [4,9,10,11]. In Korea, fish of the Engraulidae family, Todarodes pacificus, Clupea pallasii, and Gadus morhua, have migrated away from their original habitats owing to increased seawater temperature since the 1990s, resulting in reduced catches of pollen (seed), a cold-temperature species [12,13]. Meanwhile, the production of Halocynthia roretzi, Styela clava, and marine algae is gradually declining [14,15,16]. Over the last 100 years, the mean global land temperature has increased by 0.74 ℃; however, in Korea, the temperature has increased by 1.87 ℃, higher than the mean global temperature rise. Consequently, a rapid increase in water temperature in Korea is inevitable and is expected to affect various fisheries areas directly and indirectly, resulting in fewer fish being caught in the future [17,18,19].
Marine algae are particularly vulnerable to climate change, which is expected to cause a variety of problems [20,21]; nevertheless, only a limited number of studies have evaluated the impact [22,23,24]. In particular, only a few studies have explored the effect of climate change on laver. Indeed, most studies have focused on developing marine algae aquaculture as a future energy source to improve the ecological environment.
Kim et al. [23] evaluated the vulnerability to climate change of aquaculture in Korea. The annual change in seawater surface temperature, a factor affecting climate change, was predicted by representative concentration pathway (RCP) 4.5 and RCP 8.5 scenarios. Kim et al. [24] also presented the causality between laver production in Maro-hae (in Jeollanam-do) and factors affecting climate change (such as rainfall, wind speed, duration of sunlight, and farm facilities. Water temperature was found to be a key factor affecting laver production; however, no predictive analyses for laver production have been conducted [21]. Meanwhile, Yong et al. presented marine algal aquaculture as a future sustainable energy source to combat climate change [25]. Oh et al. [26] devised a methodology for the automatic harvesting of laver to reduce risks, and Ahmed et al. [27] indicated that the seaweed industry is a potential sector for sustainable blue economy alternatives and for improving ecological conditions.
One study has demonstrated that the potential impacts of climate change on inland fisheries include increased water temperature, decreased dissolved oxygen (DO) levels, and increased toxicity of contaminants, all of which can change hydrologic regimes and groundwater temperatures, affecting the quality of fish habitat [28]. Further, a study on the effect of water temperature on the susceptibility of cultured marine fish species to vibriosis assessed the correlation between the marine aquaculture environment and pH, DO, and salinity, demonstrating that water temperature had a substantial impact on vibriosis susceptibility and increased fish mortality [29].
According to Kim et al. [23,24] and Nam Yang Fishing Net Co., Ltd. [30], increased water temperature is a major factor directly affecting laver production. However, policy countermeasures are not properly implemented as water temperature increases rapidly in Korea. Thus, laver cultivation is vulnerable to climate change [14,23].
Laver is Korea’s top export and increased by 15.4% from 2010 to 2020 (Figure 1) [31]. The entire production of laver, from processing to export, is conducted in Korea. Moreover, this industry has an annual market value of more than 4 trillion won, thus creating numerous jobs [32,33]. In addition, seaweed absorbs carbon dioxide and help mitigate the progression of marine acidification in response to climate change.
We aimed to establish a model using a 10-year dataset from Wando, a major laver-producing area. A specific objective was to develop measures to meet future laver demands by predicting the production following future environmental changes. Based on previous studies [23,24,30], the factors affecting laver production include water temperature, rainfall, and sunlight duration. Therefore, these environmental variables were selected. Moreover, this study considered the optimum timing of the impacts of environmental variables on laver production. A model including a time lag was used to predict laver production based on previous environmental changes before harvesting. For instance, water temperature and rainfall 1 month prior, as well as 2-month sunlight exposure, could be used to predict production at collection time. Using such production forecasts, the facilities and the workforce required to harvest the laver can be prepared. Various environmental change scenarios were analyzed using the derived model, and measures to avoid a reduction in laver production in Korea based on the results of the quantified analysis were proposed. Briefly, a model for changes in laver production due to climate change was derived. Subsequently, four future scenarios of change in projected laver production for each strategy based on the Intergovernmental Panel on Climate Change (IPCC) predicted data on climate change (water temperature change) were predicted using the analysis model.

2. Material and Methods

We aimed to predict changes in laver production, a typical marine trade product in Korea, in response to climate change. For this, we used environmental variables that affect laver production as derived from previous studies. Through these analyses, the simulation based on the shared socioeconomic pathway (SSP) scenario of IPCC was analyzed to predict future production due to environmental change.

2.1. Study Areas

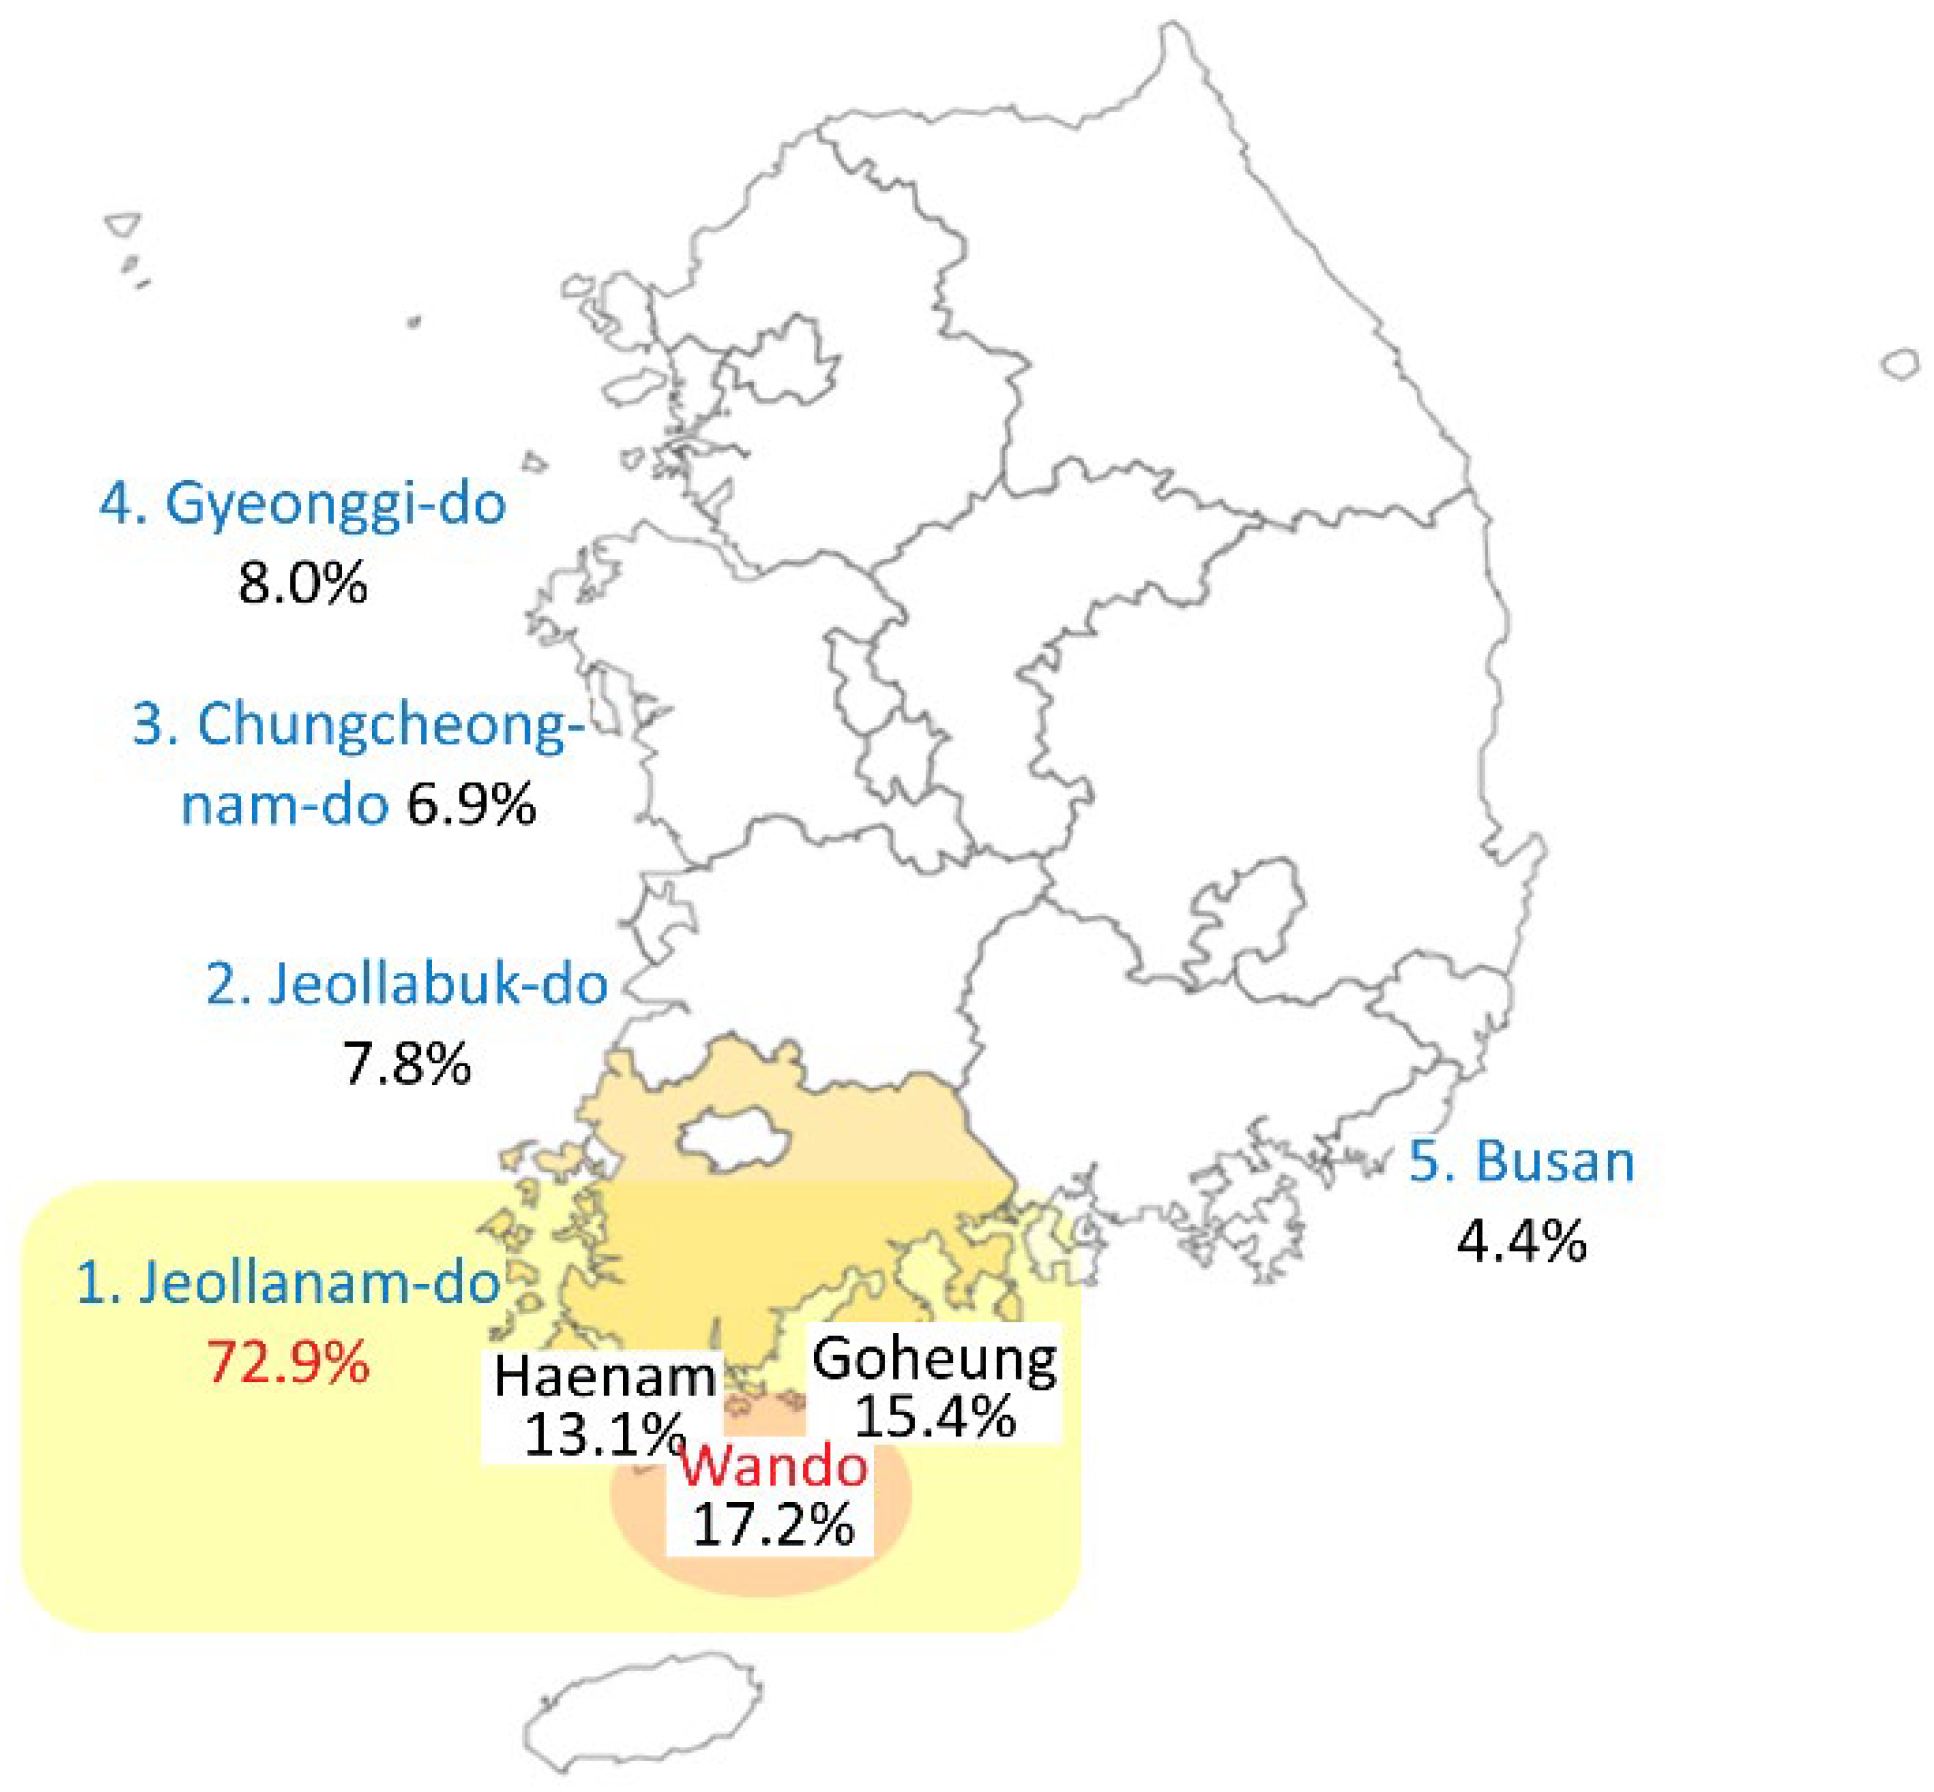
The major producers of laver in Korea are shown in Figure 22. Jeollanam-do is the largest producer of farmed laver and accounts for approximately 73% of overall laver production. Specifically, Wando (17.2%), Goheung-gun (15.4%), and Haenam-gun (13.1%) are the top three producers of laver in the Jeollanam-do region. The Wando fishery, which has 19.8% of all laver-farming households, accounts for the highest percentage. Thus, Wando was selected as the target site in this study as it produces the highest number of laver (GIM) in the country (e.g., laver, Undaria, Saccharina, and Hizikia) [34]. Accordingly, data on laver production and environmental factors from October 2010 to May 2020 in Wando, Jeollanam-do region, were analyzed.

2.2. Multiple Linear Regression

Multiple linear regression was used to analyze the correlation between each factor and laver production. In this context, a model of multiple linear regression can be expressed as follows [35]:
Y i = β 1 + β 2 X 2 i + β 3 X 3 i + + β k X k i + u i ,
where Yi is a dependent variable that represents laver production in Wando; β 1 represents the regression intercept; X is a descriptive variable (regressor) and represents rainfall, sunlight duration, and water temperature; u is a random number or error term; and subscript ‘i’ denotes the ith observation. The STATA/MP version 17.0 was used for multiple regression analysis.

2.3. Data Sources

Data on monthly laver production were collected from the Fisheries Observation Center of the Korean Maritime Institute [36], and the environmental variables and weather observation statistics were collected from the meteorological observation statistics data of the Korea Meteorological Administration [37] (Table 1)3. As the Korea Meteorological Administration only collects some maritime information, and data on environmental variables are limited, only Wando has complete information.

2.4. Data Characteristics

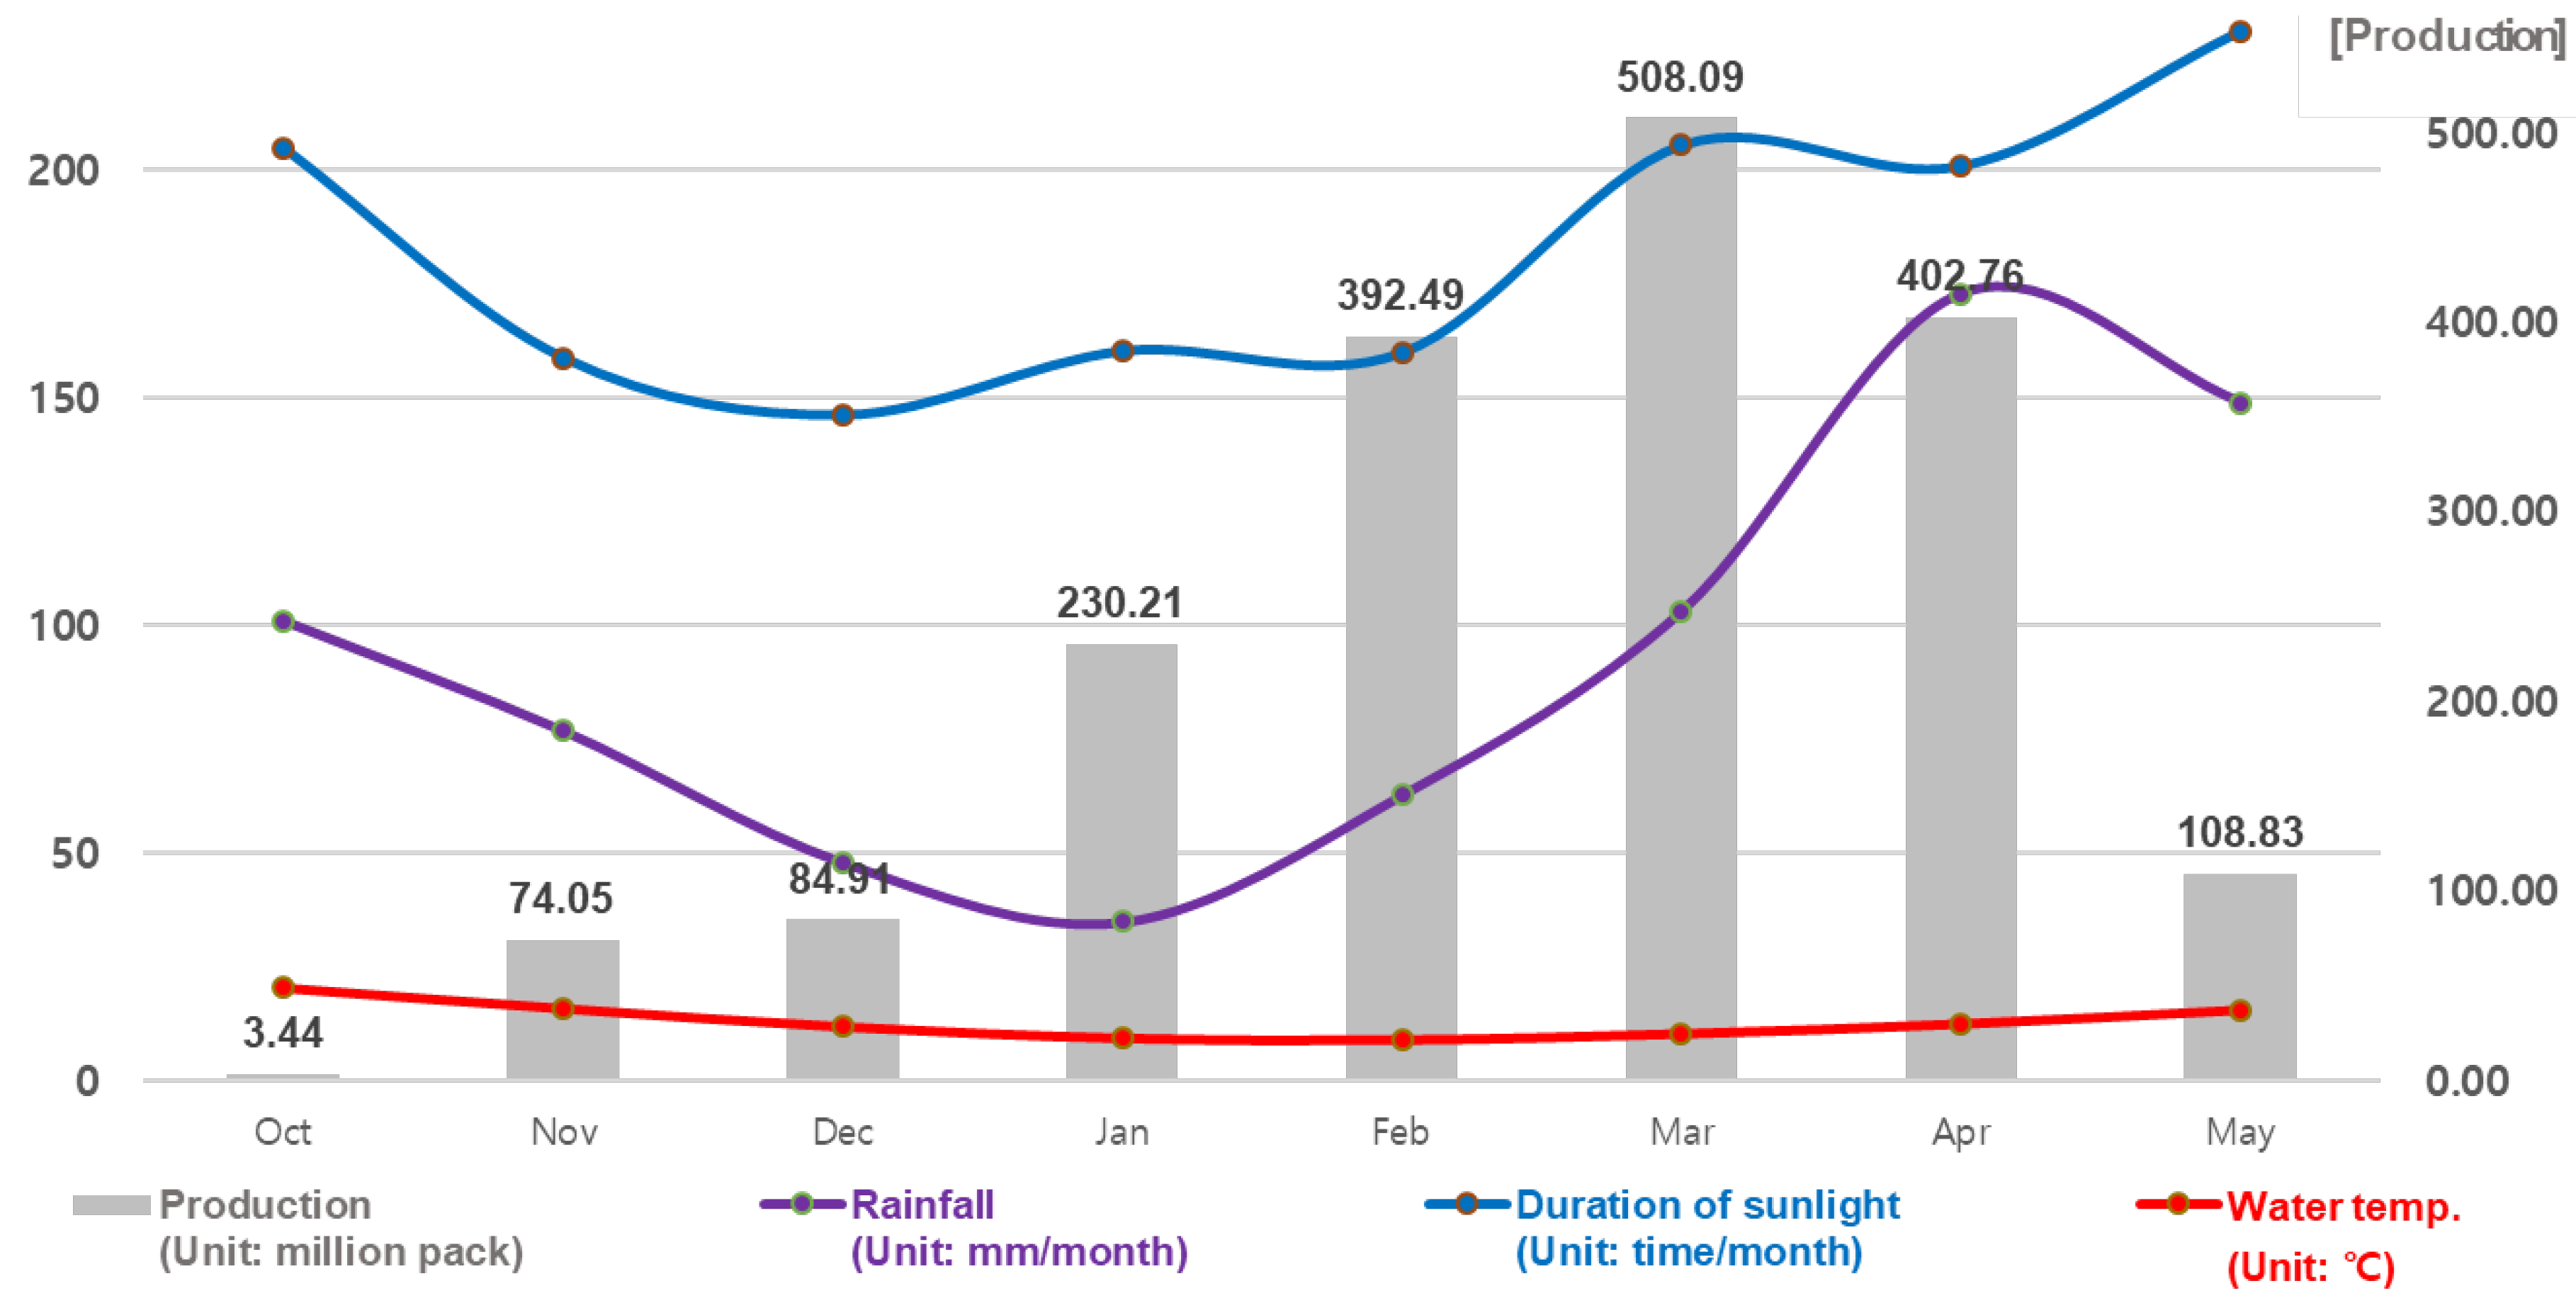
To derive a model for estimating laver production, we obtained monthly production and environmental variables from 2010 to 2020. All variables were continuous. Additionally, data from June to September (no laver production) were excluded. Data from October and May were used for the analysis. The basic statistics used for analysis are shown in Table 2 and Figure 3. The basic characteristics of laver production and environmental variables from Wando that were analyzed in the study are shown in Table 2 and Figure 3

3. Results

3.1. Model Derivation

Previous studies have analyzed the impacts of environmental variables during particular months of laver production [23,24]. However, these studies assumed that the predominant environmental variables prior to laver collection would affect production at a specific time lag rather than in a specific month4. Therefore, a model with an optimum time lag was produced by considering a time lag of 1–2 months in addition to the existing data. The production determination model used in this study is as follows (Equation (2)).
ln l a v e r = α + β 1 R a i n t x + β 2 s u n t y   + β 3 W t e m t z + u i
The dependent variable in the model ln l a v e r represents the value obtained by taking the natural logarithm of the laver production. R a i n t x represents the mean rainfall x month(s) before, s u n t y represents the mean sunlight duration y month(s) before, and W t e m t z represents the mean water temperature z month(s) before. Prior to the analysis, this study added a variable (snowfall) to determine the relationship between laver production and snowfall. Snowfall is also important for nutrient salt; however, obtaining snowfall statistics at the culture site was difficult. In addition, snow only falls for 2–3 months annually in Jeollanam-do regions, thus increasing the standard deviation of snowfall. Thus, owing to the few observable variables, no significant results were derived from the analysis. Therefore, although this model considered additional impacts of snowfall, this was not reflected in the final model because of the limitations in obtaining statistics. We believe that additional verification is necessary by supplementing snowfall-related data and obtaining data on long-term time series. In addition to environmental variables, appropriate time lags that significantly affected laver production were analyzed; the following model (Equation (3)) was produced.
ln l a v e r = α + β 1 R a i n t 1 + β 2 s u n t 1   + β 3 W t e m t 0 + u i

3.2. Relationship between Laver Production and Environmental Variables

This study estimated the optimum time lags using environmental variables and analyzed the correlation between each environmental variable. To test multicollinearity between environmental variables (rainfall [ R a i n t 1 , duration of sunlight [ s u n t 1 , and water temperature [ W t e m t 0 ), correlation levels and variance inflation factors (VIFs) were analyzed. The correlation coefficient was less than the threshold value (0.7), indicating safety in problems with multicollinearity. In the case of VIF, the values of all variables were lower than the threshold value (10), and the mean VIF was 1.65, showing low multicollinearity. Therefore, each factor appears to have independent configuration feasibility, and it is possible to present the production change from a multifaceted aspect if the three environmental variables are combined to measure laver production.
Table 3 presents the study results. The estimation showed that the significance probability of all the factors was less than 0.05. Thus, a p-value of 0.05 is significant. The F statistic for the goodness of fit of the estimated regression model was 25.95 (significance probability of 0.0000), indicating that the analytical model was significant. The adjusted R-squared (Adj R-squared) of all the models was 0.5352, indicating that the estimated explanatory power in this study was 53.52%. The estimated model was a log-level model, and the relative influence of the independent variables as a coefficient was the largest for water temperature, followed by sunlight duration and rainfall. Accordingly, the water temperature suitable for laver aquaculture is approximately 10 °C during the growing season. If the water temperature was ≤10 °C, the growth of laver would be sluggish, and rot disease would be liable to occur when the water temperature was ≥10 °C. When the water temperature was 1 °C higher than the optimum, laver production decreased by 13.7%. From December, when the water temperature dropped, laver production gradually increased, accounting for 50% of the total in March and April. The compensation point for the sunlight duration for laver was 300–500 lx, and it could photosynthesize at low light levels. Accordingly, as the sunlight duration increased by 1 h per month, laver production increased by 0.32%. Therefore, from the winter solstice in December, the sunlight duration increases to ≥200 h on average in March and April as days become longer than the nights. The impact of 1 h of sunlight on the growth of laver is not negligible, given the deteriorating weather conditions during winter. Rainfall affects the concentration of nutrient salts, and an increase in rainfall of 1 mm resulted in an increase in laver production by 0.13%. Although rainfall during the winter season ranges from 100 to 150 mm and is less during the summer season, rainfall greater than the threshold can affect laver production. Thus, adequate rainfall during the laver harvest period is important. Based on this, the final model (Equation (4)) of laver production derived from the estimated results is as follows:
ln l a v e r = 3.2276 + 0.0013 R a i n t 1 + 0.0032 s u n t 1 0.1370 W t e m t 0 + u i

3.3. Future Climate Change/IPCC CMIP6 Scenarios

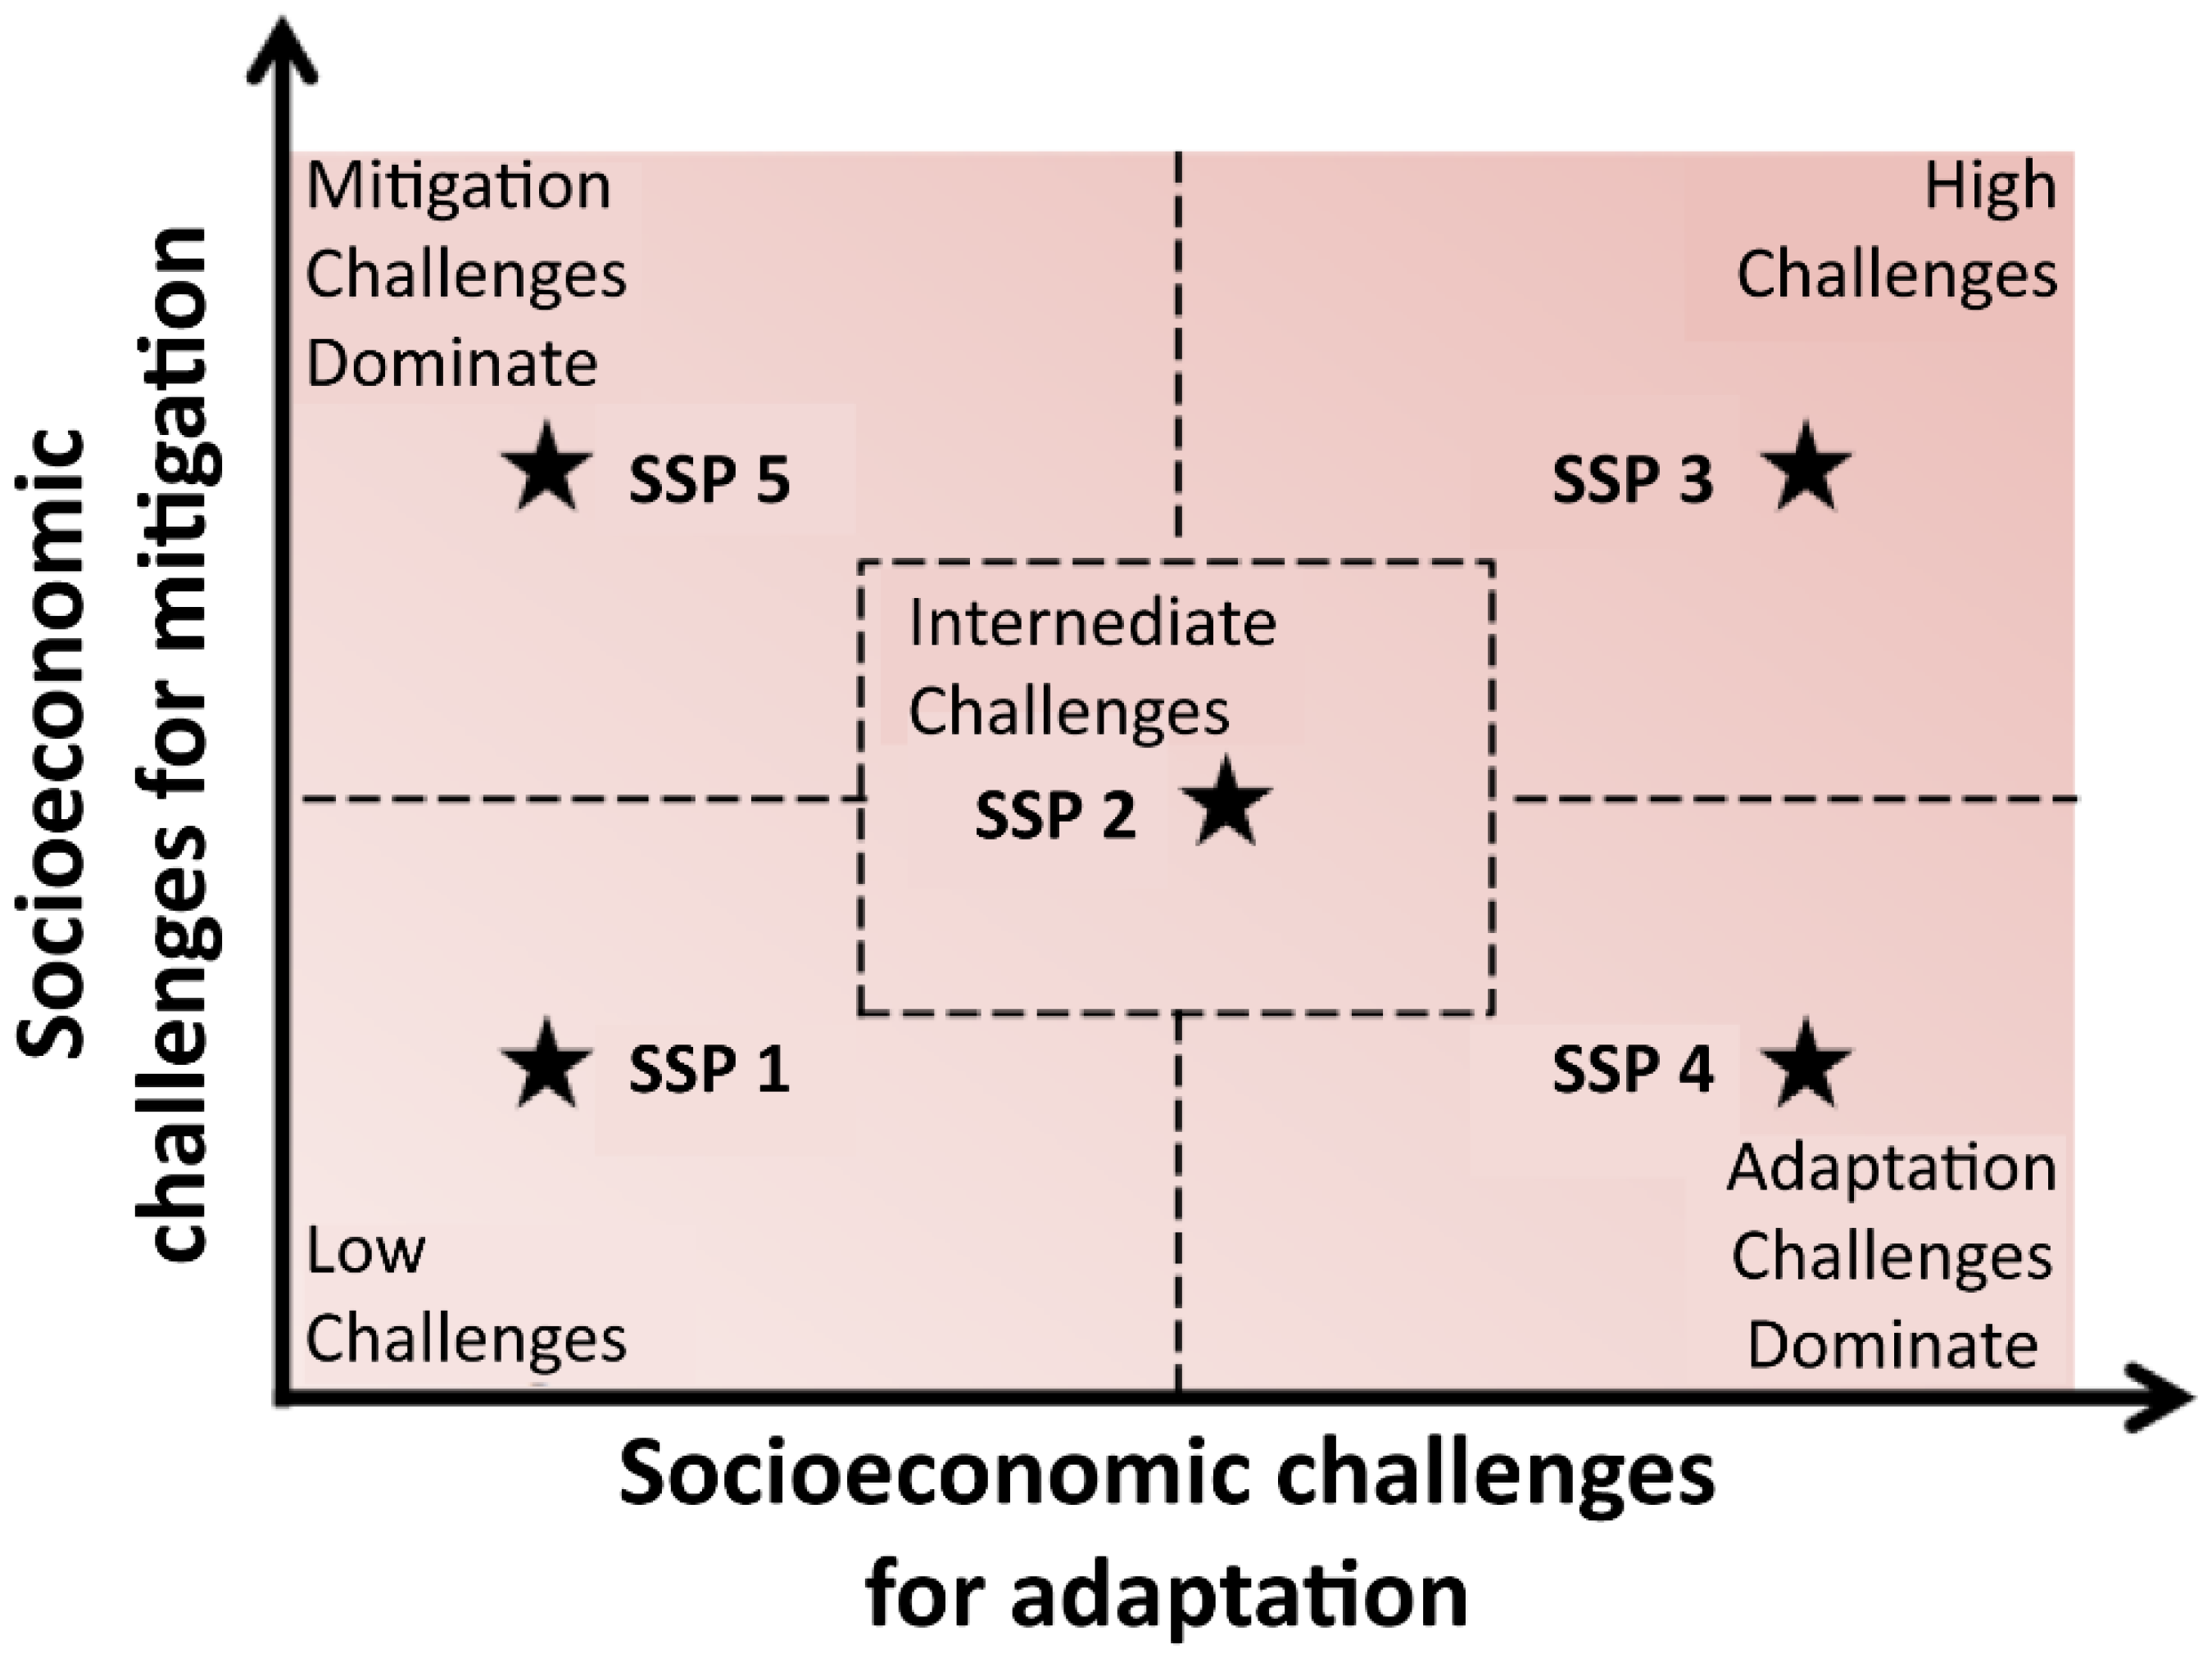
Scenario analysis was conducted using the water temperature, which showed a significant impact based on the study results. Analyses were conducted for each scenario through climate change data of CMIP6 (Coupled Model Intercomparison Project Phase 6) to develop the 6th Assessment Report (AR6) of IPCC in 2022 [18,38]. We used RCPs and shared SSP scenarios for CMIP5 and CIMP6, respectively. The SSPs were composed of five scenarios considering population, economy, use, and energy use following climate change adaptation and mitigation of greenhouse gas, along with radiative forcing levels (analogous to the existing RCP concept) as of 2100 (Figure 4).
In our analysis, SSP is divided into cases in which various socioeconomic pathways achieve a reduction in moderate development. Notably, SSP1 and SSP5 are cases where greenhouse gas reduction is good (1) or bad (5) as society develops, whereas SSP3 and SSP4 are cases where society develops slowly or greenhouse gas reduction is good (4) or bad (5).
The changes in sea surface temperature projected by the IPCC are shown in Table 4. Based on CIMP6, the average water temperature per scenario in East Asia is expected to increase by 1.0 ℃, 2.6 ℃, and 5.4 ℃ in 2040, 2060, and 2100, respectively.

3.4. Laver Production Changes under Various IPCC CMIP6 Scenarios

The results of the analysis of laver production for each water temperature change SSP scenario in East Asia are shown in Table 5. The analysis was conducted using water temperature. Four scenarios were analyzed, and it was shown that the mean production of laver in Wando would be 20.75 million packs (100 sheets per pack) in 2040, 15.48 million packs in 2060, and 6.42 million packs in 2100. This represents decreases of 13.7%, 35.6%, and 73.3%, respectively, compared to the production in 2020. A continuous rise in water temperature would lead to reduced laver production and substantially impact laver industries. Consequently, without policy measures to counter climate change, the sustainability of laver aquaculture cannot be guaranteed.

4. Discussion

The present study used water temperature, duration of sunlight, and rainfall as the environmental variables and analyzed the correlations and their impacts on laver production. Environmental changes typically do not immediately impact output within the same month. To alter laver production, environmental factors must have an impact over a growth period, and in this study, the growth period was accounted for in the analysis. By introducing a time lag for the environmental variables, an optimum model to show laver production following environmental changes before harvesting was established. The analysis showed that the variable with the greatest impact on laver production was water temperature; thus, the laver production was predicted at 20.73 million packs (a decrease of 13.78%) as the water temperature increased by 1 °C, given a time lag. The next most important factor was sunlight duration in the month before harvesting. If the sunlight duration increased by 1 h per month, the laver production would increase by 0.32%. If the sunlight duration 1 month before harvesting increased by 10 h, the total laver production would increase by 3.2% (24,820 packs). Lastly, if rainfall increased by 1 mm 1 month before harvesting, laver production would be expected to increase by 0.13%. Similarly, if 1 month before harvesting laver, rainfall increased by 1 cm, laver production would increase by 1.3% (24.36 million packs), assuming that rainfall during the winter season was suitable. As with sunlight duration, countermeasures can be implemented in advance by recruiting the necessary workforce and building processing facilities to respond to environmental changes 1 month earlier.
Laver production levels are highly associated with the aquaculture environment. In terms of water temperature, there is a tendency for rot disease to develop when the water temperature is ≥10 °C, whereas poor growth leads to reduced laver production when the water temperature is ≤10 °C. However, lack of rainfall and inadequate sunlight exposure may inhibit laver production due to the proliferation of diatoms [39]. During the March and April harvest period (when laver production is high), production may decrease because of an increase in water temperature. However, a considerable increase in rainfall and sunlight duration created conditions that increased laver production. Therefore, a proper balance between environmental variables is considered crucial for laver production.
A future reduction in laver production due to climate change is inevitable. Therefore, this study quantitatively analyzed changes in laver production according to environmental change scenarios and proposed short-, mid-, and long-term alternatives for developing laver aquaculture. Compliance with the appropriate laver seeding time based on scientific data and expansion of land-based seeding are short-term alternatives. Maintaining an appropriate water temperature during the harvest period is important for the growth of laver, especially during the seeding period. The seeding method involves installing spores in a laver facility (net). High water temperature inhibits spore adherence, and poor harvest is tantamount to a reduction in laver production [40]. Aquaculture farmers can use these methods to increase laver production with minimal effort. Nevertheless, the majority of aquaculture farmers plant seeds before and after Chuseok by relying solely on their years of experience. Chuseok, known as Korean Thanksgiving Day, occurs on August 15 of the lunar calendar. An increase in water temperature and natural disasters, such as typhoons, after seed planting cause significant damage to laver production, and several cases of such events have been reported [40,41]. Therefore, in order to minimize such damage, studies on appropriate seedlings based on scientific analysis are needed.
Unlike Japan, seeding in Korea is primarily sea-based and greatly influenced by the outside environment, such as water temperature. Accordingly, it is important to use the optimum water temperature during seeding to maintain stable production [42,43]. Land-based seeding facilities in Korea account for 20% of all laver facilities, which is significantly lower than the percentage in Japan. Despite the government’s policy support, owing to the lack of land-based seeding technology in Korea, the absence of standard facility manuals, and a decline in reliability, the expansion of land-based seeding farms is slower than expected. However, despite these disadvantages, using the land-based seeding technique can ensure stable production of laver amidst climate change, even with a reduced workforce, shortened seeding time, and limited frozen and refrigeration facilities [44].
Mid- and long-term alternatives include the development of laver seeds that are high-temperature- and disease-resistant and the discovery of new aquaculture sites. Developing laver seeds that are resistant to changes in the environment, even to high water temperatures, is important as it is the basis for sustainable laver aquaculture [18,45]. Although laver seeds are constantly being improved in Korea, continuous research and development and policy support are required as climate change accelerates. The analysis of IPCC’s scenarios suggests that laver output in Wando could decrease by 73.3% in 2100 compared to that in 2020, indicating that the environment is no longer optimal for laver production (region, water temperature, and other factors). However, finding new laver farms will incur high costs and require considerable time and effort. Finding a new appropriate laver aquaculture ground that is as good as the South West Sea will be challenging. Therefore, the discovery of appropriate laver aquaculture grounds should be considered from the mid- and long-term perspectives. In Korea, restrictions on new permits for laver aquaculture result in high-density planting of laver. This affects laver production, as well as contamination in laver aquaculture, consequently reducing laver production [46]. Accordingly, integrated management based on continuous monitoring and research is necessary to maintain the laver aquaculture environment by considering the environmental capacity [47].
The present study used observational data to conduct a regression analysis based on the monitoring data of environmental changes over the last 10 years. Thus, environmental changes such as extremely high and low temperatures were not considered. Therefore, the scenario was analyzed under the assumption that changes in water temperature affecting the growth and development of laver would not be extreme. In addition, because the scenario was analyzed based on the parameter values of the model derived for analyzing changes in laver production, there may be factors that were not reflected in the model.
This study had some limitations. First, although laver farms are located in 23 regions in Korea, the analysis was conducted only for Wando due to the lack of basic statistics for other areas. In addition, it is insufficient to describe the cycle of overall growth and development of laver in Korea alone since the analysis was conducted assuming that laver production varies linearly with parameter values. Since laver production trends may change under different local aquaculture methods, policy support should be provided to obtain accurate estimation by gathering basic data from other regions.
Second, like other agricultural resource studies, this study used data from 10 years (240 months) of follow-up observations in Korea to study the amount of laver production according to environmental changes. However, it is expected that there will be some limitations in predicting future changes to natural ecology through 10 years of data, and it is expected that research on the laver industry can be further developed through follow-up research from a longer-term perspective.
Nevertheless, this study used the simulation analysis method for each scenario using climate models, which are employed in other sectors such as agriculture. Moreover, this is the first study that has attempted to determine the vulnerability of laver production to changes in water temperature influenced by climate change. Considering the increasing importance of seaweed as a sustainable food source and the economic value of the laver industry, both of which are challenged by climate change, it is necessary to conduct follow-up studies in other laver-producing areas. Moreover, research into i) suitable new laver cultivation sites and how they are affected by climate change and ii) ways to secure laver productivity through seed development is necessary.

Author Contributions

Eun Young Baek: Conceptualization, Supervision, Writing - original draft preparation; Writing - review and editing, Funding acquisition. Ae Rim So: Formal analysis, Software, Writing - review and editing, Data curation, Methodology.

Institutional Review Board Statement

Not applicable.

Informed Consent Statement

Not applicable.

Acknowledgments

We are particularly grateful for the administrative support from the Fisheries Observation Center of the Korea Maritime Institute.

Conflicts of Interest

none.

References

  1. R. Mendelsohn, W.D. Nordhaus, D. Shaw, The impact of global warming on agriculture: A Ricardian analysis, Am. Econ. Rev. (1994) 753–771. (https://www.jstor.org/stable/2118029).
  2. Intergovernmental Panel on Climate Change, Summary for policymakers, in: Global Warming of 1 °C (2018).
  3. Intergovernmental Panel on Climate Change, Summary for policymakers, in: IPCC Special Report on the Ocean and Cryosphere in a Changing Climate, 2019.
  4. M. Cuilleret, L. Doyen, H. Gomes, F. Blanchard, Resilience management for coastal fisheries facing with global changes and uncertainties, Econ. Anal. Policy. 74 (2022) 634–656. [CrossRef]
  5. E.C. Jeon, Geobook. 27 Experts’ Solutions for Climate Change (2012) 54–55.(ISBN 978-89-94242-45-3).
  6. Intergovernmental Panel on Climate Change 2013: The Synthesis Report Contribution of Working Groups I, II and III to the Fifth Assessment Report of the Intergovernmental Panel on Climate Change Climate Change, Cambridge University Press, 2013.
  7. T.H. Moon, B.S. Kim, Korea’s limit to growth from circular causation perspective: Focusing on crisis factors, population, economy, resources, environment, and food, Korean, Syst. Dyn. Rev. 10 (2009) 47–79.(ISSN (P)1229-8085).
  8. J.C. Choi, Y.S. Choi, Climate Change Textbook-Current Status and Perspectives of Climate Change and Ecosystem of the Korean Peninsula, Doyobook, pp. 147–151, 2011. (ISBN 978-89-89831-70-9).
  9. M. Barange, I. Allen, E. Allison, M.-C. Badjeck, J. Blanchard, B. Drakeford, N.K. Dulvy, J. Harle, R. Holmes, J. Holt, S. Jennings, J. Lowe, G. Merino, C. Mullon, G. Pilling, L. Rodwell, E. Tompkins, F. Werner, Predicting the impacts and socio-economic consequences of climate change on global marine ecosystems and fisheries: The QUEST_Fish framework, in: R. Ommer, I. Perry, K.L. Cochrane, P. Cury (Eds.), World Fisheries: A Social–Ecological Analysis, Wiley–Blackwell, New Jersey, 2011, p. 440. [CrossRef]
  10. T. Kawasaki, Climate Change and Fish, Academy Publication, pp. 50–51, 2012. (ISBN 978-89-7616-479-7).
  11. Ministry of the Environment Korean Climate Change Assessment Report 2020: Climate Change Impact and Adaptation, 2020, pp. 188–219. (ISBN 978-89-954715-9-3).
  12. Ministry of the Environment, National Institute of Environmental Research Korean Climate Change Assessment Report 2014-Climate Change Impact and Adaptation 1–29, 2014. (ISBN 978-89-6558-261-8 93530).
  13. H.J. Song, Fluctuations of common squid Todarodes pacificus catches in the northwestern Pacific under changing climate and habitat temperature. Korean, J. Fish. Aquat. Sci. 51 (2018) 338–343. (pISSN:0374-8111, eISSN:2287-8815).
  14. E.Y. Baek, A study on the current state and problems of laver drying-processing industry, J. Fish Mar. Sci. Educ. 3 (2020) 713–724. [CrossRef]
  15. H.J. Lee, In the high temperature winter sea ... South Jeolla Province’s laver production has plummeted. https://www.donga.com/news/article/all/20200219/99784537/1, 2022 (in Korean) (accessed 28 March 2022).
  16. Y.S. Park, South coast, high temperature ... Dead sea squirts and sea squirts en masse. http://www.munhwa.com/news/view.html?no=2022042701030927109001, 2022 (in Korean) (accessed 28 April 2022).
  17. W.W.L. Cheung, V.W.Y. Lam, J.L. Sarmiento, K. Kearney, R. Watson, D. Pauly, Projecting global marine biodiversity impacts under climate change scenarios, Fish. Fisheries. 10 (2009) 235–251. [CrossRef]
  18. K. Brander, K. Cochrane, M. Barange, D. Soto, Climate change implications for fisheries and aquaculture, in: Climate Changes Impacts on Fisheries and Aquaculture: A Global Analysis, John Wiley & Sons, New Jersey, 2017, pp. 45–62.
  19. W.H. Hwang, Climate Change, Changing the Marine Ecosystem in an Unexpected Way? http://www.ecomedia.co.kr/news/newsview.php?ncode=1065614089206814, 2022 (in Korean) (accessed 27 April 2022).
  20. S.K. Park, H.J. Kwon, J.W. Park, C.P. Cha, Bio-economic relationships between climate change and fisheries, J. Fish. Mar. Sci. Educ. 22 (2010) 388–401.(https://kiss.kstudy.com).
  21. M.A. Cisneros-Mata, T. Mangin, J. Bone, L. Rodriguez, S.L. Smith, S.D. Gaines, Fisheries governance in the face of climate change: Assessment of policy reform implications for Mexican fisheries, PLOS ONE. 14 (2019) e0222317. [CrossRef]
  22. J.H. Cho, J.-M. Suh, L. Nam-Su, H.-J. Ha, The impacts of seawater surface temperature rising on sea mustard yields of Goheung and Wando coast in Korea, J. Environ. Sci. Int. 27 (2018) 147–154. (in Korean) [CrossRef]
  23. B.-T. Kim, C.L. Brown, D.-H. Kim, Assessment on the vulnerability of Korean aquaculture to climate change, Mar. Policy. 99 (2019) 111–122. [CrossRef]
  24. T.-H. Kim, J.-A. Shin, S.-D. Choi, Effects of climate change on Laver farming in Maro-hae (Jindo-gun and Haenam-gun), Republic of Korea and countermeasures, J. Fish Bus. Admin. 52 (2021) 55–67. [CrossRef]
  25. W.T.L. Yong, V.Y. Thien, R. Rupert, K.F. Rodrigues, Seaweed: A potential climate change solution, Renew. Sustain. Energy Rev. 159 (2022) 112222. [CrossRef]
  26. S.M. Oh, B. Park, A. Angani, E.S. Kim, Realization of fully automatic harvest unit for water laver in the Korea sea. IEEE International Conference on Architecture, Construction, Environment and Hydraulics (ICACEH) 105-107, 2019. [CrossRef]
  27. Z.U. Ahmed, O. Hasan, M.M. Rahman, M. Akter, M.S. Rahman, S. Sarker, Seaweeds for the sustainable blue economy development: A study from the south east coast of Bangladesh, Heliyon. 8 (2022) e09079. [CrossRef]
  28. A.D. Ficke, C.A. Myrick, L.J. Hansen, Potential impacts of global climate change on freshwater fisheries, Rev. Fish Biol. Fish. 17 (2007) 581–613. [CrossRef]
  29. V. Albert, J. Ransangan, Effect of water temperature on susceptibility of culture marine fish species to vibriosis, Int. J. Res Pure Appl. Microbiol. 3 (2013) 48–52. 사이트가 유로 전환된 듯 Effect of water temperature on susceptibility of culture marine fish species to vibriosis - 검색 (bing.com).
  30. Nam Yang, Fishing Net Co., Ltd., The Path to Increased Production of Haetae, pp. 66–77, 1979.
  31. Korea International Trade Association, Current Status of Laver Trade by Year 2021, 2022. (https://kr.linkedin.com/com).
  32. E.Y. Baek, H.D. Lee, K.Y. Lee, D.Y. Kim, Laver, a semiconductor of the sea, strategy to achieve 1 trillion won in exports, KMI weekly report. 61 (2017) 1–15. (https://www.kmi.re.kr/web/trebook/view).
  33. National Institute of Fisheries Science, A Value Chain Analysis of Major Aquacultural Products: Olive Flounder, Abalone, and Porphyra spp., pp. 101–105, 2021. (SP-2021-AQ-001).
  34. Honam Regional Statistics Office, Wando. 2016 Wando County Fisheries Survey Report. https://www.wando.go.kr/contents/13486/fish_survey.pdf, 2017 (accessed 20 September 2020) pp. 3–349.
  35. D.N. Gujarati, Econometrics by Example, second ed, Sigmapress, pp. 3–31, 2016.
  36. KMI Fisheries Observation Center Monthly Review of Laver Fisheries Observation, Fisheries Observation Center of the Korean Maritime Institute (https://www.foc.re.kr).
  37. Korea Meteorological Administration, Meteorological Observation Statistics Data, 2022.
  38. M.K. Soviadan, E.M. Koffi-Tessio, A.A. Enete, N.J. Nweze, Impact of climate change on cotton production: Case of Savannah region, northern Togo, Agric. Sci. 10 (2019) 927–947. [CrossRef]
  39. K. Yamauchi, Influence of temperature on the growth of sporelings of laber. I. Early growth and shapes of sporelings cultured at various temperature, Bull. Jpn. Soc. Sci. Fish. 40 (1974) 439–446.
  40. E.Y. Baek, A.H. Noh, K.W. Kim, N.S. Lee, Concerns Over Disruption of Seaweed Supply Due to Abnormal High Temperature, Reorganization of Supply and Demand Management Is Required, KMI Weekly Report 166 (2020) 1–18. (https://www.kmi.re.kr/web/trebook/view).
  41. National Institute of Fisheries Science, Laver Culture (in Korean), 1984.(https://www.nifs.go.kr).
  42. National Federation of Fisheries Cooperatives, Laver II, Fisheries Economic Institute, pp. 17–20, 1983a.(https://fei.suhup.co.jp.co.kr).
  43. National Federation of Fisheries Cooperatives, Laver, Fisheries Economic Institute, pp. 61–64, 1983b.(https://fei.suhup.co.jp.co.kr).
  44. D.H. Kim, The Relationship between Climatic and Oceanographic Factors and Laver Aquaculture Production, The Journal of Fisheries Business Administration, 44(3), pp. 77–84, 2013. [CrossRef]
  45. M. Ruckelshaus, S.C. Doney, H.M. Galindo, J.P. Barry, F. Chan, J.E. Duffy, C.A. English, S.D. Gaines, J.M. Grebmeier, A.B. Hollowed, N. Knowlton, J. Polovina, N.N. Rabalais, W.J. Sydeman, L.D. Talley, Securing ocean benefits for society in the face of climate change, Mar. Policy. 40 (2013) 154–159. [CrossRef]
  46. K. Tada, M. Fujiwara, T. Honjo, Water quality and Nori (Porphyra) culture in the Seto Inland Sea, Bunseki Kagaku, The Japan Society for Analytical Chemistry. 59 (2010) 945–955. [CrossRef]
  47. H.H. Lim, D.S. Kang, J.H. Nam, Utilization of marine environmental carrying capacity models as a tool for integrated coastal management, Ocean Policy Res. 18 (2003) 33–69. (UCI: G704-001382.2003.18.2.011).
1
Laver (Pyropia haitanensis) is usually called “Gim” in Korea; “nori” in Japan; and “laver,” “purple laver,” or “nori seaweed” in the North and South American continents. In this article, we have used the common name “laver” throughout.
2
Fig. 2 in KMI Fisheries Observation Center (KMI Fisheries Observation Center Monthly Review of Laver Fisheries Observation)]. Monthly review of laver fisheries observation [36].
3
Table 2 in Korea Meteorological Administration (2022), Meteorological observation data [37].
4
Laver seeding is usually done in September, and laver is produced from October to May of the following year. Laver is harvested 7–8 times during the fishing season at the facility where spores were planted, and it takes approximately 15–20 days from harvest to the subsequent harvest. If laver is produced at the beginning or the end of the month, it will be more affected by the environmental factors of the previous month rather than those of the present month. In particular, the level of nutrient salt, vital for the growth and development of laver, is closely related to phytoplankton abundance, freshwater input or rainfall, and duration of sunlight (environmental variables). Therefore, a time lag should be included when considering the environmental variables affecting laver production.
Figure 1. Trends in laver exports by year (2001–2020). Total exports are measured in tons (unit); CAGR (Compound Annual Growth Rate); Data: Korean Customs Service and Korea Trade Statistics Promotion Institute.
Preprints 107096 g001
Figure 2. Production status of farmed laver by producer in Korea (based on the laver production in 2020). The 2020 production is from October 2019 to June 2020. Data: Korea Maritime Institute (KMI) (KMI Fisheries Observation Center Monthly Review of Laver Fisheries Observation), laver observation (each number).
Preprints 107096 g002
Figure 3. Structure of analysis data and basic statistics.
Preprints 107096 g003
Figure 4. Intergovernmental Panel on Climate Change (IPCC) climate change scenarios. SSP, shared socioeconomic pathway.
Preprints 107096 g004
Table 1. Factors used for analysis and data sources.
Classification Variable Unit Source
Purple laver production laver million pack/month Korea Maritime Institute
(KMI) Fisheries Observation Centre
Rainfall rain mm/month
Korean Customs Service and Korea Trade Statistics Promotion Institute
Duration of sunlight sun time/month
Water temperature Wtem ℃ (monthly average)
Table 2. Analysis data and basic statistics.
Classification Monthly Average MEAN SD MAX MIN
Oct Nov Dec Jan Feb Mar Apr May
Production
(Unit: million pack)
3.44 74.05 84.91 230.21 392.49 508.09 402.76 108.83 233.83 204.94 781.88 0.00
Rainfall
(Unit: mm/month)
101.01 76.86 47.95 34.91 62.81 103.26 172.94 148.99 125.88 96.37 493.60 0.50
Duration of sunlight
(Unit: time/month)
204.96 158.83 146.30 160.34 159.97 205.58 201.00 230.76 181.31 43.98 300.50 84.00
Water temperature
(Unit: ℃)
20.37 15.83 11.82 9.29 8.93 10.29 12.45 15.55 15.78 5.27 26.50 7.40
Table 3. Results of model analysis of environmental change and laver production.
Ln (laver) Coefficient SE t P>t [95% CI VIF 1/VIF
R a i n t 1 0.0013** 0.0007 2.02 0.048 0 0.0026 1.99 0.5015
S u n t 1 0.0032*** 0.0012 2.73 0.008 0.0009 0.0056 1.55 0.6459
W t e m t 0 -0.1370*** 0.0173 -7.93 0 -0.1716 -0.1025 1.41 0.7106
_cons 3.2276*** 0.1978 16.32 0 2.8323 3.6229
Number of obs = 66 R-squared = 0.5566
Mean VIF: 1.65
F = 25.95, Prob > F = 0.0000 Adj R-squared = 0.5352
*** p < 0.01, ** p < 0.05, * p < 0.1; VIF, Variation Inflation Factor; SE, Standard Error; Ln (laver), Natural Logarithmic Value of Laver Production, R a i n t 1 , Precipitation a month ago; S u n t 1 , A m o u n t   o f   s u n l i g h t   a   m o n t h   a g o ; W t e m t 0 , Temperature of the month
Table 4. IPCC CMIP6 scenarios predicting changes in water temperature.
Classification Period SSP1-2.6 SSP2-4.5 SSP3-7.0 SSP5-8.5 Mean
Water temperature change
Unit: ℃
2021-2040 1.0 1.0 0.9 1.1 1.0
2021–2060 2.4 2.5 2.5 3.0 2.6
2021–2100 3.9 4.8 5.7 7.0 5.4
*CMIP6-Footnote 1: CMIP6 – sea surface temperature (SST) Change deg C – Regions: East Asia (rel. to 1981–2010) – Annual (26 models) –EAS. **SSP, shared socieconomic pathways; IPCC, Intergovernmental Panel on Climate Change; CMIP6, Coupled-Model Intercomparison Project Phase 6. Date: IPCC, WGI Interactive Atlas: Regional information (advanced). Accessed May 30, 2022
Table 5. Analysis of changes in purple laver production in Wando according to IPCC CMIP6 scenarios of water temperature changes.
Period Classification SSP1-2.6 SSP2-4.5 SSP3-7.0 SSP5-8.5 Average
2021–2040 Reduction rate (%) -13.70 -13.70 -12.30 -15.10 -13.70
Diminution (million pack) -329.4 -329.4 -296.5 -362.4 -329.4
Production (million pack) 2,074.70 2,074.70 2,107.60 2,041.70 2,074.70
2021–2060 Reduction rate (%) -32.90 -34.30 -34.30 -41.10 -35.60
Diminution (million pack) -790.6 -823.5 -823.5 -988.3 -856.5
Production (million pack) 1,613.50 1,580.60 1,580.60 1,415.80 1,547.60
2021–2100 Reduction rate (%) -53.40 -65.80 -78.10 -95.90 -73.30
Diminution (million pack) -1,284.70 -1,581.20 -1,877.70 -2,305.90 -1,762.40
Production (million pack) 1,119.40 822.9 526.4 98.2 641.7
* Original data were divided into near-term (2021–2040), medium-term (2041–2060), and long-term (2081–2100). However, cumulative values from 2021 were used for analysis in this study. **SSP, shared socieconomic pathways; IPCC, Intergovernmental Panel on Climate Change; CMIP6, Coupled-Model Intercomparison Project Phase 6.
Disclaimer/Publisher’s Note: The statements, opinions and data contained in all publications are solely those of the individual author(s) and contributor(s) and not of MDPI and/or the editor(s). MDPI and/or the editor(s) disclaim responsibility for any injury to people or property resulting from any ideas, methods, instructions or products referred to in the content.
Copyright: This open access article is published under a Creative Commons CC BY 4.0 license, which permit the free download, distribution, and reuse, provided that the author and preprint are cited in any reuse.
Prerpints.org logo

Preprints.org is a free preprint server supported by MDPI in Basel, Switzerland.

Subscribe

© 2024 MDPI (Basel, Switzerland) unless otherwise stated