Preprint
Article

X-ray Microtomography Analysis of Integrated Crop-Livestock Production Impact on Soil Pore Architecture

Altmetrics

Downloads

130

Views

51

Comments

0

A peer-reviewed article of this preprint also exists.

This version is not peer-reviewed

Submitted:

22 May 2024

Posted:

23 May 2024

You are already at the latest version

Alerts
Abstract
Integrated crop-livestock production (ILP) is an interesting alternative for more sustainable soil use. However, more studies are needed to analyze soil pore properties under ILP at the micrometer scale. Thus, this study proposes a detailed analysis of soil pore architecture at the micrometer scale in three dimensions. For this purpose, samples of an Oxisol under ILP subjected to minimum tillage (MT) and no-tillage (NT) with ryegrass as cover crop (C) and silage (S) were investigated. The soil micromorphological properties of the soil were analyzed using X-ray microtomography. The MT(C) system showed the highest values of porosity (c. 20.4%), connectivity (c. 32.8×10³), volume (c. 26%), and number of pores (c. 32%) in a rod-like shape. On the other hand, the MT(S), NT(C), and NT(S) systems showed higher tortuosities (c. 2.2, c. 2.0, and c. 2.1) and lower pore connectivities (c. 8.3×10³, c. 6.9×10³, and c. 6.2×10³), especially in S use. Ellipsoidal and rod-shaped pores predominated over spheroidal and disc-shaped pores in all treatments. The results of this study show that the use of ryegrass as a cover crop improves soil physical properties, especially in MT. For S use, the type of soil management (MT or NT) did not show any differences.
Keywords: 
Subject: Environmental and Earth Sciences  -   Soil Science

1. Introduction

In recent decades, rapid population growth has been accompanied by several extreme events, including droughts, forest fires, and floods, which have significantly pressured food production and land use. These pressures have directly impacted agriculture [1,2]. In light of this situation, it is of the utmost importance to direct investments towards a more rational use of natural resources, focusing on soil and water. In this context, one of the strategies for achieving equilibrium between food production and environmental protection is to implement management systems that integrate conservation practices with diverse agricultural crop uses.
Intensive soil cultivation and a lack of diversity in crop production have been identified as contributing to deleterious effects on soil structure [3,4]. These effects generally involve changes in the soil pore system, mainly affecting water infiltration and water availability for plants [5,6]. In this context, it is essential to understand pore architecture in order to seek more environmentally sustainable soil management practices. According to McBratney et al. [7], the intensification of agriculture aims to meet the global demand for food; however, this intensification must be carried out sustainably, respecting the environment's limitations. Therefore, soil management practices play a crucial role in ensuring the productivity and sustainability of agricultural activities [8] since they involve a set of techniques and strategies aimed at preserving soil fertility and quality in order to reduce harmful processes such as erosion and the contamination of water resources by agrochemicals [9].
In Brazil, it is common practice to adopt management techniques that are considered to be environmentally friendly, particularly the minimum tillage system (MT) and the no-tillage system (NT). The former is a system that permits the planting of crops during the rainy season, more intensive use of agricultural areas, a reduction in soil erosion, and the use of agricultural machinery, as well as greater control of weeds [10]. No-till farming maintains crop residues on the soil surface, thereby preventing erosion and enhancing the organic matter content of the surface layers [11]. The reduction in tillage under no-till farming techniques serves to preserve the soil structure, thereby enhancing its capacity to retain water and nutrients [12].
The combination of soil management practices with different agricultural crop utilization strategies has the potential to generate noteworthy results in terms of soil conservation. In this context, ryegrass (Lolium multiflorum L.), primarily utilized for producing pasture for livestock, has emerged as a highly versatile crop for implementing sustainable agricultural practices [13]. Ryegrass is cultivated in temperate climate regions and employed in ground cover and silage production [14]. The utilization of ryegrass as a cover crop has the dual objective of protecting the soil from erosion, suppressing weed growth, and improving water and nutrient retention, thereby contributing to the sustainability of the production system [15]. In silage production, ryegrass is harvested at different stages of development and stored for use as cattle feed [16].
In this context, integrated crop-livestock systems have emerged as a promising strategy in agriculture to increase the productivity and sustainability of agricultural systems [17]. Integrated livestock production (ILP) is a system that combines the production of grains and other materials that can be used to feed livestock when carried out in the form of crop rotation [18]. This technique can be employed as a combination of various soil management practices and agricultural crop utilization strategies. The advantages of ILP include soil conservation and improved pasture quality, which can help to reduce the pressure for new production areas [19]. Consequently, implementing ILP may serve as a viable alternative for transforming these areas into productive agricultural sites.
For a comprehensive examination of the impact of ILP on soil structure, three-dimensional (3D) image analysis techniques, such as X-ray microtomography (Micro-CT), can be employed. This technique enables the investigation of the soil pore architecture in a non-invasive manner, facilitating the acquisition of high-resolution images. The use of 3D Micro-CT images allows for the measurement of numerous morphological and geometric properties of the soil structure, thus enabling a detailed characterization of the distribution of pores and their complexity in porous media, even under different management practices [20,21,22,23,24]. Applying research approaches such as those offered by micro-CT provides invaluable insights into the soil pore system at various scales, thereby facilitating the implementation of more efficient and sustainable management practices.
This study proposes a 3D image-based analysis of the pore system of an Oxisol under ILP at the transmission and redistribution pore scale. Two management systems (MT and NT) and two forms of ryegrass crop use (cover crop and silage) are being investigated. Studies still need to address a detailed analysis of soil pore architecture under ILP on the micrometer scale based on 3D micro-CT images. In this regard, the objective of this study is to provide findings that have not been previously reported, which will assist farmers in selecting agricultural systems that can enhance productivity while promoting the rational use of soil resources.
Thus, this study is based on two hypotheses: the first is that the ILP management practices analyzed have different effects on the micromorphological properties of the soil, and the second is that the use of vegetation cover improves the morphological and geometric properties of the soil pore system, regardless of the type of management adopted. High-resolution three-dimensional images were obtained using the X-ray microtomography technique to evaluate these hypotheses.

2. Materials and Methods

2.1. Study Sites

The study was conducted in an experimental demonstration field located near the city of Castro, state of Paraná, Brazil, at latitude 24°47'53" S and longitude 49°57'41" W, with an altitude of 997 m (Figure 1). The region's climate is mesothermal with no defined dry season, classified as Cfb, according to the Köppen climate classification [25]. The average annual temperature is 16.8 0C with an annual rainfall of between 1600 and 1800 mm.
According to the USDA classification system, the soil used in the experiment was classified as an Oxisol (Haplohumox) characterized by a loamy texture (Table 1). The experiment started in the 2004/2005 agricultural year and consisted of an annual succession of maize and ryegrass. It involved blocks with plots measuring 1200 m² each, which were further divided into 100 m² subplots (10×10 m) to evaluate different soil preparation systems and uses of the ryegrass crop (Lolium multiflorum L.) grown during the autumn-winter period. All plots received pH correction and chemical fertilization procedures [26].
The soil preparation systems studied were: (i) minimum tillage (MT), with just one pass of the harrow; and (ii) no-tillage (NT), with sowing without turning the soil and plant remains kept on the surface. The uses of the ryegrass crop involved: (i) cover crop (C), which remained throughout the winter until the area was desiccated, which took place at the beginning of October 2012; and (ii) pre-dried silage (S), where three cuts of ryegrass at a height of 20 to 25 cm were made and after each cut N fertilization was carried out with 120 kg ha-1 of urea.
Table 1 shows the results of some of the physical properties of the soil studied under the different treatments for the 0-0.20 m layer.

2.2. Soil Sampling and Preparation

The soil samples for this study were collected in the 0 to 0.20 m depth layer after desiccation of the ryegrass crop in 2012. The sampling process involved using trowels, hoes, and shovels designed for this purpose. The samples were collected three days after heavy rainfall when the soil was at field capacity moisture. Six irregularly shaped clods of soil were obtained per treatment, giving a total of 24 samples (6 samples × 2 soil preparations × 2 uses of ryegrass = 24 clods). The samples were randomly collected in the experimental area at one meter from the border on each side of the sub-plot. After sampling, the irregularly shaped clods with more than a thousand cubic centimeters were wrapped in plastic wrap and transported in plastic boxes to the laboratory to avoid disintegration and loss of moisture during transport.
The soil samples were left to air dry for several weeks until they reached a constant mass. After this, the clods were carefully trimmed to produce more regular-shaped blocks (parallelepipeds) using steel saws and spatulas. After this procedure, the blocks were wrapped in plastic to prevent moisture absorption. The volumes of the blocks were adjusted according to the dimensions of the sample holders (diameters of 3 and 5 cm) used in the microtomography analysis. The samples generally had a length of c. 3 cm and a width and height varying between c. 3 and 5 cm. Foam was used to fix the samples inside the sample holder to avoid movement that could create image artifacts.

2.3. X-Ray Computed Tomography

The soil samples were scanned in the X-ray Tomography Analysis Facility at C-LABMU (UEPG, Ponta Grossa) using a Nikon X-ray microtomograph, model XT V 130C. The equipment settings were adjusted with a voltage of 125 kV, a current of 140 µA, an acquisition time of 250 ms per image, and 8 frames. A 0.25 mm thick copper filter was used to minimize the hardening of the X-ray beam. Each sample was scanned, producing 1583 projections with a pixel size of 50 μm. After acquiring the images, 1008 two-dimensional (2D) images per sample were used to build the 3D images (1008×1008×1008 voxels). The 2D grayscale images were saved in 16-bit (TIFF format) for the remaining processing steps.
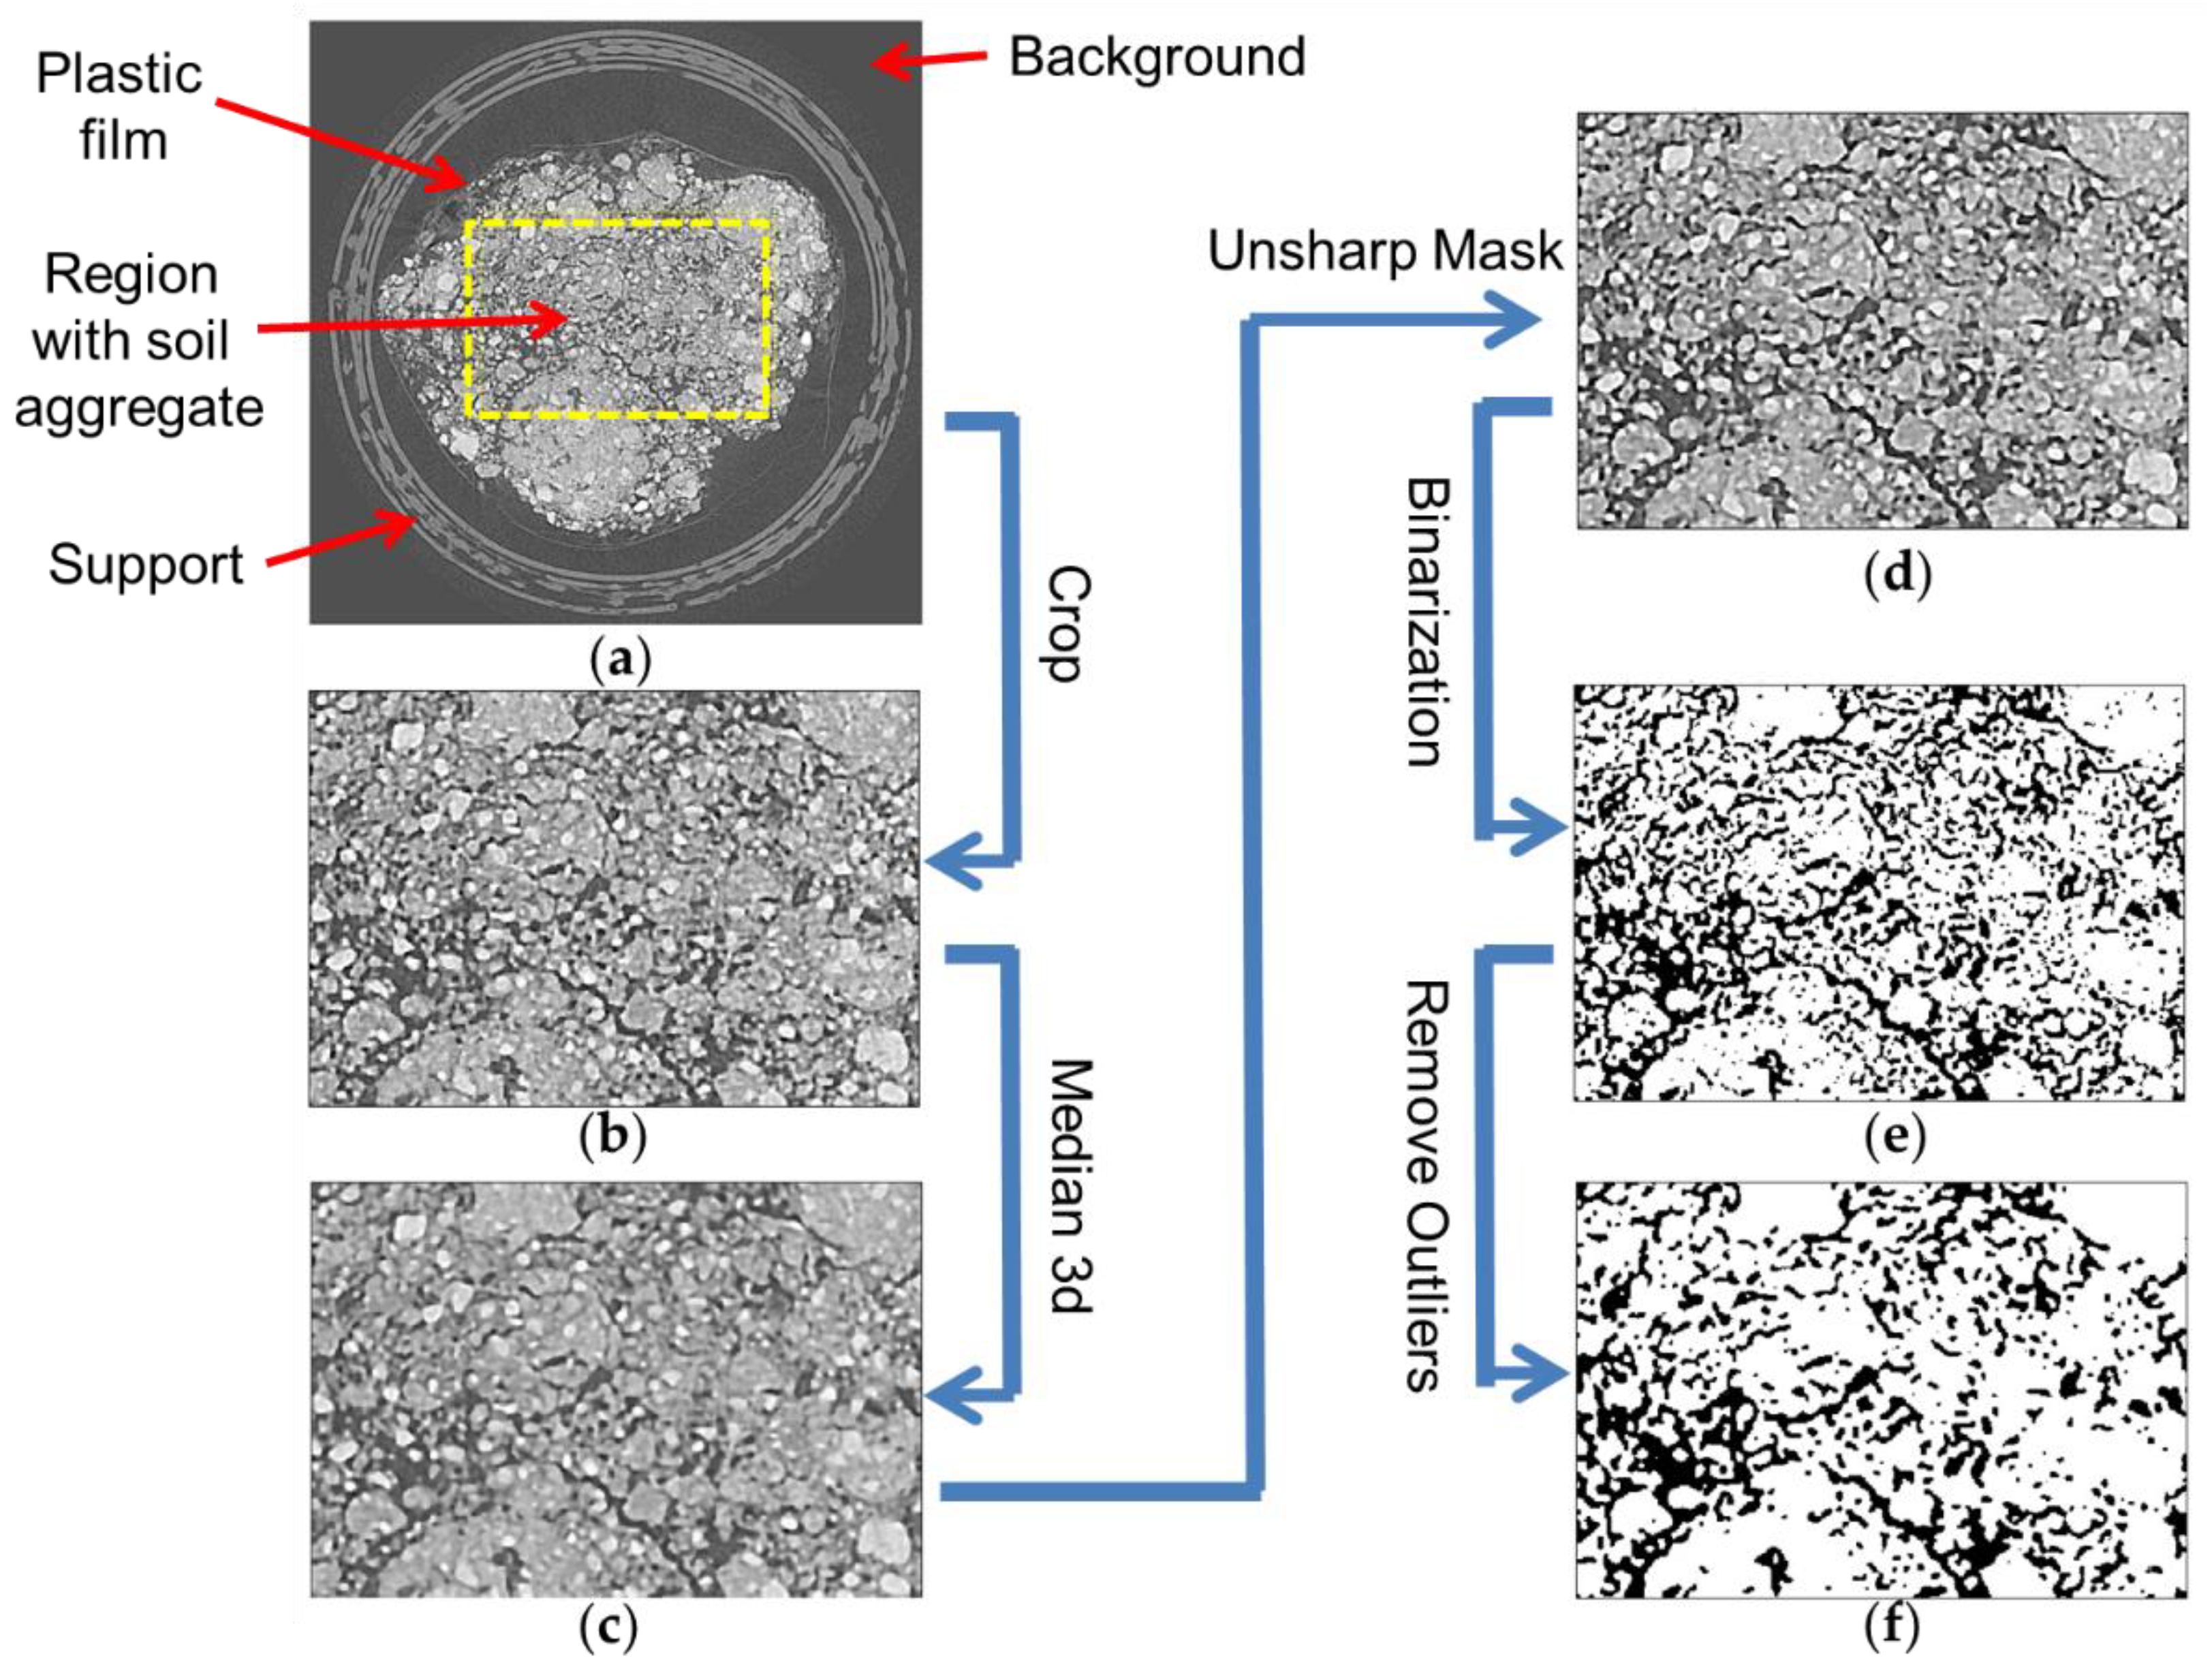
The following steps were carried out after image reconstruction: (i) selection and cropping of cubic sub-volumes, (ii) segmentation, and (iii) binarization of the 2D images. All these steps were made using ImageJ software [27], considering only the selected region of interest within the scanned soil aggregate (Figure 2a). The sub-volume of interest (VOI) cropping was carried out in ImageJ using the crop tool (Figure 2b). Subsequently, the cropped images were converted to 8-bit format (256 shades of gray) to make it easier to select the peaks referring to the contribution of air and solids in the aggregates. Filters were applied to reduce noise and improve the separation between the phases (air and solids). The first procedure was to apply a 3D Median filter (Figure 2c), configured with the parameters: x = 2.0, y = 2.0, and z = 2.0, followed by the Unsharp Mask tool (Figure 2d), configured with the parameters: radius = 1.0 pixel and mask weight = 0.9.
Next, the images were segmented using the non-parametrized Otsu method (Figure 2e), where the threshold values were set based on the gray tones of the images. The Otsu method divides pixels into two classes based on a threshold chosen from the histogram: class 1, gray tones [0, t], and class 2, gray tones [t, 255]. When there is a good separation between the peaks due to the characteristics of the samples, this segmentation method gives good results. As the last stage of image processing, the remaining noise was minimized using the Remove Outliers tool (Figure 2f), configured for particles and pores with values Bright = 4.0 (for particles) and Dark = 2.0 (for pores).

2.4. Soil Morphological and Geometric Properties

Porosity ( φ ) is an indicator that describes the amount of empty space present in the soil [28]. This parameter was calculated by dividing the volume of pores ( V p o r e s ) by the total volume of the sample ( V s a m p l e ):
φ ( % ) = V p o r e s V s a m p l e × 100
The imaged porosity was determined using the Voxel Counter function in the ImageJ software. The plugin counts the voxels in black with a threshold value within a region of interest (pores with a value of 255) in a stack of 8-bit binarized images. The image porosity is then calculated as the ratio between the voxels with a threshold value (255) and all the voxels in the sample (0 and 255).
The fractal dimension ( F D ) is a property that characterizes the complexity and irregularity of patterns at different scales [29]. This parameter was determined using the Fractal Dimension plugin using the box counting technique. Fractal dimension is determined by the slope of the line on the log n versus log 1 / R graph, where n represents the number of boxes and R is the lateral length of the box:
F D = lim R 0 log n log 1 R
The degree of anisotropy ( D A ) is an indicator used to measure the directionality or preferential orientation of a given property in a system. The BoneJ plugin [30] was used to calculate the D A of the soil pore system. The Anisotropy function was chosen. The D A is based on a series of vectors with η directions, originating from random positions in the 3D image, which intersect the pores (black = 255):
D A = 1 I C I L
where I C represents the average length of the shortest interception vectors and I L the average length of the longest interception vectors. Values close to 0 indicate greater isotropy, while values closer to 1 indicate greater anisotropy in the orientation of the pores. When D A is equal to 0, it means that the ratio between I C and I L is equal to 1 ( I C =   I L ), whereas when D A is equal to 1, the ratio between I C and I L is equal to 0.
Pore connectivity ( C ) is a geometric measure that quantifies the number of connected structures and interconnected paths in a porous system [31]. The procedure for determining C involved using the Purify filter to remove isolated cavities and the Connectivity plugin in BoneJ, which analyzes neighboring voxels to calculate the Euler number ( E N ) and determine the contribution to C . Pore connectivity was calculated by:
E N = N o b C + H
C = 1 E N
where N o b denotes the number of isolated objects, C represents connectivity, H corresponds to the number of completely closed cavities. The E N quantity will be positive if the number of isolated pores is greater than the number of connections between the pores ( N o b > C ). In a fully connected pore network, the E N value will be negative ( C > > N o b = 1 ). In this context, the E N parameter counts the number of multiple connections and is associated with the number of ramifications in the pore network. It is important to note that in porous systems such as soil, the contribution of the H parameter is usually negligible.
Tortuosity ( Ʈ ) is a measure that assesses the sinuosity of a pore [32]. The calculation of this parameter involves the ratio between the geodesic length ( L g ) and the Euclidean length ( L e ), along a path of connected pores, as expressed by:
Ʈ = L g L e
Tortuosity was calculated using the Tortuosity plugin in ImageJ, based on the geodesic reconstruction algorithm (RG) developed by Gommes et al. [33]. The analysis was conducted for the elements of the voxel structure in black 255 (pores), defined for six neighbors and carried out on the three axes ( ± x ,   ± y , ± z ).
Pore volume ( V P ) and pore number ( N P ) were calculated based on the distribution of pore shapes determined from the ellipsoid axes plotted inside them. The Particle Analyser plugin in ImageJ was used for this analysis, following the pore classification system proposed by Bullock et al. [34]. Four main pore shapes were considered: (i) equant - pores with an approximately spherical shape; (ii) prolate - elongated pores with a longer main axis; (iii) oblate - flattened pores, with a smaller main axis and two larger perpendicular axes; and (iv) triaxial - elongated pores with an ellipsoid shape, presenting three axes of different sizes. Table 2 shows the relationship between the ellipsoid axes for calculating pore shape [35]. During the analysis, some pores were called unclassified due to their complexity. For these pores, it was not possible to compute all or one of the axes.
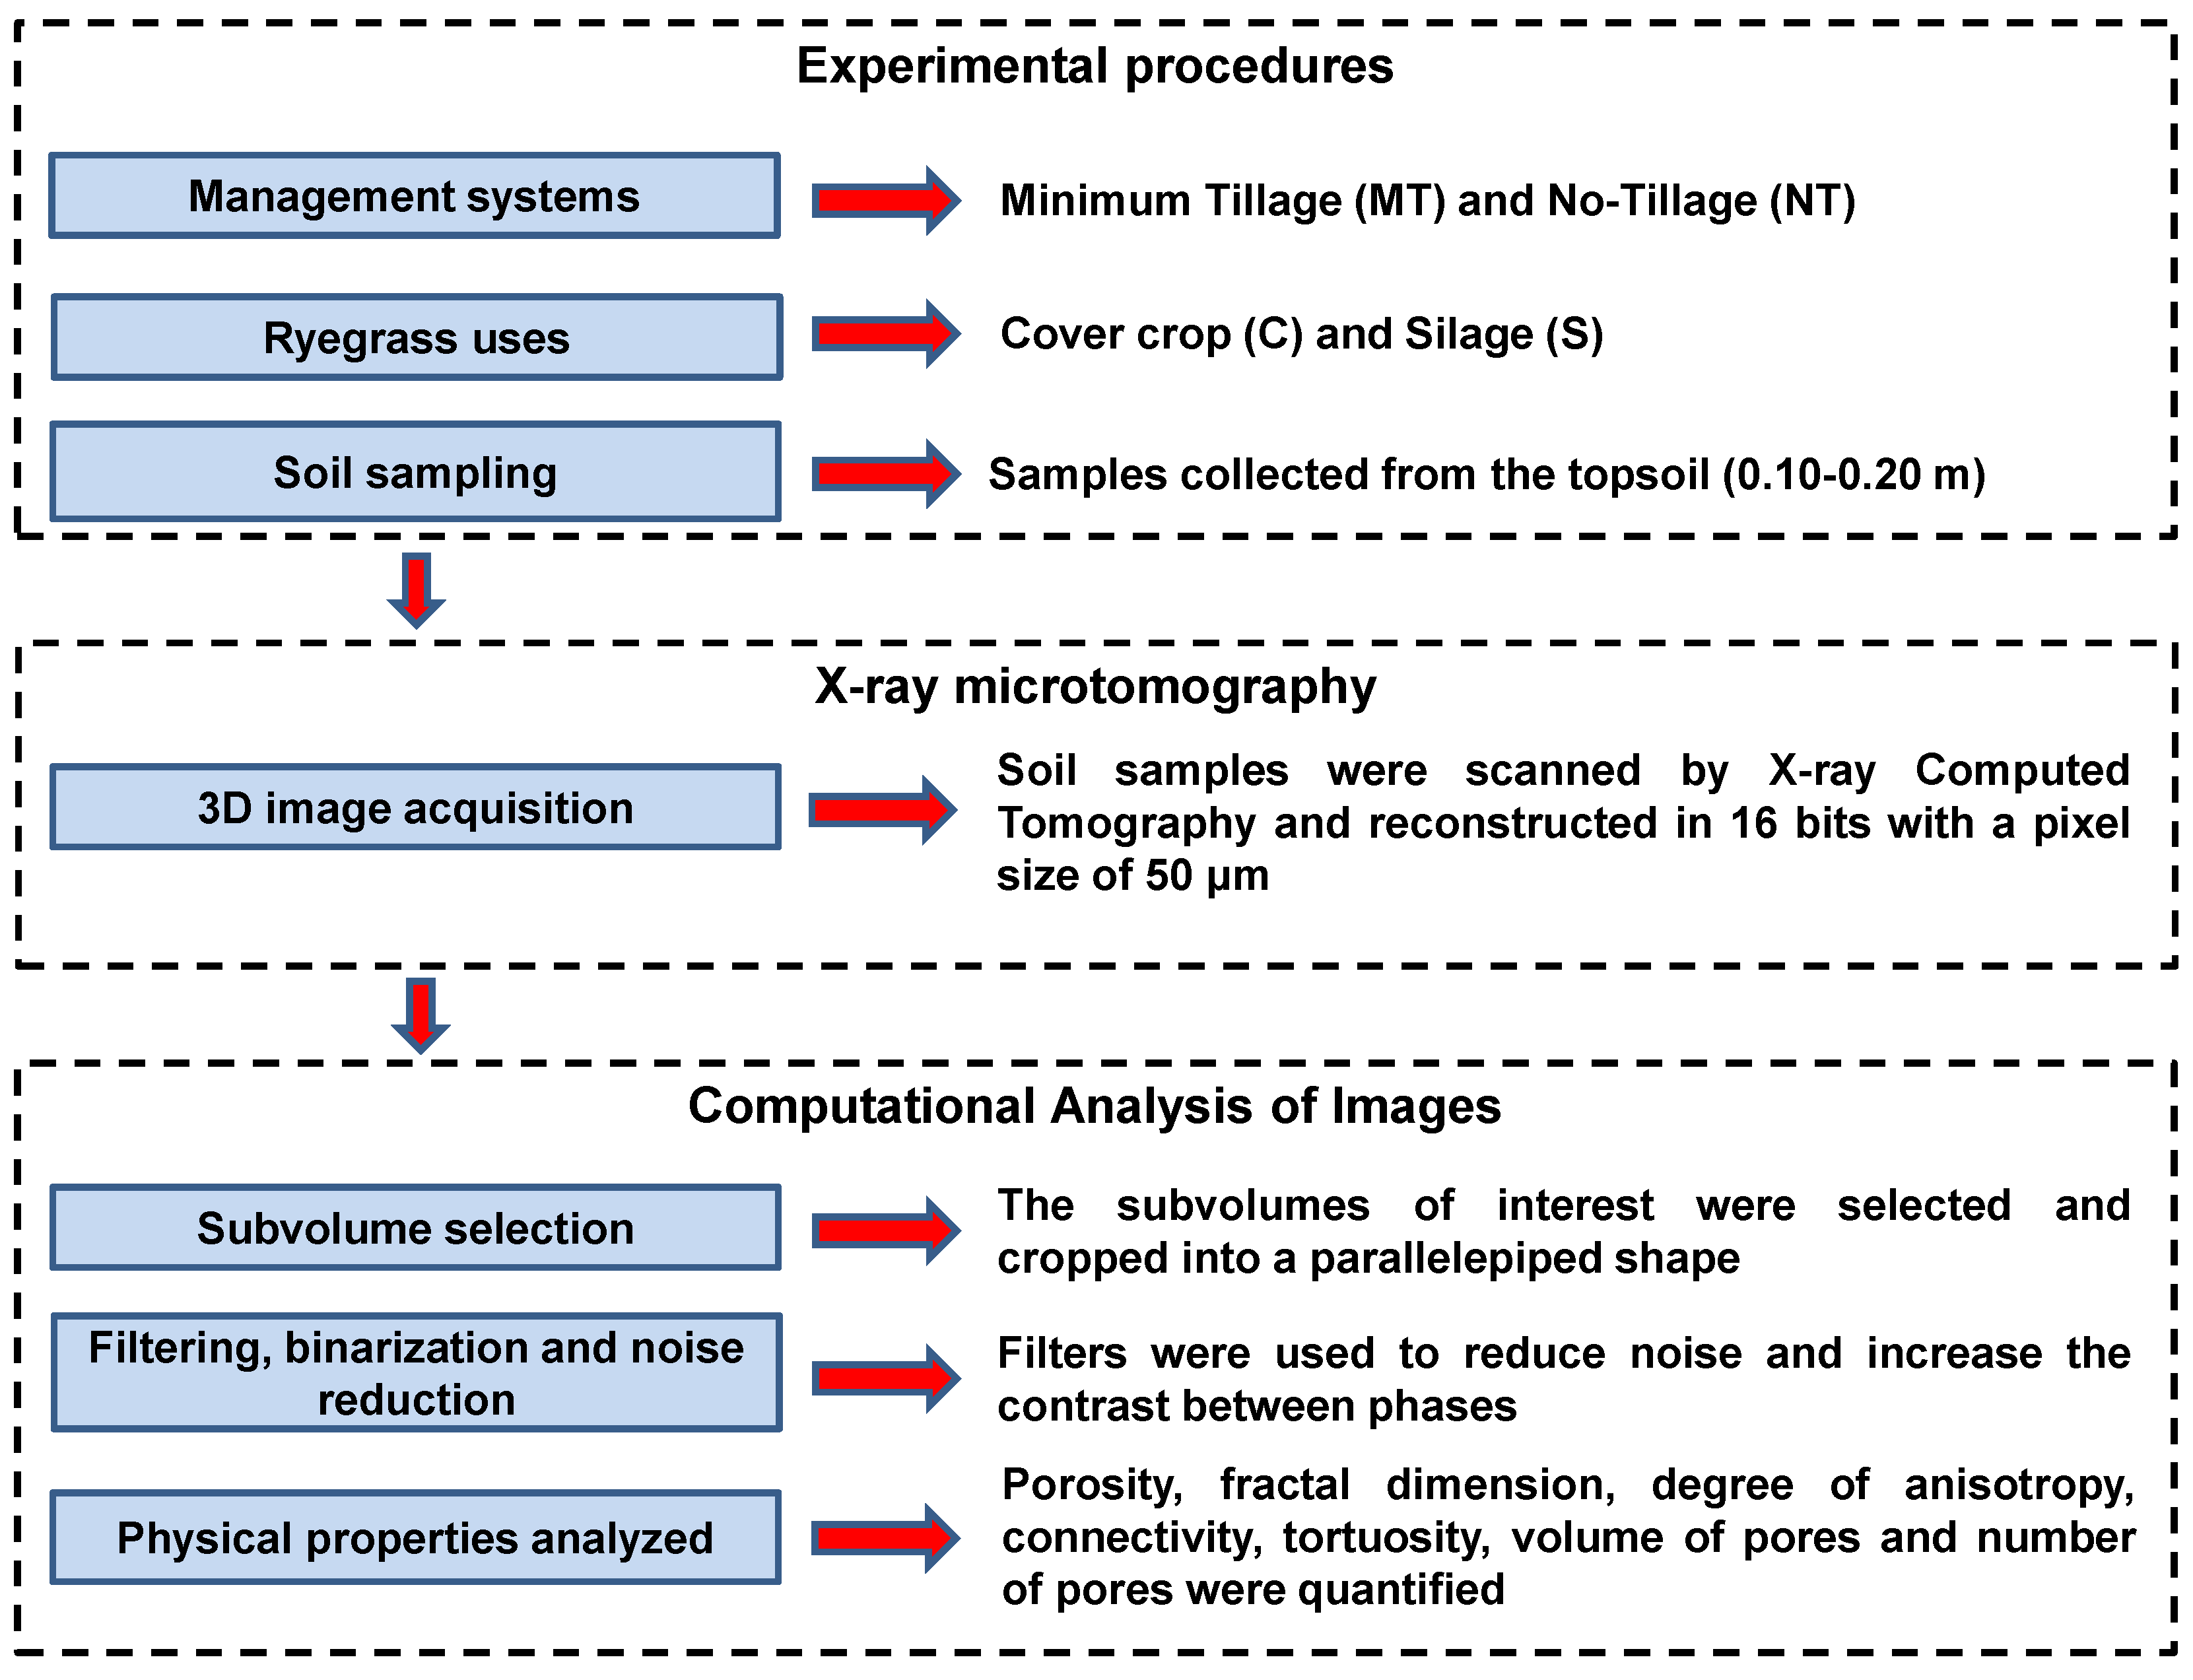
Figure 3 shows a flowchart summarizing the main steps followed in this study, in order to make it easier to understand the results that will be presented next.

2.5. Statistical Analysis

The data on the morphological and geometric parameters of the soil pores was submitted to analysis of variance (ANOVA), followed by the Tukey test at a 5% significance level. These tests were carried out to compare the means of the different treatments. In addition, Pearson’s correlation coefficients were calculated between the variables of the different managements, ryegrass crop uses, and the morphological and geometric properties measured. All the statistical analyses were done using the PAST (Paleontological Statistics) software, version 4.03 [36].

3. Results and Discussion

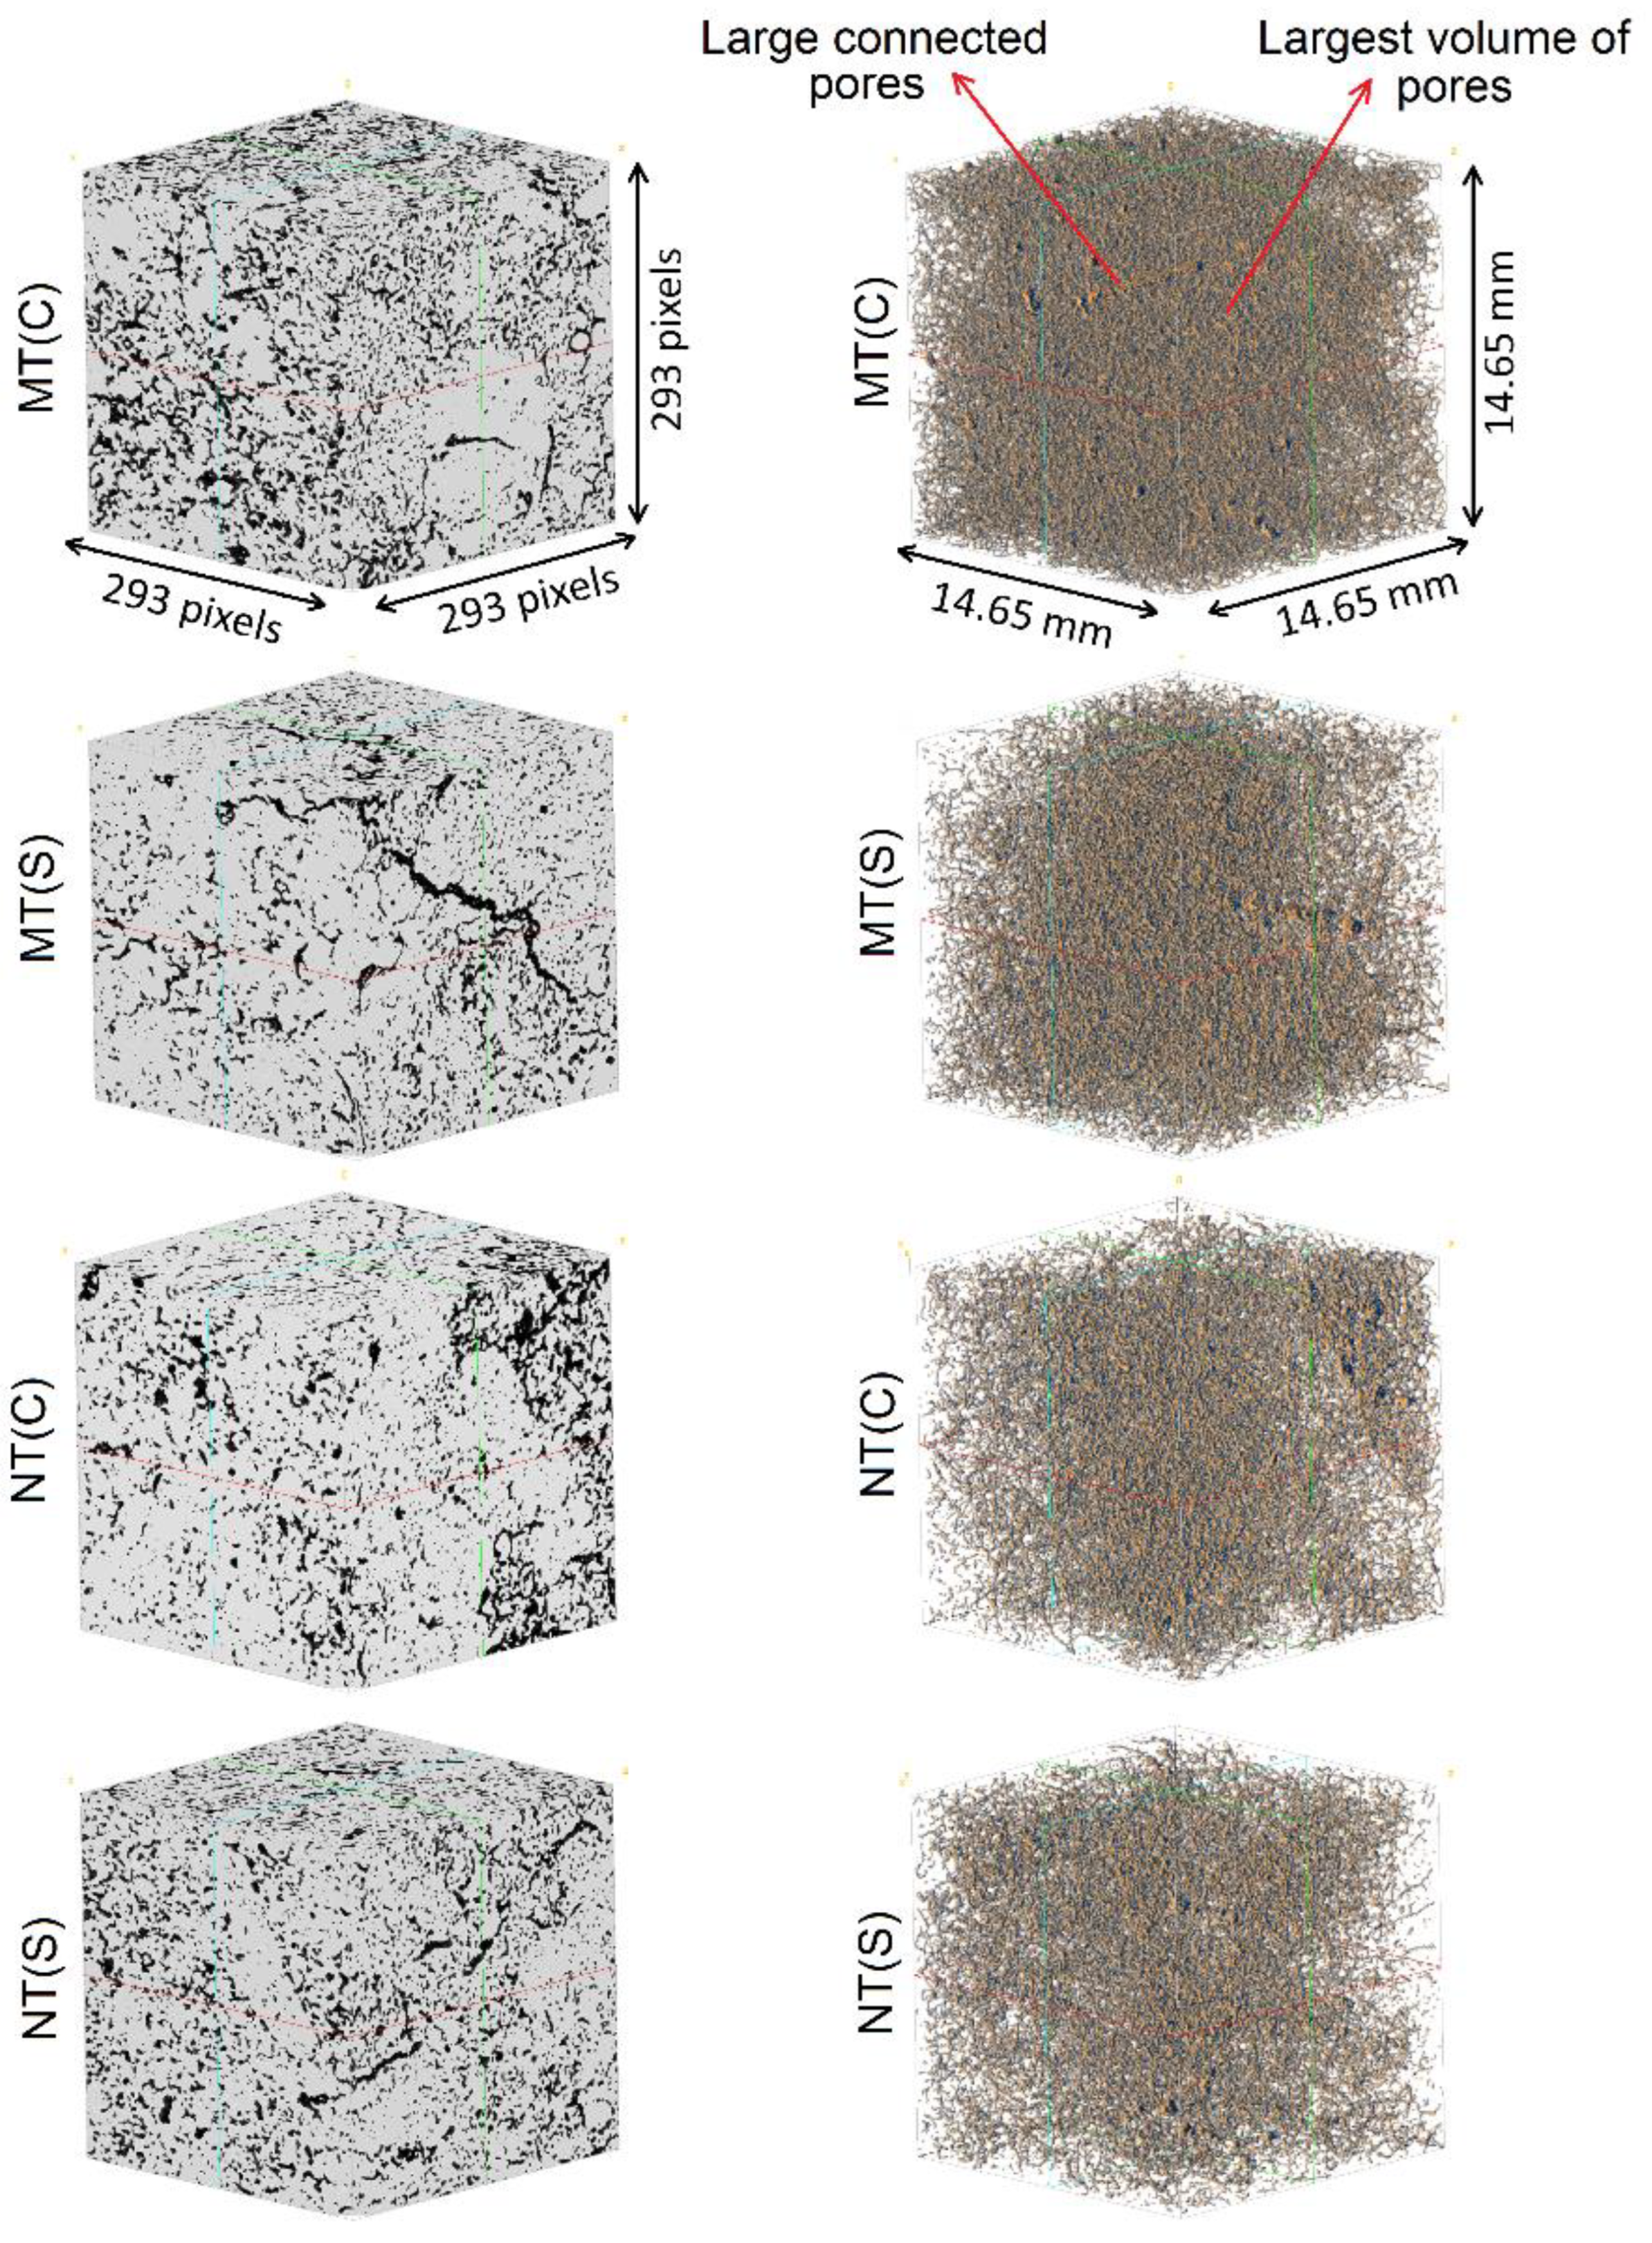
Representative 3D grayscale images of the pore system of the samples are shown in Figure 4. We chose to select only one sample for each of the treatments studied. The MT(C) system is characterized by higher porosity and the presence of regions with connected pores in its porous system (Figure 4a,b). In the case of MT(S), it is possible to verify a smaller frequency of pores compared to MT(C), which indicates lower porosity and the presence of connected pores, which may be associated with dead roots (Figure 4c,d). The NT© (Figure 4e,f) and NT(S) (Figure 4g,h) systems also have smaller pore volumes compared to MT(S). In the former, the pores are more concentrated in some areas of the samples, indicating more anisotropy of the pore system.
In general, the images show the existence of pores with branches and interconnections in all the treatments studied. This finding suggests the predominant presence of elongated and interconnected pores in these systems. When the results of the qualitative analysis are compared with the data in Table 1, we observe that the sample with the highest bulk density (MT(C)) has the largest pore volume in the 3D images. This result is consistent with the icroporosity value found for this system (Table 1). The other treatments have similar bulk density values, explaining the similarities in pore volumes found among these managements.
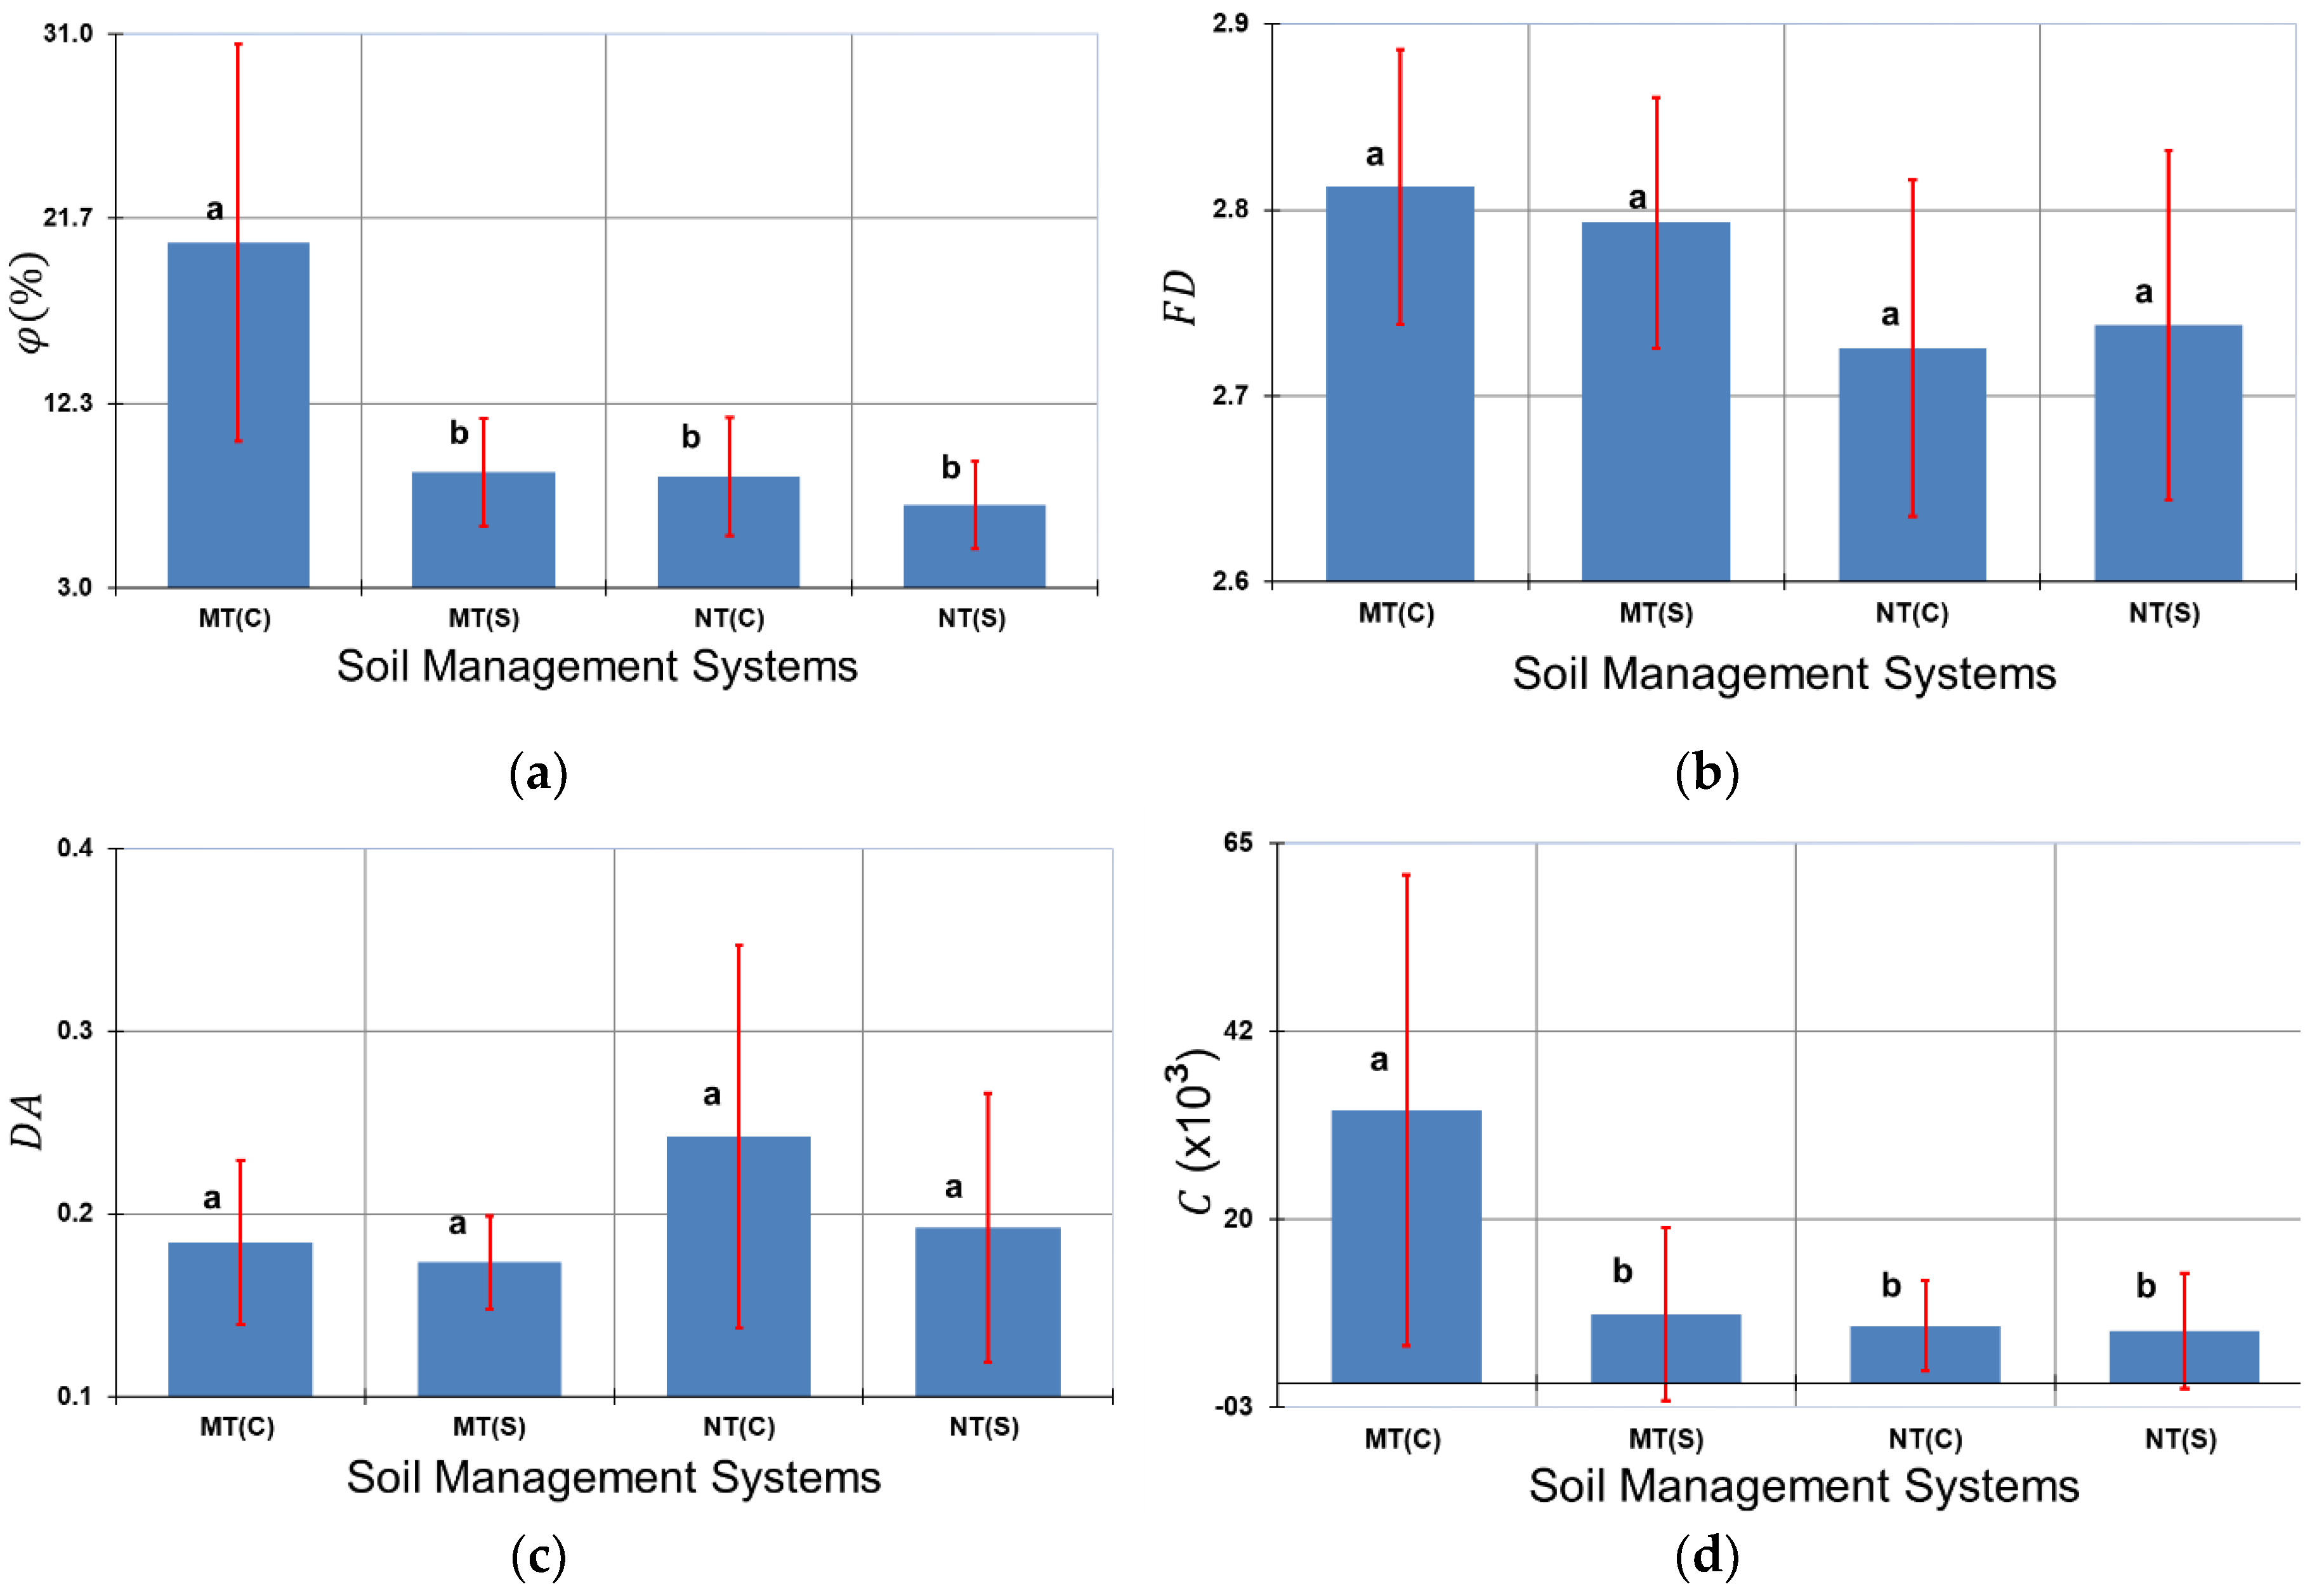
The φ results (Figure 5a) show that the MT(C) system differed significantly (p<0.05) from the other treatments. The greater porosity of MT(C) compared to MT(S) suggests that the cover crop positively affected the pore soil system compared to silage. This fact highlights the importance of conservation practices that maintain cover crops at the surface on soil structure [37]. There were no significant differences (p> 0.05) between NT© and NT(S), although the adoption of no-tillage reduced φ . When soils are managed for long periods under NT, compaction of the surface layer can occur due to the traffic of agricultural equipment and animals, as in the case of crop-livestock integration [38,39].
Using ryegrass as a cover positively affects φ , especially when combined with minimum tillage [40,41]. In addition, maintaining vegetative cover has the added benefit of providing organic matter (Table 1) to the surface layers of the soil [42]. The presence of vegetative cover facilitates water and air movement, contributes to water retention, and reduces the impact of raindrops that can seal the soil surface and increase the risk of erosion [43]. Holthusen et al. [44] demonstrated the importance of plant residues in maintaining soil structure based on porosity measurements. Auler et al. [26], who made measurements in the same experimental area as in the present study, found that intensive use of ryegrass for grazing or silage production, regardless of the planting system, negatively affects the soil structure compared to the use of cover crops. These results are consistent with those obtained in our study.
The F D results show similarities between the treatments analyzed (Figure 5b). The more significant variability (error bars) observed between samples is related to the sensitivity of F D to small changes in pore geometry [45,46]. It is important to note that this physical parameter provides an assessment of the complexity and degree of irregularity of the soil pore structure at different scales [47,48]. Thus, changes in the complexity of pore geometry, especially at the micrometric scale, can be analyzed using FD [49].
In this study, MT had the highest F D values for cover and silage compared to NT but had little effect on NT (p>0.05). This result may be related to the greater resilience of NT to structural changes due to the lack of soil disturbance, as pointed out by Fiorini et al. [50] and Zhang et al. [51]. However, in the silage process, the procedures used to manage the area can reduce φ , which affects pore complexity [26,52]. Papadopoulos et al. [53] showed that F D is sensitive to several factors, including soil compaction and biological activity. It is important to note that complex porous structures due to the presence of vegetation cover have been verified by several authors, confirming the results of our study [54,55]. The process of soil disturbance, even if minimal, as in the case of MT, can also favor the appearance of more complex and irregular pores, as observed by Zhang et al. [56].
We have to mention that the F D values found (between 2.50 and 2.90) are consistent with other studies for 3D structures [20,45]. However, Dhaliwal & Kumar [35] and Singh et al. [57] reported slightly lower values than those presented here. Nevertheless, these authors found that management practices that include cover crops have the potential to improve the complexity of the soil pore system. In this sense, the higher F D values found in our study are evidence of complex pores, regardless of the treatment analyzed.
The degree of anisotropy (Figure 5c) reflects the arrangement of soil pores in different directions [58,59]. Our study observed the highest D A values for NT, although minor differences (p>0.05) were observed between treatments. Similar results were reported by Polich et al. [60] in a study that combined management practices with winter cover crops. The higher D A observed for NT under cover crops is associated with less soil disturbance, improved root development, and the accumulation of plant residues on the soil surface, which favors the appearance of pore clusters [50]. Garbout et al. [61] highlight that no-tillage practices facilitate the formation of more oriented and connected pore systems than practices that till the soil. These practices, typically associated with the presence of soil fauna and plant remains on the soil surface, exert a direct influence on the anisotropy of the soil pore system [62].
The low D A values observed in our study (≤0.25) indicate the presence of more isotropic pore structures. These findings are consistent with those of previous studies in soil science [20,61,63]. As stated by Tseng et al. [63], lower D A values can indicate that the soil pore network extends relatively homogeneously in all directions. This fact suggests that the capacity for water transport, aeration, and nutrient movement in the soil can occur more uniformly, which is vital from the point of view of water percolation and redistribution [64].
The MT(C) exhibited the highest pore connectivity compared to the other treatments (Figure 5d). This parameter is related to the continuity of the pore network through connections between pores of different sizes and is fundamental to water dynamics and the transport of nutrients and gases in the soil profile [65,66]. The C values observed for the different treatments are consistent with the findings of Ferreira et al. [67]. Castro Filho et al. [68] and Dexter [69] emphasize that management practices considered conservationist, such as minimum tillage, when associated with vegetation cover, tend to result in soils with a stronger structure and more stable aggregates. When soil structure remains stable over the long term, this can favor better connectivity between pores [70], especially considering the beneficial effects of organic matter from vegetation cover, which tends to promote the formation of interconnected pores [71]. Another relevant aspect of MT was the positive effect of cover crops compared to silage. Some authors have proposed that silage may damage the pore structure due to the traffic of the forage harvester [52,72,73], resulting in the densification of the soil and a reduction in its connectivity (Table 1). Concerning NT, the lower C values may also be associated with the traffic of agricultural implements and animals during grazing, which reduces pore connectivity [74,75].
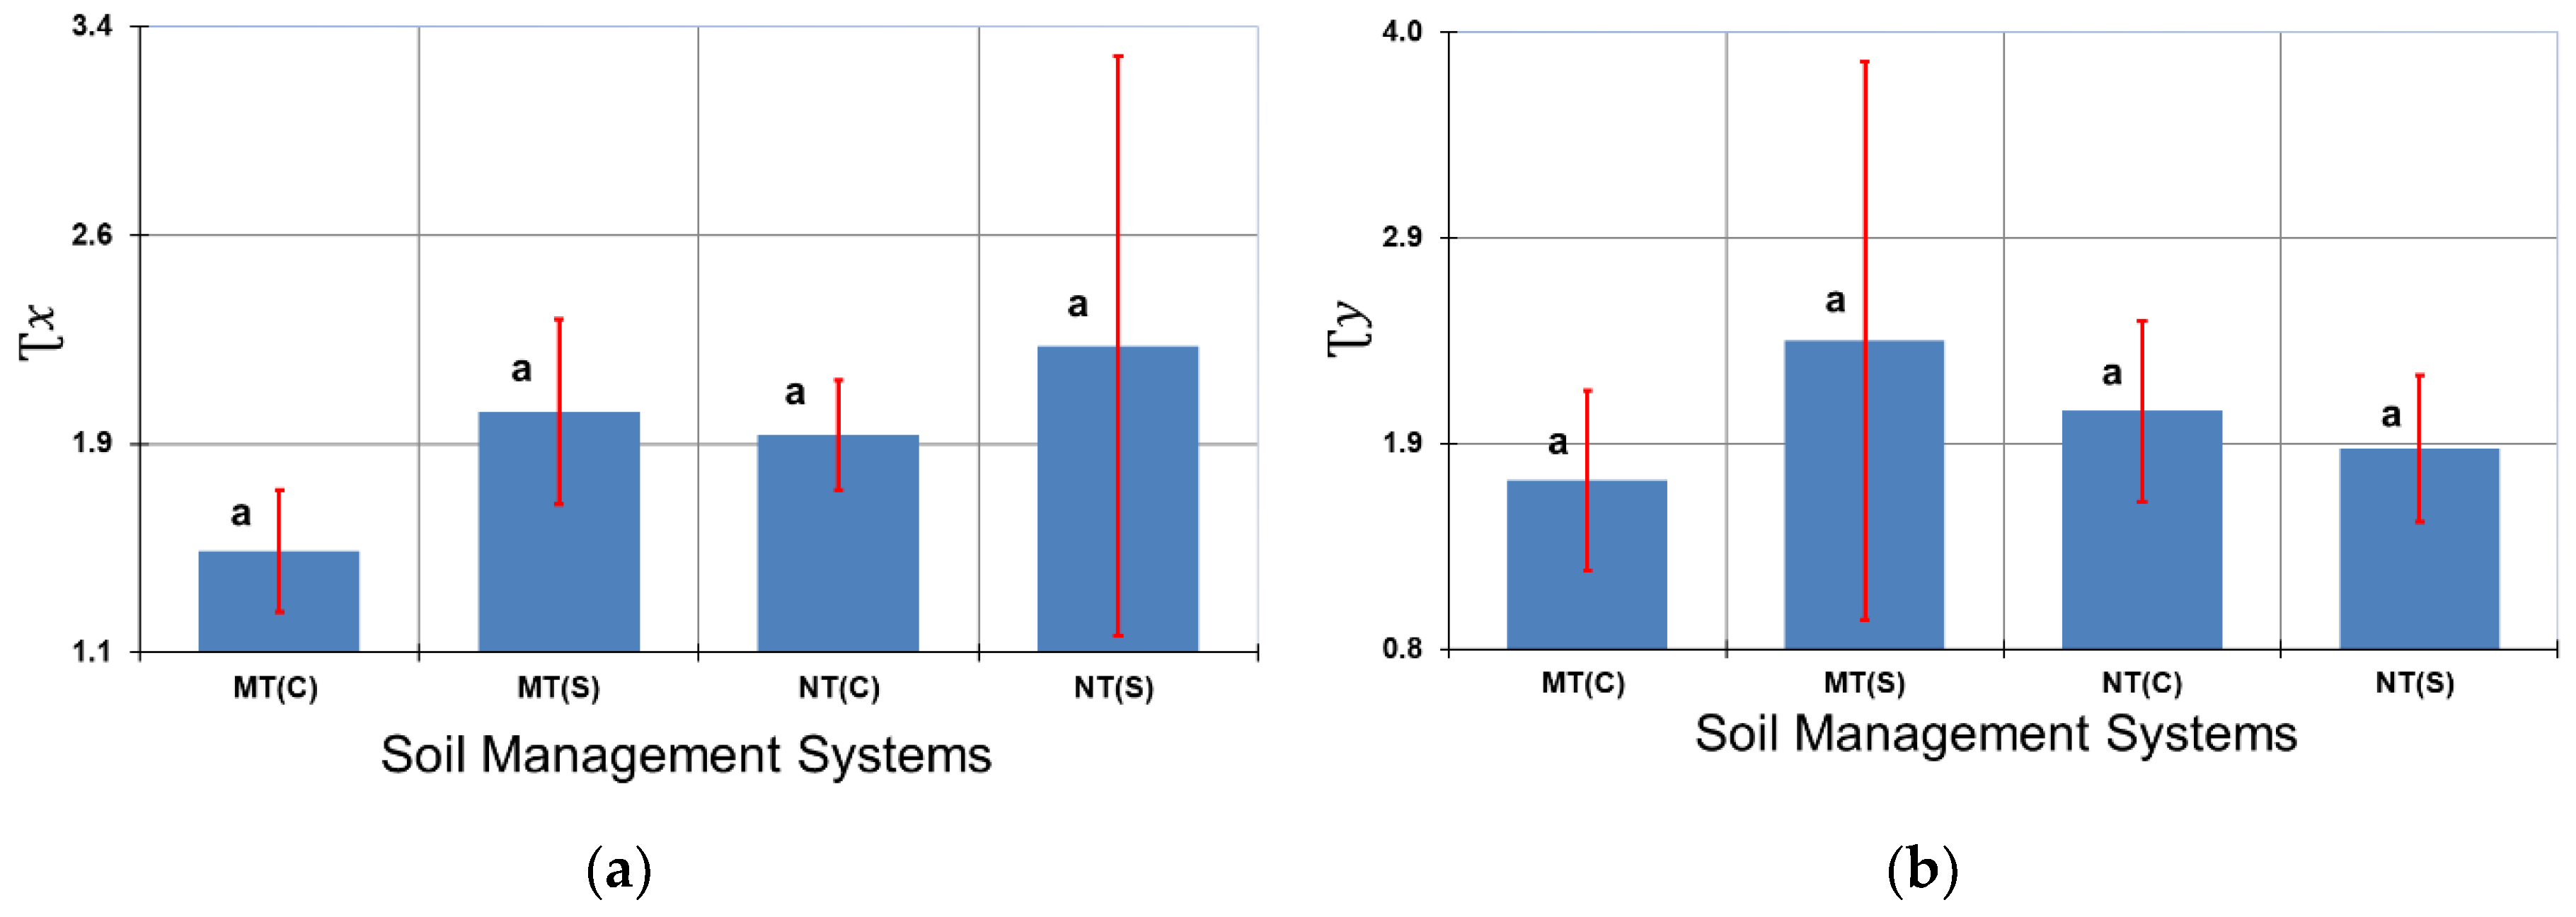
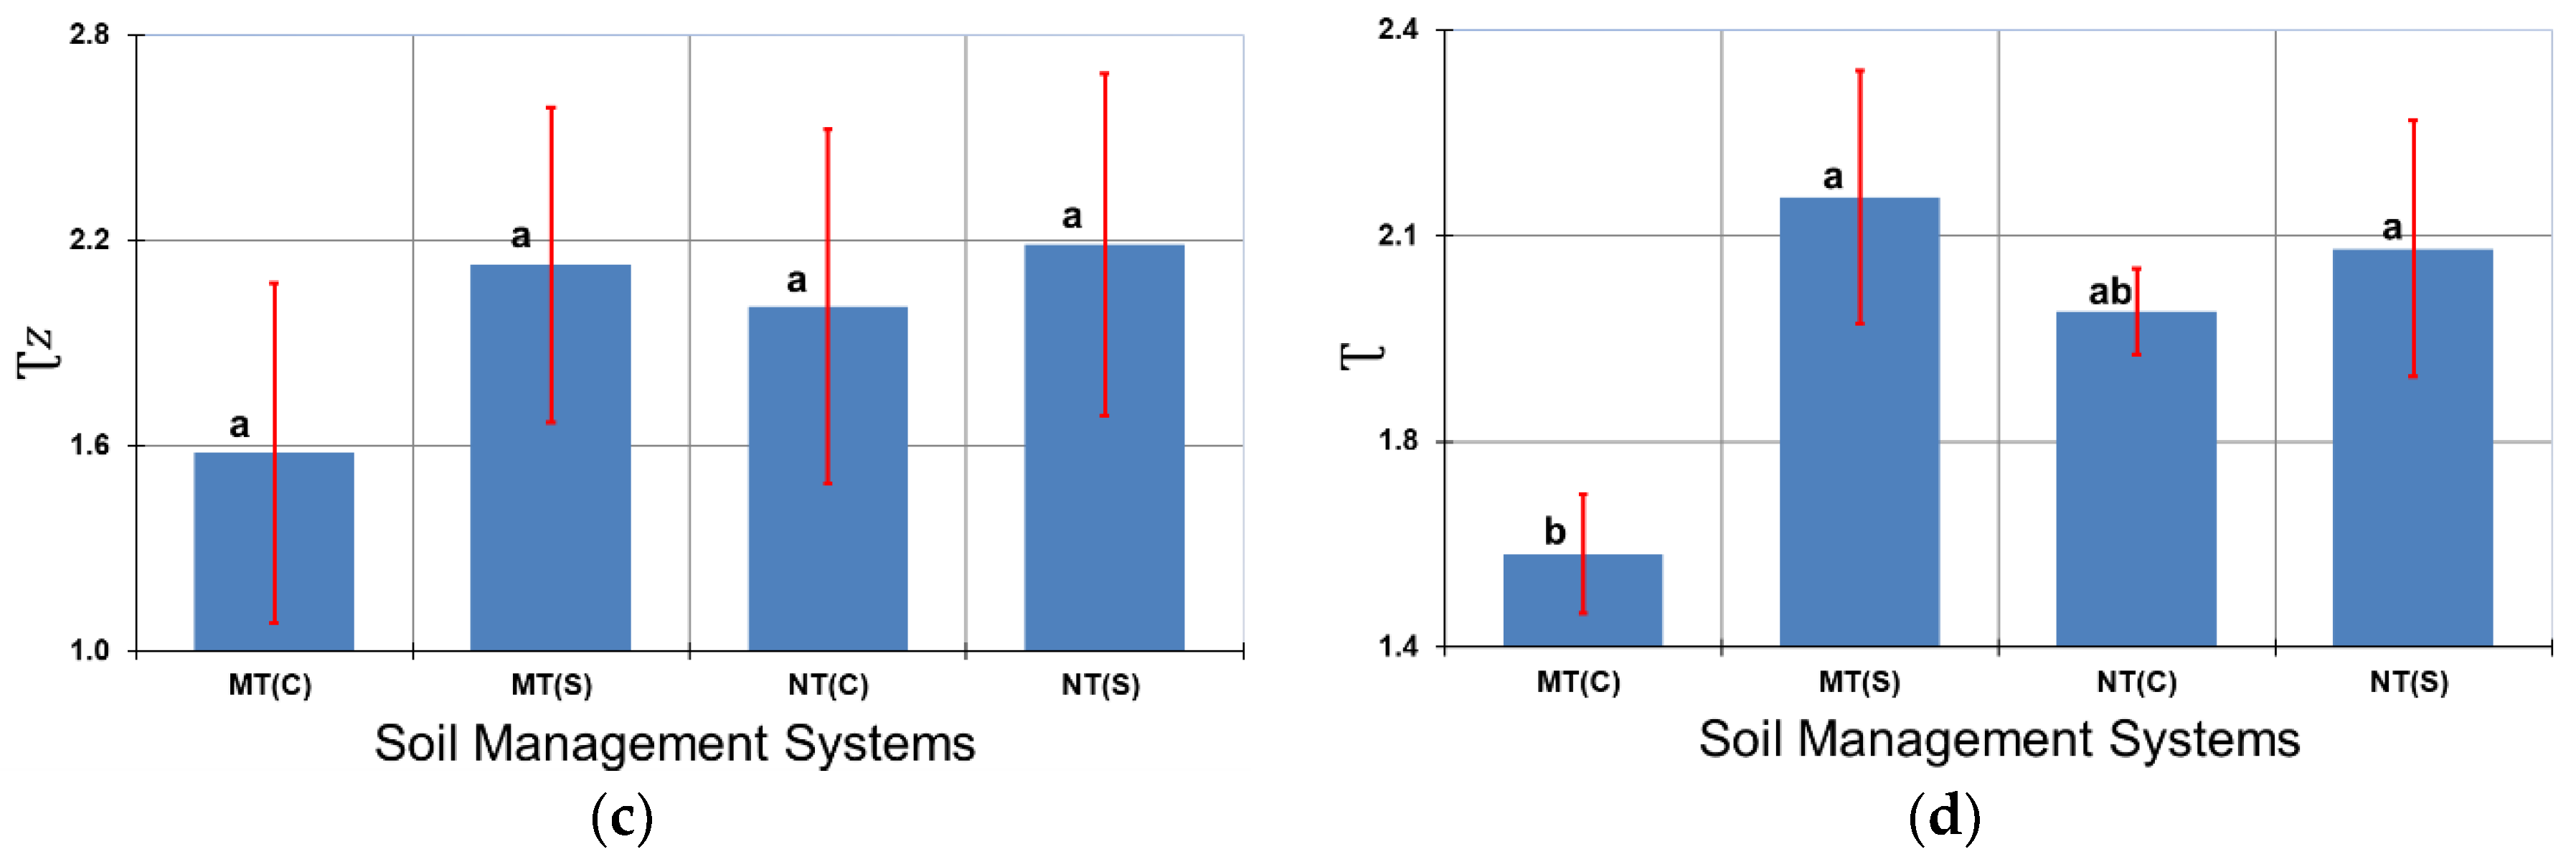
Figure 6 shows the tortuosity results for the different directions ( x , y , z ) and their mean value (considering all directions).
It is fundamental to acknowledge that the Ʈ results are not related to the orientation of the soil pores, as the aggregates were extracted without indicating direction. Nevertheless, the Ʈ values in this study provide an understanding of the variability of this physical property across different directions. It is also noteworthy that properties such as tortuosity serve to describe the degree of sinuosity of the pores [76], which directly influences the dynamics of fluids and gases in the soil [77,78].
The Ʈ values showed minor differences (p>0.05) between the treatments considering the three directions (Figure 6a–c). However, Ʈ considering all directions showed differences between MT(C) and the other treatments (Figure 6d), except for NT(C). When the different directions are analyzed, NT(S) and MT(S) showed the highest average Ʈ x and Ʈ z values (Figure 6a,c). On the other hand, for the y-axis (Figure 6b), the MT(S) and NT(C) systems were found to have the highest Ʈ values. When Ʈ is analyzed (Figure 6d), it can be seen that the MT(S) and NT(S) treatments have the highest average values, with the lowest being observed for MT(C).
Our results demonstrate that different soil management practices influence pore tortuosity. Previous studies by Elliot et al. [79] and Eltz & Norton [80] have identified variations in Ʈ in response to different management practices, indicating the susceptibility of the pore network to changes due to the action of agricultural implements. When examining systems under crop-livestock integration, Dhaliwal & Kumar [35] and Peth et al. [81] identified lower Ʈ values and well-connected pores, which align with the findings of our study. The lower Ʈ value for MT(C) can be attributed to the positive impact of this management on porosity and pore connectivity (Table 1). Recent studies have demonstrated that management practices with less connected pores and low porosity tend to exhibit the highest tortuosity [43,76,82]. It can be observed that processes that involve the densification of the soil (Table 1) by the traffic of agricultural machinery or animals tend to increase tortuosity [83,84]. This fact may explain the higher tortuosity values observed mainly for areas under silage.
Notably, the Ʈ values we found are consistent with those reported in the scientific literature. Pires et al. [70] investigated no-tillage and conventional tillage systems and found Ʈ values ranging from 1.5 to 1.7. Ferreira et al. [67] examined soil under no-tillage and pasture and found Ʈ values ranging from 2.0 to 2.7. Conversely, Galdos et al. [43] reported lower Ʈ values, ranging from 1.3 to 1.5, for tropical soils under no-tillage and conventional tillage. These findings demonstrate that Ʈ is a valuable indicator for monitoring changes in the soil pore network, as it is influenced by soil properties such as texture and structure (Table 1), as well as by management practices and vegetation cover crop systems. It is also important to note that the method for measuring Ʈ can also affect the results obtained [85].
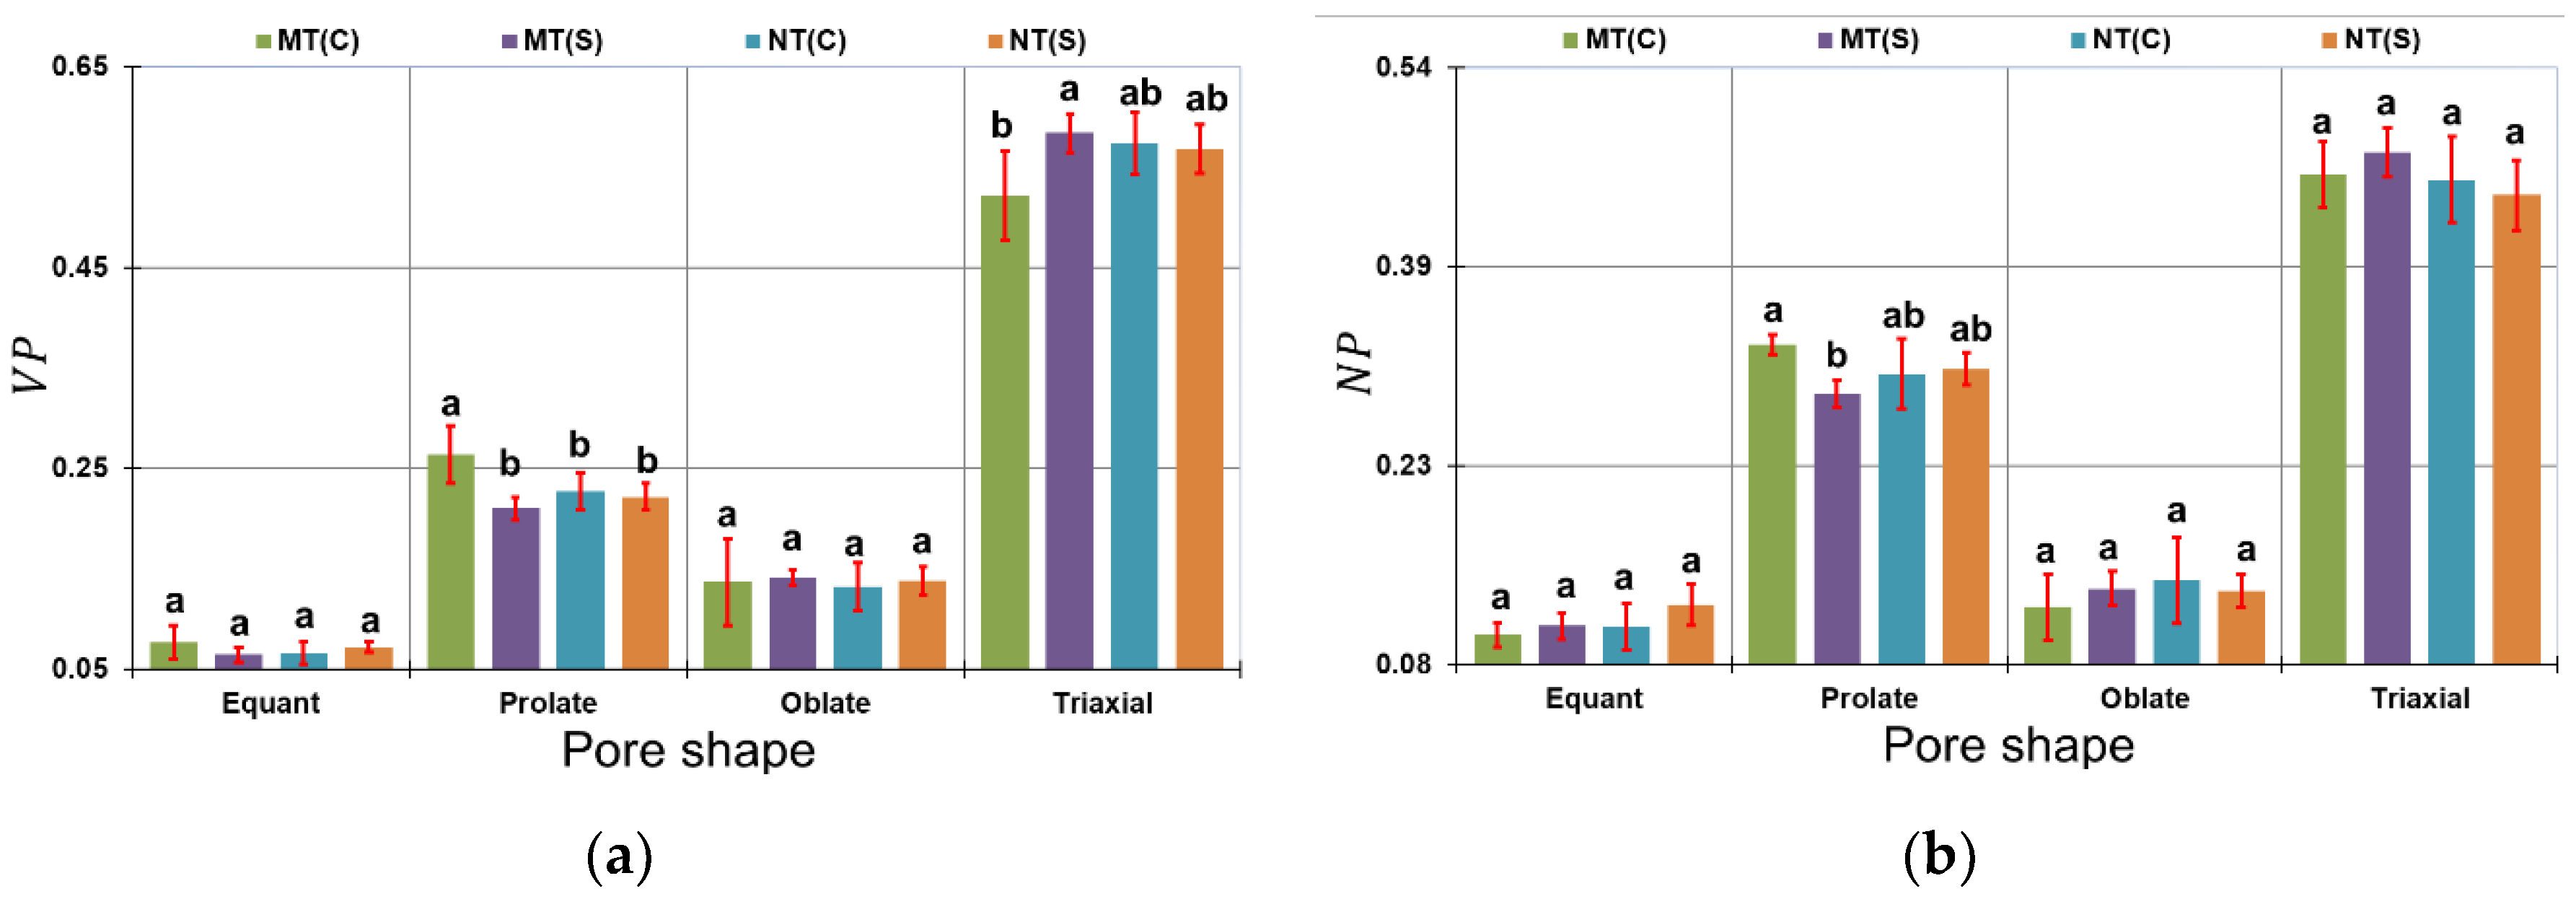
The results of the effect of the treatments studied on the contribution of the volume and number of pores as a function of their shapes are shown in Figure 7. It is of fundamental importance to study pore shape, as the porous system is susceptible to changes due to the different processes that occur in the soil. These changes are influenced by natural and human-induced processes [61,82]. In V P and N P results (Figure 7a,b), the contributions of unclassified pores, characterized by higher complexity, were not included. It is important to note that these pores represented approximately 65% of V P and N P . These pores are designated as unclassified when it is impossible to identify at least one of the semi-axes of the ellipsoids used to describe their shape.
The results show that the different treatments affect the more elongated (triaxial-shaped and prolate-shaped) pores (Figure 7). MT(C) favored the formation of rod-shaped pores, with significant differences to the other treatments (p<0.05), but with a reduction in the contribution of ellipsoidal-shaped pores (Figure 7a). Pores with rod and ellipsoidal shapes are essential in water infiltration, soil aeration, erosion resistance, and organic matter decomposition [35,70]. The elongated transmission pores play an important role in the processes of water conduction in the soil [6]. In the case of the MT(C), the appearance of these pores corroborates the greater porosity and connectivity of the pores, and lower tortuosity was found for this treatment. Other authors working with clay soils also observed the predominance of V P and N P with an ellipsoidal shape in the soil structure [35,43].
Although disk and spheroidal pore shapes are essential in soil structure, they contributed less to V P than ellipsoidal and rod-shaped pores (Figure 7a). No significant differences (p>0.05) were observed between treatments for these pore types. The minor differences noticed for some pore shapes analyzed between treatments indicate pores more resilient to changes [35]. Spheroidal and disc-shaped pores are generally found isolated from other pores and can be produced by the action of agricultural implements, air entrapment during soil drying, and the activity of soil fauna [86,87]. The prevalence of these types of pores can indicate a soil with a damaged structure [6,88]. Authors such as Pietola et al. [89] and Posadas et al. [90] indicate that the traffic of agricultural implements and the inadequate use of pasture can result in more isolated and flattened pores. Consequently, the low contribution of these pores in the soil demonstrates that the area studied presented good structural conditions for the treatments analyzed. It is worth mentioning that spheroidal and disk-type-shaped pores are generally more resilient to changes and have lower contributions due to being disconnected from other pores or having a very flat shape [87,91].
When we compared the relationship between the analyzed properties, we found that MT(C) had the highest porosity and fractal dimension (Figure 5a,b). The correlation analysis comparing all the treatments provided a moderate positive linear correlation (r=0.61, p<0.05), indicating that lower φ is related to less complex porous media [48,92]. For D A , no relationship was observed with φ (r= -0.13, p<0.05). However, there was a weak negative correlation with F D (r= -0.47, p<0.05). For pore connectivity, MT(C) was found to have the highest values, as was observed for φ and F D (Figure 5d). Connectivity showed a strong positive linear correlation (r=0.88, p<0.05) with φ and a moderate positive correlation (r=0.63, p<0.05) with F D . This result suggests that soil systems with higher porosity and complexity exhibit higher connectivity between pores [93,94]. On the other hand, C and D A did not show any kind of relationship (r= -0.05, p<0.05). Concerning pore tortuosity, this parameter was inversely related to C (r=-0.58, p<0.05) and φ (r=-0.63, p<0.05). These results suggest a tendency for Ʈ to increase when pores are less connected and soil porosity is lower [94,95].
For the different pore shapes, positive correlations were found for the rod-shaped V P against φ (r=0.72, p<0.05), F D (r=0.61, p<0.05), C (r=0.54, p<0.05); and negative correlation against Ʈ (r=-0.65, p<0.05). For the rod-shaped N P , positive correlations were found against φ (r=0.61, p<0.05), F D (r=0.86, p<0.05), C (r=0.51, p<0.05); and negative against Ʈ (r=-0.72, p<0.05). On the other hand, the ellipsoidal-shaped pores, which had the largest contribution to V P and N P , revealed surprising correlations with these properties. For the ellipsoidal-shaped V P , negative correlations were identified against φ (r=-0.72, p<0.05), F D (r=-0.42, p<0.05), C (r=-0.79, p<0.05), and a positive correlation against Ʈ (r=0.48, p<0.05). The correlation between N P and the ellipsoidal-shaped pores was weak for the different properties analyzed: φ (r=-0.09, p<0.05), F D (r=-0.06, p<0.05), C (r=-0.17, p<0.05), and with Ʈ (r=0.05, p<0.05).
As previously mentioned, elongated pores provide a greater capacity for infiltration and storage of water and nutrients in the soil, avoiding air entrapment; and are particularly important in drought conditions, where the storage of available water becomes crucial for plant development [96,97]. However, it is worth mentioning that in the case of our study, unclassified pores will also be vital, especially concerning pore connectivity and tortuosity. These pores are generally formed by joining several other pores and, therefore, have a complex shape, making it difficult to classify them in terms of shape. For this reason, the relationship between pore shape and different soil properties should be analyzed carefully.

4. Conclusions

The results of this study revealed that the MT(C) management system showed significant improvements in various soil properties, such as porosity, fractal dimension, pore connectivity, volume, and number of rod-shaped pores. These results indicate a soil structure that favors water infiltration, air circulation, and nutrient transport processes. On the other hand, the MT(S), NT(C), and NT(S) systems showed results that may restrict water infiltration in the range of pore sizes assessed by microtomography in our study. These treatments were characterized by higher tortuosity, lower porosity, and pore connectivity, especially for using ryegrass as silage.
The fractal dimension and anisotropy results show that all treatments exhibited complex and isotropic pore structures, regardless of ryegrass management or use. These results allow us to infer that solutes can infiltrate the soil without preferential paths, which is essential for better redistribution of solutes and water retention for plants. The study also analyzed the number and volume of pores of different shapes. It was observed that ellipsoidal and rod-shaped pores were predominant, which are essential for soil water conduction and storage processes. On the other hand, spheroidal and disc-shaped pores were also identified, which contributed little to soil porosity and showed minor differences between treatments, proving resilient to changes.
Finally, our results provided a detailed analysis of soil pore architecture in integrated crop-livestock production systems. These types of findings are fundamental for understanding how different land uses at the micrometer scale affect the soil pore system, considering the function of soil pores. Thus, the information obtained here can support new studies on the relationship between soil micromorphological properties and water infiltration and retention, which are fundamental for developing crops under integrated production systems.

Author Contributions

Conceptualization, L.F.P.; methodology, J.V.G.; formal analysis, J.V.G.; investigation, J.V.G. and L.F.P.; writing—original draft preparation, J.V.G., and L.F.P.; writing—review and editing, L.F.P.; project administration, L.F.P.; funding acquisition, L.F.P. All authors have read and agreed to the published version of the manuscript.

Funding

This research was partially funded by the Brazilian National Council for Scientific and Technological Development (CNPQ) (Grants 304925/2019-5 and 404058/2021-3) and the Brazilian National Nuclear Energy Commission (CNEN) (Grant 000223.0011675/2021).

Data Availability Statement

All data are available upon reasonable request to josevalderinog@gmail.com.

Acknowledgments

The authors want to thank “Complexo de Laboratórios Multiusuários (Clabmu) da Universidade Estadual de Ponta Grossa (UEPG)” for the infrastructure related to the X-ray microtomographic analysis. JVG want to thank “Comissão Nacional de Energia Nuclear” (CNEN) for the grant (Process number 000223.0011675/2021).

Conflicts of Interest

The authors declare no conflict of interest.

References

  1. Dai, H.; Mamkhezri, J.; Arshed, N.; Javaid, A.; Salem, S.; Khan, Y.A. Role of Energy Mix in Determining Climate Change Vulnerability in G7 Countries. Sustainability 2022, 14, 2161. [Google Scholar] [CrossRef]
  2. Kumar, L.; Chhogyel, N.; Gopalakrishnan, T.; Hasan, M.K.; Jayasinghe, S.L.; Kariyawasam, C.S.; Ratnayake, S. Climate change and future of agri-food production. Future foods 2022, 4, 49–79. [Google Scholar] [CrossRef]
  3. Lal, R. Restoring soil quality to mitigate soil degradation. Sustainability 2015, 7, 5875–5895. [Google Scholar] [CrossRef]
  4. Šimanský, V.; Mendyk, L. Green fallow soil vs. intensive soil cultivation–a study of soil structure along the slope gradient affected by erosion process. Acta fytotechn zootechn 2019. 22, 76–83. [CrossRef]
  5. Li, Y.; Li, Z.; Chang, S.X.; Cui, S.; Jagadamma, S.; Zhang, Q.; Cai, Y. Residue retention promotes soil carbon accumulation in minimum tillage systems: Implications for conservation agriculture. Sci. Total Environ 2020, 740, 11. [Google Scholar] [CrossRef]
  6. Pagliai, M.; Vignozzi, N.; Pellegrini, S. Soil structure and the effect of management practices. Soil Sci 2004, 79, 131–143. [Google Scholar] [CrossRef]
  7. McBratney, A.; Field, D.J.; Koch, A. The dimensions of soil security. Geoderma 2014, 213, 203–213. [Google Scholar] [CrossRef]
  8. Indoria, A.K.; Sharma, K.L.; Reddy, K.S.; Rao, C.S. Role of soil physical properties in soil health management and crop productivity in rainfed systems–II. Management technologies and crop productivity. Curr. Sci 2016, 110, 320–328. [Google Scholar] [CrossRef]
  9. Seta, A.K.; Blevins, R.L.; Frye, W.W.; Barfield, B.J. Reducing soil erosion and agricultural chemical losses with conservation tillage. J. Environ. Qual 1993, 22, 661–665. [Google Scholar] [CrossRef]
  10. Johansen, C.; Haque, M.E.; Bell, R.W.; Thierfelder, C.; Esdaile, R.J. Conservation agriculture for small holder rainfed farming: Opportunities and constraints of new mechanized seeding systems. Field Crops Res 2012, 132, 18–32. [Google Scholar] [CrossRef]
  11. Triplett Jr, G.B.; Dick, W.A. No-tillage crop production: A revolution in agriculture! J. Agron 2008, 100, 153–165. [Google Scholar] [CrossRef]
  12. Mondal, S.; Chakraborty, D. Global meta-analysis suggests that no-tillage favourably changes soil structure and porosity. Geoderma 2022, 405, 1–12. [Google Scholar] [CrossRef]
  13. Grogan, D.; Gilliland, T.J. A review of perennial ryegrass variety evaluation in Ireland. IJAFR 2011, 50, 65–81. [Google Scholar]
  14. Wilkins, P.W. Breeding perennial ryegrass for agriculture. Euphytica 1991, 52, 201–214. [Google Scholar] [CrossRef]
  15. Poeplau, C.; Aronsson, H.; Myrbeck, Å.; Kätterer, T. Effect of perennial ryegrass cover crop on soil organic carbon stocks in southern Sweden, GEODERMA REG 2015, 4, 126-133. 4. [CrossRef]
  16. Hoffman, P.C.; Combs, D.K.; Casler, M.D. Performance of lactating dairy cows fed alfalfa silage or perennial ryegrass silage. JDS 1998, 81, 162–168. [Google Scholar] [CrossRef]
  17. Lemaire, G.; Franzluebbers, A.; de Faccio Carvalho, P.C.; Dedieu, B. Integrated crop–livestock systems: Strategies to achieve synergy between agricultural production and environmental quality. AGR ECOSYST ENVIRON 2014, 190, 4–8. [Google Scholar] [CrossRef]
  18. Sulc, R.M.; Tracy, B.F. Integrated crop–livestock systems in the US Corn Belt. J. Agron 2007, 99, 335–345. [Google Scholar] [CrossRef]
  19. Martin, G.; Moraine, M.; Ryschawy, J.; Magne, M.A.; Asai, M.; Sarthou, J.P.; Therond, O. Crop–livestock integration beyond the farm level: a review. Agron. Sustain. Dev 2016, 36, 21. [Google Scholar] [CrossRef]
  20. Gaspareto, J.V.; Oliveira, J.A.T.d.; Andrade, E.; Pires, L.F. Representative Elementary Volume as a Function of Land Uses and Soil Processes Based on 3D Pore System Analysis. Agriculture 2023, 13, 20. [Google Scholar] [CrossRef]
  21. Helliwell, J.R.; Sturrock, C.J.; Grayling, K.M.; Tracy, S.R.; Flavel, R.J.; Young, I.M.; Mooney, S.J. Applications of X-ray computed tomography for examining biophysical interactions and structural development in soil systems: a review. Eur. J. Soil Sci 2013, 64, 279–297. [Google Scholar] [CrossRef]
  22. Costanza-Robinson, M.S.; Estabrook, B.D.; Fouhey, D.F. Representative elementary volume estimation for porosity, moisture saturation, and air-water interfacial areas in unsatured porous media: Data quality implications. Water Resour. Res 2011, 47, 12. [Google Scholar] [CrossRef]
  23. Ketcham, R.A.; Carlson, W.D. Acquisition, optimization and interpretation of X-ray computed tomographic imagery: applications to the geosciences. Comput and Geosci 2001, 27, 381–400. [Google Scholar] [CrossRef]
  24. Luo, L.; Lin, H.; Halleck, P. Quantifying soil structure and preferential flow in intact soil using X-ray computed tomography. Soil Sci. Soc. Am. J 2008, 72, 1058–1069. [Google Scholar] [CrossRef]
  25. Aparecido, L.E.D.O.; Rolim, G.D.S.; Richetti, J.; Souza, P.S.D.; Johann, J.A. Köppen, Thornthwaite and Camargo climate classifications for climatic zoning in the State of Paraná, Brazil. Ciênc. agrotec 2016, 40, 405–417. [Google Scholar] [CrossRef]
  26. Auler, A.C.; Miara, S.; Pires, L.F.; Fonseca, A.F.D.; Barth, G. Soil physico-hydrical properties resulting from the management in Integrated Production Systems. Rev. Science Agron 2014, 45, 976–989. [Google Scholar] [CrossRef]
  27. Schneider, C.A.; Rasband, W.S.; Eliceiri, K.W. NIH Image to ImageJ: 25 years of image analysis. Nat. Methods 2012, 9, 671–675. [Google Scholar] [CrossRef] [PubMed]
  28. Nimmo, J.R. Porosity and pore size distribution. Environ. Earth Sci 2004, 3, 295–303. [Google Scholar] [CrossRef]
  29. Wu, J.; Jin, X.; Mi, S.; Tang, J. An effective method to compute the box-counting dimension based on the mathematical definition and intervals. RINENG 2020, 6, 11. [Google Scholar] [CrossRef]
  30. Doube, M.; Kłosowski, M.M.; Arganda-Carreras, I.; Cordelières, F.P.; Dougherty, R.P.; Jackson, J.S.; Schmid, B.; Hutchinson, J.R.; Shefelbine, S.J. BoneJ: free and extensible bone image analysis in ImageJ. Bone 2010, 47, 1076–1079. [Google Scholar] [CrossRef] [PubMed]
  31. Odgaard, A.; Gundersen, H.J.G. Quantification of connectivity in cancellous bone, with special emphasis on 3-D reconstructions. Bone 1993, 14, 173–182. [Google Scholar] [CrossRef] [PubMed]
  32. Roque, W.L.; Costa, R.R. A plugin for computing the pore/grain network tortuosity of a porous medium from 2D/3D MicroCT image. Appl. Comput. Geosci. 2020, 5, 12. [Google Scholar] [CrossRef]
  33. Gommes, C.J.; Bons, A.J.; Blacher, S.; Dunsmuir, J.H.; Tsou, A.H. Practical methods for measuring the tortuosity of porous materials from binary or gray-tone tomographic reconstructions. AICHE J 2009, 55, 2000–2012. [Google Scholar] [CrossRef]
  34. Bullock, P.; Fedoroff, N.; Jongerius, A. Handbook for soil thin section description, 1rd ed.; Waine Research: Albrighton, England, 1985; pp. 1–152. [Google Scholar]
  35. Dhaliwal, J.K.; Kumar, S. 3D-visualization and quantification of soil porous structure using X-ray micro-tomography scanning under native pasture and crop-livestock systems. Soil Tillage Res 2022, 218, 8. [Google Scholar] [CrossRef]
  36. Hammer, Ø.; Harper, D.A. Past: paleontological statistics software package for educaton and data anlysis. PALAEONTOL ELECTRON 2001, 4, 1. [Google Scholar]
  37. Verhulst, N.; Govaerts, B.; Verachtert, E.; Castellanos-Navarrete, A.; Mezzalama, M.; Wall, P.; Deckers, J.; Sayre, K.D. Conservation agriculture, improving soil quality for sustainable production systems, 1rd ed.; CIMMYT: Texcoco, Mexico, 2010; pp. 137–208. [Google Scholar]
  38. de Oliveira, T.S.; Fernandes, R.B. Physical Subsoil Constraints of Agricultural and Forestry Land. Subsoil Constraints for Crop Production, 1nd ed.; de Oliveira, T.S., Bell, R.W., Eds.; Publisher: Springer: Cham, Switzerland, 2007; Volume 1, pp. 125–160. [Google Scholar]
  39. Reichert, J.M.; Brandt, A.A.; Rodrigues, M.F.; da Veiga, M.; Reinert, D.J. Is chiseling or inverting tillage required to improve mechanical and hydraulic properties of sandy clay loam soil under long-term no-tillage? Geoderma 2017, 301, 72–79. [Google Scholar] [CrossRef]
  40. Haruna, S.I.; Anderson, S.H.; Udawatta, R.P.; Gantzer, C.J.; Phillips, N.C.; Cui, S.; Gao, Y. Improving soil physical properties through the use of cover crops: A review. Agrosystems Geosci. Environ 2020, 3, 18. [Google Scholar] [CrossRef]
  41. Qi, J.; Jensen, J.L.; Christensen, B.T.; Munkholm, L.J. Soil structural stability following decades of straw incorporation and use of ryegrass cover crops. Geoderma 2022, 406, 11. [Google Scholar] [CrossRef]
  42. Tsukada, H.; Yamada, D.; Yamaguchi, N. Accumulation of 137Cs in aggregated organomineral assemblage in pasture soils 8 years after the accident at the Fukushima Daiichi nuclear power plant. Sci. Total Environ 2022, 806, 9. [Google Scholar] [CrossRef] [PubMed]
  43. Galdos, M.V.; Pires, L.F.; Cooper, H.V.; Calonego, J.C.; Rosolem, C.A.; Mooney, S.J. Assessing the long-term effects of zero-tillage on the macroporosity of Brazilian soils using X-ray Computed Tomography. Geoderma 2019, 337, 1126–1135. [Google Scholar] [CrossRef] [PubMed]
  44. Holthusen, D.; Brandt, A.A.; Reichert, J.M.; Horn, R. Soil porosity, permeability and static and dynamic strength parameters under native forest/grassland compared to no-tillage cropping. Soil Tillage Res 2018, 177, 113–124. [Google Scholar] [CrossRef]
  45. Dathe, A.; Eins, S.; Niemeyer, J.; Gerold, G. The surface fractal dimension of the soil–pore interface as measured by image analysis. Geoderma 2001, 103, 203–229. [Google Scholar] [CrossRef]
  46. Giménez, D.; Allmaras, R.R.; Nater, E.A.; Huggins, D.R. Fractal dimensions for volume and surface of interaggregate pores—scale effects. Geoderma 1997, 77, 19–38. [Google Scholar] [CrossRef]
  47. Atzeni, C.; Pia, G.; Sanna, U.; Spanu, N. A fractal model of the porous microstructure of earth-based materials. Constr. Build. Mater 2008, 22, 1607–1613. [Google Scholar] [CrossRef]
  48. Wang, H.; Liu, Y.; Song, Y.; Zhao, Y.; Zhao, J.; Wang, D. Fractal analysis and its impact factors on pore structure of artificial cores based on the images obtained using magnetic resonance imaging. J APPL GEOPHYS 2012, 86, 70–81. [Google Scholar] [CrossRef]
  49. Holden, N.M. A two-dimensional quantification of soil ped shape. J. Soil Sci 1993, 44, 209–219. [Google Scholar] [CrossRef]
  50. Fiorini, A.; Boselli, R.; Amaducci, S.; Tabaglio, V. Effects of no-till on root architecture and root-soil interactions in a three-year crop rotation. Eur. J. Agron 2018, 99, 156–166. [Google Scholar] [CrossRef]
  51. Zhang, Y.; Tan, C.; Wang, R.; Li, J.; Wang, X. Conservation tillage rotation enhanced soil structure and soil nutrients in long-term dryland agriculture. Eur. J. Agron 2021, 131, 12. [Google Scholar] [CrossRef]
  52. dos Reis, A.M.H.; Auler, A.C.; Armindo, R.A.; Cooper, M.; Pires, L.F. Micromorphological analysis of soil porosity under integrated crop-livestock management systems. Soil Tillage Res 2021, 205, 9. [Google Scholar] [CrossRef]
  53. Papadopoulos, A.; Mooney, S.J.; Bird, N.R.A. Quantification of the effects of contrasting crops in the development of soil structure: an organic conversion. SOIL USE MANAGE 2006, 22, 172–179. [Google Scholar] [CrossRef]
  54. Duhour, A.; Costa, C.; Momo, F.; Falco, L.; Malacalza, L. Response of earthworm communities to soil disturbance: Fractal dimension of soil and species’ rank-abundance curves. APPL SOIL ECOL 2009, 43, 83–88. [Google Scholar] [CrossRef]
  55. van Noordwijk, M.; Brouwer, G.; Harmanny, K. Concepts and methods for studying interactions of roots and soil structure. Geoderma 1993, 56, 351–375. [Google Scholar] [CrossRef]
  56. Zhang, Z.; Wei, C.; Xie, D.; Gao, M.; Zeng, X. Effects of land use patterns on soil aggregate stability in Sichuan Basin, China. Particuology 2008, 6, 157–166. [Google Scholar] [CrossRef]
  57. Singh, N.; Kumar, S.; Udawatta, R.P.; Anderson, S.H.; de Jonge, L.W.; Katuwal, S. Grassland conversion to croplands impacted soil pore parameters measured via X-ray computed tomography. SOIL SCI SOC AM J 2021, 85, 73–84. [Google Scholar] [CrossRef]
  58. Pozdnyakov, A.I.; Rusakov, A.V.; Shalaginova, S.M.; Pozdnyakova, A.D. Anisotropy of the properties of some anthropogenically transformed soils of podzolic type. Eurasian Soil Sci 2009, 42, 1218–1228. [Google Scholar] [CrossRef]
  59. Pulido-Moncada, M.; Labouriau, R.; Kesser, M.; Zanini, P.P.G.; Guimarães, R.M.L.; Munkholm, L.J. Anisotropy of subsoil pore characteristics and hydraulic conductivity as affected by compaction and cover crop treatments. SOIL SCI SOC AM J 2021, 85, 28–39. [Google Scholar] [CrossRef]
  60. Polich, N.G.; Lozano, L.A.; Villarreal, R.; Salazar, M.P.; Bellora, G.L.; Barraco, M.R.; Soracco, C.G. Effect of cover crops on hysteresis and anisotropy of soil hydraulic properties. GEODERMA REG 2022, 31, 6. [Google Scholar] [CrossRef]
  61. Garbout, A.; Munkholm, L.J.; Hansen, S.B. Tillage effects on topsoil structural quality assessed using X-ray CT, soil cores and visual soil evaluation. Soil Tillage Res 2013, 128, 104–109. [Google Scholar] [CrossRef]
  62. Pires, L.F.; Roque, W.L.; Rosa, J.A.; Mooney, S.J. 3D analysis of the soil porous architecture under long term contrasting management systems by X-ray computed tomography. Soil Tillage Res 2019, 191, 197–206. [Google Scholar] [CrossRef]
  63. Tseng, C.L.; Alves, M.C.; Crestana, S. Quantifying physical and structural soil properties using X-ray microtomography. Geoderma 2018, 318, 78–87. [Google Scholar] [CrossRef]
  64. Li, M.; Yao, J.; Yan, R.; Cheng, J. Effects of infiltration amounts on preferential flow characteristics and solute transport in the protection forest soil of southwestern China. Water 2021, 13, 1301. [Google Scholar] [CrossRef]
  65. Cunha, A.R.; Fernandes, C.P.; Santos, L.O.E.D.; Kronbauer, D.P.; Mantovani, I.F.; Moreira, A.C.; Schmitt, M. A phenomenological connectivity measure for the pore space of rocks. arXiv 2020, 1, 23. [Google Scholar] [CrossRef]
  66. Bernabé, Y.; Li, M.; Maineult, A. Permeability and pore connectivity: a new model based on network simulations. J. Geophys. Res. Solid Earth 2010, 115, 14. [Google Scholar] [CrossRef]
  67. Ferreira, T.R.; Pires, L.F.; Wildenschild, D.; Heck, R.J.; Antonino, A.C. X-ray microtomography analysis of lime application effects on soil porous system. Geoderma 2018, 324, 119–130. [Google Scholar] [CrossRef]
  68. Castro Filho, C.D.; Lourenço, A.; Guimarães, M.D.F.; Fonseca, I.C.B. Aggregate stability under different soil management systems in a red latosol in the state of Parana, Brazil. Soil Tillage Res 2002, 65, 45–51. [Google Scholar] [CrossRef]
  69. Dexter, A.R. Advances in characterization of soil structure. Soil Tillage Res 1988, 11, 199–238. [Google Scholar] [CrossRef]
  70. Pires, L.F.; Borges, J.A.; Rosa, J.A.; Cooper, M.; Heck, R.J.; Passoni, S.; Roque, W.L. Soil structure changes induced by tillage systems. Soil Tillage Res 2017, 165, 66–79. [Google Scholar] [CrossRef]
  71. Papadopoulos, A.; Bird, N.R.A.; Whitmore, A.P.; Mooney, S.J. Investigating the effects of organic and conventional management on soil aggregate stability using X-ray computed tomography. Eur. J. Soil Sci. 2009, 60, 360–368. [Google Scholar] [CrossRef]
  72. Alvemar, H.; Andersson, H.; Pedersen, H.H. Profitability of controlled traffic in grass silage production–economic modelling and machinery systems. Advances in animal biosciences 2017, 8, 749–753. [Google Scholar] [CrossRef]
  73. Hargreaves, P.R.; Peets, S.; Chamen, W.C.T.; White, D.R.; Misiewicz, P.A.; Godwin, R.J. Improving grass silage production with controlled traffic farming (CTF): agronomics, system design and economics. Precis. Agric 2019, 20, 260–277. [Google Scholar] [CrossRef]
  74. Soracco, C.G.; Lozano, L.A.; Villarreal, R.; Palancar, T.C.; Collazo, D.J.; Sarli, G.O.; Filgueira, R.R. Effects of compaction due to machinery traffic on soil pore configuration. REV BRAS CIENC SOLO 2015, 39, 408–415. [Google Scholar] [CrossRef]
  75. Beutler, A.N.; Centurion, J.F.; Silva, A.P.D.; Centurion, M.A.P.D.C.; Leonel, C.L.; Freddi, O.D.S. Soil compaction by machine traffic and least limiting water range related to soybean yield. Pesqui. Agropecu. Bras 2008, 43, 1591–1600. [Google Scholar] [CrossRef]
  76. Roque, W.L.; Arcaro, K.; Lanfredi, R.B. Trabecular network tortuosity and connectivity of distal radius from microtomographic images. Rev. Bras. Eng. Bioméd 2012, 28, 116–123. [Google Scholar] [CrossRef]
  77. Ghanbarian, B.; Lin, Q.; Pires, L.F. Scale dependence of tortuosity in soils under contrasting cultivation conditions. Soil Tillage Res 2023, 233, 9. [Google Scholar] [CrossRef]
  78. Pagenkemper, S.K.; Puschmann, D.U.; Peth, S.; Horn, R. Investigation of time dependent development of soil structure and formation of macropore networks as affected by various precrop species. Int. Soil Water Conserv. Res 2014, 2, 51–66. [Google Scholar] [CrossRef]
  79. Elliot, T.R.; Reynolds, W.D.; Heck, R.J. Use of existing pore models and X-ray computed tomography to predict saturated soil hydraulic conductivity. Geoderma 2010, 156, 133–142. [Google Scholar] [CrossRef]
  80. Eltz, F.L.F.; Norton, L.D. Surface roughness changes as affected by rainfall erosivity, tillage, and canopy cover. Soil Sci. Soc. Am. J 1997, 61, 1746–1755. [Google Scholar] [CrossRef]
  81. Peth, S.; Horn, R.; Beckmann, F.; Donath, T.; Fischer, J.; Smucker, A.J.M. Three-dimensional quantification of intra-aggregate pore-space features using synchrotron-radiation-based microtomography. Soil Sci. Soc. Am. J 2008, 72, 897–907. [Google Scholar] [CrossRef]
  82. Pires, L.F.; Auler, A.C.; Roque, W.L.; Mooney, S.J. X-ray microtomography analysis of soil pore structure dynamics under wetting and drying cycles. Geoderma 2020, 362, 10. [Google Scholar] [CrossRef]
  83. Salazar, M.P.; Lozano, L.A.; Polich, N.G.; Bellora, G.L.; Miguel, C.; Villarreal, R.; Soracco, C.G. Anisotropy of soil hydraulic properties induced by repeated machinery traffic in a Typic Argiudoll of the Argentinean Pampas Region. Soil Tillage Res 2024, 237, 7. [Google Scholar] [CrossRef]
  84. Dörner, J.; Horn, R. Direction-dependent behaviour of hydraulic and mechanical properties in structured soils under conventional and conservation tillage. Soil Tillage Res 2009, 102, 225–232. [Google Scholar] [CrossRef]
  85. Holzer, L.; Marmet, P.; Fingerle, M.; Wiegmann, A.; Neumann, M.; Schmidt, V. Tortuosity and microstructure effects in porous media: classical theories, empirical data and modern methods, 1rd ed.; Springer Nature: Cham, Switzerland, 2023; pp. 1–190. [Google Scholar]
  86. Pires, L.F.; Borges, F.S.; Passoni, S.; Pereira, A.B. Soil pore characterization using free software and a portable optical microscope. Pedosphere 2013, 23, 503–510. [Google Scholar] [CrossRef]
  87. Rasa, K.; Eickhorst, T.; Tippkötter, R.; Yli-Halla, M. Structure and pore system in differently managed clayey surface soil as described by micromorphology and image analysis. Geoderma, 2012; 173, 10–18. [Google Scholar] [CrossRef]
  88. Castilho, S.C.D.P.; Cooper, M.; Silva, L.F.S.D. Micromorphometric analysis of porosity changes in the surface crusts of three soils in the Piracicaba region, São Paulo State, Brazil. Acta Scientiarum. Agron 2015, 37, 385–395. [Google Scholar] [CrossRef]
  89. Carter, M.R.; Angers, D.A.; Topp, G.C. Characterizing equilibrium physical condition near the surface of a fine sandy loam under conservation tillage in a humid climate. Soil Sci 1999, 164, 101–110. [Google Scholar] [CrossRef]
  90. Pietola, L.; Horn, R.; Yli-Halla, M. Effects of trampling by cattle on the hydraulic and mechanical properties of soil. Soil Tillage Res. 2005, 82, 99–108. [Google Scholar] [CrossRef]
  91. Posadas, A.N.; Giménez, D.; Quiroz, R.; Protz, R. Multifractal characterization of soil pore systems. Soil Sci. Soc. Am. J 2003, 67, 1361–1369. [Google Scholar] [CrossRef]
  92. Dal Ferro, N.; Charrier, P.; Morari, F. Dual-scale micro-CT assessment of soil structure in a long-term fertilization experiment. Geoderma 2013, 204, 84–93. [Google Scholar] [CrossRef]
  93. Soto-Gómez, D.; Juíz, L.V.; Pérez-Rodríguez, P.; López-Periago, J.E.; Paradelo, M.; Koestel, J. Percolation theory applied to soil tomography. Geoderma 2020, 9, 113959. [Google Scholar] [CrossRef]
  94. Vervoort, R.W.; Cattle, S.R. Linking hydraulic conductivity and tortuosity parameters to pore space geometry and pore-size distribution. J. Hydrol 2003, 272, 36–49. [Google Scholar] [CrossRef]
  95. Vogel, H.J. Morphological determination of pore connectivity as a function of pore size using serial sections. Eur. J. Soil Sci 1997, 48, 365–377. [Google Scholar] [CrossRef]
  96. Menon, M.; Mawodza, T.; Rabbani, A.; Blaud, A.; Lair, G.J.; Babaei, M.; Banwart, S. Pore system characteristics of soil aggregates and their relevance to aggregate stability. Geoderma 2020, 366, 11. [Google Scholar] [CrossRef]
  97. Zhang, S.J.; Tang, Q.; Bao, Y.H.; He, X.B.; Tian, F.X.; Lü, F.Y.; Anjum, R. Effects of seasonal water-level fluctuation on soil pore structure in the Three Gorges Reservoir, China. J. Mt. Sci 2018, 15, 2192–2206. [Google Scholar] [CrossRef]
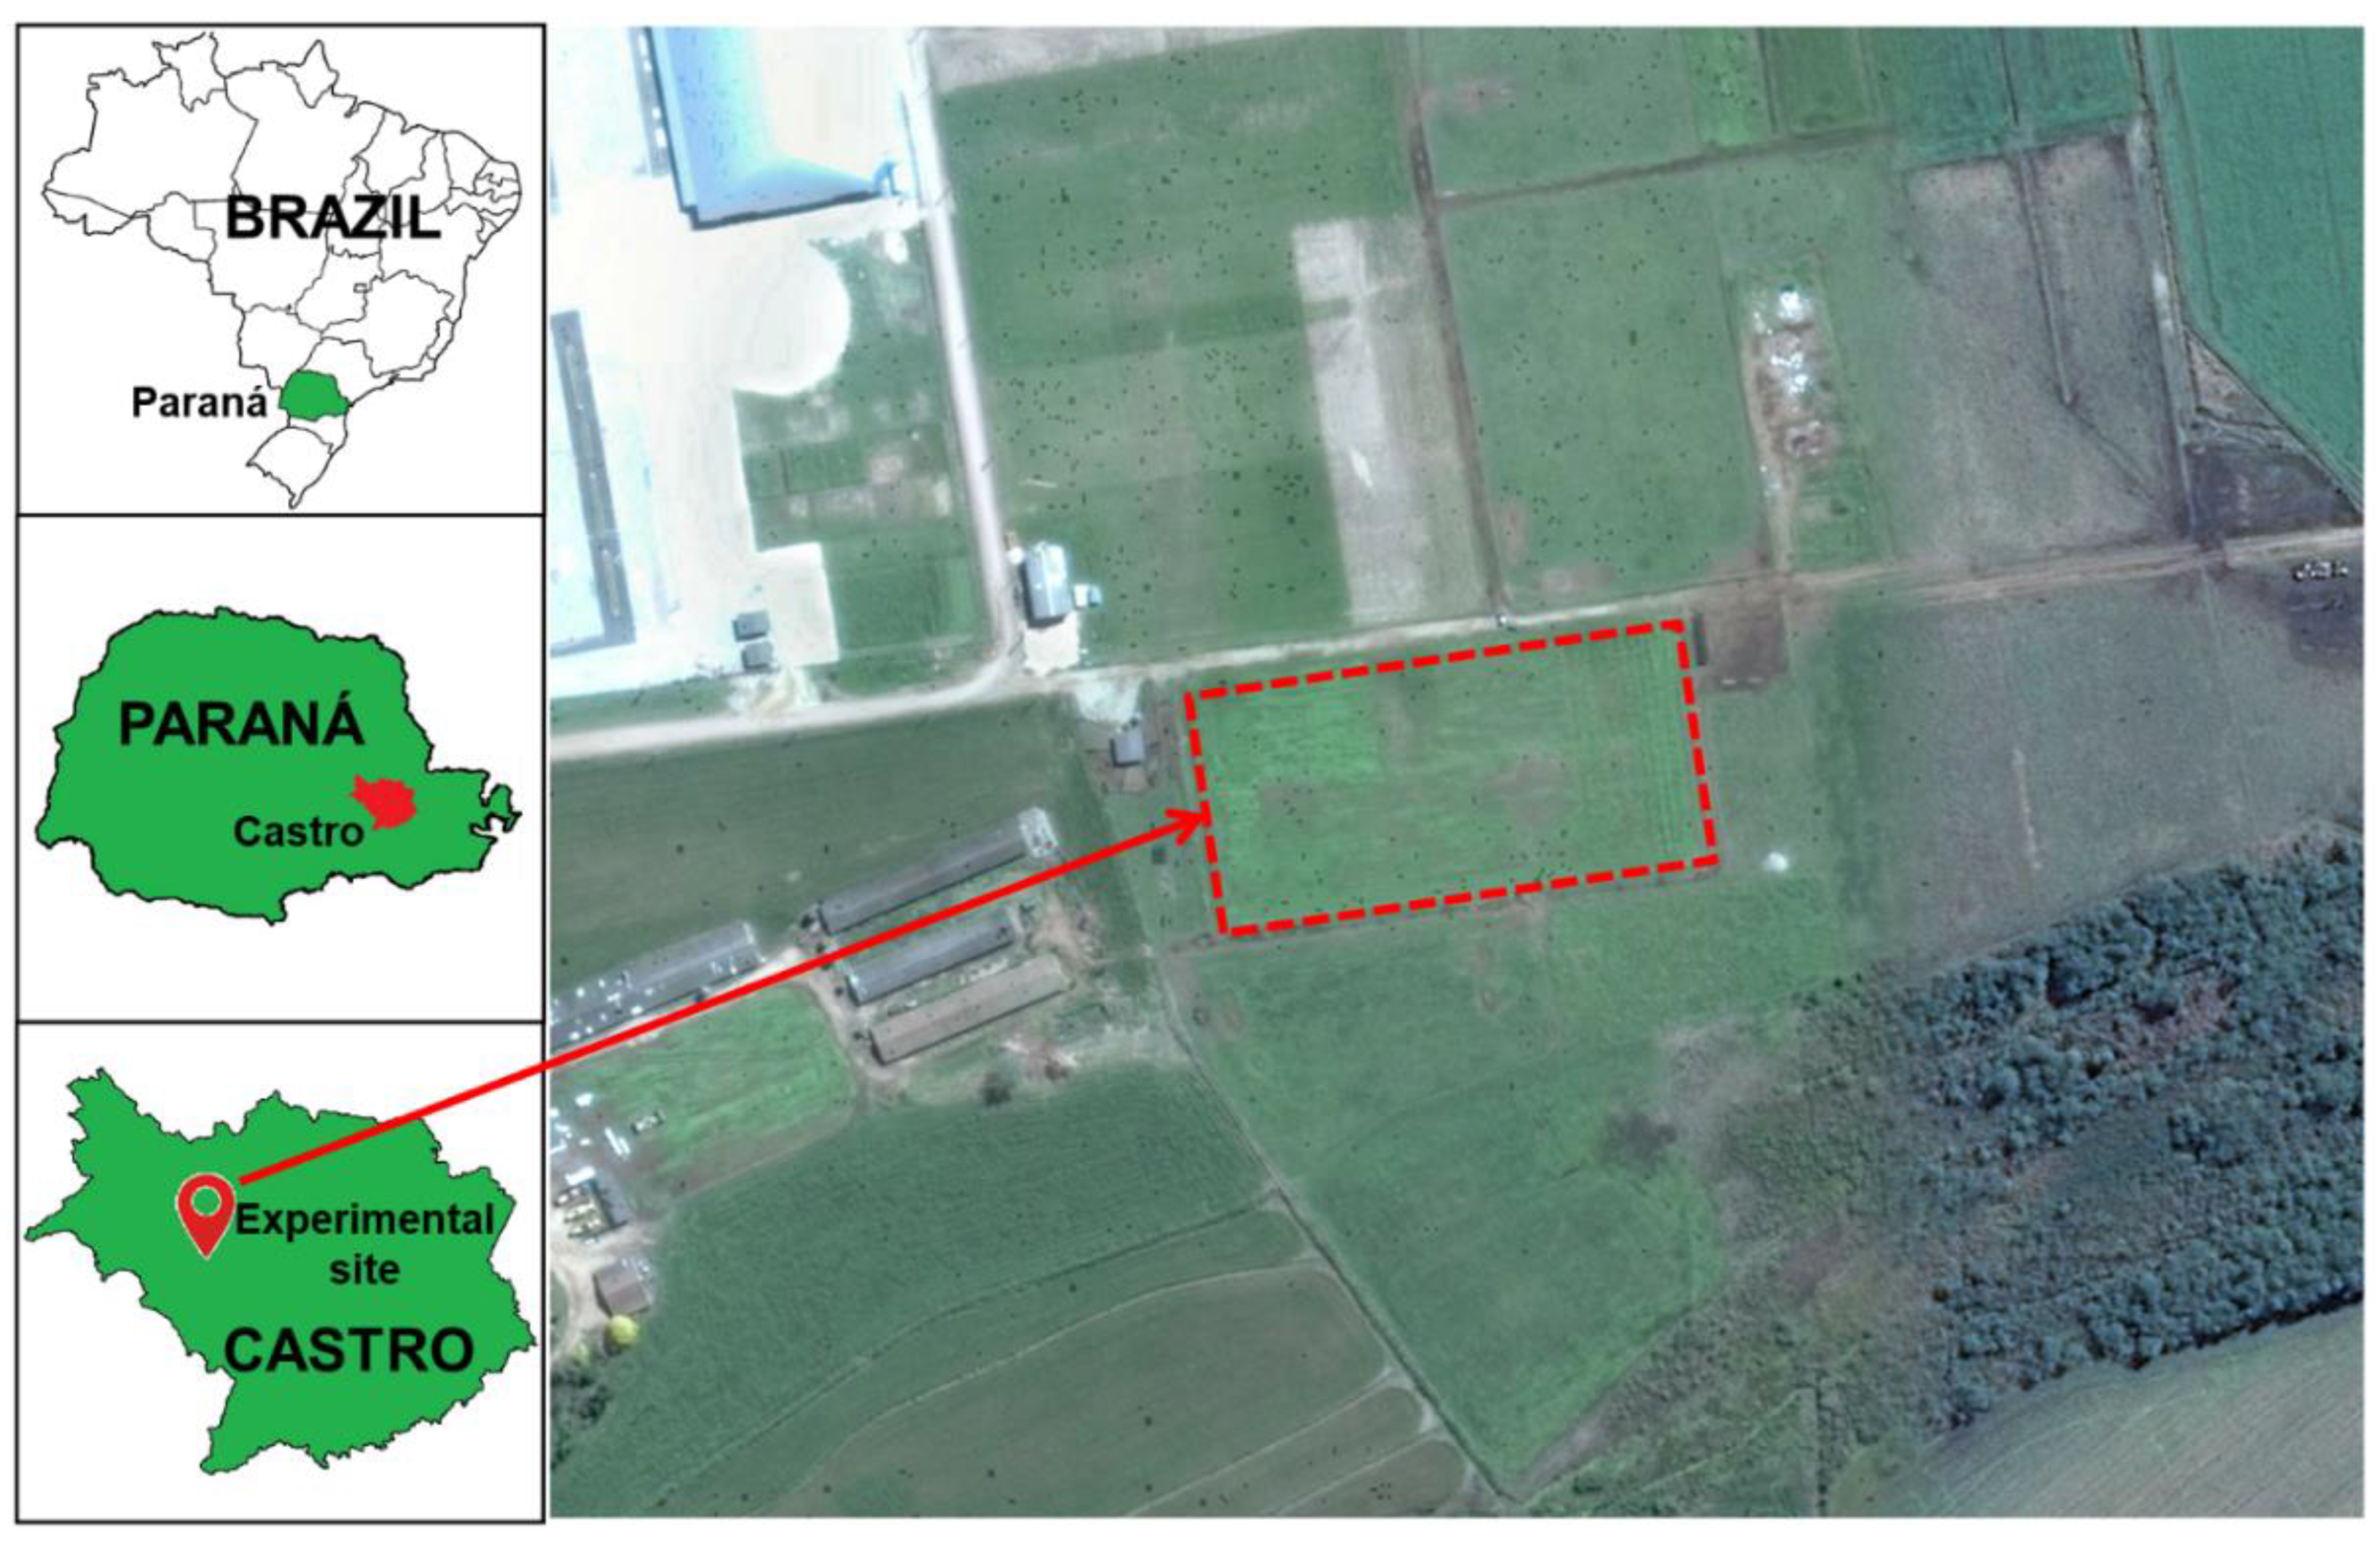
Figure 1. Location map of the study area. The region highlighted in red represents the experimental plot studied.
Preprints 107239 g001
Figure 2. Procedures for image analysis using X-ray tomography: a) selection of the region of interest (ROI) inside the scanned aggregate; b) ROI from the clipping procedure; c) application of the Median 3D filter; d) application of the Unsharp Mask tool; e) segmentation by Otsu method; f) noise removal.
Preprints 107239 g002
Figure 3. Flowchart containing the main steps carried out in our study to measure the morphological and geometric properties of the soil.
Preprints 107239 g003
Figure 4. Three-dimensional (3D) images – reconstructed by X-ray microtomography of the different soil management systems (Minimum tillage + ryegrass cover, MT(C); Minimum tillage + ryegrass silage, MT(S); No tillage + ryegrass cover, NT©; and No tillage + ryegrass silage, NT(S)).
Preprints 107239 g004
Figure 5. Morphological and geometric soil properties for the minimum tillage system (MT), no-tillage system (NT), and ryegrass uses (C: cover crop; S: silage). (a) Imaged porosity ( φ ), (b) Fractal dimension ( F D ), (c) Degree of anisotropy ( D A), and (d) Pore connectivity ( C ). Different letters indicate differences between treatments (p<0.05). Error bars indicate the standard deviation of the mean.
Preprints 107239 g005
Figure 6. Tortuosity ( Ʈ ) calculated based on 3D images for the minimum tillage system (MT), no-tillage system (NT) and ryegrass uses (C: cover; S: silage). (a) Tortuosity in the x direction ( Ʈ x ), (b) Tortuosity in the y direction ( Ʈ y ), (c) Tortuosity in the z direction ( Ʈ z ) and (d) Tortuosity ( Ʈ ) considering all directions. Different letters indicate differences between treatments (p<0.05). Error bars indicate the standard deviation of the mean.
Preprints 107239 g006aPreprints 107239 g006b
Figure 7. Contribution of volume (VP) and number of pores (NP) in relation to total volume for the different pore shapes (equant – spheroidal shape, prolate – rod-like shape, oblate – disk-like shape, and triaxial – ellipsoidal shape) for the following treatments: minimum tillage system (MT), no-tillage system (NT) and ryegrass uses (C: cover; S: silage). (a) pore volume (PV) and (b) pore number (NP). Different letters indicate differences between treatments (p<0.05). Error bars indicate the standard deviation of the mean.
Preprints 107239 g007
Table 1. Soil physical properties of the samples studied.
Physical properties Soil use practices
MT(C) MT(S) NT(C) NT(S)
Sand (g kg-¹) 354 349 342 348
Clay (g kg-¹) 420 430 415 445
Silt (g kg-¹) 226 221 243 207
BD (g cm-3) 1.13 (0.13) 1.22 (0.05) 1.25 (0.03) 1.22 (0.05)
TP (%) 0.54 (0.05) 0.52 (0.02) 0.51 (0.01) 0.52 (0.02)
MAC (%) 0.14 (0.07) 0.07 (0.05) 0.05 (0.01) 0.09 (0.03)
MIC (%) 0.40 (0.03) 0.45 (0.03) 0.46 (0.01) 0.43 (0.01)
OC (g kg-¹) 26.0 (2) 25 (2) 24 (2) 27 (3)
Sand, clay, and silt contents were measured using the densimeter method; BD: bulk density was measured using the volumetric ring method; TP: total porosity was measured by the difference between the soil bulk density and particle density.; MAC: macroporosity was measured by the difference between TP and microporosity; MIC: microporosity was measured considering the volume of water retained in the pressure head of 6 kPa; OC: organic carbon was measured using the method of oxidizing organic matter in an acidic medium with potassium dichromate (K2Cr2O7). Numbers between parentheses represent the standard deviation of the mean (n=5).
Table 2. Definition of the shape of soil pores based on the ratio between the main axes of ellipsoids: I A : intermediate axis; L A : large axis; S A : short axis.
Ellipsoid
axes
Shape
Equant Prolate Oblate Triaxial
I A / L A ≥0.65 <0.65 ≥0.65 <0.65
S A / I A ≥0.65 ≥0.65 <0.65 <0.65
Disclaimer/Publisher’s Note: The statements, opinions and data contained in all publications are solely those of the individual author(s) and contributor(s) and not of MDPI and/or the editor(s). MDPI and/or the editor(s) disclaim responsibility for any injury to people or property resulting from any ideas, methods, instructions or products referred to in the content.
Copyright: This open access article is published under a Creative Commons CC BY 4.0 license, which permit the free download, distribution, and reuse, provided that the author and preprint are cited in any reuse.
Prerpints.org logo

Preprints.org is a free preprint server supported by MDPI in Basel, Switzerland.

Subscribe

© 2024 MDPI (Basel, Switzerland) unless otherwise stated