1. Introduction
Vegetation is a very important element of urban space which performs many key functions, such as protection against air pollution, maintaining air humidity, mitigating extreme temperatures, reducing noise levels, and also creates a positive aesthetic impression [
1,
2,
3]. Research shows that having green areas nearby increases the level of satisfaction with living in a given area [
4]. Currently, over half of Poland’s population lives in cities, and forecasts indicate a further increase in the share of the urban population. Therefore, the issue of the presence and functioning of vegetation in urbanized areas is extremely important. Its size and diversity directly shape the aesthetics of cities [
5].
Despite the above-mentioned aspects a trend of reducing areas with high-quality greenery in urbanized areas is currently observed [
6,
7]. It turns out, however, that despite the inflated prices of space in cities, some local governments are more aware of the need to provide appropriate open space for public use [
8]. These areas should be covered with greenery and an appropriate greenery protection system should be implemented.
Nowadays it is futile to look for standardization in assessing the degree of greenness of cities within one country, let alone comparisons of cities in other countries. Moreover, there are several equivalent databases in Poland, differing both in terms of the classification of the greenery itself and the estimation of its area [
9].
An additional problem is the very fact of determining the method of measuring the size of greenery. According to the official repositories urban green areas are only those, which have a public functions such as parks, lawns and promenades [
10]. However, it turns out that this way of presenting the level of greenery in urban areas does not show the real situation since there are many areas with vegetation, which are not included, even though they perform very important functions. Those areas like greenery located in developed plots, industrial and post-industrial spaces [
11] along roads and watercourses can be taken as an example. Additionally, the official reports take various aspect when it came to the classification (e.g. function, majority land cover).
Specific areas, which are included in the official statistics, are measured by taking into consideration only the planar surface of them. The important fact is, that not only the area covered by vegetation should be taken into account, but its entire volume [
12]. The density and condition of vegetation in a given area should also be taken into account [
13]. Those data can be obtained from remote sensing sources getting data from low, medium and high altitudes. In addition, we have IT systems (Geographic Information System - GIS) enabling the management and use of spatial data for multiple studies and analyzes [
14].
Another aspect is the fact, that not only the size of greenery does matter in cities. Also theirs location and the ratio of its size to the number of city inhabitants play a big role. Łódź (51°36’25.79” N, 19°25’15.59” E) has one of the largest percentages of areas covered with vegetation in the total area of the city and their area per inhabitant in Poland [
15,
16]. Green areas per 1 person - almost 50 m² - which is an impressive figure, but it does not take into account the actual possibility of staying in areas covered with vegetation and is limited to characterizing it using only one indicator - the area occupied. For a city resident, an area of land occupied by tall, well developed trees that provide shade and significantly influence the aesthetics of the neighborhood means more than the same area consisting of low grass, meadows or shrubs.
In cities, we most often deal with uneven spatial distribution of inhabitants and greenery - population concentration in the city centers and greenery on the outskirts. A significant number of residents have dense buildings in their immediate surroundings, often without even the smallest patch of greenery. On the other hand, on the outskirts of cities there are often urban forests, which count towards the overall balance of green areas, but at the same time few people live there. Knowing the proportion of the population that has access to what green resources in their place of residence can say a lot about the conditions and quality of life in individual cities.
Many spectral indices are used to analyze vegetation, among which the NDVI is the most popular [
17,
18]. It is used to analyze both aerial photos and satellite images, to assess the size of plant biomass - at various spatial scales - from single fields to global vegetation zones [
19], to recognize vegetation [
20] and its condition [
21,
22], analysis the size of the projection area of leaves LAI - Leaf Area Index [
23], the amount of radiation absorbed by plants in the process of photosynthesis [
24], biomass [
25] and many others.
An important feature of NDVI is its relationship with the “quantity” and “quality” of greenery present in a given area [
26]. If the image pixel includes various objects (e.g. buildings, roadways with asphalt or concrete surfaces, tree crowns, gardens and lawns), then the NDVI is the resultant of the NDVI coefficients of individual objects, weighted by their share in the pixel area [
27].
The topic of urban greenery inventory based on data from airborne laser scanning (ALS) and digital aerial photos has been discussed many times in scientific studies. In our research, we focus on projects carried out mainly in Poland, as they relate to our natural conditions. An example of conducting an inventory of greenery was the research made in Wrocław, where authors collected and processed, among others, aerial digital photos (10 cm resolution) and aerial laser scanning data (density 15 points m
-²) [
28]. They used these data to prepare a Digital Terrain Model (DTM), a Digital Surface Model (DSM), a normalized Digital Surface Model (nDSM) and the so-called true orthophotomap. The final classification was obtained by applying a filter of the minimum value of the Normalized Differential Vegetation Index (NDVI) ≥ 0.1 calculated from the pixels of the infrared orthophotomap (CIR - Color InfraRed), and then integrating the resulting areas with the spatially corresponding height data. Based on the obtained results the authors were able to classify urban greenery into three height classes, which has better interpretative values than studies limited only to the analysis of its surface.
A similar approach to the classification of two different types of urban objects – buildings and vegetation – was adopted by Grigillo and Kanjir [
29]. They used digital aerial photography and laser scanning data and produced DSM using ALS data. They used multispectral photogrammetric images to obtain DTM. The second element was the automatic extraction of vegetation using object-oriented analysis, which they performed on orthoimages with three spectral channels - infrared, red and green, with an added fourth channel - the nDSM layer. Carefully selected segmentation parameters made it possible to isolate objects classified as “visible vegetation” or “shaded” areas using the NDVI index. Then, the segmentation procedure was repeated separately for the shaded zones to isolate the vegetation hidden there. The combined urban vegetation elements were further divided into high and low vegetation (above and below 1 m) based on the height attribute read from nDSM.
Myeong et al. [
30] also used high-resolution digital infrared images and divided urban space into trees and shrubs, lawns, bare soil, water and impervious surfaces. Here, too, the challenge for the authors were the shaded areas, but also the large spectral similarities between the distinguished classes. Only repeated attempts at selecting and applying textures, masks and majority filters allowed the classification accuracy to be increased.
Krukowski et al. [
31] used high-resolution IKONOS 2 satellite images with a level of detail allowing for the precise allocation of individual pixels to land cover classes. They decided to distinguish two classes of urban greenery: high and low. The first step was to adopt an NDVI > 0.2 threshold for separating vegetation. Then, training fields for the two previously mentioned classes were determined and a supervised classification of areas covered with vegetation was performed. Taking into account the higher values of the indicator for tall vegetation observed after field verification of the resulting fields, the authors used an additional discriminatory threshold of NDVI = 0.35. The two classes of vegetation obtained in this way - high and low - were the final result of the categorization.
The original concept of using NDVI to assess the availability of vegetation in cities was presented by Będkowski and Bielecki [
32]. They used this indicator as a measure of the size of vegetation resources and determined, using the Lorenz concentration curve, the accessibility to them for the inhabitants of Łódź. They stated that due to the uneven distribution of population and vegetation, access is very difficult, which is reflected in the fact that almost 80% of residents have only about 25% of urban vegetation resources in their places of residence.
The authors of works on forest areas [
33,
34] unanimously point out that while monitoring vegetation in terms of surface cover or their biophysical condition is undertaken in many different ways, remote research on processes and characteristics of forest stands is still a challenge. However, geomatic techniques are increasingly replacing traditionally used terrestrial methods.
The Greenness Index (GI) or simply Green Index has been defined many times in literature. Shekhar and Kumar calculated it based on NDVI value were a positive value was taken as a green class and a negative as non-green class. Then a grid layer (20m × 20m) was overlaid on binary image of NDVI and the percentage of the area where NDVI > 0 was calculated [
35]. Yang et. al. defined a Green Index for the whole city based on manual classification of low altitude images [
36]. Abudaleb and others has calculated Greenness Index as the percentage of each study region’s area divided by the area of the green classes was used to generate the greenness index. The area coverage for every land cover class was acquired subsequent to the Random Forest image classification which is based on machine learning algorithm [
37].
The aim of the work is therefore to develop measures that enable a clear presentation, both qualitatively and quantitatively, of the amount of greenery in a large city (over 100 km2) and, consequently, to demonstrate its spatial diversity and prioritize places regarding potential investments in greenery, taking into account the uneven distribution of population.
3. Indices
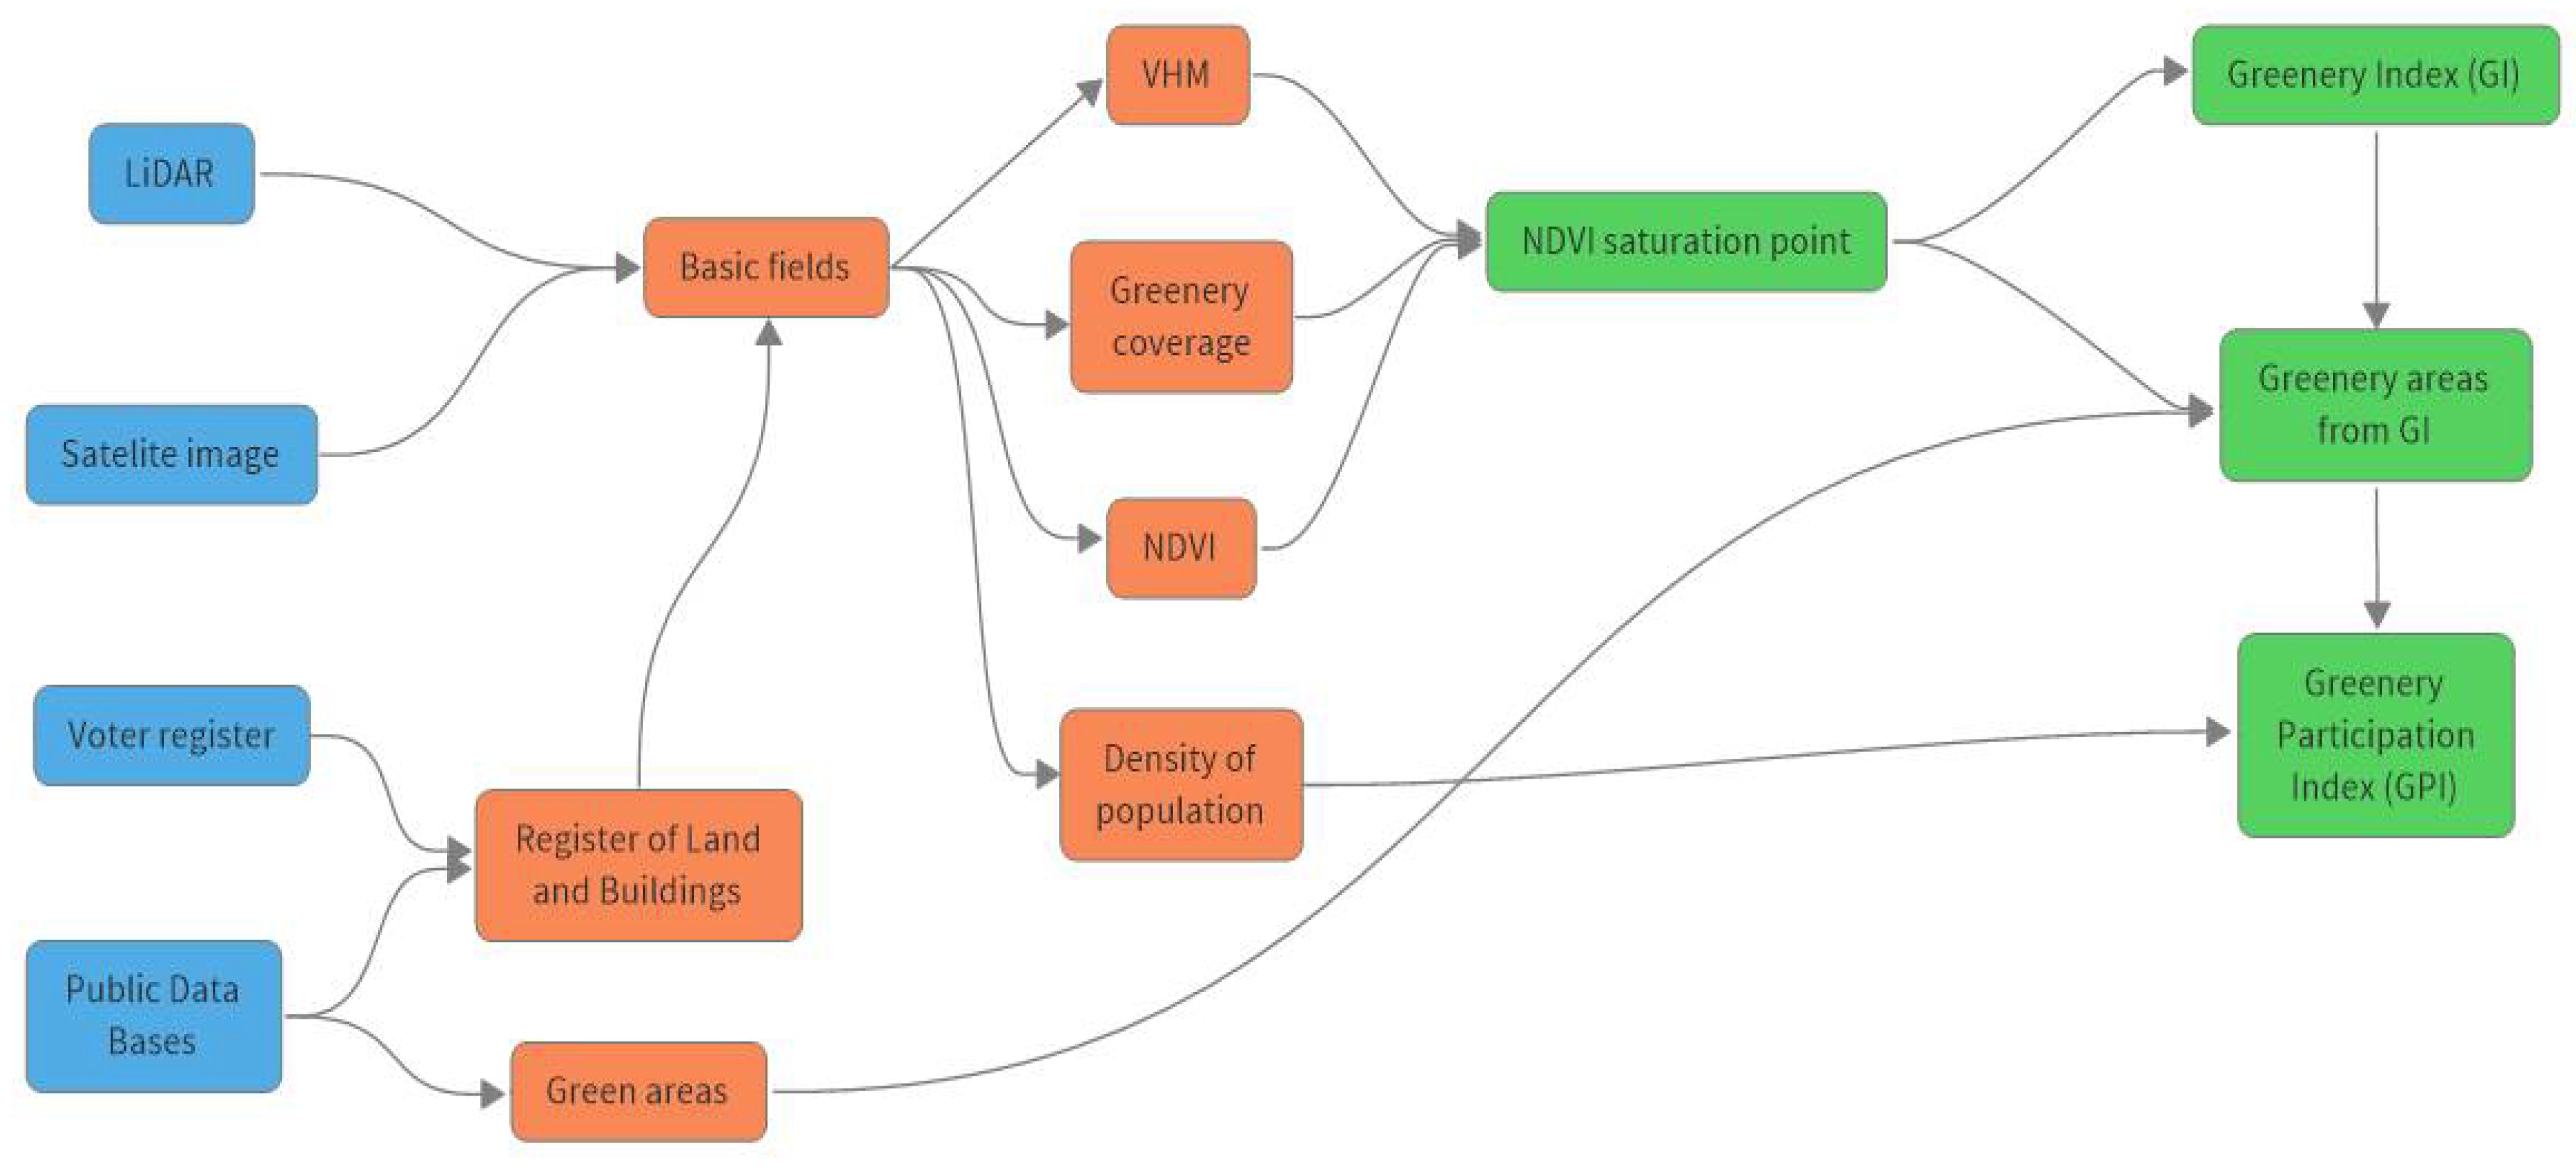
To determine the amount of greenery resources available in the place of residence, we have developed three indicators: Greenness Index (GI), Greenery deficiency index (GDI) and Greenery Participation Index (GPI). In the following, we present the basic assumptions for the construction of these indicators. The starting point for their determination is the Normalized Difference Vegetation Index, NDVI, commonly used in remote sensing [
17,
46]:
,
RED – Red band.
The NDVI value for individual land cover forms depends on their spectral properties, i.e. their ability to reflect, absorb and transmit incoming electromagnetic radiation from these ranges [
47]. In the case of vegetation, a simple model of the relationship between radiation and the vegetation layer can be presented in
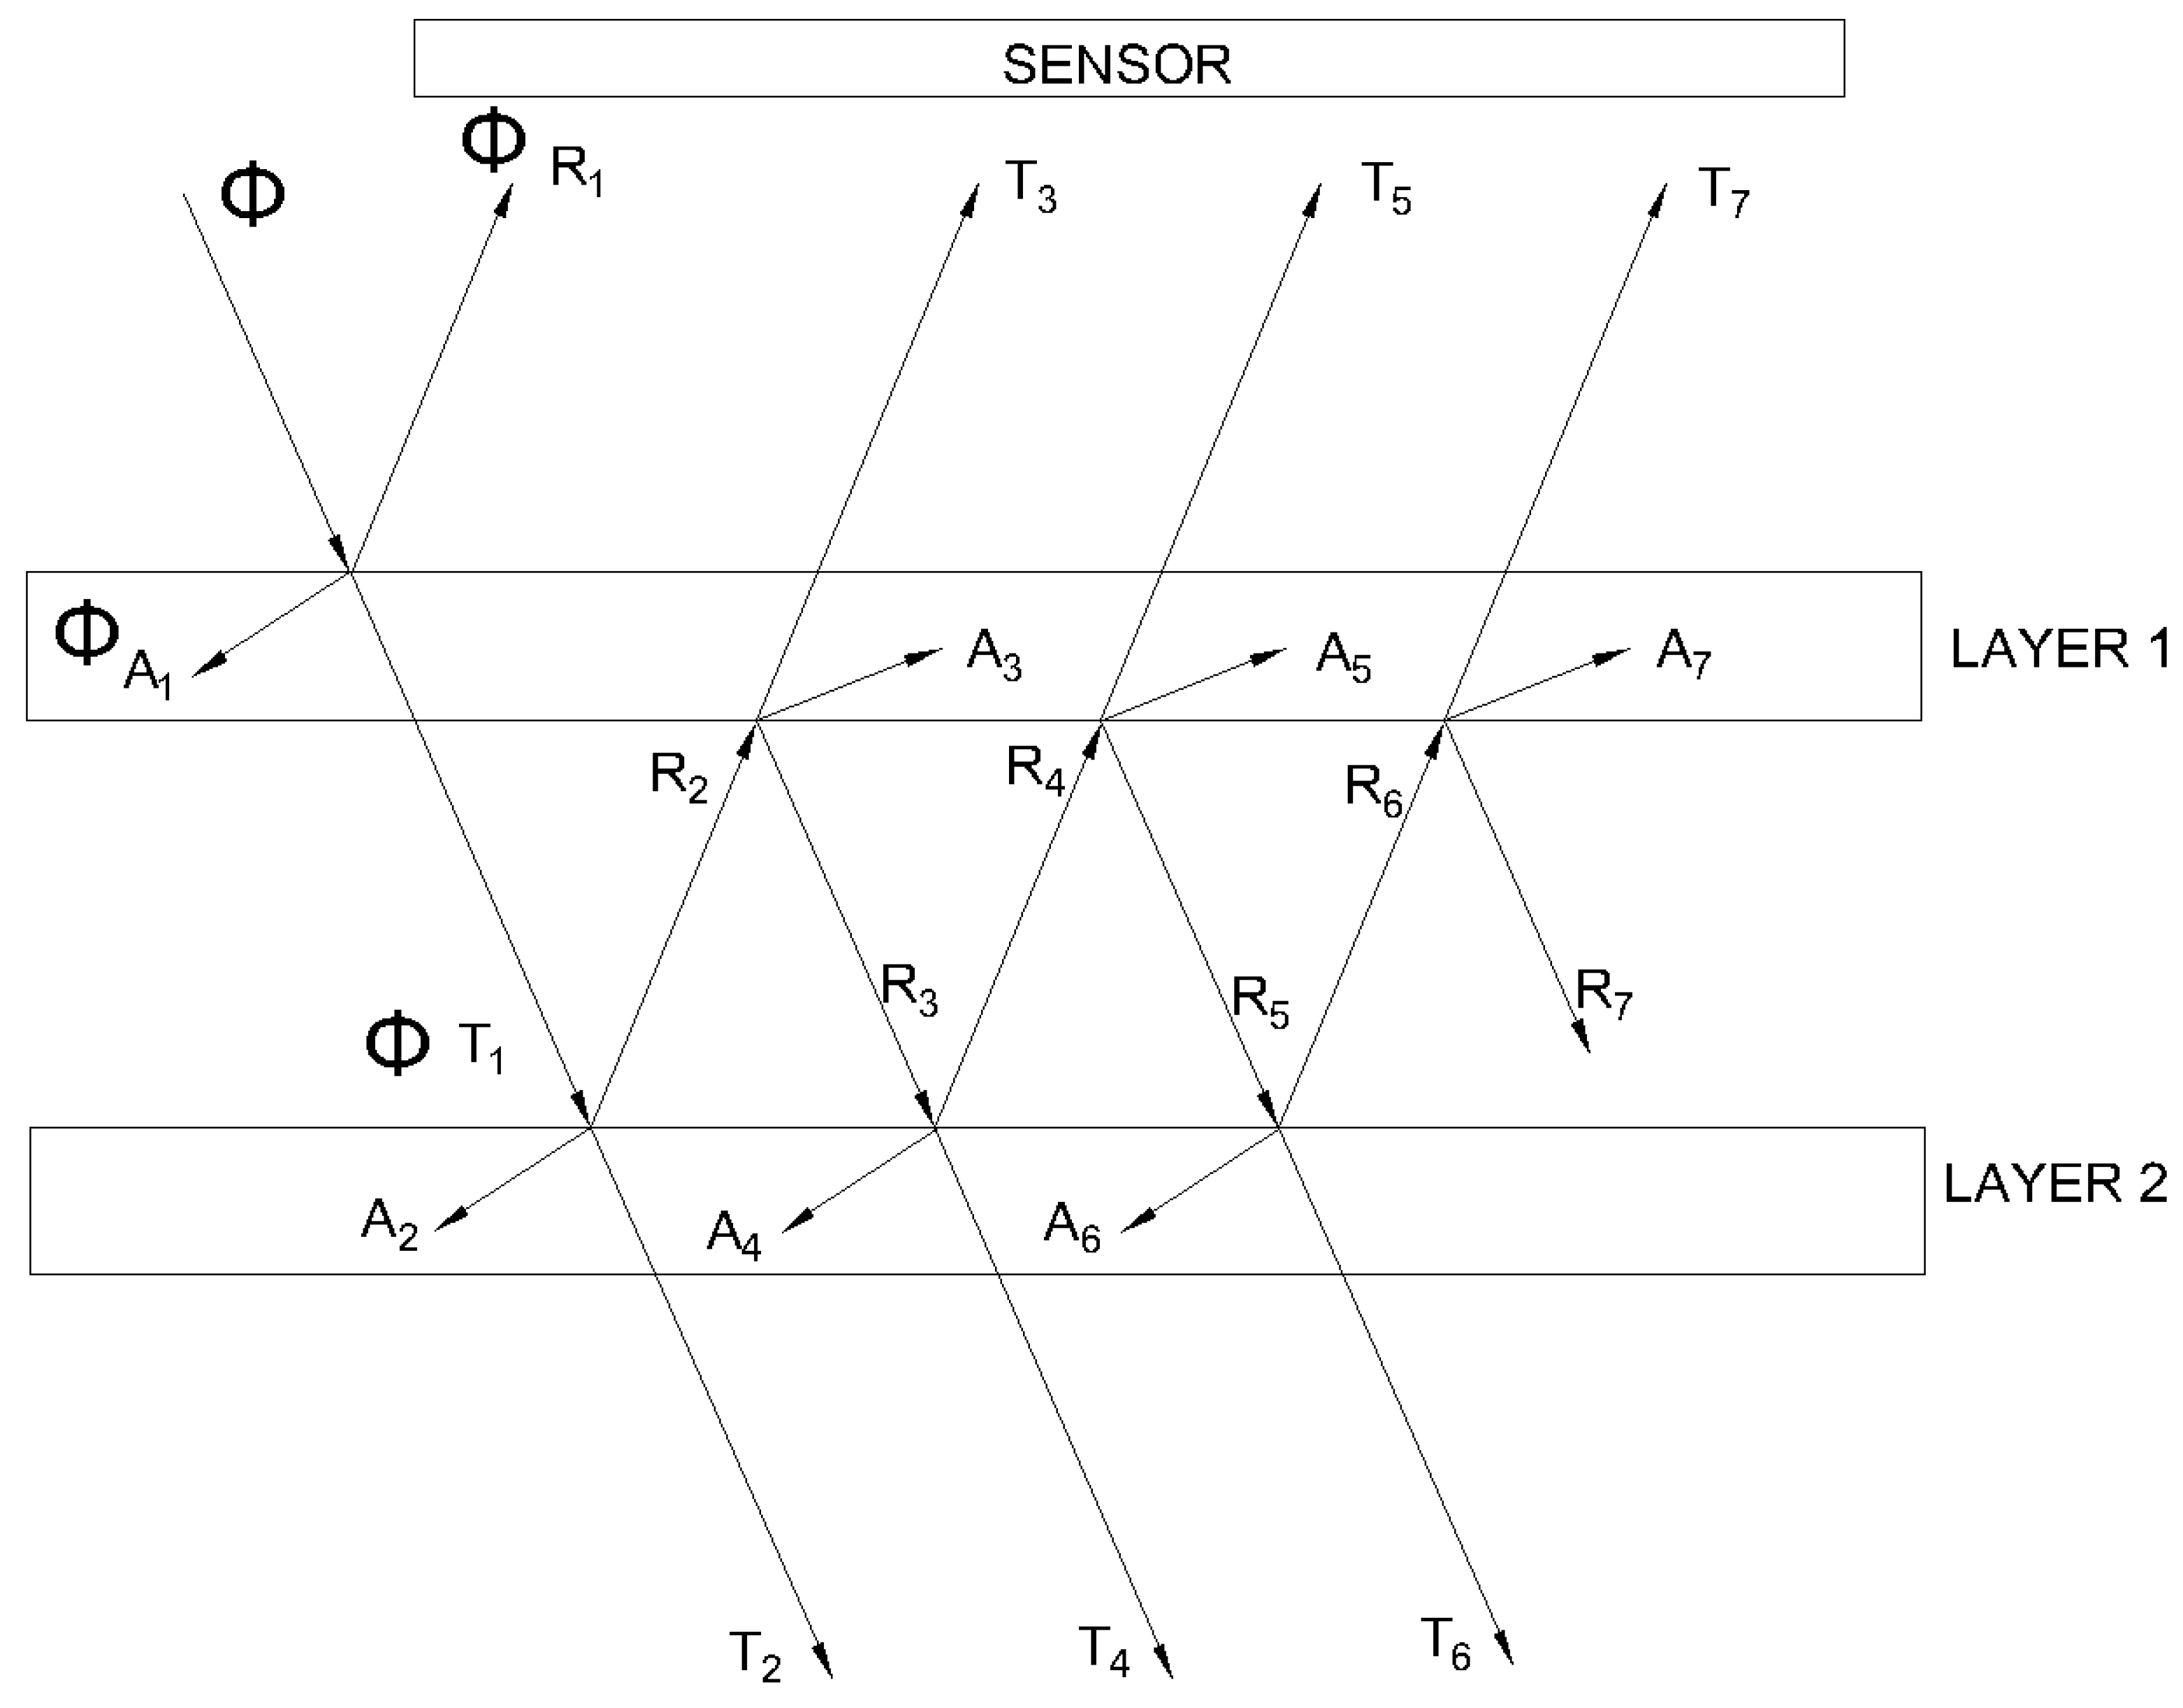
Figure 1: the incoming light flux Φ is initially divided into three fluxes Φ
Ri, Φ
Ai, Φ
Ti, (
i = 1). The mutual relations of these streams depend on the properties of the green layer, and note that their normalized values φ
ri= Φ
Ri/(Φ
Ri+Φ
Ai+Φ
Ti), φ
ai= Φ
Ai/( Φ
Ri+Φ
Ai+Φ
Ti), φ
ti= Φ
Ti/( Φ
Ri+Φ
Ai+Φ
Ti) satisfy the condition φ
ri+φ
ai+φ
ti = 1.
Any increase in the thickness of the vegetation layer can be considered as the addition of subsequent layers (layer 2 in
Figure 5). In fact, this is so, because basic research has shown that vegetation has a multi-layered structure, which is expressed by the well-known LAI index used in remote sensing [
47,
48]:
where:
FA – total foliage area,
TA – the projection area of the tree crown on the horizontal plane (terrain).
The LAI index reaches a value of up to 19, and the typical range for forests ranges from 6 to 8 on average, and for cereal crops from 2 to 4 [
26].
Increasing the thickness of the plant layer, i.e. the number of layers, will cause the course of radiation fluxes to change: the transmitted flux ΦT1 is now the flux incident on the second layer of vegetation and can be divided into fluxes of reflected radiation (ΦR2), absorbed (ΦA2) or penetrating further radiation (ΦT2). Let us also note that the radiation reflected from the lower layer (ΦR2 flux) now encounters the upper layer, where it is again divided into reflected (ΦR3), absorbed (ΦA3) and transmitted (ΦT3) radiation streams. This process takes place many times between both layers, as a result of which a sensor placed above the vegetation can register the resulting sum of radiation from several streams: ΦR1+ΦT3+ΦT5+ΦT7+…
If we assume that the vegetation block is composed of a larger number of layers, then the presented model will become somewhat complicated and the streams considered here are fractional parts of other streams, and a significant part of the radiation remains as if ‘trapped’ in the vegetation layer. For example, assuming constant values φ
r = 0.5, φ
a = 0.25 and φ
t = 0.25, we will obtain the following values of fluxes reaching the sensor for the model presented in
Figure 5:
ΦR1=0.5Φ
ΦT3=(0.25×0.5×0.25) Φ =0.0313 Φ
ΦT5=(0.25×0.5×0.5×0.5×0.25) Φ =0.0078 Φ
ΦT7=(0.25×0.5×0.5×0.5×0.5×0.5×0.25) Φ =0.0020 Φ
Therefore, mainly reflected radiation ΦR1 reaches the sensor, the remaining fluxes constitute a small part of the received radiation. It is easy to see that the total radiation flux ΦR1+ΦT3+ΦT5+ΦT7+… reaching the sensor is not directly proportional to the number of layers. Moreover, the proportions of reflected, absorbed and transmitted radiation vary depending on the wavelength of light.
The presented model may be a partial explanation for the phenomenon of saturation of the NDVI index, which means that the NDVI index calculated on the basis of satellite images increases slightly or even does not increase when the appropriate thickness of the green layer is achieved [
49,
50].
3.1. Greenness Index
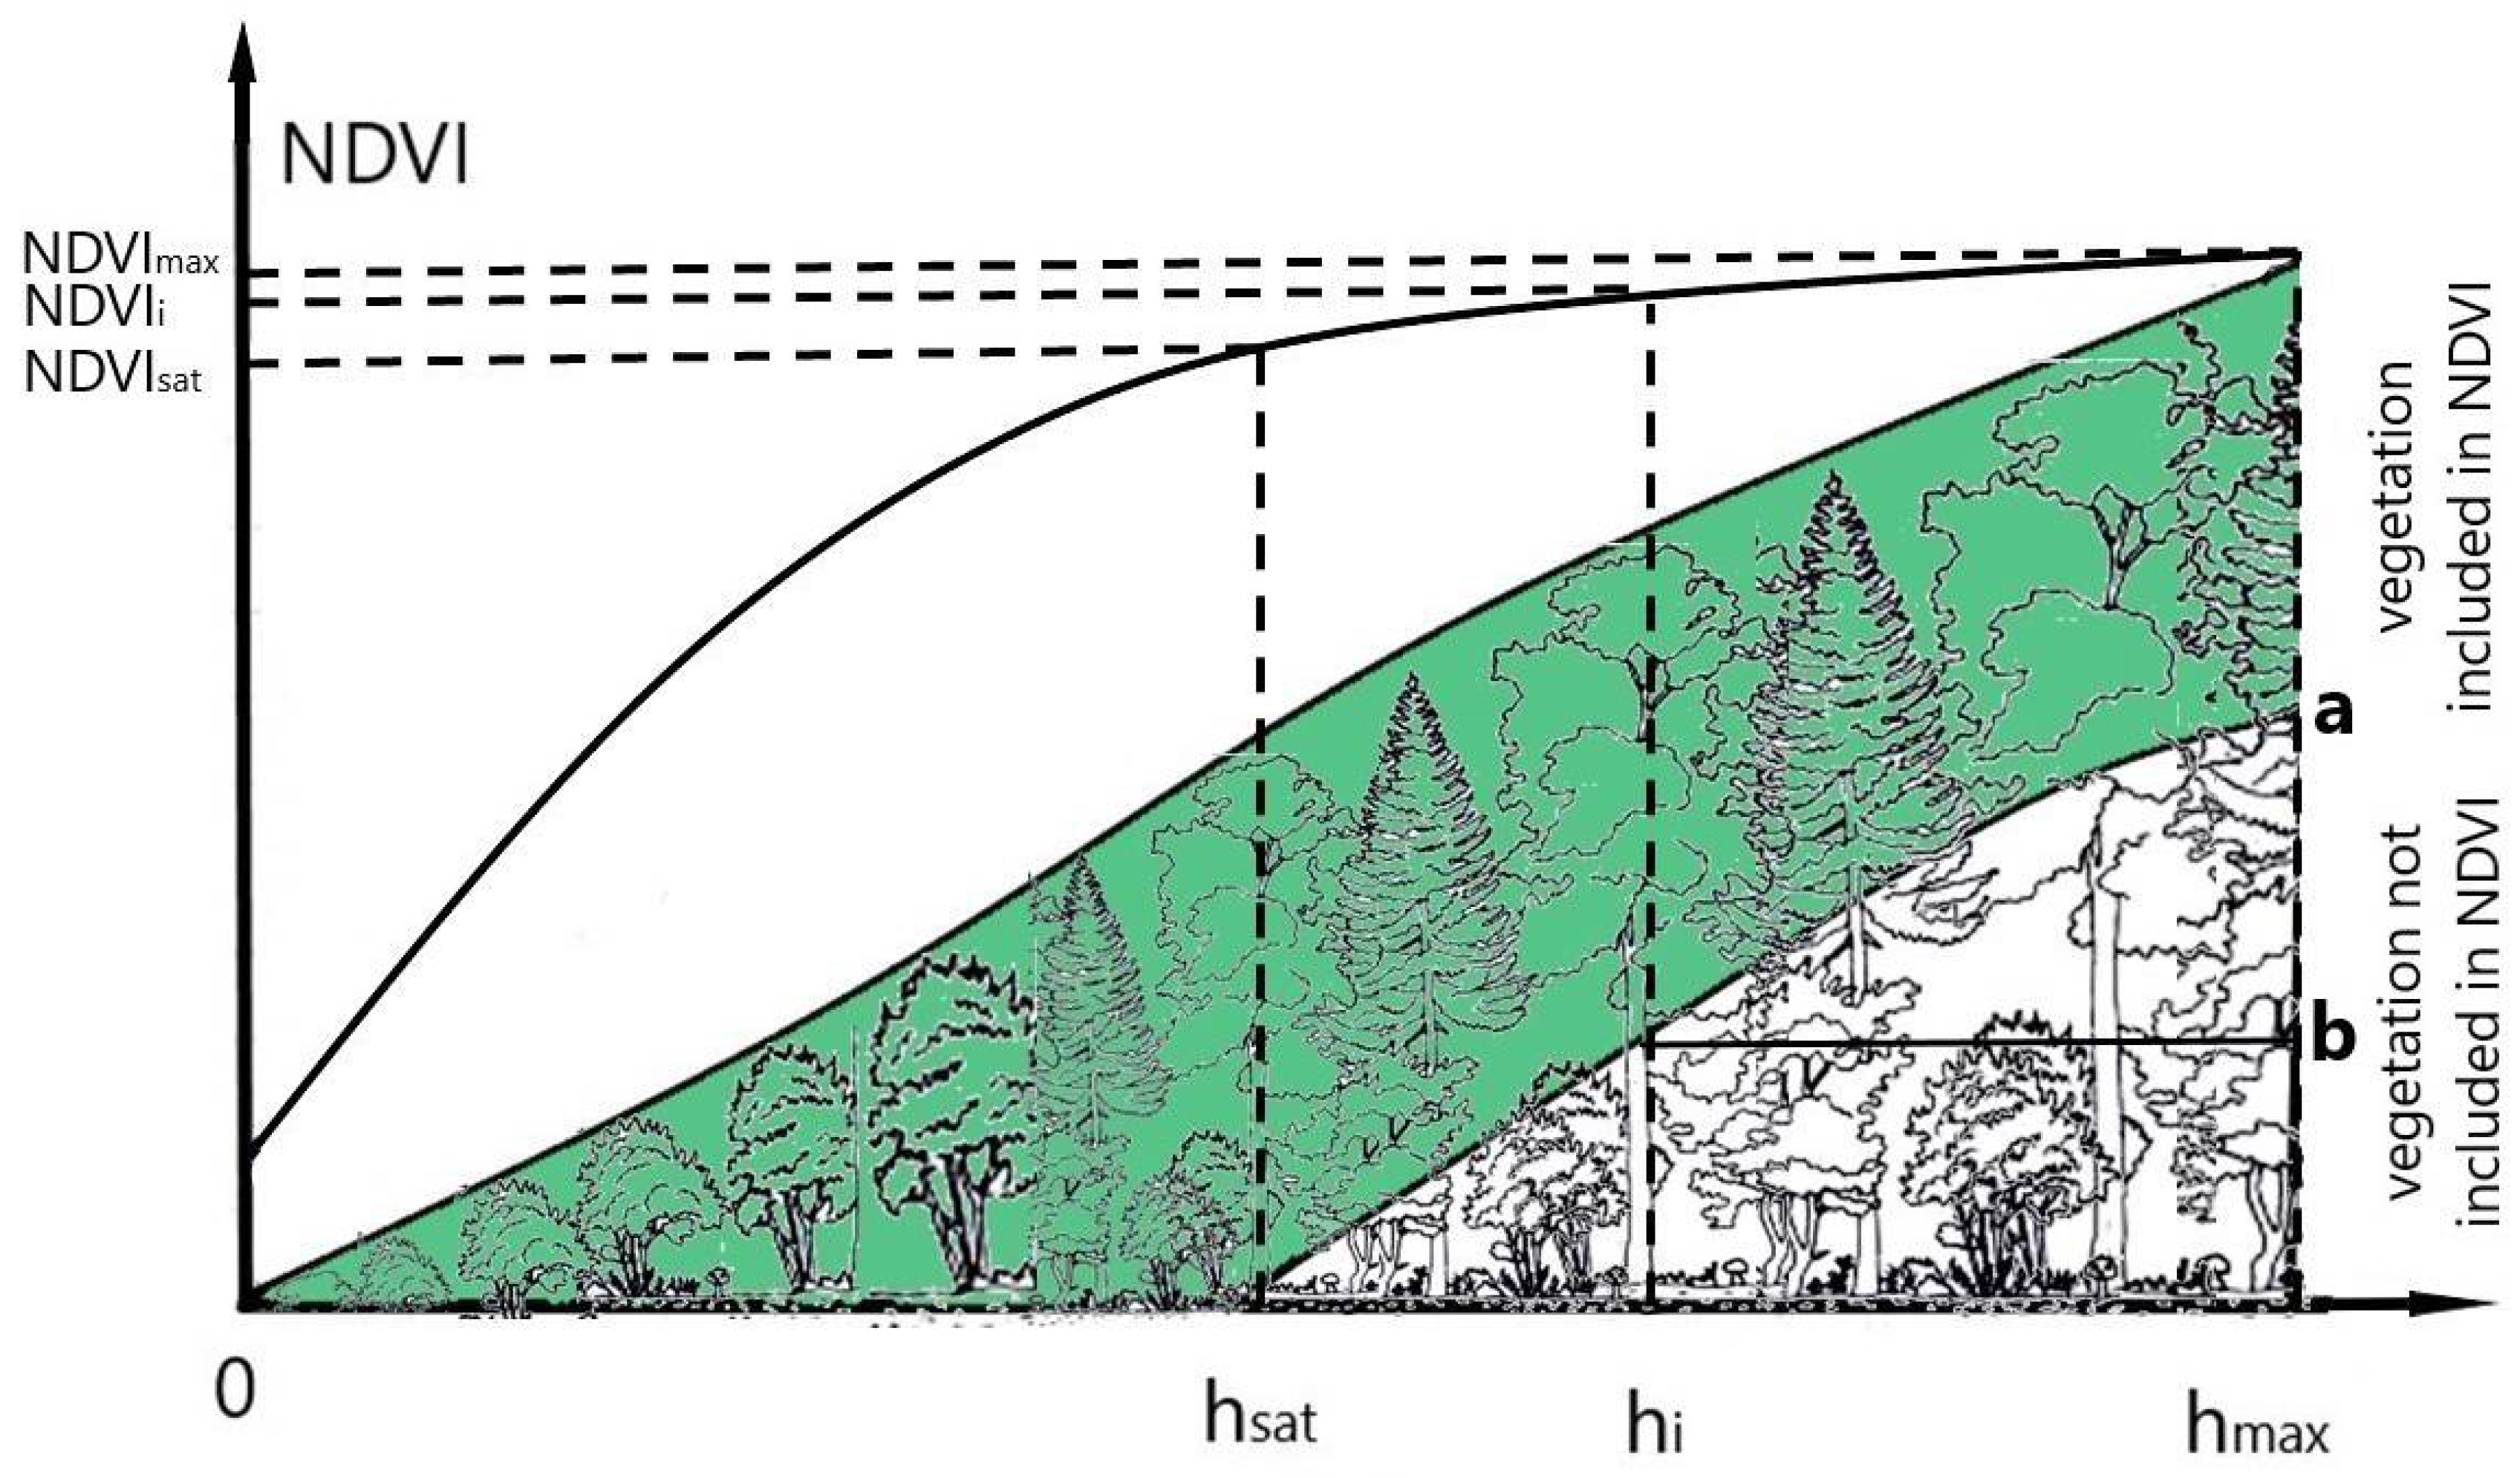
The purpose of our proposed Greenness Index is to express the amount of greenery resources in the analyzed basic fields. When constructing it, we gave special importance to the NDVI saturation point. We assumed that up to this point, the indicator of the amount of greenery is the NDVI value itself, and after exceeding NDVIsat, the measure of the amount of greenery is the thickness of the vegetation layer.
The mathematical notation of the greenness index is as follows:
- height of vegetation in the i-th basic field
- average height of the crown base
- value for the saturation point
- height of the highest greenery (trees) in the given area (in the city)
- NDVI value in the i-th basic field
- NDVI value for the saturation point
Due to the fact that the
values in the above formula reduce, formula 4 can be simplified to the following form:
Thanks to this structure, the Greenness Index can reach a value of 0 ≤
GI ≤ 1, with
GI = 0.5 at the saturation point. The importance of individual components of equation (4) depends on the height of the greenery. For areas with low green height values, the value of the NDVI index is crucial, but as the green height increases, the average green height based on Vegetation Height Model [
51] becomes more and more important, and NDVI becomes less important (in accordance with the description of the problem of saturating the NDVI value).
As a result of limiting the flow of light energy to the zones under the tree crowns, resulting from the screening properties of the layer of the assimilation apparatus contained mainly in the crown layer, a zone without active greenery is formed under the trees (
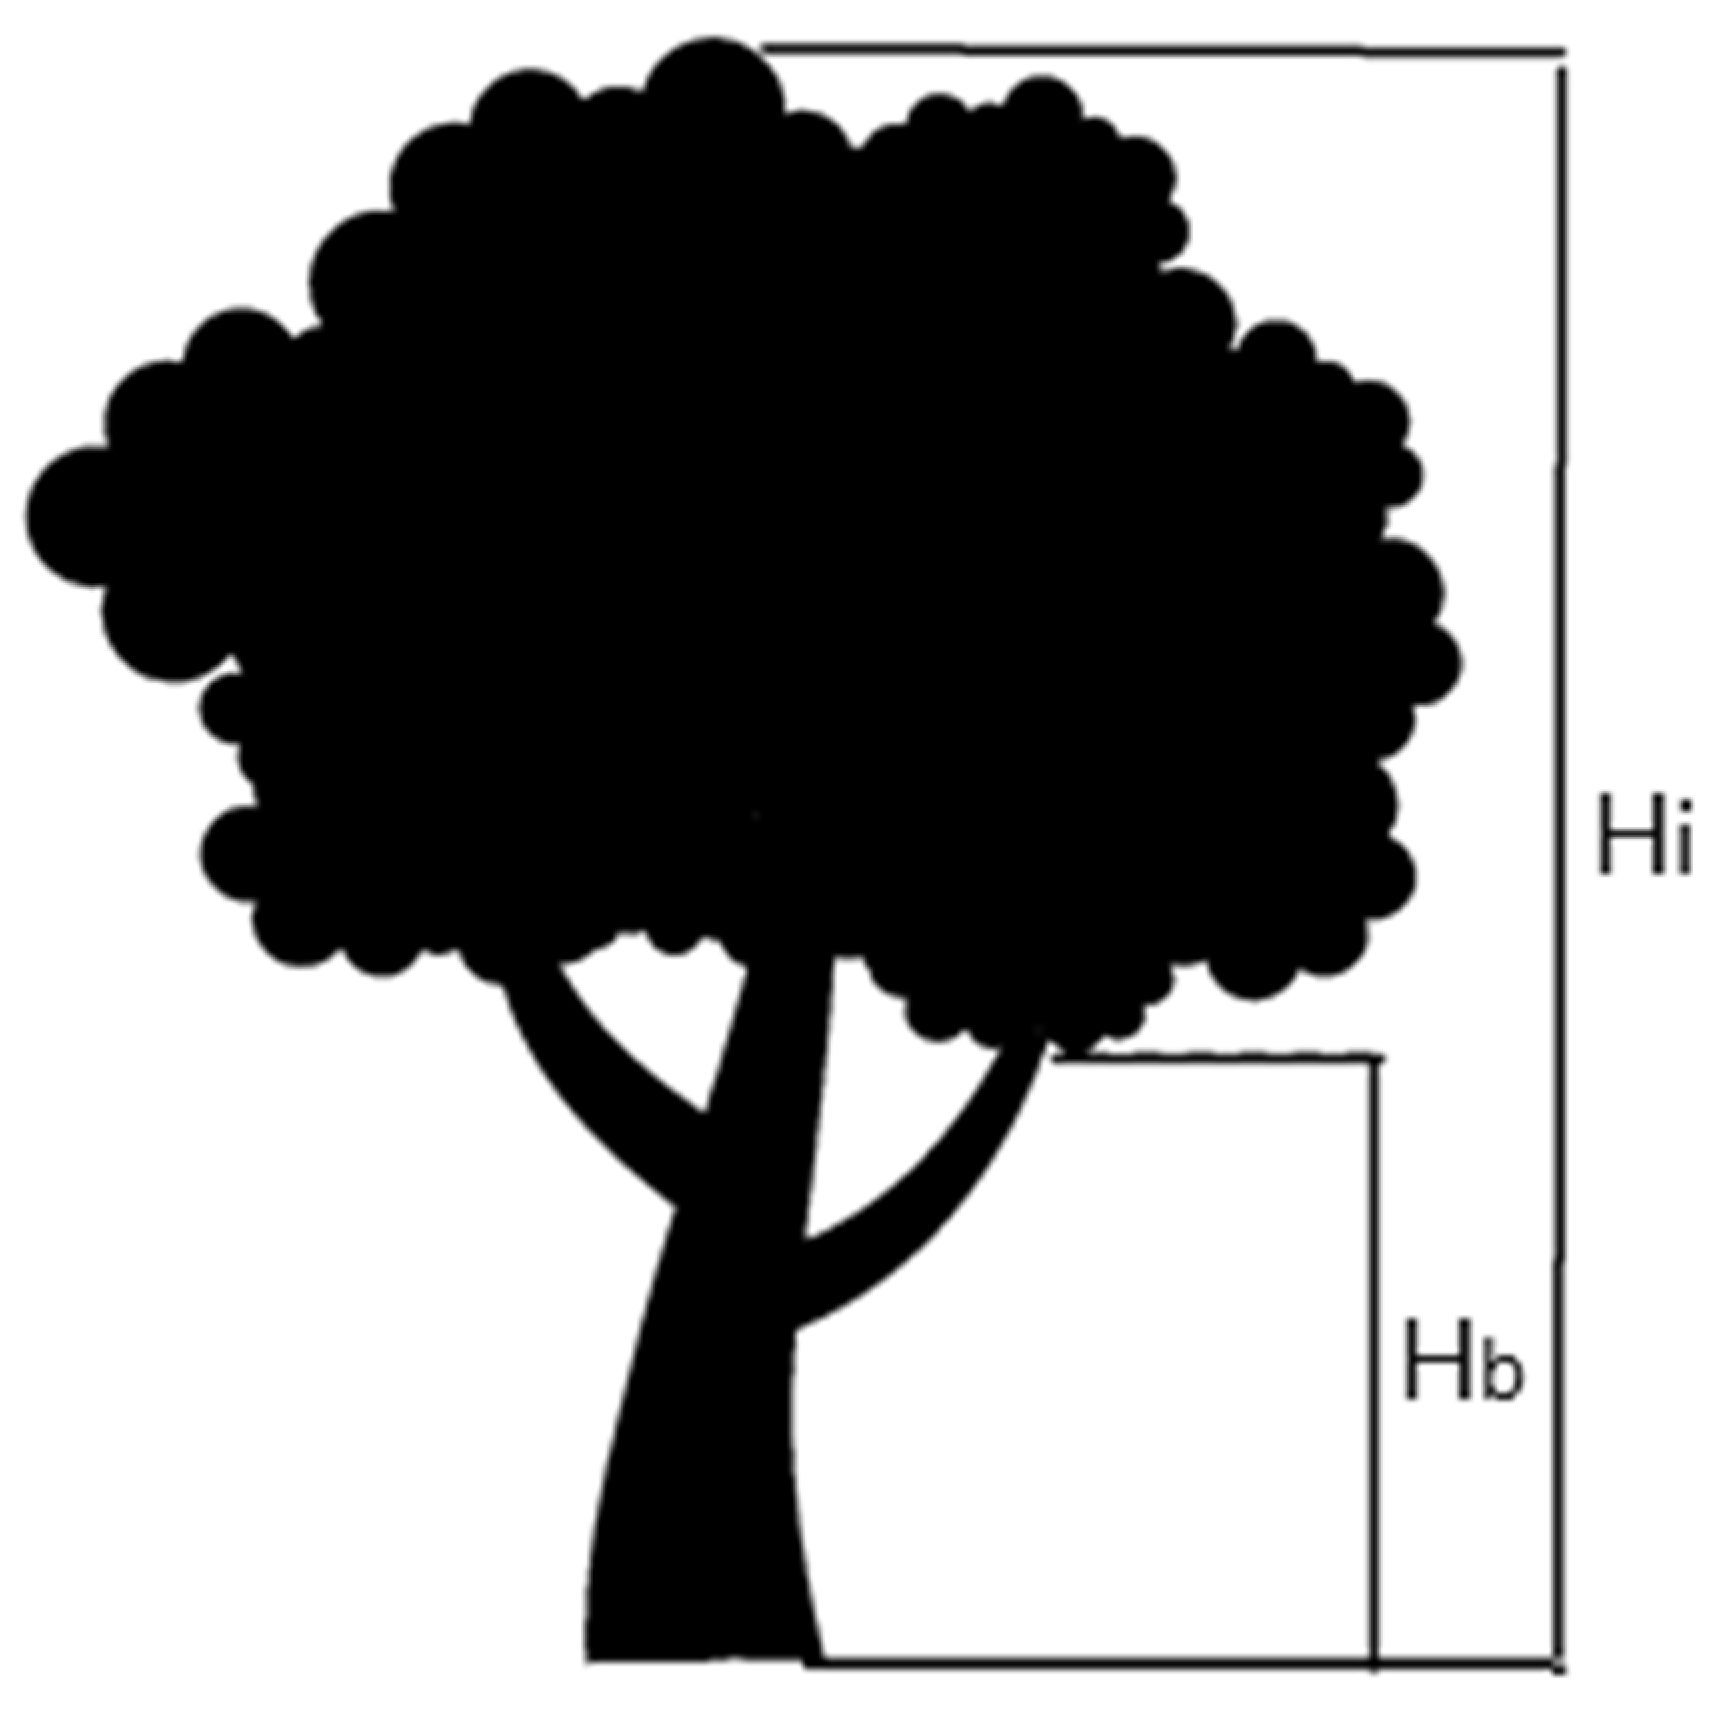
Figure 6), which does not participate in the regulation of light fluxes (apart from its reflection) from a few branches or trunks and thus does not significantly affect the NDVI value. It turns out that the height of vegetation above the NDVI saturation point does not indicate the actual height of assimilating greenery, so only the length of the tree crown should be taken into account.
The phenomenon of dying tree branches due to lack of adequate light is well known for tree communities forming stands in forest areas [
52]. Unfortunately, we did not have the appropriate dimensions for urban conditions, so we proposed a certain simplification, consisting in assuming the height of the crown base as the height to which urban trees are de-branched in order to ensure visibility and the possibility of pedestrian and mechanized communication. Thus, the value of the green height
hi determined from VHM should be reduced by the average height of the crown base
hb. This value was determined on the basis of measurements of 237 trees located in the area of 69 street intersections. These intersections, in turn, were selected from all 1,418 road intersections of the following classes: main, local and collector roads in Łódź. 336 of them had exactly 4 outlets. In the next step 20% of the places where the field inventory was carried out were randomly selected. On streets leading to intersections, at least one tree closest to the intersection was selected. It should also be noted that the value of 0 was assumed for negative NDVI values. In this case we didn’t take this value into consideration since the value because this value would be reduced when calculated in the formula.
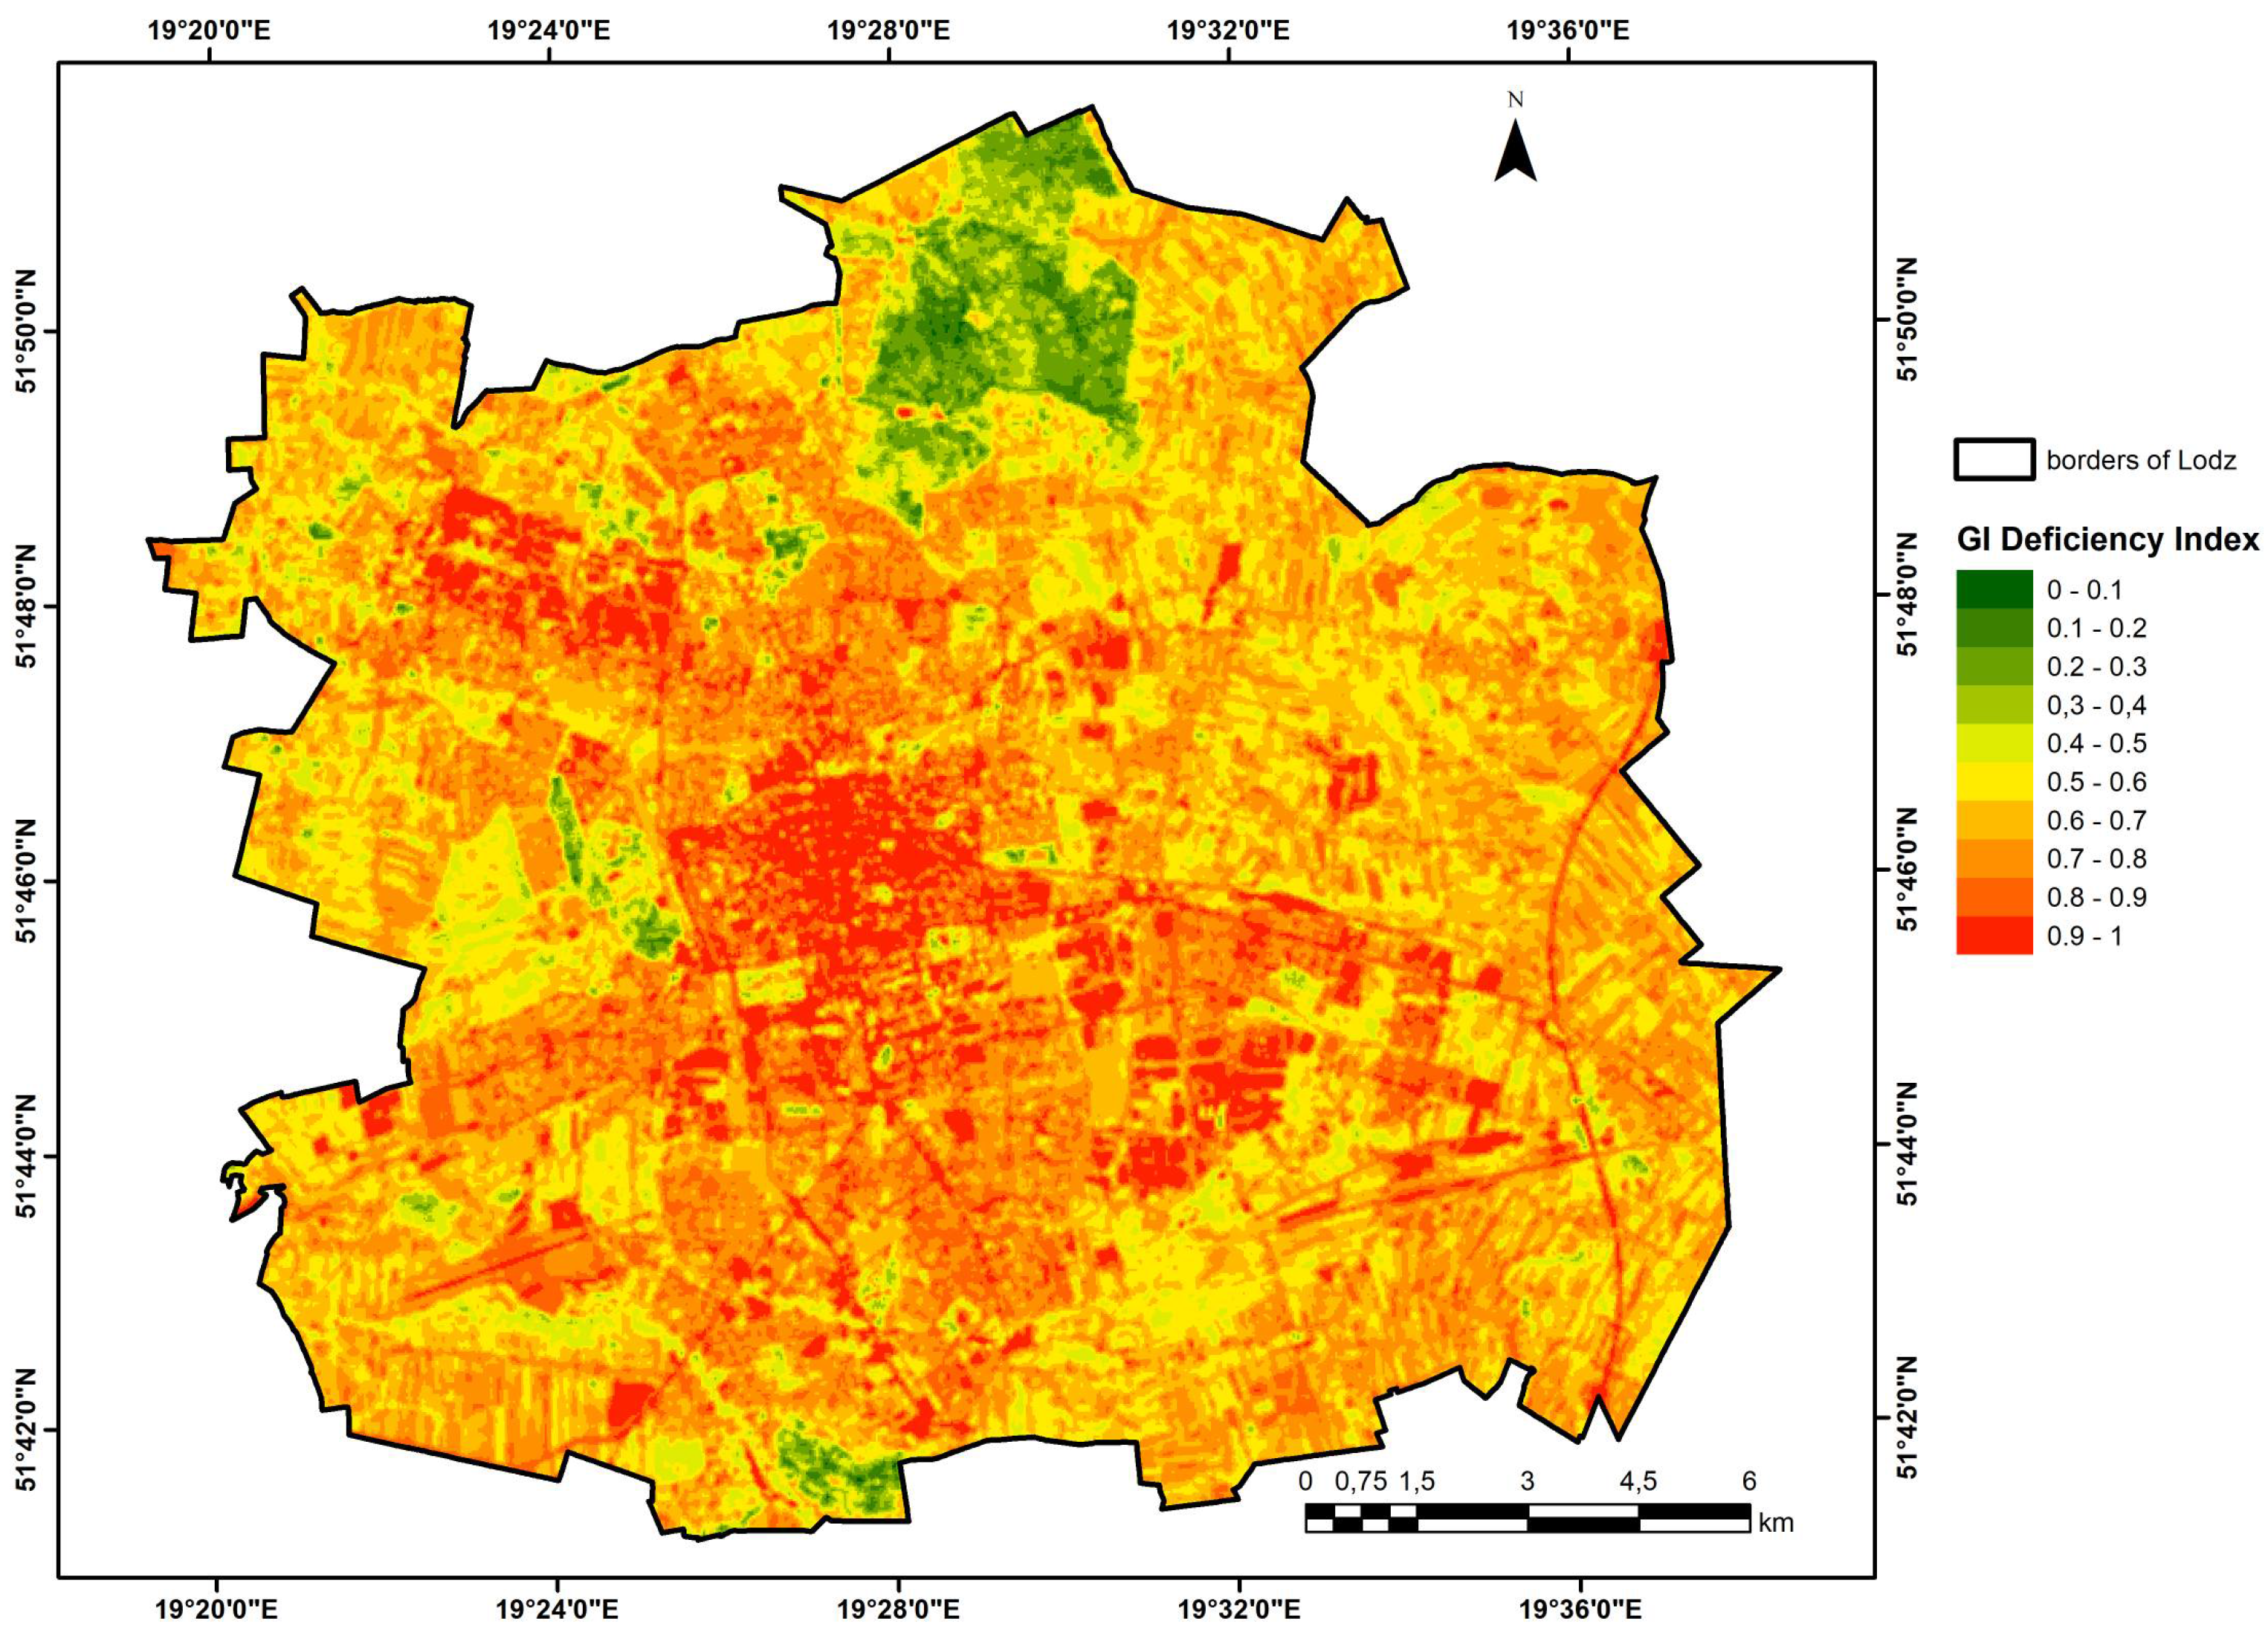
3.2. Greenery Deficiency Index
The Greenness Index GI can be easily transformed into a value that we call the Greenery Deficiency Index, GDI (5). Its purpose is to express the amount of greenery deficiency in the analyzed
i-th basic field, and thus signal the need to supplement it:
– the value of the greenness index in a i-th field.
In the form proposed in (6), the GDI indicator meets the condition 1 ≤
GDIi ≤ 0, with the value of 1 reaching 1 in areas without greenery and 0 where there is fully developed vegetation. The
GDIi index therefore expresses the postulate (expectation) that in a given
i-th area the level of ‘amount’ of greenery corresponds to the location of the
hmax point (Figure 7) can be considered optimal, so at least theoretically it can also be associated with
NDVImax, i.e. . the highest values of vegetation height and NDVI in the study area. In this approach,
GDIi = 0 would correspond to the areas of urban parks or forests, but it is difficult to expect these areas to be inhabited, because dense buildings exclude the existence of richly developed vegetation. Therefore, for inhabited areas, a different limiting, empirically determined optimal value of this
GIopt index can be adopted. To determine it, NDVI measurements should be performed in areas where the process of shaping the buildings and the accompanying greenery has been completed, so it can be assumed that the observed condition is an expression of a certain permanent balance and, additionally, can be accepted by the local community. Bielecki and Będkowski [
53] showed that certain characteristic areas of the city of Łódź have specific, non-normal distributions of NDVI values and suggest that the most typical values for them should be not average values, but modal ones, as the most frequently occurring ones. Assuming
GIopt into the model, the quotient
GIi/GIopt should be introduced into equation (6) instead of
GIi, so it will now take the form:
Also now 1 ≤ GDIi ≤ 0.
The GDI index is directly proportional to the size of the greenery deficit in a given area, but the nature of this relationship, due to the assumptions made (formula 5), is not linear. However, GDI has an ordering nature, i.e. it ranks the regions (basic fields) according to the increasing size of the greenery deficit.
3.3. Greenery Participation Index
In order for the determination of the distribution of places with a shortage of greenery, made using the GDI index, to be complete, i.e. to correspond to real needs, it is also necessary to take into account parameters characterizing the population distribution. We have proposed the establishment of a Greenery Participation Index (GPI) for this purpose.
To calculate GPI (9), two auxiliary indices were used: the Greenery Deficiency Index GDI (6, 7) and the Local Population Index LPI (8):
is the number of inhabitants in a given field,
is the highest value of number of inhabitants in one basic field.
In this approach, LPIi becomes a weight, i.e. an indicator determining the rank of the i-th basic field, because we assume that the urgency of expanding greenery is also directly proportional to the number of inhabitants. It is worth noting that, as in the case of calculating the GDI index (5, 6), also here, instead of Pmax, another value can be used, which we consider as the optimal reference level for population density (Popt). However, additional studies are necessary to determine it. It is possible that this number would be set at different levels depending on the nature of the current development, but it would always express the best (optimal) condition in a given area, i.e. corresponding to the desired (or socially accepted) population density.
Ultimately, the GPI index should therefore be calculated as follows:
The calculated indicator takes into account both the vegetation already existing in a given it’s adjacent basic fields and the number of inhabitants in this specific field. This indicator is, again, of an ordering nature, i.e. it ranks basic fields (30m × 30m) determining the order in which places we experience the lowest quality of life in terms of the participation of residents in the surrounding greenery. The lower value, the better situation.
3.3. Greenery Participation Index
The presented concept of determining indicators leading to the calculation of the Greenery Participation Index GPI must also take into account corrections resulting from the heterogeneity of urban space, which in the simplest terms consists of three forms of coverage: Vegetation, Impervious and Soil + Water, which is described using the VIS Model [
54]. However, we believe that in the conditions of the Central European temperate climate, i.e. with relatively abundant precipitation, it is difficult to expect that areas of soil not covered with vegetation will be significant in terms of size in cities. Rather, as we observe, these are transitional states - any exposed surface becomes green very quickly, first with herbaceous vegetation, then with shrubs and trees. This is a process of natural succession and is so intense that owners of temporarily unused plots must clean them regularly to prevent excessive development of shrub and woody vegetation. This is mainly dictated by legal reasons, because the removal of large trees, if they exceed certain size limits, involves the need to incur significant costs of environmental fees. So in our cities, apart from Vegetation, we basically only have Impervious and water, the latter of which, as uninhabited, are excluded from our considerations.
In urban conditions, any image pixel or base field is most often a mixture of the above-mentioned land cover forms. The NDVI determined for them is related by a linear function to the fractional cover of vegetation f and its specific NDVI, which we will now denote as NDVI
V and the specific NDVI
I value for Impervious areas, i.e. built-up areas - roofs of buildings, sidewalks, communication areas [
55,
56,
57]:
An NDVI value close to zero is appropriate for Impervious land cover (NDVI
I ≈ 0), while high positive values are appropriate for various types of Vegetation cover, while in the literature for our conditions different threshold values are assumed between NDVI
I and NDVI
V, from 0.1 to 0.3 or even 0.6, depending on the type of remote sensing data used, image properties and the season [
58]. If, for example, NDVI
V = 0.8, NDVI
I = 0.1 and Vegetation fractional cover
f = 0.5, then the resulting value NDVI = 0.45 will be recorded in the basic field. We will obtain the same value for the basic field in which NDVI
V = 0.45 and
f = 1. Therefore, the lack of vegetation in part of the basic field may result in a given region being classified, based on its total NDVI, as areas with a significant greenery deficit, while in fact there may be no greenery in the built-up part, and the remaining part of the area is covered with sufficiently well-developed vegetation.
In order to avoid false classification, the value of the NDVI index calculated using formula (1) in a given basic field should be corrected, taking into account the surface share of vegetation
f and NDVI
I for the part of the area not covered with vegetation. For this purpose, we will transform formula (10) accordingly:
where:
NDVIcor – corrected index value,
NDVI –index value calculated using the formula (1),
NDVII – index value for the Impervious area,
f – surface share of the area covered with vegetation.
Because most often it can be assumed that NDVI
I = 0, then we will receive:
In practice, determining fractional cover f may prove difficult because it requires processing data on land cover with infrastructural elements, such as buildings, streets, sidewalks, concrete squares, etc., coming from geometric databases, e.g. BDOT. A solution may be to use classified LiDAR laser scanning point clouds for this purpose. Both solutions, however, are very computationally complex.
The assumptions and dependencies discussed above are presented schematically in
Figure 7.
4. Results (Lodz Case Study) and Discussion
The city of Łódź was chosen as the research area because the authors of this work focus their research on this city. Not without significance was the fact that the authors living in Łódź know the research area very well and had the opportunity to empirically verify all results.
All basic spatial indicators were calculated based on defined basic fields in the shape of a square with sides of 30 meters, consistent with the pixel arrangement of the satellite image. It was decided that this size would be appropriate for calculations on a cities with large area over 100 km
2. Within the city limits of Łódź, 325,691 basic fields were designated, which is a demanding number to develop for a personal computer, especially considering the fact that one of the stages was the development of LiDAR data, which can also be resource-intensive [
59]. This is the main reason why the size of the basic field should not be too small and the data will not be more detailed. Then the vegetation deficiency index were calculated based on the square with sides of 90 meters, which is being show the situation in the pixel itself but also in the adjacent basic fields giving the value of average for it.
Utilizing the Landsat 8 satellite scene of the resolution 30m bands 4 (red range, RED) and 5 (near infrared, NIR) were used to calculate the NDVI in pixels corresponding to the resolution of the original image, i.e. 30m × 30m.
The NDVI vegetation index was the basis for calculating the indices. Since the entire image of the city of Łódź was covered by one satellite scene, neither solar nor atmospheric correction of the images was performed. The index values ranged from -0.18 to 0.63.
To determine the relationship between NDVI and vegetation height in our study area, basic fields of 30m × 30m were designated. Out of 325691 we only selected those basic fields based covered with greenery completely, based on LiDAR data, as we wanted to focus solely on the thickness of the vegetation layer [
60,
61]. Then the average height of greenery has been determined by using a LAS to Raster function built in ESRI ArcMap application [
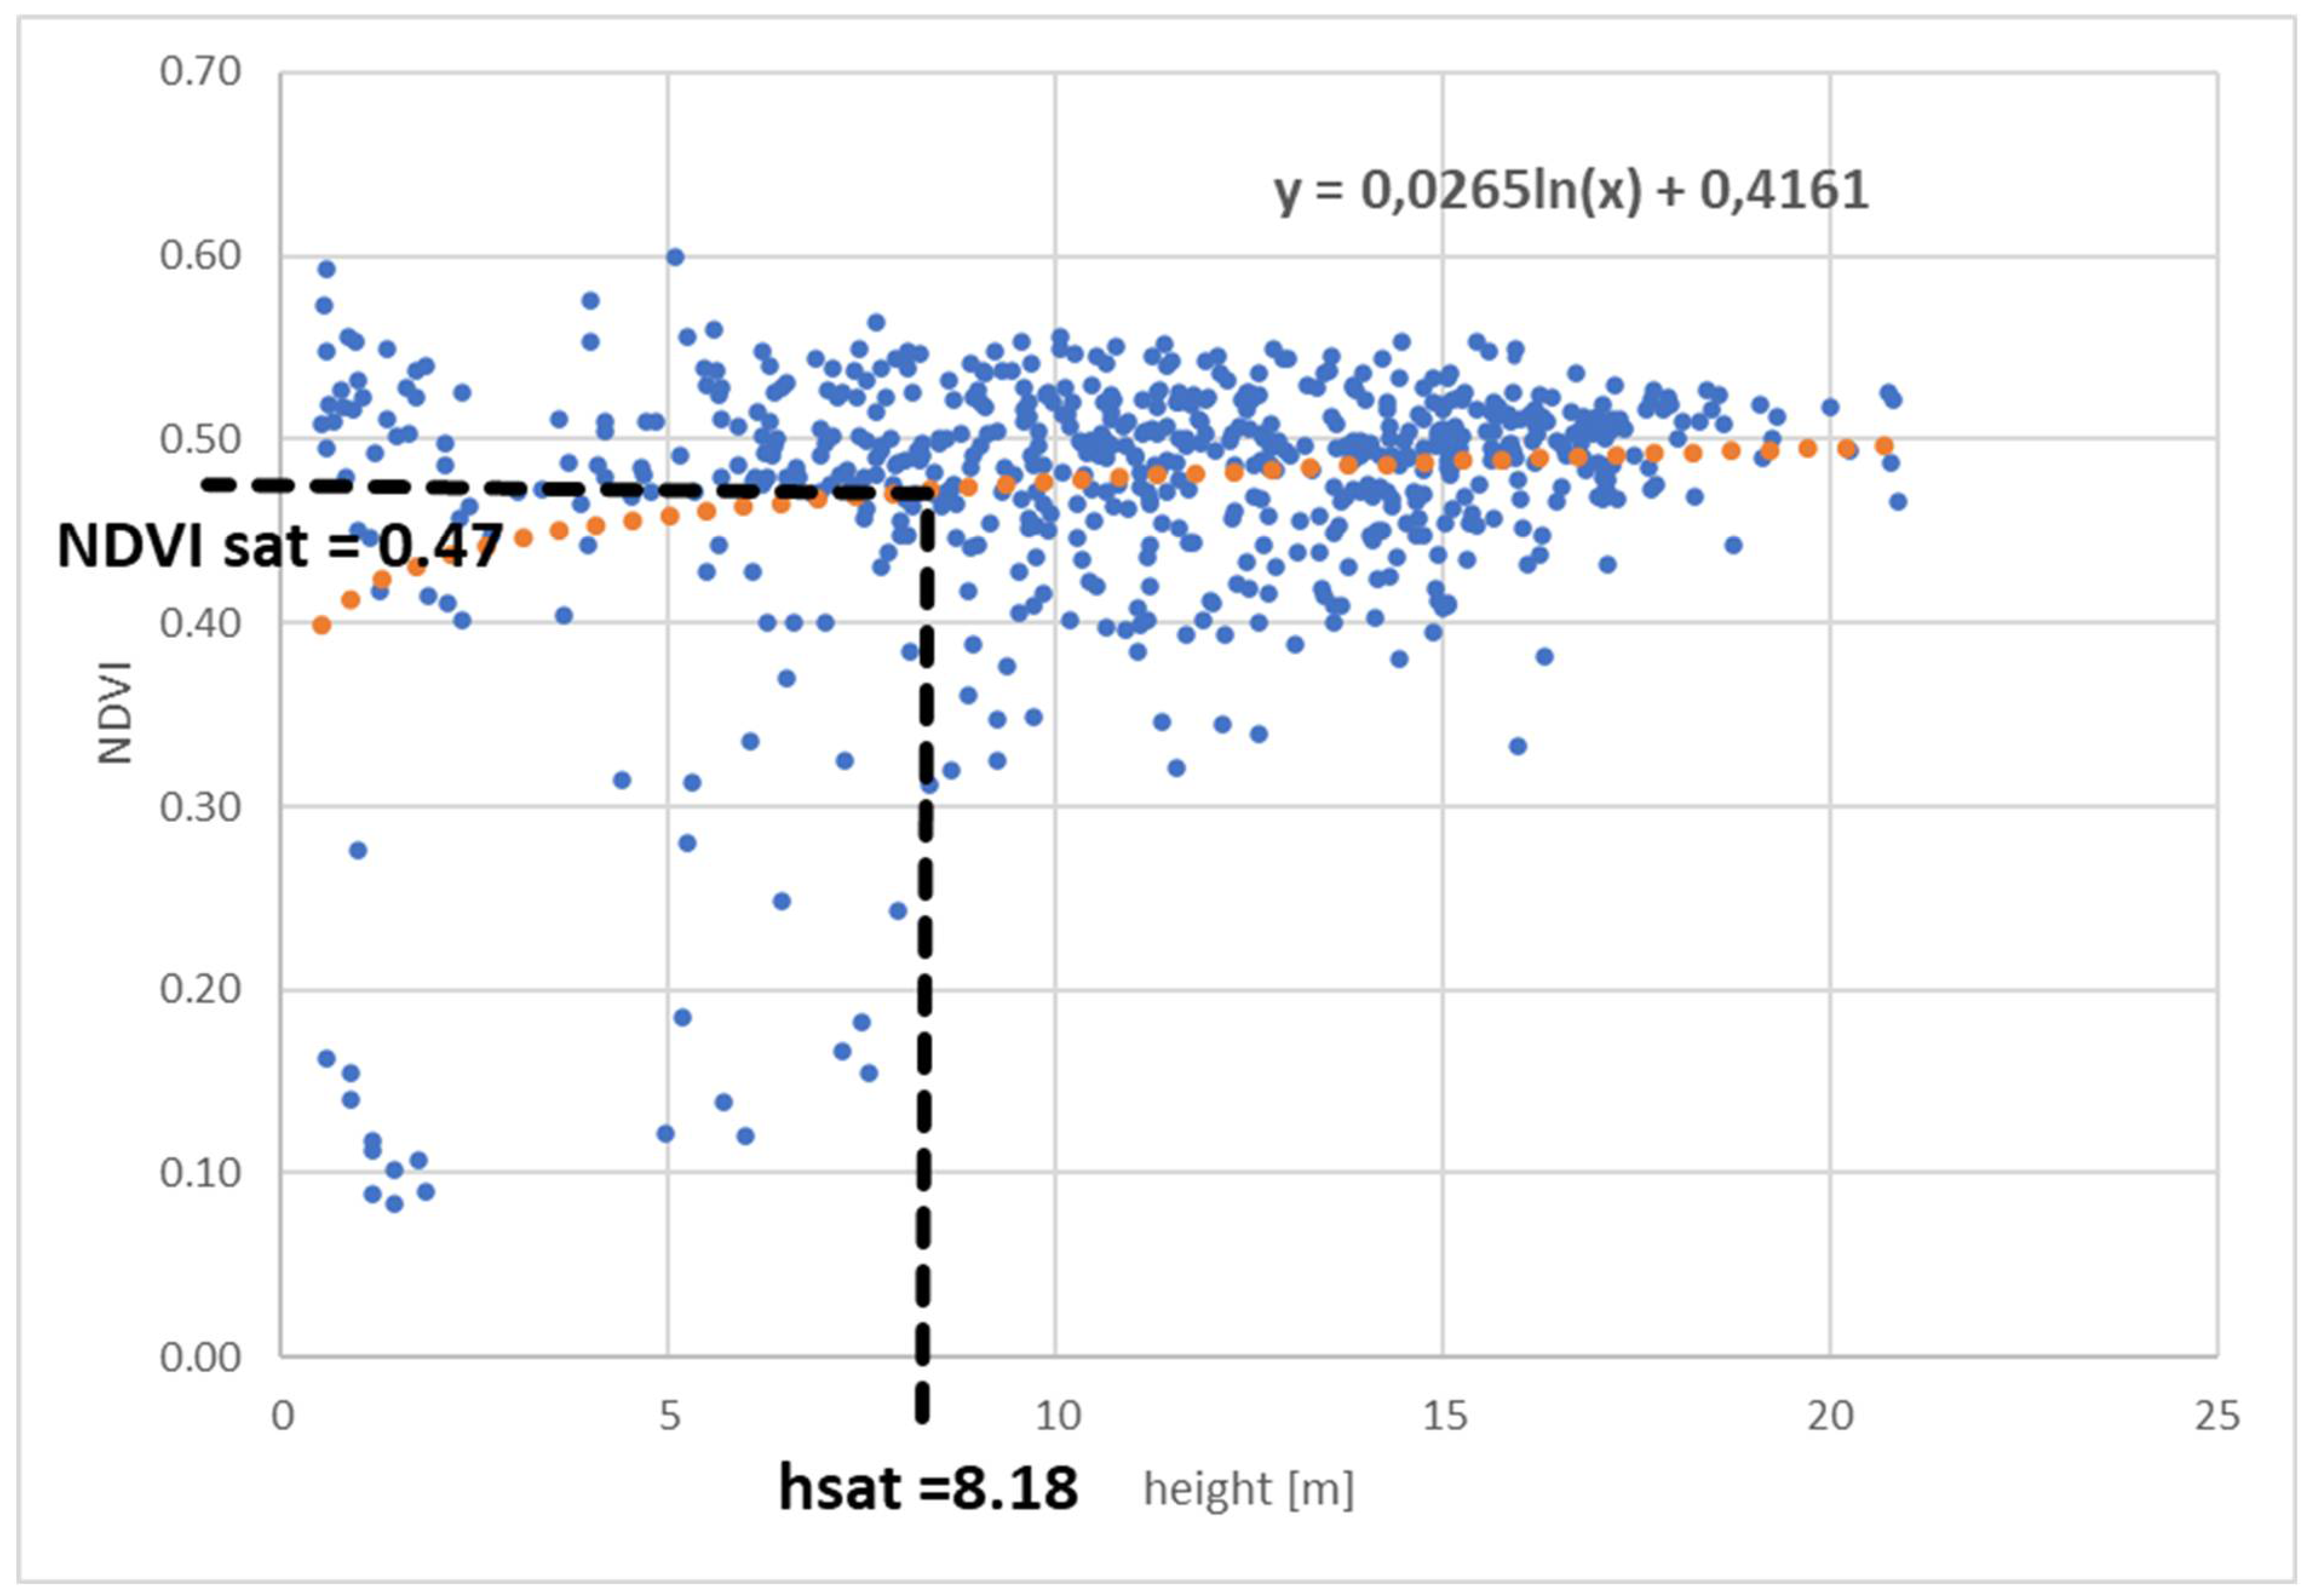
62]. The next task was to create a chart showing the dependence of the NDVI index on the height of greenery.
As a result, the following logarithmic function formula was obtained:
The phenomenon of NDVI ‘saturation’ in our data is clearly visible (
Figure 8), so a threshold was determined on the graph for which the ratio of the difference between the maximum of the function and the value of the function f(x) falls below 5% of the value of this function. This value was adopted arbitrarily and this is how we determined the location of the saturation point (h
sat = 8.18 m, NDVI
sat = 0.47).
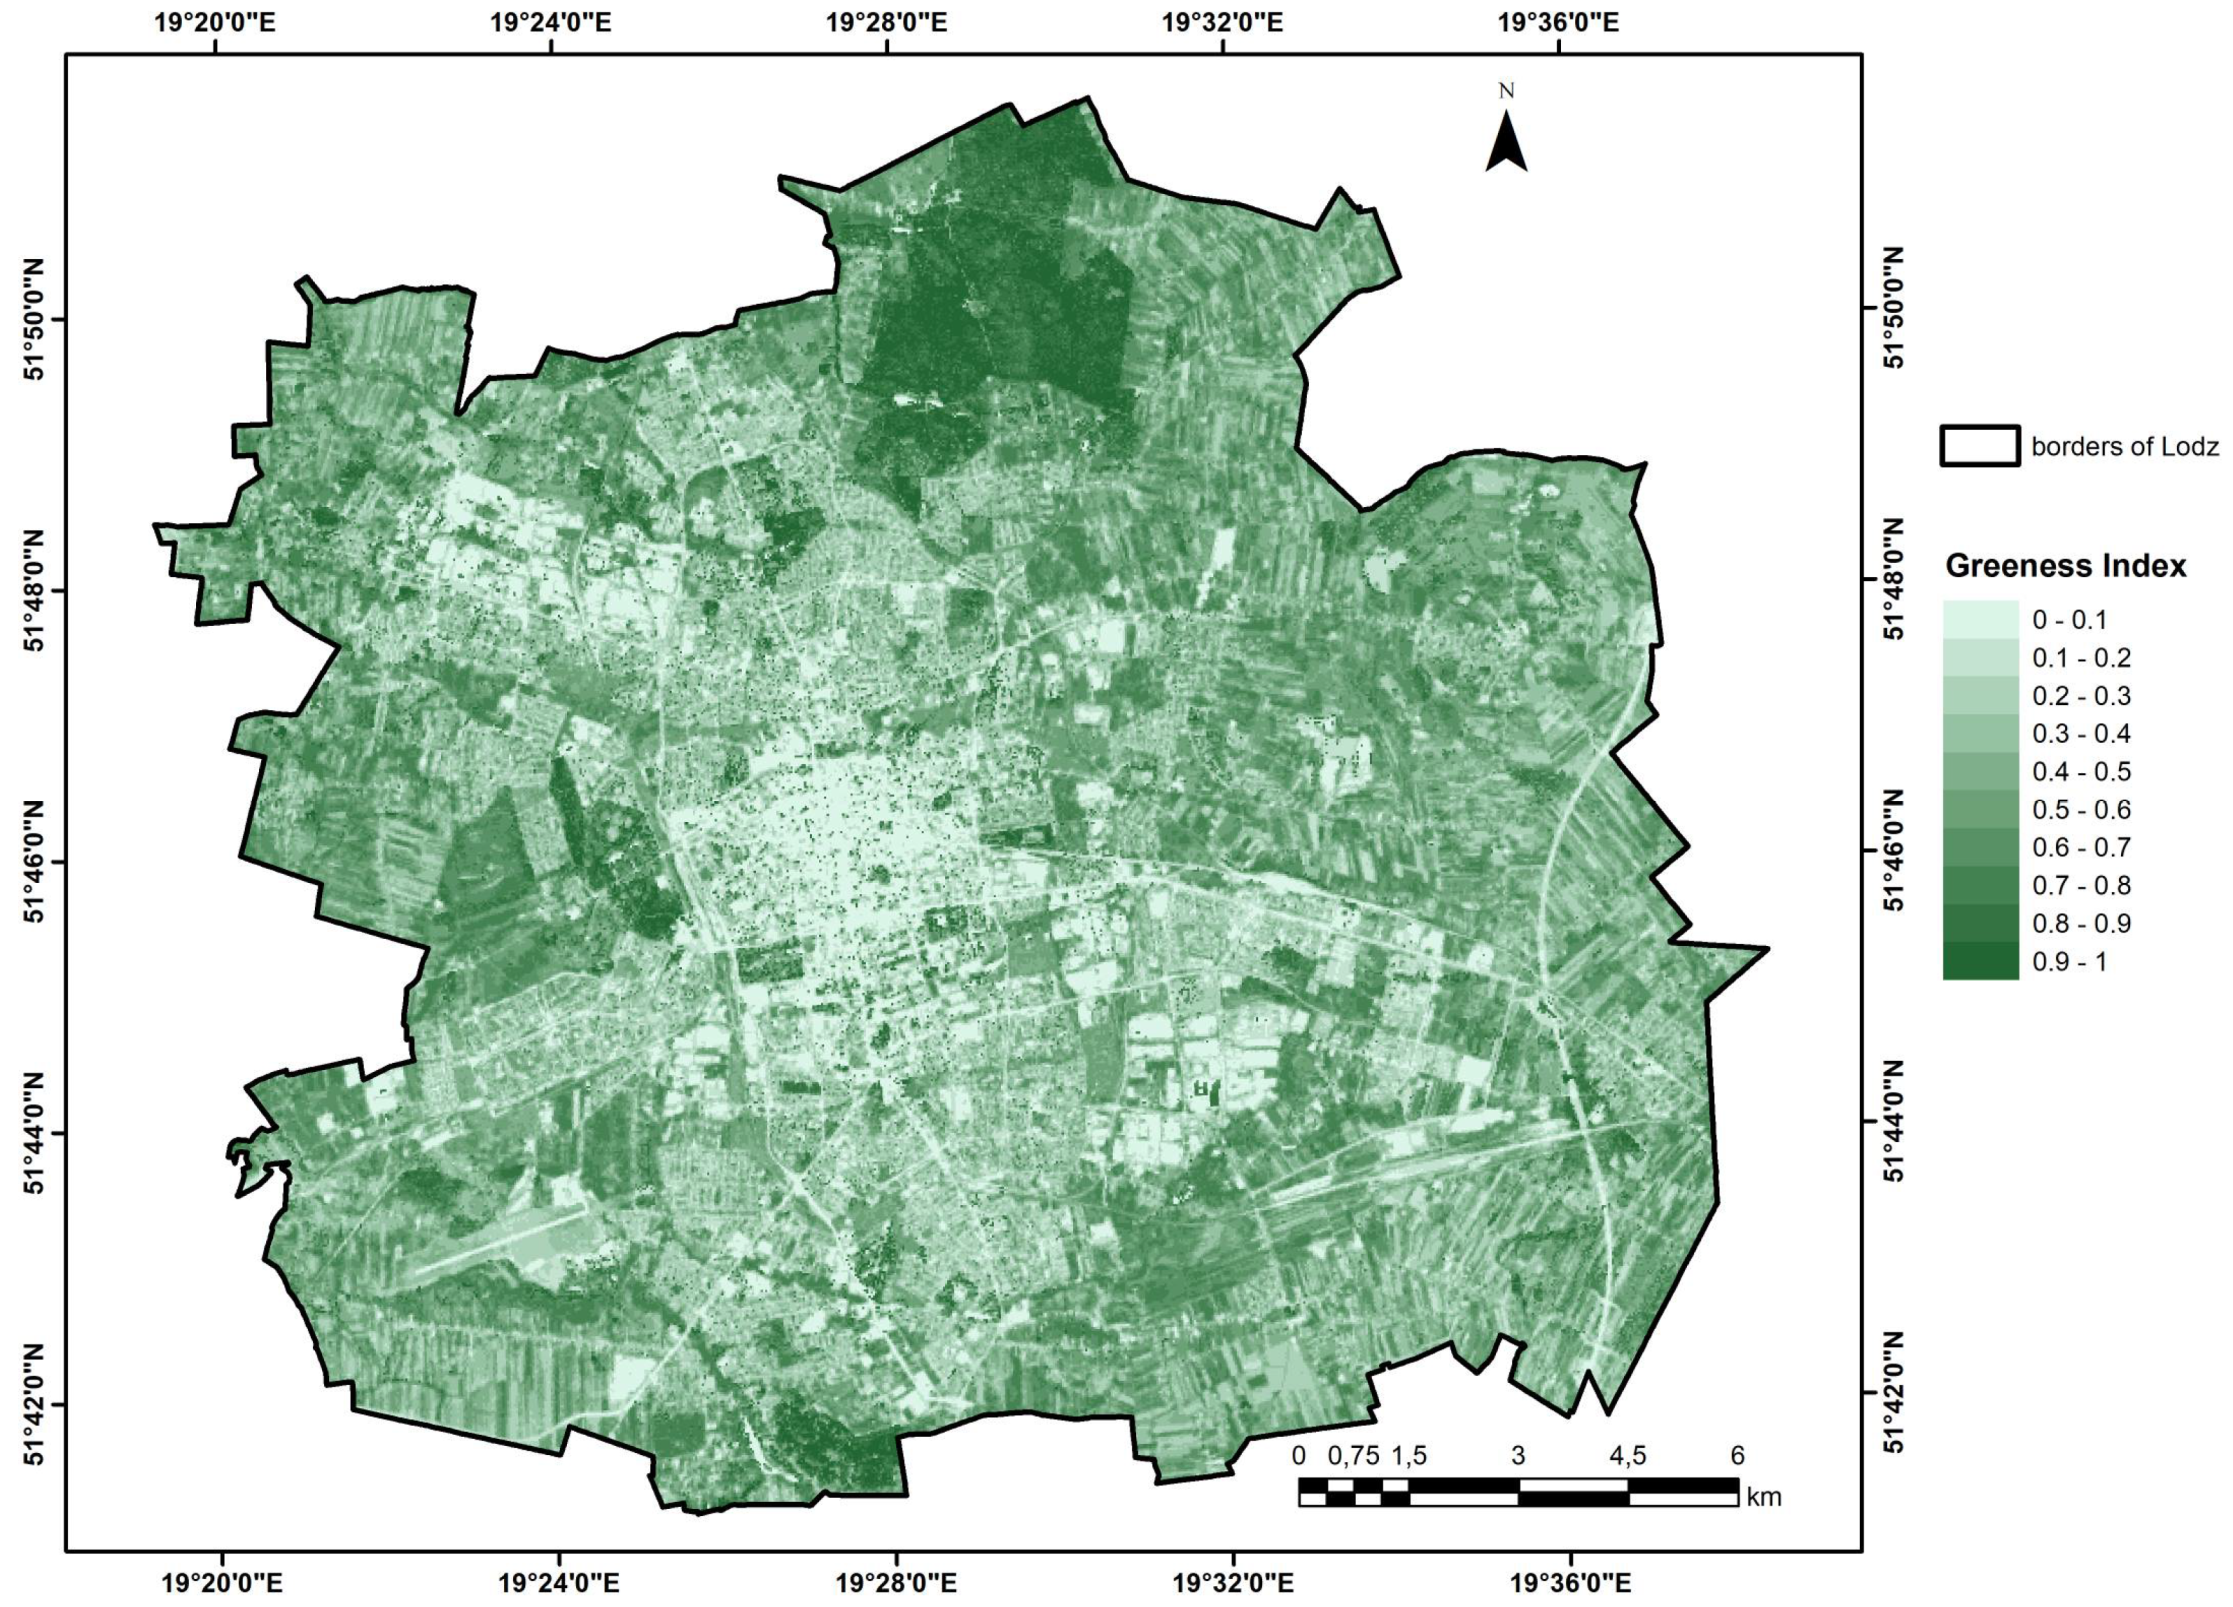
By calculating the Greenness Index, a map was obtained of the degree of vegetation development in individual places in Łódź, which can be interpreted as the amount of greenery in a given location. The spatial distribution of this indicator is presented on
Figure 9. The average value of the greenness indicator for Łódź is 0.58.
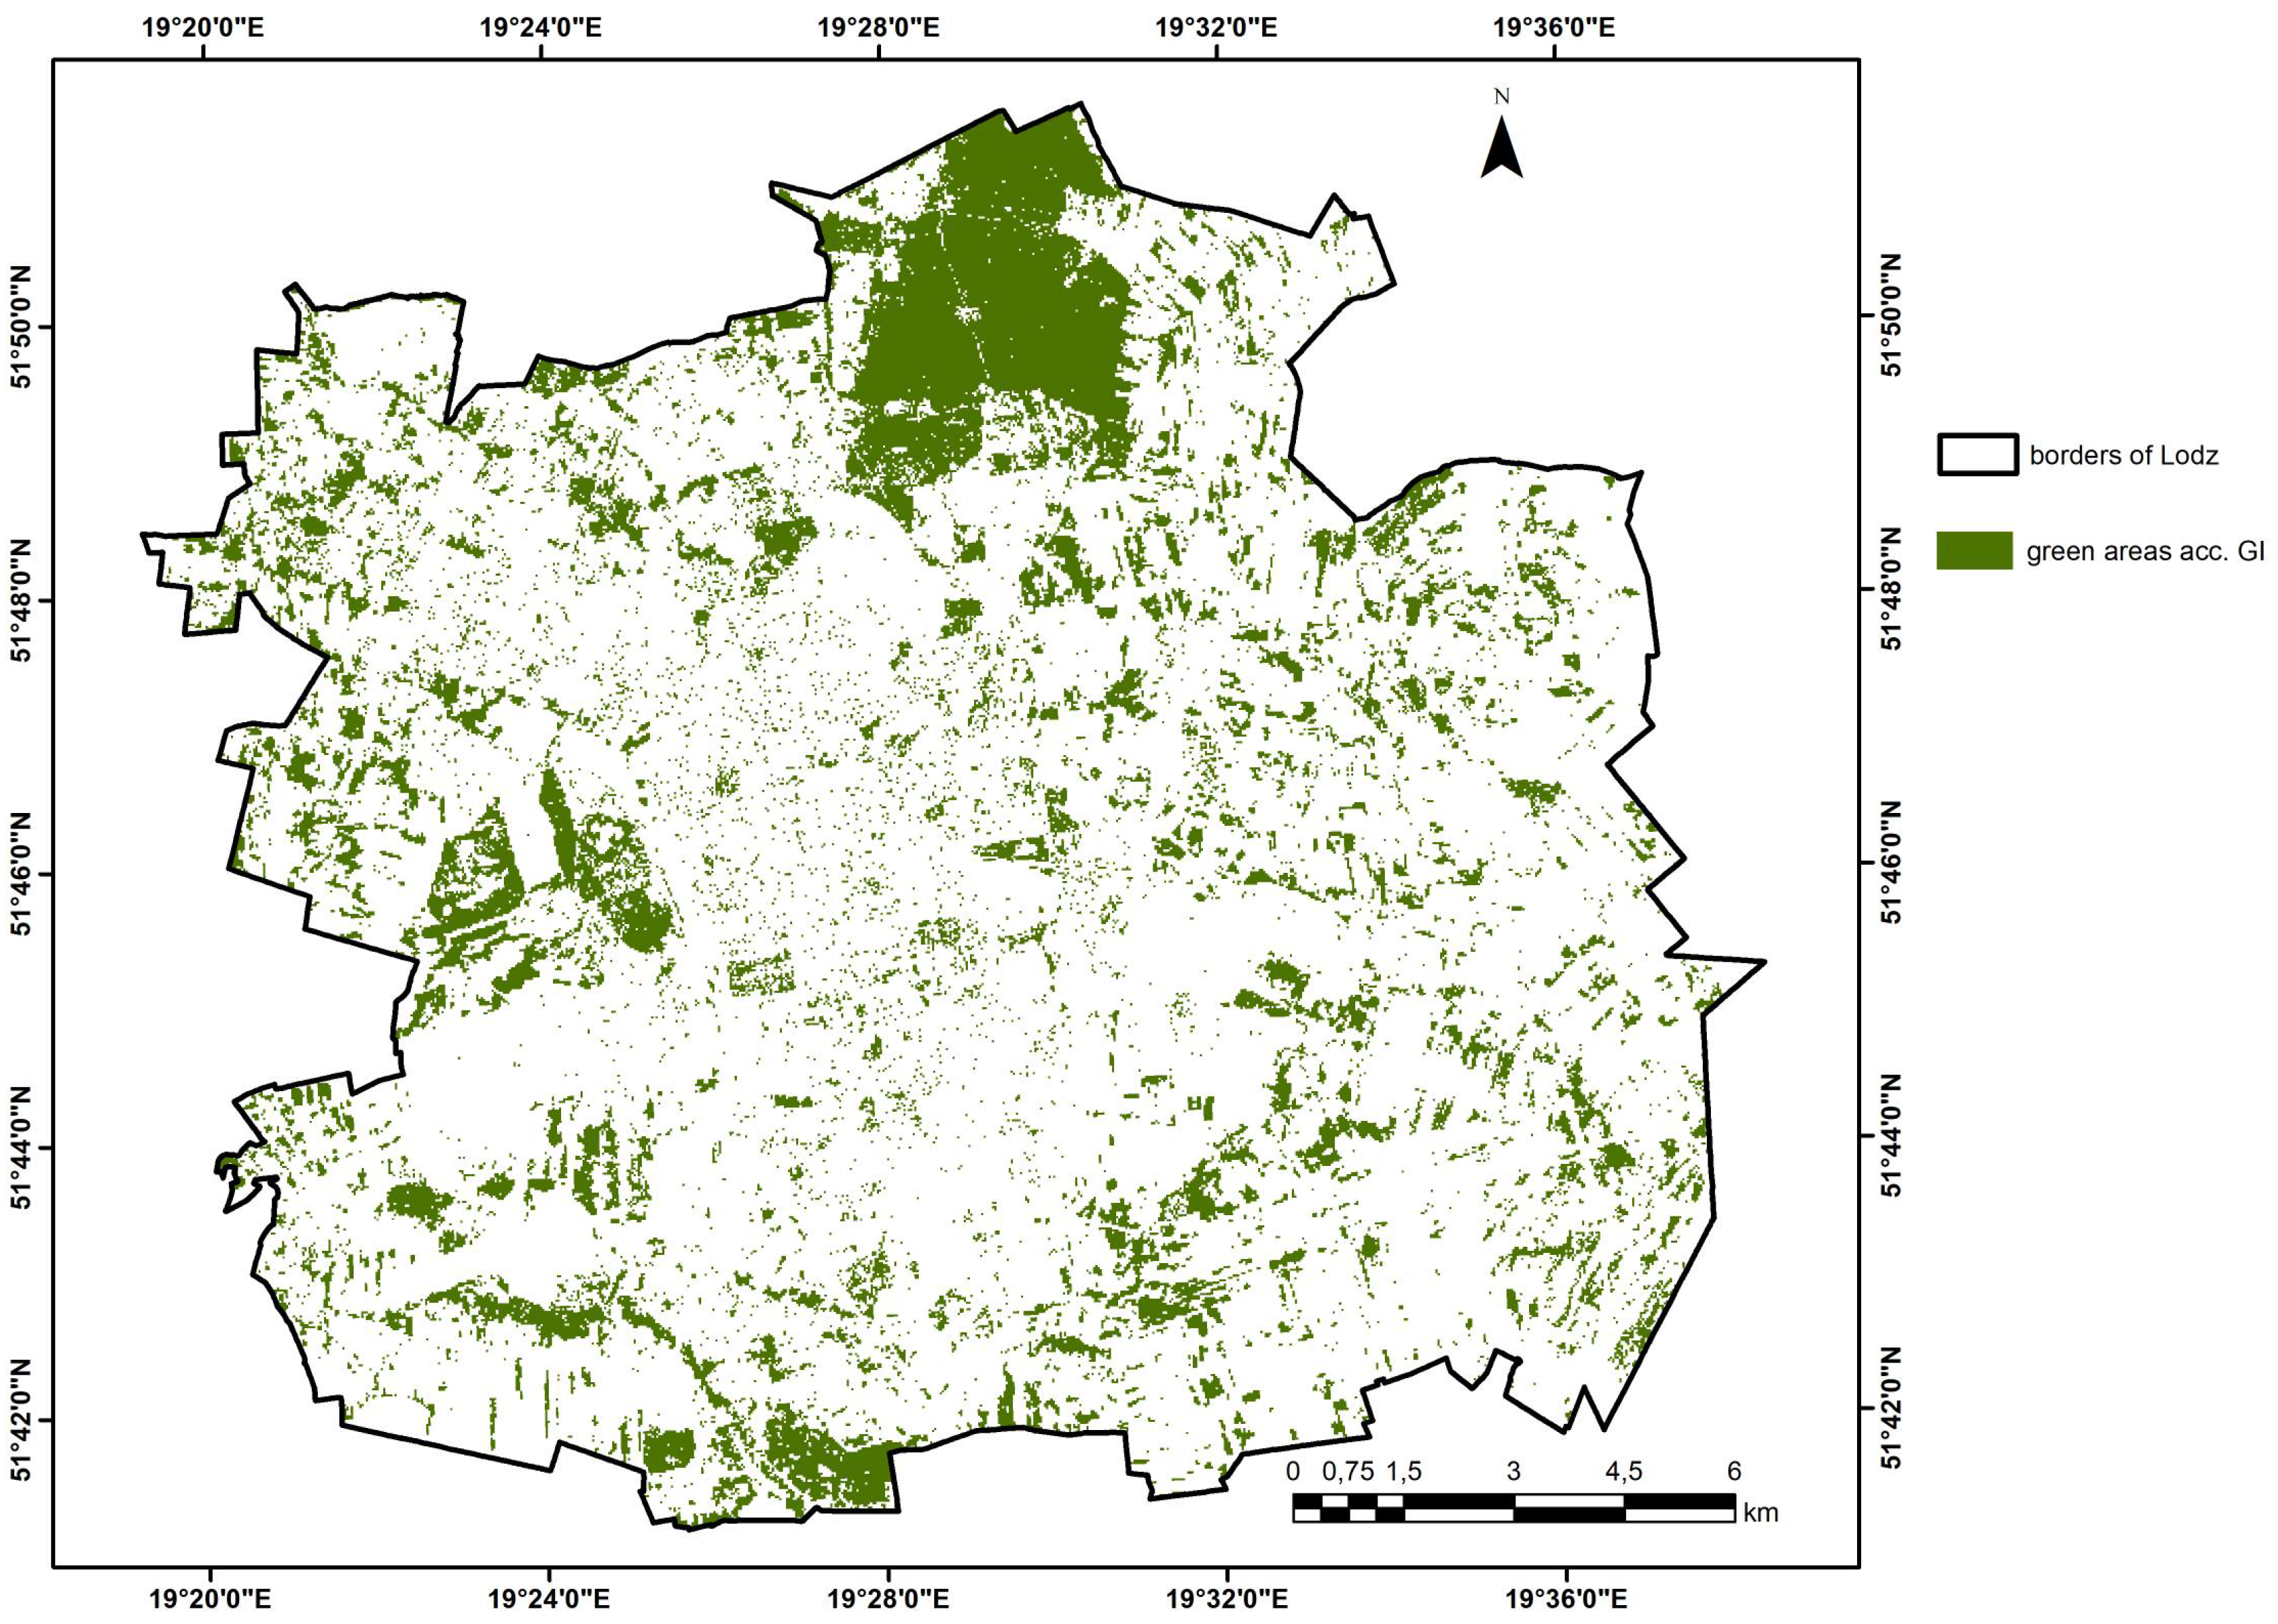
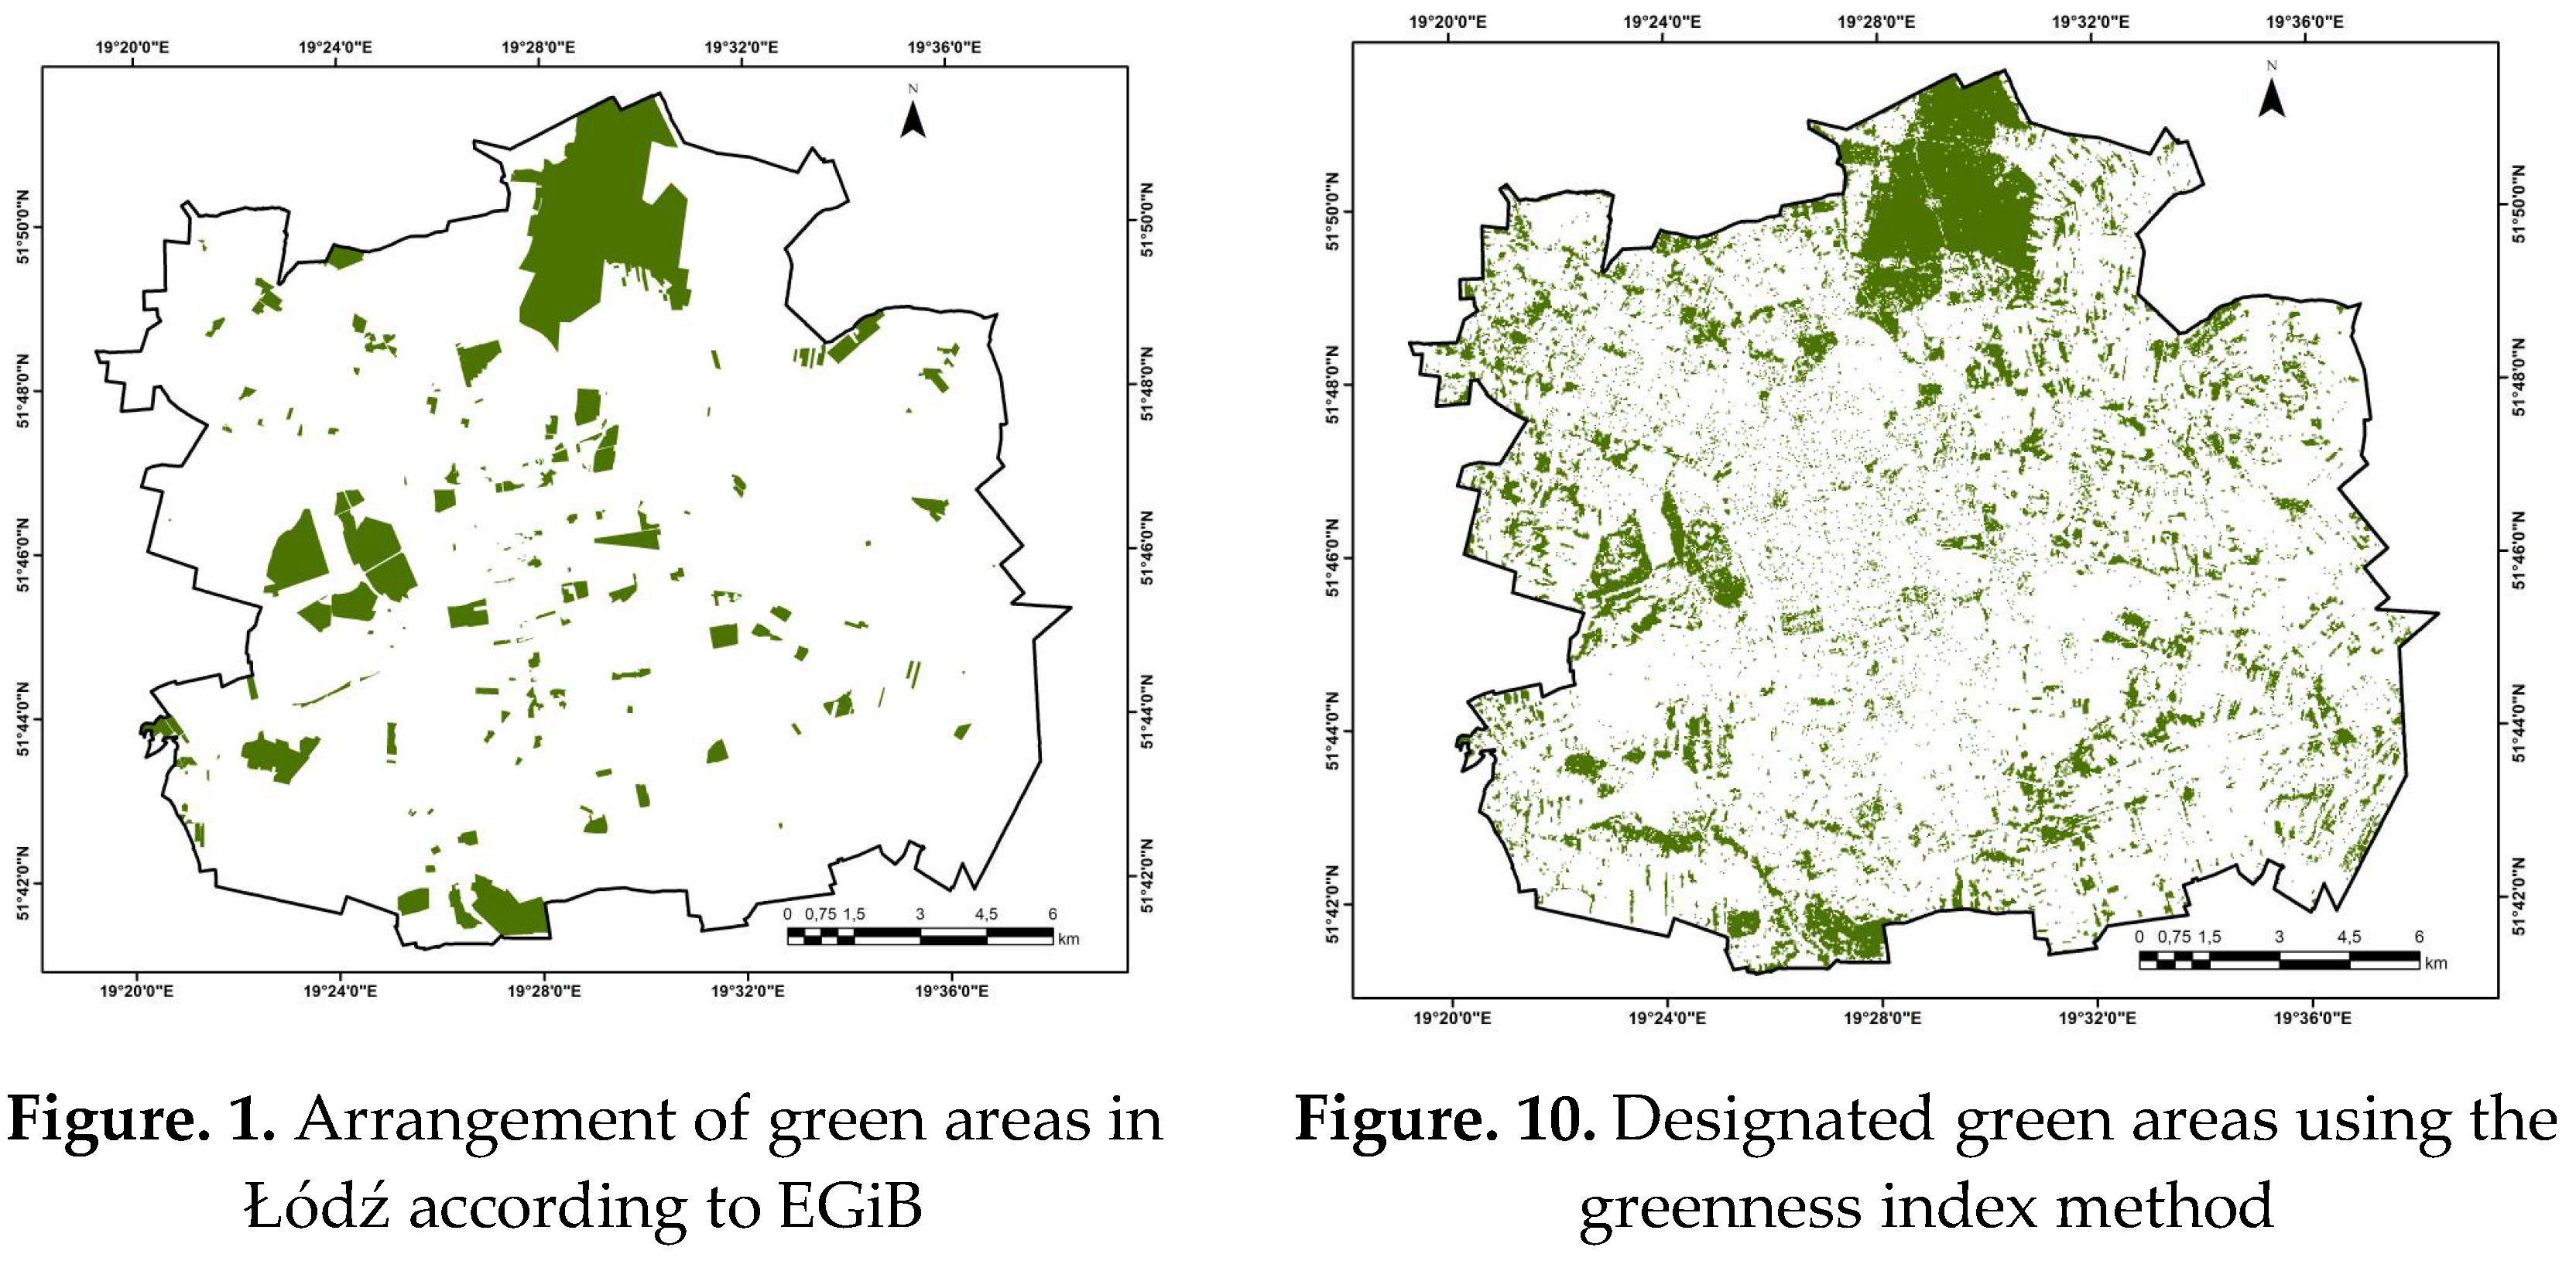
Based on the designated formula, it was determined which areas of Łódź could be classified as green areas. This was done by determining the dominant value of the greenness index for official green areas according to data from ŁOG, which is equal to 0.51 (corresponding to 2.51% of all basic fields). Then, those basic fields were selected for the entire city of Łódź in which the greenness index value was at least 0.51. As a result, it was found that the designated green areas in Łódź cover an area of 55.17 km
2, which constitutes 18.83% of the area of Łódź (
Figure 10).
The next goal was to designate green areas in the place of residence. The immediate vicinity of the place of residence was designated as a basic field of 30m × 30m along with adjacent fields (
Figure 11).
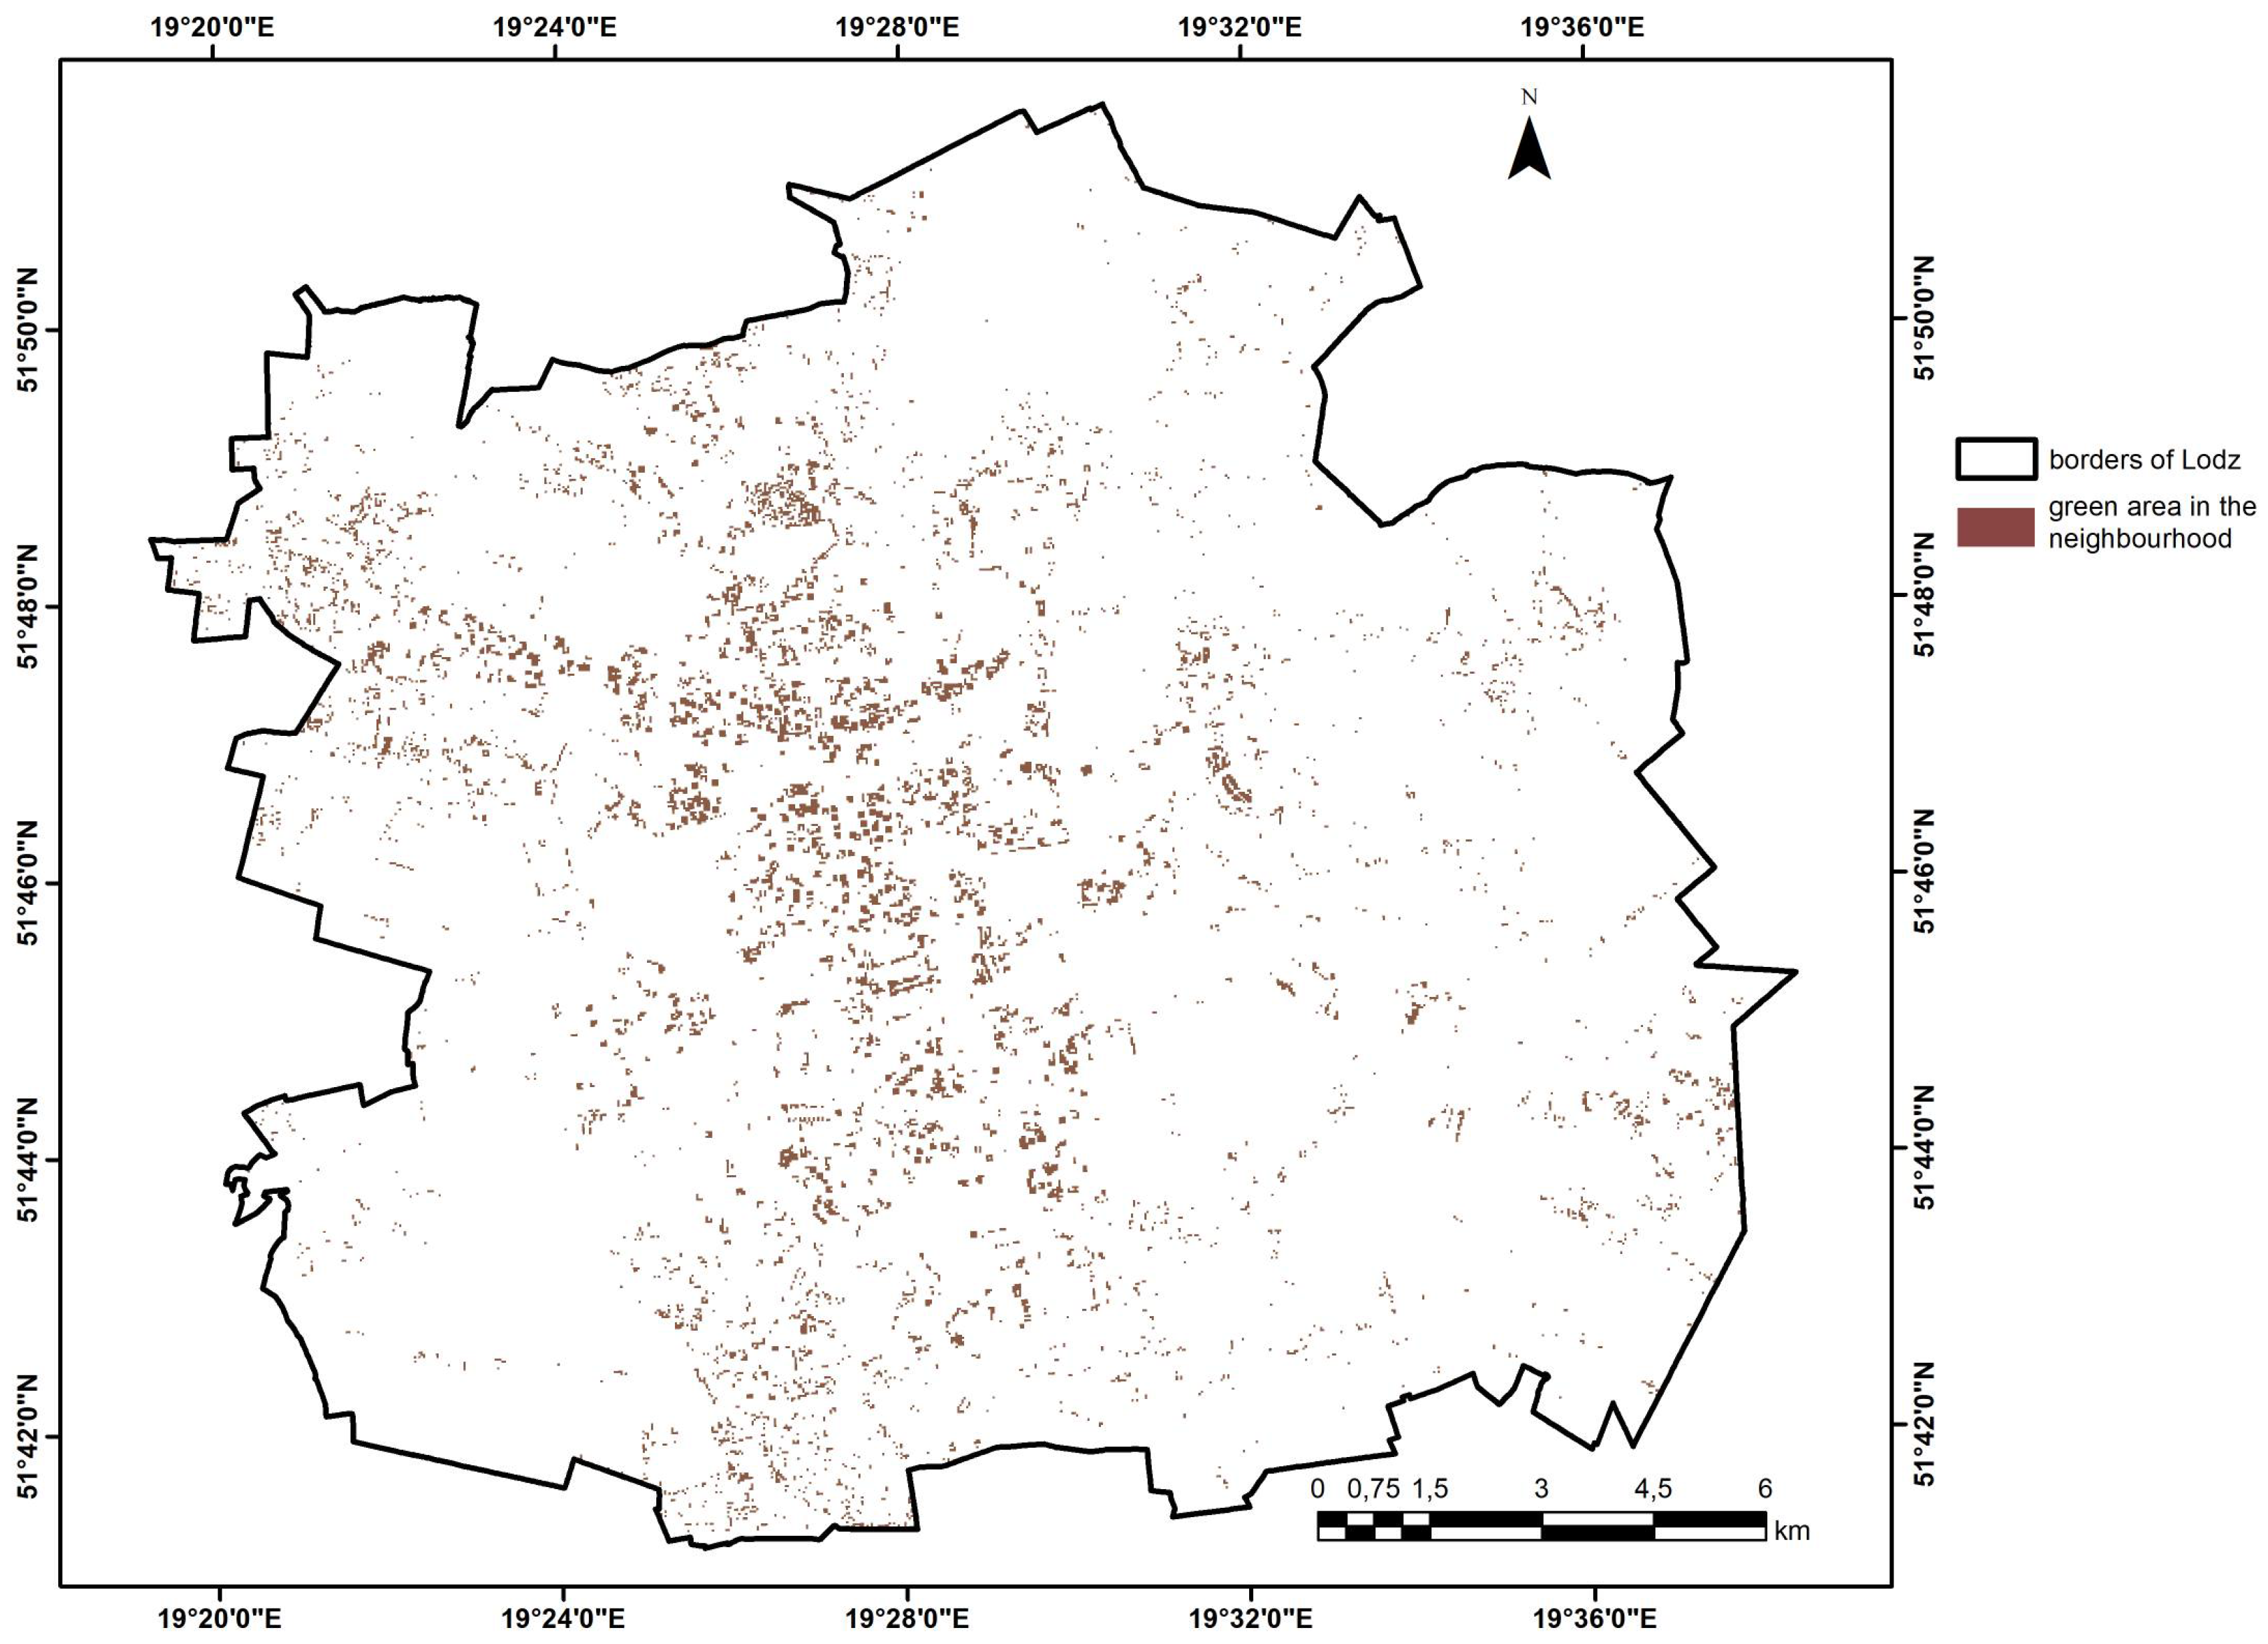
It is recommended to locate a parks not more than 500 meters from residential buildings (or the location of buildings at such a distance to parks), which would take a 10-15 minute walk [
63]. However the quality of life of the city’s inhabitants is mostly determined by the size and condition of green areas in the place of residence. It was assumed that the immediate surrounding means a space contained within a radius of approximately 50 m, which is approximately equivalent to a square of 90m × 90m.
After the analysis, it turned out that approximately 157,000 inhabitants of Łódź have greenery in their place of residence with a Greenness Index of 0.51 or more, which constitutes 24,1% of the total population (
Figure 13).
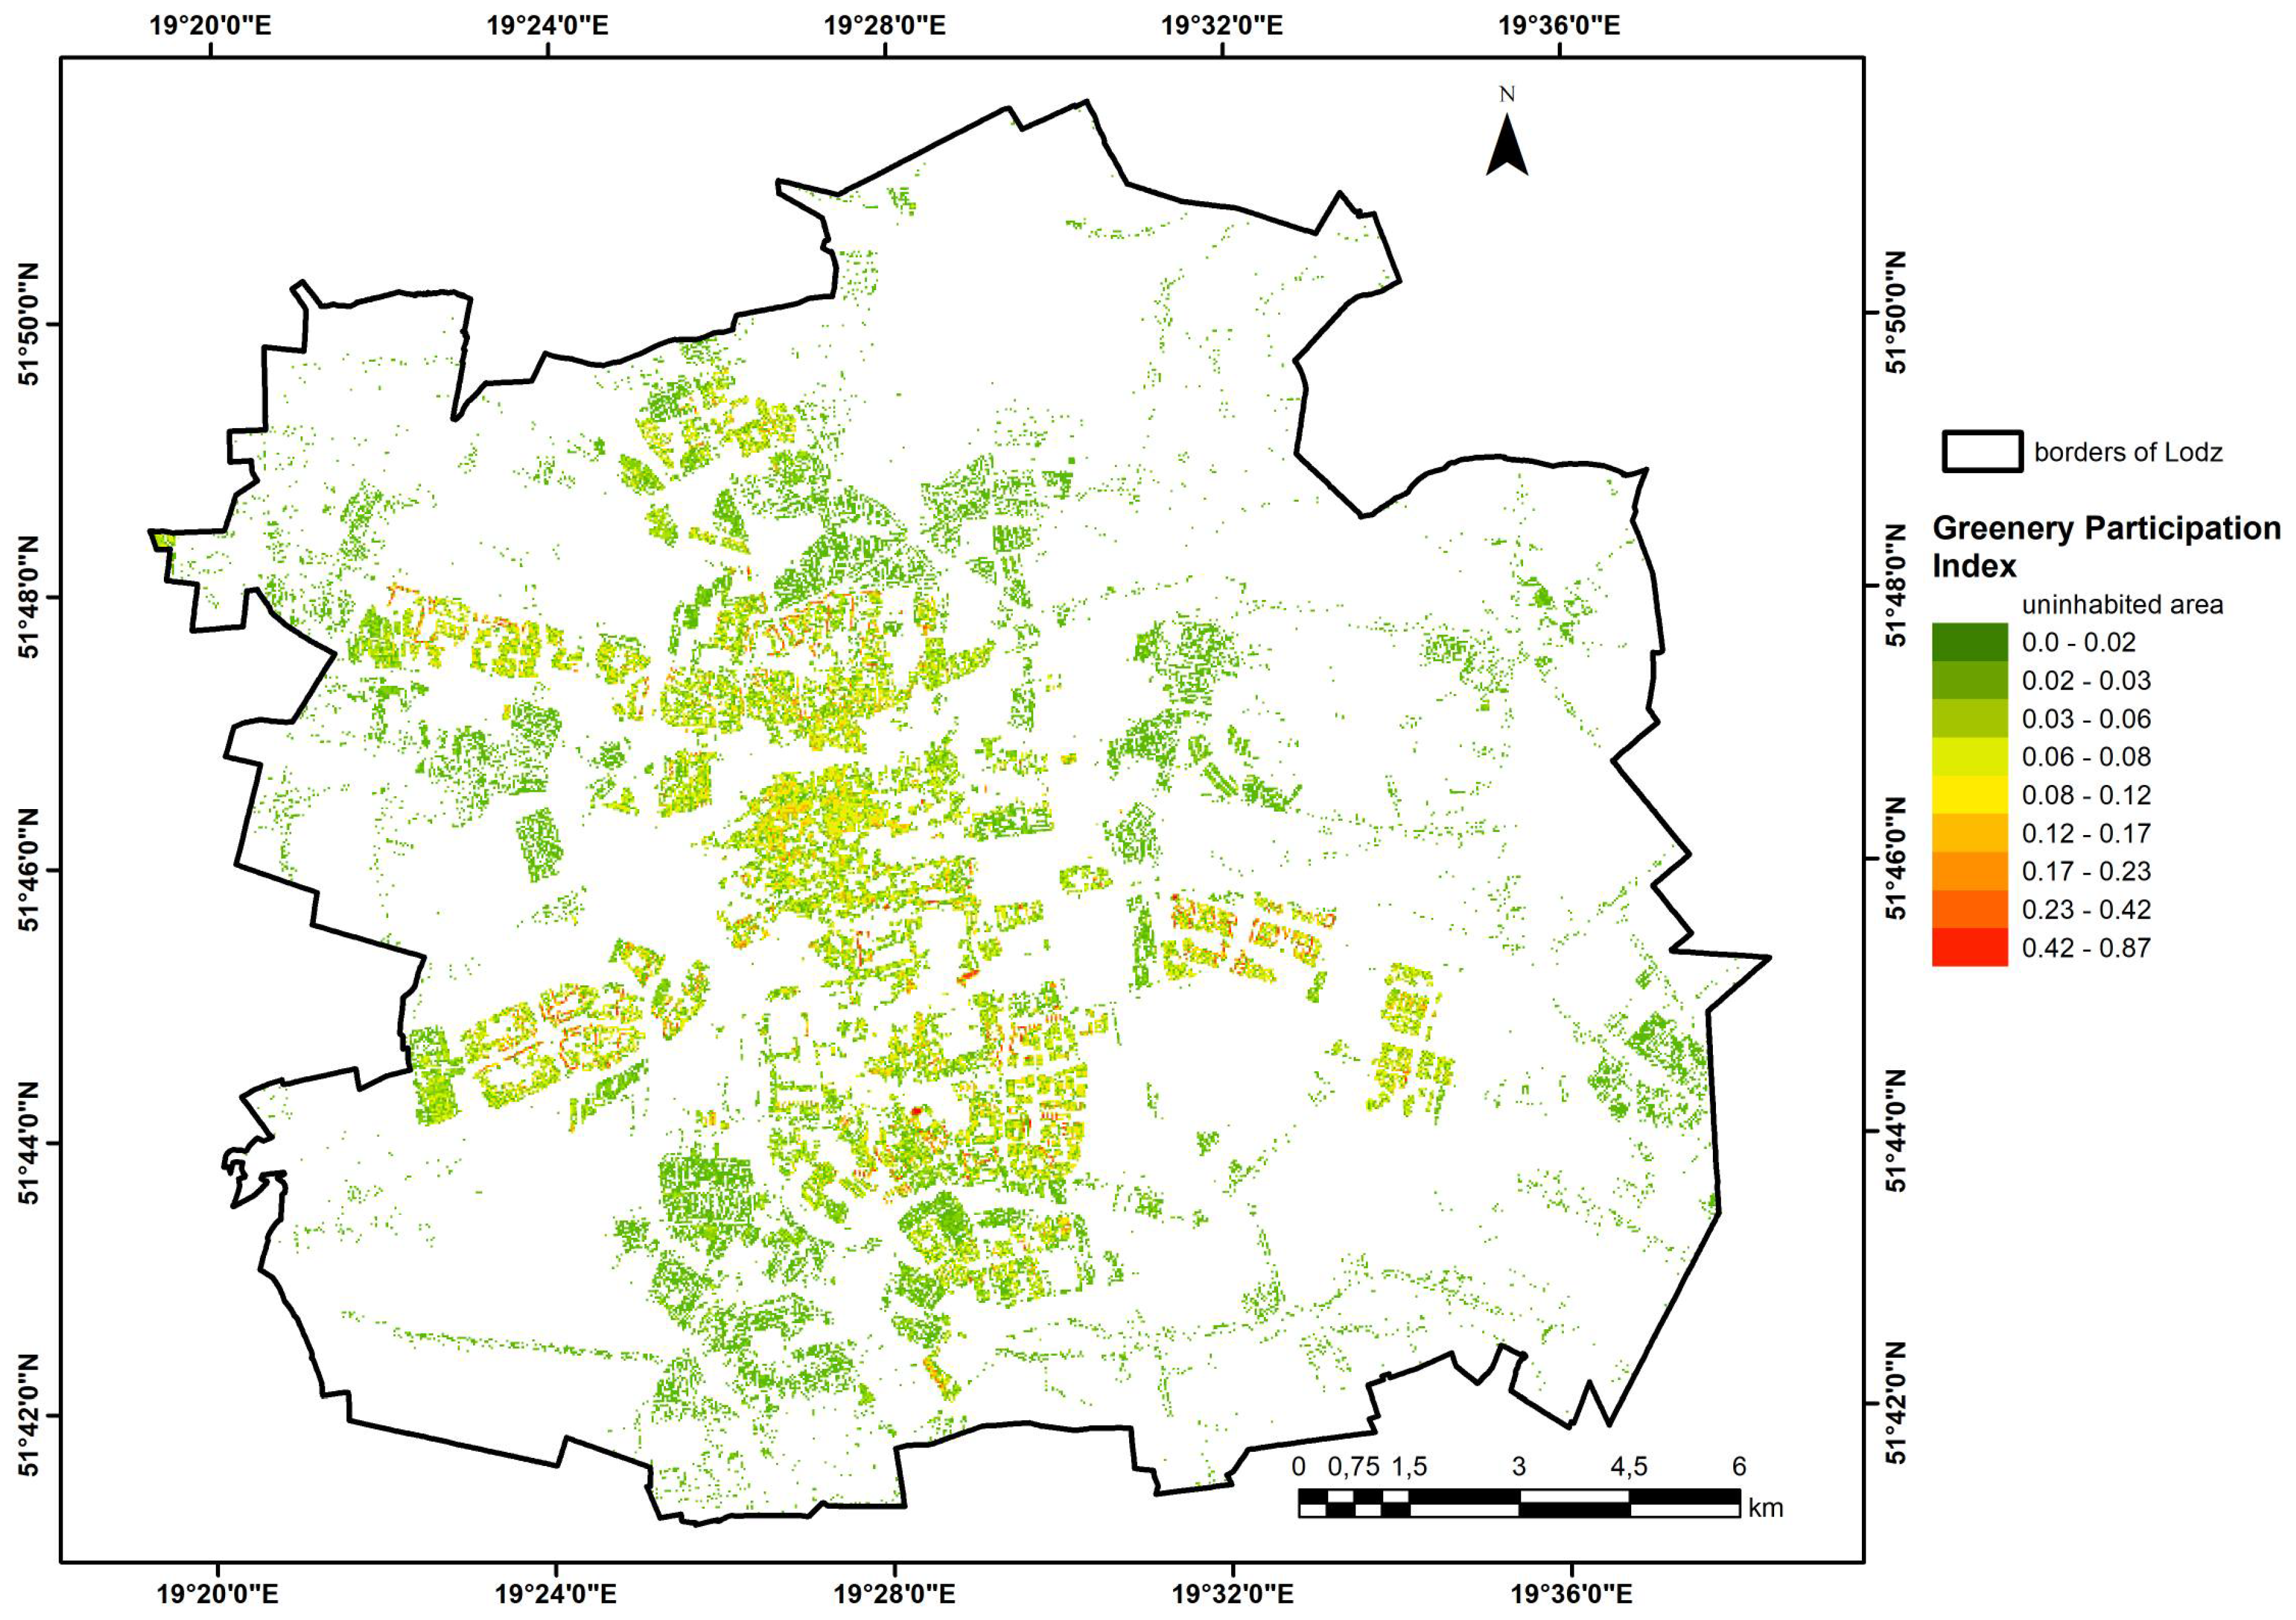
As a result, the Greenery Participation Index for replenishing greenery in a given place was also calculated for each basic field. The spatial distribution of the GPI is presented in
Figure 14.
The GPI values in Łódź range from 0 to 0.87.
5. Conclusions
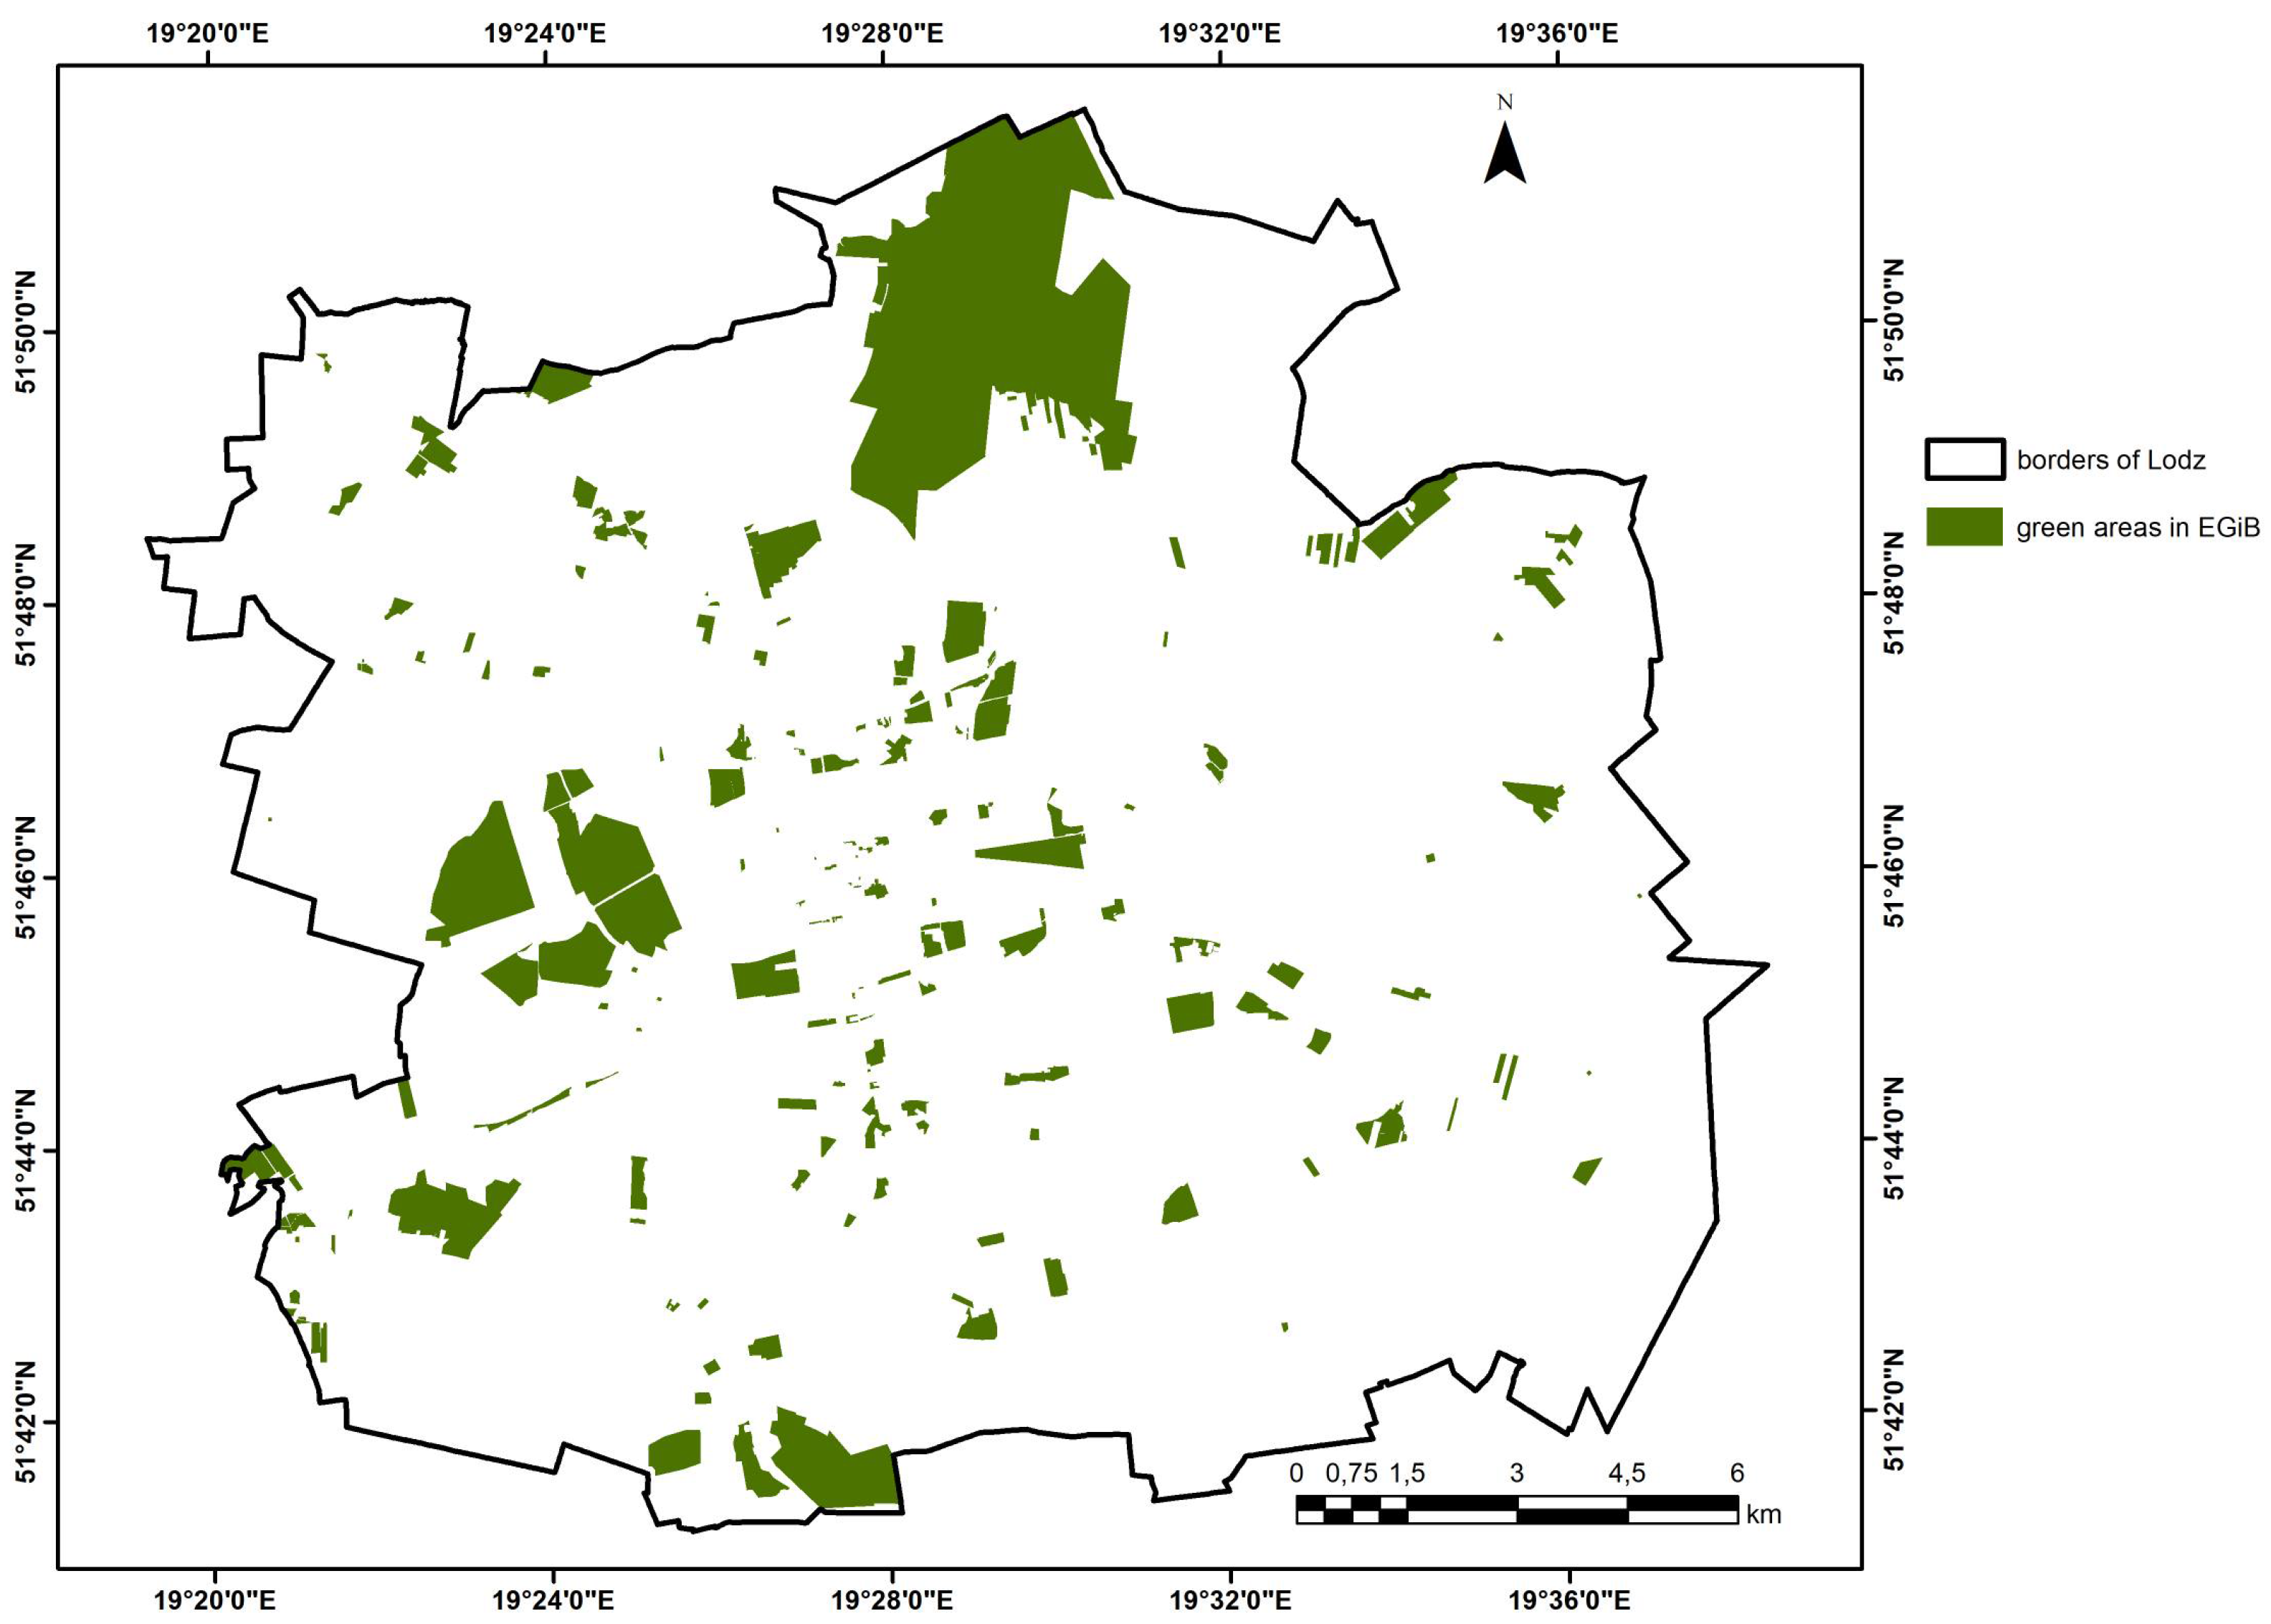
The presented results show that the actual amount of greenery differs significantly from that presented in official reports. Area of 30.77 km
2 according to the public data (
Figure 1) is almost double smaller than green areas designated basing on Greenness Index (60.91 km
2).
The uneven distribution of green areas throughout the city is very visible. Taking into account the distribution of inhabitants, the rule is that the more people there are in a given area, the less vegetation there is.
This has direct consequences in the distribution of the Greenery Participation Index values in Łódź, which has the highest values especially in the city center, where there is a dense residential development and green areas constitute a small part of this area.
The proposed indicators combine satellite data with demographic data, thanks to which we receive additional information resulting from information from various sources.
Instead of relying on data that is not entirely clearly defined, a uniform method should be used, which allows for the definition of land cover in a more realistic and objective way and enables an indisputable comparison of the quality of life in different parts of the city as well as among the cities themselves.
The great advantage of the method is that it uses only free and publicly available input data. This method does not require specialized knowledge, only the basics of GIS. However, one should initially get used to the process of obtaining data and attaching it. Moreover, the method does not require specialized equipment or large computing units. The average computer used for managing of spatial data in city halls and offices has sufficient processing power. This method is also independent of the legal status, functions and accessibility of a given area. It can help in decision-making processes regarding spatial changes in the city.
Figure 1.
Arrangement of green areas in Łódź according to EGiB.
Figure 1.
Arrangement of green areas in Łódź according to EGiB.
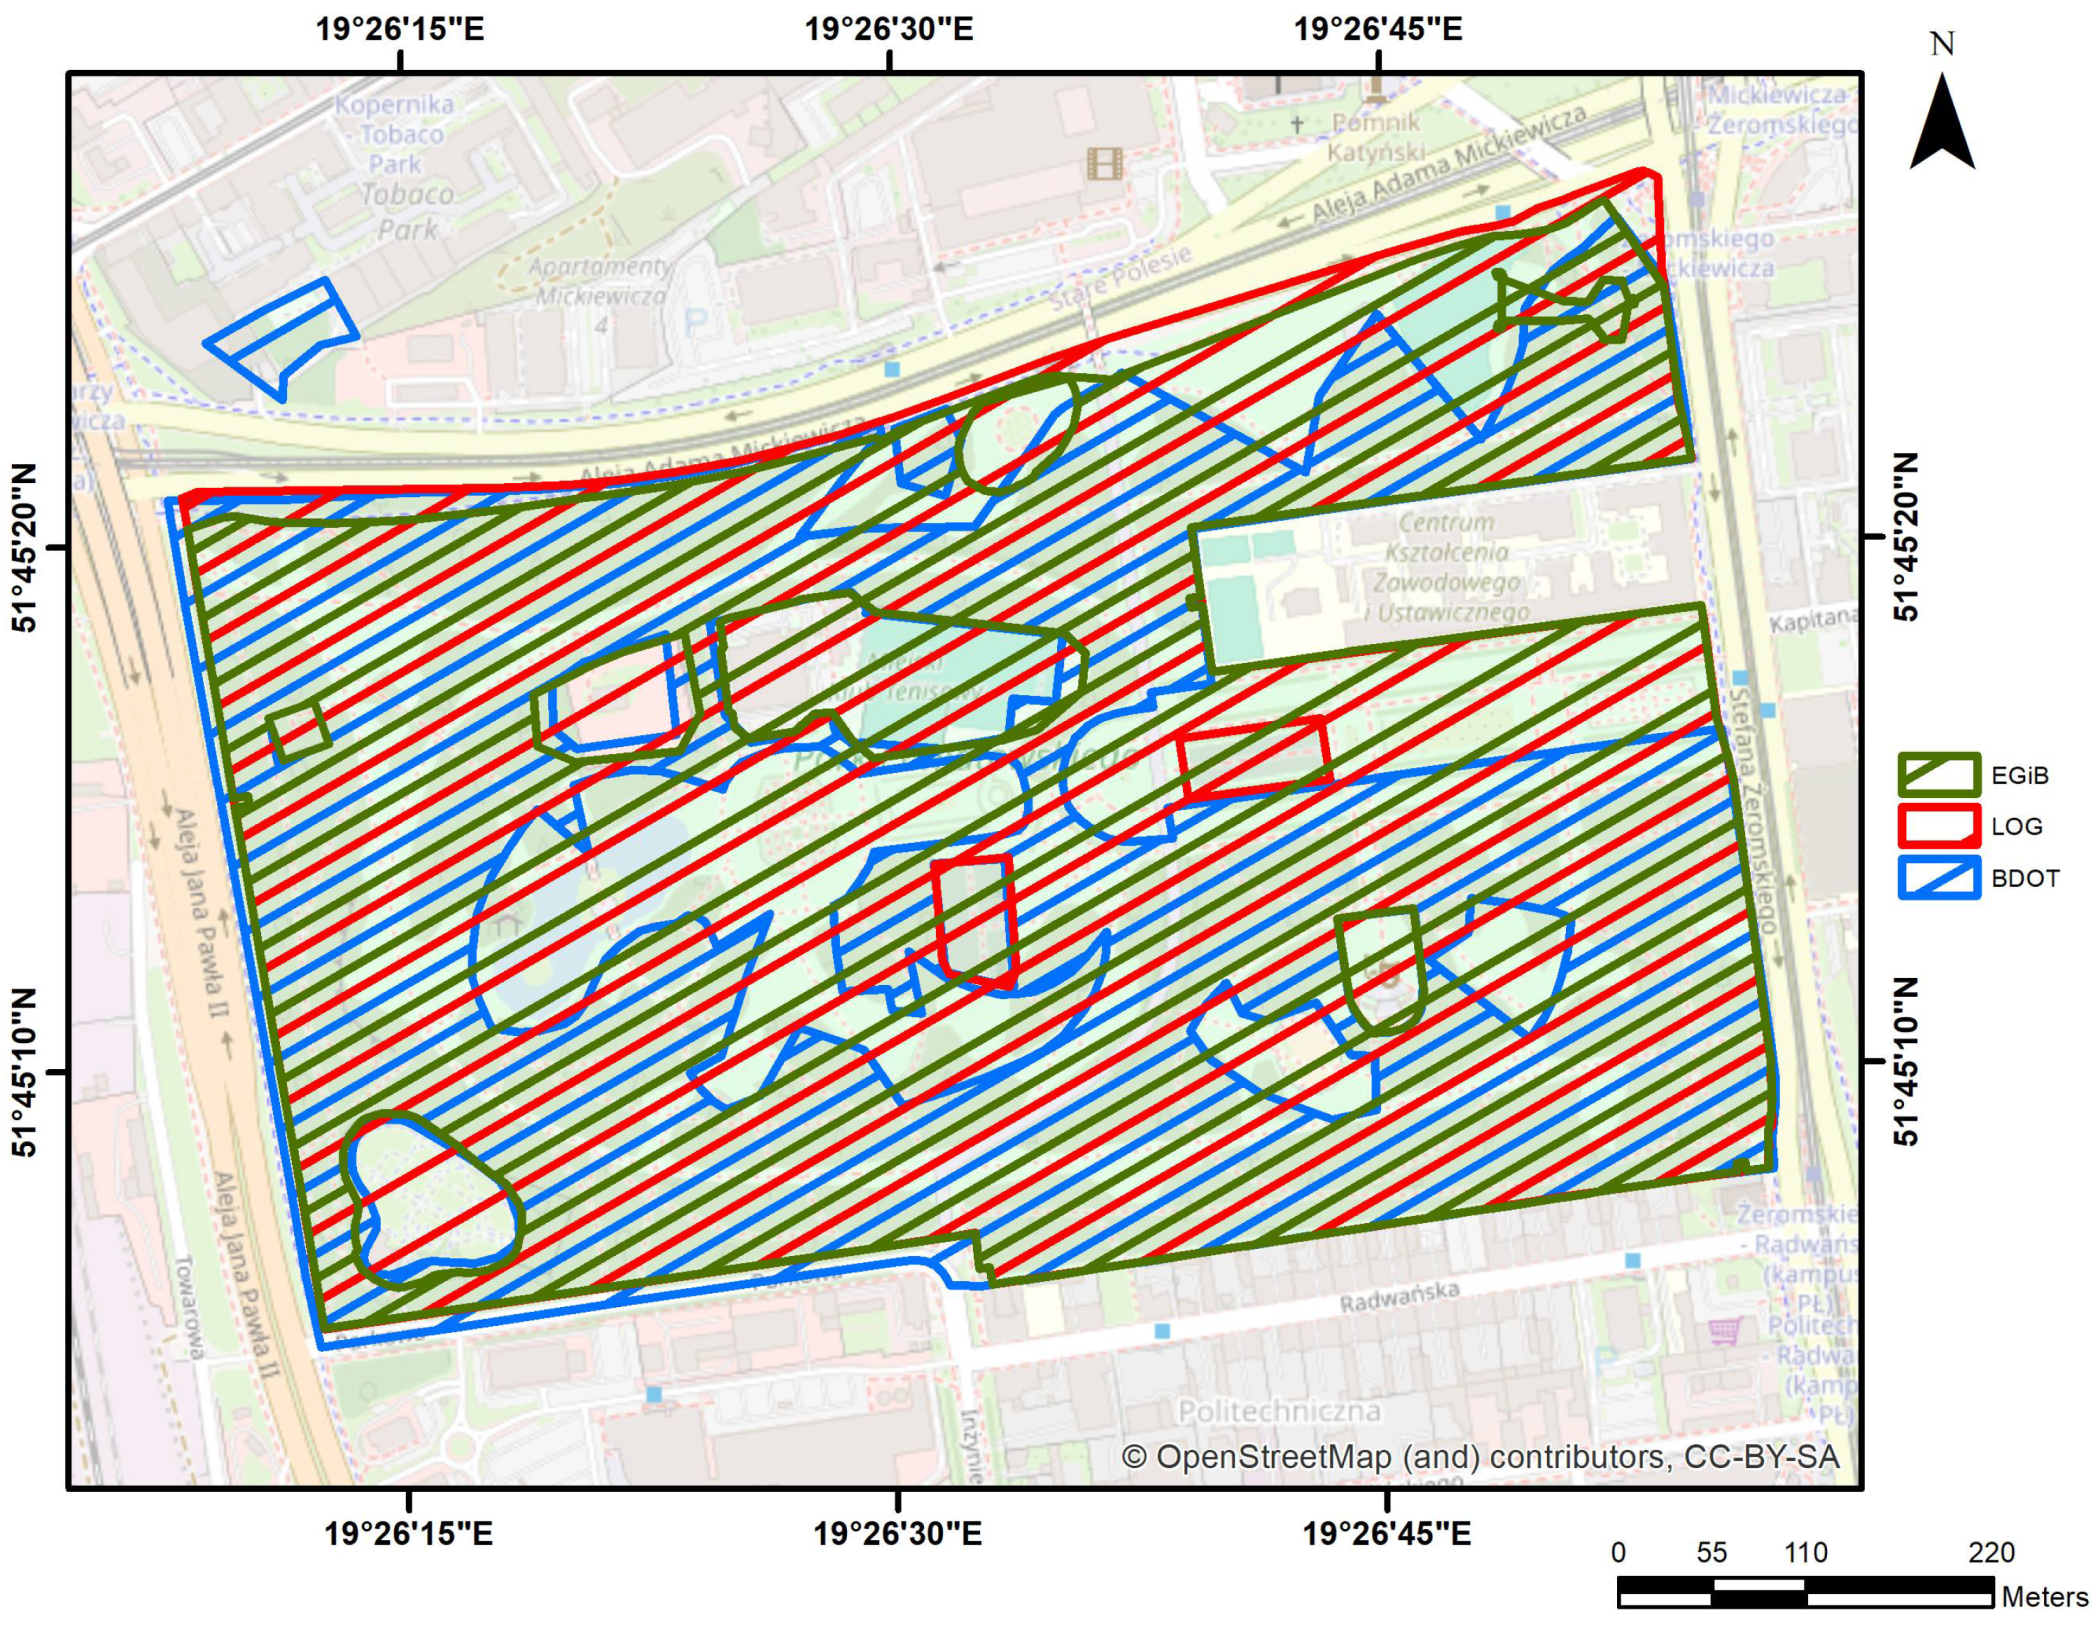
Figure 2.
Comparison of boundaries of green areas according to different databases.
Figure 2.
Comparison of boundaries of green areas according to different databases.
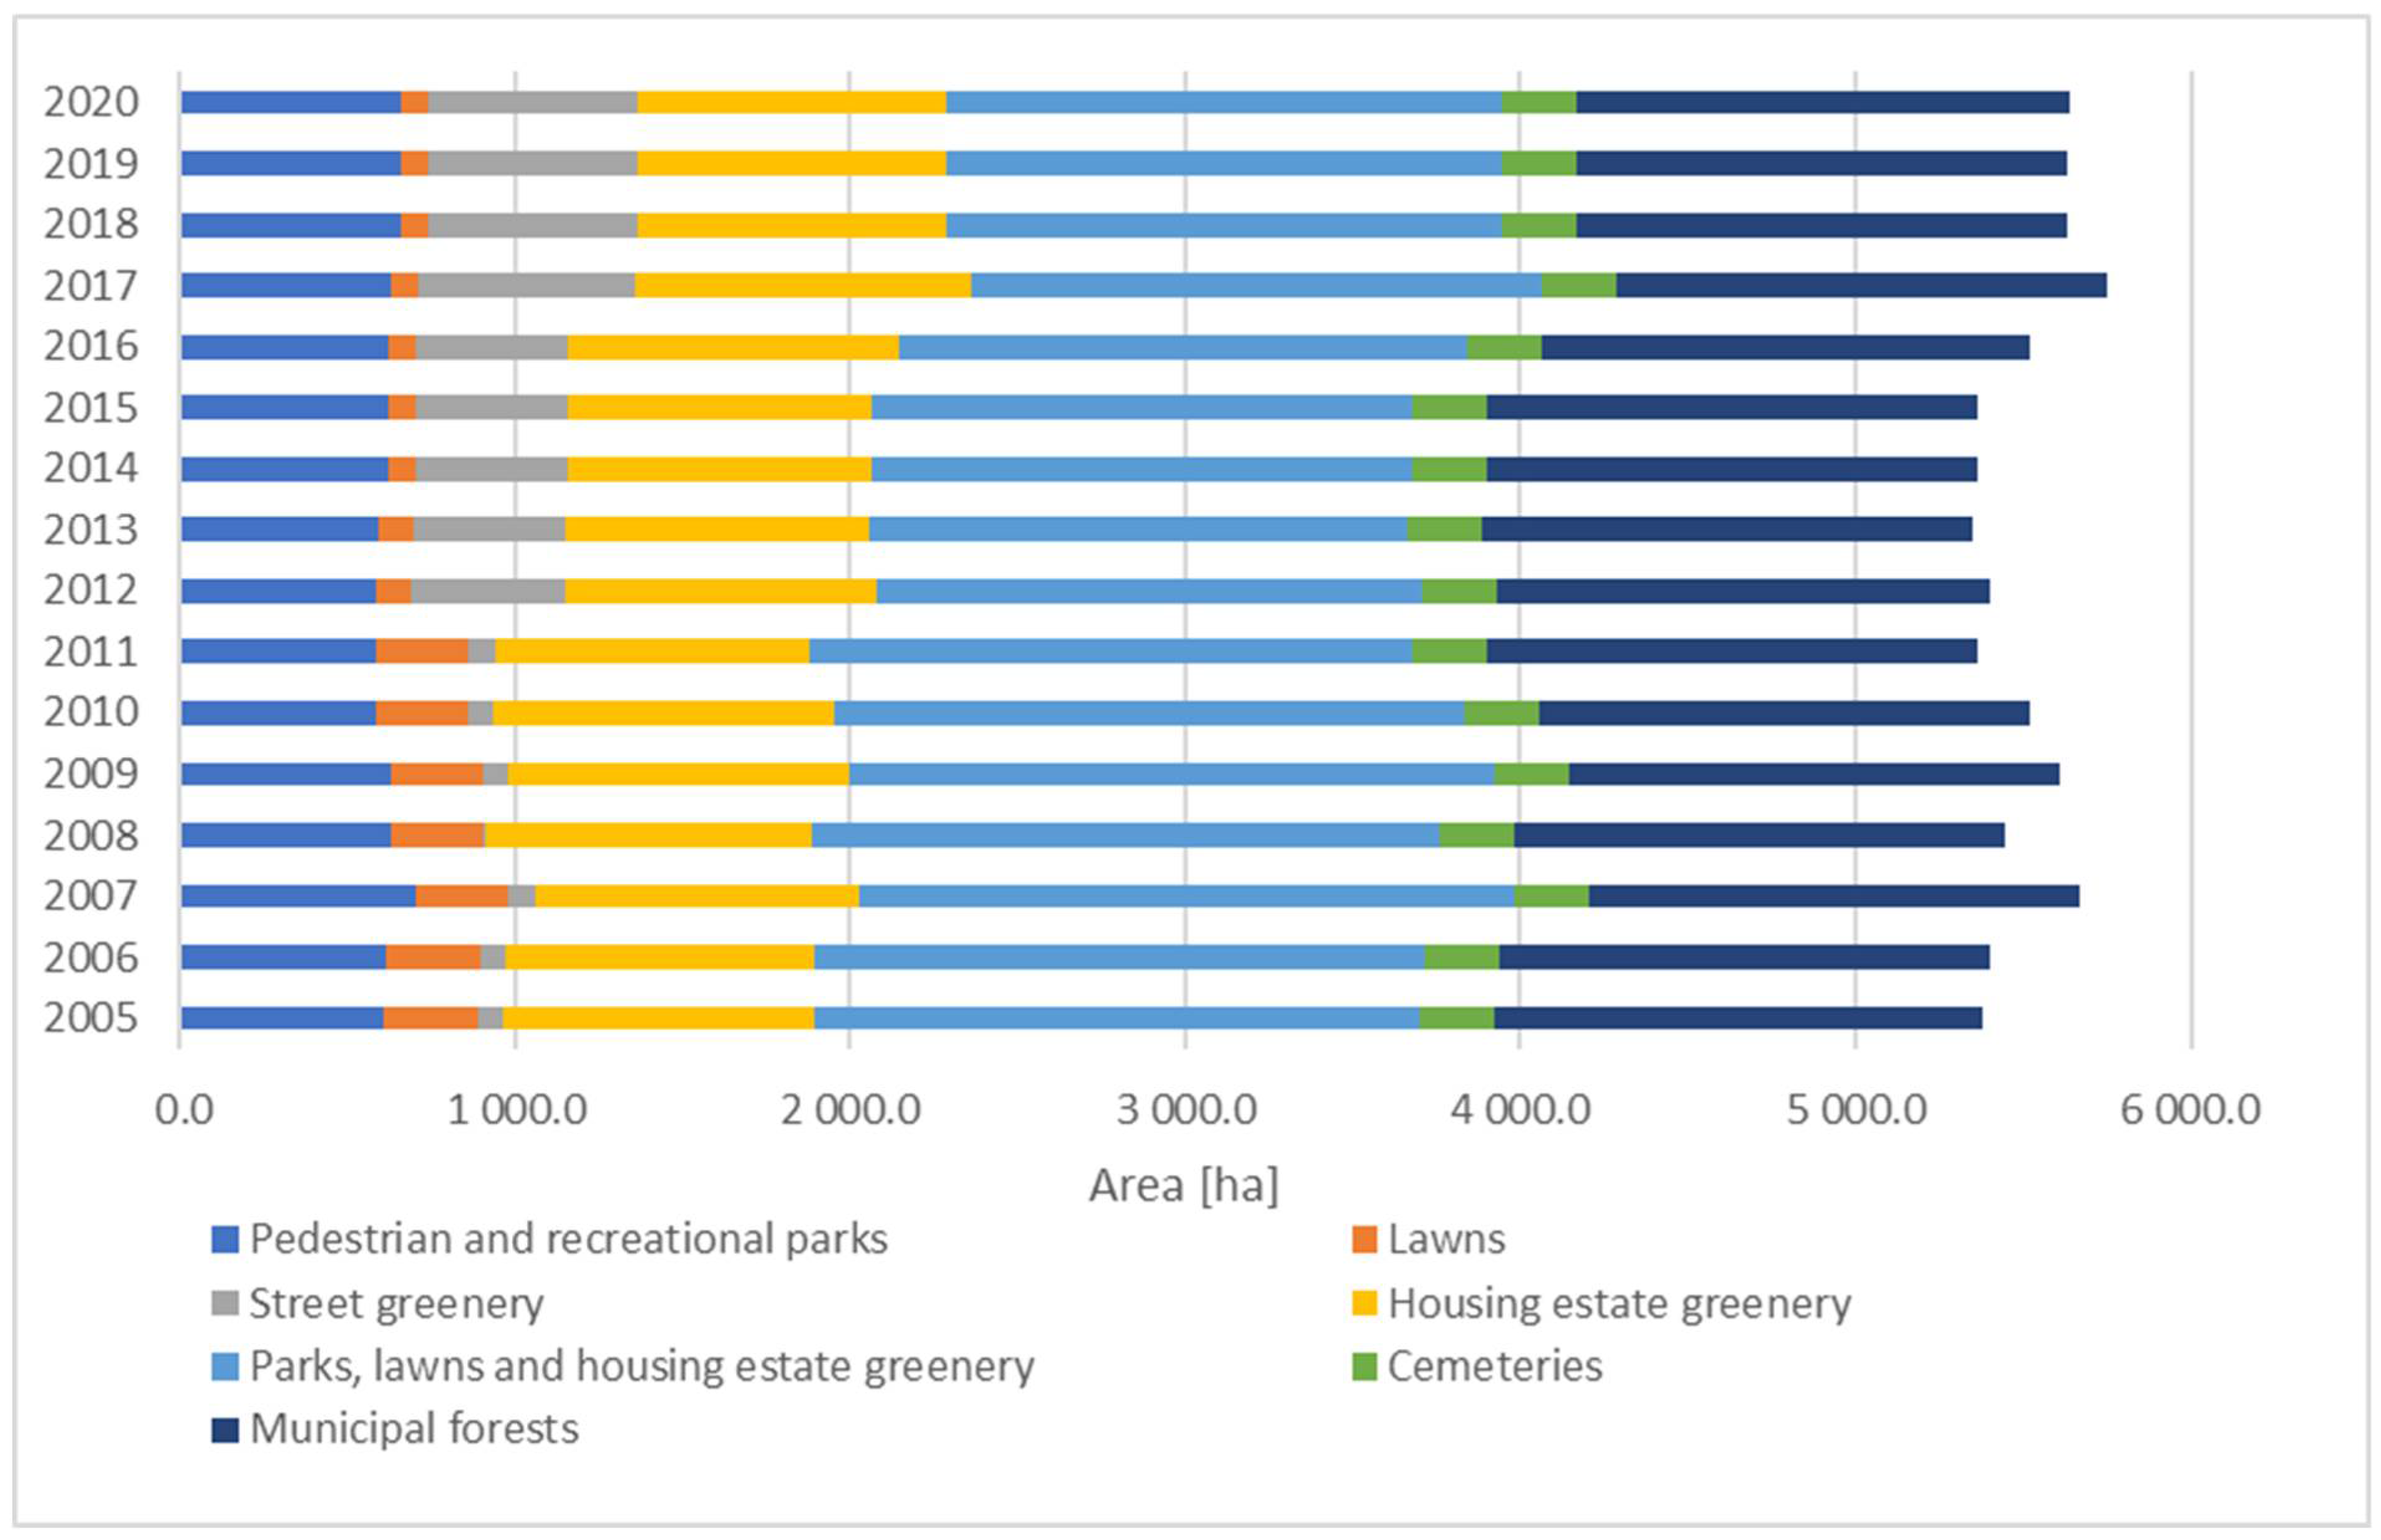
Figure 3.
Greenery in Łódź in 2005-2019.
Figure 3.
Greenery in Łódź in 2005-2019.
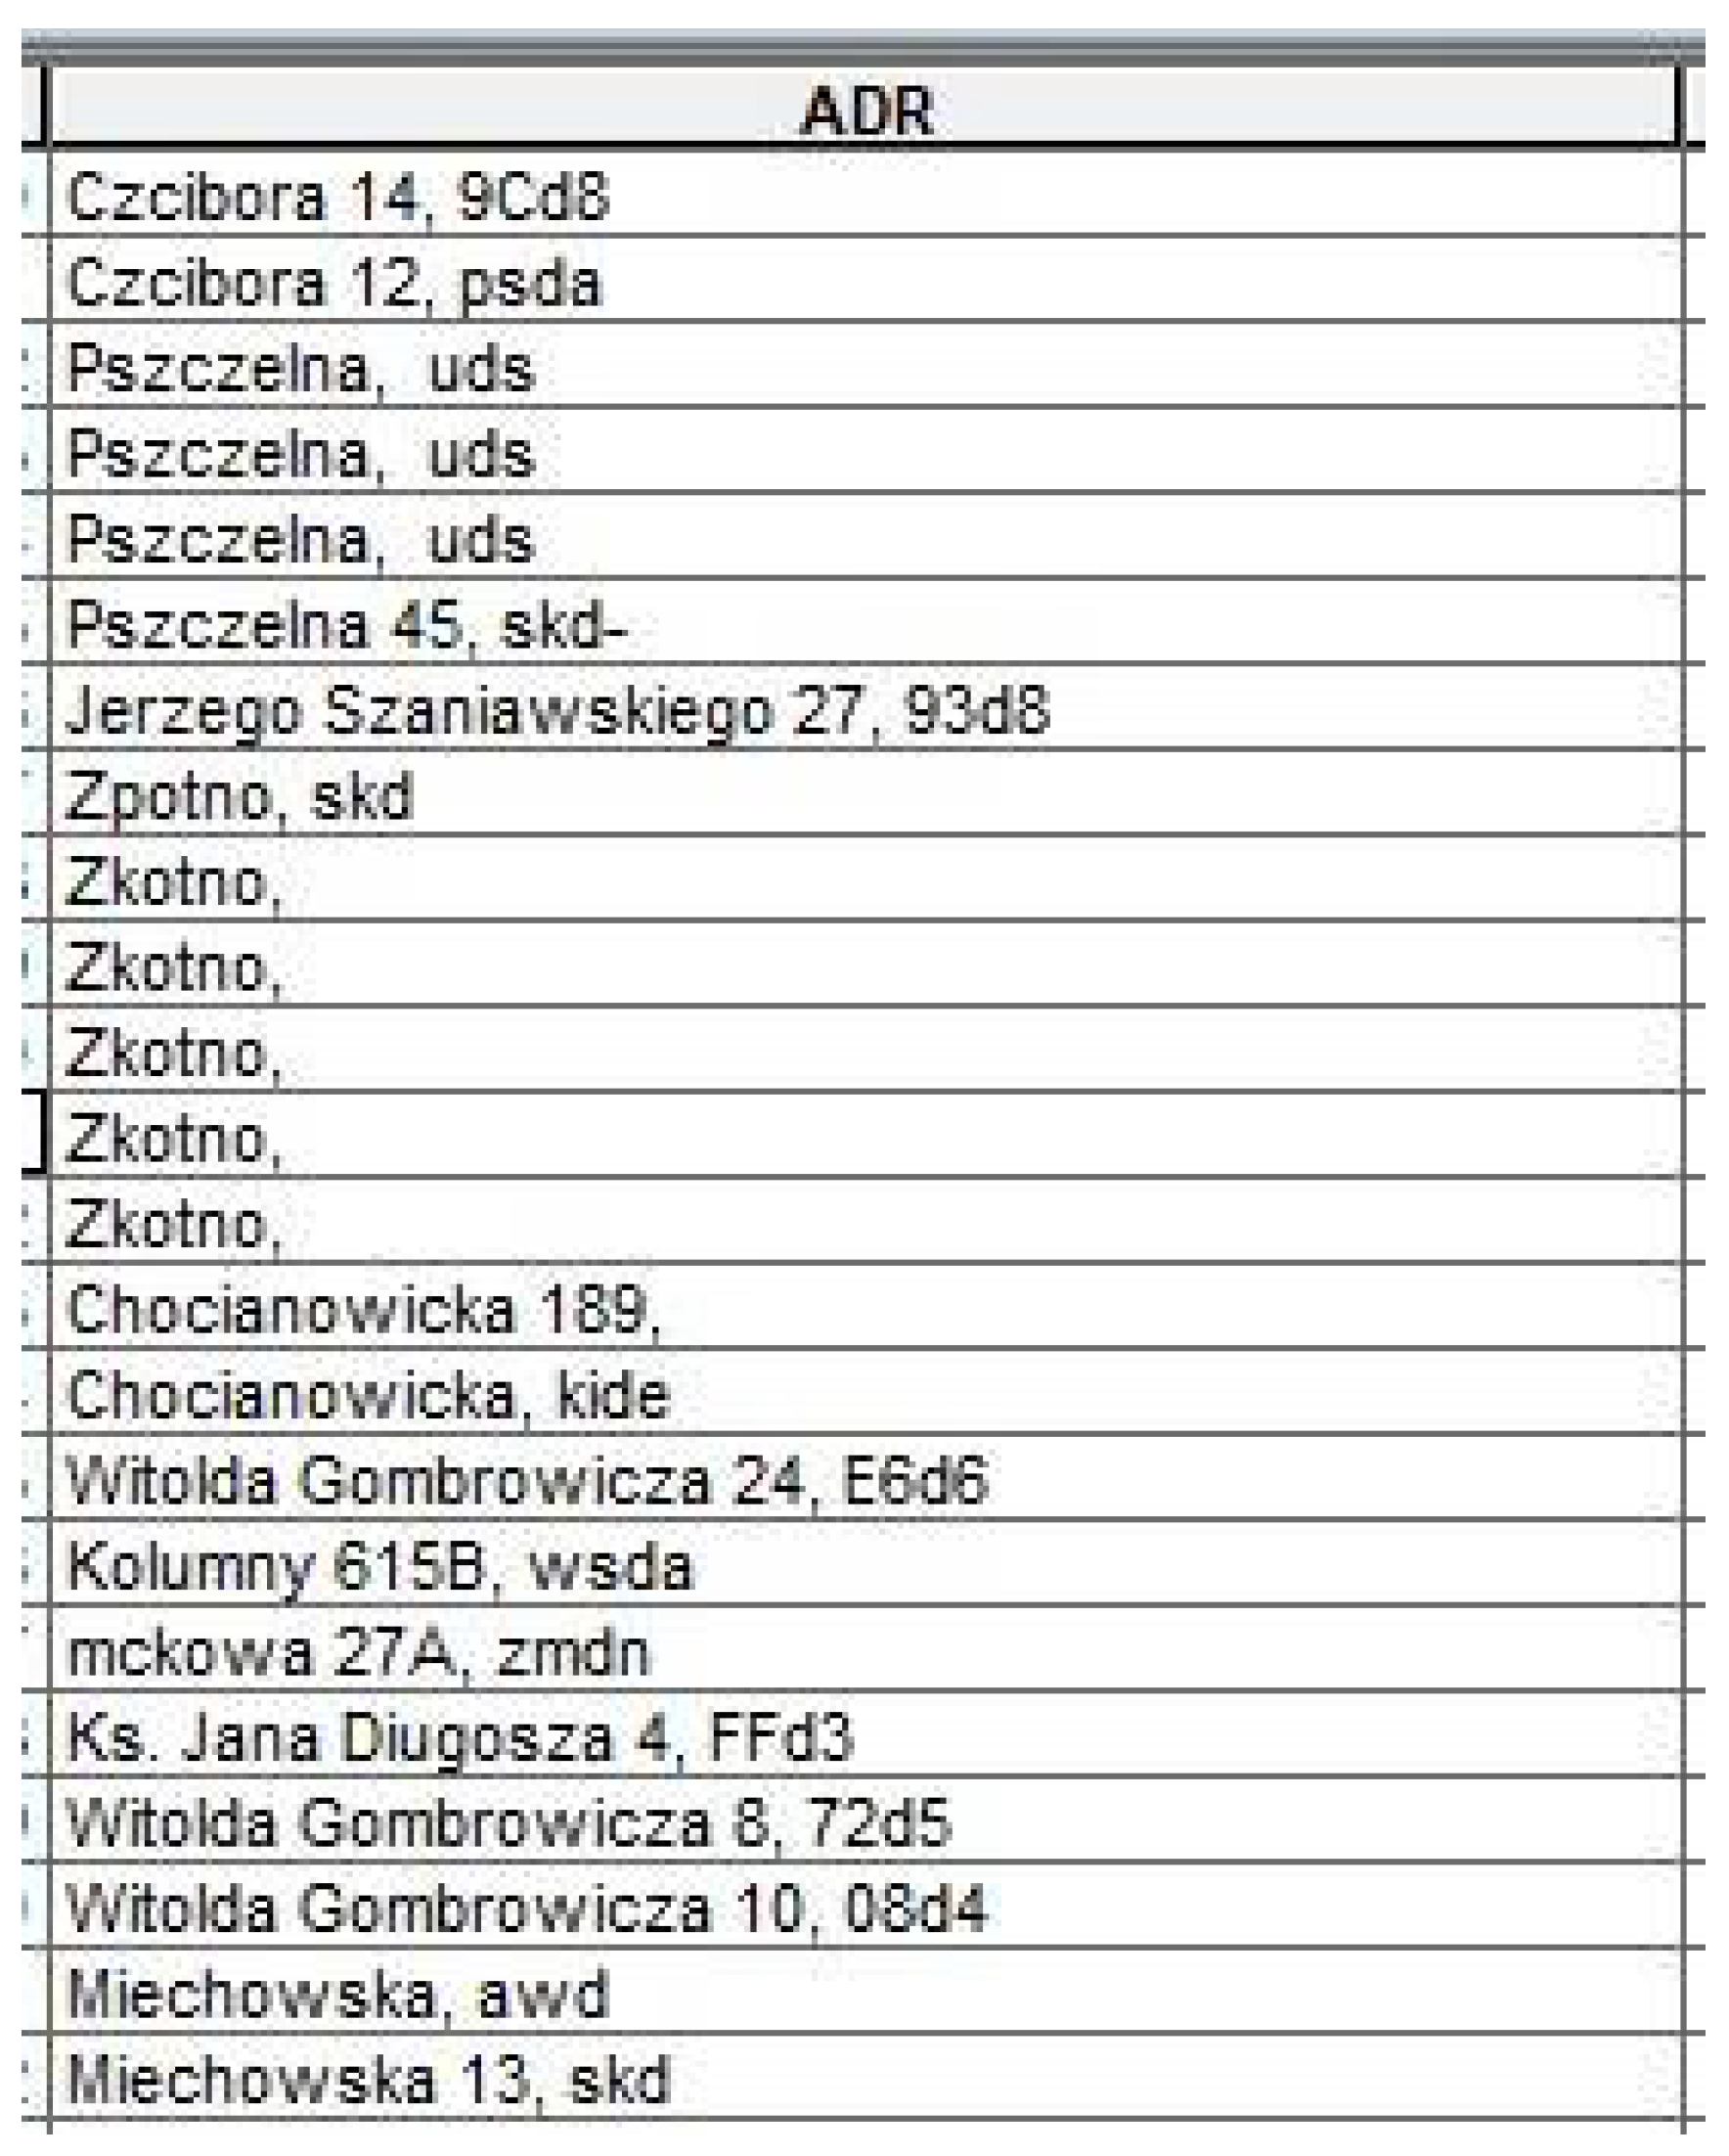
Figure 4.
An example of negligence of data in the PESEL register (e.g. missing letters, different replacement for polish letters).
Figure 4.
An example of negligence of data in the PESEL register (e.g. missing letters, different replacement for polish letters).
Figure 5.
Reflection, transmission and absorption of radiation by the vegetation layer. For better readability of the drawing, the symbols of light fluxes have been changed, i.e. ΦRi = Ri, ΦAi = Ai, ΦTi = Ti. Refraction angles are not taken into account.
Figure 5.
Reflection, transmission and absorption of radiation by the vegetation layer. For better readability of the drawing, the symbols of light fluxes have been changed, i.e. ΦRi = Ri, ΦAi = Ai, ΦTi = Ti. Refraction angles are not taken into account.
Figure 6.
Measures describing the components of GI formula.
Figure 6.
Measures describing the components of GI formula.
Figure 7.
Interrelationships of the NDVI and the height of vegetation: the NDVI indicator after exceeding the saturation point (hsat, NDVIsat) does not increase in proportion to the increase in the height of the vegetation layer, line a indicates the limit of dying of tree branches due to lack of light energy supply, line b indicates the height to which the tree urban roads are stripped of their branches to ensure visibility and communication.
Figure 8.
Dependence of NDVI on the average height of greenery in basic fields, where the greenery covered these fields 100%.
Figure 8.
Dependence of NDVI on the average height of greenery in basic fields, where the greenery covered these fields 100%.
Figure 9.
Spatial distribution of greenness index values in Łódź.
Figure 9.
Spatial distribution of greenness index values in Łódź.
Figure 10.
Designated green areas using the Greenness Index method.
Figure 10.
Designated green areas using the Greenness Index method.
Figure 11.
Spatial distribution of the GI Deficiency Index in Łódź.
Figure 11.
Spatial distribution of the GI Deficiency Index in Łódź.
Figure 12.
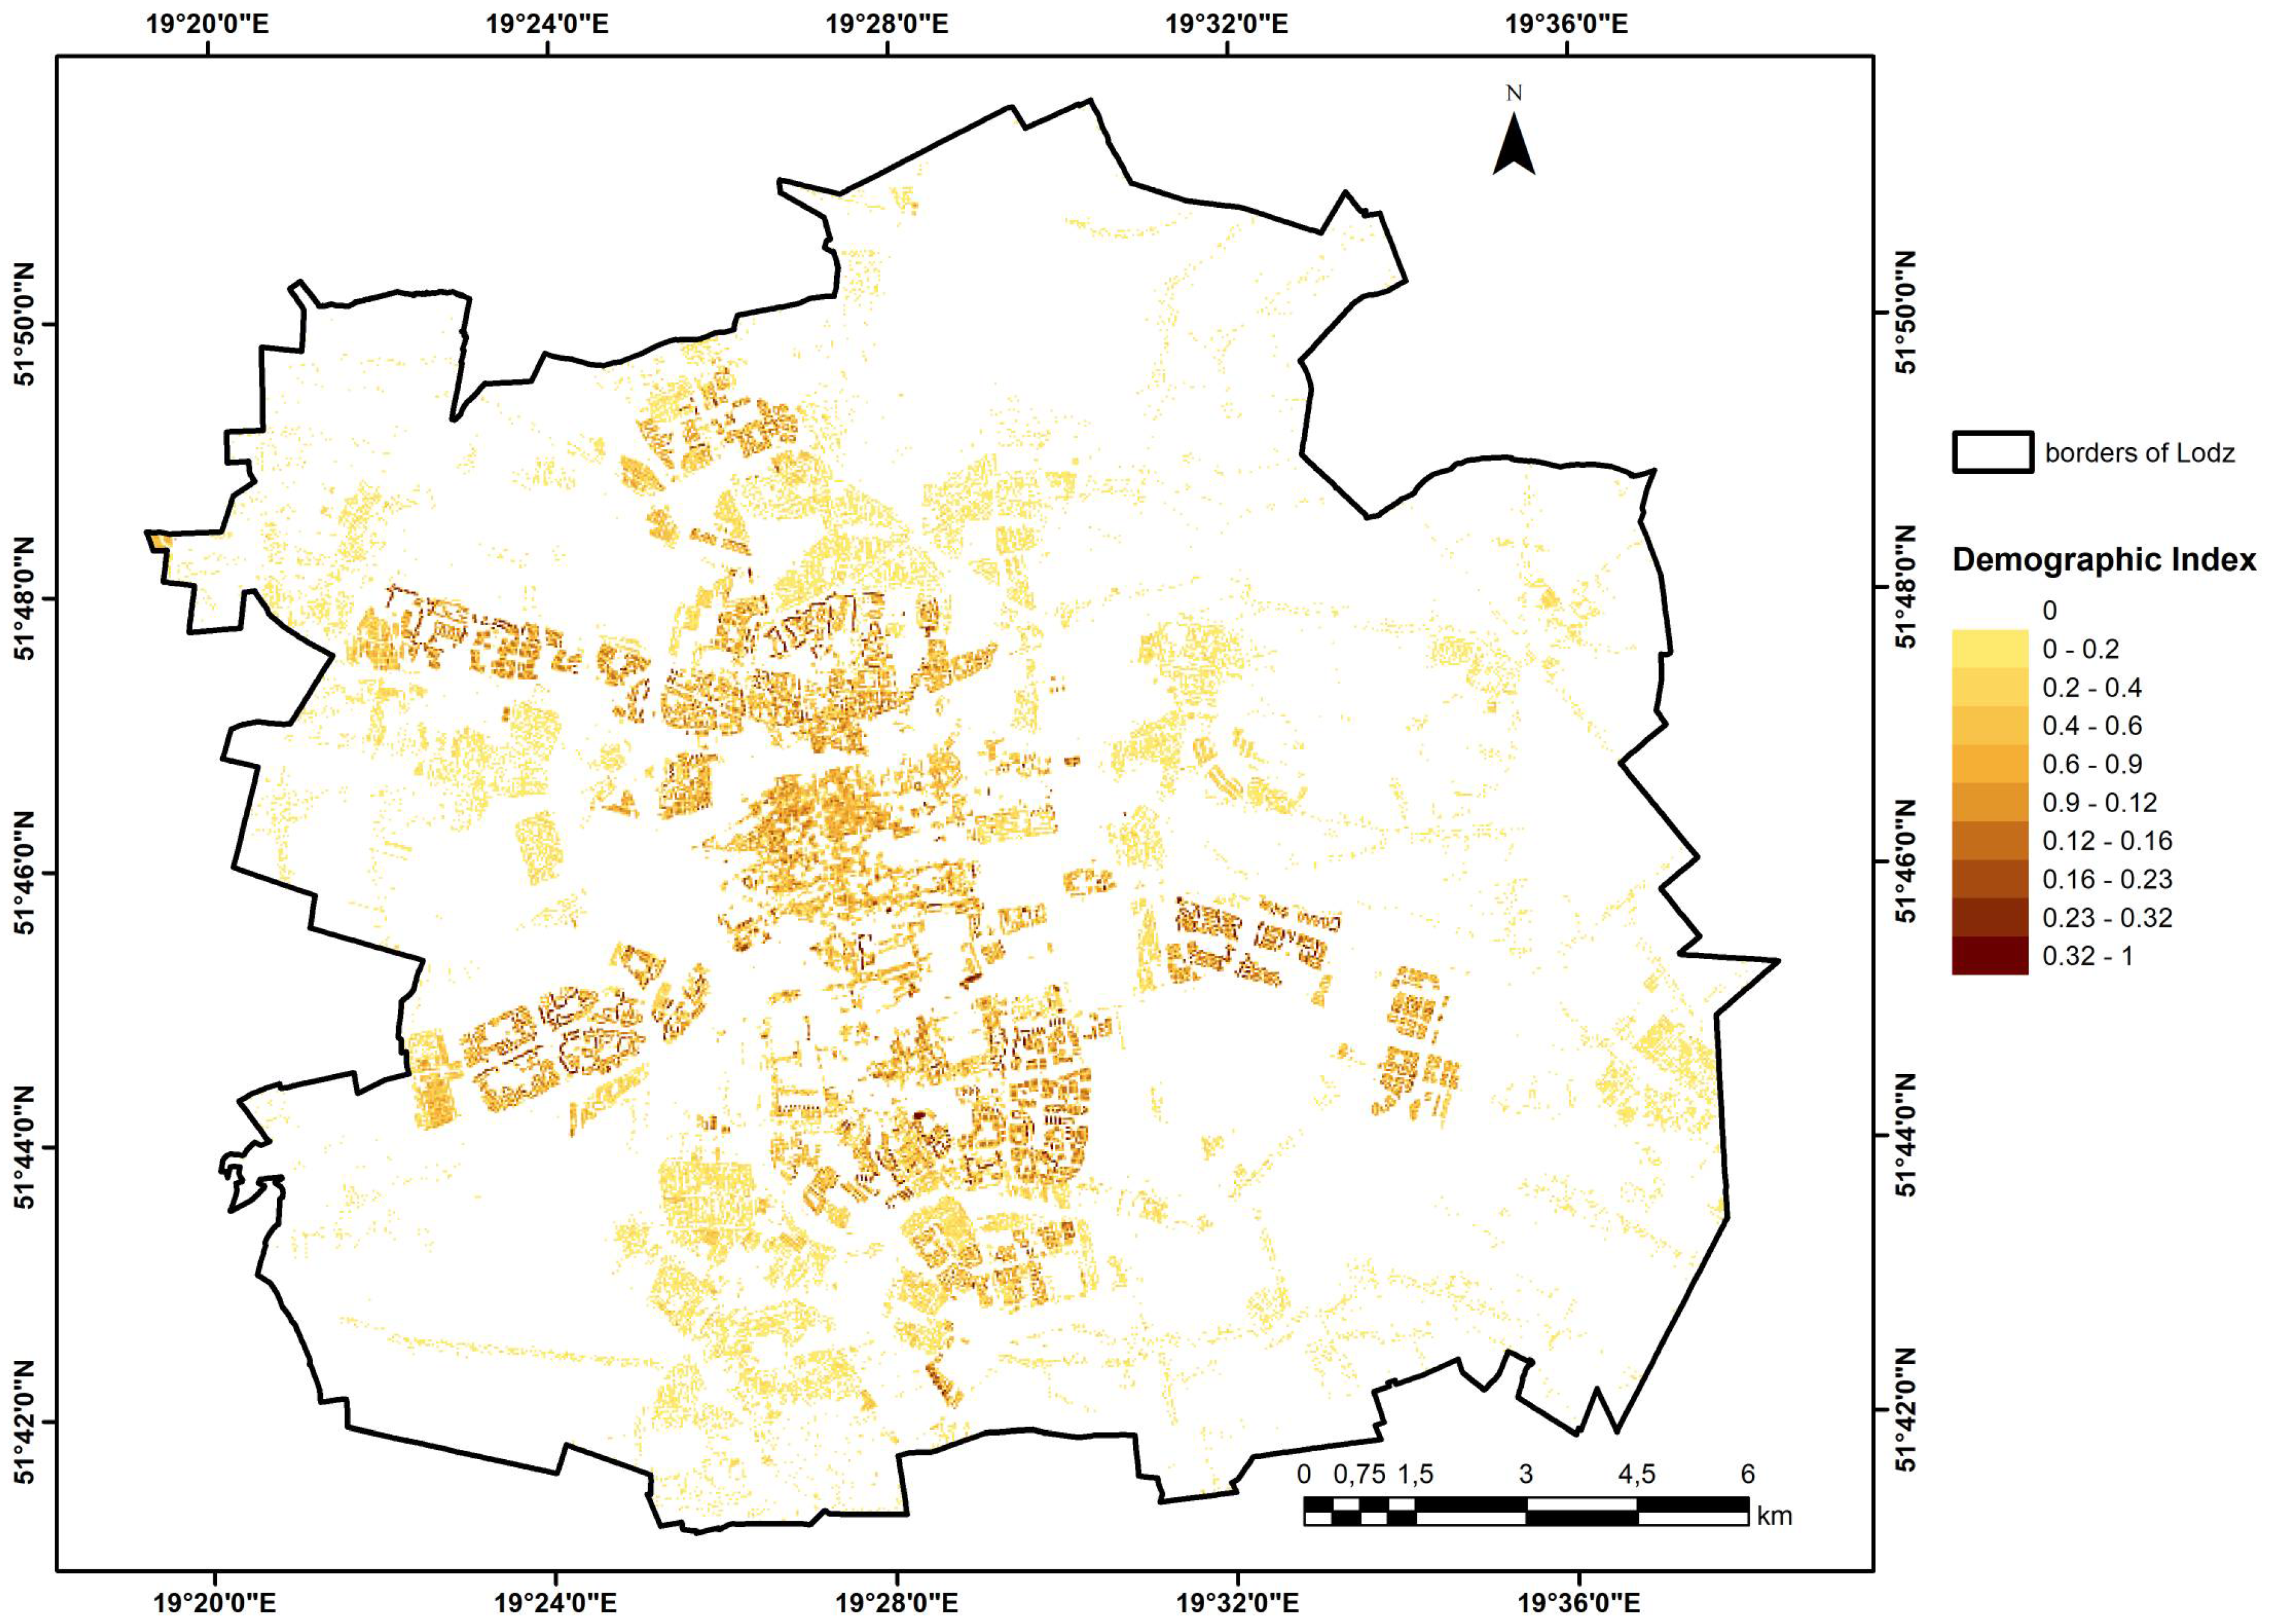
Inhabited pixels 30m×30m.
Figure 12.
Inhabited pixels 30m×30m.
Figure 13.
Inhabited pixels 30m×30m that are adjacent to a pixel with a GI>0.51.
Figure 13.
Inhabited pixels 30m×30m that are adjacent to a pixel with a GI>0.51.
Figure 14.
The Greenery Participation (GPI) in Lodz.
Figure 14.
The Greenery Participation (GPI) in Lodz.
Figure 15.
Comparison of boundaries of green areas according to different databases.
Figure 15.
Comparison of boundaries of green areas according to different databases.
Table 1.
Types of land use according to EGiB, corresponding abbreviations and their share in the entire area of the city of Łódź in 2021.
Table 1.
Types of land use according to EGiB, corresponding abbreviations and their share in the entire area of the city of Łódź in 2021.
| Type of use according to EGiB |
Shortcut |
Surface area [km2] |
% of the city |
| Residential areas |
B |
46.17 |
16.00 |
| Industrial areas |
Ba |
13.02 |
4.51 |
| Other built-up areas |
Bi |
24.36 |
8.44 |
| Urbanised undeveloped areas or under development |
Bp |
10.24 |
3.55 |
| Built-up agricultural land |
Br |
6.34 |
2.20 |
| Recreational areas |
Bz |
10.95 |
3.79 |
| Roads |
dr |
30.84 |
10.69 |
| Ecological use |
E, E-W |
0.91 |
0.31 |
| Mining land use |
K |
1.07 |
0.37 |
| Forests |
Ls |
24.69 |
8.55 |
| Wooded and bushed land |
Lz |
3.77 |
1.31 |
| Wooded and bushed land on agricultural land |
Lzr |
0.11 |
0.04 |
| Wasteland |
N |
1.23 |
0.43 |
| Pastures |
PS |
6.66 |
2.31 |
| Arable land |
R |
92.60 |
32.08 |
| Orchards |
S |
2.57 |
0.89 |
| Other communication areas |
Ti |
2.78 |
0.96 |
| Railway areas |
Tk |
7.11 |
2.46 |
| Land reserved for the construction of public roads or railway lines |
Tp |
1.08 |
0.37 |
| Miscellaneous land |
Tr |
0.34 |
0.12 |
| Land under ditches |
W |
0.27 |
0.09 |
| Land under surface water flowing |
Wp |
1.21 |
0.42 |
| Land under surface water still |
Ws |
0.14 |
0.05 |
| Land under ponds |
Wsr |
0.19 |
0.06 |

