Submitted:
23 May 2024
Posted:
24 May 2024
You are already at the latest version
Abstract

Keywords:
1. Introduction
2. Results
2.1. London Dispersive Surface Energy of Solid Materials
2.2. Lewis’s Acid-Base Properties of Solid Materials
2.3. Polar Acid-Base Surface Energies of Graphenes and Carbon Fibers
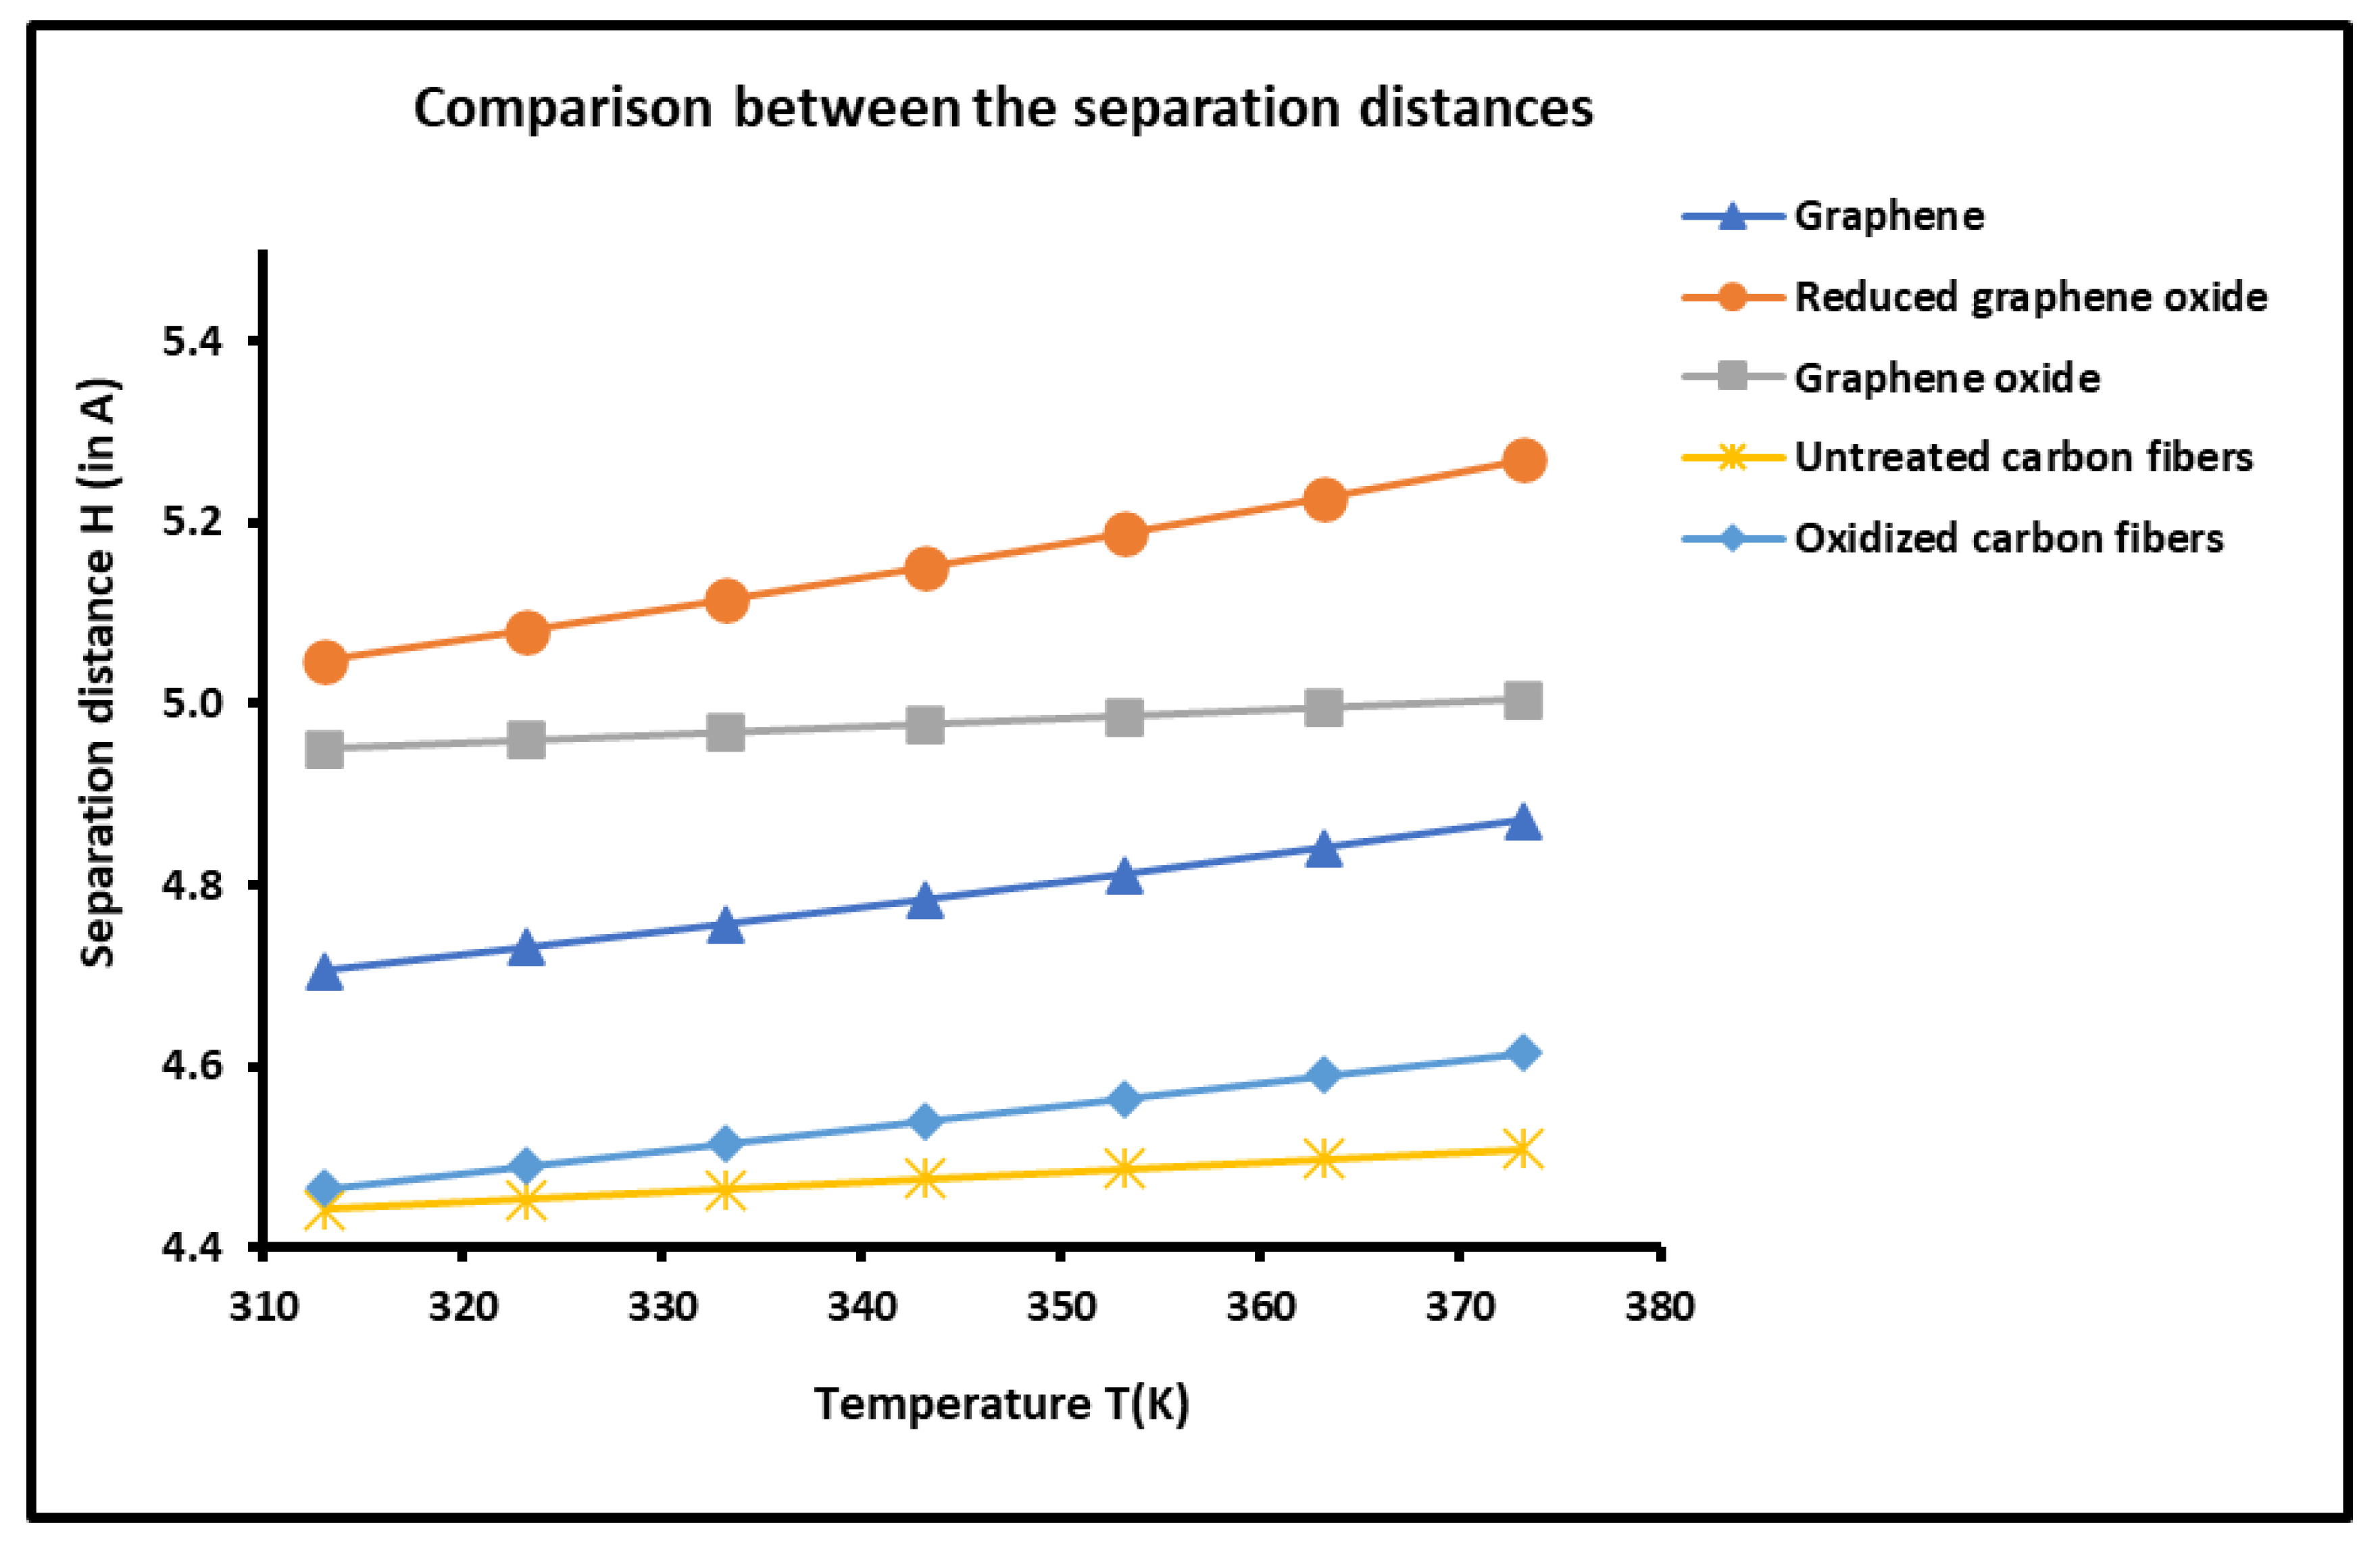
2.4. Determination of the Average Separation Distance H
3. Materials and Methods Thermal Model
4. Conclusions
Supplementary Materials
Funding
Informed Consent Statement
Data Availability Statement
Conflicts of Interest
References
- Balandin, A. Thermal properties of graphene and nanostructured carbon materials. Nature Mater 10, 569–581 (2011). [CrossRef]
- Novoselov, K. S. et al. Electric field effect in atomically thin carbon films. Science 306, 666–669 (2004).
- Geim, A. K. & Novoselov, K. S. The rise of graphene. Nature Mater. 6, 183–191 (2007).
- Novoselov, K. S. et al. Two-dimensional gas of massless Dirac fermions in graphene. Nature 438, 197–200 (2005).
- Zhang, Y. B., Tan, Y. W., Stormer, H. L. & Kim, P. Experimental observation of the quantum Hall effect and Berry’s phase in graphene. Nature 438, 201–204 (2005).
- Balandin, A.A.; Ghosh, S.; Bao, W.; Calizo, I.; Teweldebrhan, D.; Miao, F.; Lau, C.N. Superior thermal conductivity of single-layer graphene, Nano Lett., 2008, 8, 902-907. [CrossRef]
- Ghosh, S. et al. Extremely high thermal conductivity in graphene: Prospects for thermal management application in nanoelectronic circuits. Appl. Phys. Lett. 92, 151911 (2008).
- Calizo, I., Balandin, A. A., Bao, W., Miao, F. & Lau, C. N. Temperature dependence of the Raman spectra of graphene and graphene multilayers. Nano Lett. 7, 2645–2649 (2007).
- Ghosh, S. et al. Thermal properties of polycrystalline graphene films and reduced graphene-oxide films. MRS Proc. S6.2, 198 (2010).
- Kole, M.; Dey, T.K. Investigation of thermal conductivity, viscosity, and electrical conductivity of graphene based nanofluids. J. Appl. Phys., 2013. [CrossRef]
- Kumar, P.V.; Bardhan; N.M.; Tongay, S.; Wu, J.; Belcher, A.M.; Grossman, J.C. Scalable enhancement of graphene oxide properties by thermally driven phase transformation. Nat. Chem., 2014, 6, 151–158. [CrossRef]
- Lee, J.W.; Ko, J.M.; Kim, J.-D. Hydrothermal preparation of nitrogen-doped graphene sheets via hexamethylenetetramine for application as supercapacitor electrodes. Electrochim Acta, 2012, 85, 459–466. [CrossRef]
- Novoselov, K.; Fal′ko, V.; Colombo, L.; Gellert, P.R.; Schwab, M.G.; Kim, K. A roadmap for graphene. Nature 490, 192–200 (2012). [CrossRef]
- Lopez Paz, I., Godignon, P., Moffat, N. et al. Position-resolved charge collection of silicon carbide detectors with an epitaxially-grown graphene layer. Sci Rep 14, 10376 (2024). [CrossRef]
- Dai, J.; Wang, G.; Wu, C. Progress in Surface Properties and the Surface Testing of Graphene. Journal of Advances in Physical Chemistry 2016, 05 (02), 48-57. [CrossRef]
- Amanda, S. B. & Ian, K. S. Thermal stability of graphene edge structure and graphene nanoflakes. J. Chem. Phys. 128, 094707 (2008).
- Xiong, Z., Yu, P., Liang, Q. et al. Rapid microwave reduction of electrochemically-derived graphene oxide for high-crystalline graphene membranes. Sci. China Mater. 66, 4733–4741 (2023). [CrossRef]
- Liu, J., Li, Q. & Xu, S. Reinforcing mechanism of graphene and graphene oxide sheets on cement-based materials. J. Mater. Civ. Eng. 31, 04019014 (2019).
- Kumuda, S., Gandhi, U., Mangalanathan, U. et al. Synthesis and characterization of graphene oxide and reduced graphene oxide chemically reduced at different time duration. J Mater Sci: Mater Electron 35, 637 (2024). [CrossRef]
- Shiren Wang, Yue Zhang, Noureddine Abidi, and Luis Cabrales, Wettability and Surface Free Energy of Graphene Films, Langmuir 2009, 25 (18), 11078-11081. [CrossRef]
- Dai, J.; Wang, G.; Wu, C. Investigation of the Surface Properties of Graphene Oxide and Graphene by Inverse Gas Chromatography. Chromatographia 2014, 77 (3-4), 299-307. [CrossRef]
- Hamieh, T. Study of the temperature effect on the surface area of model organic molecules, the dispersive surface energy and the surface properties of solids by inverse gas chromatography. J. Chromatogr. A 2020, 1627, 461372.
- Hamieh, T.; Ahmad, A.A.; Roques-Carmes, T.; Toufaily, J. New approach to determine the surface and interface thermodynamic properties of H-β-zeolite/rhodium catalysts by inverse gas chromatography at infinite dilution. Sci. Rep. 2020, 10, 20894.
- Hamieh, T. New methodology to study the dispersive component of the surface energy and acid–base properties of silica particles by inverse gas chromatography at infinite dilution. J. Chromatogr. Sci. 2022, 60, 126–142. [CrossRef]
- Hamieh, T. Some Irregularities in the Evaluation of Surface Parameters of Solid Materials by Inverse Gas Chromatography. Langmuir 2023, 39, 17059–17070. [CrossRef]
- Hamieh, T. Inverse Gas Chromatography to Characterize the Surface Properties of Solid Materials. Chem. Mater. 2024, 36, 5, 2231–2244. [CrossRef]
- Lee, S.-Y.; Lee, J.-H.; Kim, Y-H.; Mahajan, R. L.; Park, S.-J. Surface energetics of graphene oxide and reduced graphene oxide determined by inverse gas chromatographic technique at infinite dilution at room temperature, Journal of Colloid and Interface Science, 2022, 628, 758-768. [CrossRef]
- Papadopoulou, S.K.; Panayiotou, C. Assessment of the thermodynamic properties of poly(2,2,2-trifluoroethyl methacrylate) by inverse gas chromatography. J. Chromatogr. A 2014, 1324, 207–214.
- Voelkel, A.; Strzemiecka, B.; Adamska, K.; Milczewska, K. Inverse gas chromatography as a source of physiochemical data. J. Chromatogr. A 2009, 1216, 1551.
- Al-Saigh, Z.Y.; Munk, P. Study of polymer-polymer interaction coefficients in polymer blends using inverse gas chromatography, Macromolecules 1984, 17, 803.
- Dritsas, G.S.; Karatasos, K.; Panayiotou, C. Investigation of thermodynamic properties of hyperbranched aliphatic polyesters by inverse gas chromatography, J. Chromatogr. A 2009, 1216, 8979.
- Papadopoulou, S.K.; Panayiotou, C. Thermodynamic characterization of poly(1,1,1,3,3,3-hexafluoroisopropyl methacrylate) by inverse gas chromatography. J. Chromatogr. A 2012, 1229, 230.
- Coimbra, P.; Coelho, M. S.N.; Gamelas, J. A.F. Surface characterization of polysaccharide scaffolds by inverse gas chromatography regarding application in tissue engineering, Surface and Interface Analysis, 2019, 51 (11), 1070 – 1077.
- Kołodziejek, J.; Voelkel, A.; Heberger, K. Characterization of hybrid materials by means of inverse gas chromatography and chemometrics. J. Pharm. Sci. 2013, 102, 1524.
- Belgacem, M.N.; Czeremuszkin, G.; Sapieha, S.; Gandini, A. Surface by XPS characterization and inverse gas of cellulose fibres chromatography. Cellulose 1995, 2, 145–157.
- Ryan, H.M.; Douglas, J.G.; Rupert, W. Inverse Gas Chromatography for Determining the Dispersive Surface Free Energy and Acid–Base Interactions of Sheet Molding Compound-Part II 14 Ligno-Cellulosic Fiber Types for Possible Composite Reinforcement. J. Appl. Polym. Sci. 2008, 110, 3880–3888.
- Jacob, P.N.; Berg, J.C. Acid-base surface energy characterization of microcrystalline cellulose and two wood pulp fiber types using inverse gas chromatography. Langmuir 1994, 10, 3086–3093.
- Carvalho, M.G.; Santos, J.M.R.C.A.; Martins, A.A.; Figueiredo, M.M. The Effects of Beating, Web Forming and Sizing on the Surface Energy of Eucalyptus globulus Kraft Fibres Evaluated by Inverse Gas Chromatography. Cellulose 2005, 12, 371–383.
- Chtourou, H.; Riedl, B.; Kokta, B.V. Surface characterizations of modified polyethylene pulp and wood pulps fibers using XPS and inverse gas chromatography. J. Adhesion Sci. Tech. 1995, 9, 551–574.
- Donnet, J.B.; Park, S.J.; Balard, H. Evaluation of specific interactions of solid surfaces by inverse gas chromatography. Chromatographia 1991, 31, 434–440.
- Donnet, J.B.; Custodéro, E.; Wang, T.K.; Hennebert, G. Energy site distribution of carbon black surfaces by inverse gas chromatography at finite concentration conditions. Carbon 2002, 40, 163–167. [CrossRef]
- Gamble, J.F.; Davé, R.N.; Kiang, S.; Leane, M.M.; Tobyn, M.; Wang, S.S.Y. Investigating the applicability of inverse gas chromatography to binary powdered systems: An application of surface heterogeneity profiles to understanding preferential probe-surface interactions. Int. J. Pharm. 2013, 445, 39–46.
- Balard, H.; Maafa, D.; Santini, A.; Donnet, J.B. Study by inverse gas chromatography of the surface properties of milled graphites. J. Chromatogr. A 2008, 1198–1199, 173–180.
- Bogillo, V.I.; Shkilev, V.P.; Voelkel, A. Determination of surface free energy components for heterogeneous solids by means of inverse gas chromatography at finite concentrations. J. Mater. Chem. 1998, 8, 1953–1961.
- Das, S.C.; Zhou, Q.; Morton, D.A.V.; Larson, I.; Stewart, P.J. Use of surface energy distributions by inverse gas chromatography to understand mechanofusion processing and functionality of lactose coated with magnesium stearate. Eur. J. Pharm. Sci. 2011, 43, 325–333.
- Das, S.C.; Stewart, P.J. Characterising surface energy of pharmaceutical powders by inverse gas chromatography at finite dilution. J. Pharm. Pharmacol. 2012, 64, 1337–1348.
- Bai, W.; Pakdel, E.; Li, Q.; Wang, J.; Tang, W.; Tang, B.; Wang, X. Inverse gas chromatography (IGC) for studying the cellulosic materials surface characteristics: A mini review, Cellulose, 2023, 30, 3379–3396. [CrossRef]
- Dong, S.; Brendlé, M.; Donnet, J.B. Study of solid surface polarity by inverse gas chromatography at infinite dilution. Chromatographia 1989, 28, 469–472.
- Gamble, J.F.; Leane, M.; Olusanmi, D.; Tobyn, M.; Supuk, E.; Khoo, J.; Naderi, M. Surface energy analysis as a tool to probe the surface energy characteristics of micronized materials—A comparison with inverse gas chromatography. Int. J. Pharm. 2012, 422, 238–244.
- Newell, H.E.; Buckton, G.; Butler, D.A.; Thielmann, F.; Williams, D.R. The use of inverse gas chromatography to measure the surface energy of crystalline, amorphous, and recently milled lactose. Pharm. Res. 2001, 18, 662–666.
- Newell, H.E.; Buckton, G. Inverse gas chromatography: Investigating whether the technique preferentially probes high energy sites for mixtures of crystalline and amorphous lactose. Pharm. Res. 2004, 21, 1440–1444.
- Kołodziejek, J.; Głowka, E.; Hyla, K.; Voelkel, A.; Lulek, J.; Milczewska, K. Relationship between surface properties determined by inverse gas chromatography and ibuprofen release from hybrid materials based on fumed silica. Int. J. Pharm. 2013, 441, 441–448.
- Ho, R.; Hinder, S.J.; Watts, J.F.; Dilworth, S.E.; Williams, D.R.; Heng, J.Y.Y. Determination of surface heterogeneity of D-mannitol by sessile drop contact angle and finite concentration inverse gas chromatography. Int. J. Pharm. 2010, 387, 79–86.
- Sesigur, F.; Sakar, D.; Yazici, O.; Cakar, F.; Cankurtaran, O.; Karaman, F. Dispersive Surface Energy and Acid-Base Parameters of Tosylate Functionalized Poly(ethylene glycol) via Inverse Gas Chromatography. J. Chem. 2014, 2014, 402325.
- Calvet, R.; Del Confetto, S.; Balard, H.; Brendlé, E.; Donnet, J.B. Study of the interaction polybutadiene/fillers using inverse gas chromatography. J. Chromatogr. A 2012, 1253, 164–170.
- Papadopoulou, S.K.; Dritsas, G.; Karapanagiotis, I.; Zuburtikudis, I.; Panayiotou, C. Surface characterization of poly(2,2,3,3,3-pentafluoropropyl methacrylate) by inverse gas chromatography and contact angle measurements Eur. Polym. J. 2010, 46, 202–208.
- Dritsas, G.S.; Karatasos, K.; Panayiotou, C. Investigation of thermodynamic properties of hyperbranched poly(ester amide) by inverse gas chromatography. J. Polym. Sci. Polym. Phys. 2008, 46, 2166–2172.
- Hamieh, T.; Rezzaki, M.; Schultz, J. Study of the transition temperatures and acid–base properties of poly (methyl methacrylate) adsorbed on alumina and silica, by using inverse gas chromatography technique. Colloids Surf. A Physicochem. Eng. Asp. 2001, 189, 279–291. [CrossRef]
- Hamieh, T.; Schultz, J. New approach to characterise physicochemical properties of solid substrates by inverse gas chromatography at infinite dilution. I. II. And III. J. Chromatogr. A 2002, 969, 17–47. [CrossRef]
- Hamieh, T. Temperature Dependence of the Polar and Lewis Acid–Base Properties of Poly Methyl Methacrylate Adsorbed on Silica via Inverse Gas Chromatography. Molecules 2024, 29, 1688. [CrossRef]
- Papirer, E.; Brendlé, E.; Ozil, F.; Balard, H. Comparison of the surface properties of graphite, carbon black and fullerene samples, measured by inverse gas chromatography. Carbon 1999, 37, 1265–1274. [CrossRef]
- Chung, D.L. Carbon Fiber Composites; Butterworth-Heinemann: Boston, MA, USA, 1994; pp. 3–65. [CrossRef]
- Donnet, J.B.; Bansal, R.C. Carbon Fibers, 2nd ed.; Marcel Dekker: New York, NY, USA, 1990; 584p. [CrossRef]
- Hamieh, T. Surface acid-base properties of carbon fibres. Adv. Powder Technol. 1997, 8, 279–289.
- Liu, Y.; Gu, Y.; Wang, S.; Li, M. Optimization for testing conditions of inverse gas chromatography and surface energies of various carbon fiber bundles. Carbon Lett. 2023, 33, 909–920. [CrossRef]
- Pal, A.; Kondor, A.; Mitra, S.; Thua, K.; Harish, S.; Saha, B.B. On surface energy and acid–base properties of highly porous parent and surface treated activated carbons using inverse gas chromatography. J. Ind. Eng. Chem. 2019, 69, 432–443. [CrossRef]
- Hamieh, T. New Physicochemical Methodology for the Determination of the Surface Thermodynamic Properties of Solid Particles. AppliedChem 2023, 3, 229–255. [CrossRef]
- Sawyer, D.T.; Brookman, D.J. Thermodynamically based gas chromatographic retention index for organic molecules using salt-modified aluminas and porous silica beads. Anal. Chem. 1968, 40, 1847–1850. [CrossRef]
- Saint-Flour, C.; Papirer, E. Gas-solid chromatography. A method of measuring surface free energy characteristics of short carbon fibers. 1. Through adsorption isotherms. Ind. Eng. Chem. Prod. Res. Dev. 1982, 21, 337–341. [CrossRef]
- Saint-Flour, C.; Papirer, E. Gas-solid chromatography: Method of measuring surface free energy characteristics of short fibers. 2. Through retention volumes measured near zero surface coverage. Ind. Eng. Chem. Prod. Res. Dev. 1982, 21, 666–669. [CrossRef]
- Basivi, P.K.; Hamieh, T.; Kakani, V.; Pasupuleti, V.R.; Sasikala, G.; Heo, S.M.; Pasupuleti, K.S.; Kim, M.-D.; Munagapati, V.S.; Kumar, N.S.; Wen, J.-H.; Kim, C.W. Exploring advanced materials: Harnessing the synergy of inverse gas chromatography and artificial vision intelligence, TrAC Trends in Analytical Chemistry, 2024, 173, 117655. [CrossRef]
- Brendlé, E.; Papirer, E. A new topological index for molecular probes used in inverse gas chromatography for the surface nanorugosity evaluation, 2. Application for the Evaluation of the Solid Surface Specific Interaction Potential. J. Colloid Interface Sci. 1997, 194, 217–224.
- Brendlé, E.; Papirer, E. A new topological index for molecular probes used in inverse gas chromatography for the surface nanorugosity evaluation, 1. Method of Evaluation. J. Colloid Interface Sci. 1997, 194, 207–216.
- Hamieh, T. The Effect of Temperature on the Surface Energetic Properties of Carbon Fibers Using Inverse Gas Chromatography. Crystals 2024, 14, 28. [CrossRef]
- Hamieh, T. New Progress on London Dispersive Energy, Polar Surface Interactions, and Lewis’s Acid–Base Properties of Solid Surfaces. Molecules 2024, 29, 949. [CrossRef]
- Hamieh, T. London Dispersive and Lewis Acid-Base Surface Energy of 2D Single-Crystalline and Polycrystalline Covalent Organic Frameworks. Crystals 2024, 14, 148. [CrossRef]
- Dai, J.; Wang, G; Ma, L., Wu C. Study on the surface energies and dispersibility of graphene oxide and its derivatives, J. Mater. Sci., 2015, 50, 3895–3907. [CrossRef]
- Baoqin Fu. Surface Energy of Diamond Cubic Crystals and Anisotropy Analysis Revealed by Empirical Electron Surface Models. Advances in Materials, 2019, 8 (2), 61-69. [CrossRef]
- Frank J. Z.; Hermenzo D. J. Surface energy and the size of diamond crystals, AIP Conf. Proc., 1996, 370, 163–166. [CrossRef]
- Zhang, J.-M.; Li, H.-Y.; Xu, K.-W. Ji, V. Calculation of surface energy and simulation of reconstruction for diamond cubic crystals (001) surface, Applied Surface Science, 2008, 254 (13), 4128-4133. [CrossRef]
- Jang, D.; Lee, S. Correlating thermal conductivity of carbon fibers with mechanical and structural properties, Journal of Industrial and Engineering Chemistry, 2020, 89, 115-118. [CrossRef]
- Kim, S.K. ; Bae, H.S.; Yu, J.; Kim S.Y. Thermal conductivity of polymer composites with the geometrical characteristics of graphene nanoplatelets. Sci. Rep., 2016, 6, 26825. [CrossRef]
- Mahdavi, M.; Yousefi, E.; Baniassadi, M.; Karimpour, M.; Baghani M. Effective thermal and mechanical properties of short carbon fiber/natural rubber composites as a function of mechanical loading, Appl. Therm. Eng., 2017, 117, 8-16.
- Hadadian, M.; Goharshadi, E.K.; Youssefi, A. Electrical conductivity, thermal conductivity, and rheological properties of graphene oxide-based nanofluids, J. Nanopart. Res., 2014, 16, 2788. [CrossRef]
- Hofmeister, A.M. Thermal diffusivity and thermal conductivity of single-crystal MgO and Al2O3 and related compounds as a function of temperature. Phys Chem Minerals, 2014, 41, 361–371. [CrossRef]
- Wu, X.; Lee, J.; Varshney, V.; Wohlwend, J.L.; Roy, AK.; Luo, T. Thermal Conductivity of Wurtzite Zinc-Oxide from First-Principles Lattice Dynamics – a Comparative Study with Gallium Nitride. Sci Rep, 2016, 6, 22504 (2016). [CrossRef]
- Van Oss, C.J.; Good, R.J.; Chaudhury, M.K. Additive and nonadditive surface tension components and the interpretation of contact angles. Langmuir 1988, 4, 884. [CrossRef]
- Fowkes, F.M. Surface and Interfacial Aspects of Biomedical Polymers; Andrade, J.D., Ed.; Plenum Press: New York, NY, USA, 1985; Volume I, pp. 337–372.
- Gutmann, V. The Donor-acceptor Approach to Molecular Interactions; Plenum: New York, NY, USA, 1978.
- Riddle, F.L.; Fowkes, F.M. Spectral shifts in acid-base chemistry. Van der Waals contributions to acceptor numbers, Spectral shifts in acid-base chemistry. 1. van der Waals contributions to acceptor numbers. J. Am. Chem. Soc. 1990, 112, 3259–3264. [CrossRef]
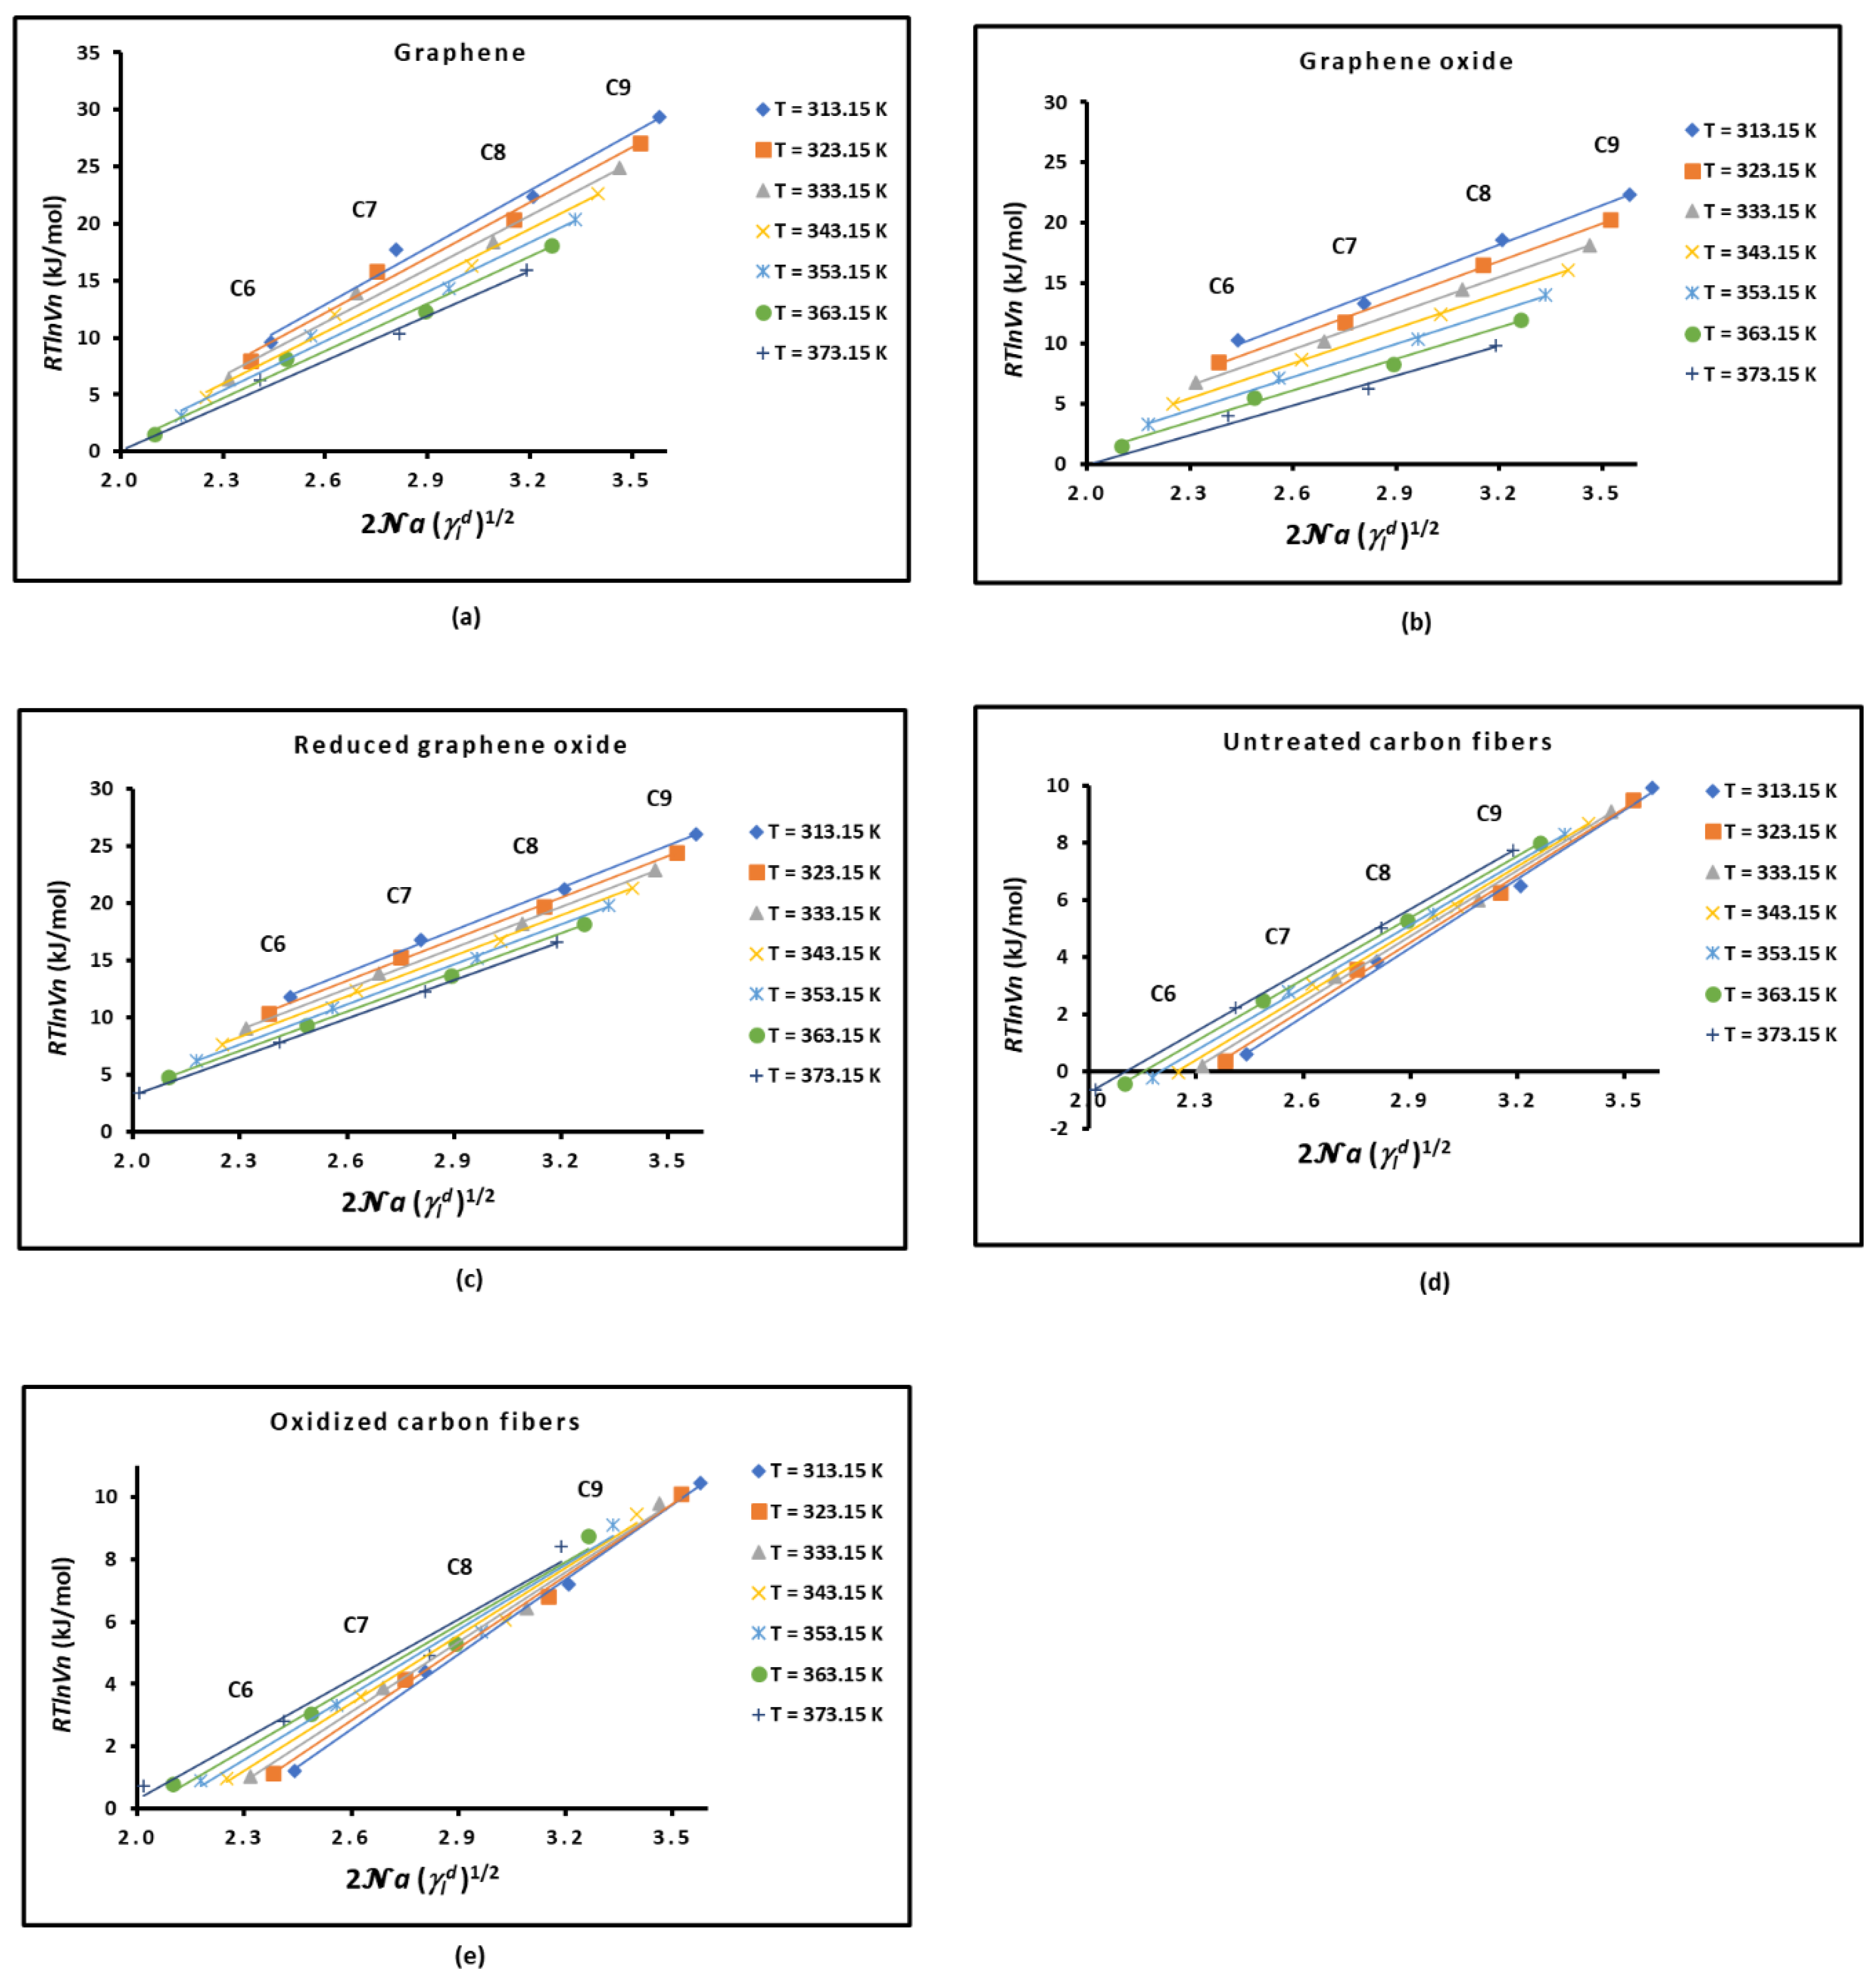
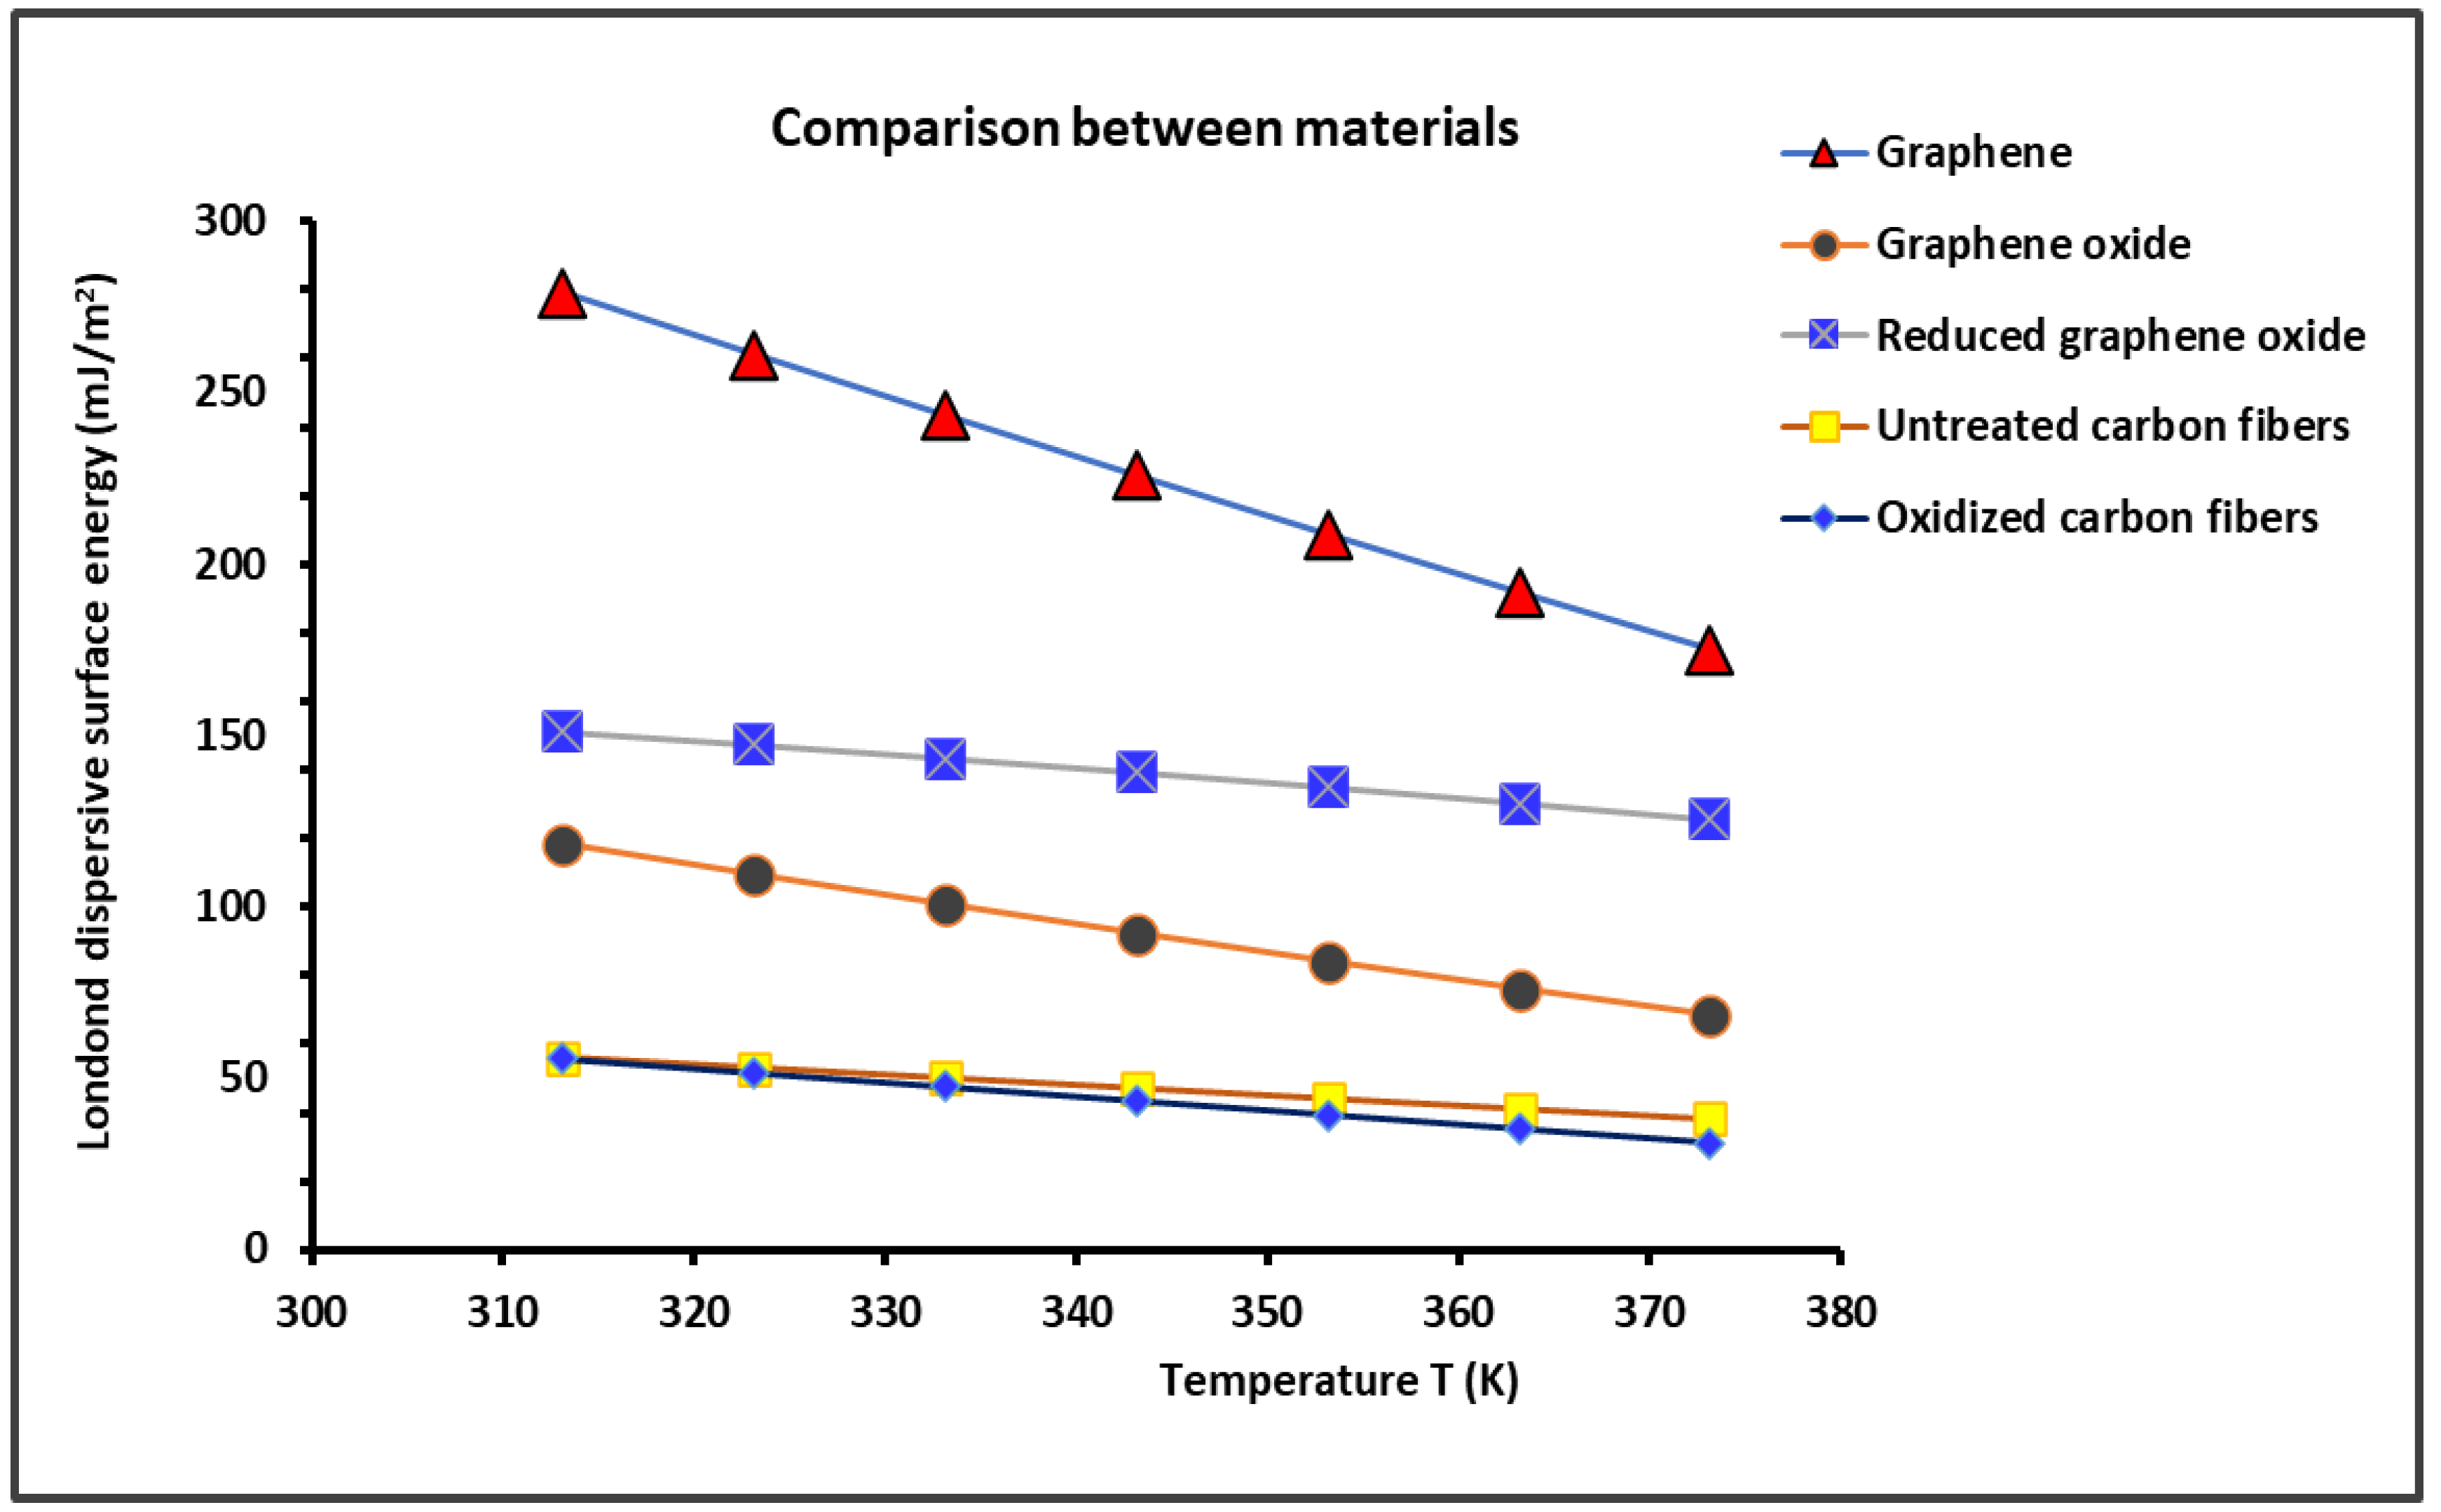
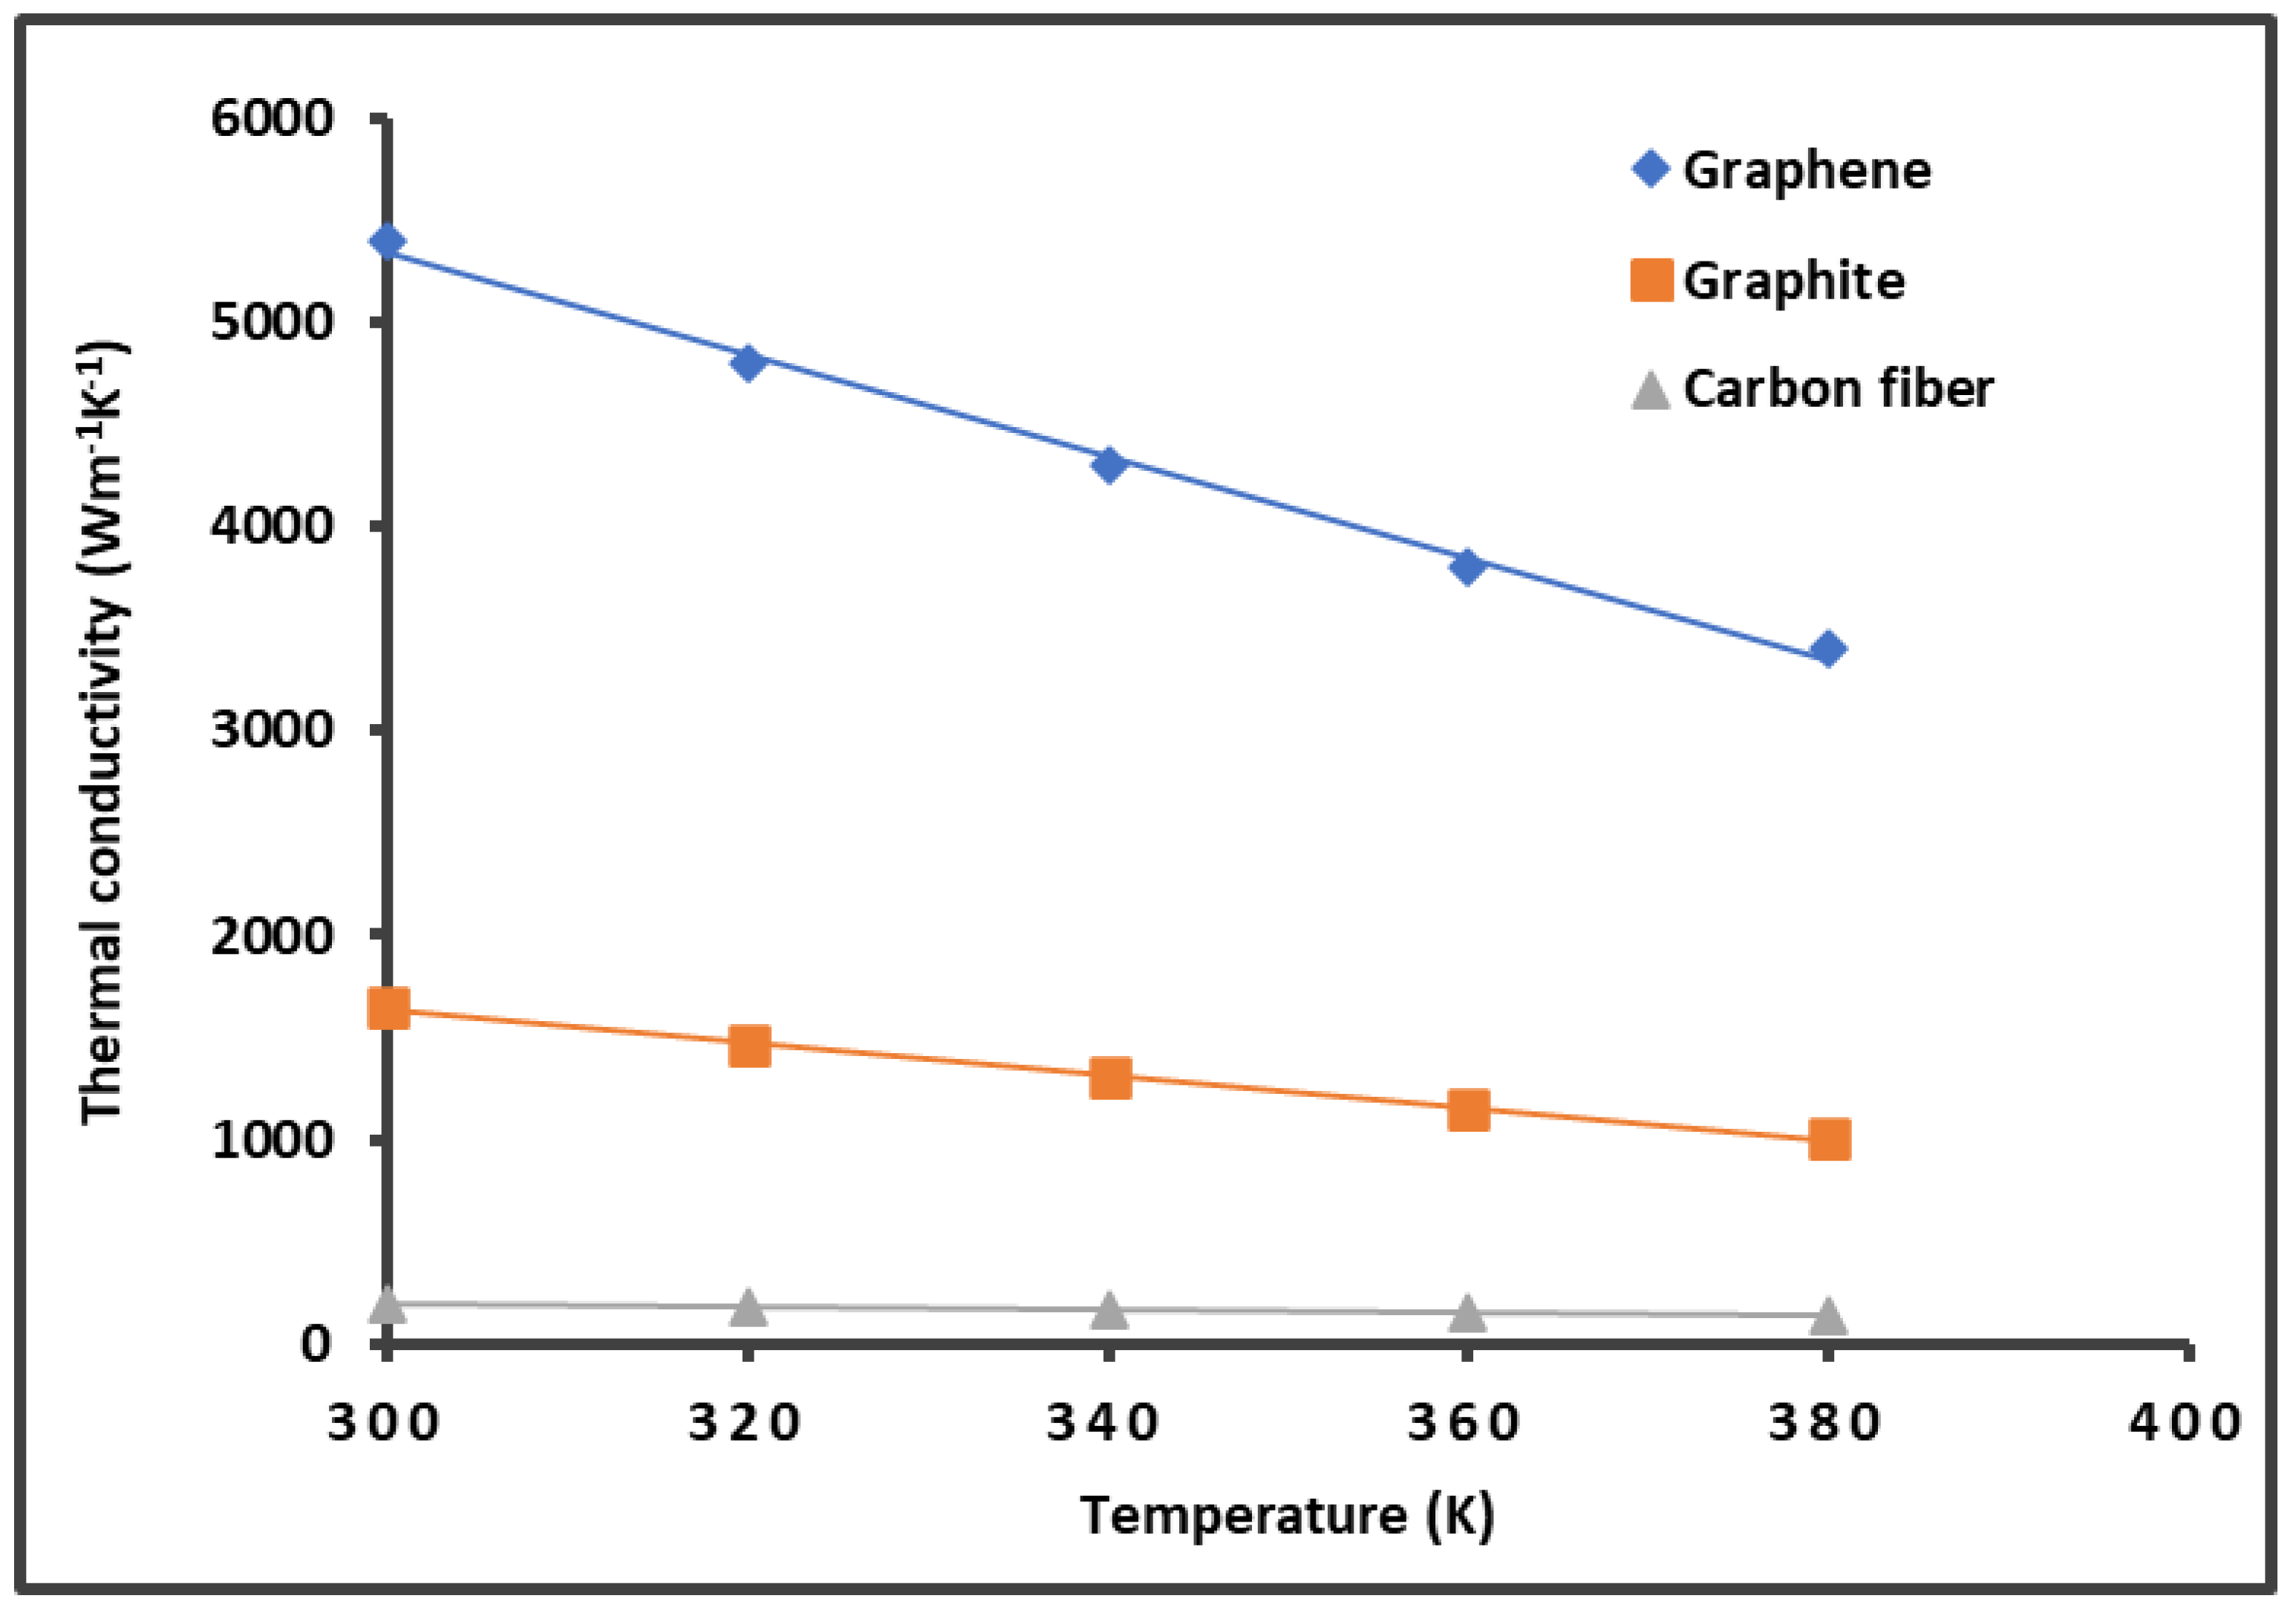
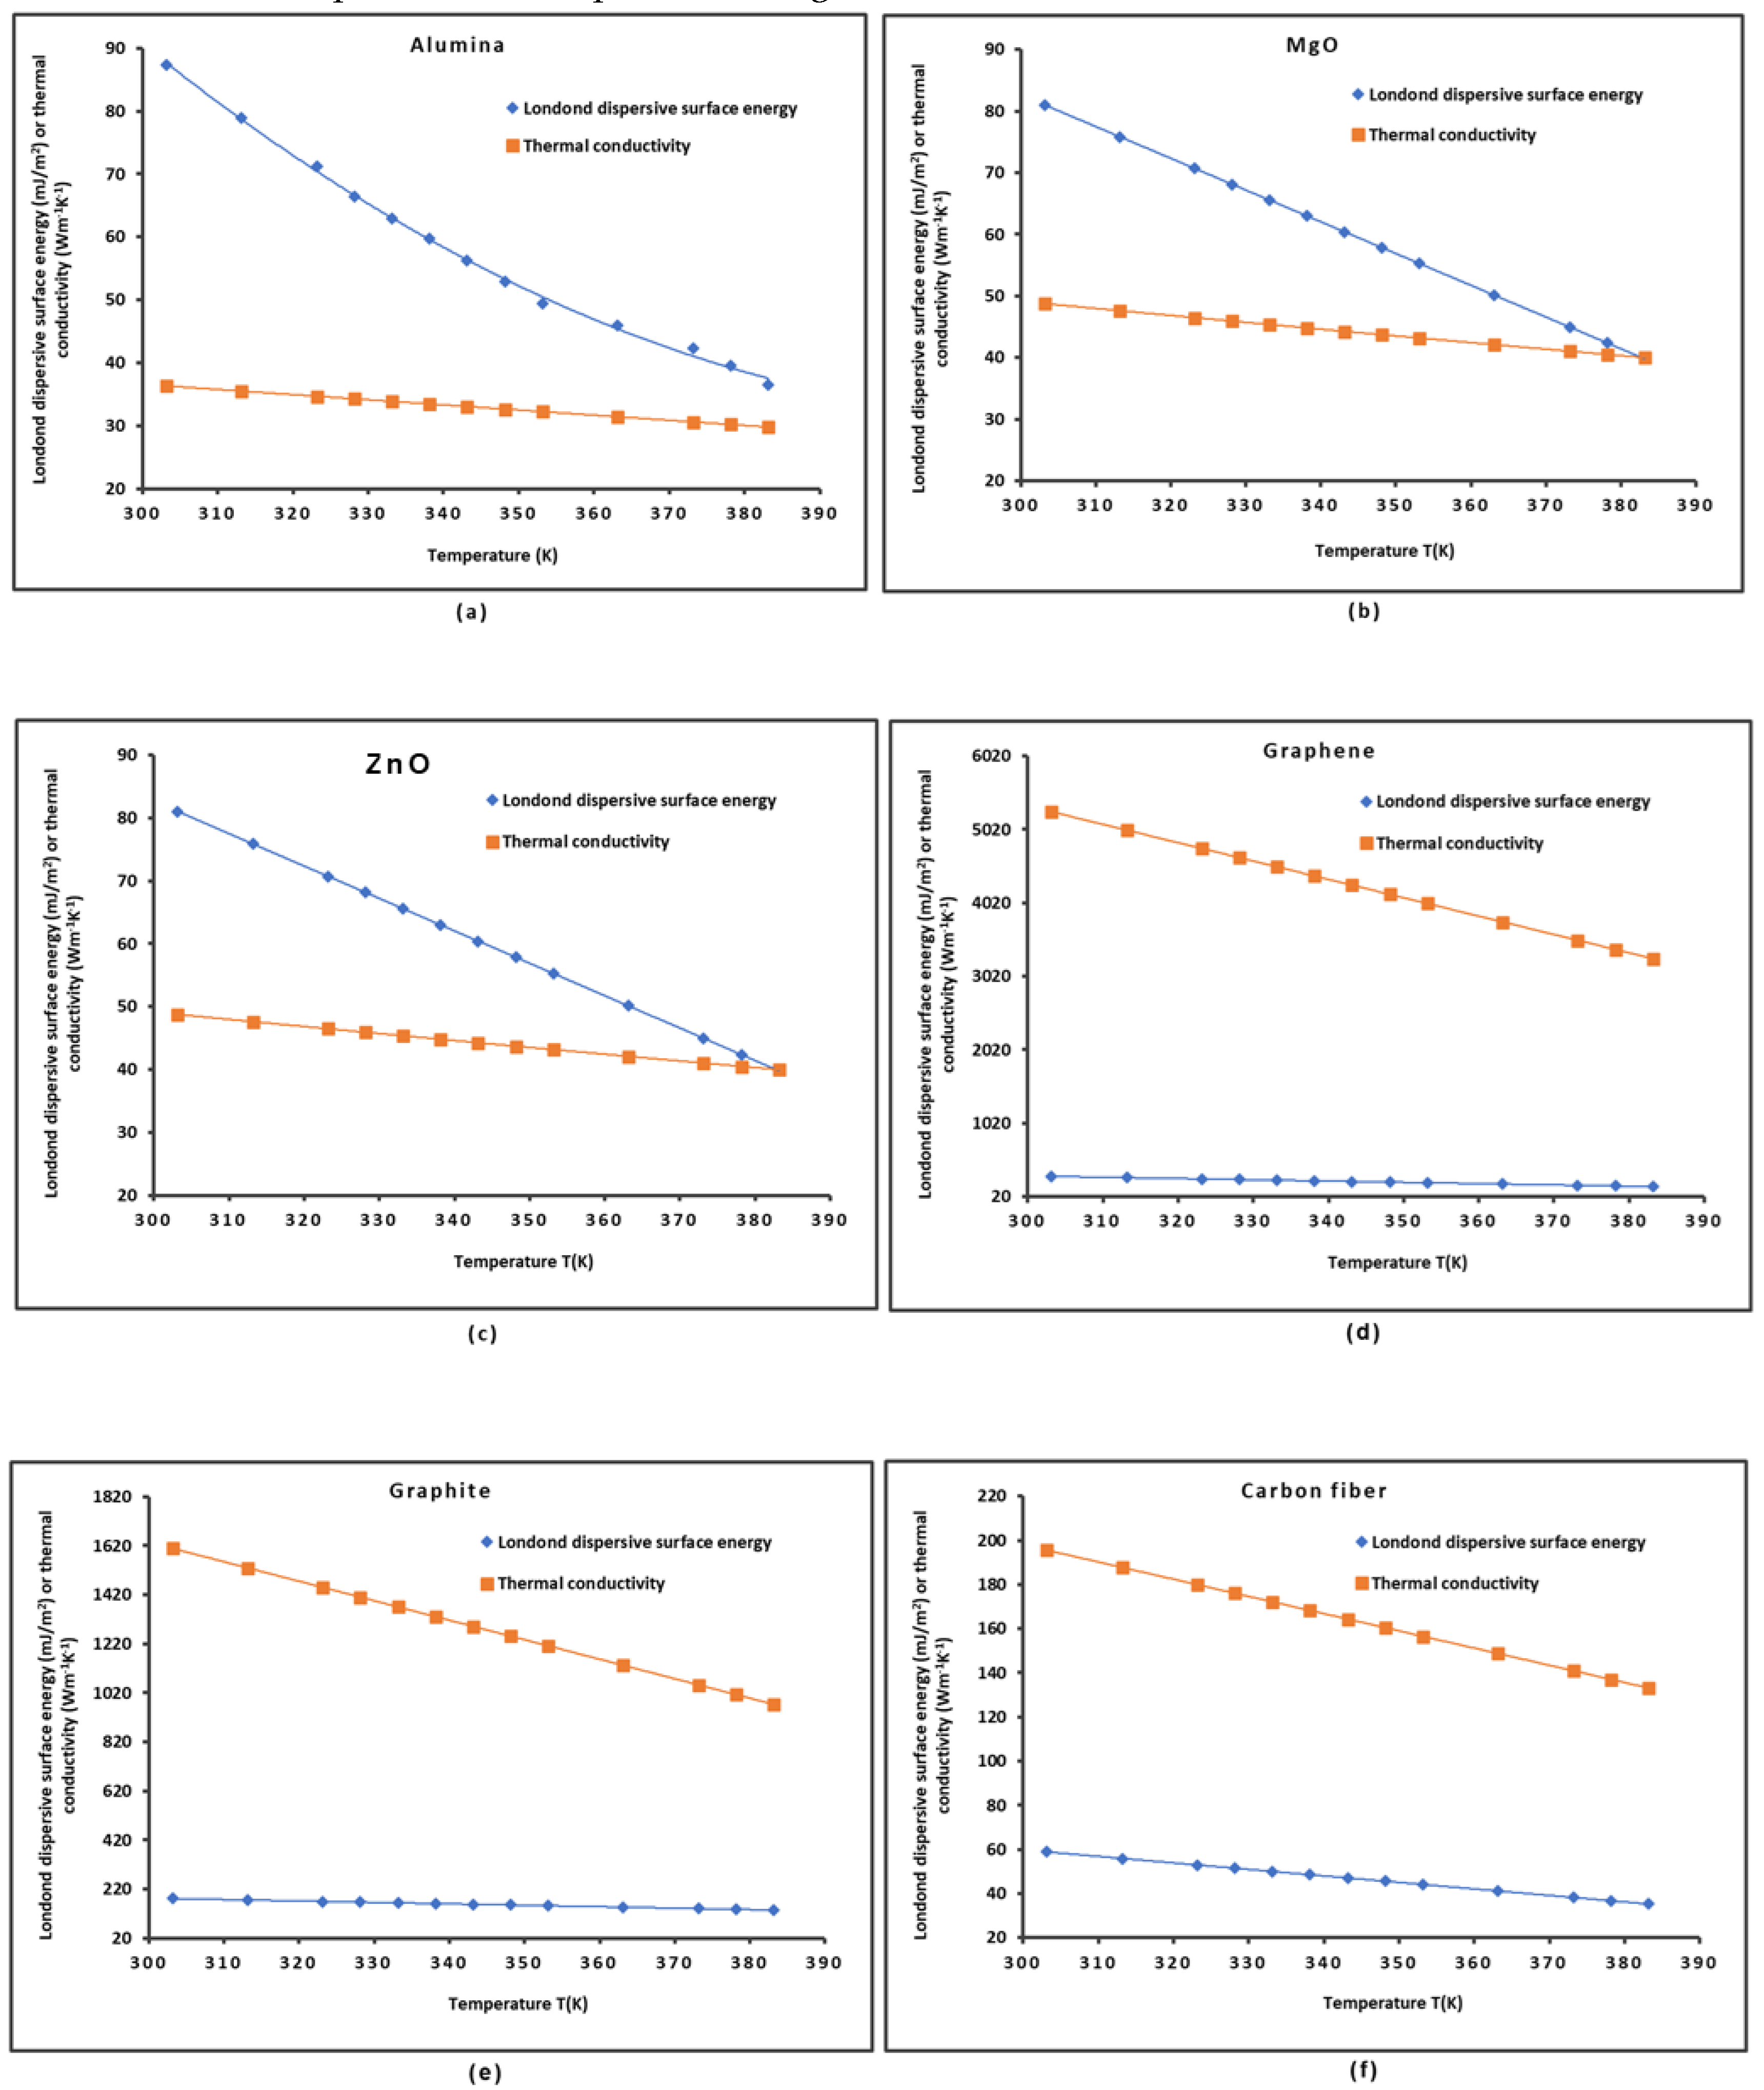
| Solid material |
(mJ/m2) |
(mJ m−2 K−1) |
(mJ/m2) |
(K) |
|---|---|---|---|---|
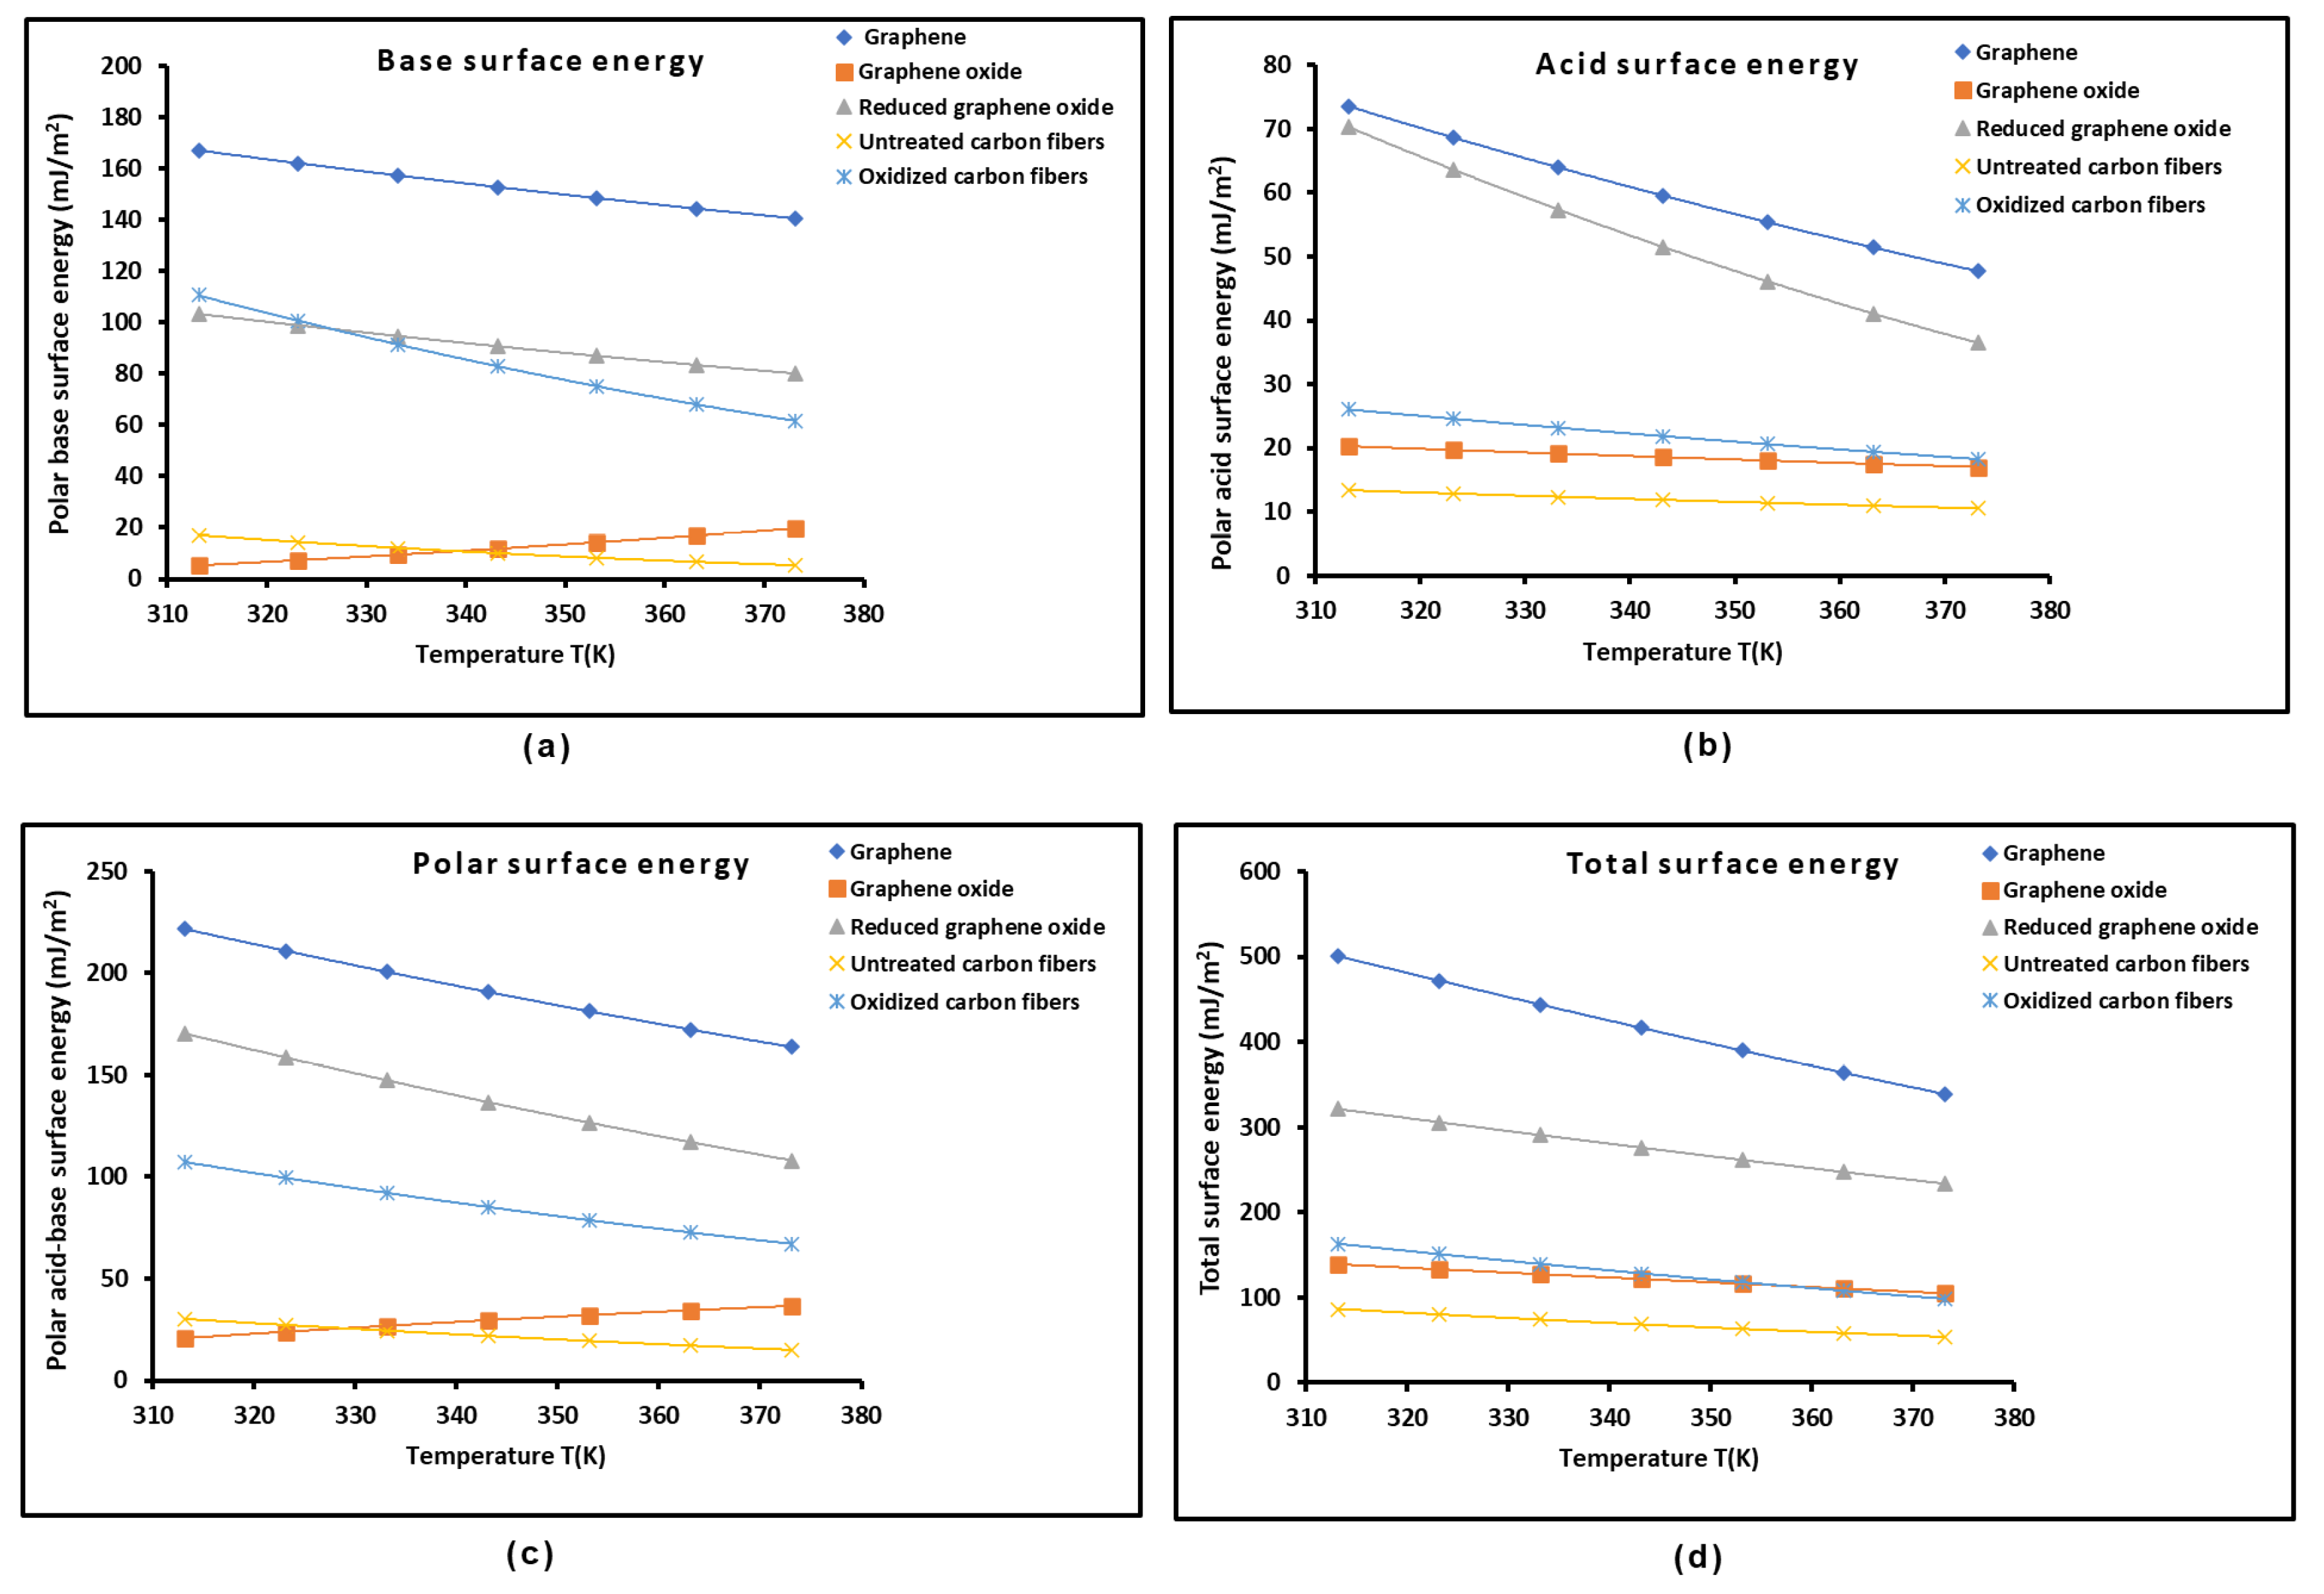
| Graphene | = -1.736T + 822.22 | -1.736 | 822.22 | 473.5 |
| Graphene oxide | = -0.832T + 377.98 | -0.832 | 377.98 | 454.6 |
| Reduced graphene oxide | = -0.424T + 284.29 | -0.424 | 284.29 | 670.5 |
| Untreated carbon fibers | = -0.295T + 148.22 | -0.295 | 148.22 | 502.8 |
| Oxidized carbon fibers | = -0.409T + 183.60 | -0.409 | 183.60 | 449.4 |
| Solid material |
(mJ/m2) Lee et al. [27] |
(mJ/m2) Dai et al. [21] |
(mJ/m2) Dai et al. [77] |
(mJ/m2) This work |
|---|---|---|---|---|
| Graphene oxide | 110 | 28.5 | 78.9 | 118.2 |
| Reduced graphene oxide | 125 | 98.3 | 106.8 | 151.0 |
| Material | |
|---|---|
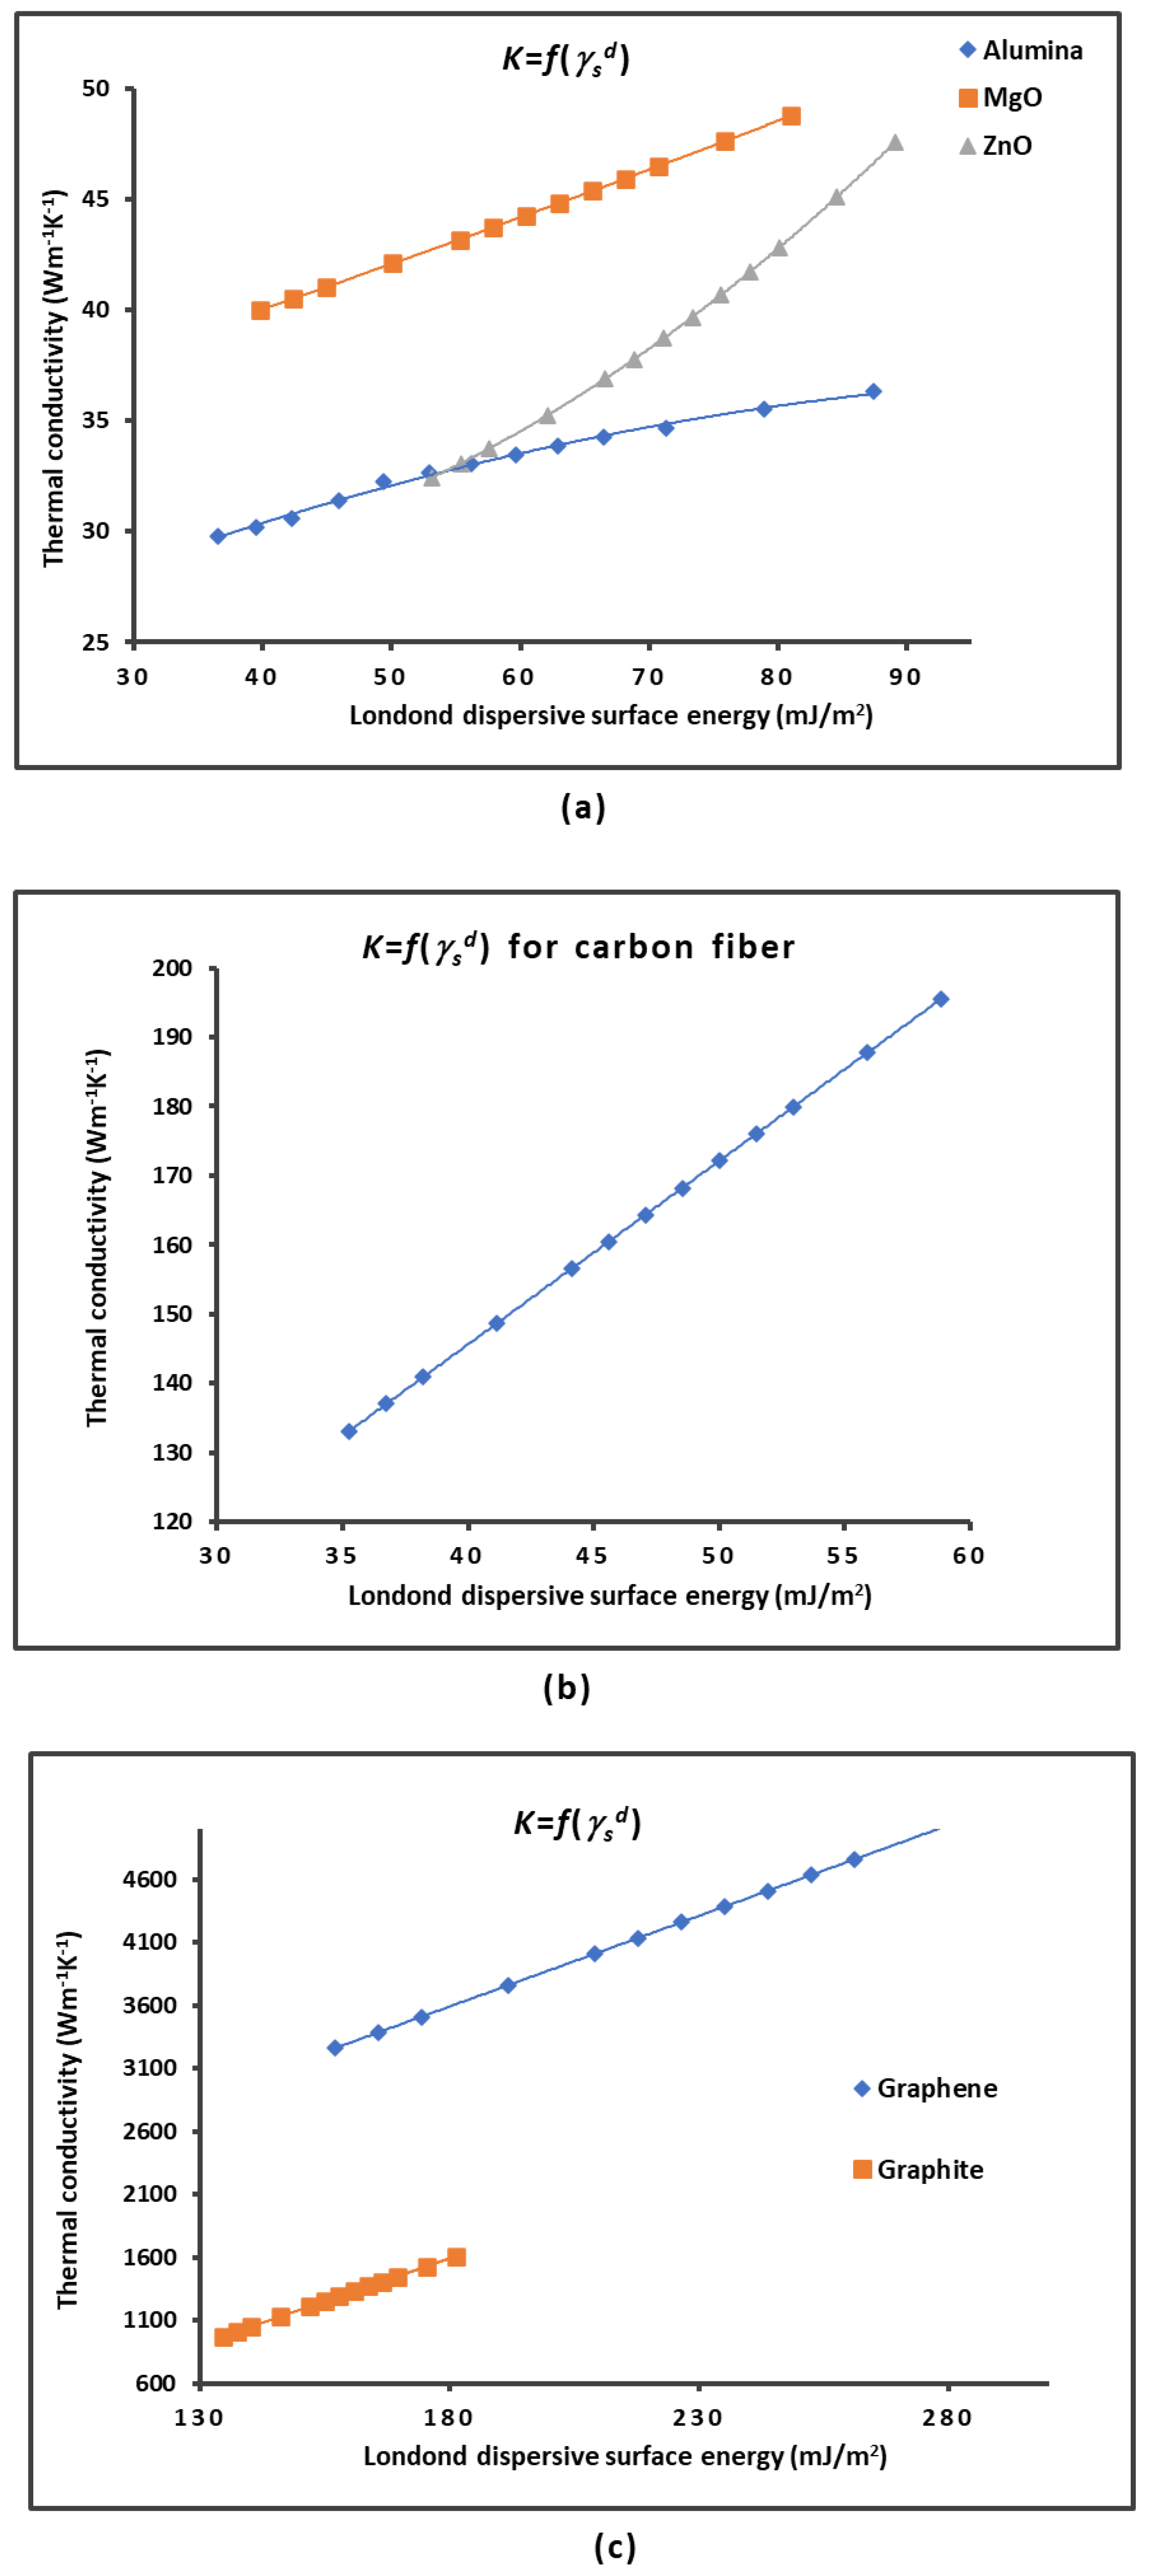
| MgO | = 0.2124 + 31.47 |
| Graphene | = 14.398 + 1002 |
| Graphite | = 13.613 + 856.09 |
| Carbon fiber | = 2.646 + 39.83 |
| Alumina | = -0.0012 2 + 0.281 + 21.123 |
| ZnO | = 0.004 2 - 0.142 + 28.794 |
| Material | KD | KA | KD/KA | R² | 10−3ωA | 10−3ωD | ωD/ωA | R² |
|---|---|---|---|---|---|---|---|---|
| Graphene | 0.253 | 0.593 | 0.426 | 0.9906 | -1.346 | 1.187 | -1.134 | 0.9563 |
| Graphene oxide | -0.551 | 0.223 | -2.471 | 0.9833 | -3.305 | 0.416 | -7.951 | 0.9412 |
| Reduced graphene oxide | -0.721 | 0.601 | -1.200 | 0.9608 | -1.800 | 1.232 | -1.461 | 0.9421 |
| Untreated carbon fibers | 0.345 | 0.235 | 1.468 | 0.8465 | 0.927 | 0.348 | 2.663 | 0.7631 |
| Oxidized carbon fibers | -0.010 | 0.381 | -0.025 | 0.9120 | -0.613 | 0.630 | -0.973 | 0.9002 |
| Material | KD | KA | KD/KA | |
|---|---|---|---|---|
| Graphene (G) | 0.278 | 0.594 | 5.7×10⁻⁴ | 0.468 |
| Graphene oxide (GO) | 0.227 | 0.069 | -7.9×10⁻³ | 3.306 |
| Reduced graphene oxide (rGO) | 0.217 | 0.631 | 2.1×10⁻² | 0.344 |
| Untreated carbon fibers (UCF) | 1.587 | 0.325 | 4.4×10⁻² | 4.883 |
| Oxidized carbon fibers (OCF) | 1.190 | 0.468 | 4.2×10⁻² | 2.543 |
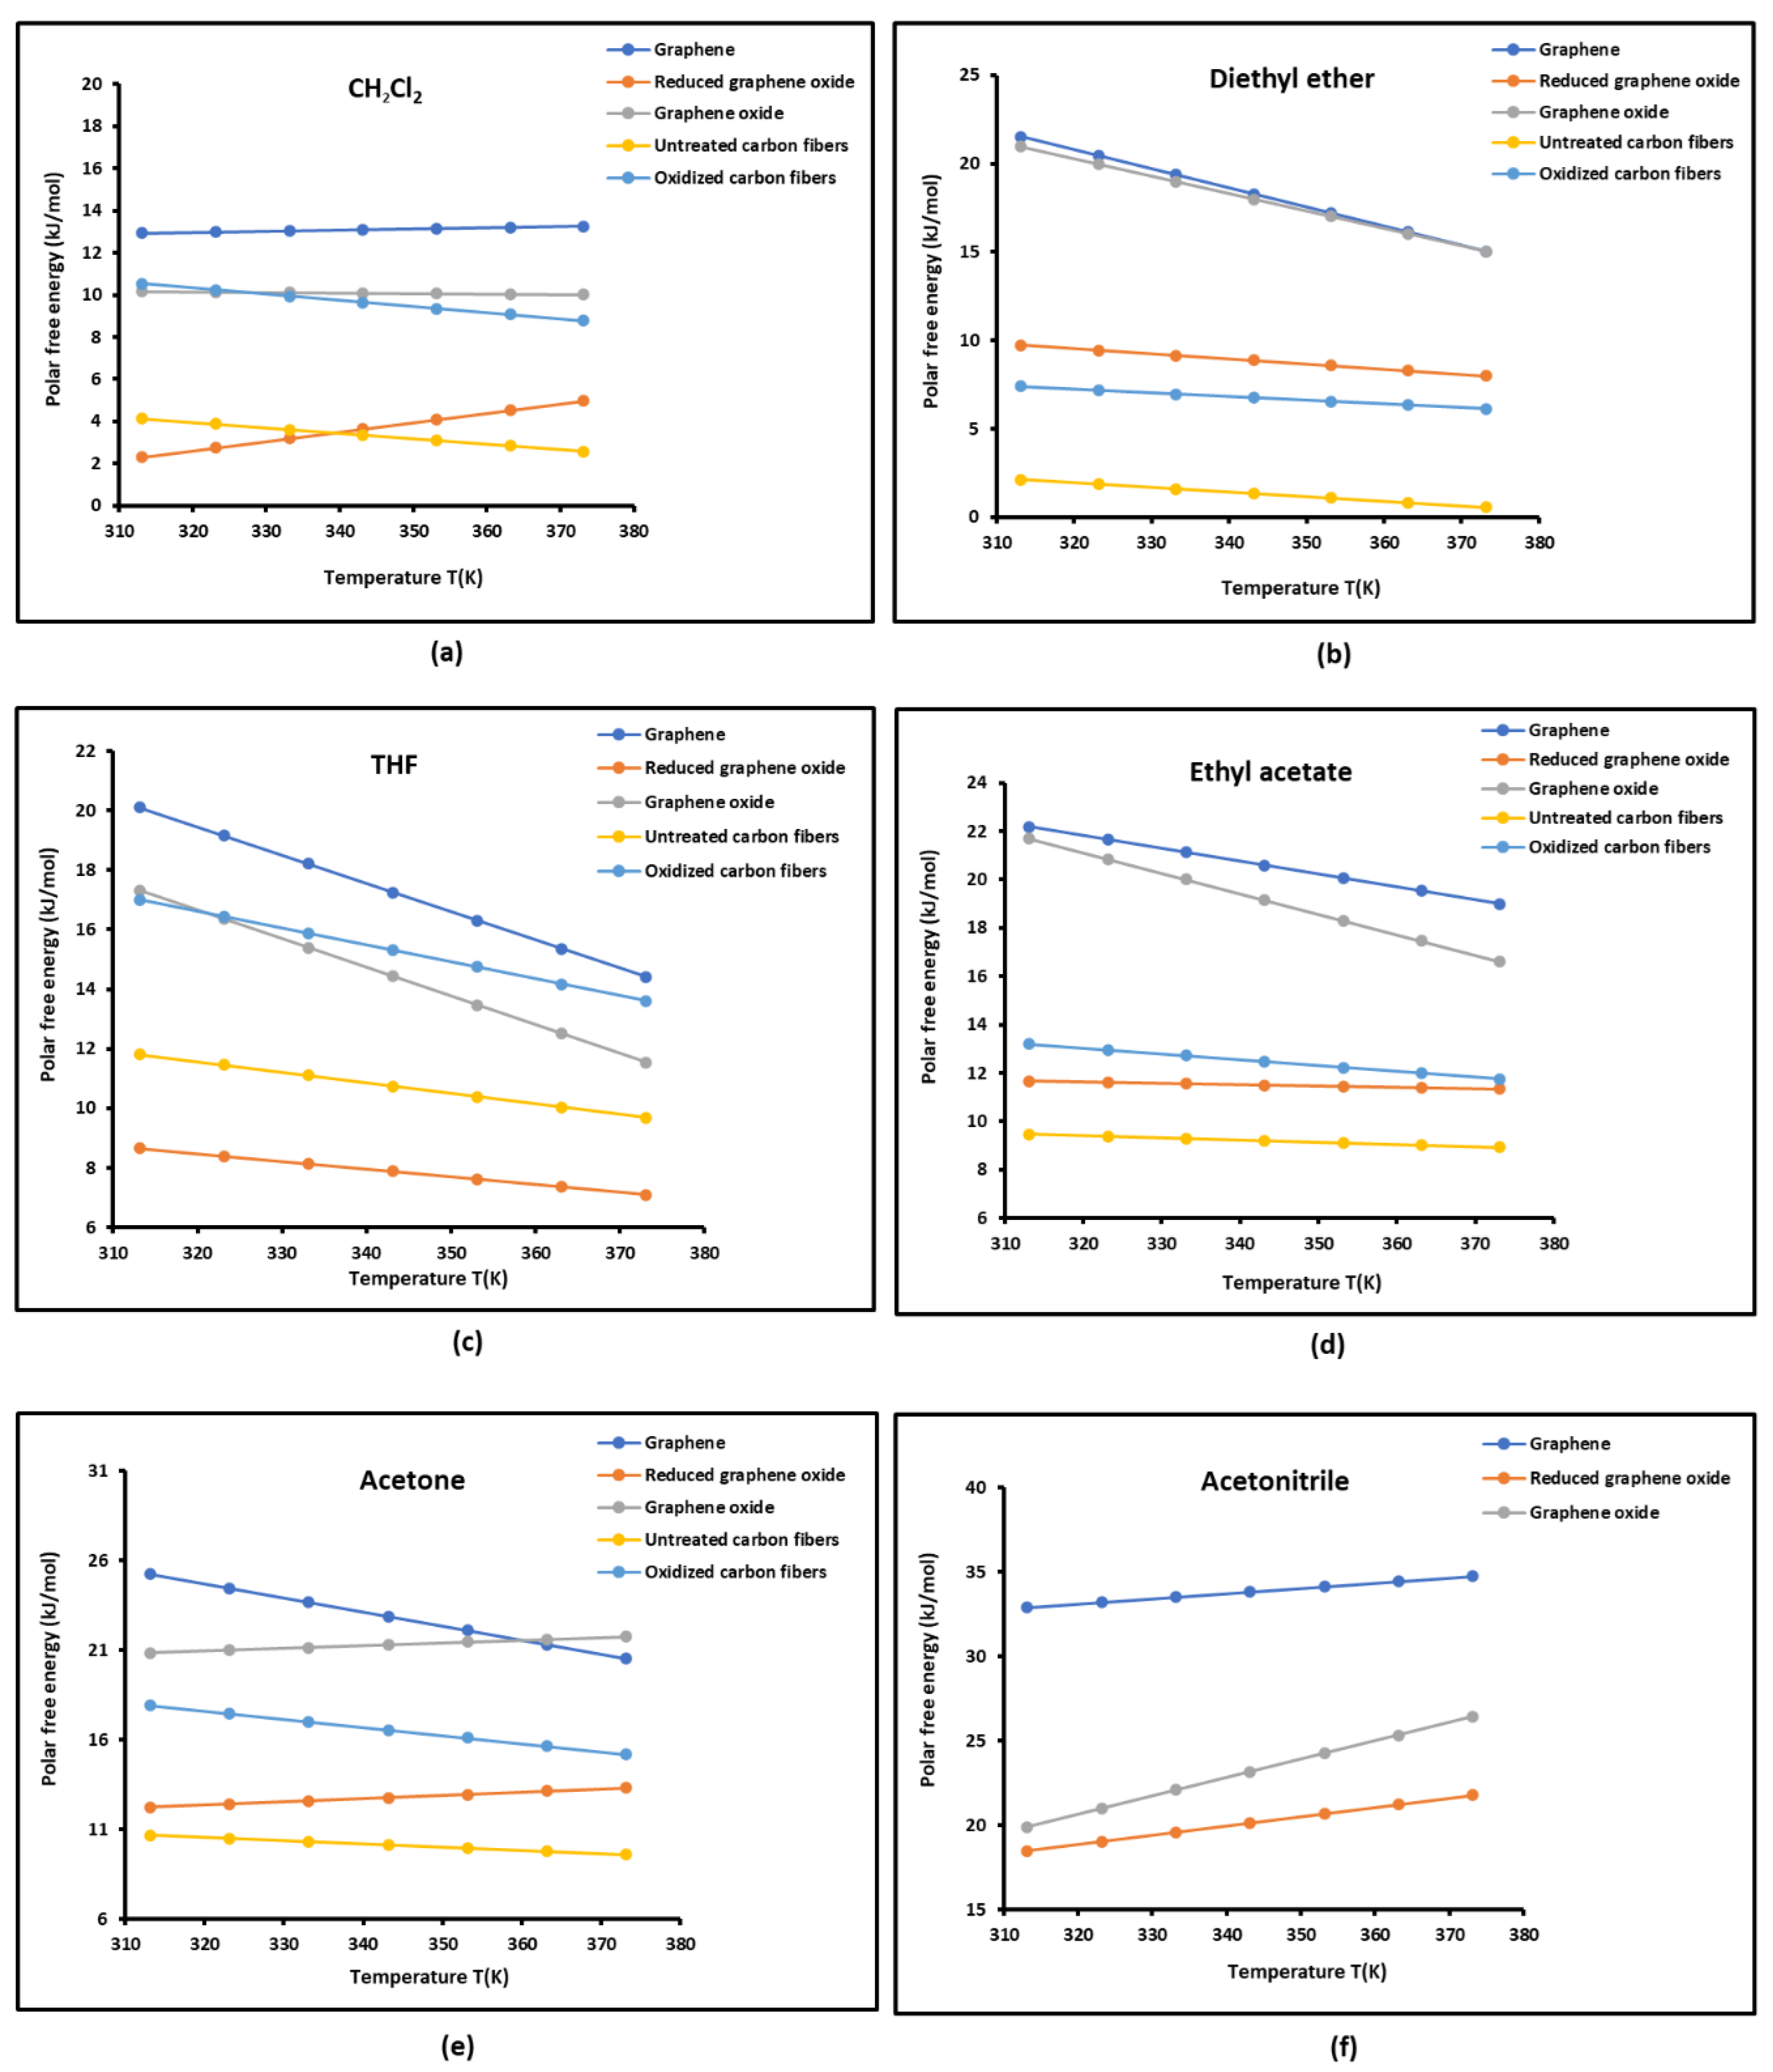
| Dichloromethane | |||||
| T(K) | G | GO | rGO | UCF | OCF |
| 313.15 | 12.938 | 2.309 | 10.175 | 4.130 | 10.526 |
| 323.15 | 12.993 | 2.749 | 10.148 | 3.872 | 10.235 |
| 333.15 | 13.048 | 3.192 | 10.123 | 3.614 | 9.944 |
| 343.15 | 13.102 | 3.639 | 10.095 | 3.356 | 9.653 |
| 353.15 | 13.157 | 4.082 | 10.068 | 3.098 | 9.362 |
| 363.15 | 13.211 | 4.523 | 10.042 | 2.840 | 9.071 |
| 373.15 | 13.265 | 4.964 | 10.013 | 2.582 | 8.780 |
| Ethyl acetate | |||||
| T(K) | G | GO | rGO | UCF | OCF |
| 313.15 | 22.191 | 11.657 | 21.696 | 9.471 | 13.204 |
| 323.15 | 21.658 | 11.603 | 20.849 | 9.381 | 12.962 |
| 333.15 | 21.125 | 11.552 | 20.000 | 9.291 | 12.720 |
| 343.15 | 20.591 | 11.504 | 19.151 | 9.201 | 12.478 |
| 353.15 | 20.057 | 11.452 | 18.302 | 9.111 | 12.236 |
| 363.15 | 19.524 | 11.400 | 17.453 | 9.021 | 11.994 |
| 373.15 | 18.990 | 11.347 | 16.604 | 8.931 | 11.752 |
Disclaimer/Publisher’s Note: The statements, opinions and data contained in all publications are solely those of the individual author(s) and contributor(s) and not of MDPI and/or the editor(s). MDPI and/or the editor(s) disclaim responsibility for any injury to people or property resulting from any ideas, methods, instructions or products referred to in the content. |
© 2024 by the authors. Licensee MDPI, Basel, Switzerland. This article is an open access article distributed under the terms and conditions of the Creative Commons Attribution (CC BY) license (http://creativecommons.org/licenses/by/4.0/).


