1. Introduction
Monopile foundations are the most widely used foundation type for existing offshore wind farm developments with 81% of all installed offshore wind turbines adopting this foundation type [
1].
In contrast to offshore Oil & Gas platforms, the Ultimate Limit State (ULS) is not dominating the design of offshore wind turbine structures [
2][
3]. Due to their dynamic response, the fatigue damage accumulated through repeated cyclic loading governs the design. During the design phase, a prediction of the fatigue life of the structure is made using assumptions on the soil and environmental conditions at the site. However, once installed, the response of the structure can be monitored to verify the design assumptions and update the fatigue calculations [
4].
Monitoring data can reveal mismatches between the designed and observed response. A well-known example is the observed mismatch between the as-designed and monitored natural frequency for offshore wind farms developed between 2010 and 2015 [
5,
6]. Following these observations, updated design methods have been developed based on onshore field tests and numerical models to predict the foundation stiffness more accurately [
7]. The small-strain stiffness
of the soil was shown to be a governing parameter for the monopile’s lateral response.
Estimation of this parameter across a windfarm site requires either direct measurement of shear wave velocity () or a transformation from cone penetration test (CPT) measurements to using a CPT-based correlation. Several methods exist to measure in-situ or in the geotechnical laboratory but the cost associated with these tests generally leads to such measurements only being performed at selected foundation locations. However, the complex geology of the North Sea requires location-specific assessment of in stratigraphies which may cut across several geological formations. As such, the CPT-based correlations should provide results which are in line with the understanding of the local geology.
To perform location-specific soil-structure interaction analysis (e.g. natural frequency analysis), soil stiffness profiles need to be developed at every foundation location. When direct shear wave velocity measurements at the location under consideration are not available, a correlation between conventional CPT measurements and shear wave velocity (or small-strain stiffness) is generally used. Several authors have formulated correlations between CPT measurements and
or
[
8,
9,
10,
11,
12,
13,
14,
15,
16], each based on a dataset containing both CPT measurements and direct measurement of
. It should be noted that
and
are related through the fundamental relation
, where
is the bulk density of the soil. Each of the correlations from the literature is based on a unique dataset which contains specific soil types and applies to the geological setting at the sites used for calibration. Using such correlations introduces a model uncertainty or transformation uncertainty [
17] in the geotechnical analysis as the small-strain shear modulus profile is derived indirectly. It should be recognised that the CPT leads to large strains in the soil whereas
or
apply to small-strain conditions and as such, finding a good correlation between CPT data and
or
is challenging.
In this work, the existing correlations from the literature are critically reviewed and their applicability to Southern North Sea soils is discussed. The Southern North Sea has a complex geological history which is summarized in
Section 2. Given the variation in depositional environments and the overconsolidation of many of the geological formations, existing correlations from the literature may not apply to this region. A dataset of 4145 direct measurements of shear wave velocity with the seismic CPT (S-PCPT) at 207 geotechnical testing locations in the North Sea is used to assess the performance of the proposed correlations. The
dataset is presented in
Section 3. The mathematical formulation of each correlations and the datasets used for their calibration are reviewed in
Section 4. The available models are evaluated against the North Sea dataset to check their applicability and the statistical properties of the ratio of calculated to measured
or
are derived. When using a CPT-based correlation for location-specific geotechnical design, the correlation should provide an unbiased estimate of the geotechnical parameter under consideration and not introduce a high transformation uncertainty. The development of a new stress-dependent correlation for North Sea sedimentary soils is presented in
Section 5. A correlation with an explicit stress-dependence is of interest for monopile geotechnical design where the placement of a scour protection layer can change the vertical effective stresses in the soil during the lifetime of the foundation. The application of the different correlations to example locations from the Southern North Sea where both CPT and S-PCPT are available is presented in
Section 6.
2. Geology of the Southern North Sea
The Southern to Central North Sea region has a complex geological history [
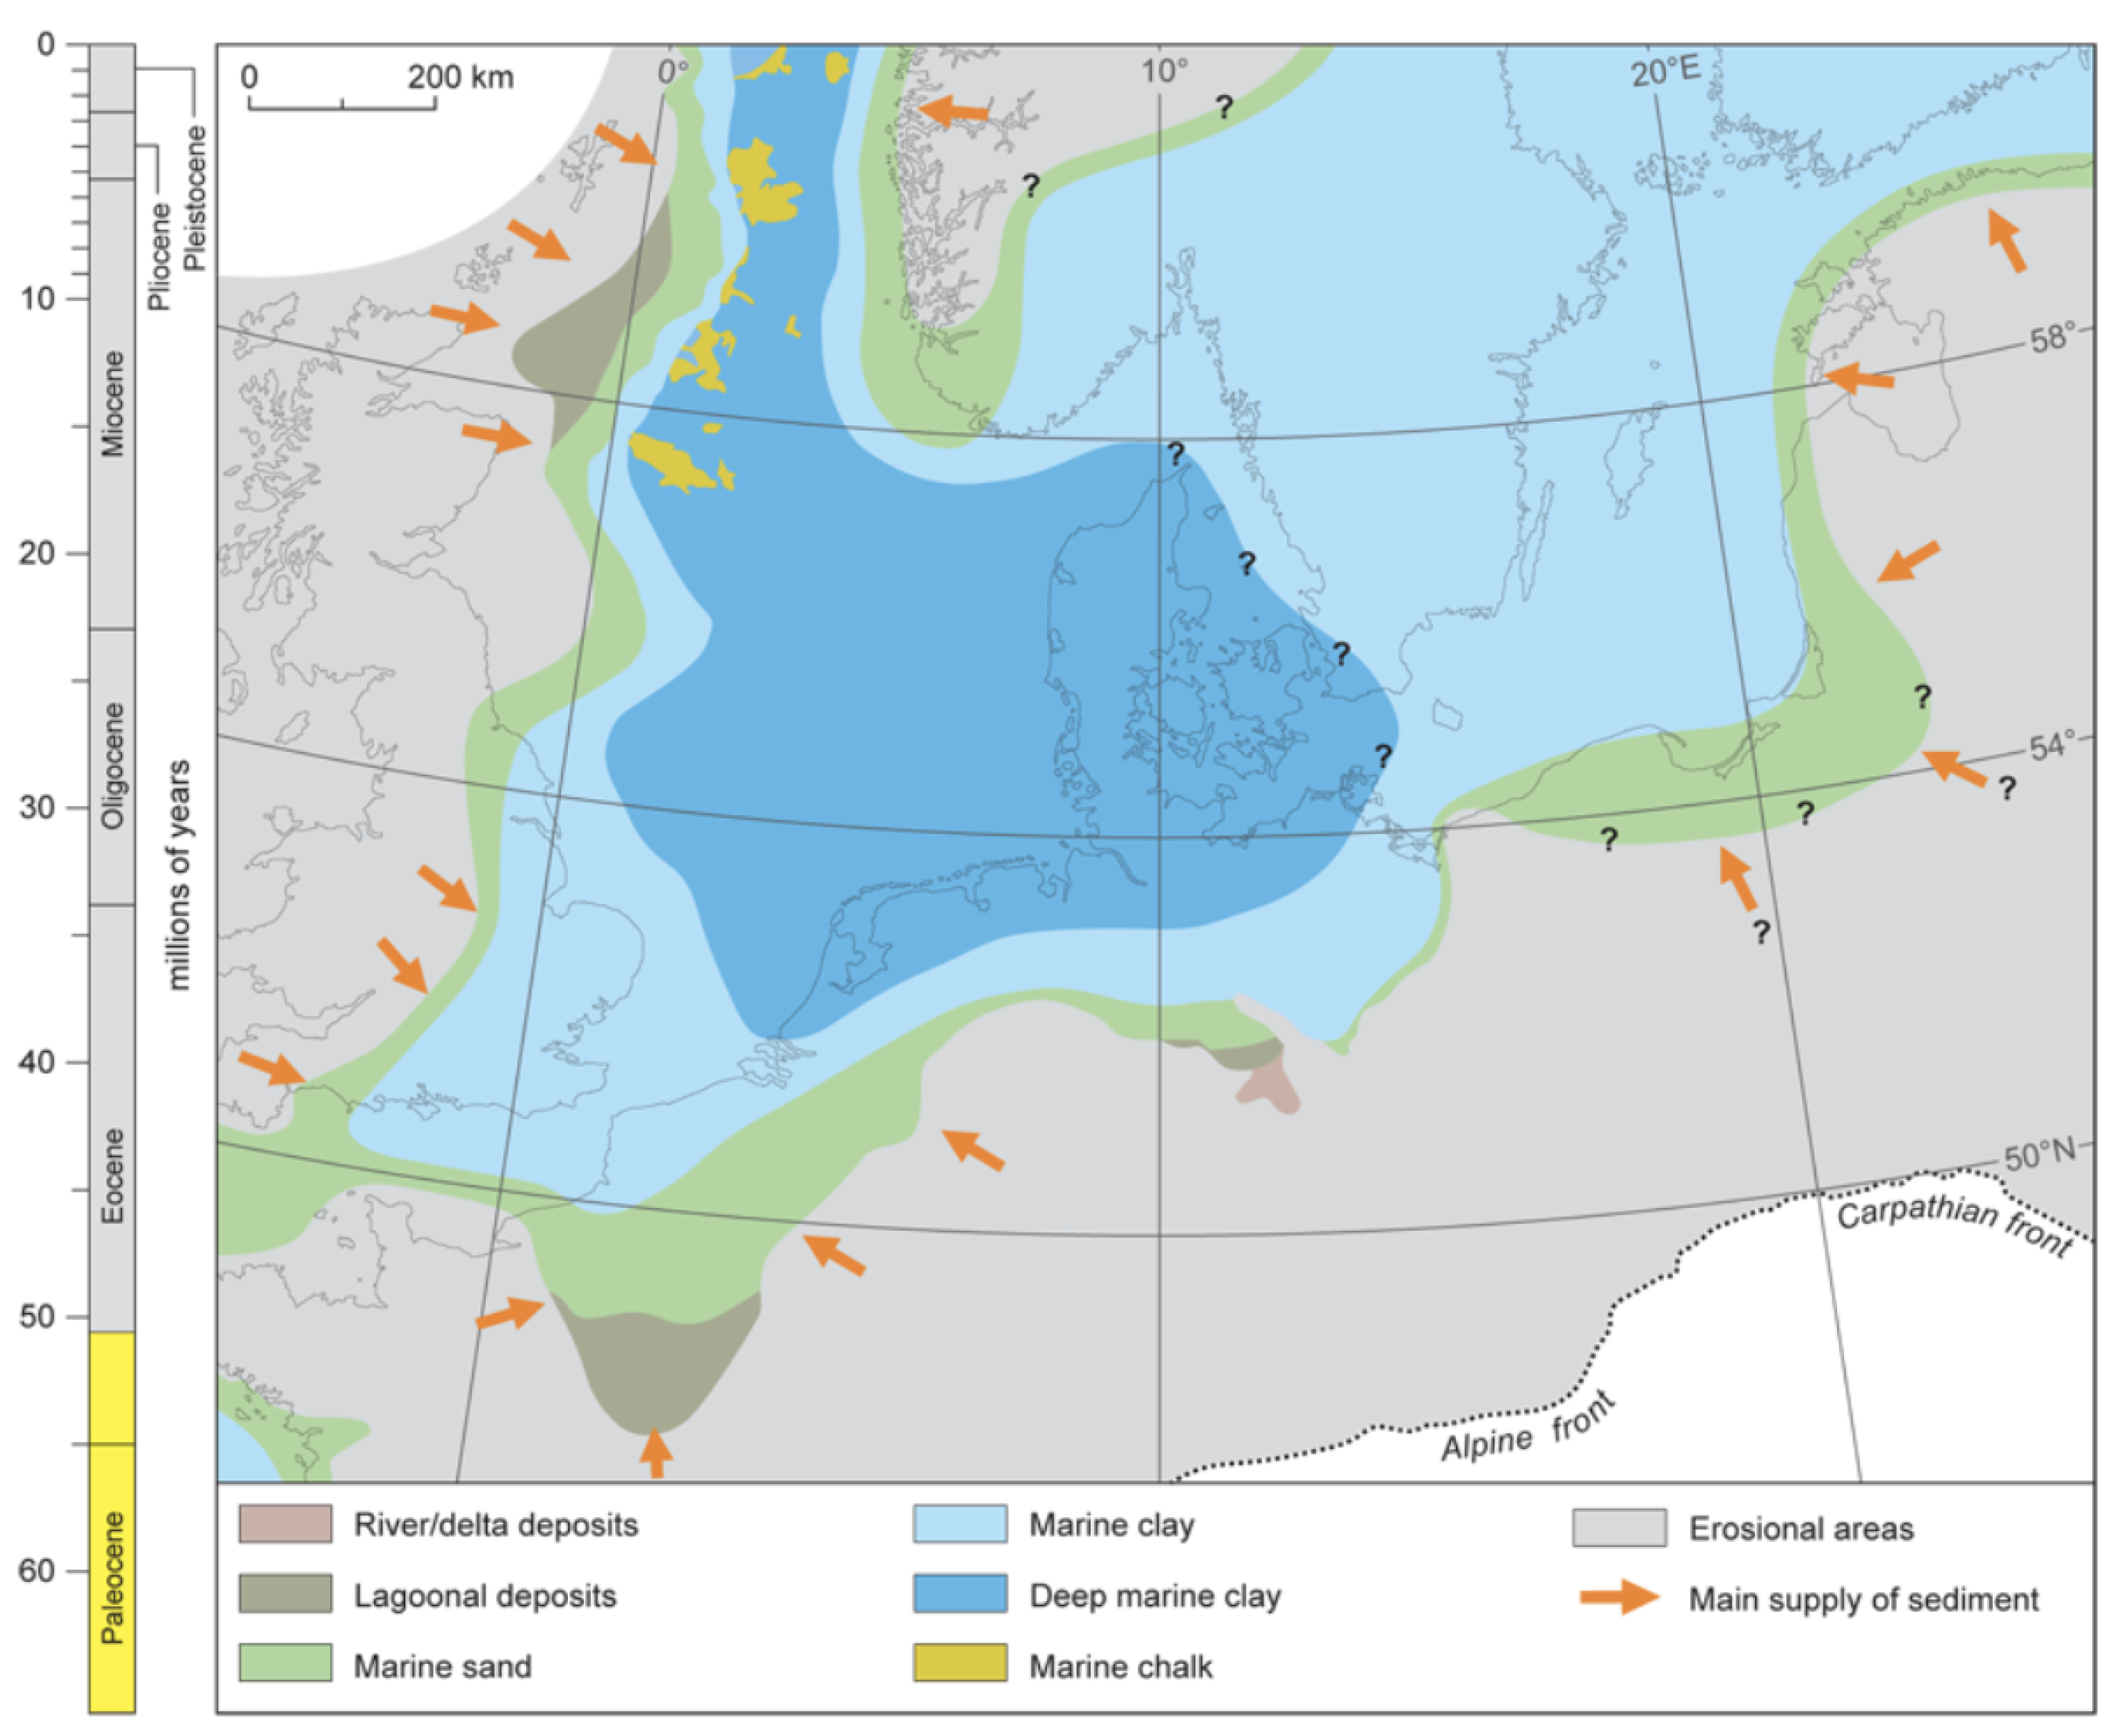
18]. In the area of interest which comprises the Belgian, Dutch, German and Danish sectors of the North Sea, the oldest geological formations found in the depth range of interest for offshore wind turbine foundations (upper 100m) are Paleogene in age. Subsidence of the North Sea basin during the Paleogene led to the deposition of >1000m of marine, clay-dominated sediments on top of the Late Cretaceous chalk, mainly during the Early Eocene (
Figure 1). The depocenter during this period was located in the Central Graben of the North Sea and further southward into the Netherlands.
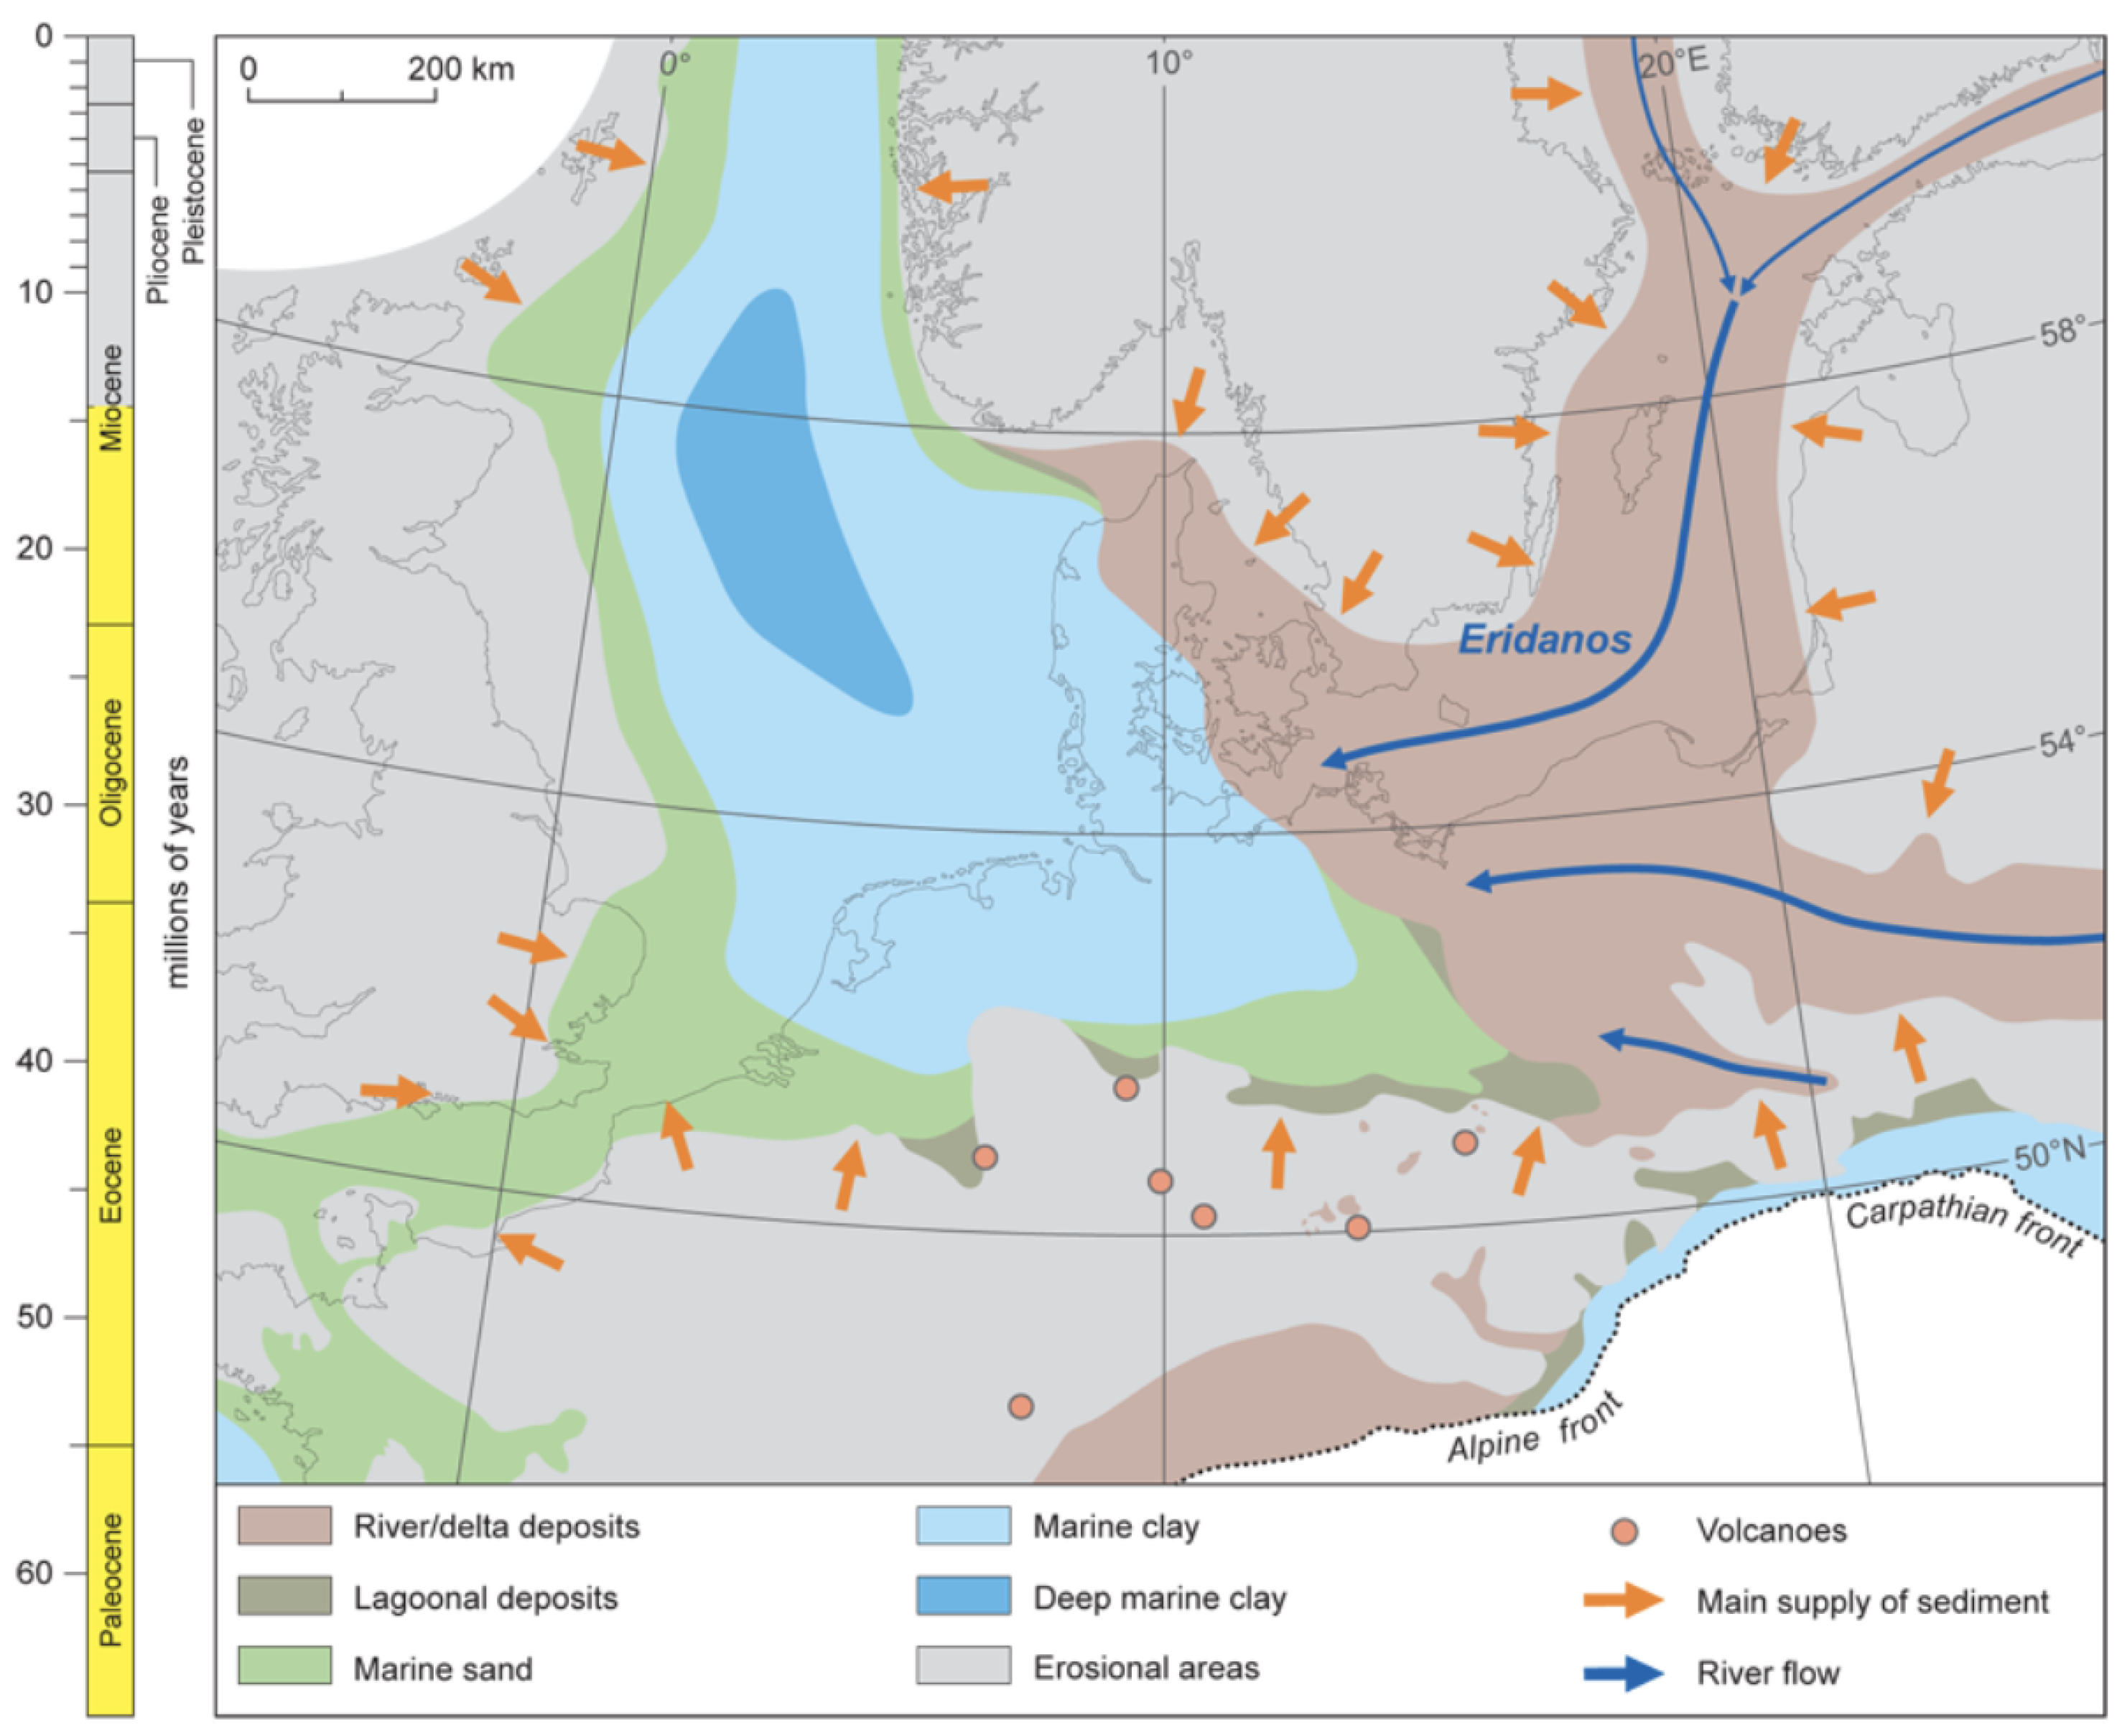
During the Mid-Miocene, the Alpine orogeny led to tectonic folding and the formation of a syncline with a notable dipping of layers to the NE on the SW margin of the North Sea. The subsequent relaxation of stresses gave rise to renewed subsidence, which allowed a large deltaic system to develop from the Mid-Miocene (
Figure 2) till the Pleistocene (
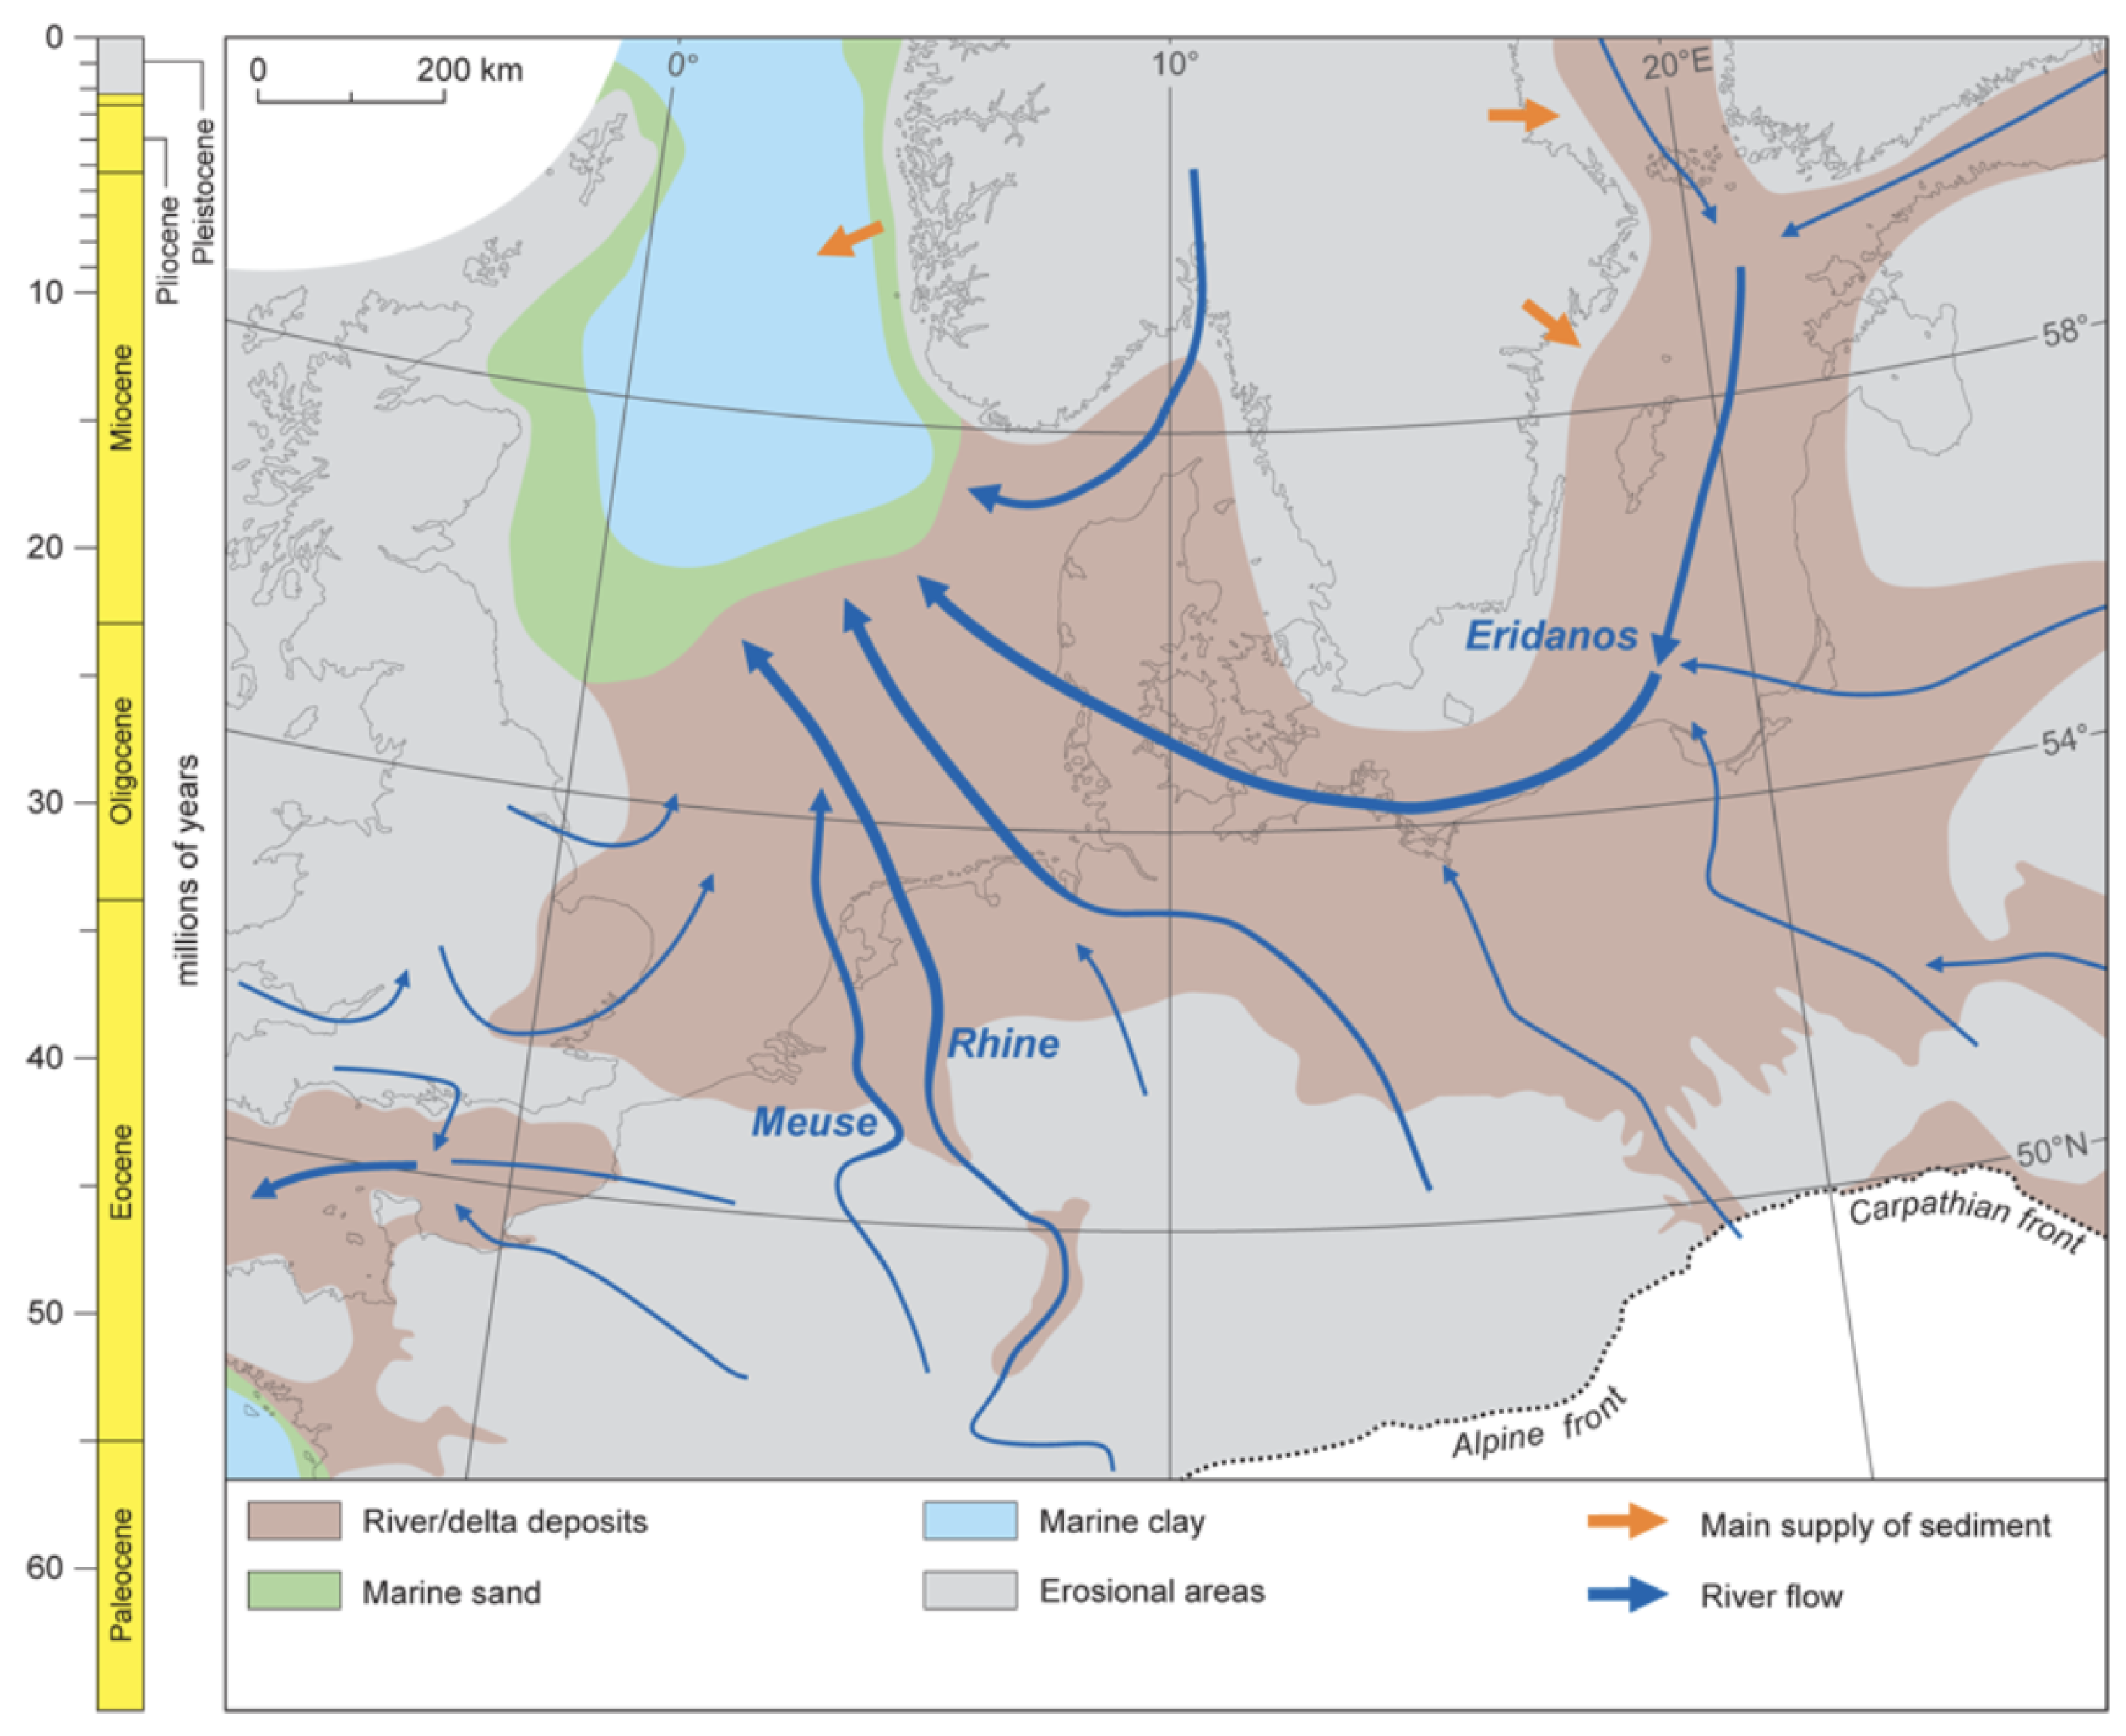
Figure 2). The deltaic systems, building out first from the east (fed by Baltic rivers) and later from the southeast (additionally fed by the Rhine, Meuse and British rivers) [
19], were very extensive and deposited a coarsening upward sequence ranging from fine-grained pro-deltaic sediments associated with a deeper depositional environment to fluvial sediments when the land become exposed above sea level [
18]. By 1.6 Ma, most of the Southern North Sea basin was infilled (Ottesen et al., 2014), and a significant proportion of the Paleogene clay-dominated sediments on the SW margin of the North Sea were eroded, resulting in the presence of overconsolidated clays in the present shallow subsurface (e.g. London Clay in the UK sector, Ypresian Clay in the Belgian sector) [
20,
21].
Figure 1.
Depositional environments in the North Sea during the early Eocene [
22]
Figure 1.
Depositional environments in the North Sea during the early Eocene [
22]
Figure 2.
Depositional environments in the North Sea during the mid-Miocene [
22]
Figure 2.
Depositional environments in the North Sea during the mid-Miocene [
22]
Figure 3.
Depositional environments in the North Sea during the early Pleistocene [
22]
Figure 3.
Depositional environments in the North Sea during the early Pleistocene [
22]
From the mid-Pleistocene to the Holocene, the alternation of glacial and interglacial periods and resulting sea level variations controlled the depositional environment in the Southern and Central North Sea. Large glacial valleys were eroded in the Pleistocene and pre-Pleistocene strata. The infill material of these channels is highly variable and can range from coarse gravels to clays. This leads to a geological setting which can show significant variability within relative short geographical distances, underlining the need for location-specific geotechnical investigation and foundation design.
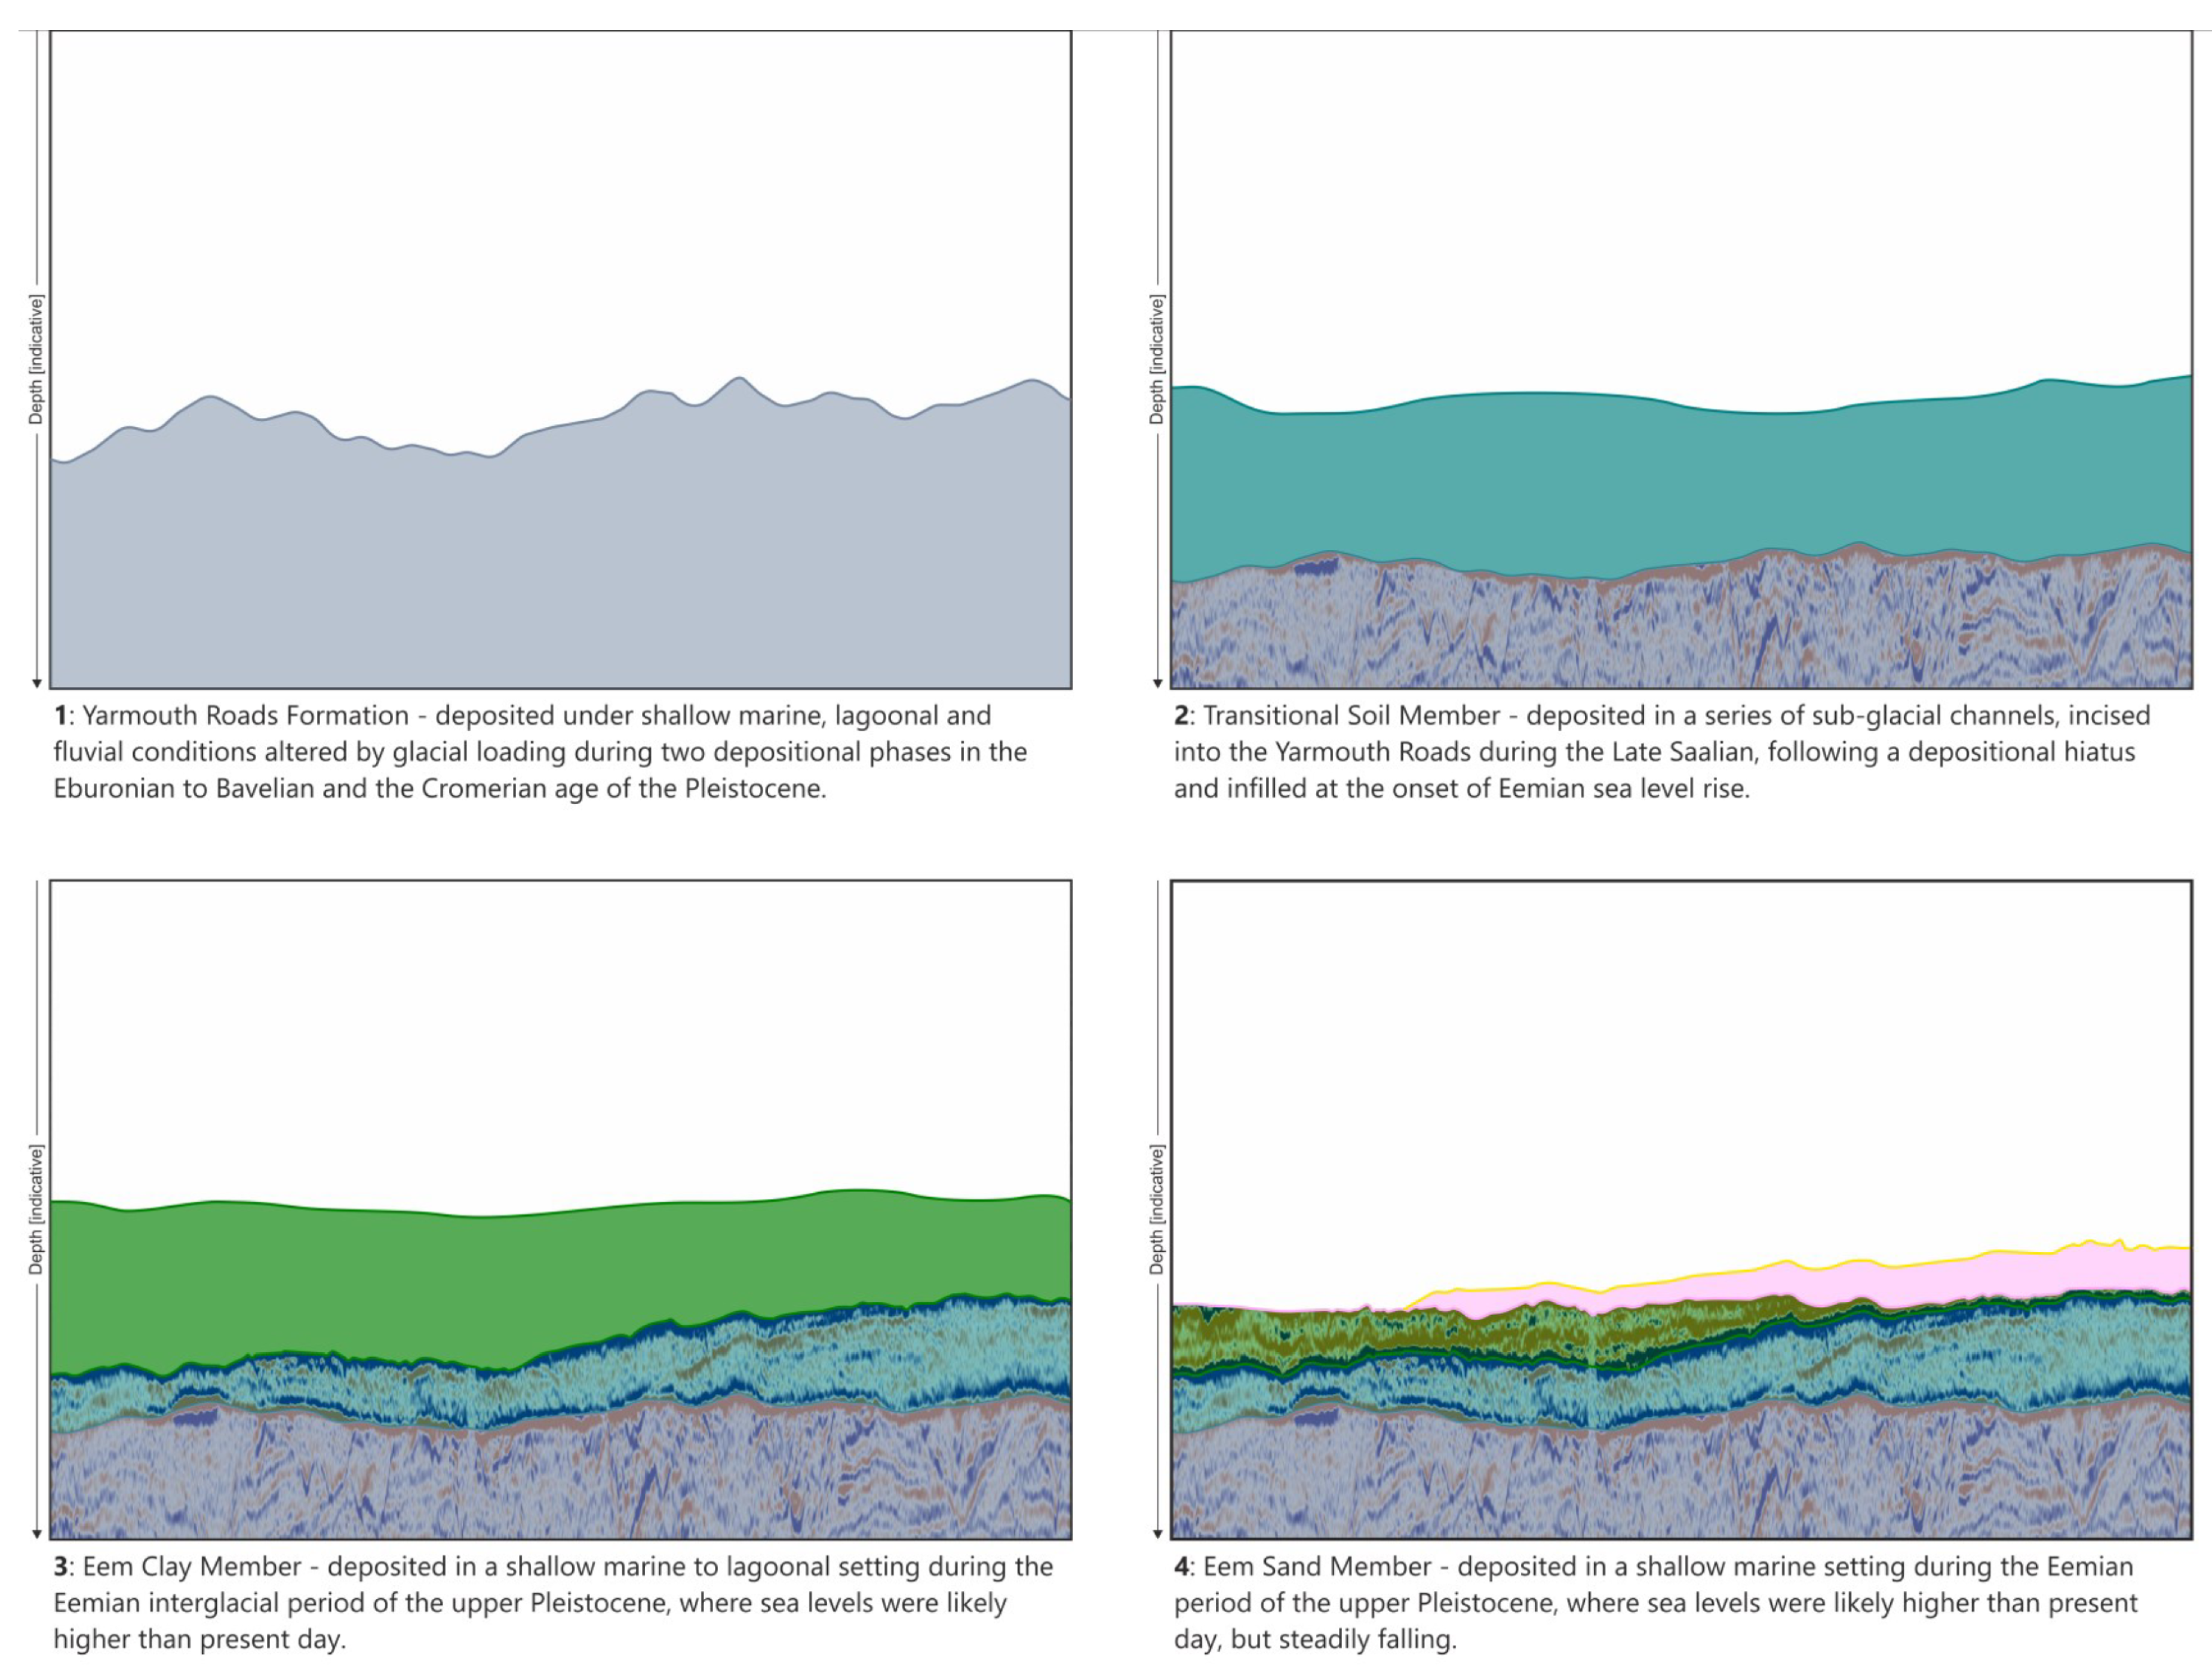
The complexity of the Middle to Late Pleistocene geological record can be demonstrated using the depositional history model for the Ijmuiden Ver Offshore wind farm zone, on the Dutch Continental Shelf [
23]. The conceptual model (
Figure 4) starts from the deposition of the Yarmouth Roads Formation during the mid-Pleistocene. Towards the end of the penultimate (Saalian) glaciation, sub-glacial channels incised the Yarmouth Roads Formation and were subsequently infilled during the sea level rise marking the onset of the following interglacial (Eemian) period.
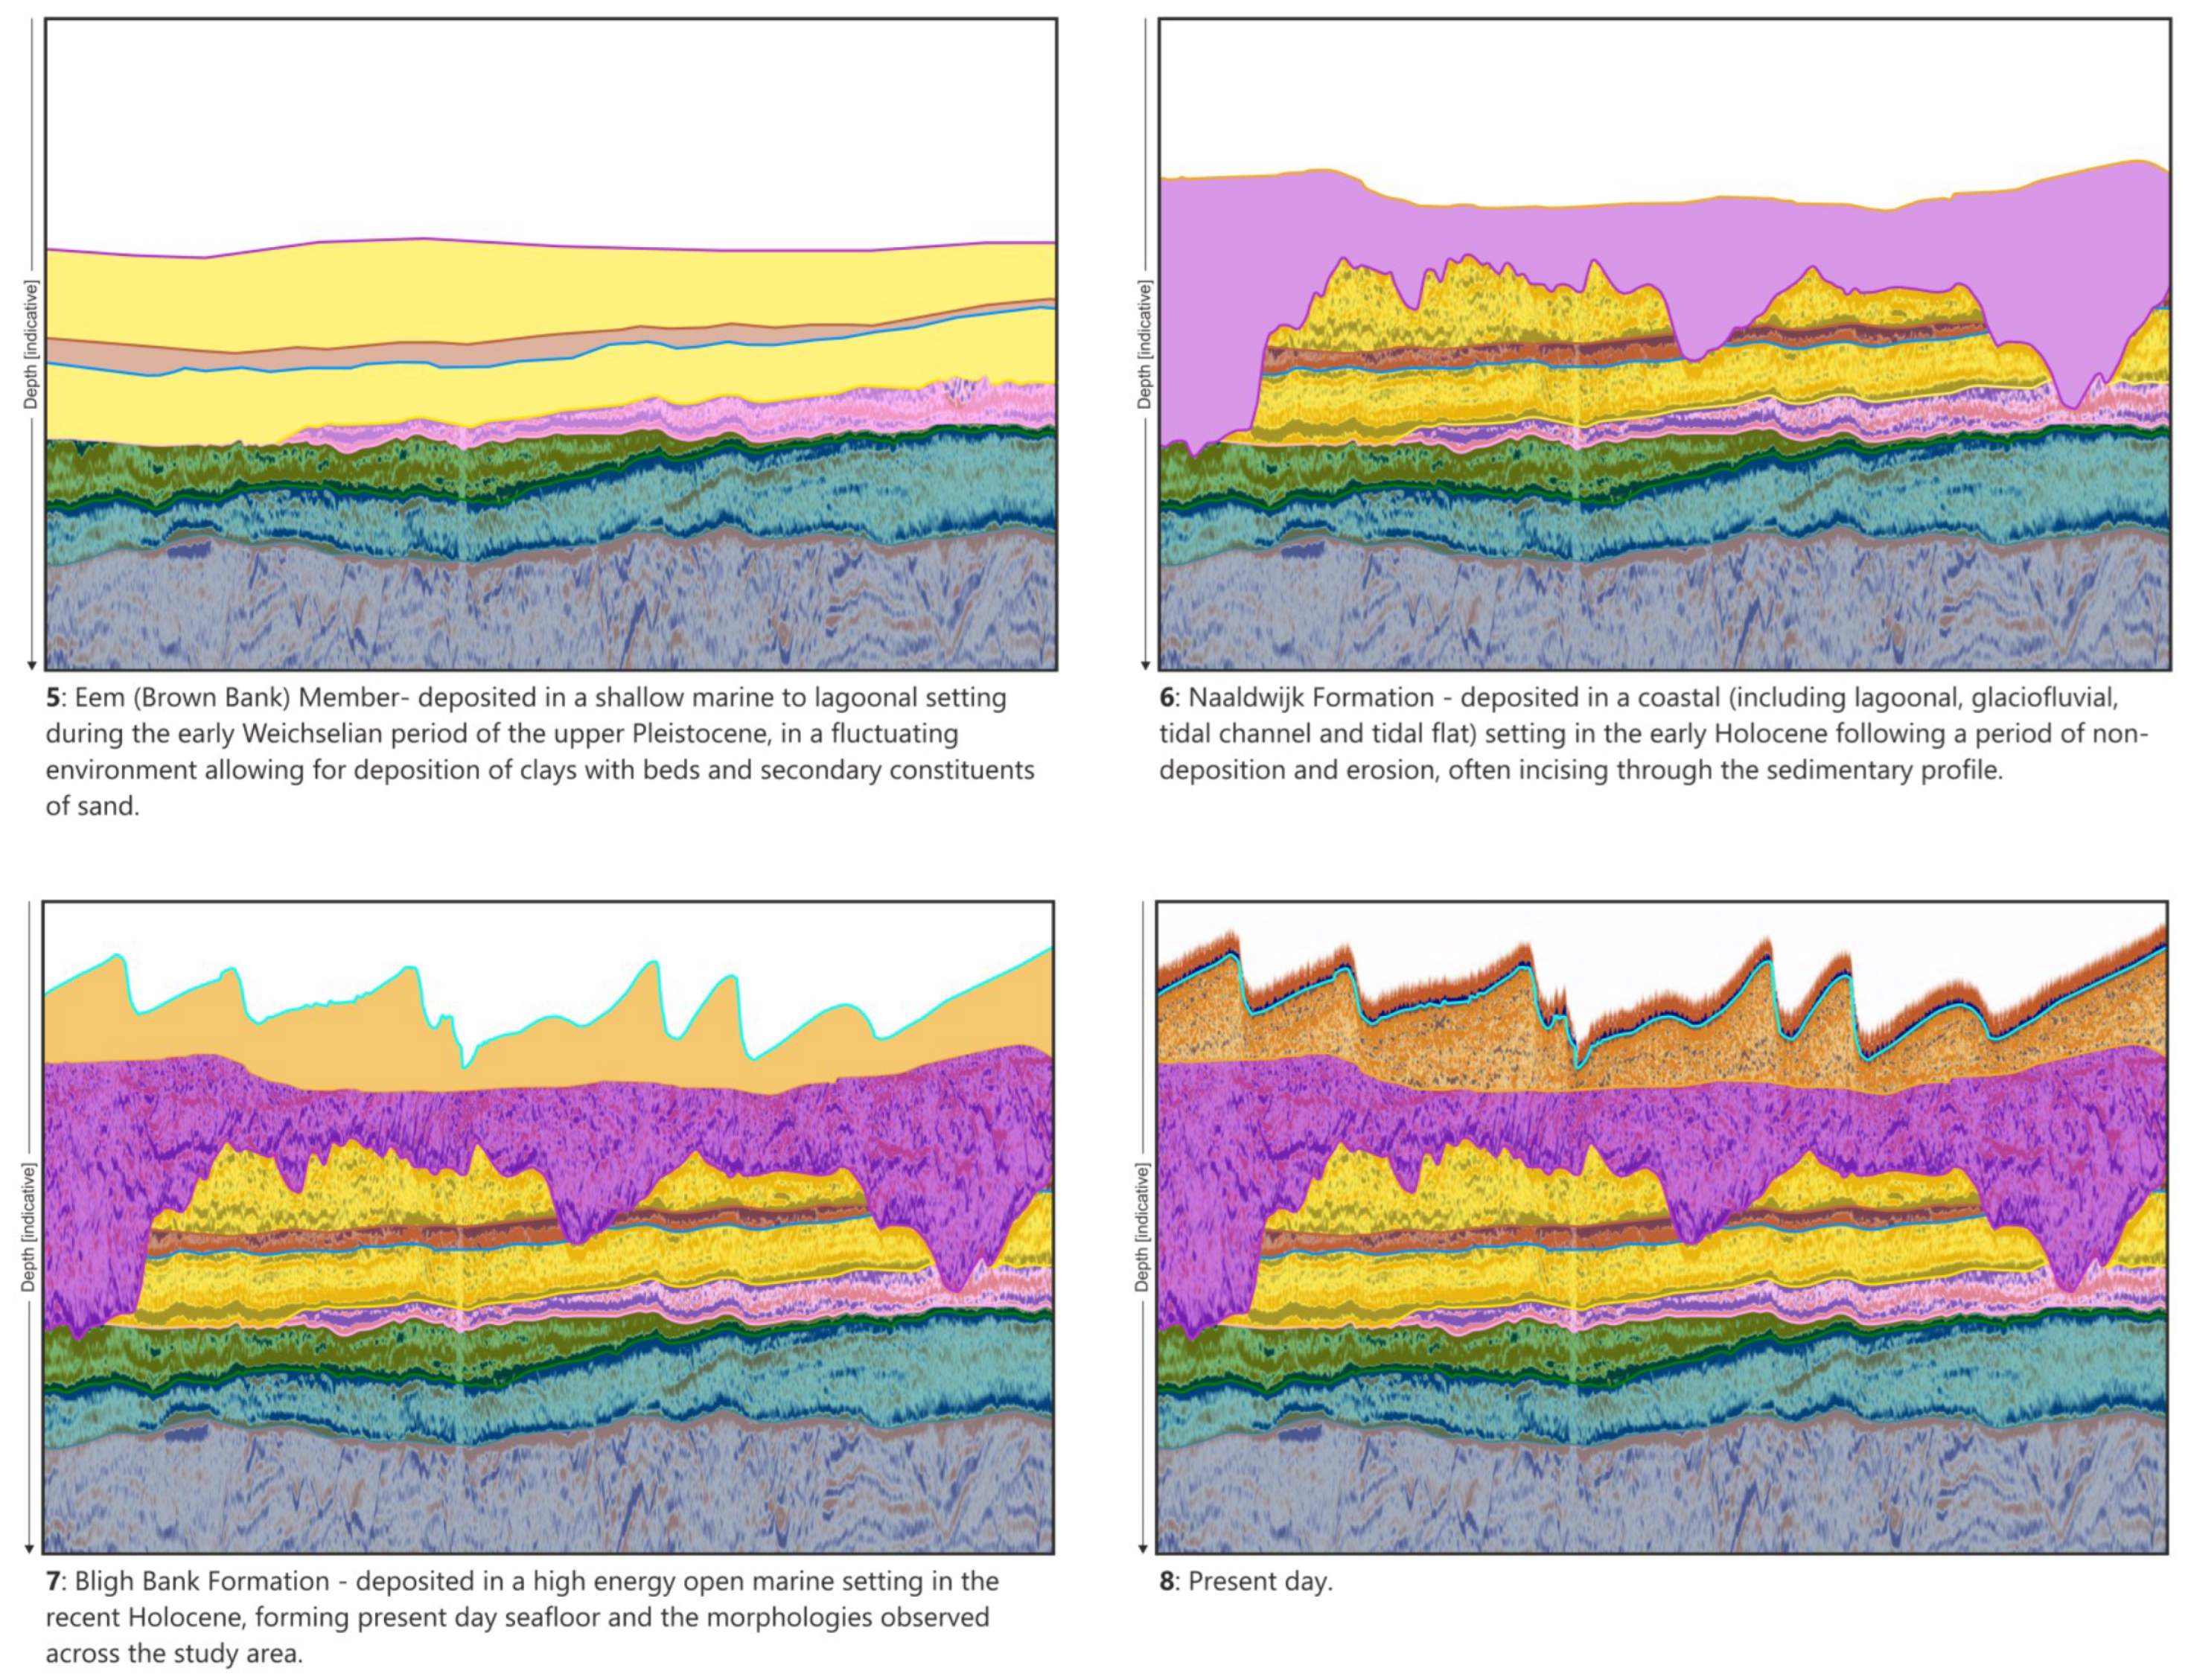
During the Eemian, clays were first deposited in a period with high sea level (
Figure 5). As sea level was gradually falling, sands were deposited and finally, in a shallow marine to lagoonal setting, an alternation of sand and clay was deposited (Brown Bank Member). During the last (Weichselian) glaciation, channels were eroded again, this time in the underlying Eemian deposits. These channels were infilled during the early Holocene transgression in a coastal environment. Finally, continued sea level risethroughout the Holocene gave rise to a high-energy open marine environment where sand was deposited, with the formation of bedforms (sandwaves and megaripples) which can clearly be noticed on the present-day sea floor from bathymetric surveys.
As outlined above, the geological history of the Southern/Central North Sea gives rise to overconsolidated sediments and highly variable deposits which, due to Quaternary glacial-interglacial cyclicity, may be formed in a wide range of (terrestrial to marine) depositional environments. This can be significantly different from the geology of onshore sites elsewhere in the world where data for calibration of CPT-based correlations for and was previously gathered. A detailed investigation into the applicability of such correlations is therefore warranted.
3. Shear Wave Velocity Dataset
3.1. Geographic Locations
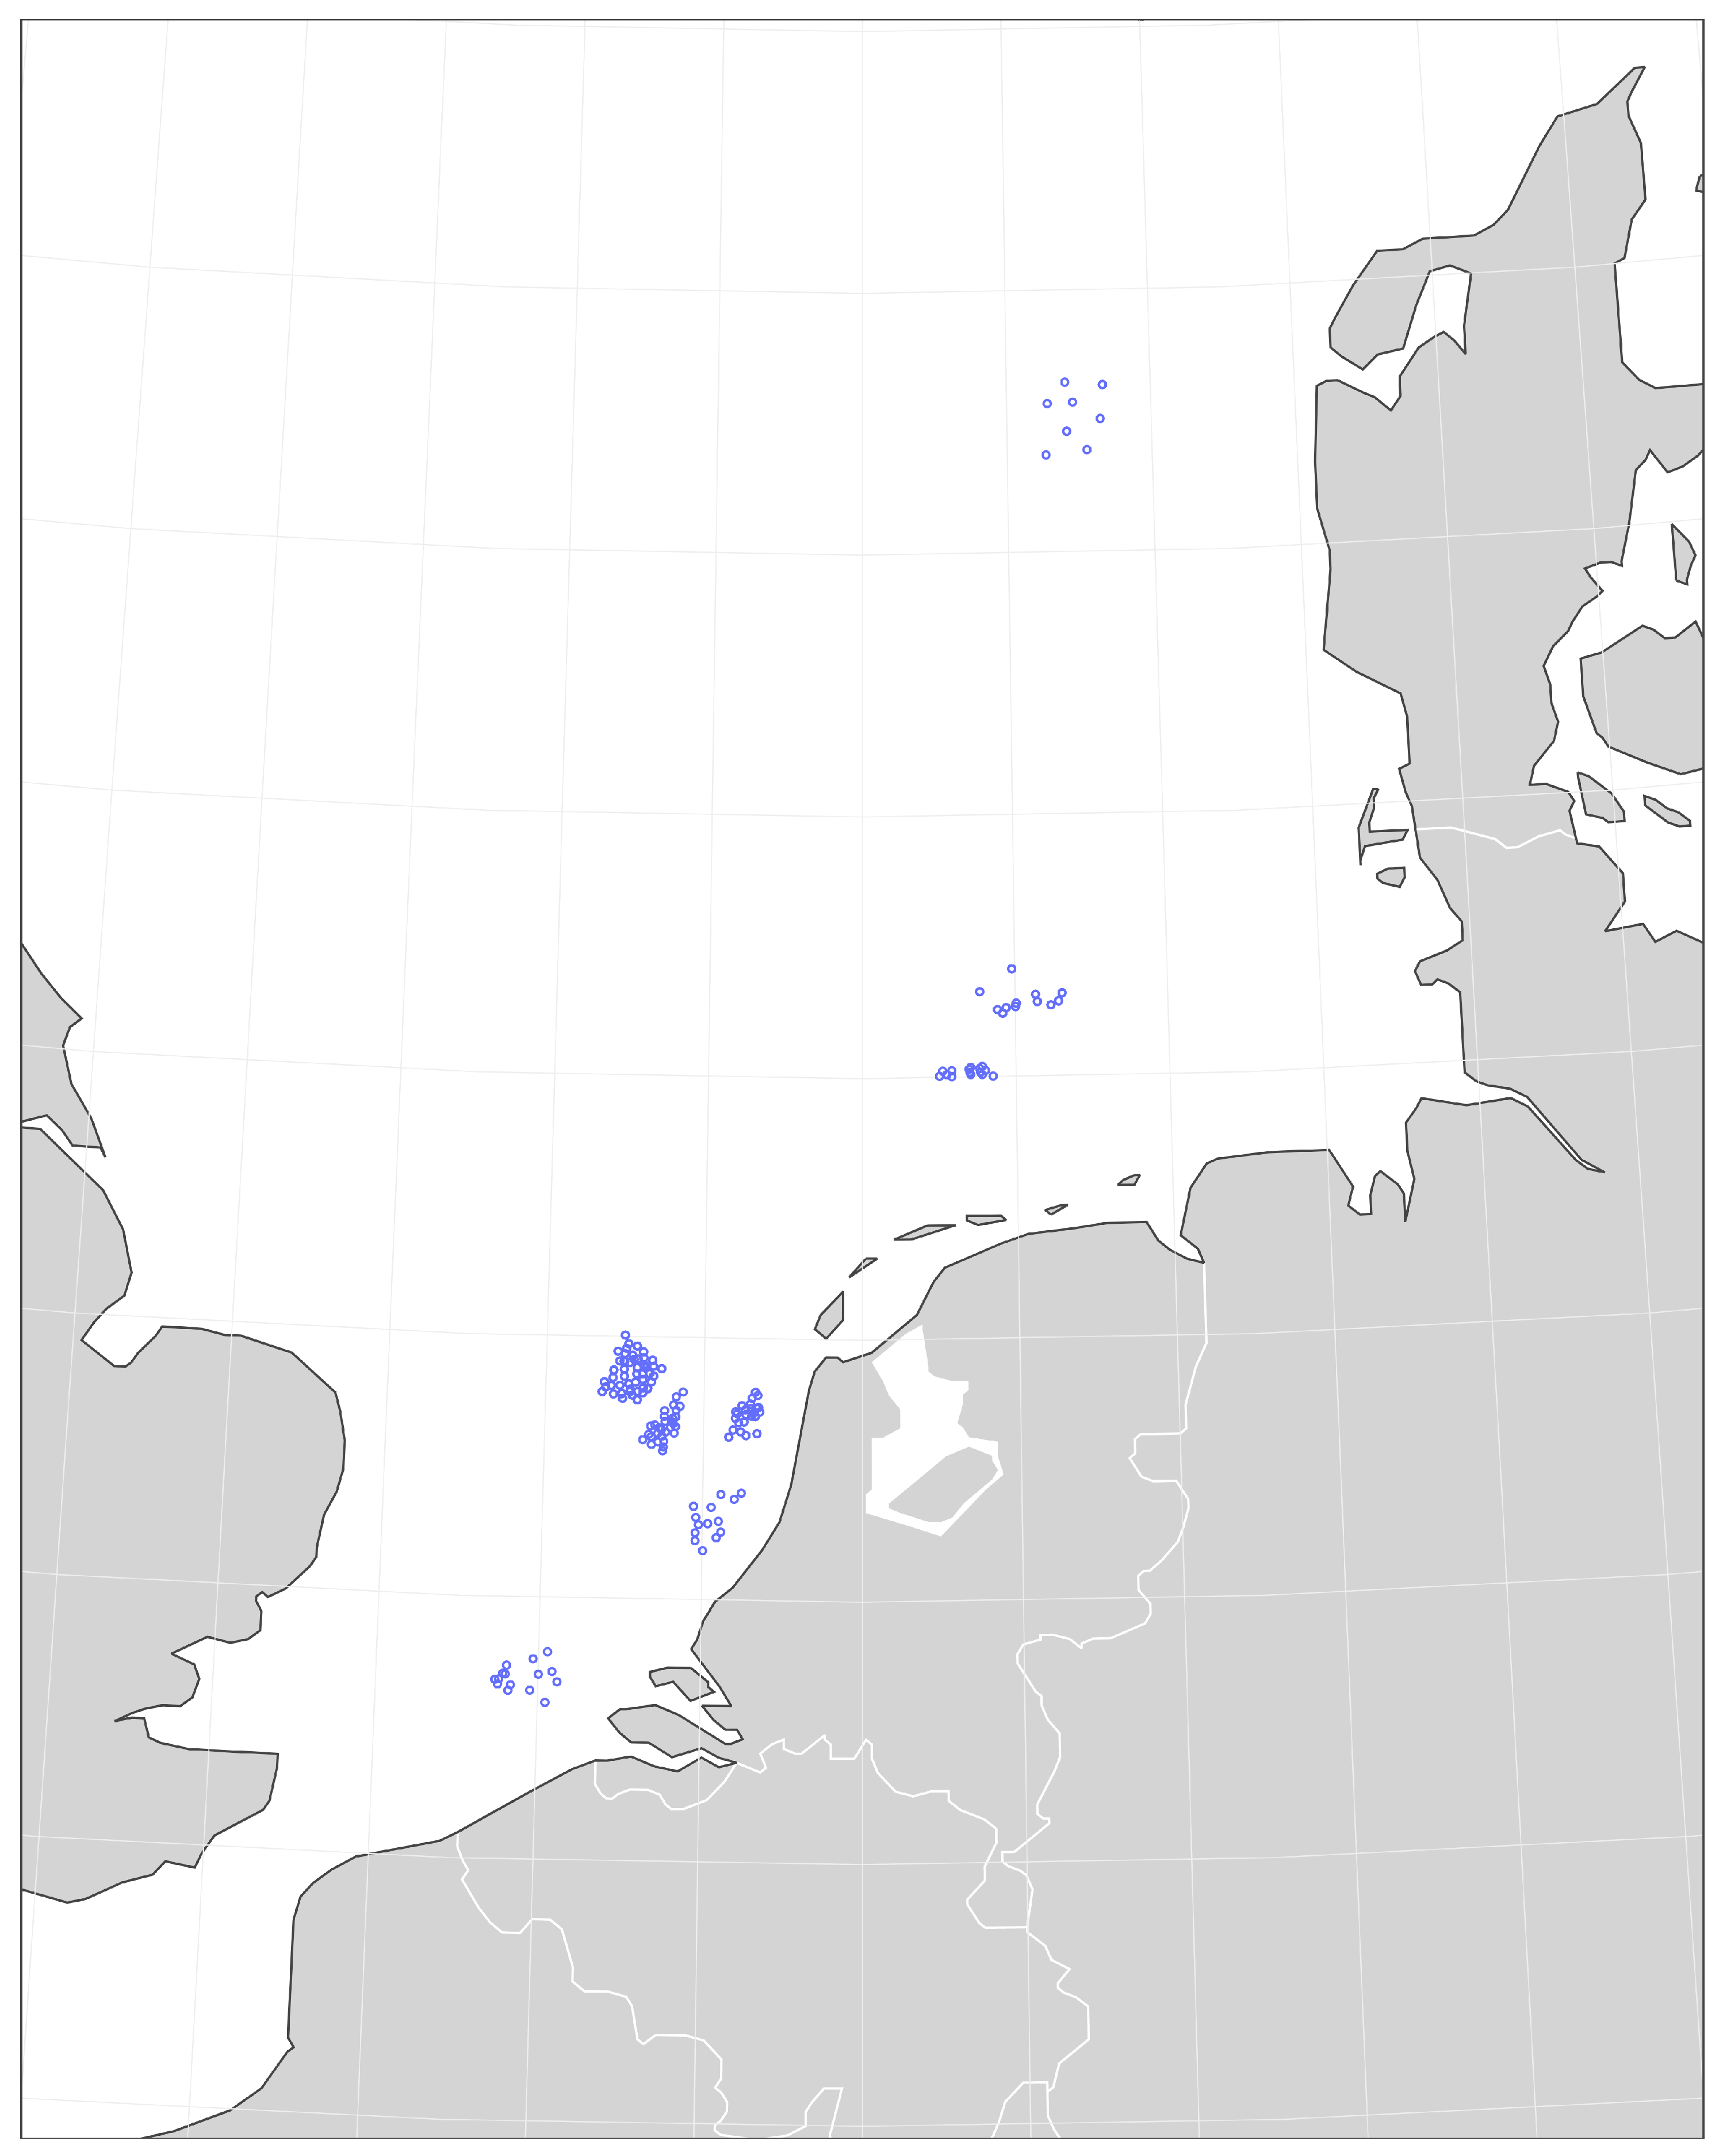
The correlations were evaluated against 4145 S-PCPT measurements spread over 207 geotechnical testing locations in the Belgian, Dutch, German and Danish sectors [
24,
25,
26] of the North Sea. For some locations in these projects, borehole geophysical logging results with measurement of shear wave velocity
and compression wave velocity
were available but the link with CPT data was more difficult to establish due to effects of drilling disturbance. Hence, this P-S logging data was not considered in this work.
Laboratory measurements of with bender elements and with the resonant column test were also available but due to uncertainty on sample disturbance (for cohesive samples) and sample reconstitution (for cohesionless samples), linking these results to CPT measurements was not straightforward. The laboratory test data was therefore not used in this study.
The available S-PCPT measurements were classified based on the soil behaviour type index (
) [
14] calculated from the CPT tests. The majority of the measurements is taken in sand to silty sand deposits (
Table 1) with only limited data in cohesive soils. The cohesive soils are mainly found in the Ijmuiden Ver, Belgian and Danish area where data coverage is limited. The locations of the S-PCPT tests are shown in
Figure 6.
The project zones from which the data were taken are listed in
Table 1. The increasing importance of the small-strain shear modulus in the geotechnical design process can clearly be observed with greater data coverage on the Hollandse Kust, Ten Noorden van Waddeneilanden (TNW) and Ijmuiden Ver zones. The surveys in these areas were performed after the PISA design method for lateral pile-soil interaction for wind turbine monopiles [
7] recommended the use of
as the primary geotechnical parameter.
3.2. Measurement Setup
The
measurements in the dataset were all gathered using a measurement setup with two geophone arrays positioned at two different positions behind the cone tip. The spacing of the geophone arrays was 0.5m. Shear wave velocity
was inferred from the cross-correlation between the signals received at the upper and lower geophone. This method is more reliable than
determination from a single geophone array setup [
27]. The
values reported by the site investigation contractors are used for the analyses presented in this paper but the quality of this data may be affected by the processing methology. Masters et al. [
28] present a review of the potential sources of error during S-PCPT test processing including the uncertainties on geophone depth, seismic source offset, trigger timing and arrival times of the shear waves.
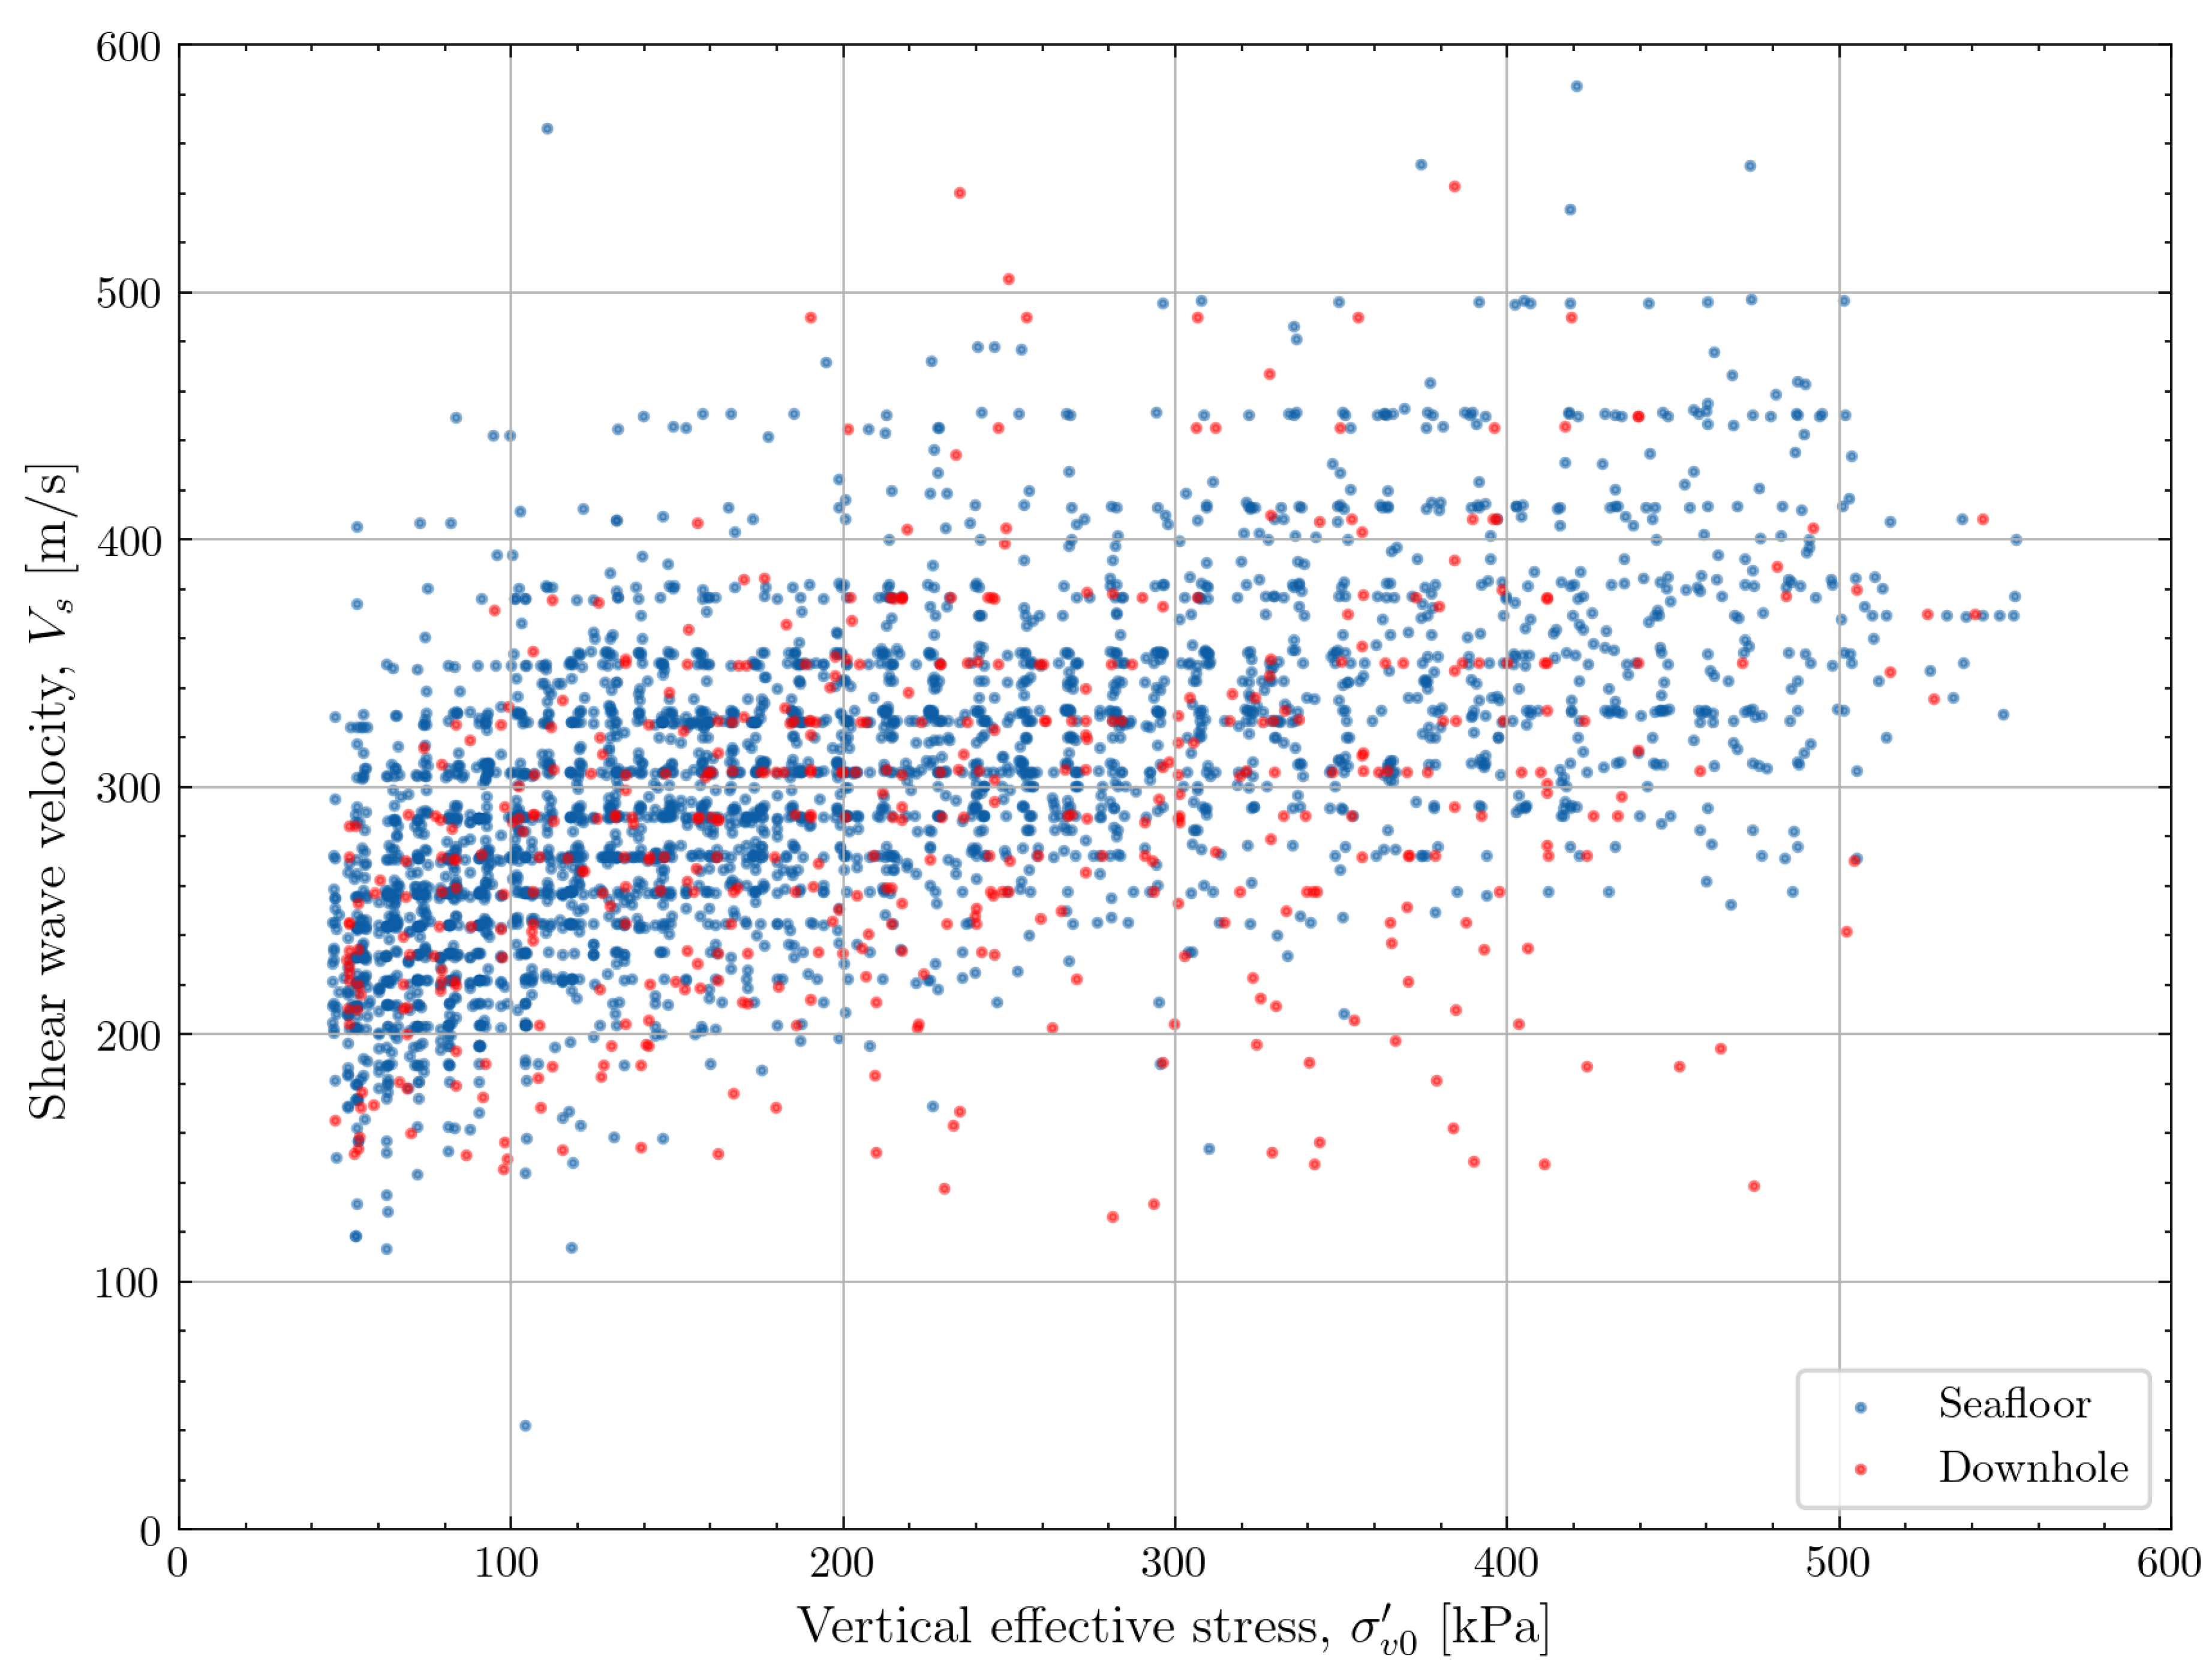
The dataset consists mainly of seismic CPTs performed with a seafloor CPT system. In the Belgian zone, the Borssele zone and Hollandse Kust Zuid zone, the seismic CPT data was collected with a downhole CPT system. The downhole CPT is performed from the bottom of the drillpile and the drilling process can lead to greater signal to noise ratios and depth uncertainty [
29]. The effect of the CPT testing method (seafloor or downhole mode) can be observed by looking at the relation of vertical effective stress to shear wave velocity in
Figure 7. An increased scatter is observed for the data collected in downhole mode. Because of the greater confidence in the seafloor CPT data, only this subset of the overall dataset was retained for further processing.
3.3. Data Processing
Each S-PCPT datapoint was connected to the corresponding CPT data. Because the distance between the geophones of the dual geophone setup is 0.5m, CPT data was averaged in a 0.5m interval between the two geophones. The raw CPT data was processed using the cone area ratio provided in the factual reports of the CPT campaigns. Vertical total and effective stress profiles were calculated using unit weights derived from density and water content index tests. Because of the overconsolidation of most geological units present at the site, the effective unit weight was typically between 18.5 and 20.5kN/m
3 [
24]. The bulk density derived
from the saturated unit weight was used to calculate the small-strain shear modulus
using the fundamental relation from Equation
1.
The soil behaviour type index according to [
14] was calculated to differentiate between soil types based on the normalised cone resistance
and the normalised friction ratio
derived from CPT data. All derived quantities for the CPT-based correlations described in
Section 4 were thus available.
Furthermore, shear wave velocity measurements above 5m depth below seafloor were discarded in accordance with ISO 19901-8 [
30]. This near-surface data is deemed unreliable because of the potential interference of surface waves with shear waves.
3.4. Dataset Overview
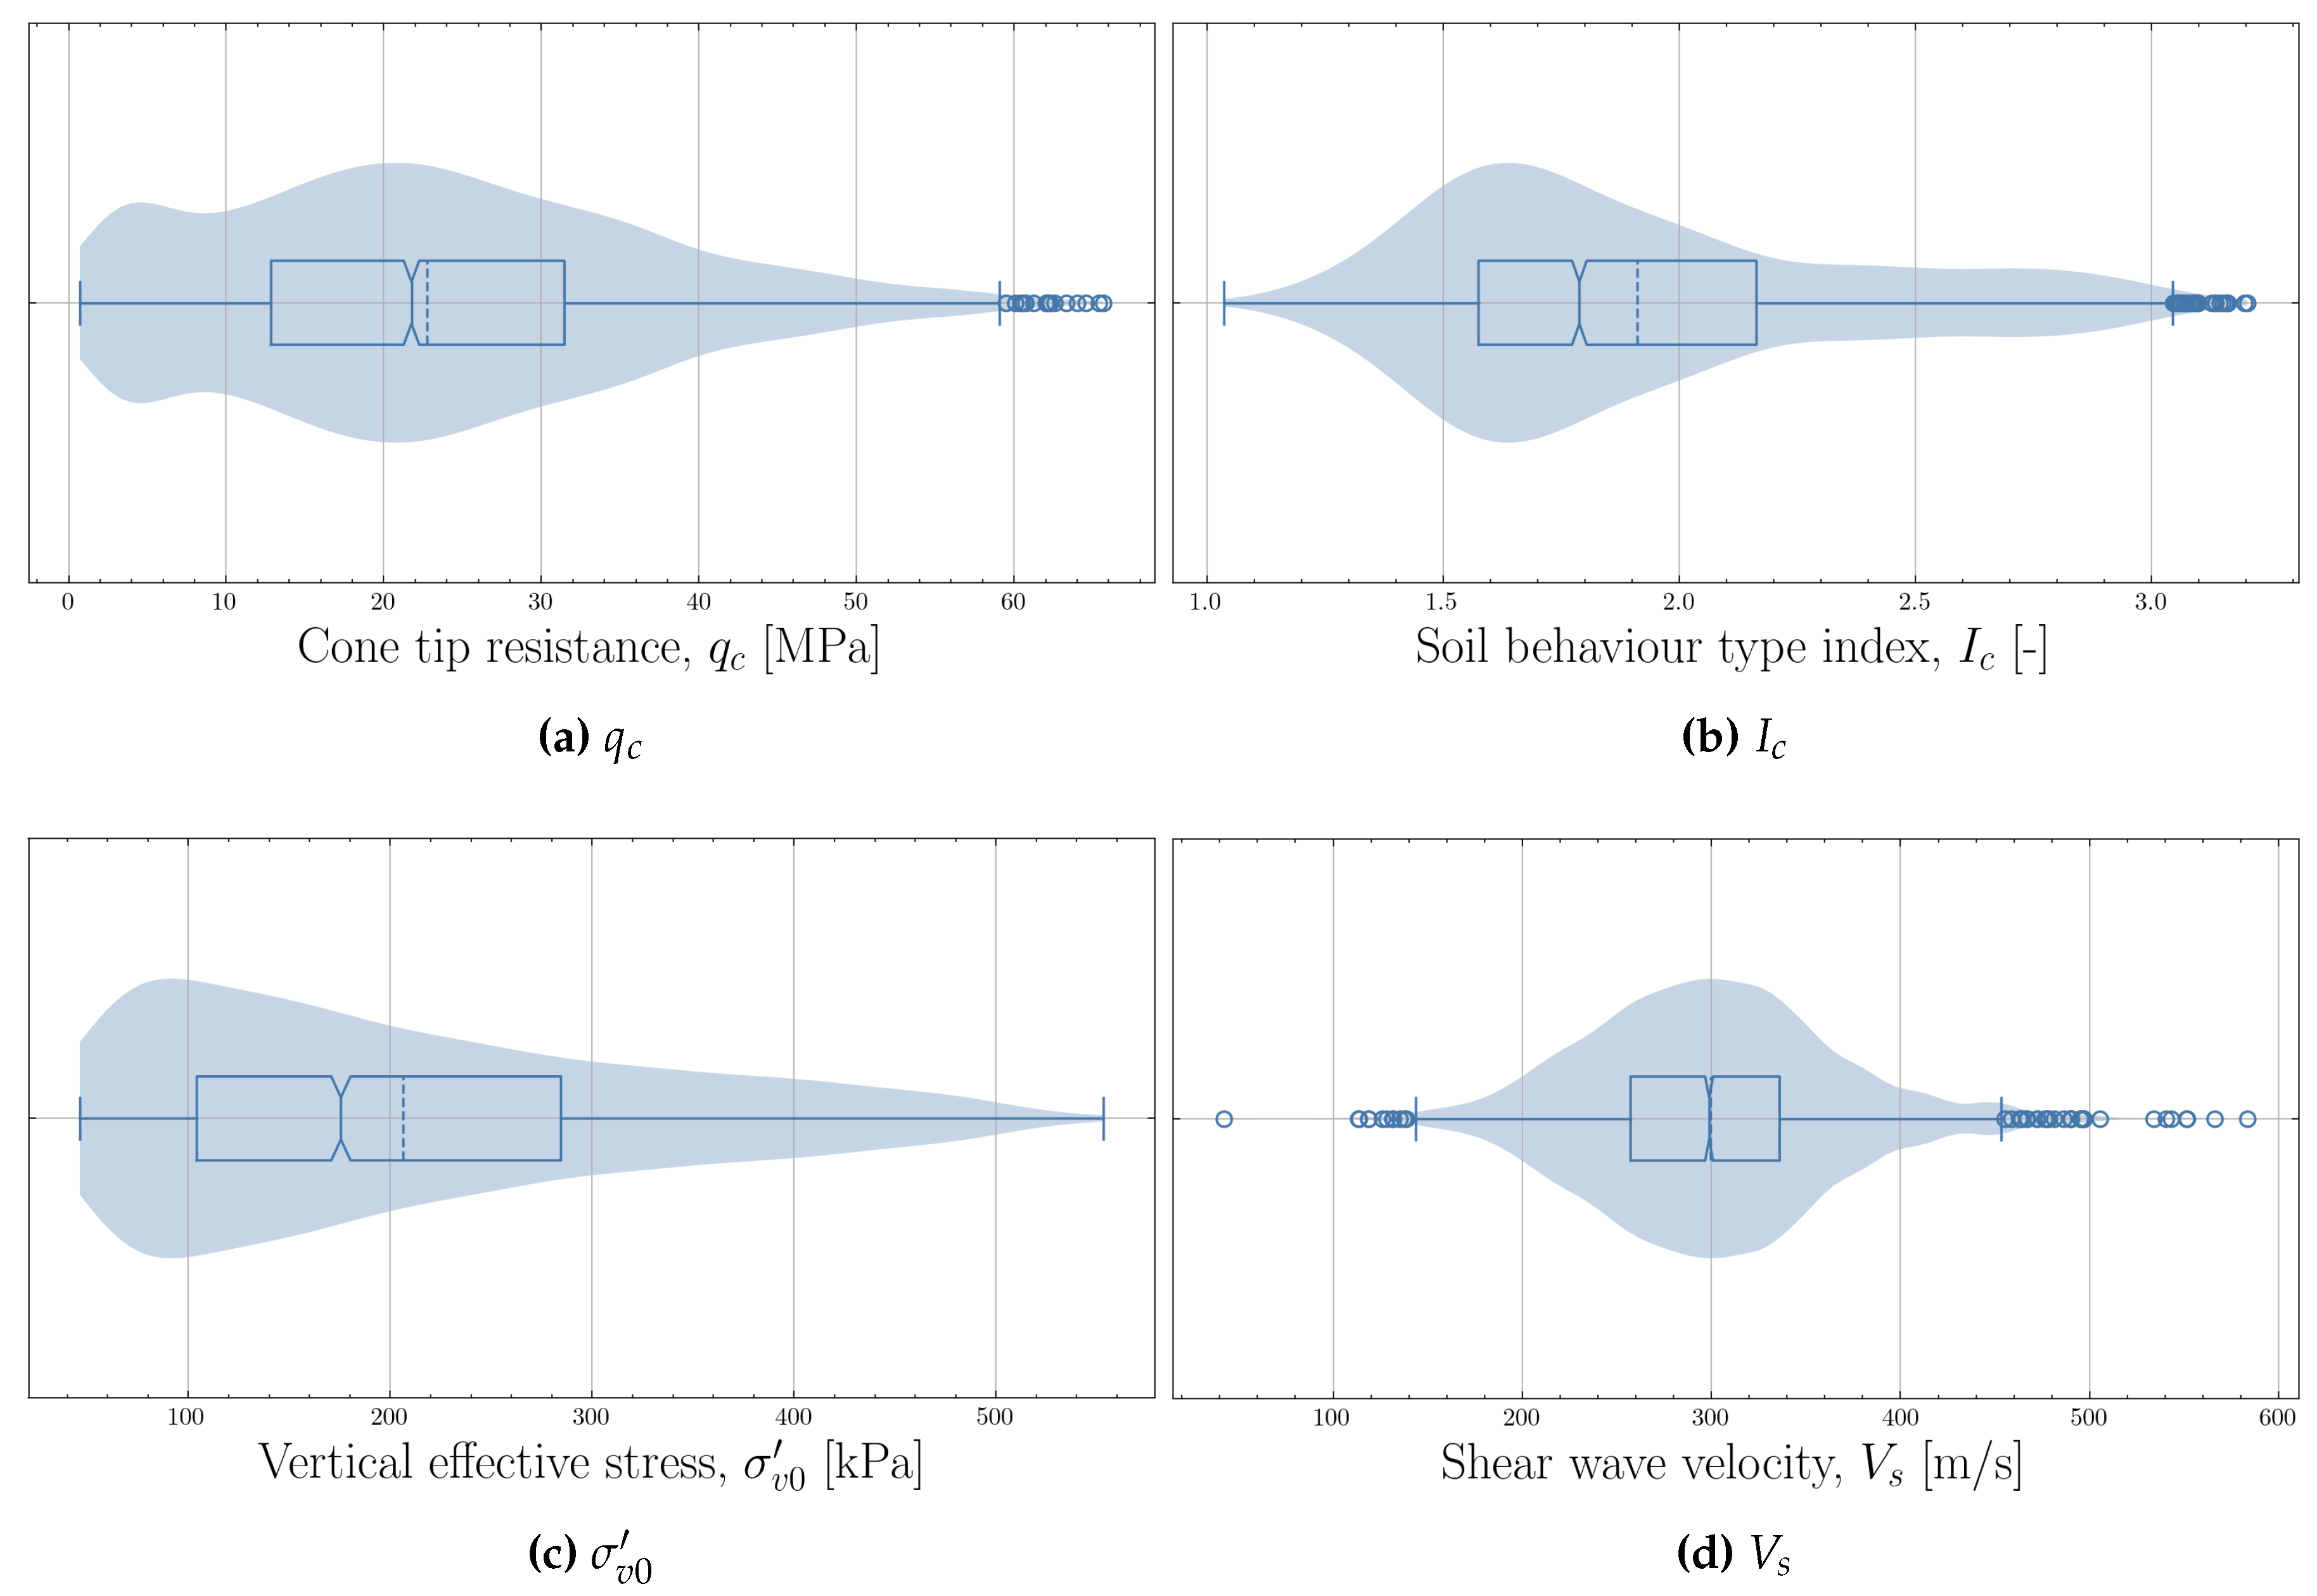
The distribution of the data over the feature parameter space can also be visualized using boxplots and violin plots [
31]. Violin plots add a visualization of the distribution of the data as a filled area. Both plots can be combined to provide insight in the distribution of the individual variables in the dataset.
Figure 8 shows the how different cone resistances (
), soil behaviour type indices (
), vertical effective stresses (
) and shear wave velocities (
) are represented in the dataset.
As already highlighted in
Table 1, the dataset is dominated by cohesionless soils which have a soil behaviour type index
smaller than 2.5 and a relatively high cone tip resistance
(increasing with depth). The lower left panel in
Figure 8 shows that data above 5m depth was removed and that the majority of the measurements were taken between 10m and 30m depth. The maximum depth was approximately 50m depth (
kPa).
As part of this publication, the processed data derived from public-domain site investigation data is shared [
32].
3.5. Observed Trends
The dependence of
on features such as vertical effective stress
, total cone resistance
and soil behaviour type index
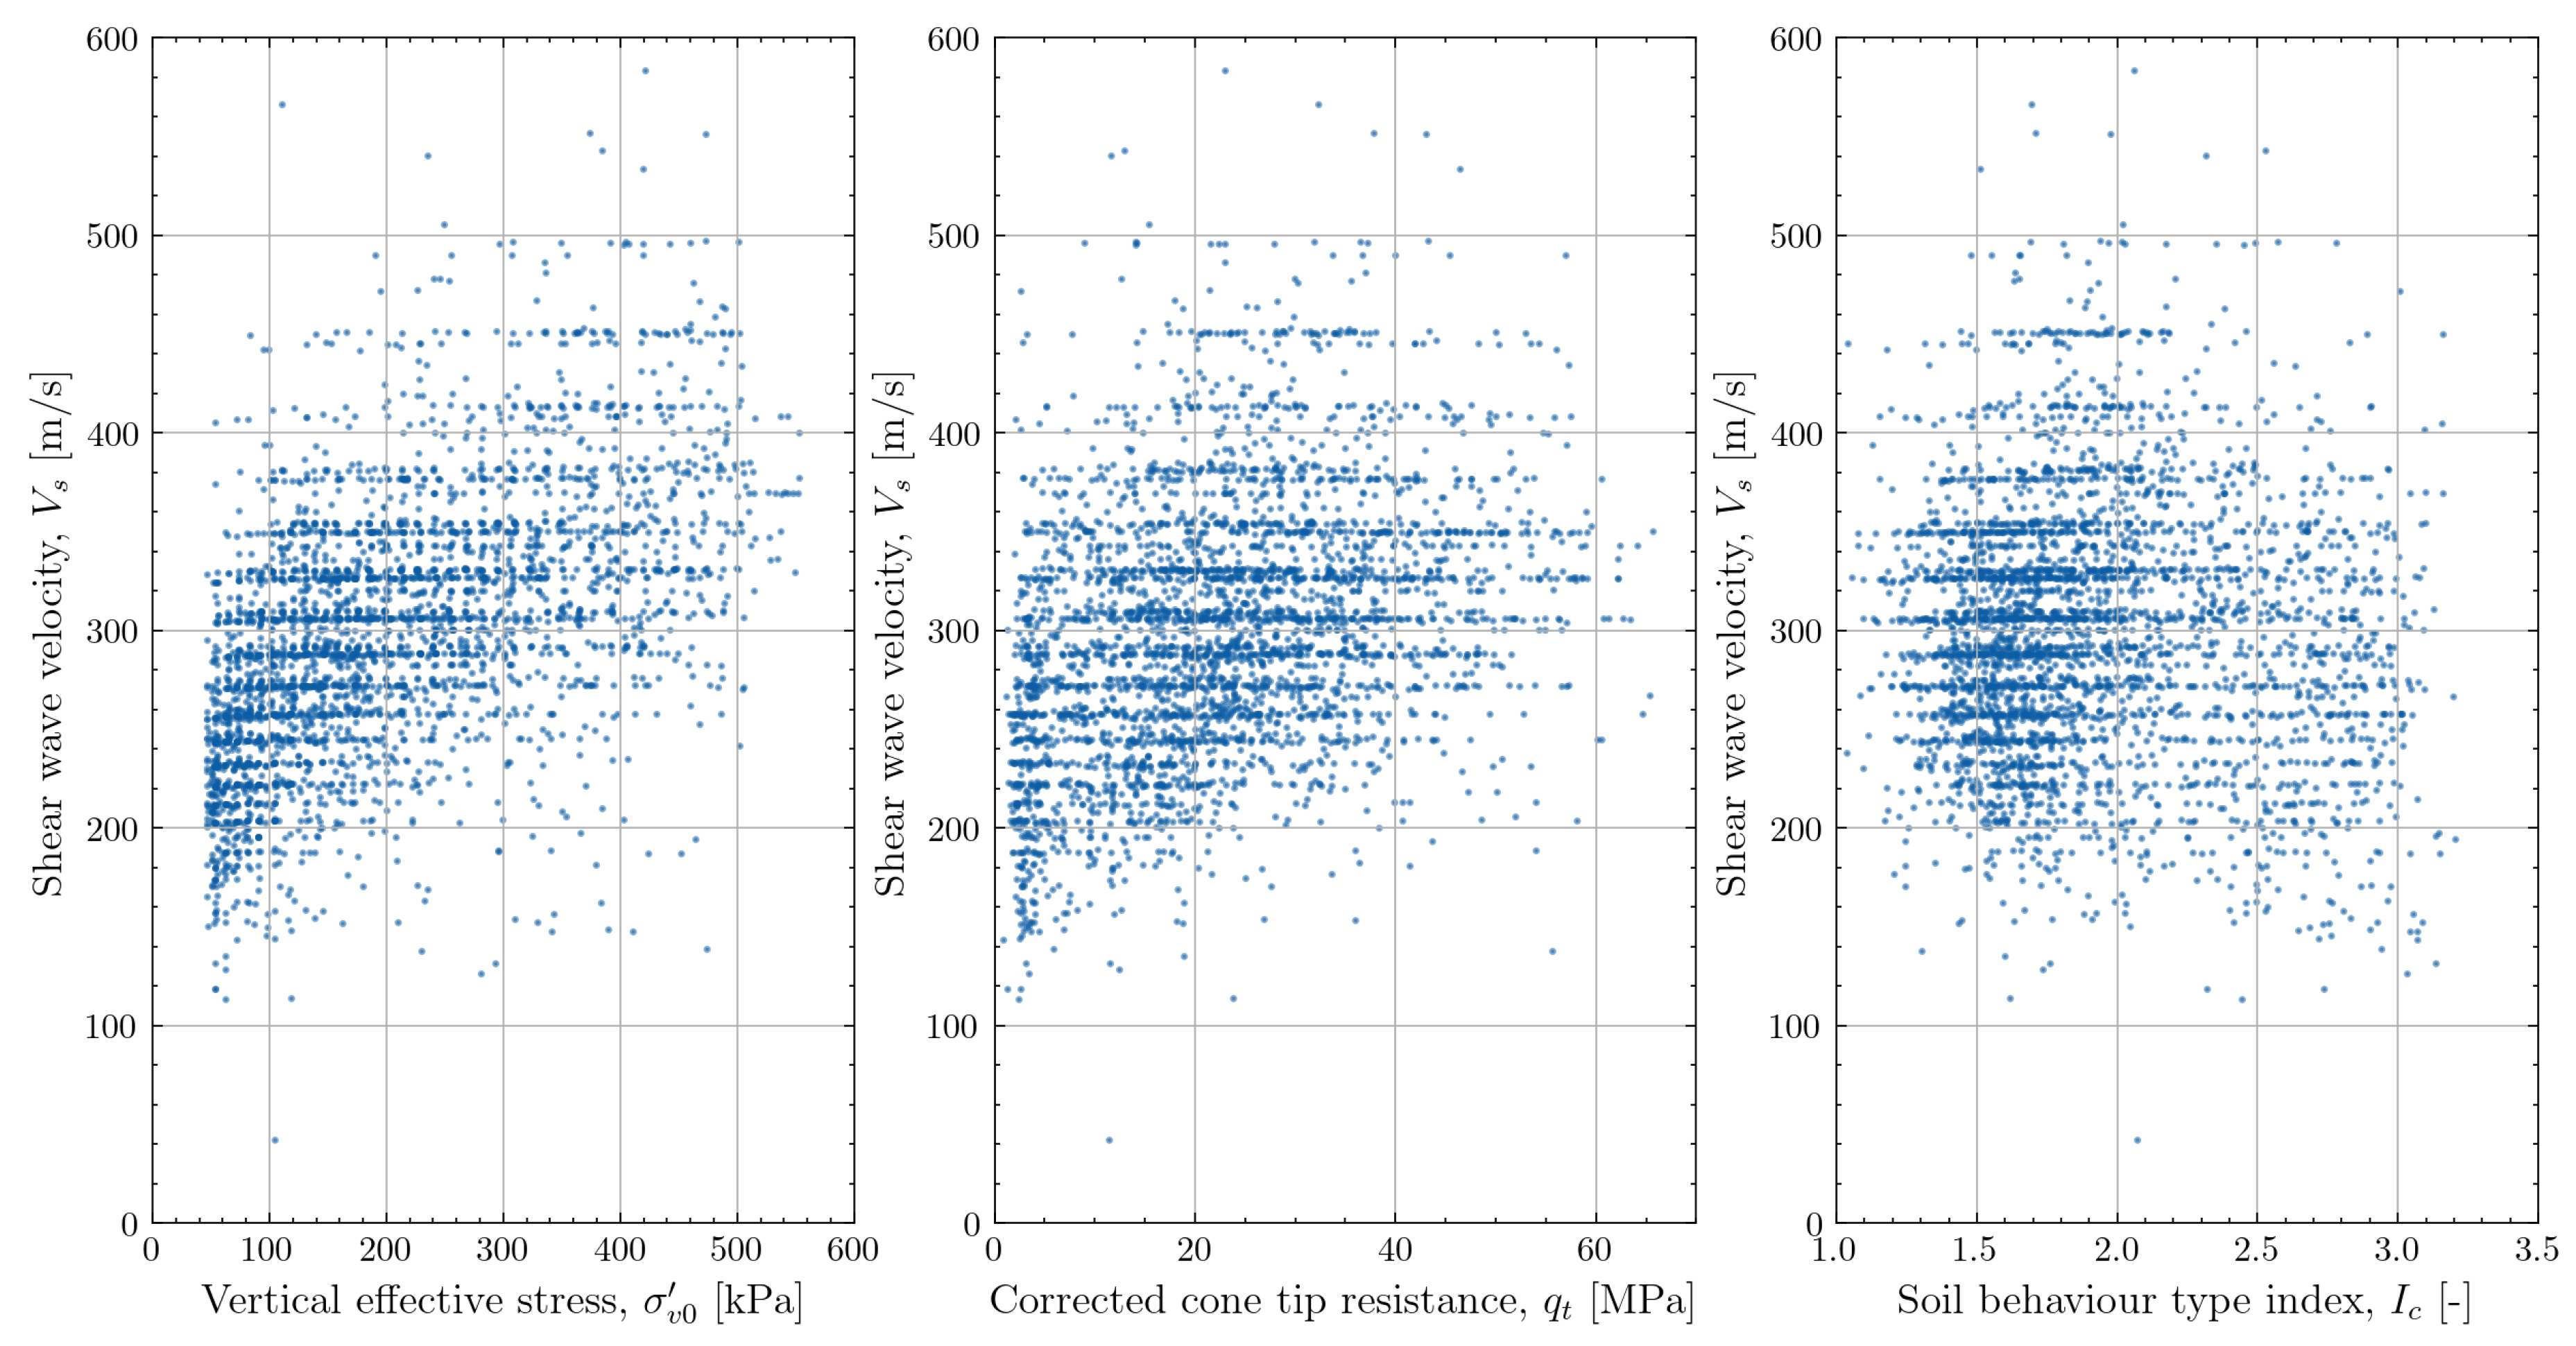
can be checked through a scatterplot.
Figure 9 shows that shear wave velocity generally increases with increasing
or
. A pronounced trend cannot be identified for the evolution of
with increasing
. A large amount of scatter is observed for each of the features which suggests that deriving a shear wave velocity model based on a single feature is not possible. The combined effect of multiple features needs to be considered.
4. Critical Review of Existing CPT-Based Correlations
In this section, the CPT-based correlations for
and
which are most widely used by geotechnical designers are reviewed. The selected correlations are shown in
Table 2. The underlying datasets used for calibrating the semi-empirical correlations and the physical meaning of their mathematical formulae are discussed and the predictions for the North Sea dataset are evaluated through scatterplots of calculated vs measured
or
. These scatterplots are presented for each of the evaluated correlations. The measured values of
or the values of
inferred from the measured shear wave velocity using the density measured at the depth of the geophones, are plotted against the estimated value of
or
. The measurements are colour-coded based on the soil behaviour type index
[
14] to allow a visual distinction between the behaviour for the different soil types. The dashed black lines in the figure represent parity; where
or
are perfectly estimated.
4.1. Review of Correlations
4.1.1. Hardin and Black (1968)
The correlation proposed by Hardin and Black [
33] was the earliest formula identified from the literature which links small-strain shear modulus to other geotechnical properties. The correlation proposed in the paper is based on resonant column tests on normally consolidated kaolinite and a comparison with previously obtained data for clays with different structures.
The formula proposed by the authors is shown in Equation
2 where
is the void ratio of the clay,
is the effective pressure,
is a reference pressure (atmospheric pressure) and
B is a calibration coefficient.
The correlation was not developed as a CPT-based correlation. However, estimation of the void ratio of saturated soils from CPT data is possible using a correlation between unit weight and CPT data. In this work, the correlation by Mayne et al. [
34] is used to derive unit weight from CPT data as given in Equation
3.
is the unit weight of water,
is the corrected sleeve friction and
is the vertical effective stress at the depth considered. It should be noted that applying such a correlation for void ratio introduces an additional tranformation uncertainty in the estimation of
.
Although the test data used to develop the correlation consisted of cohesive soils, the formula in Equation
2 was also calibrated to data for cohesionless soil for the PISA project [
35]. A calibration coefficient
was proposed for the Dunkirk test site which consists of dense sand. This calibration coefficient was used to evaluate the performance of the correlation on the North Sea dataset.
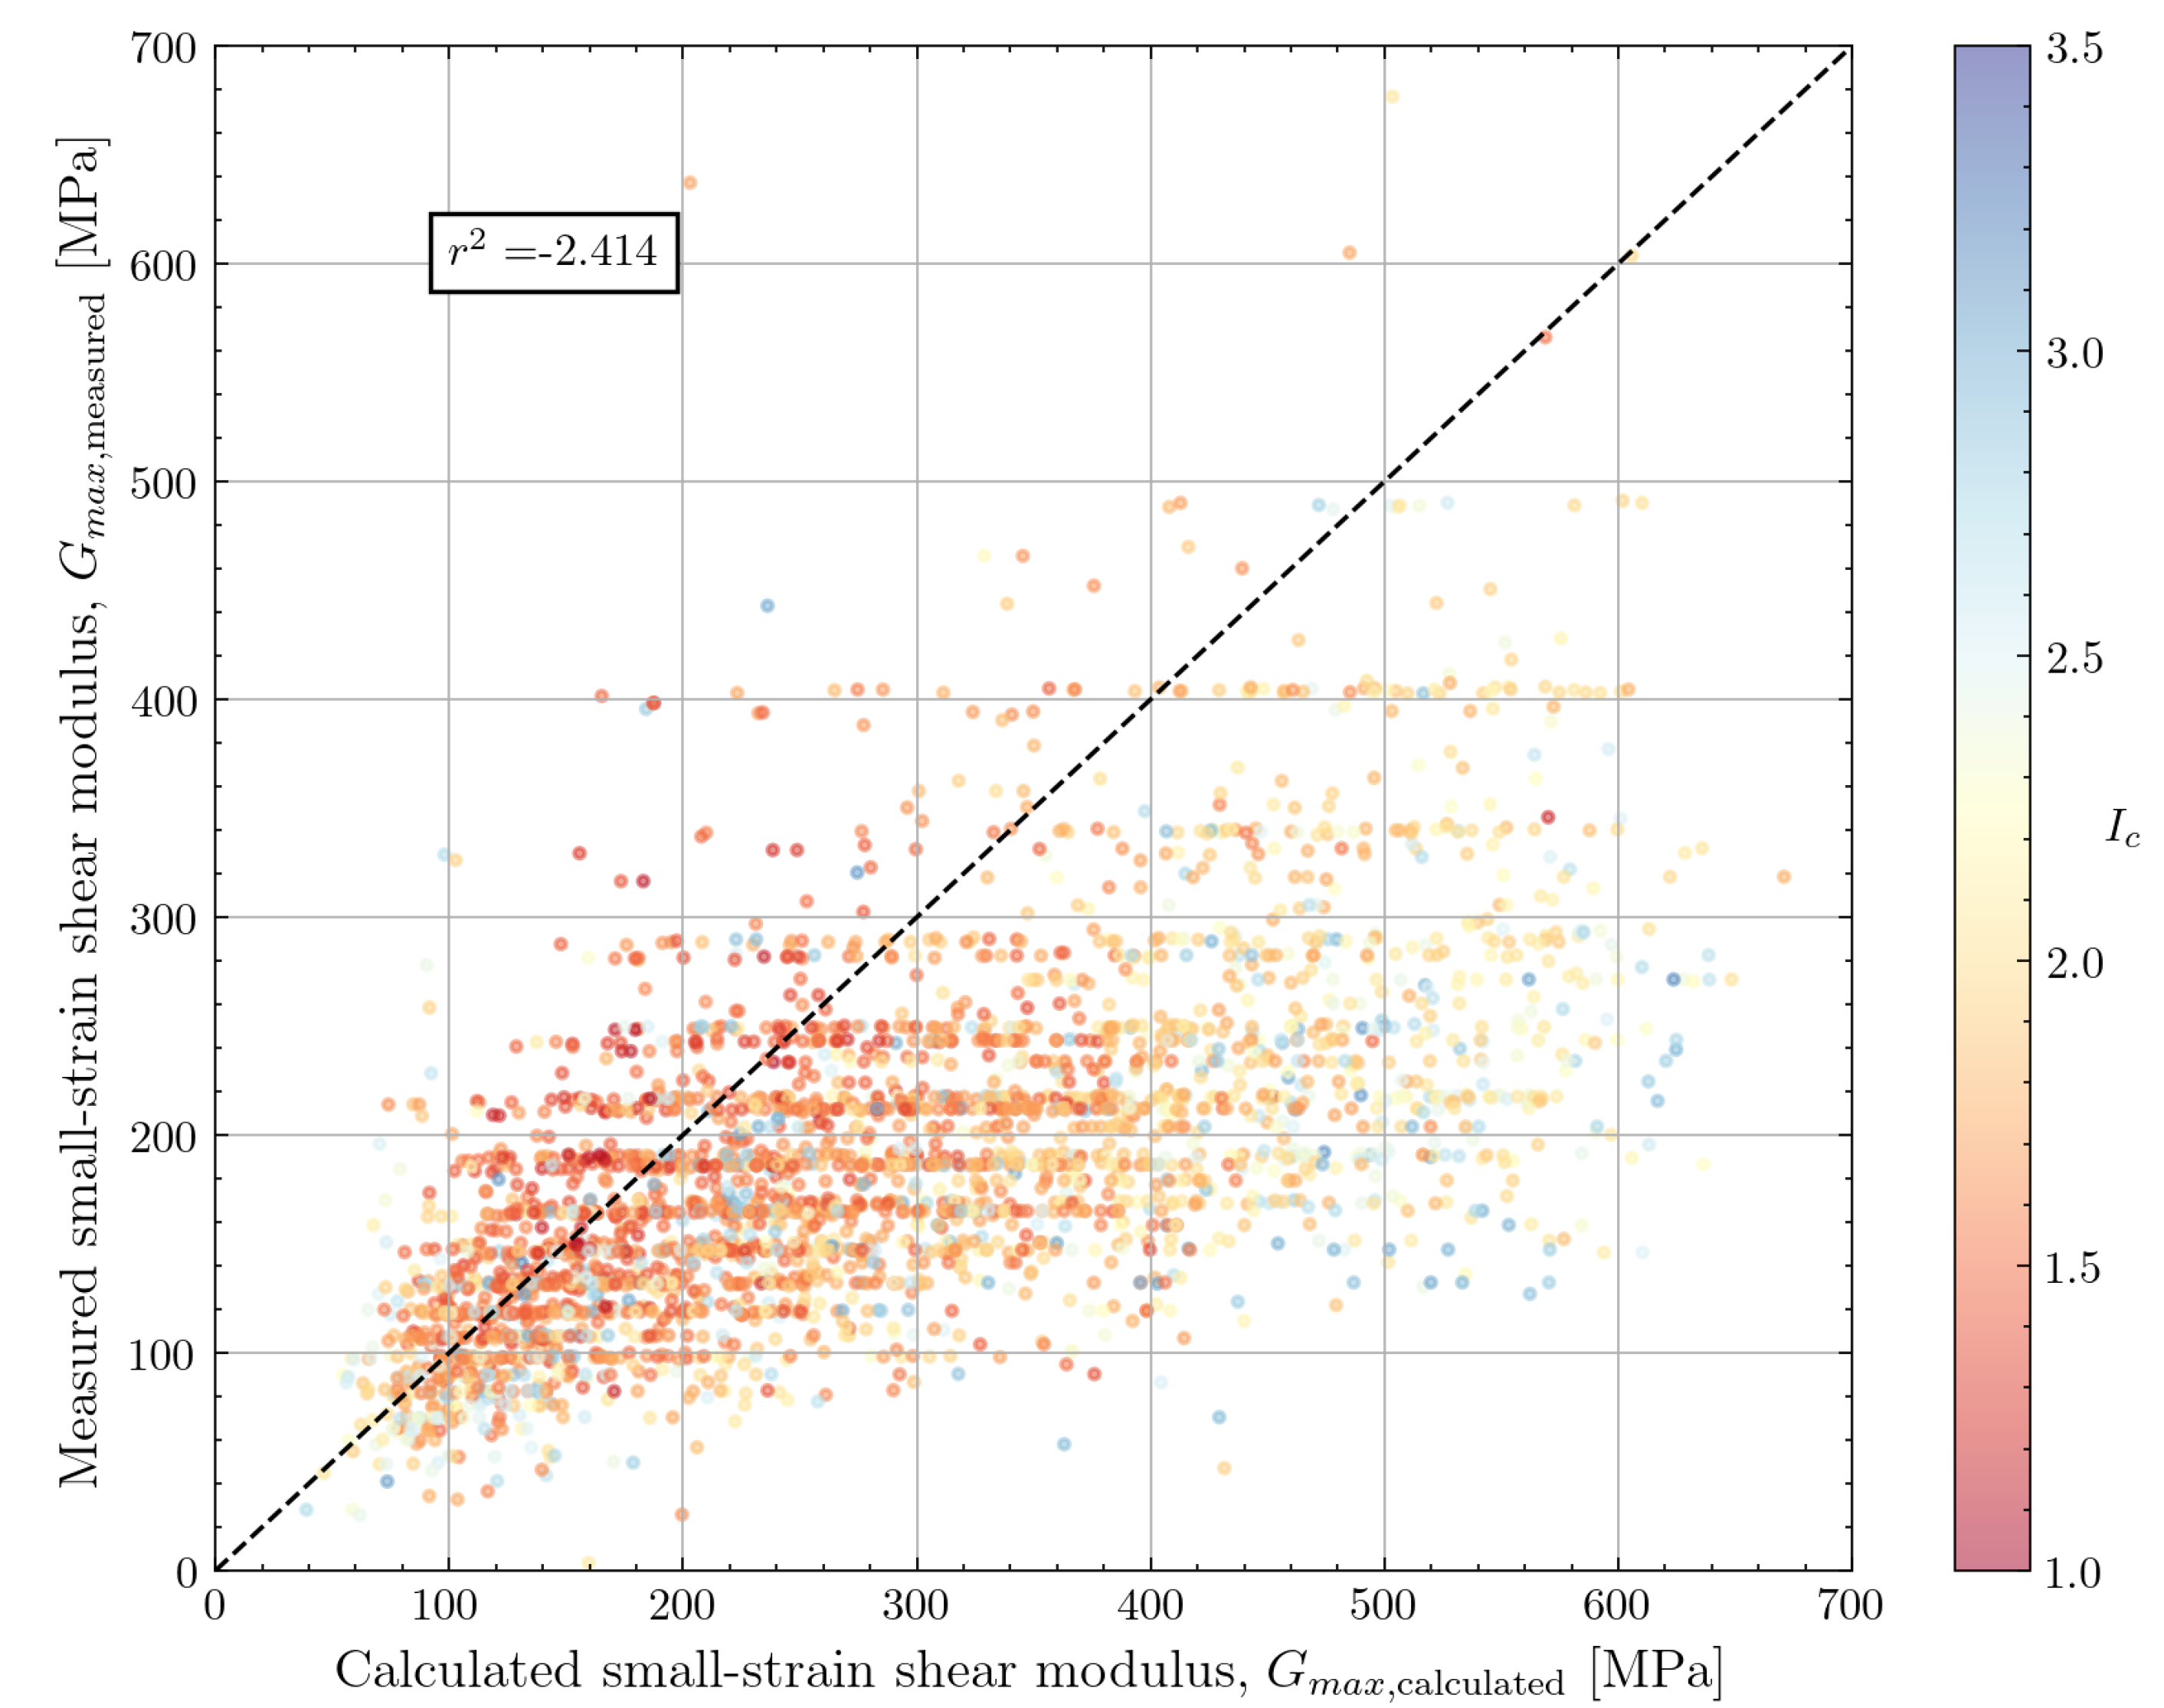
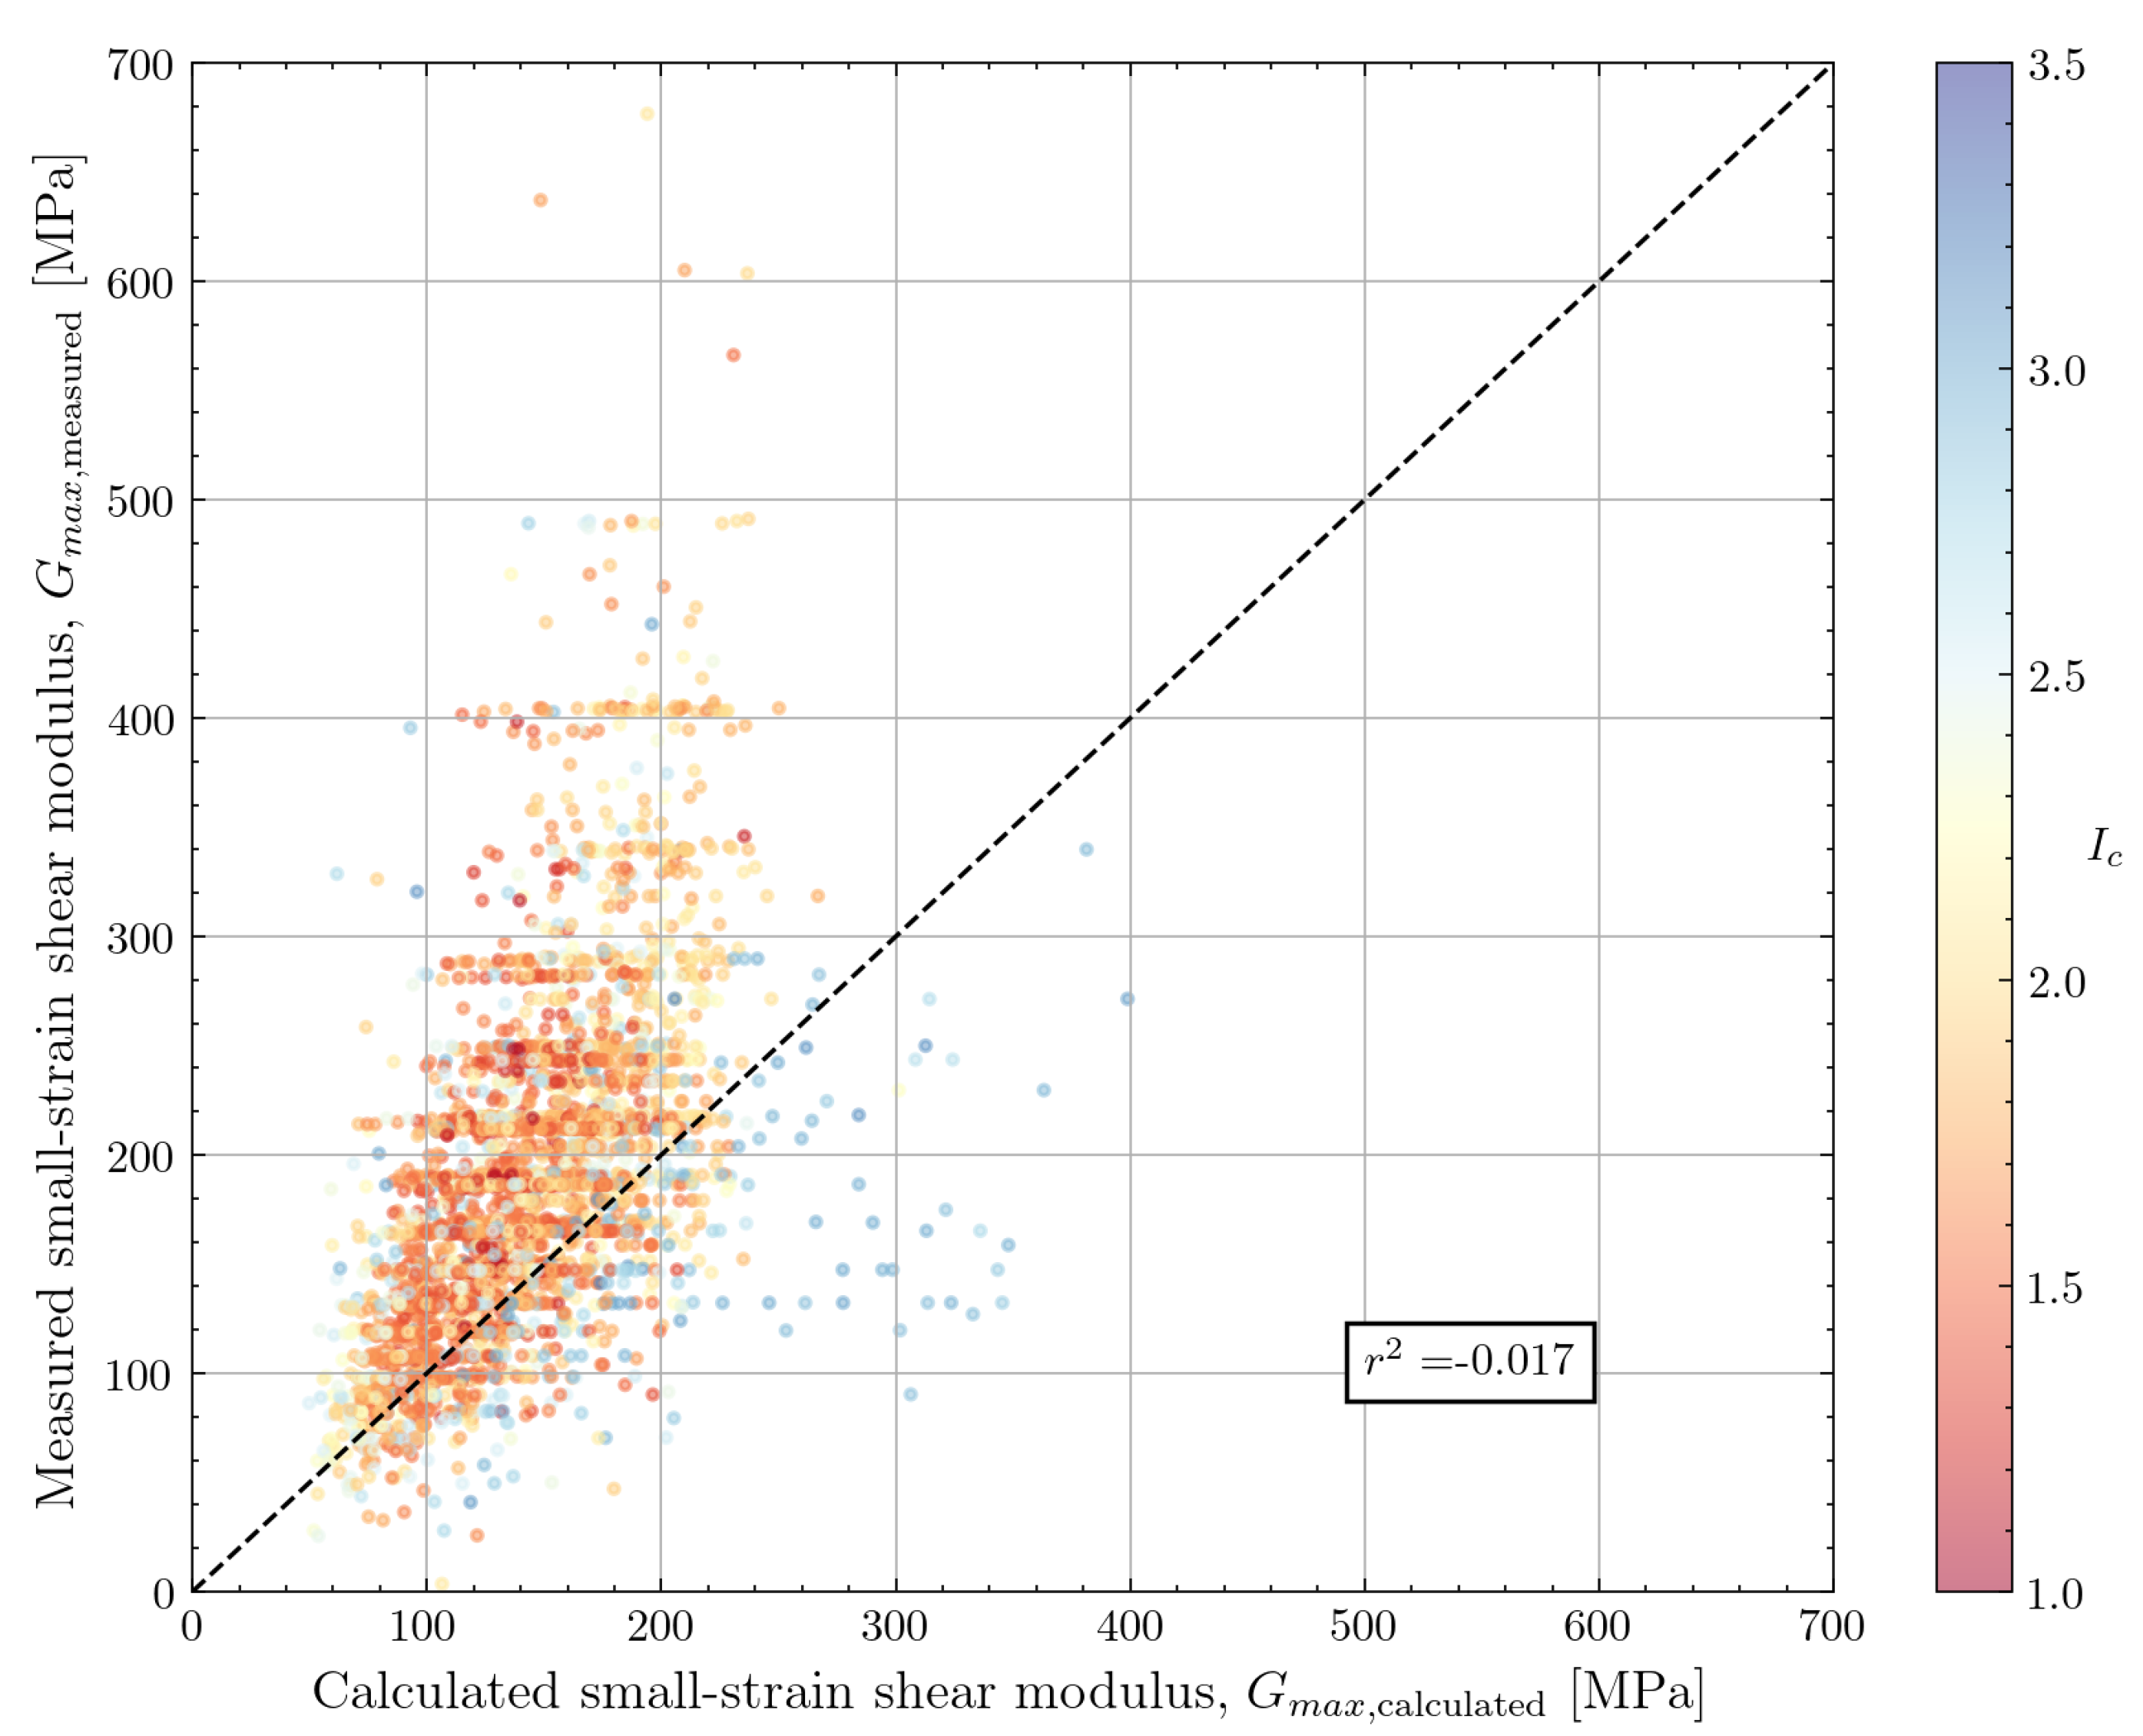
The performance of the estimation formulae discussed in this work is shown in
Figure 10. The figure shows reasonable performance for cohesionless soils and values of
lower than 200MPa. However, significant overestimation is noticed for cohesive soils and higher values of
. The calibration coefficient can be tuned to achieve better performance. A lower value of
B reduces the overestimation for higher values of
(not shown in the figure).
4.1.2. Rix and Stokoe (1991)
The correlation by Rix and Stokoe [
8] was develop for cohesionless soil based on calibration chamber tests. The material used in this study was a washed mortar sand with a median grain size of 0.35mm and less than 1% fines. CPT and resonant column test data were compared to establish the calibrated formula in Equation
4 where
is the cone tip resistance and
is the vertical effective stress at the depth considered. The calibration was aimed at earthquake engineering applications for near-surface soils with a depth of less than 13m.
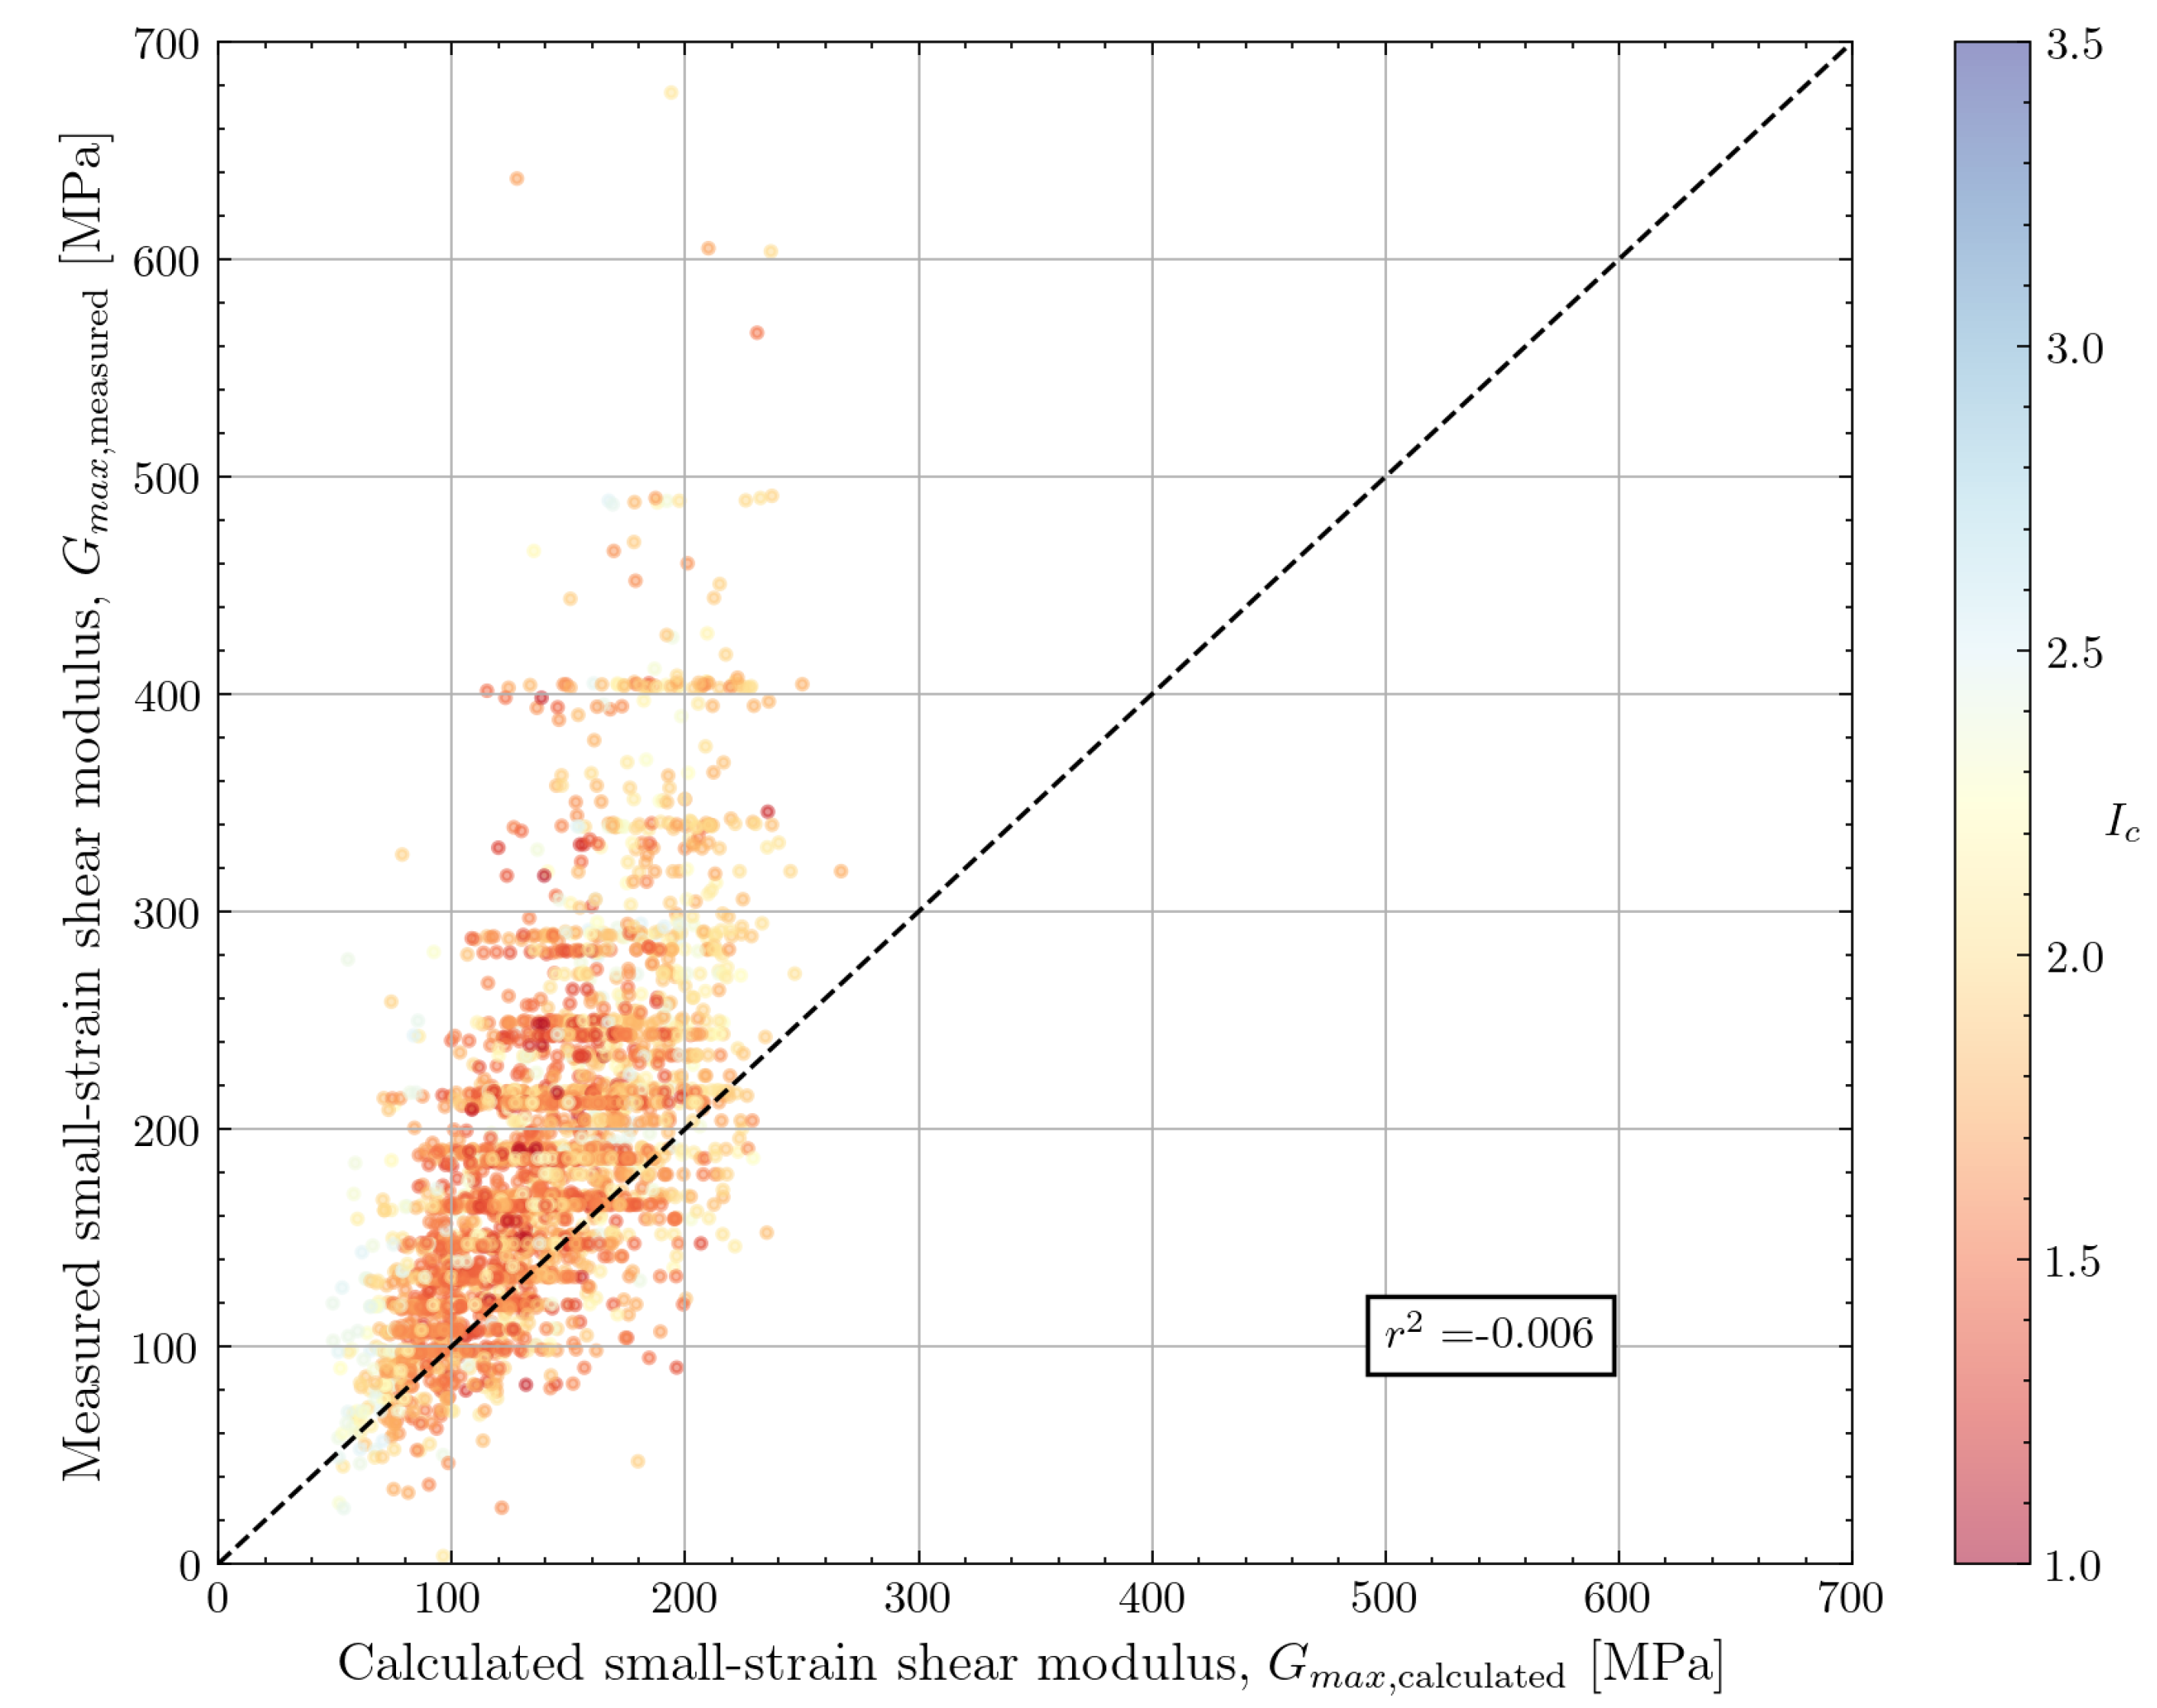
The performance of this correlation against the North Sea dataset is visualised in
Figure 11. The formula proposed by Rix and Stokoe [
8] leads to an underestimation of
, especially for data at deeper depths and consequently a higher shear modulus. The coefficients in Equation
4 can be re-calibrated based on Bayesian updating with the North Sea data [
36]. The re-calibration resulted in an increase of the multiplier in Equation
4 from 1634 to 2241. Although not shown in the figure, the results from the re-calibrated formula show a better fit for
up to 300MPa. However, for measurements with
300MPa, an underestimation was still noticed.
4.1.3. Mayne and Rix (1993)
Mayne and Rix [
9] determined a relationship between small-strain shear modulus and cone tip resistance by studying 481 data points from 31 sites all over the world. The database contains a wide range of clay materials, ranging from soft organic clay to overconsolidated, fissured clay.
ranged between about 0.7 MPa and 800 MPa. From the vertical effective stress data presented by the authors [
9], a maximum test depth of approximately 30m is identified. Based on the available data, the authors proposed a simple formula which only depends on cone tip resistance. The measurements for soft clays from Sweden and Mexico generally fall below the proposed trend (overprediction) whereas the predictions for stiff UK clays show an underprediction of
by the proposed equation.
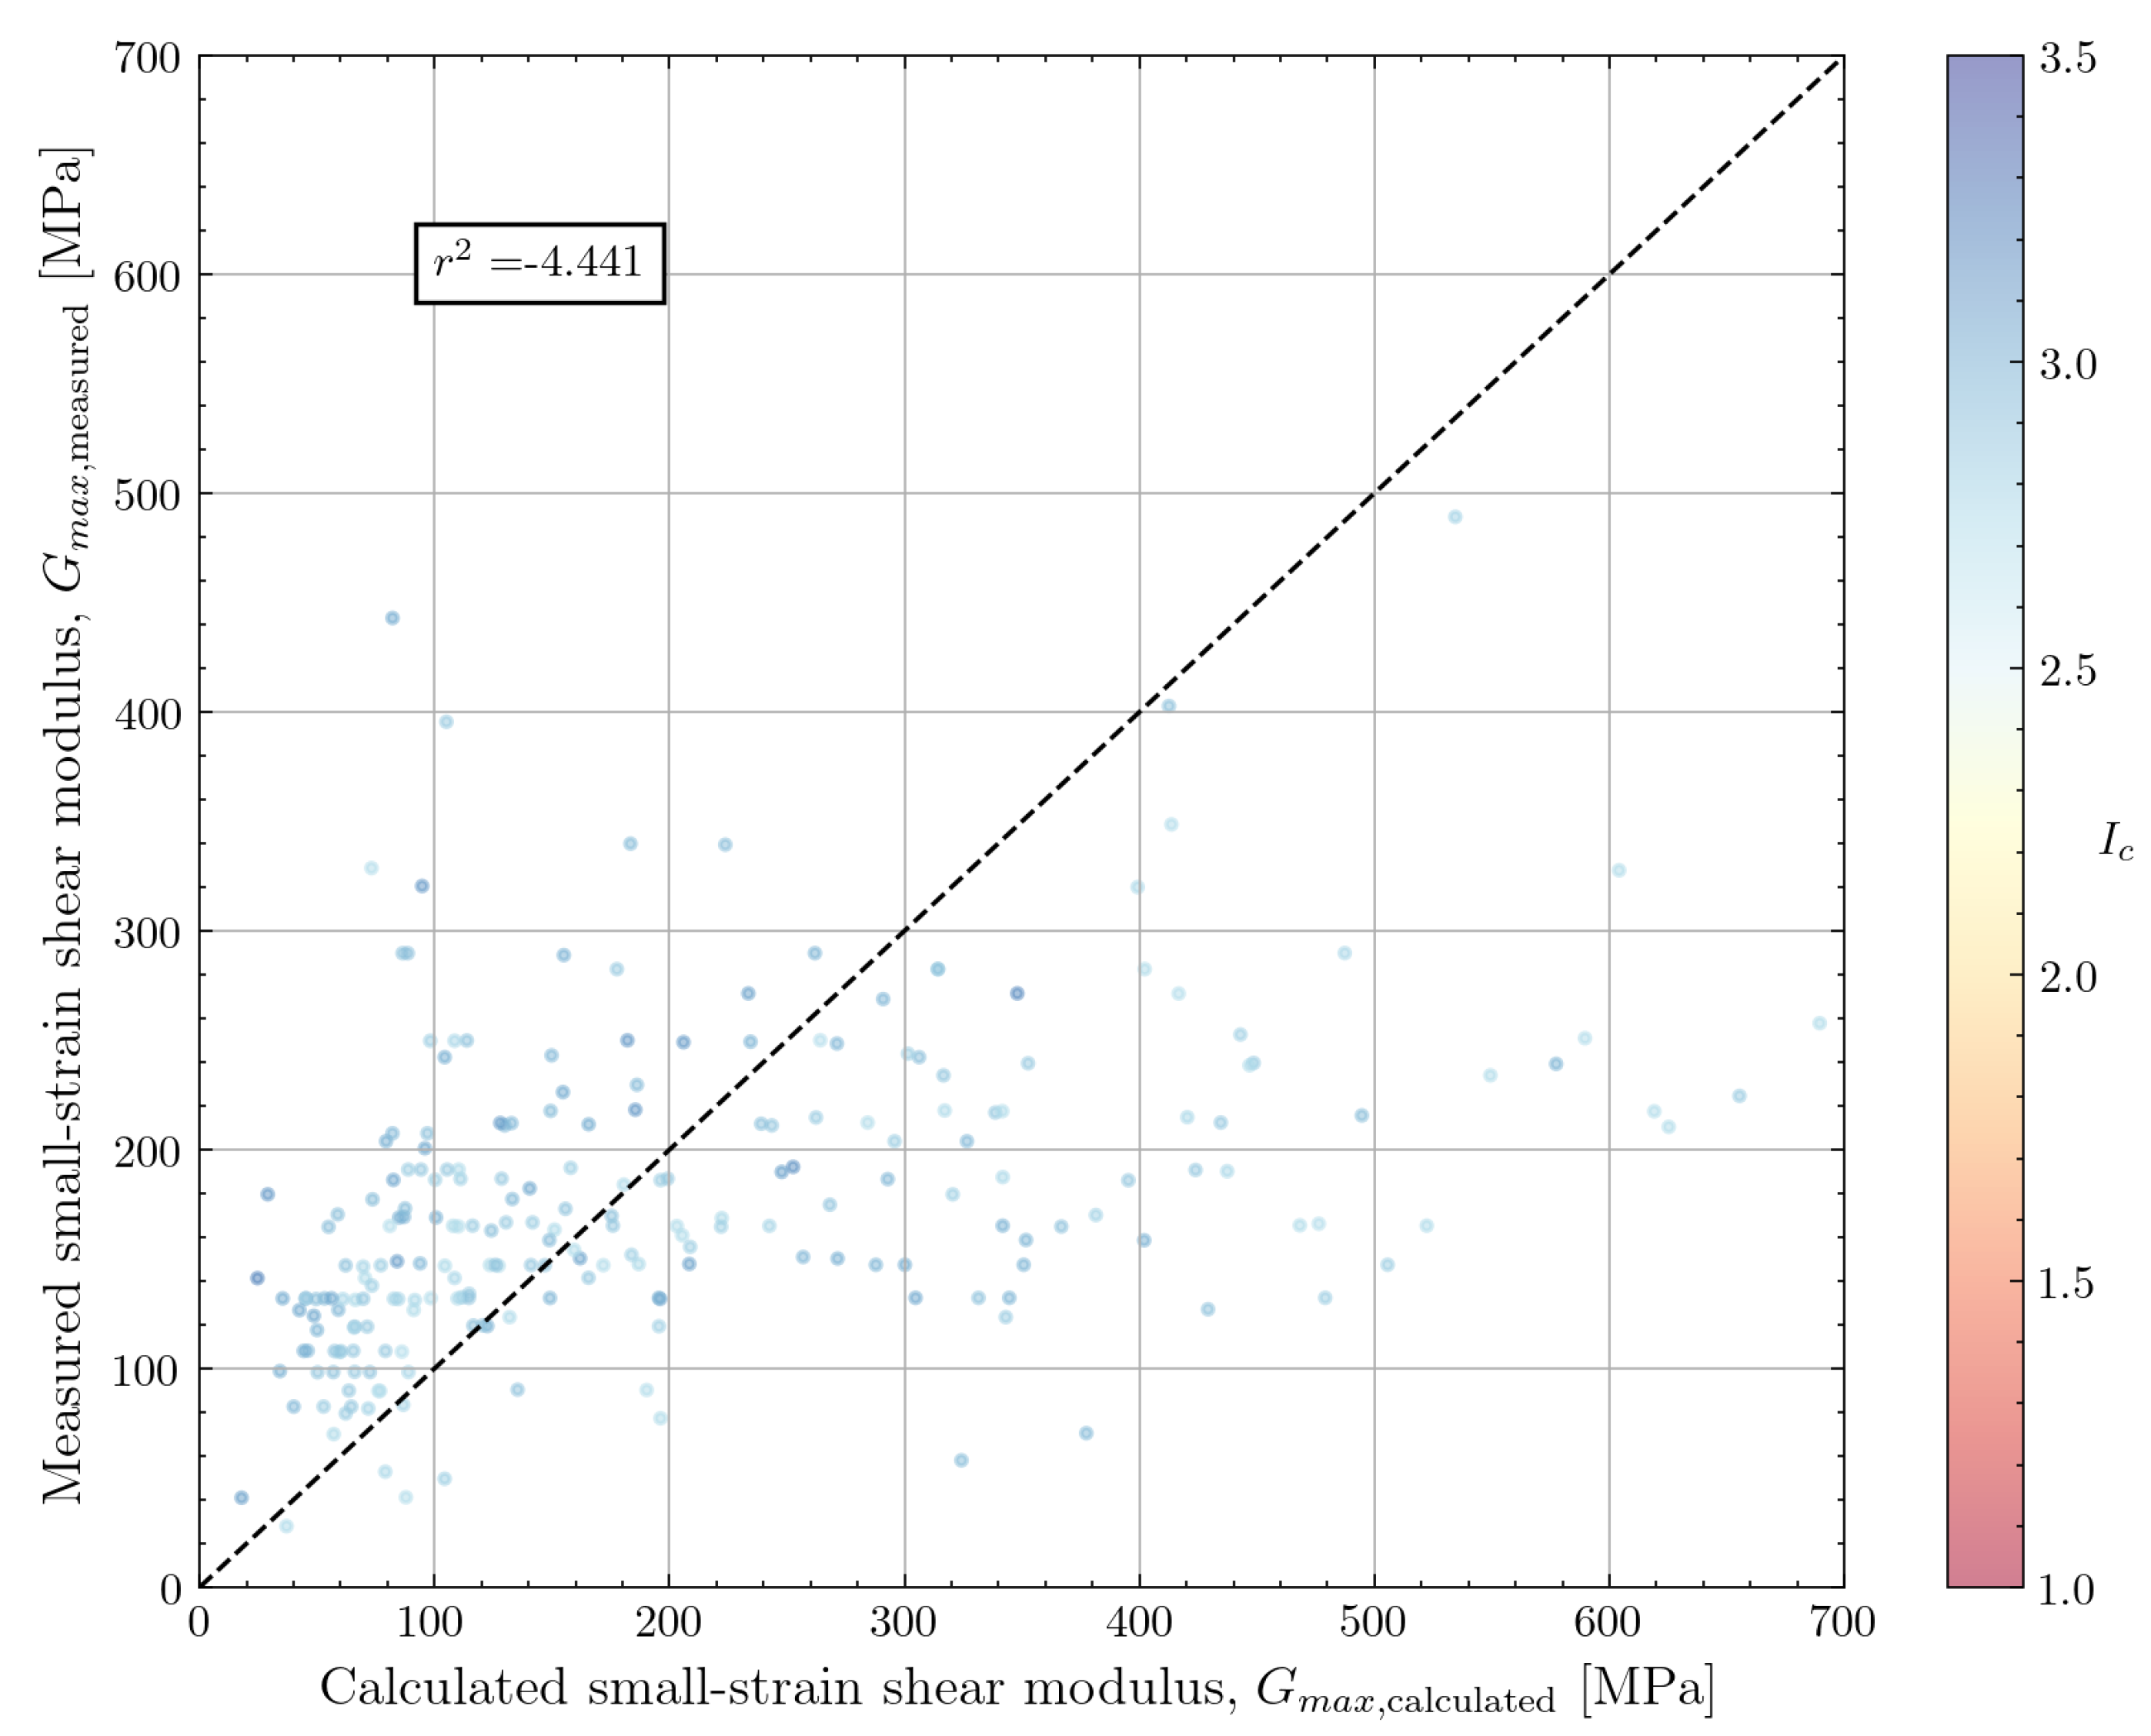
For the available North Sea dataset, the amount of cohesive data is limited. The comparison of calculated and measured
is shown in
Figure 12. The data shows a relatively high amount of scatter but the correlation does seem to capture the average trend when
< 200MPa. A number of points with high calculated
are observed. These points are all associated with a high cone resistance (
>5MPa). This indicates a high sand content in these clays which limits the applicability of the correlation.
4.1.4. Peuchen et al. (2020)
Recently, Peuchen et al. [
16] used the available
data from the Dutch offshore wind farm area, which are also used in this work, to formulate an improved CPT-based correlation. Equation
6 shows how a dependency on
was included to extend the correlation by Rix and Stokoe [
8] to cohesive soils. However, the calibration coefficients from the Rix and Stokoe correlation were not modified.
The results for the North Sea dataset are shown in
Figure 13. Since most of the data was collected in cohesionless soils,
is generally close to zero and the conclusions from the comparison of the Rix and Stokoe [
8] correlation against the data still apply. For the cohesive soils in the dataset (
>2.7), an unbiased prediction is noticed with a considerable degree of scatter.
4.2. Review of Correlations
4.2.1. Wride et al. (2000)
Wride et al. [
11] developed a correlation between
and shear wave velocity in the context of the Canadian Liquefaction Experiment (CANLEX). The selected data were obtained through in-situ testing at six sandy sites. The sand was fine sand with median grain size ranging from 0.16 to 0.25mm. The sands were normally consolidated, uncemented quartz sands of Holocene age. The shear wave velocity measurements were recorded predominantely from seismic CPT testing. The maximum test depth was limited to 15m for all but one site (Mildred Lake) where testing was performed down to a depth of 40m.
A general formula was established relating stress-corrected values of the cone tip resistance and shear wave velocity as shown in Equation
7, where
and
. The average value of the multiplier
Y proposed by Karray et al. [
37] was used as a default (
Y = 103.2). A range of
is proposed by in that study.
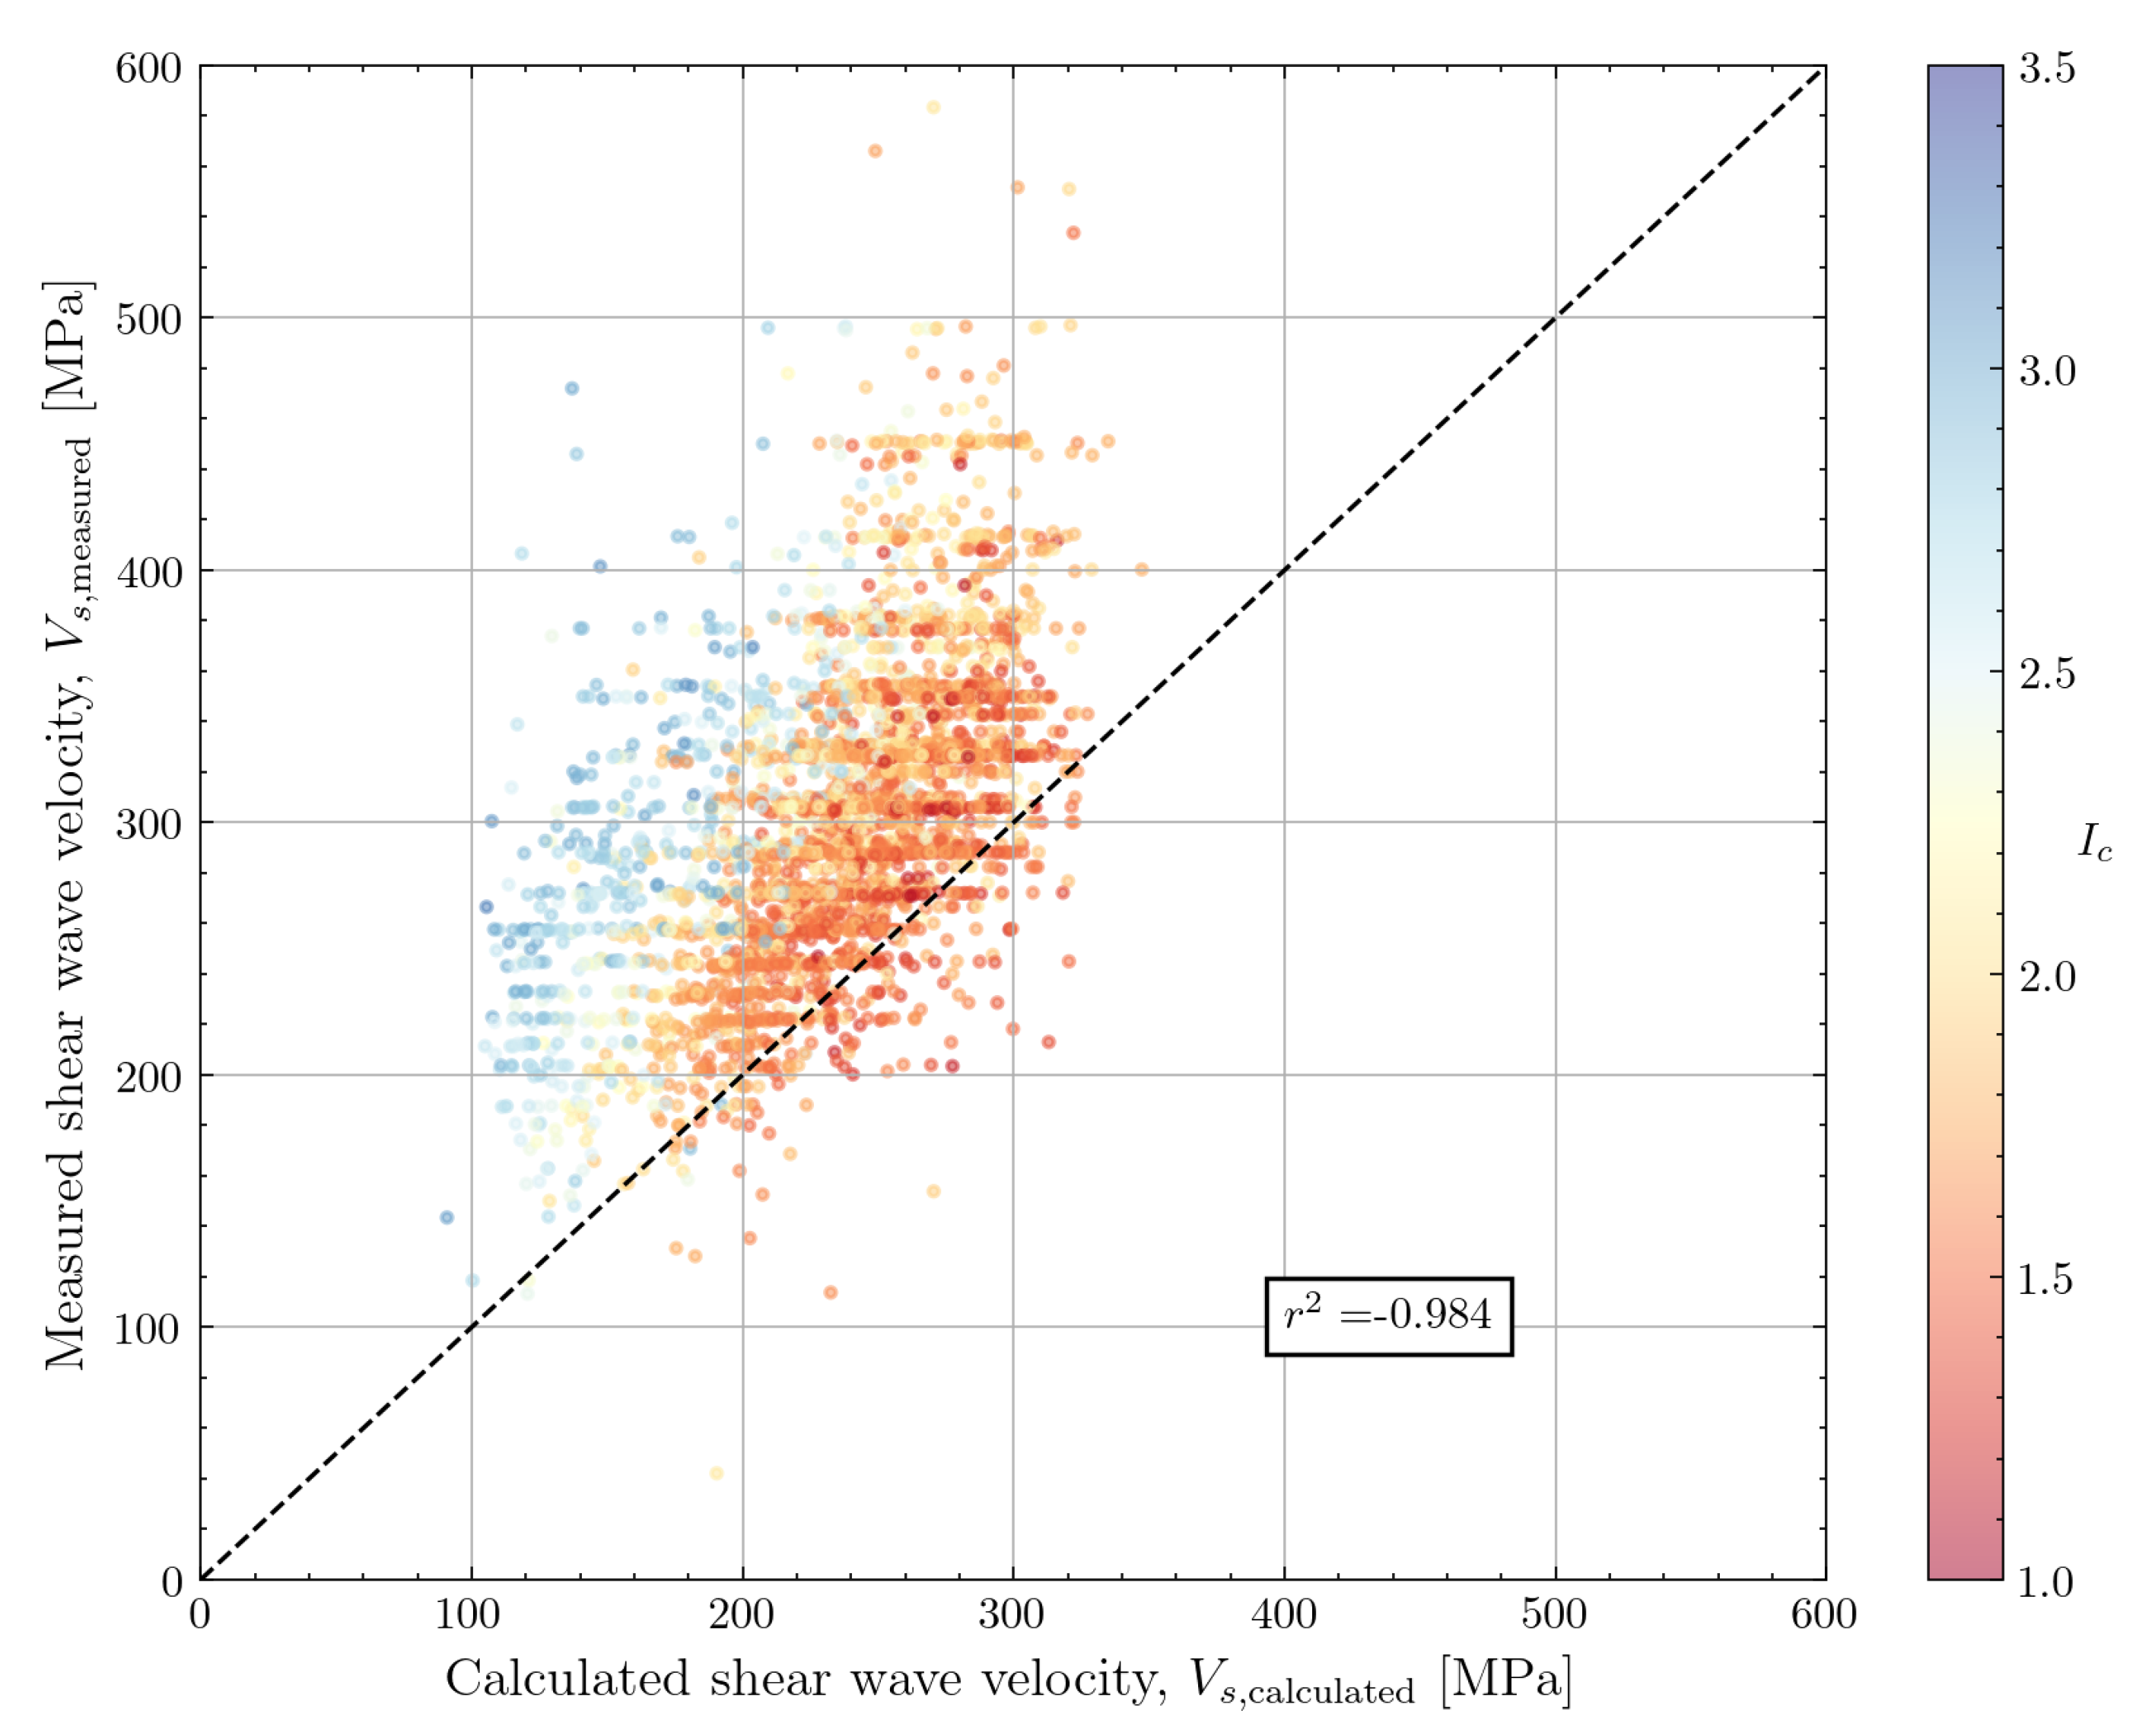
The performance of the correlation against the North Sea dataset is shown in
Figure 14. The use of the default multiplier of
Y = 103.2 shows an underestimation of
. Similarly to the Rix and Stokoe correlation, the underestimation becomes more important for high values of
(corresponding to deeper depths). The parameter
Y can be further calibrated to provide a more accurate fit. A greater underestimation is also noticed as the soil becomes more fine-grained (higher
).
4.2.2. Hegazy and Mayne (2006)
Hegazy and Mayne [
10] developed a correlation for shear wave velocity based on a global database from 73 sites with different soil conditions including sands, clays, soil mixtures and mine tailings. The correlation includes the 30 clay sites used for the Mayne and Rix [
9] correlation as well as 30 cohesive and cohesionless sites from another study by the same authors [
38]. Twelve new sites were added in the 2006 paper. A total of 558 data points are included in the database with
ranging between 0.1MPa and 100MPa. A coefficient of determination (
) of 0.85 was obtained by the authors using all data. Shear wave velocity was measured using S-PCPT, downhole testing, cross-hole testing and Spectral Analysis of Surface Waves (SASW). The authors do not report the maximum depth of the in-situ testing, although data presented by Hegazy and Mayne [
38] suggest maximum depths in the range of 20 to 25m.
The mathematical formula of the correlation is shown in Equation
8 and shows a dependence on the normalised cone tip resistance
, vertical effective stress and the soil behaviour type index
. The normalised cone tip resistance is calculated differently depending on the soil behaviour type index with a view to obtaining a unified correlation for cohesionless and cohesive soils:
for
and
for
.
The normalisations used by Hegazy and Mayne are supposed to lead to a linear trend between the logarithm of the ratio
and
. The applicability of this trend to the North Sea data was checked.
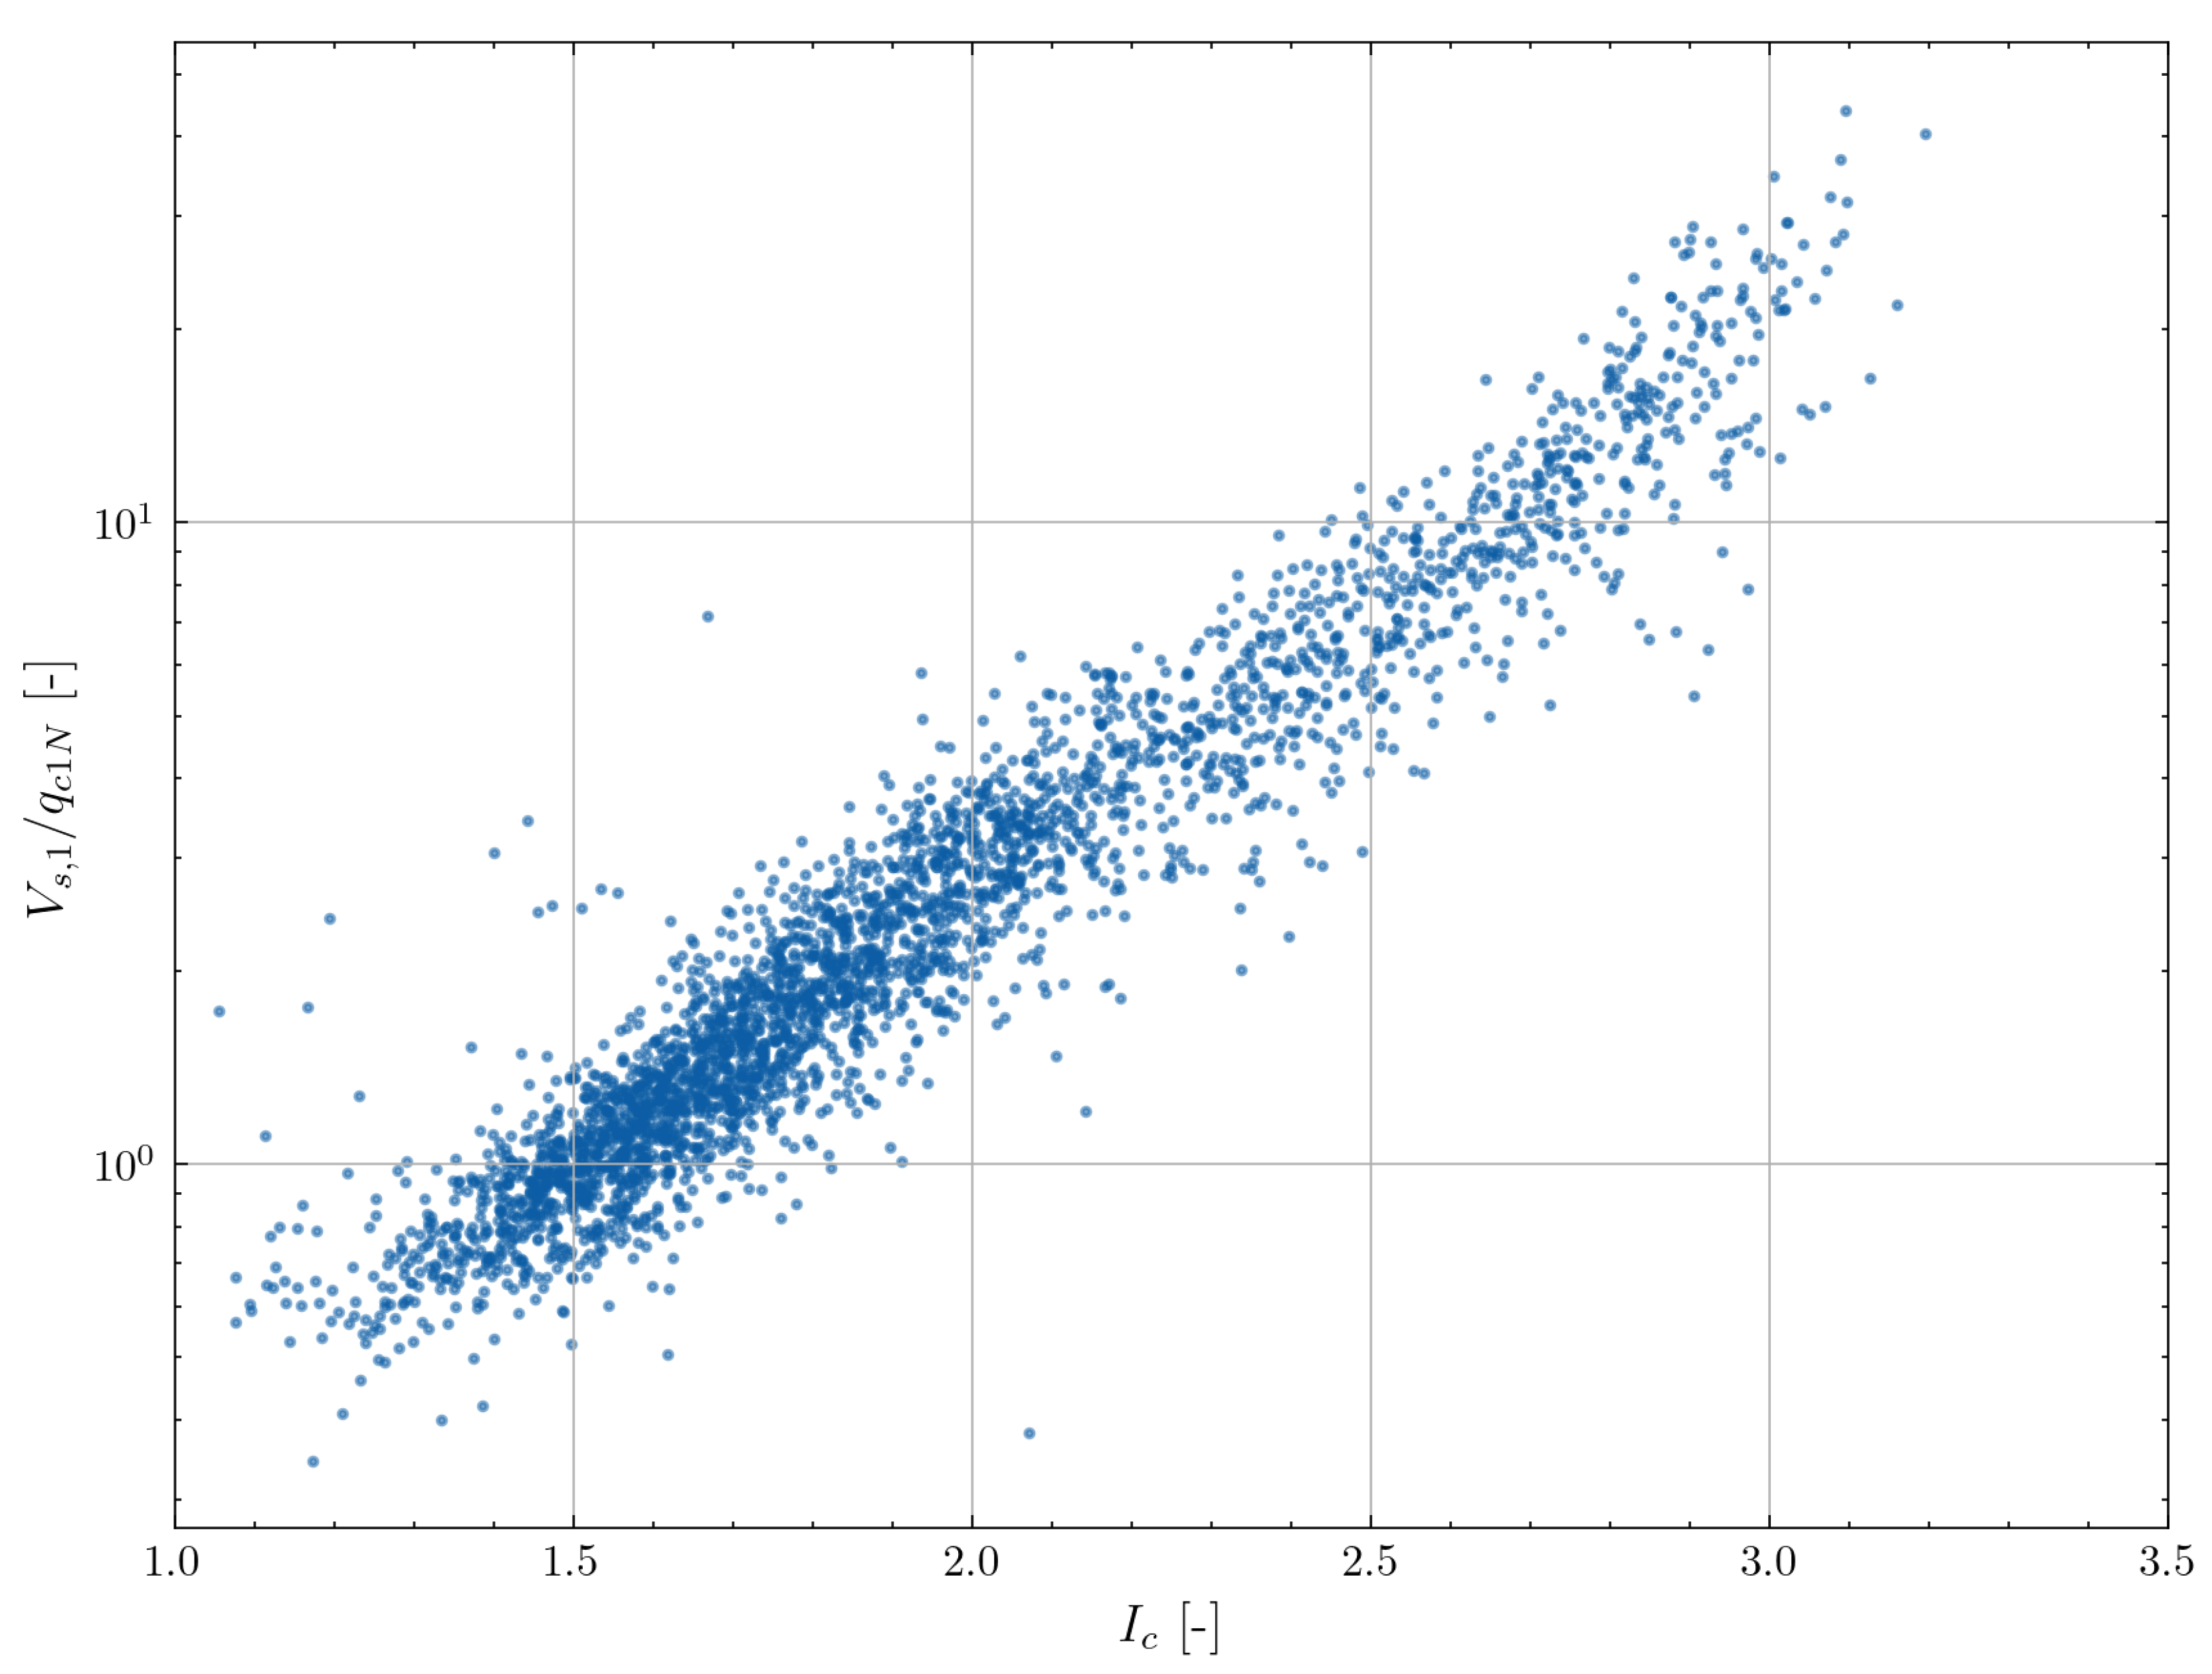
Figure 15 confirms the expected linear trend. Apart from a limited number of outliers, the authors seem to have identified a fundamental soil mechanical trend which can be used for further model calibration.
Although the trend in
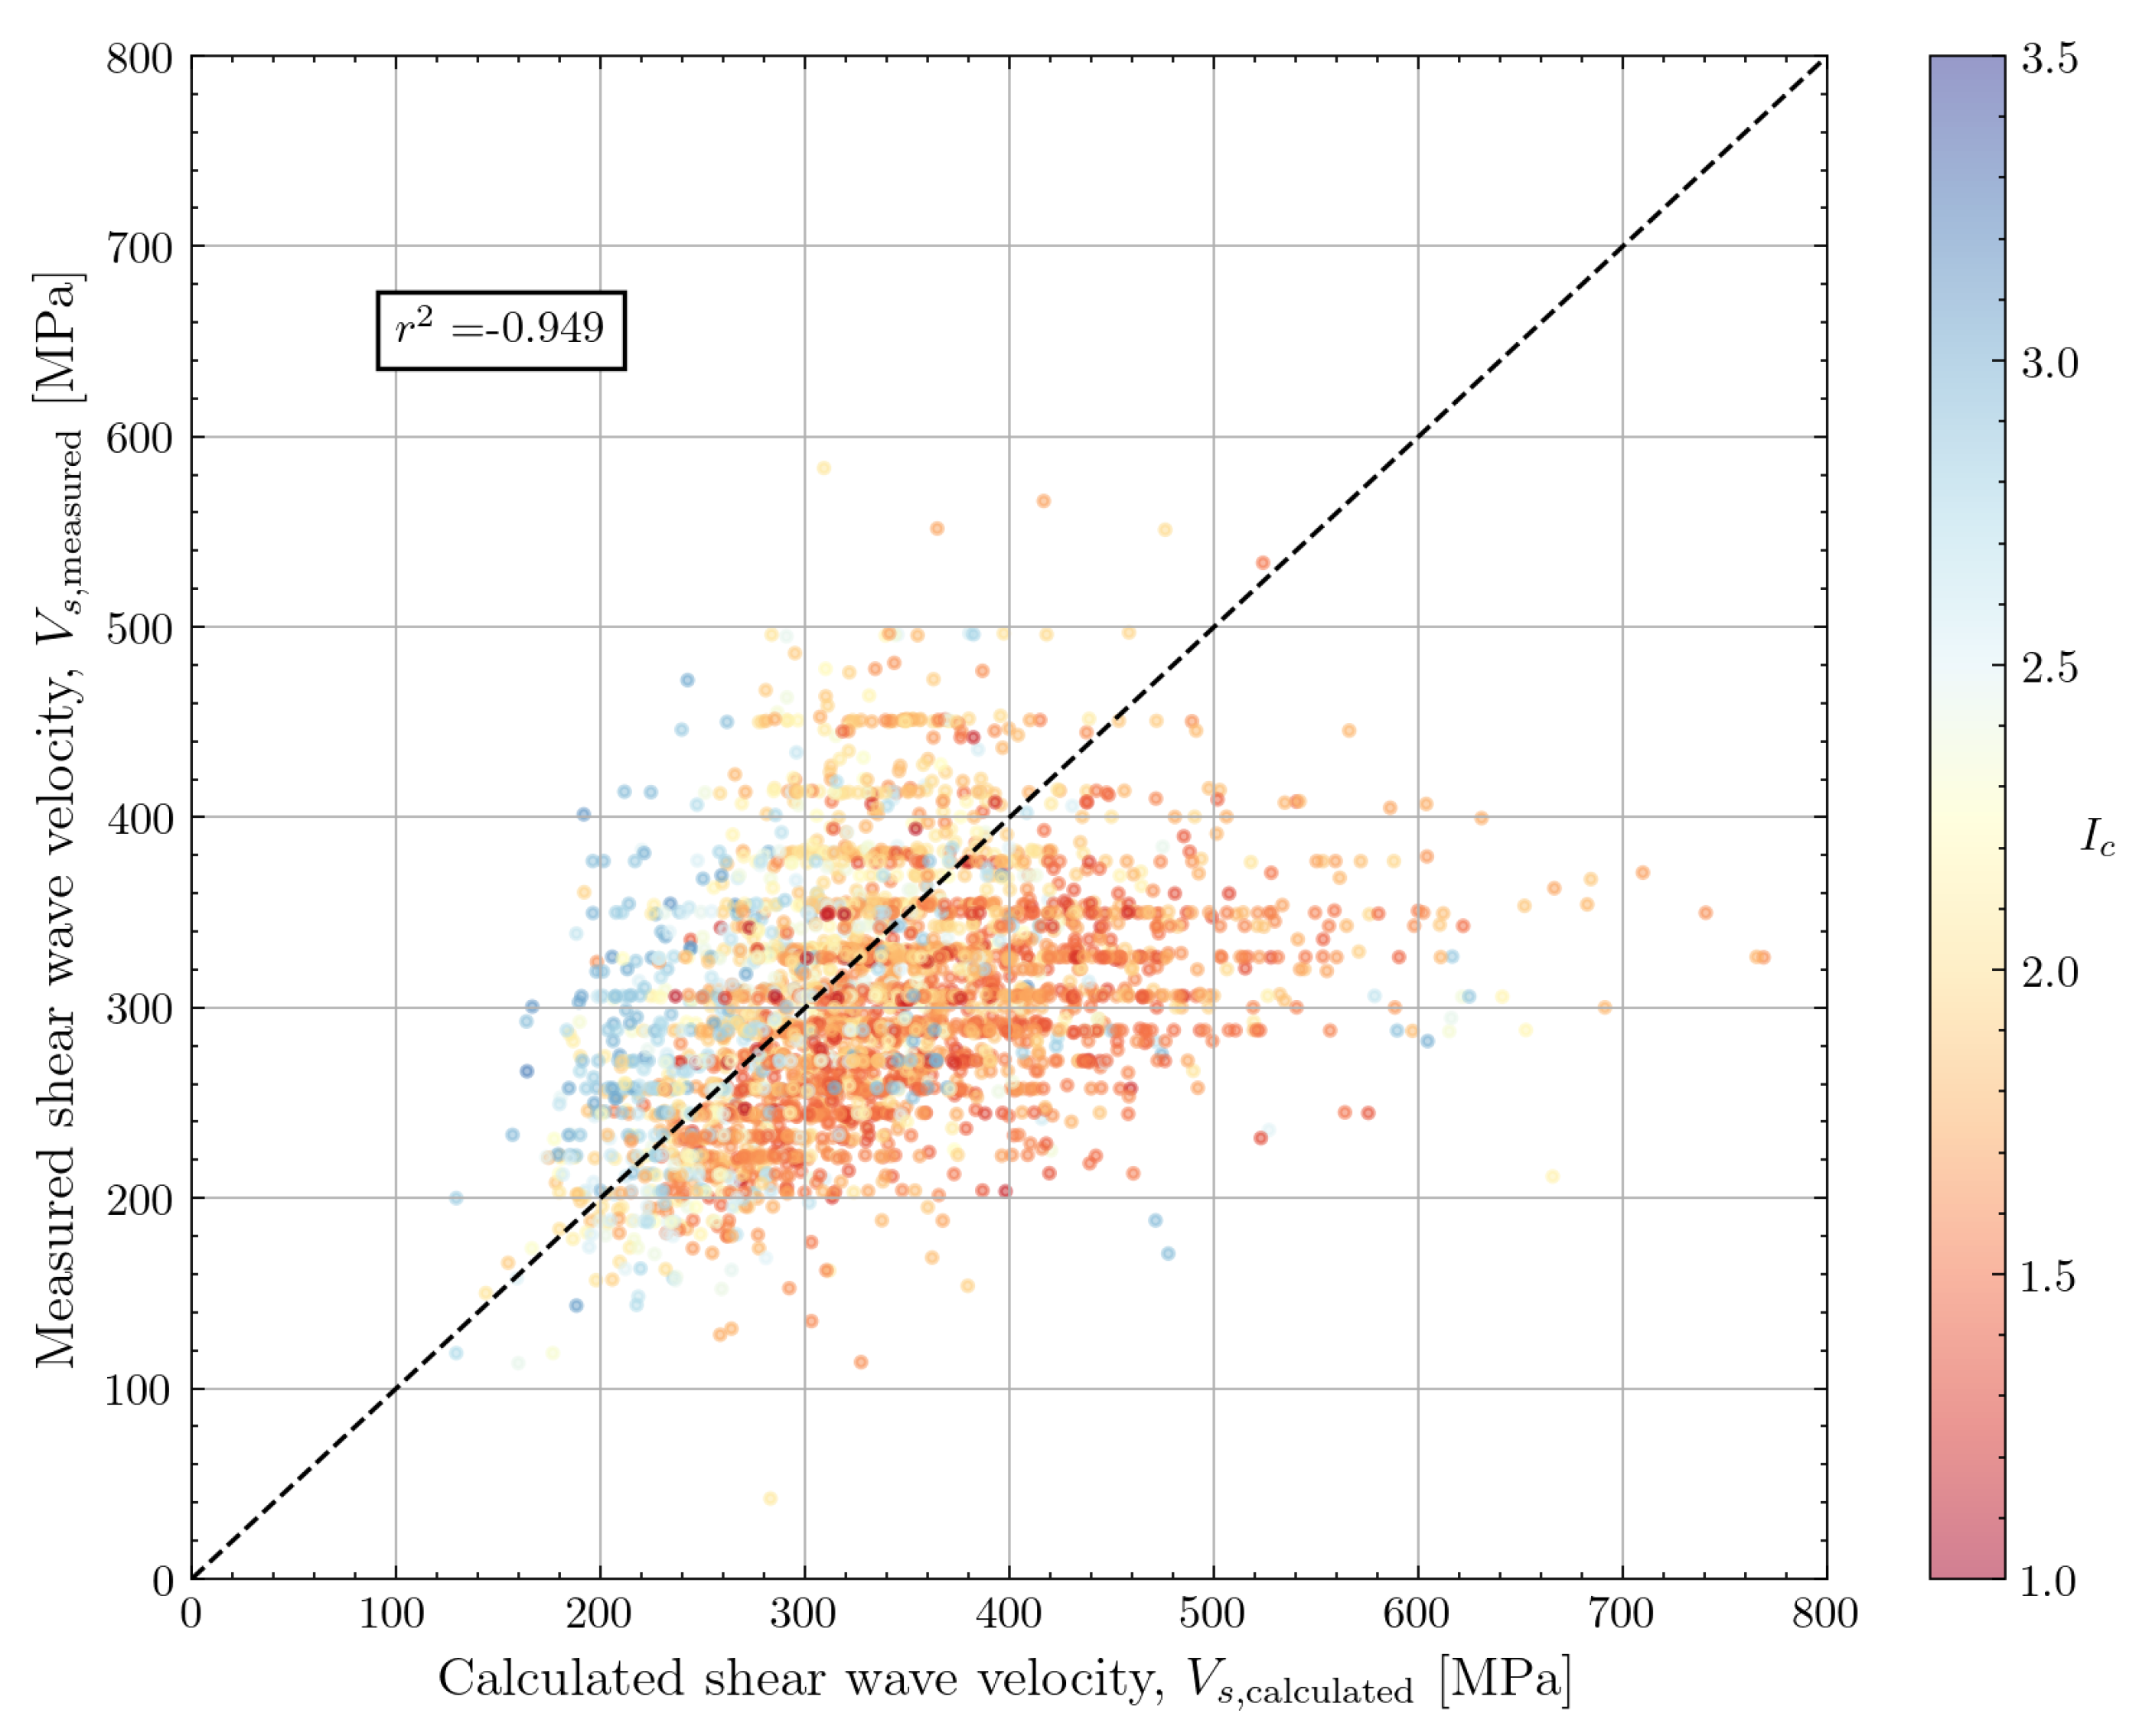
Figure 15 shows a tight clustering, the results of the correlation with the default calibration coefficients show a significant scatter as shown in
Figure 16. Although there is no bias for a specific soil class, there are several points for which
is significantly overpredicted. There seems to be a non-linearity in the predictions, suggesting that a re-calibration of the exponents in Equation
8 is necessary for the North Sea dataset. Using the observed from
Figure 15, the multiplier 0.0831 from Equation
8 would be recalibrated to 0.054 and the multiplier on
of 1.786 would be recalibrated to 1.96.
4.2.3. Andrus et al. (2007)
Andrus et al. [
12] proposed a correlation between shear wave velocity and total cone tip resistance (
), soil behaviour type index (
) and depth (
z). The dataset used for the correlation contained 229 data pairs with both CPT data and
from S-PCPT, cross-hole or suspension logging. The majority of the data (113 points) is of Pleistocene age, 72 points are of Holocene age and the 44 Tertiary data points are from the Cooper Marl in South Carolina which is not directly comparable to North Sea soils. The authors do not report the maximum depth of the measurements.
The correlation accounts for the age of the sediments through an age scaling factor (
for soils of Holocene age and
for soils of Pleistocene age). It should be noted that depth could be used interchangeably with vertical effective stress as a feature, especially in regions with small variations of effective unit weight across soil units. Separate formulae are proposed for Holocene, Pleistocene and Tertiary soils. As the North Sea soils are predominantely of Pleistocene age, the correlation for pleistocene soils is used here to evaluate the accuracy of the estimates. Knowledge on the geological age of the sediments is required before the correlation by Andrus et al. [
12] can be applied.
The formulae in Equation
9 can be written as a linear model when taking the logarithms of the left and right member of the equations. Although the model has a more empirical basis than the model by Hegazy and Mayne [
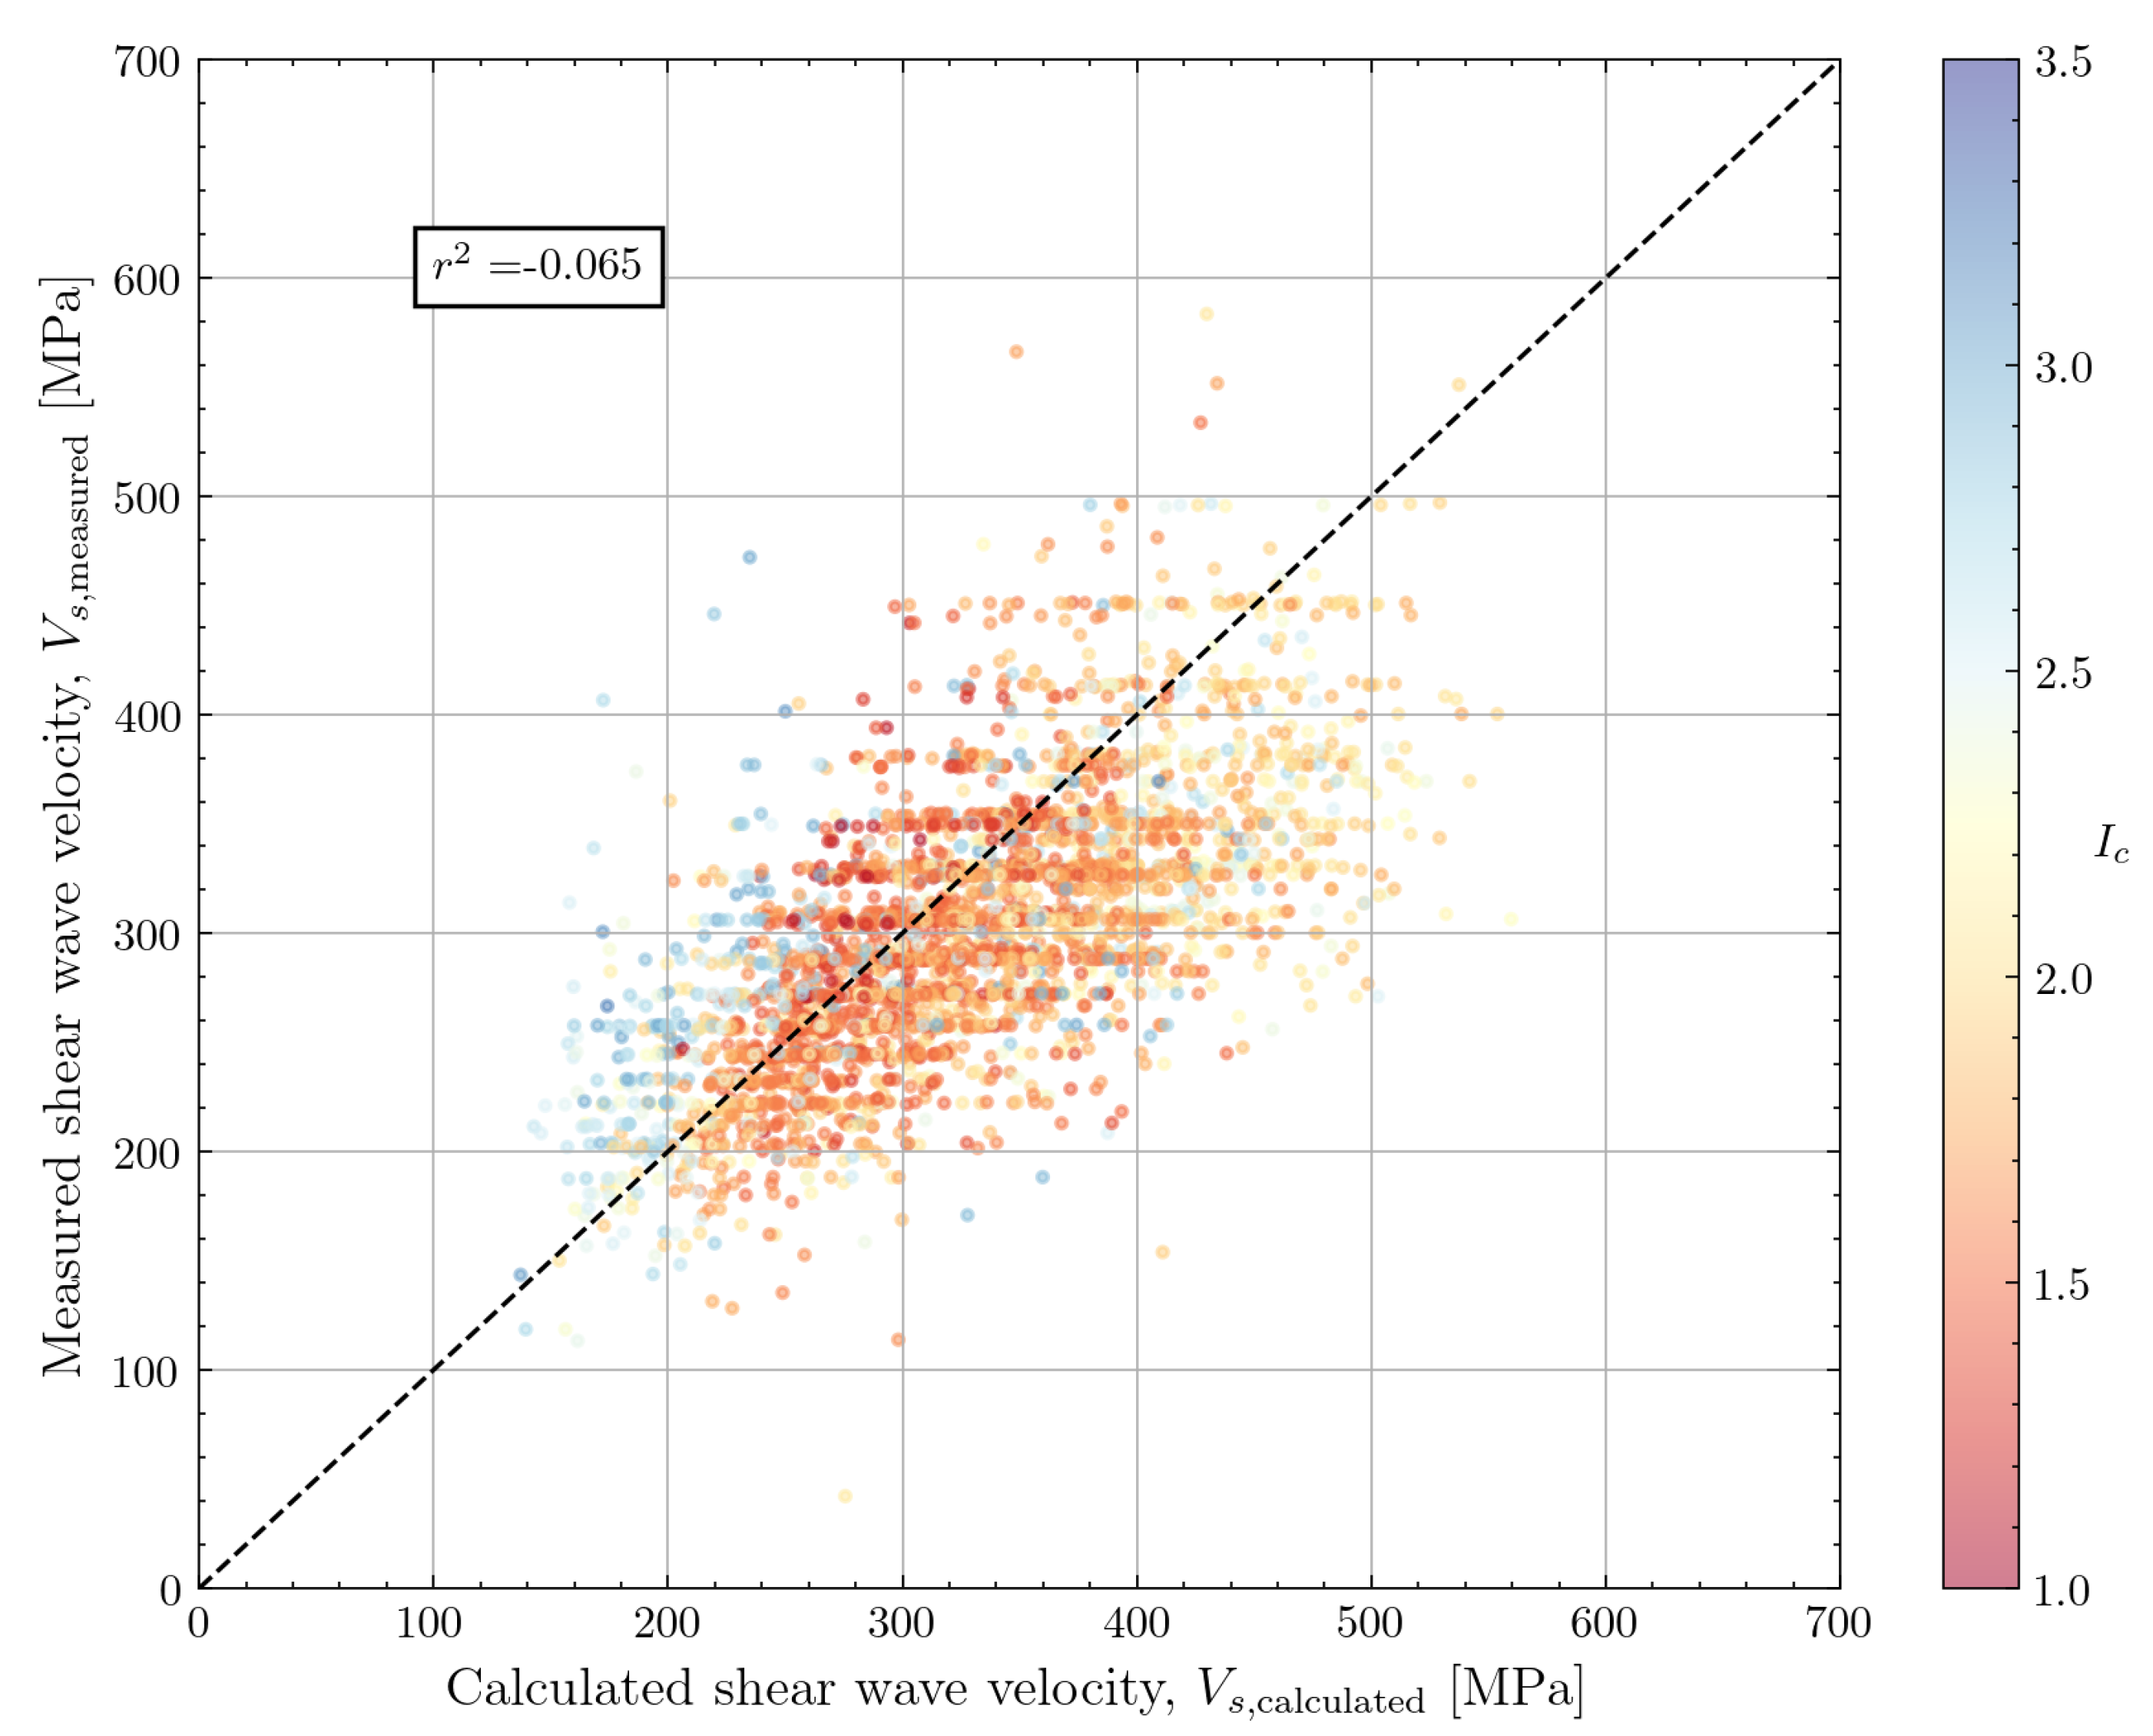
10] the model performance looks similar as shown in
Figure 17. There does not appear to be any specific bias based on soil behaviour type index.
4.2.4. Tonni and Simonini (2013)
Tonni and Simonini [
13] developed a calibration specifically for the Treporti site near Venice (Italy), which mostly consists of silty sediments. The site is located in the lagoon of Venice which contains normally consolidated to slightly overconsolidated silty sands, sands and silty clays. The sediments are mainly of Pleistocene age. The silts have been extensively studied in the context of coastal defence for the city of Venice [
39].
The Treporti test site was set up to study the response of intermediate soils to the construction and removal of an embankment. The shear wave velocity of the silty material was characterised using S-PCPT and seismic dilatometer (SDMT) tests. Measurements were conducted up to a depth of 40m. The calibrated formula for shear wave velocity is shown in Equation
10. The authors highlight the importance of using the soil behaviour type index for obtaining a correlation which performs well across the different soil types encountered at the site. In the paper, the authors limit the applicability to sites in the Venice lagoon.
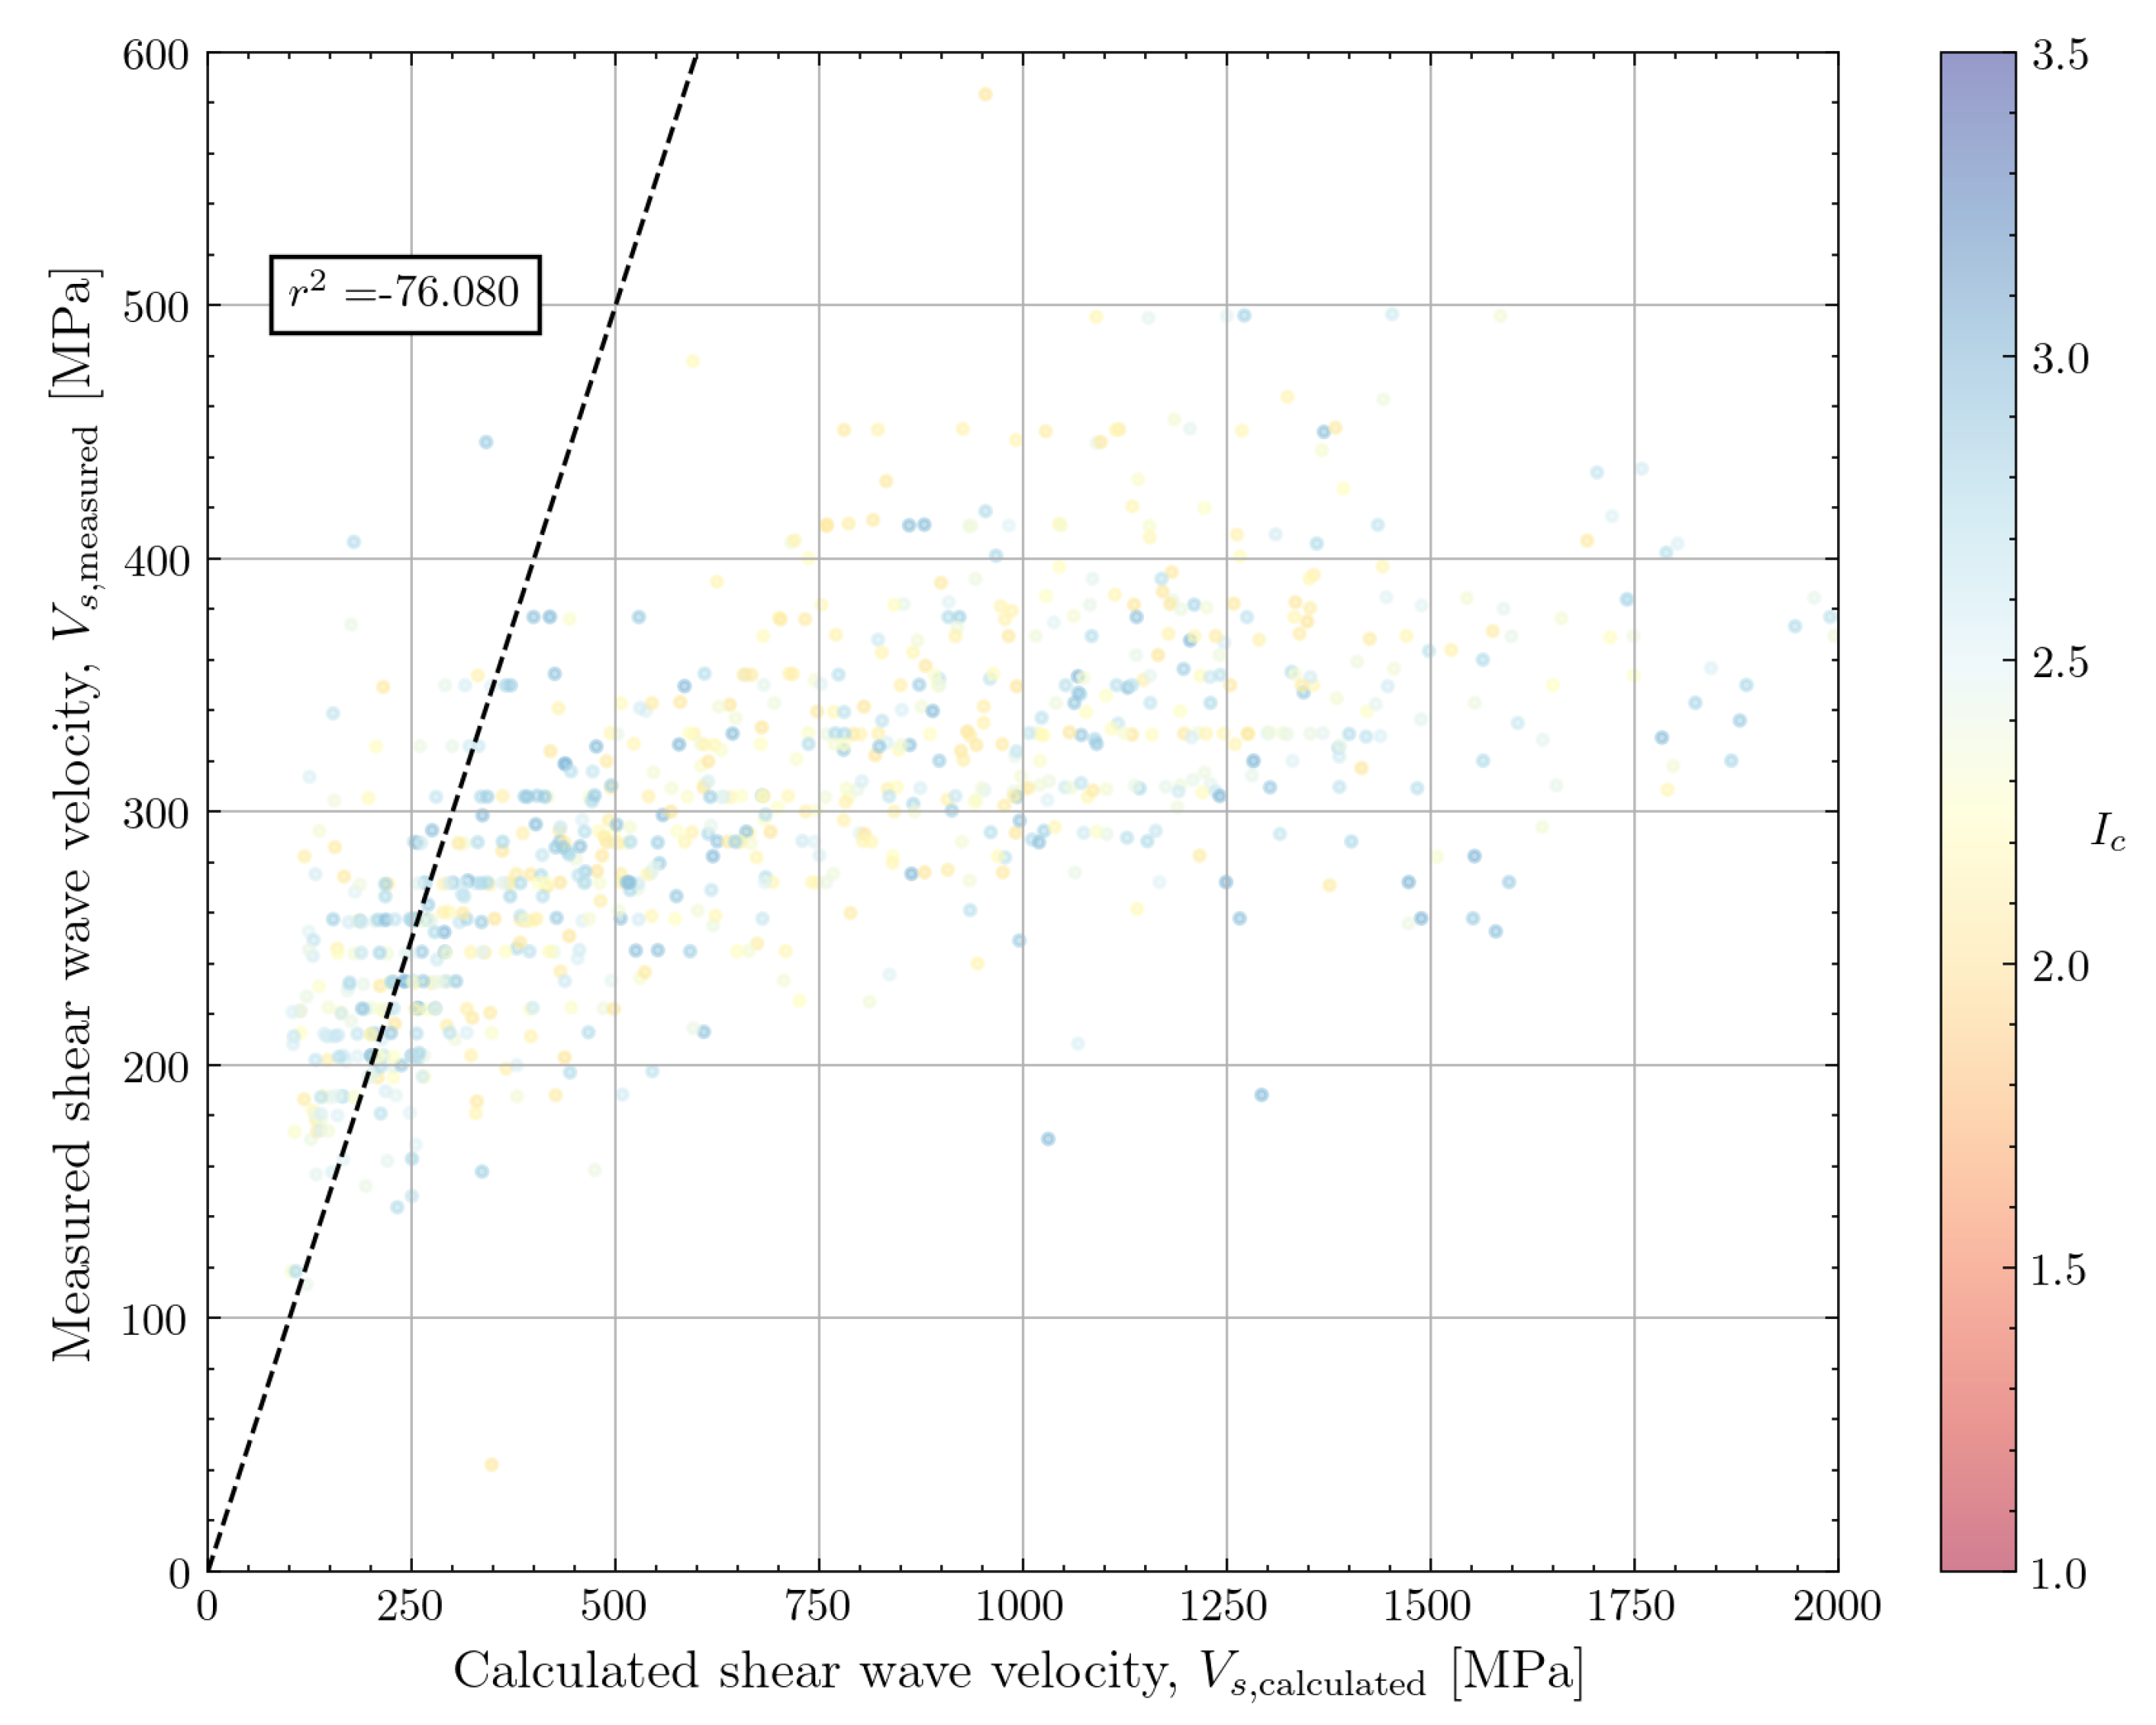
When applied to the data from the North Sea dataset with Robertson soil class 4 and 5 (silt mixtures and sand mixtures), the correlation shows large overprediction of
(
Figure 18). Because of these overpredictions and the site-specific nature of this correlation, it is not evaluated further.
4.2.5. Cha et al. (2014) and Lyu et al. (2021)
Cha et al. [
40] published a framework which explicitly captures the stress-dependence of the shear wave velocity. The effective stresses in the direction parallel to shear wave propagation (
) and the direction perpendicular to the wave propagation (
) are considered. The authors proposed a dependence of the coefficients
and
in Equation
11 on the compression index
of the soil material by investigating results from an oedometer test setup equipped with bender elements.
The compression index needs to be known for this relation to be applied. It should be noted that
also has a stress dependence. For offshore wind farm geotechnical surveys, data on the compression index is only available from a limited amount of tests which are generally performed on undisturbed samples from cohesive layers. Therefore, a comparison against the North Sea dataset cannot be undertaken. Nevertheless, the mathematical form of the model is of interest.
Lyu et al. [
41] simplified the stress-dependent model by Cha et al. [
40] to only include the vertical effective stress (Equation
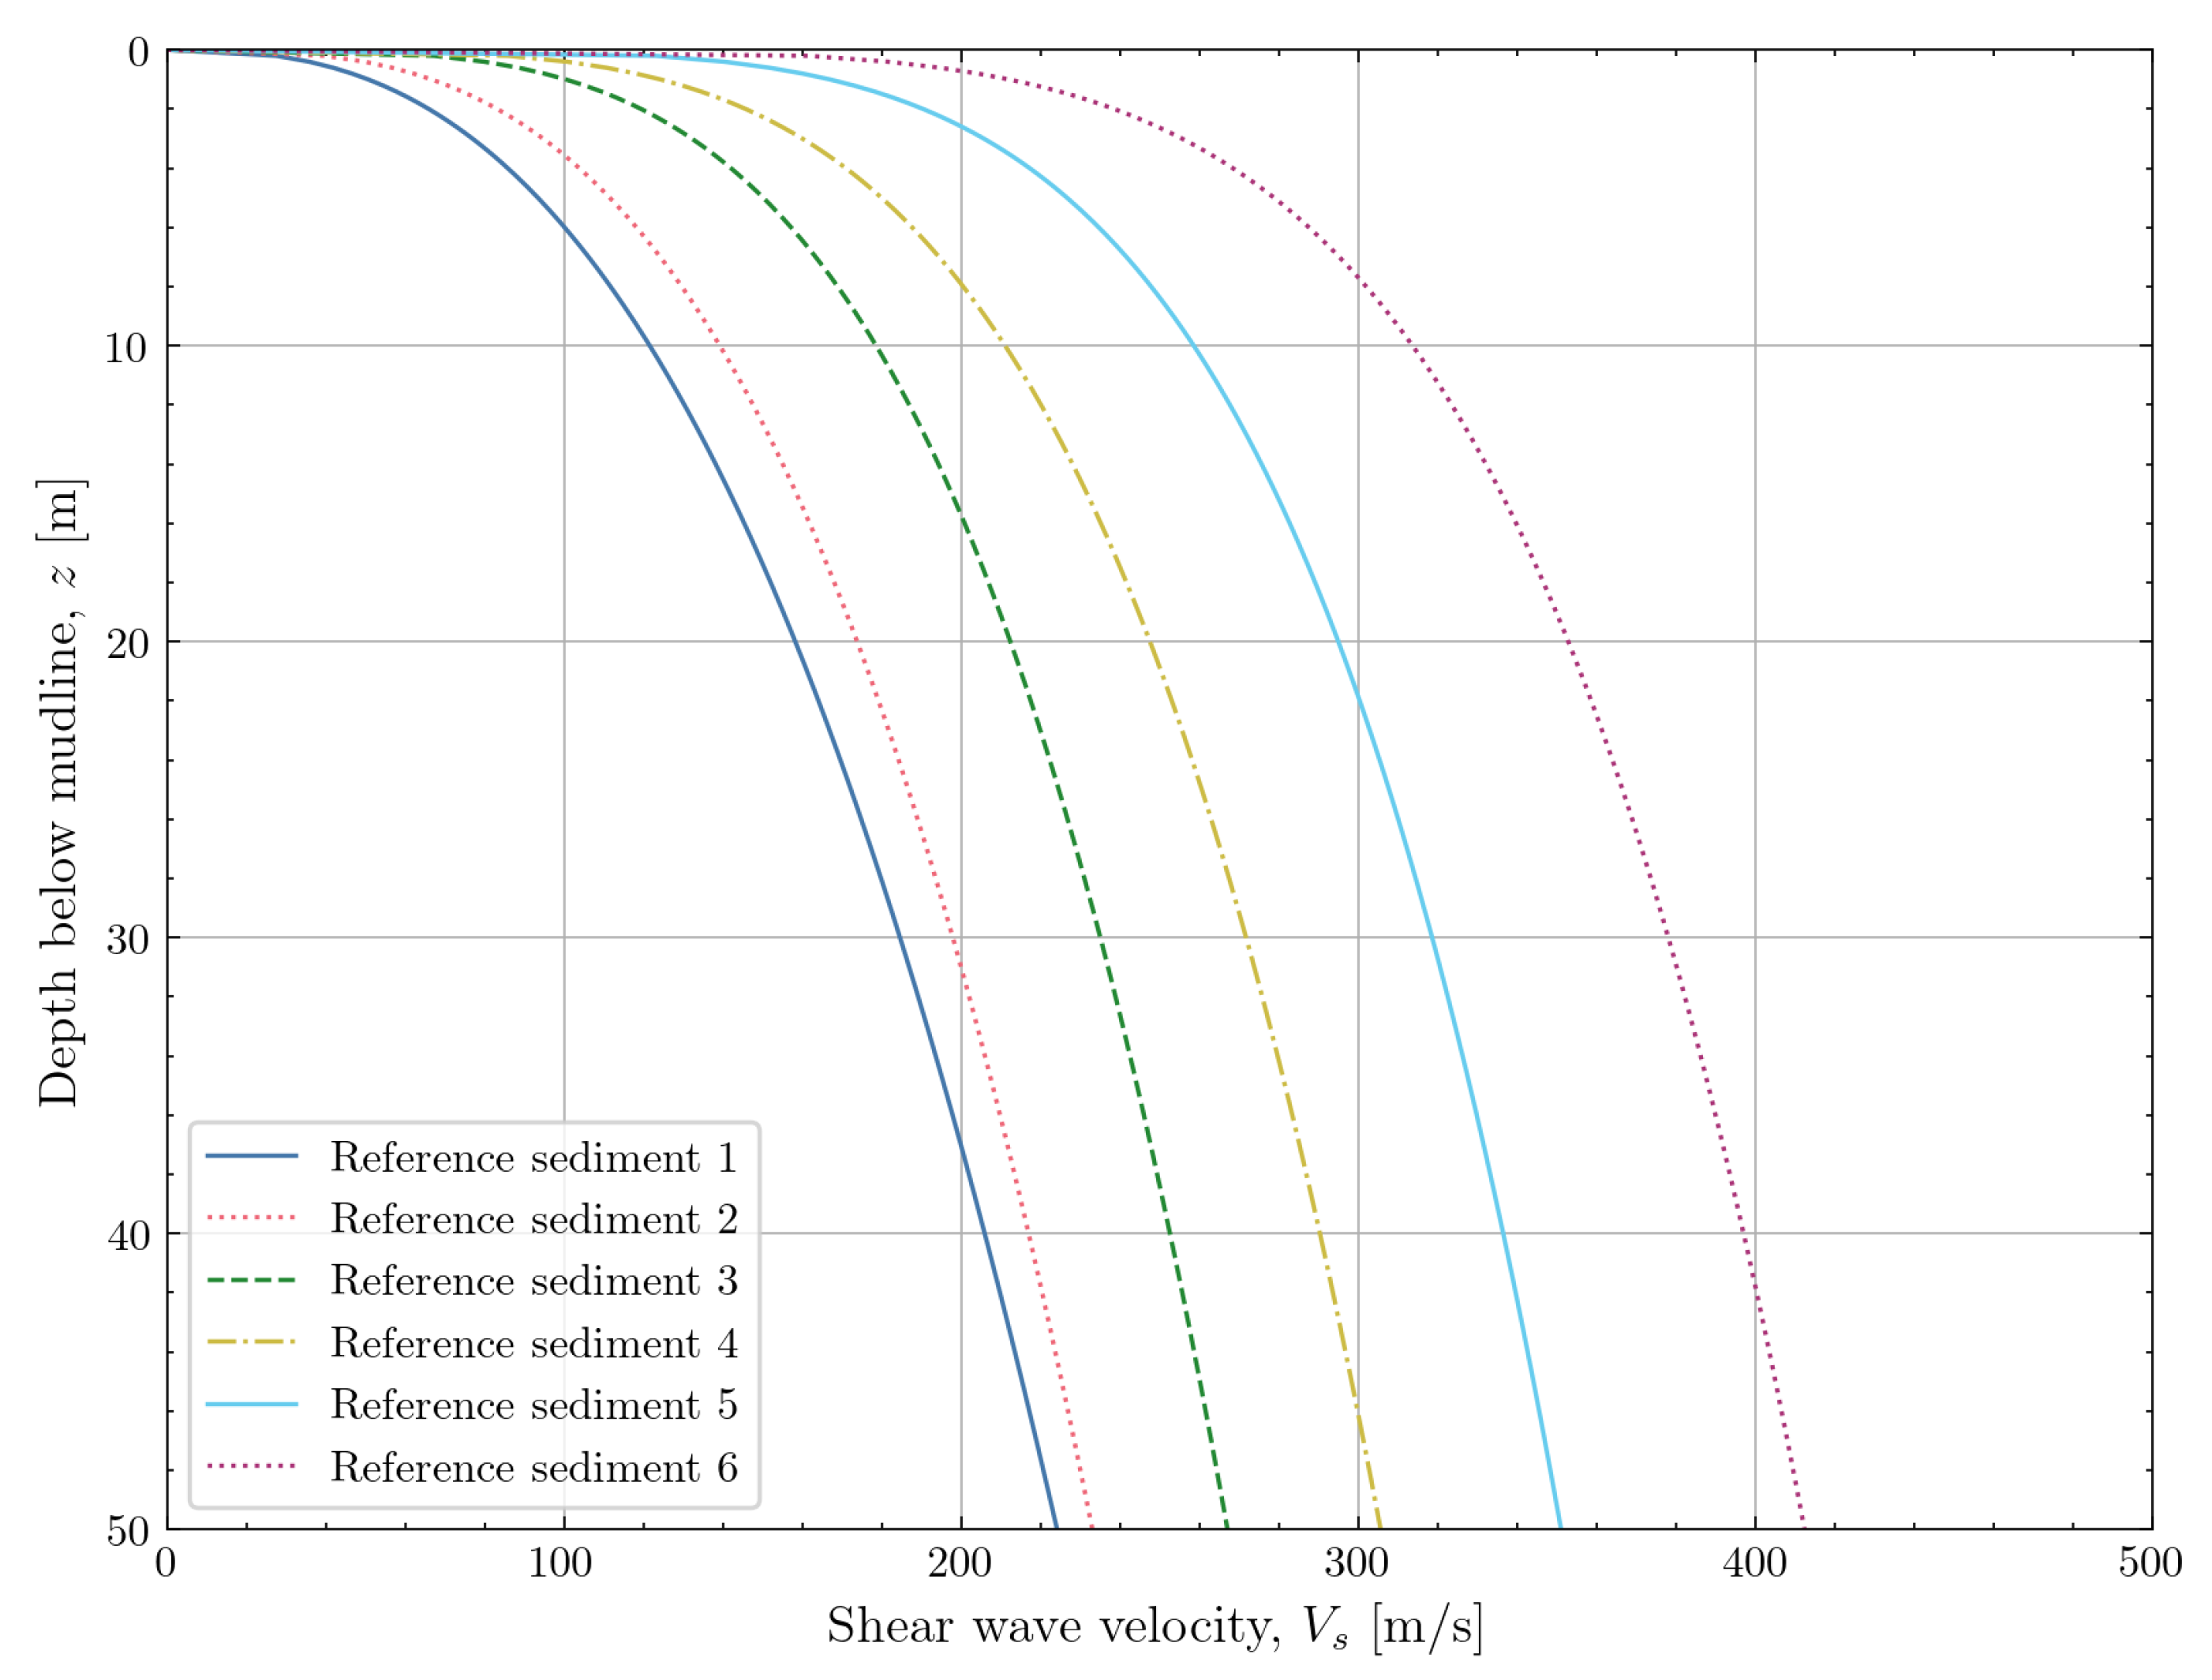
12). The authors propose coefficients for this stress-dependent model for a range of reference sediments ranging from soft clay (reference sediment 1) to coarse sand (reference sediment 6). The proposed trends of
with depth are shown in
Figure 19. These trends show a rapid increase of
close to the mudline and a more gradual increase at deeper depths. For more fine-grained sediments, lower
values are predicted at a given depth. The authors connect the values of coefficients
and
to the compressibility of the sediment and do not provide guidance to connect these coefficients to quantities which can be measured with the CPT.
4.2.6. Robertson and Cabal (2015)
Robertson and Cabal [
14] formulated a widely used correlation for shear wave velocity based on soil behaviour type index as shown in Equation
13. Unfortunately, the authors do not present the background data used for calibration of the correlation.
The correlation was applied to the North Sea data as shown in
Figure 20. The correlation does not show a systematic bias when applied to the North Sea data . Moreover, there is no bias towards any specific soil type.
4.2.7. McGann et al. (2018)
Following the Christchurch earthquake event, McGann et al. [
15] developed a correlation between CPT data and shear wave velocity for soils from the Christchurch region in New Zealand. The correlation utilised
,
and depth. Measurements of
down to a depth of 30m were considered. A specific calibration for loess soils was developed since
in these soils appeared to be underpredicted by a correlation calibrated to the remainder of the available data.
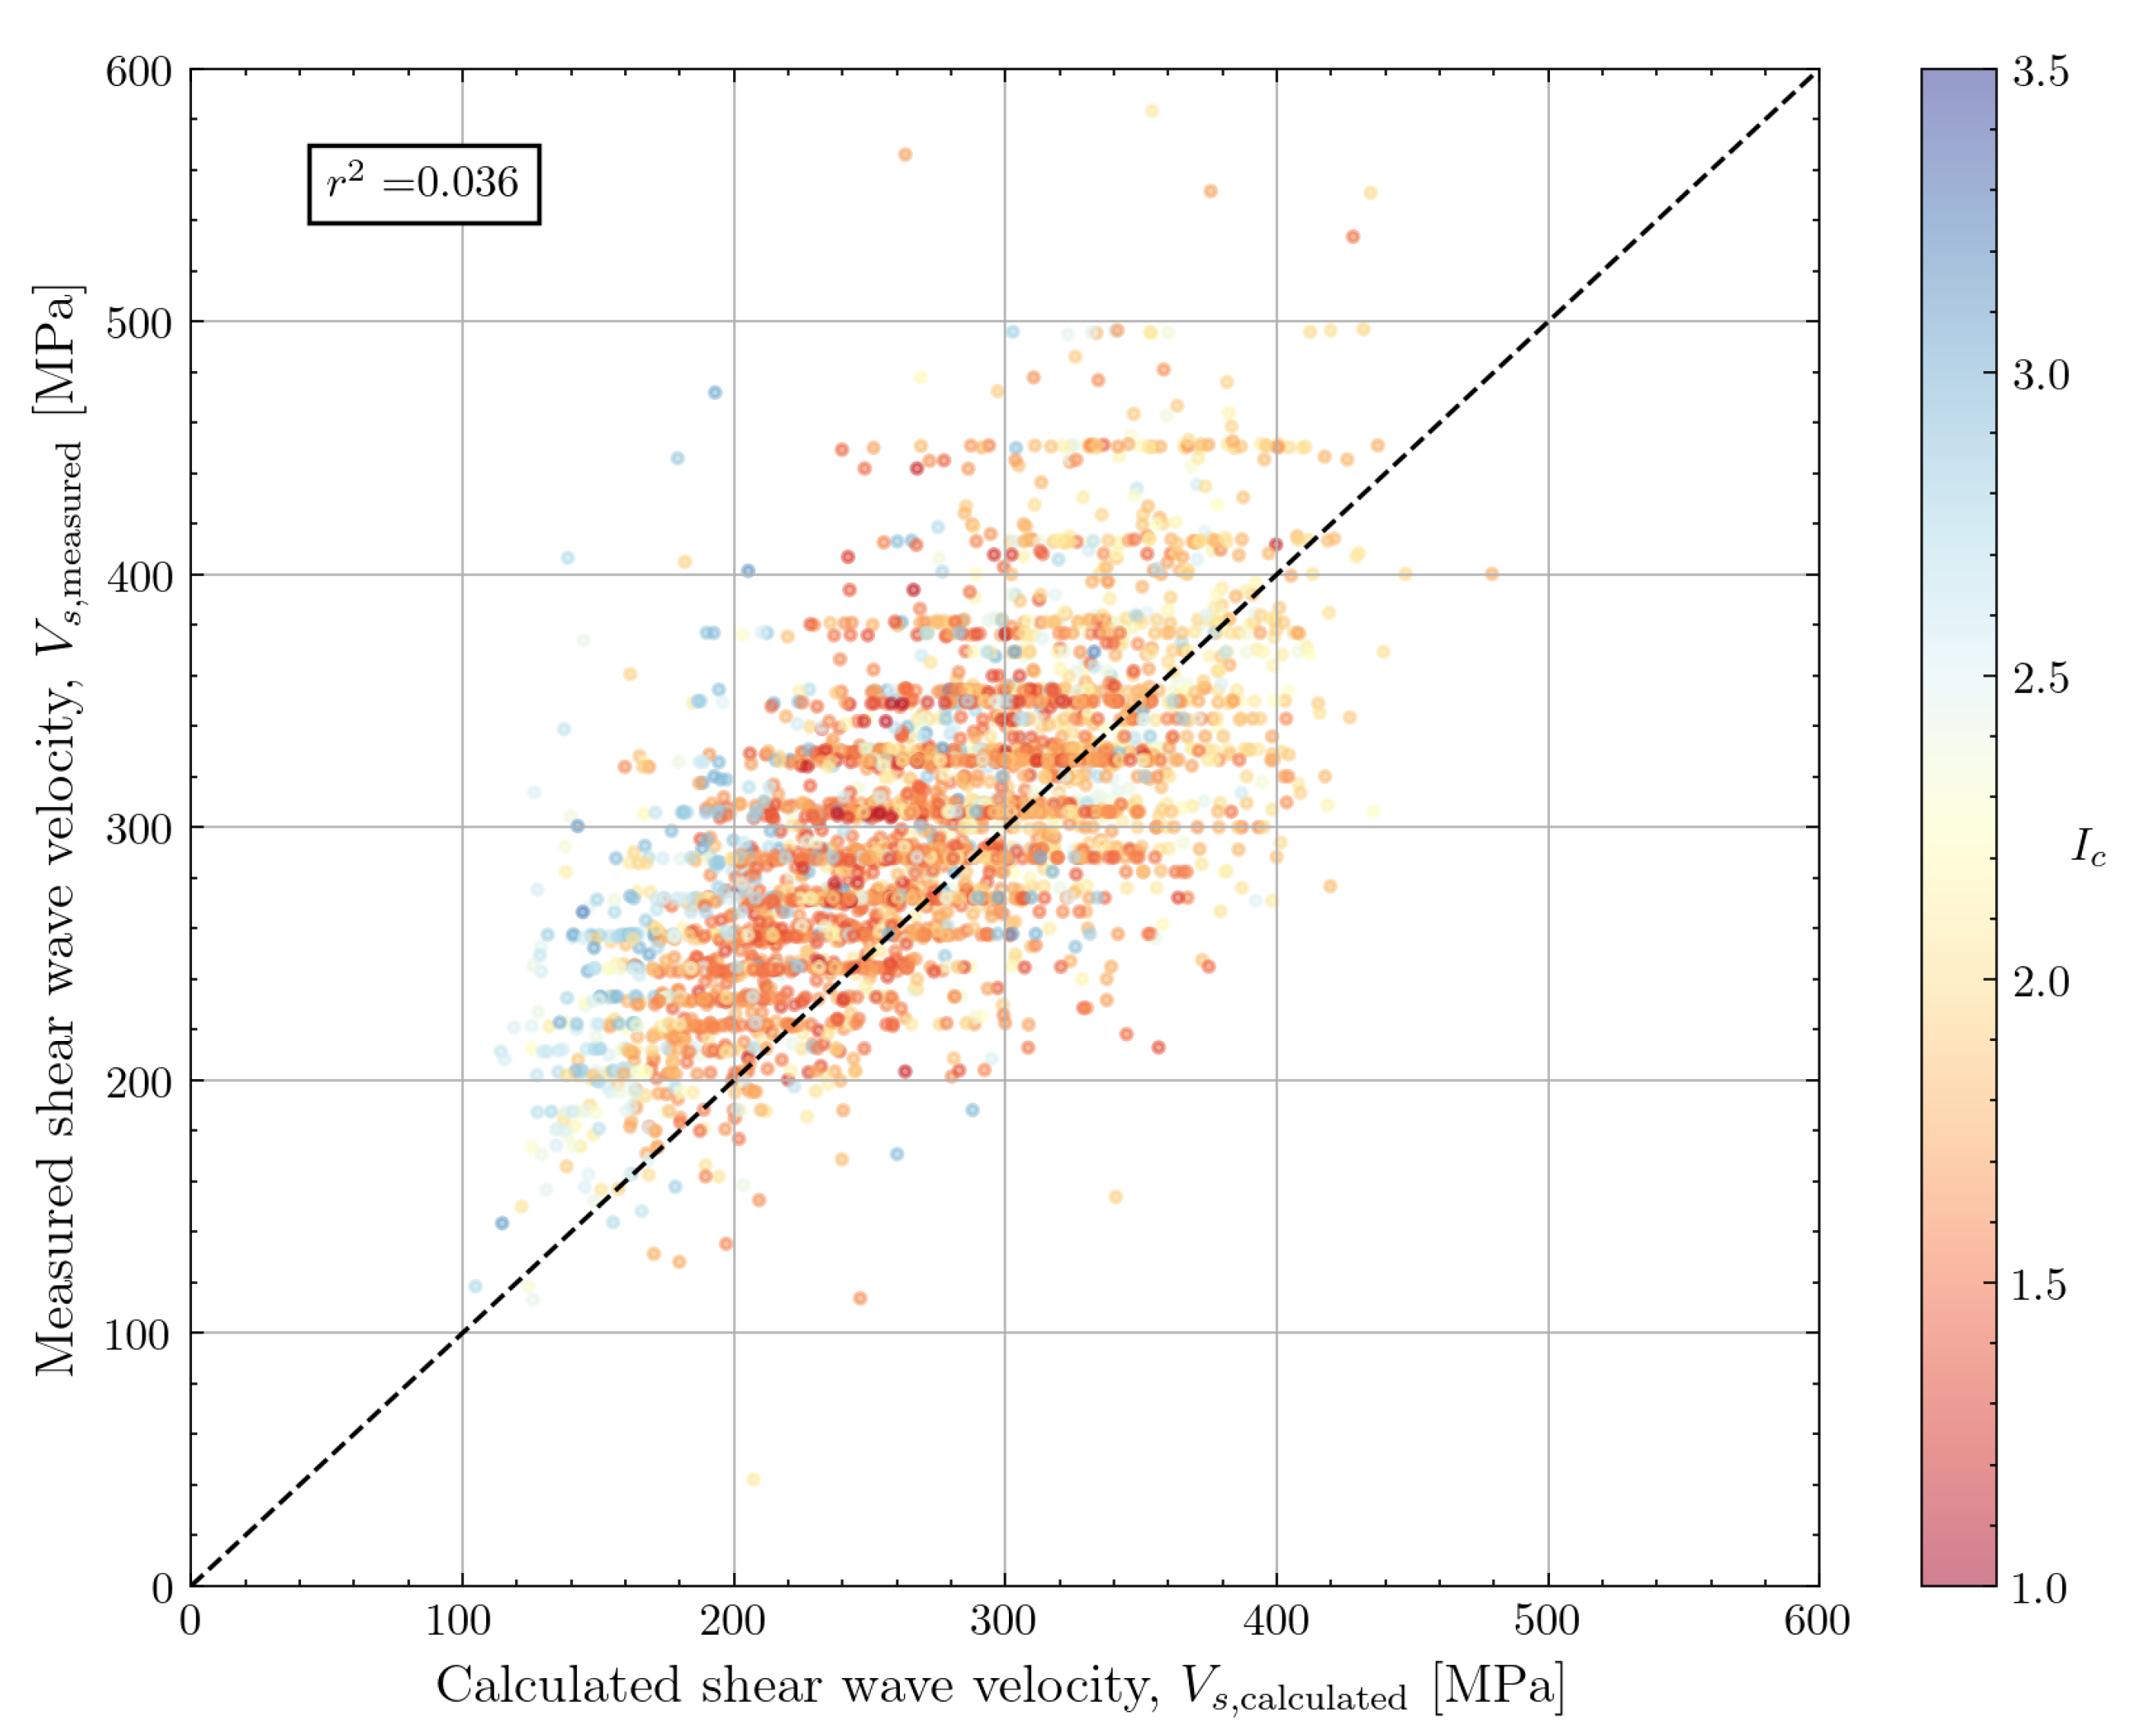
The performance of the correlation for the North Sea dataset is shown in
Figure 21. The comparison shows a slight underprediction for the majority of the data. When using the correlation for loess (not shown in the figure), there is no improvement to the accuracy and a consistent overprediction is noticed.
4.3. Statistical Evaluation of CPT-Based Correlations for the North Sea Dataset
Following the evaluation of several correlations for
or
against the North Sea dataset, the accuracy of the correlations can be summarised in terms of the ratio of calculated to measured
or
. The mean (
) and Coefficient of Variation (COV) of the ratio
or
can be computed for the North Sea dataset as shown in Equation
15. If a correlation performs well, it should have a mean close to 1 and a COV which is as low as possible.
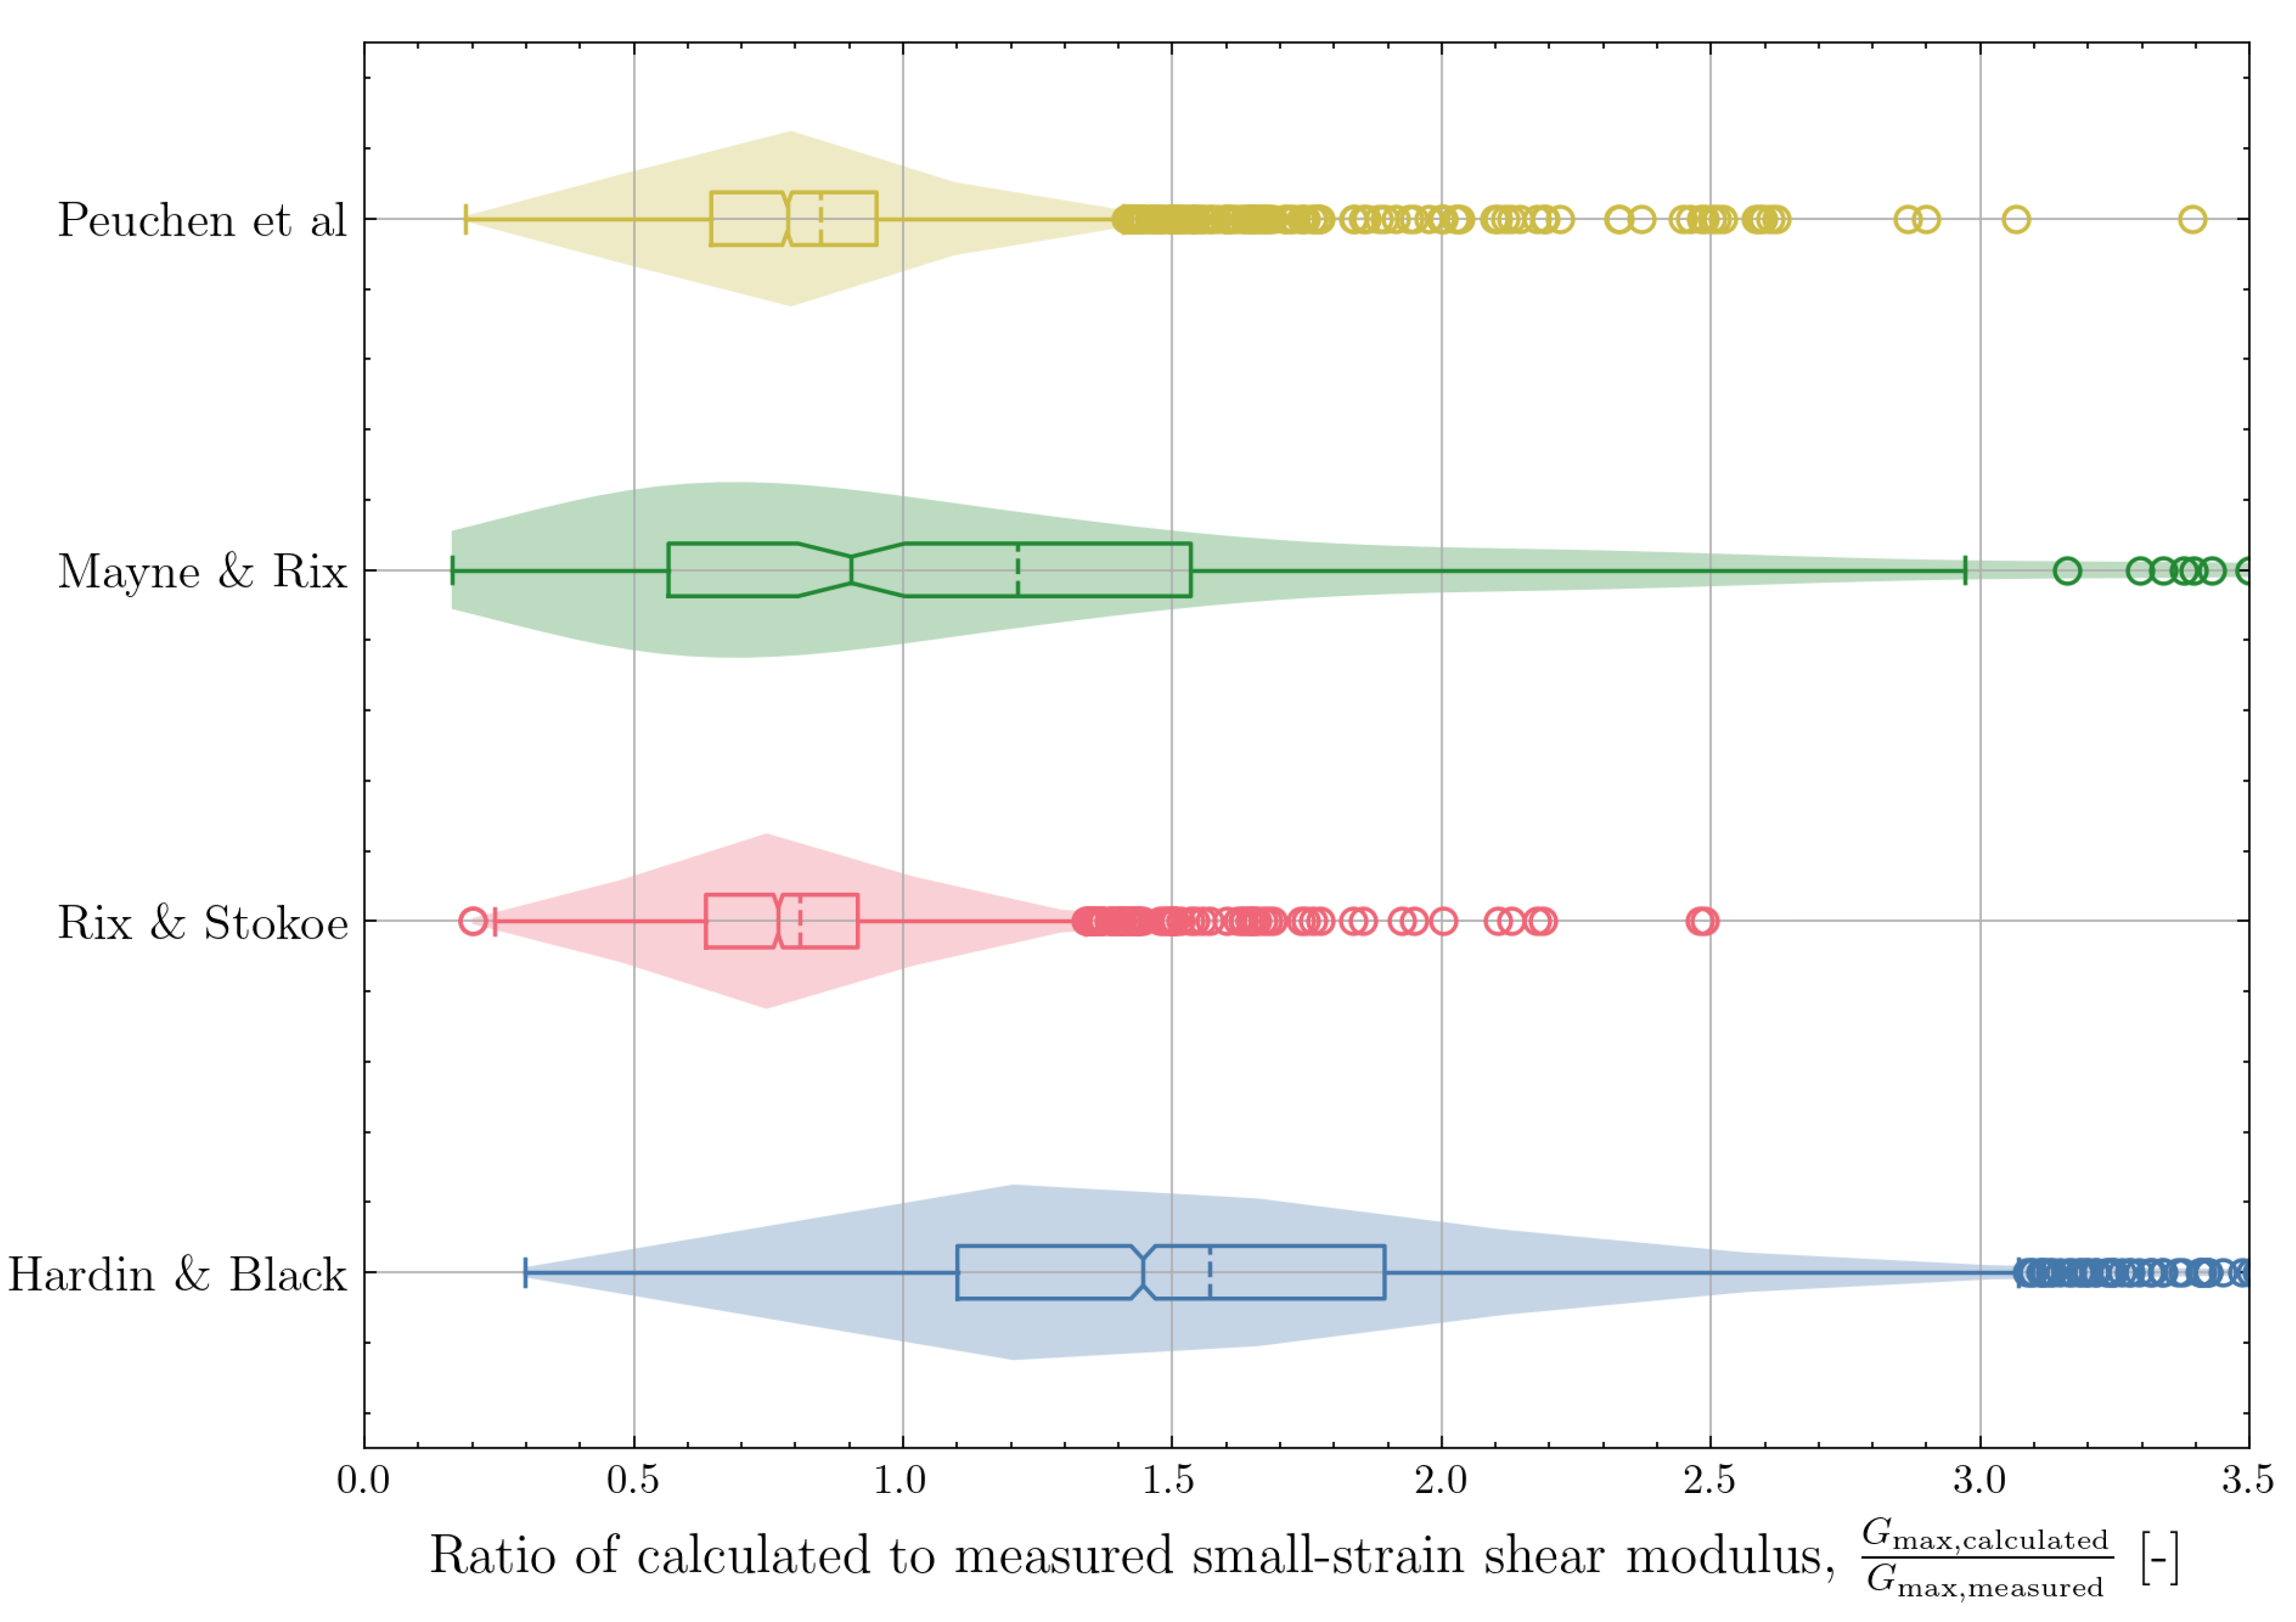
The accuracy of the correlations can also be visualised by examining the combined box and violin plots of the ratios
or
. The combined box and violin plots for the correlations which predict
are shown in
Figure 22. The combined box and violin plots show the observed underprediction of
with the correlation by Rix and Stokoe [
8]. The correlation of Mayne and Rix [
9] for cohesive soils has a mean closer to 1 but shows a large variation. The correlation by Hardin and Black [
33] shows a tendency for overprediction of
with a large uncertainty (wide distribution) on the estimate.
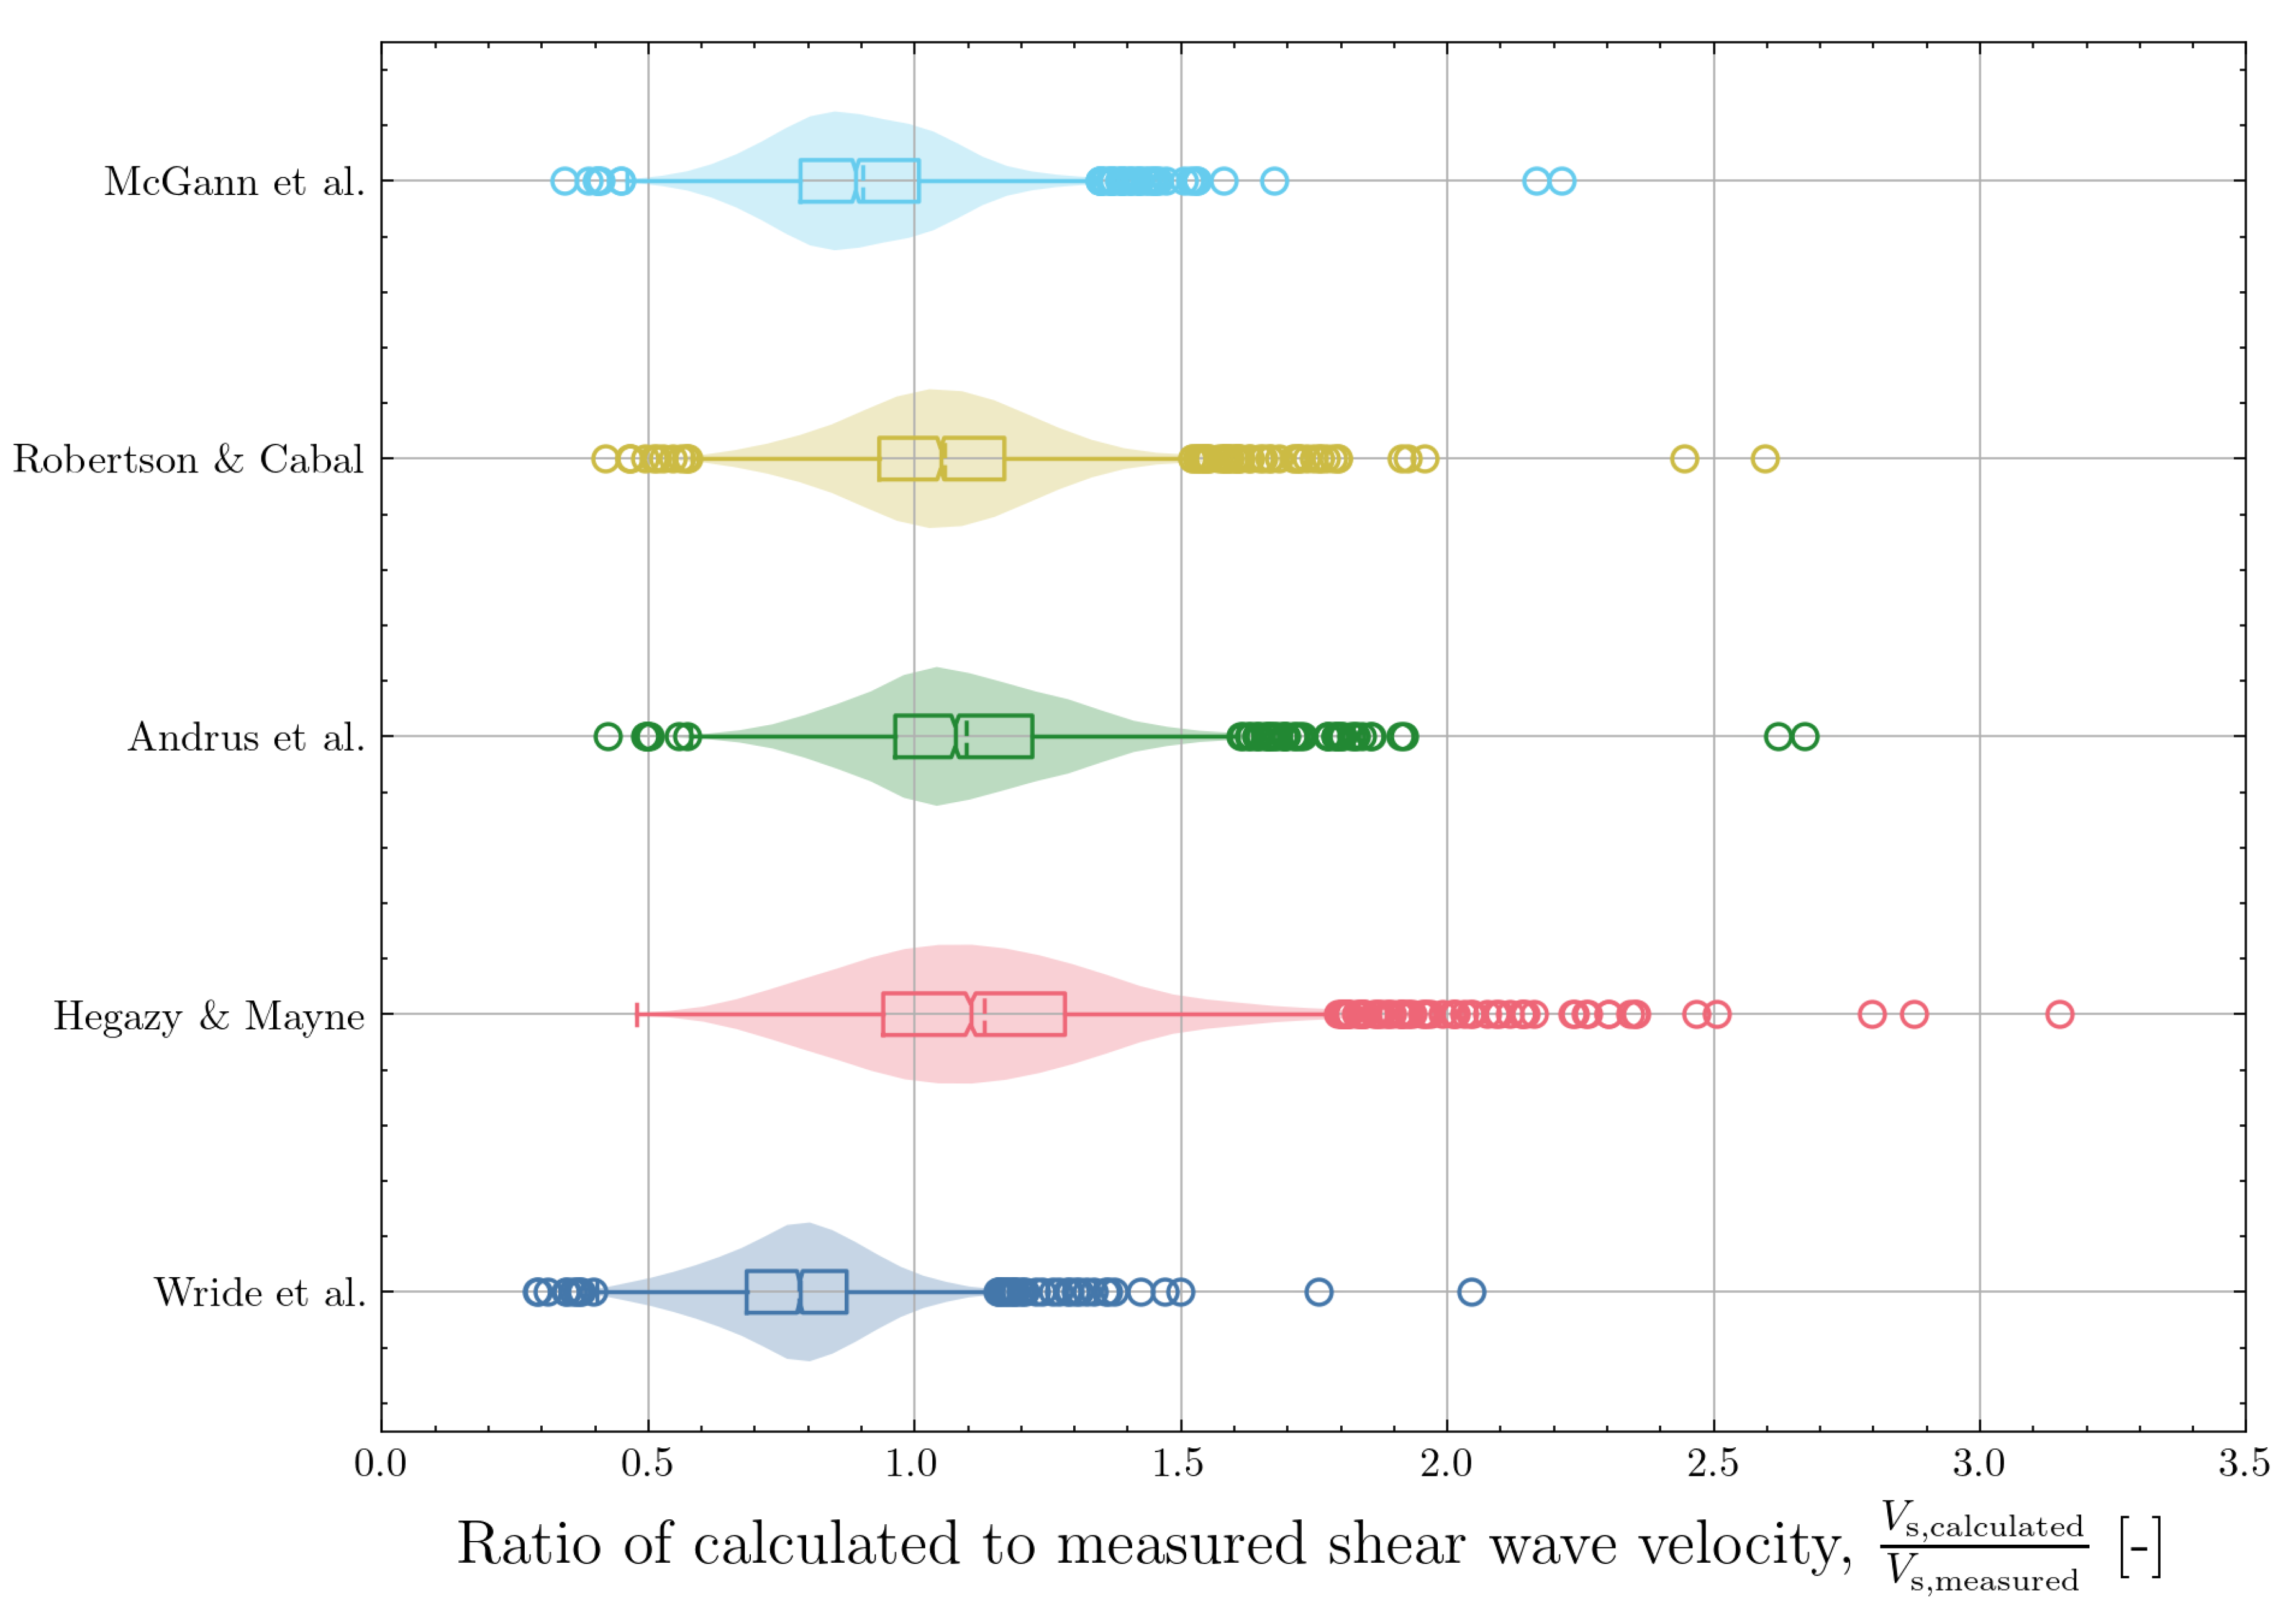
Similarly, the accuracy of the correlations predicting
can be visualised using a combined box and violin plot. The result is shown in
Figure 23. The improved accuracy of the
correlations, as shown from a smaller IQR in the boxplot and a narrower distribution from the violin plot is visible. Out of the five selected correlations, the correlation by Robertson and Cabal [
14] has the most neutral bias and a relatively small COV. The correlations by Wride et al. [
11] and McGann et al. [
15] have a tendency for underprediction of
while the correlation of Hegazy and Mayne [
10] shows a tendency for overprediction of
.
The accuracy metrics are summarised in
Table 3. The nearly neutral bias and relatively small COV for the correlation by Robertson and Cabal [
14] is apparent from this table. The number of points for which the correlation could be evaluated (
) corresponds to the number of seismic CPT measurements with a seafloor CPT system. The exceptions are the correlation of Rix and Stokoe [
8] which was only applied for cohesionless soils, the correlation by Mayne and Rix [
9] which was only applied to cohesive soils and the correlation by Tonni and Simonini [
13] which was only applied for silty soils.
Table 3 also shows the coefficient of determination
for the measured and predicted
or
. The coefficient of determination is a measure for the goodness of fit of a model by representing the proportion of the variance of the measurements that can be explained from the independent variables in the mode. Equation
16 show the equation for
where
are the measurements and
are the predictions from the correlation.
should be as close to one as possible with one being a perfect fit. When
equals zero, it means that the model would always predict the average
, regardless of the values of the input features. Negative
scores are possible, indicating a poor fit.
The majority of correlations show a negative
score. This means that these models perform poorly in capturing the underlying physics of the problem as the selected input features should have a meaningful impact on the predictions. Only the models by Robertson and Cabal [
14] and McGann [
15] show a positive
score which is still close to zero. The scatter on the input data plays a significant role in this assessment.
5. A New Stress-Dependent Model for Shear Wave Velocity
5.1. Soil Mechanical Background
Looking at the various models for
proposed in
Section 4, most equations capture the dependence of
on the soil’s packing density (relative density for sand and overconsolidation ratio for clay) and the effective stress conditions at the depth considered. The equation used for the correlation between CPT data and shear wave velocity by Robertson and Cabal [
14] makes use of the soil behaviour type index to capture the soil packing density. It can be seen in Equation
13 that the logarithm of
varies linearly with
.
While the correlation proposed by Robertson and Cabal [
14] captures the stress-dependence implicitly in the net cone resistance term, an explicit stress-dependence of shear wave velocity is not captured with this equation.
The stress-dependent framework for
by Cha et al. [
40] and Lyu et al. [
41] can be used to formulate a model with an explicit stress dependence. Instead of using a formulation for the coefficient
from Equation
11 which depends on
, the logarithm of
is written as a linear function of
, similarly to what Robertson and Cabal [
14] proposed. The linear variation of
with the logarithm of
proposed by Lyu et al. [
41] is also retained. The equation format from Equation
17 is thus obtained.
5.2. Calibration of the Model Coefficients
The coefficients
and
from Equation
17 can be calibrated to the available dataset for North Sea soils using a constrained optimisation algorithm. The calibration resulting in a minimum variance unbiased estimator (MVUE) is provided in Equation
18. It can be observed that the coefficient for
are relatively close to the ones proposed by Cha et al. [
40]. The coefficients
and
are not comparable to those proposed by Robertson and Cabal [
14] but this is due to the use of vertical effective stress instead of net cone resistance as the second term in the equation. The
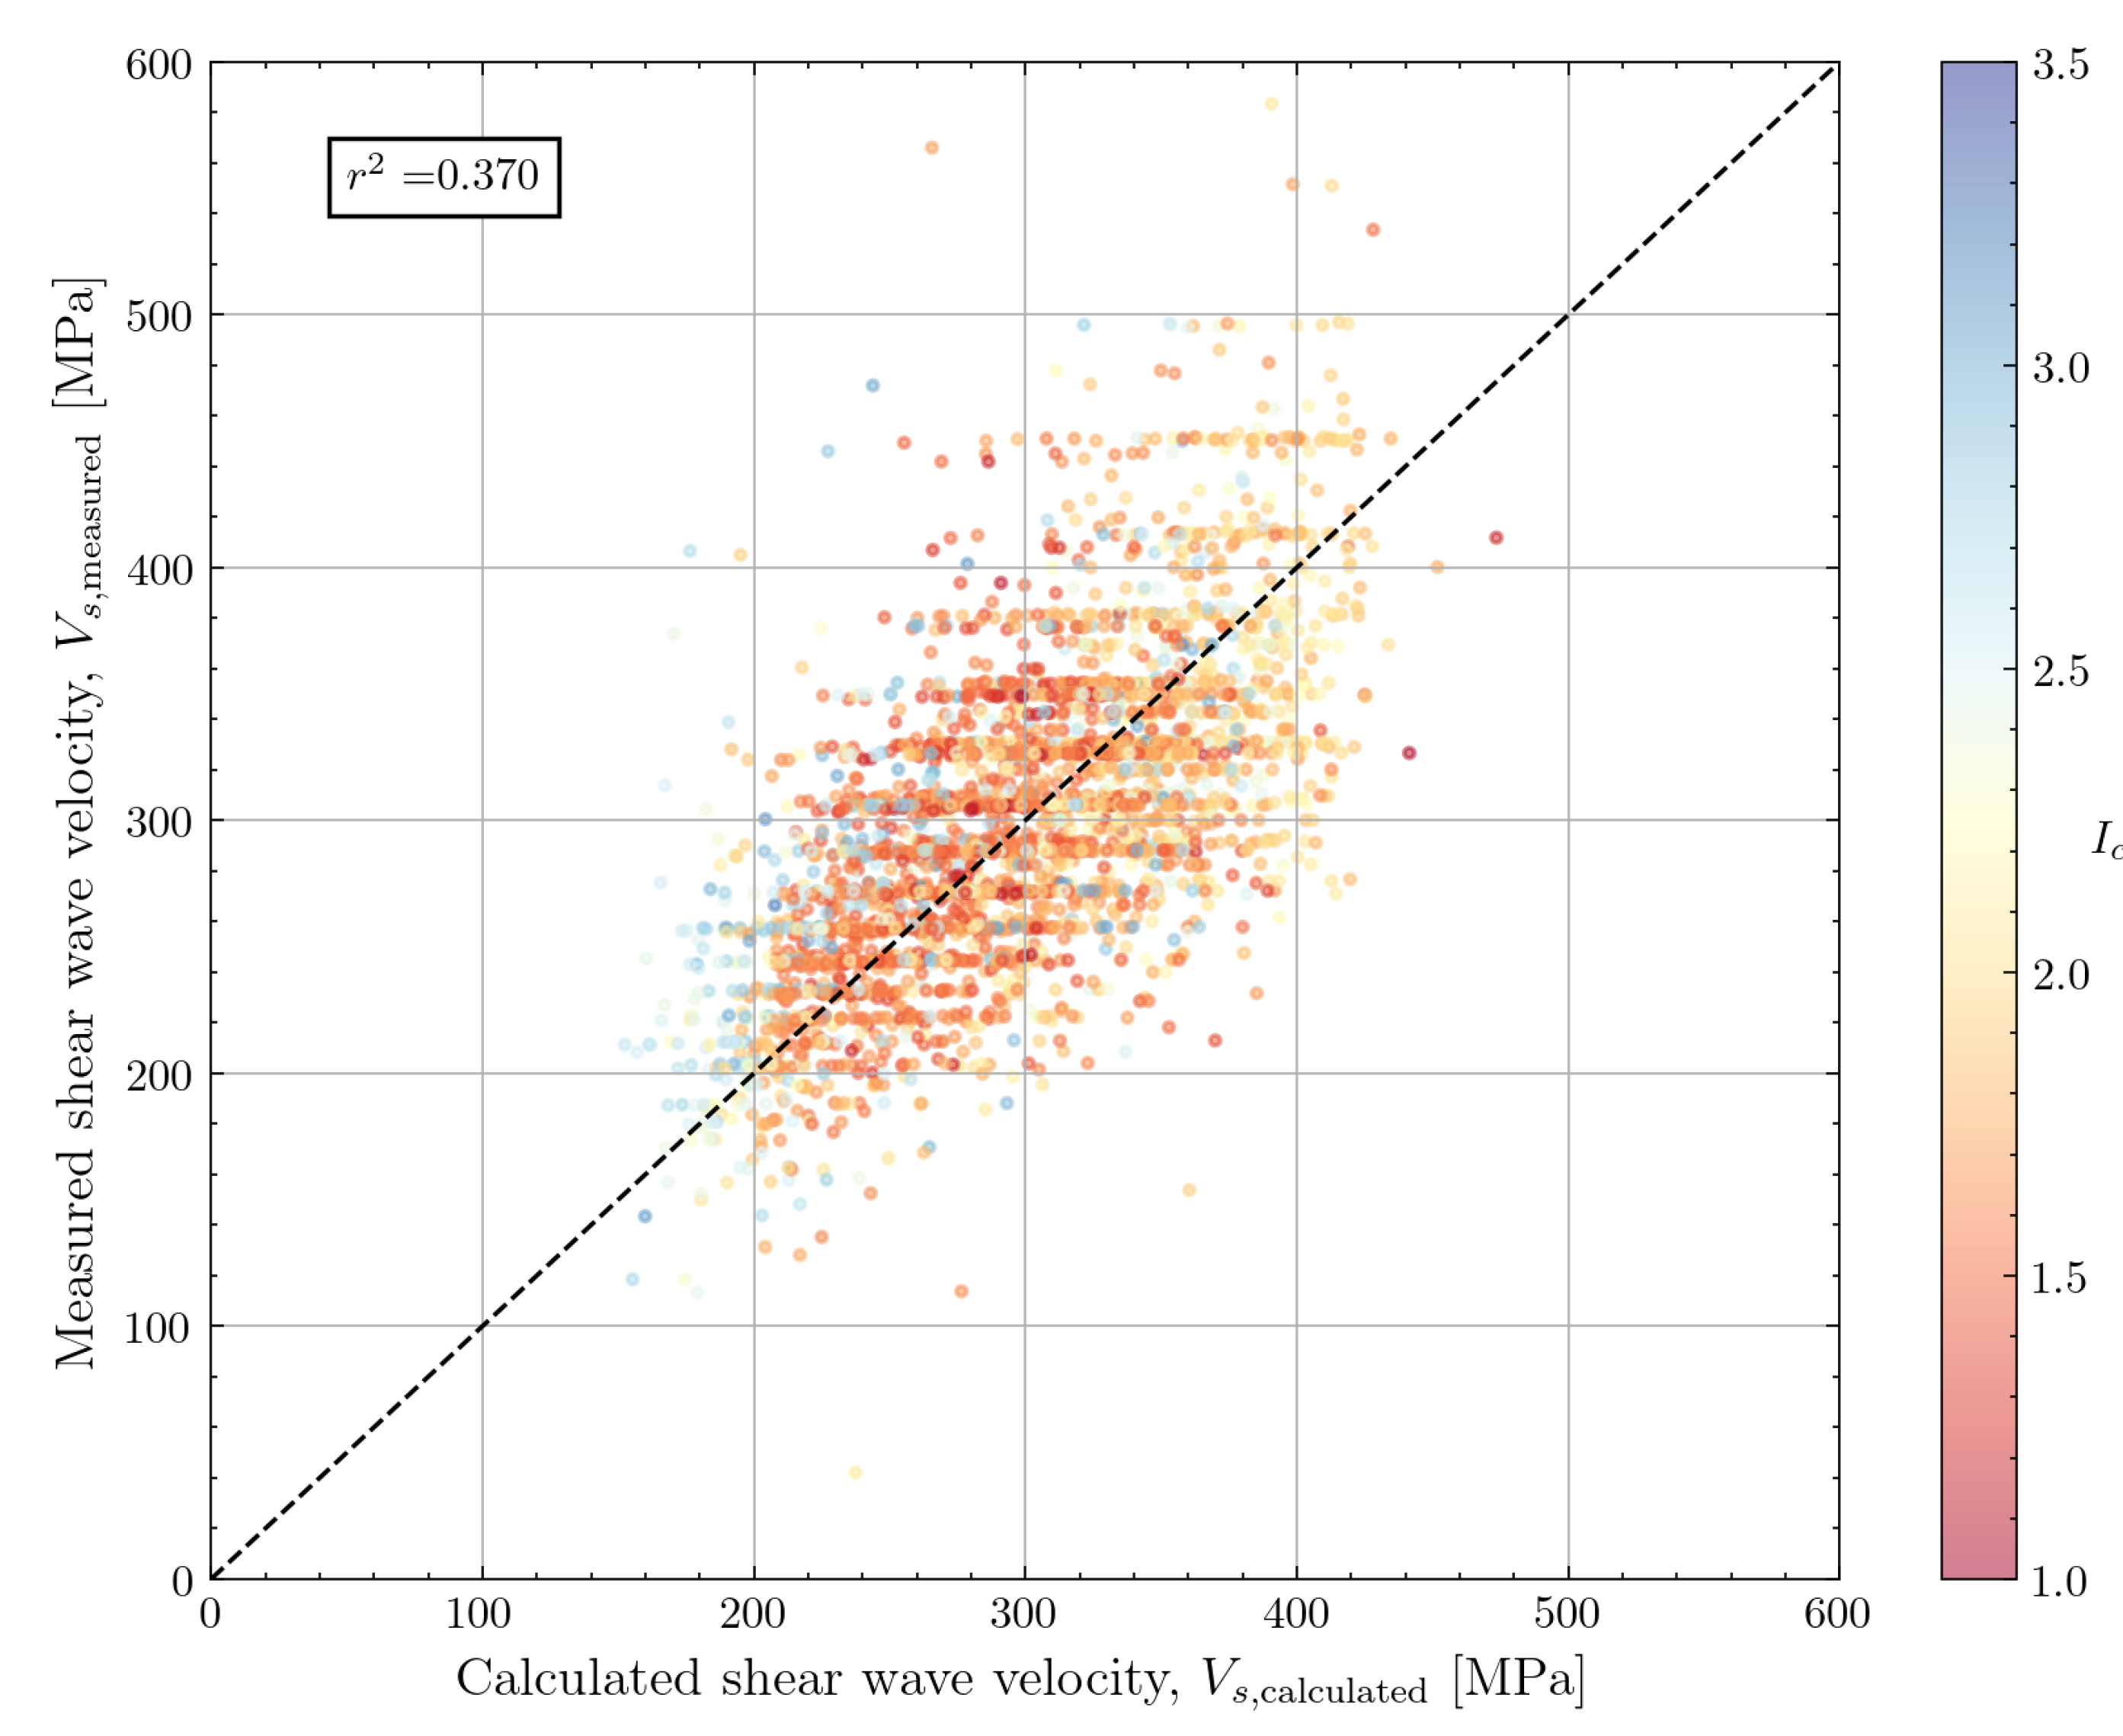
value for the new correlation is equal to 0.370. Although this is still a relatively low value, it indicates that the stress-dependent model outperforms all other correlations in terms of explaining the variance in the data based on the input variables of the model. This confirms that the model formulation with an explicit stress-dependence is meaningful.
When applied to the North Sea dataset, a graphical assessment of the performance of the new correlation (
Figure 24) shows comparatively good results. The data is centered around the line representing perfect estimation and the scatter around that line looks similar to the correlation by Robertson and Cabal [
14]. This is also reflected in the statistical metrics for model performance. The mean of the ratio
is 1.007 and the COV is 0.188 which is a slight improvement compared to the Robertson and Cabal [
14] correlation performance.
5.3. Evaluation of the Newly Proposed Correlation
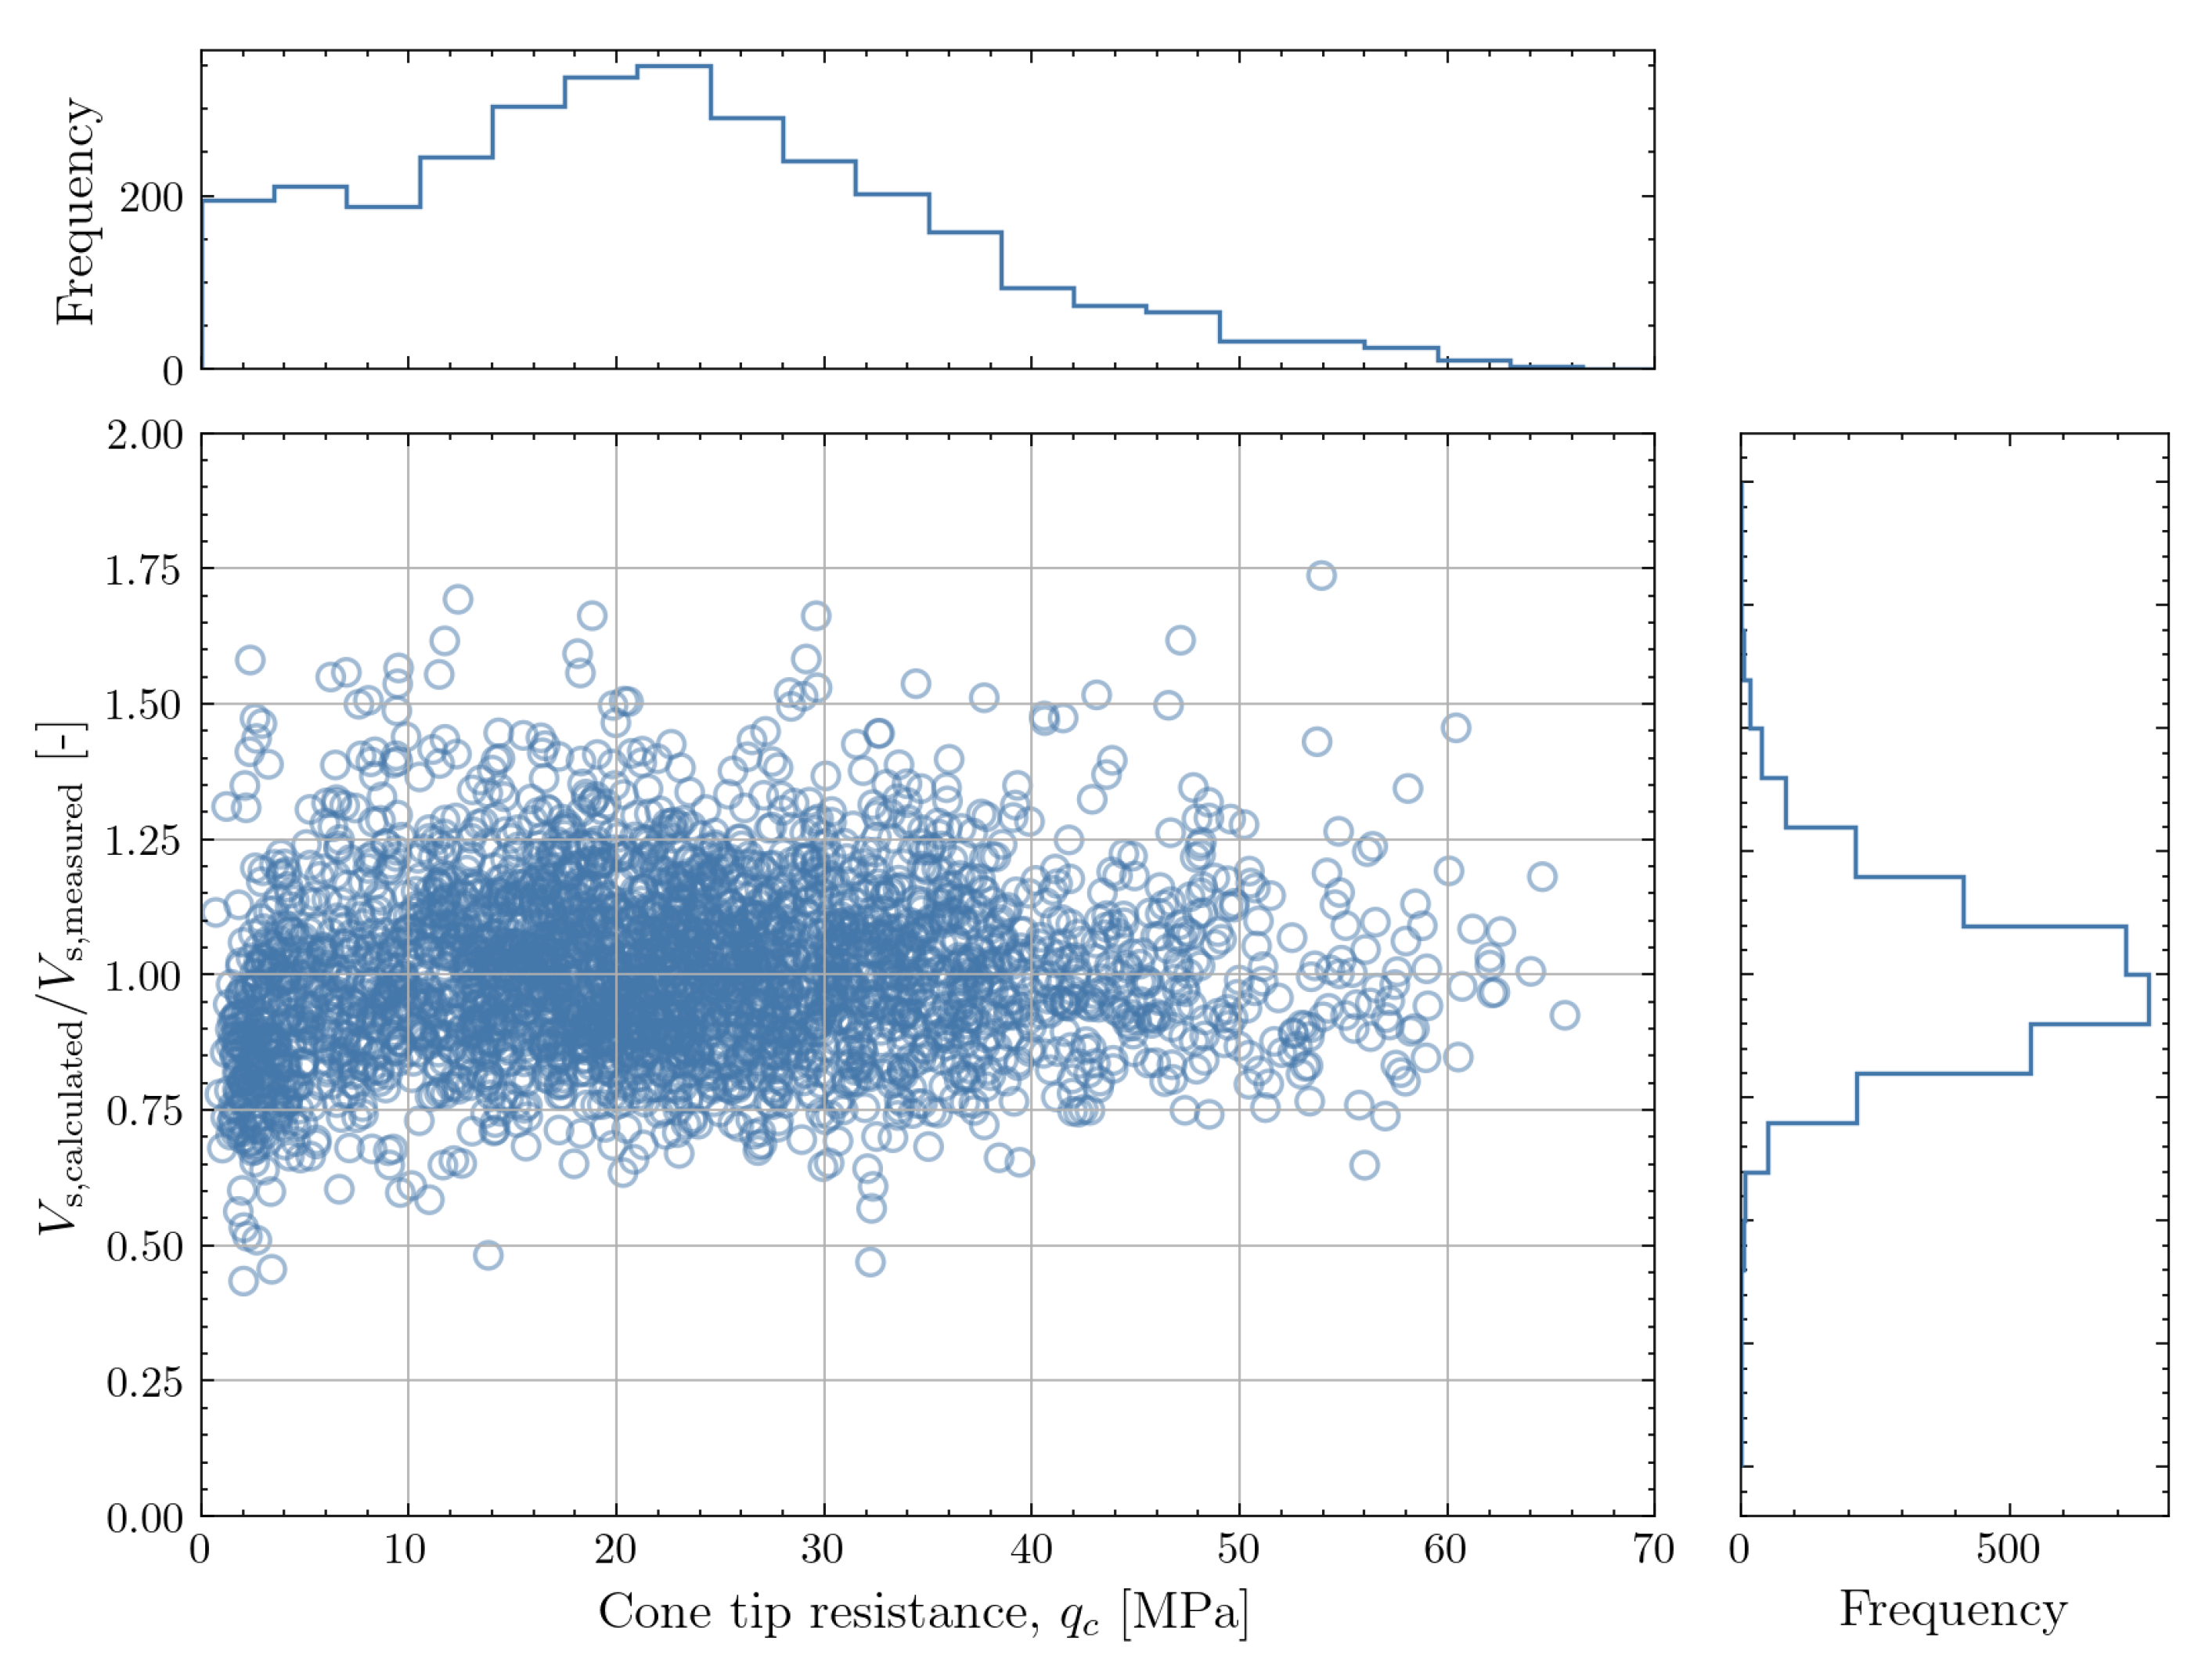
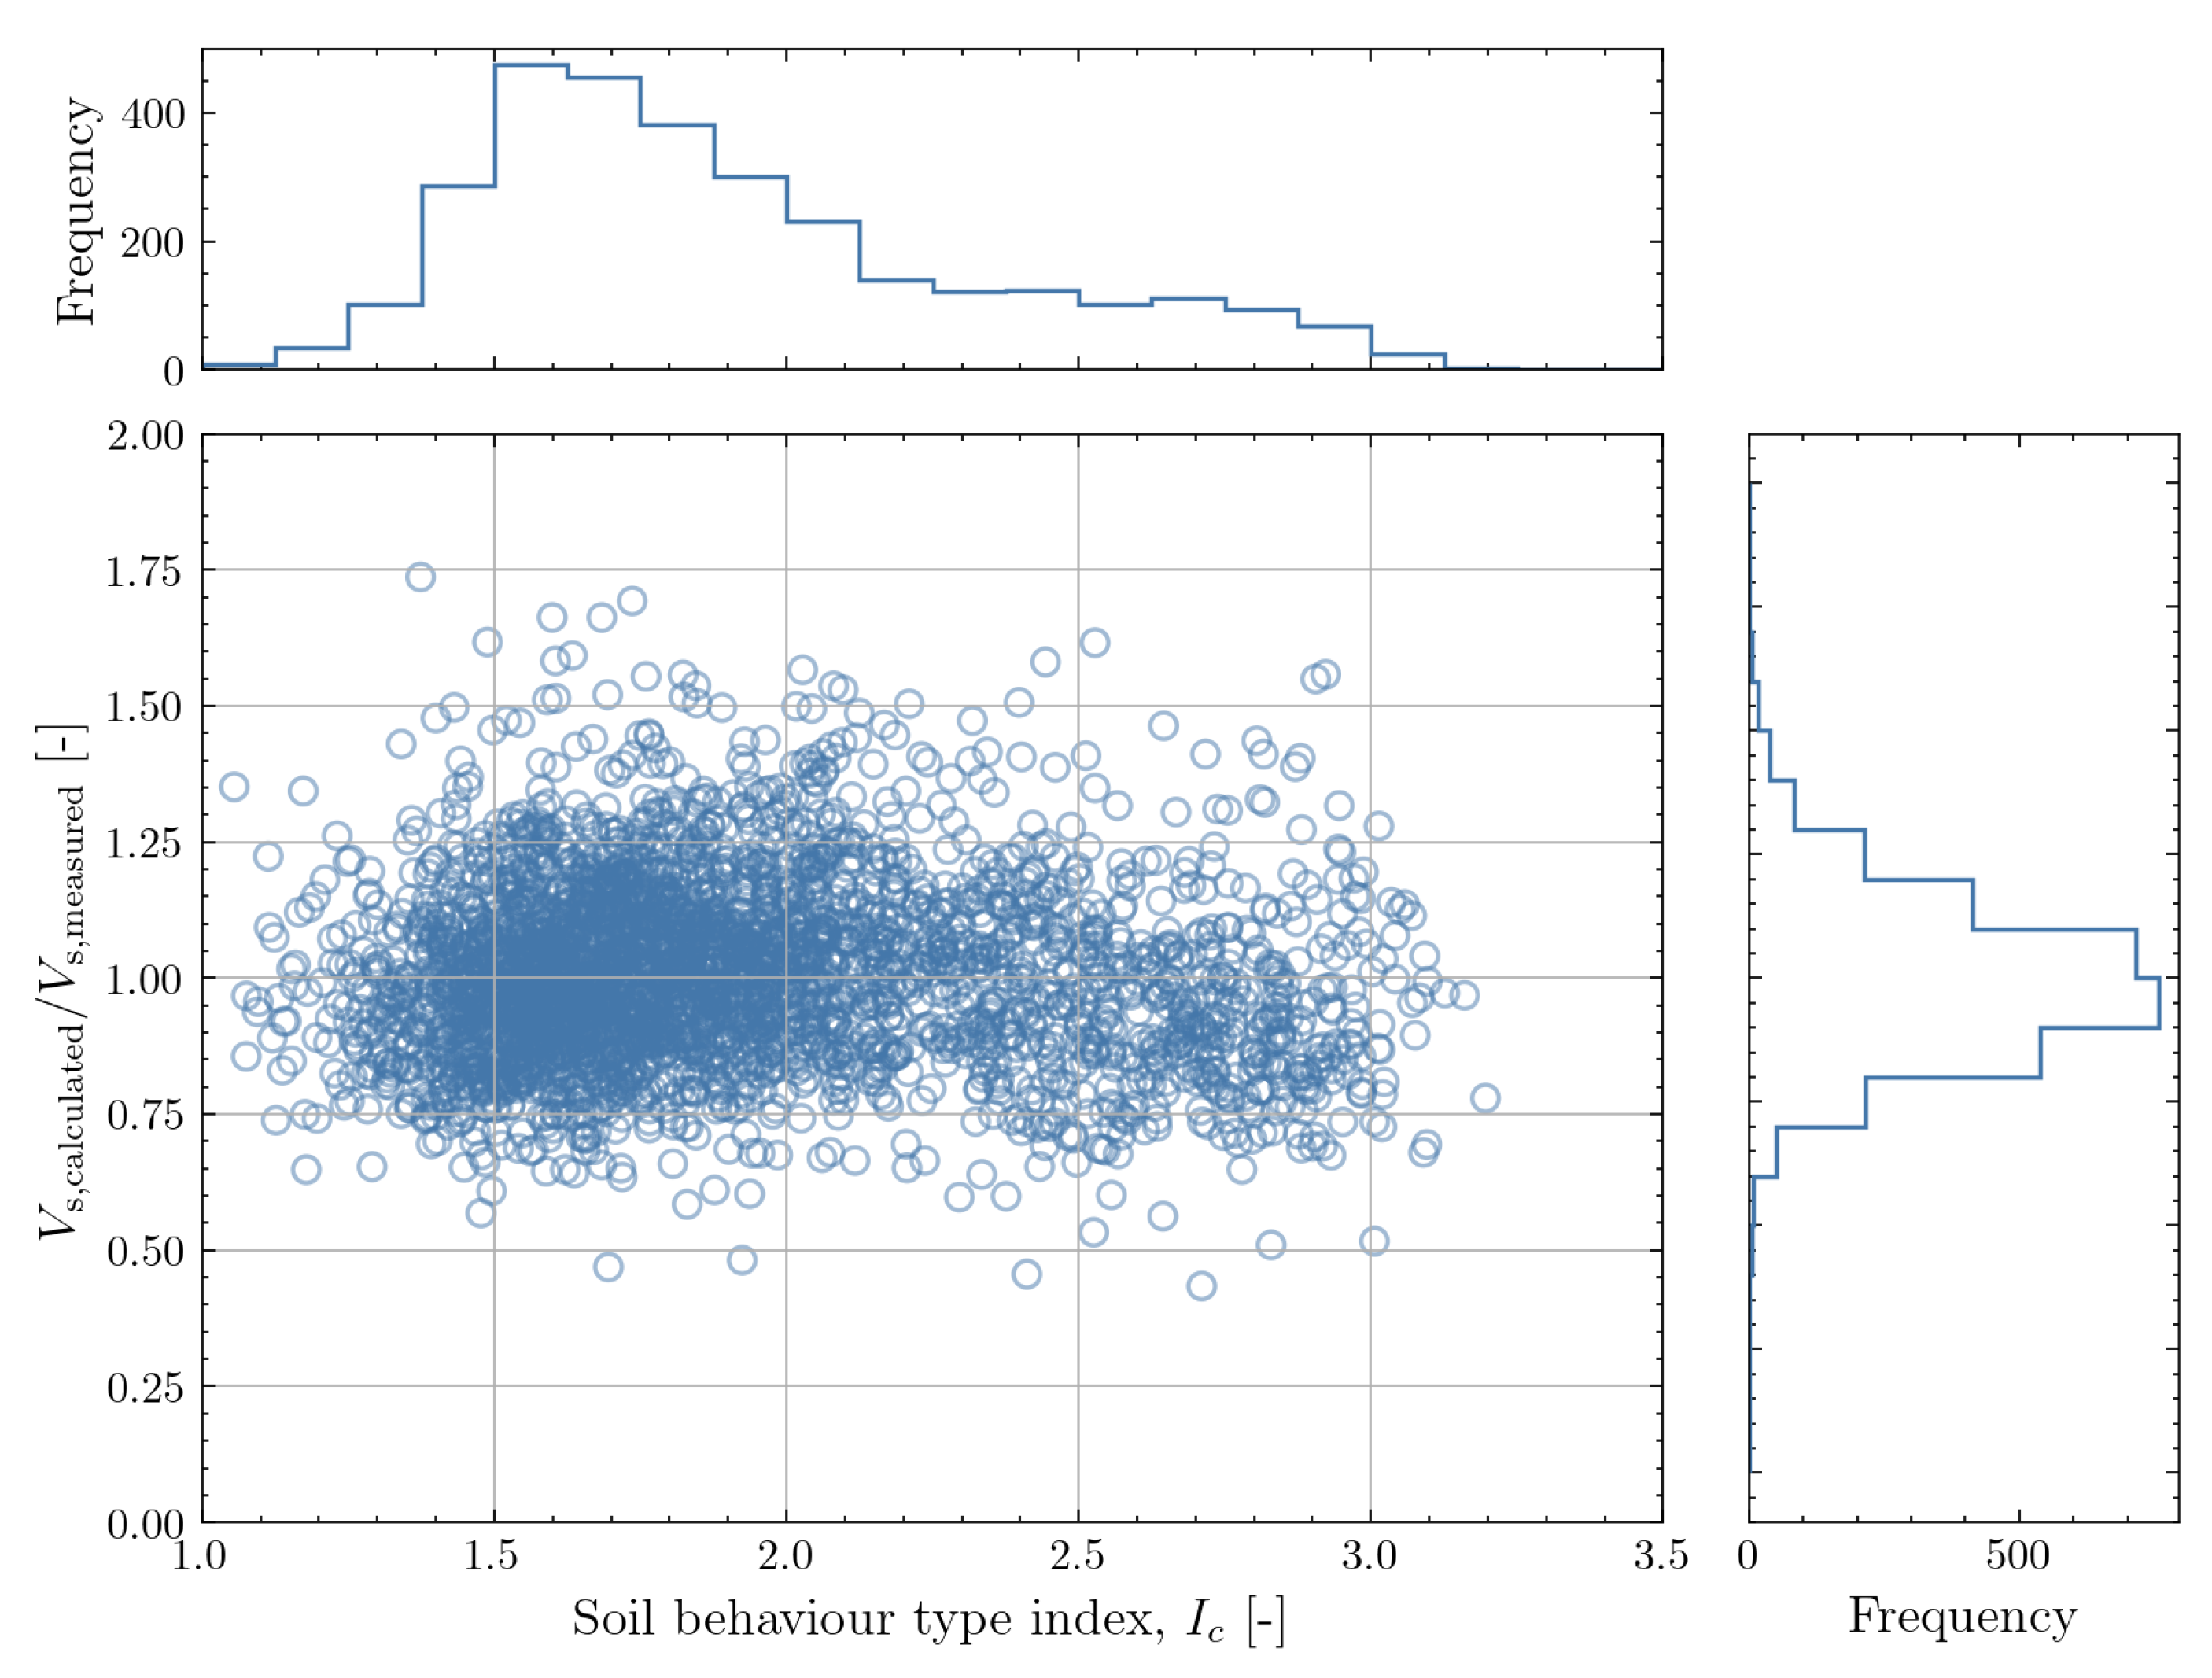
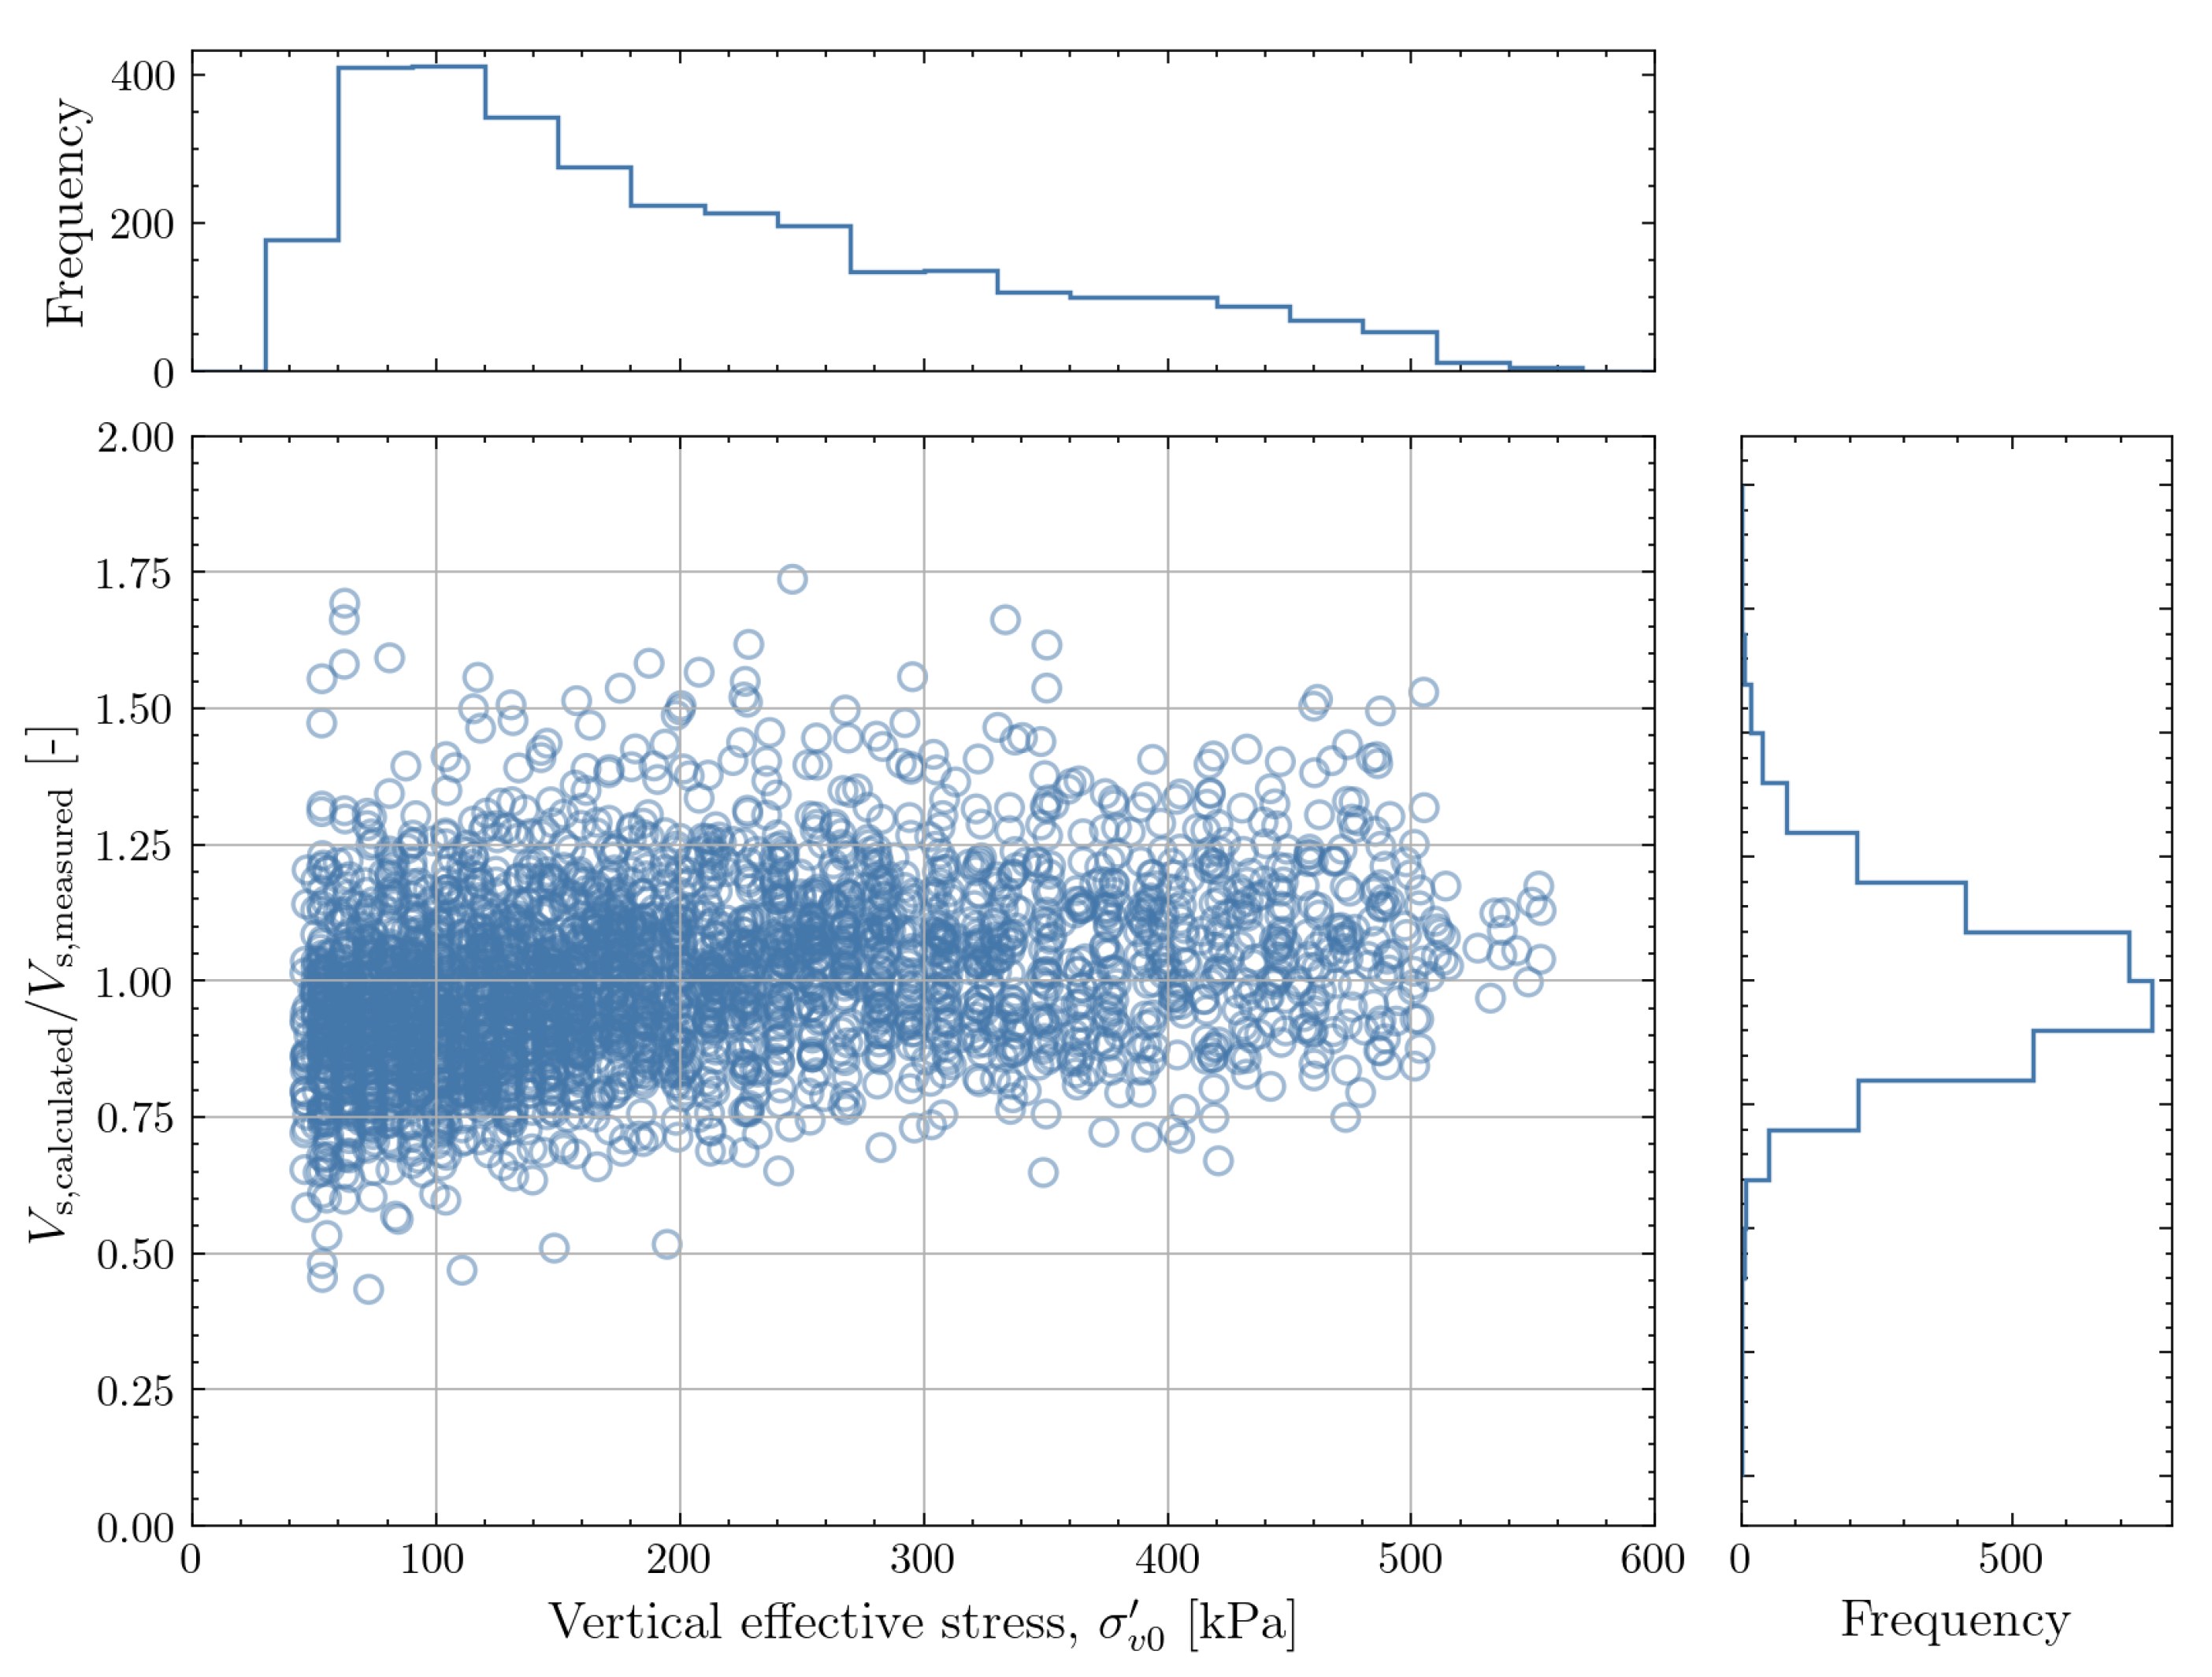
When a correlation performs well on a dataset, it should have a stationary bias and coefficient of variation, regardless of the values of the input features. For example, a correlation which performs well for very dense sand but fails to capture the behaviour in loose silty sand would not be acceptable. To ensure that the newly proposed correlation has a stationary mean and coefficient of variation over the feature space, the ratio of calculated to measured
is plotted against
,
and
in
Figure 25,
Figure 26 and
Figure 27. Marginal histograms for the distribution of the feature values and the ratio
are shown on the plot for information.
The figure shows a relatively stationary mean and COV for > 5MPa. For lower , there appears to be some tendency for underprediction of . The variation of with does not show pronounced trends across the range of soil behaviour type indices for cohesionless soil ( < 2.5). For clay ( > 2.7), there is less data but a tendency for underprediction of is observed. Finally, the variation with vertical effective stress shows that the mean and COV are stationary for > 100kPa. For lower vertical effective stresses a tendency for underprediction is again observed. Overall, the correlation is deemed fit for purpose, with slightly more caution being required for shallow soils and clays.
Based on the feature-dependence studied above, the correlation can be applied to all soil types present in the dataset but might lead to slightly conservative estimates in clay. When applying the correlation in shallows soils, the results should be interpreted with caution as there is no reliable data to support the correlation for depths shallower than 5m. Between 5m and approximately 10m below mudline (where the vertical effective stress is expected to reach 100kPa), the estimates obtained with the correlation might be slightly conservative. It should be note that all measurements in the dataset were performed on soils with silica grains. If the mineralogy at the site is substantially different (e.g. carbonate soils), the correlation might not be applicable. In such cases, direct measurements of need to be combined with site-specific CPT data to evaluate the applicability of the correlations.
6. Application to Example Locations from the Southern North Sea
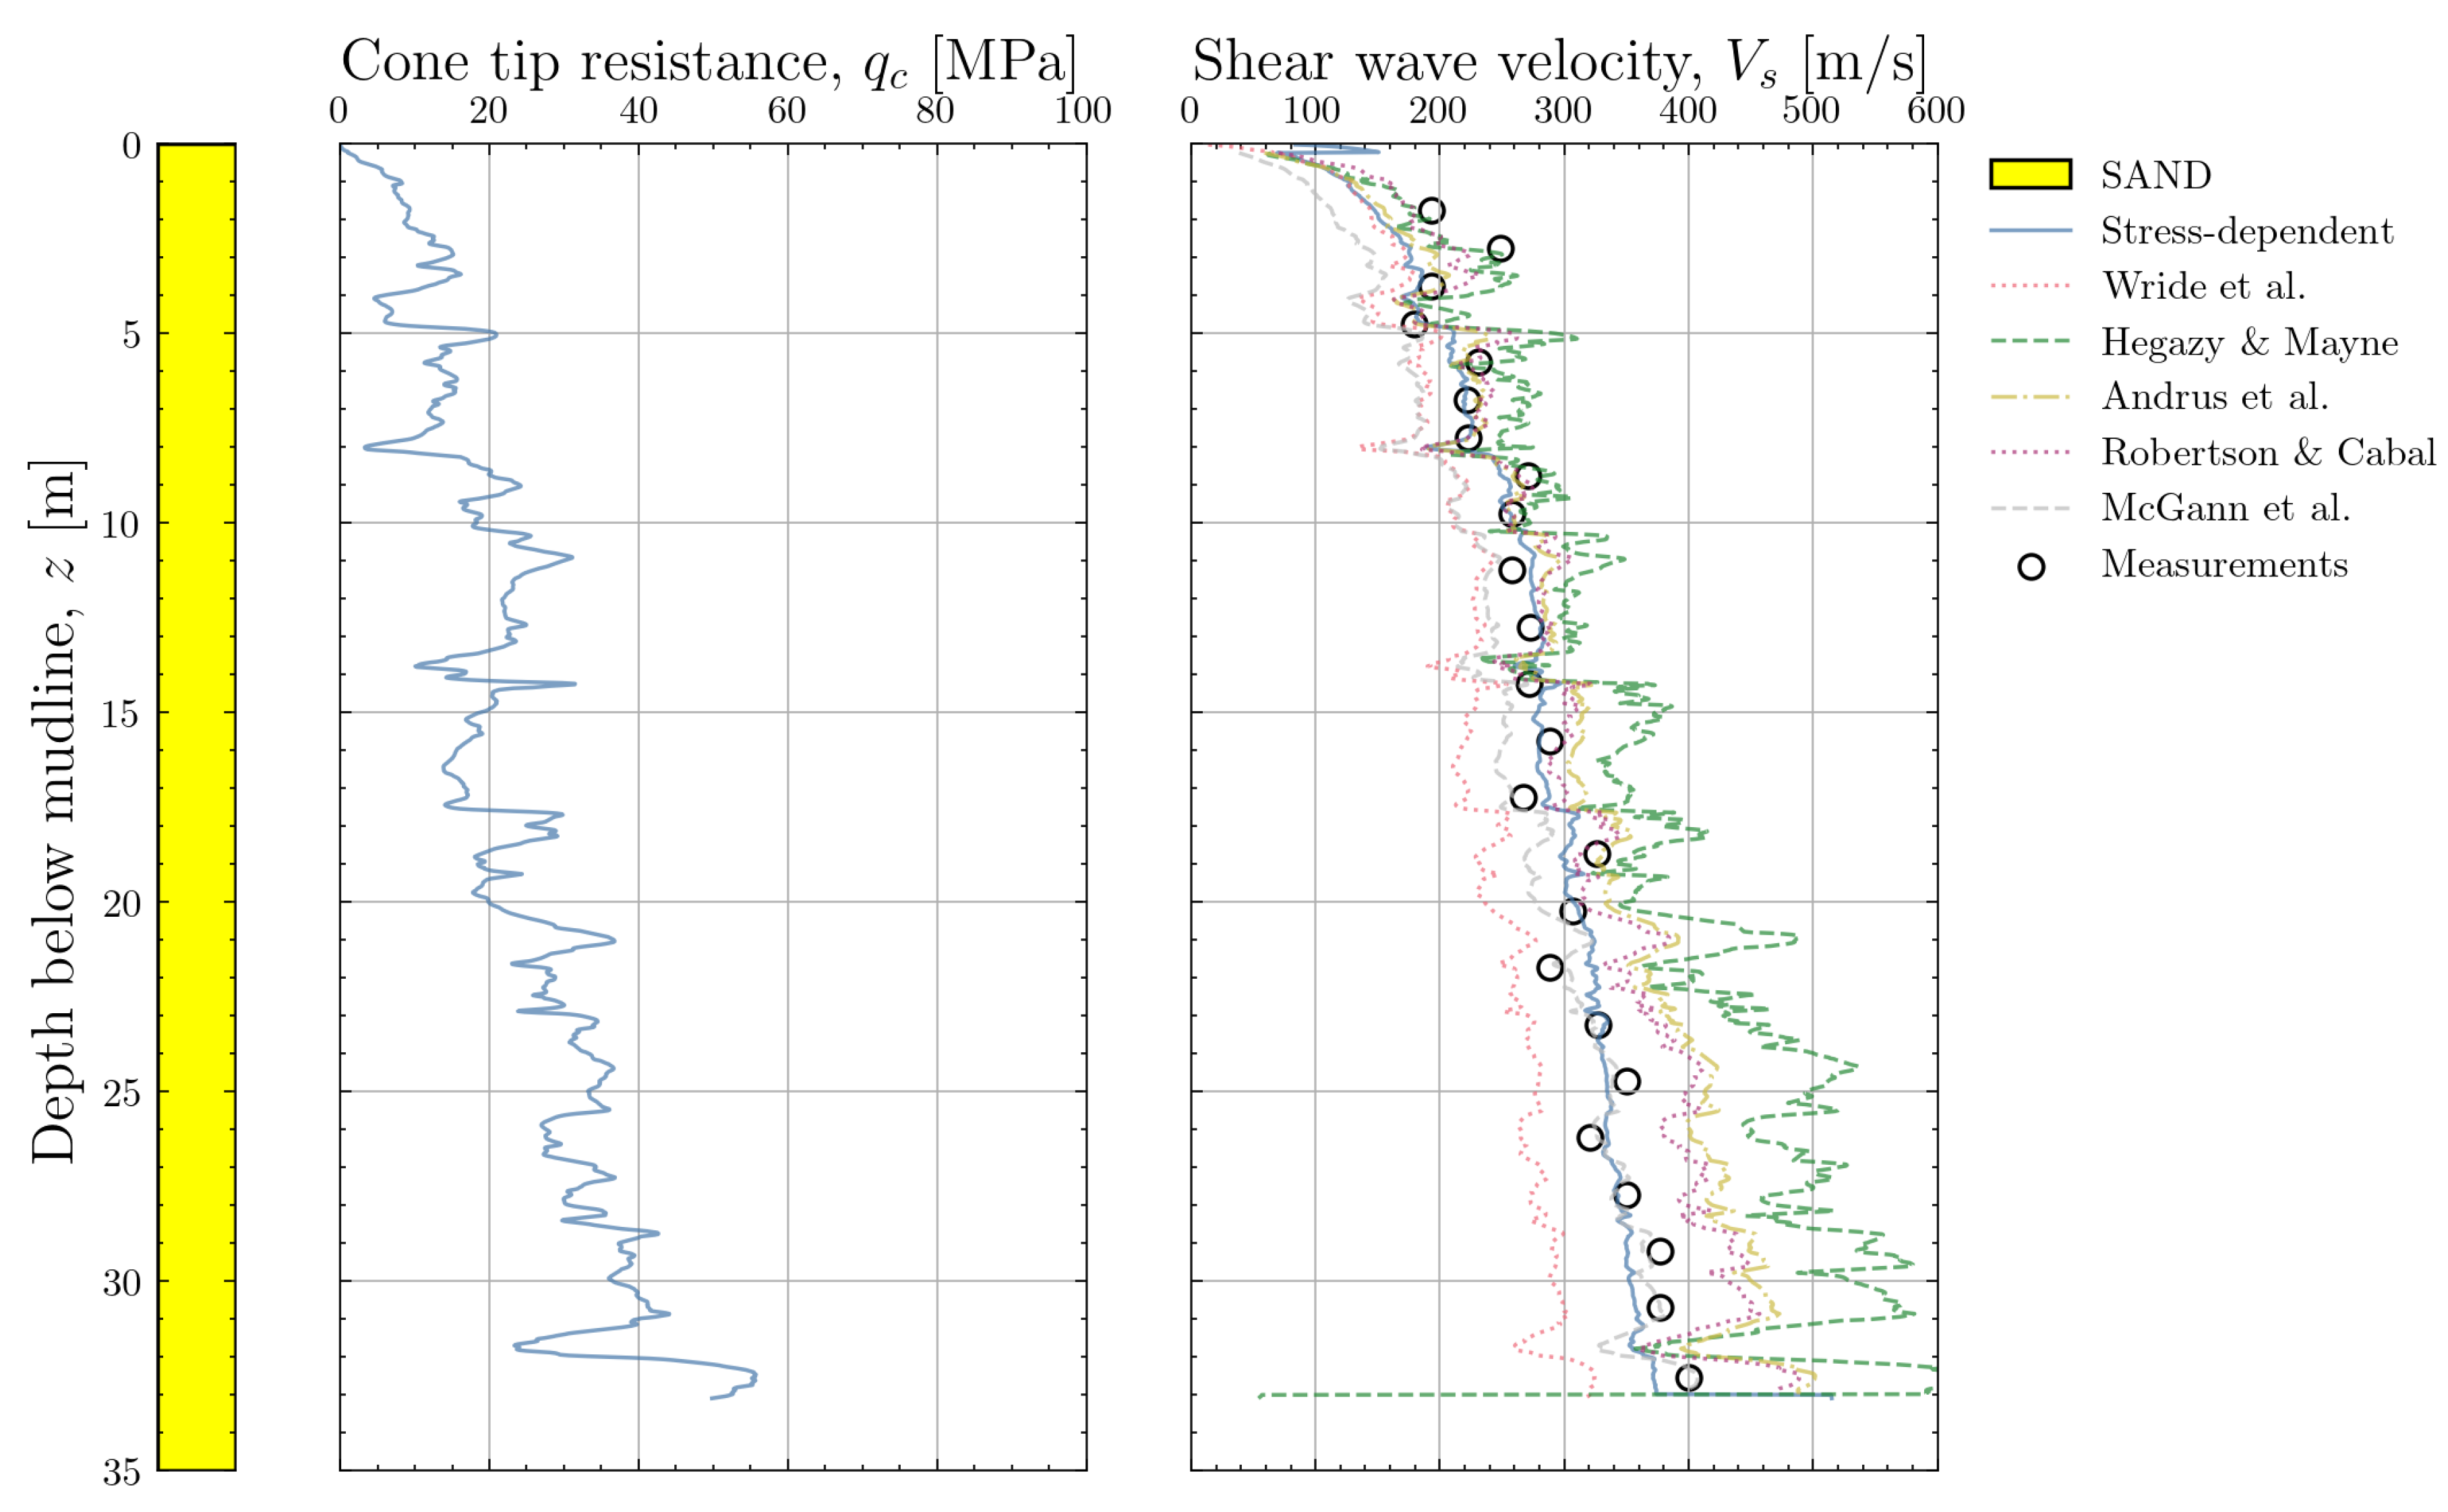
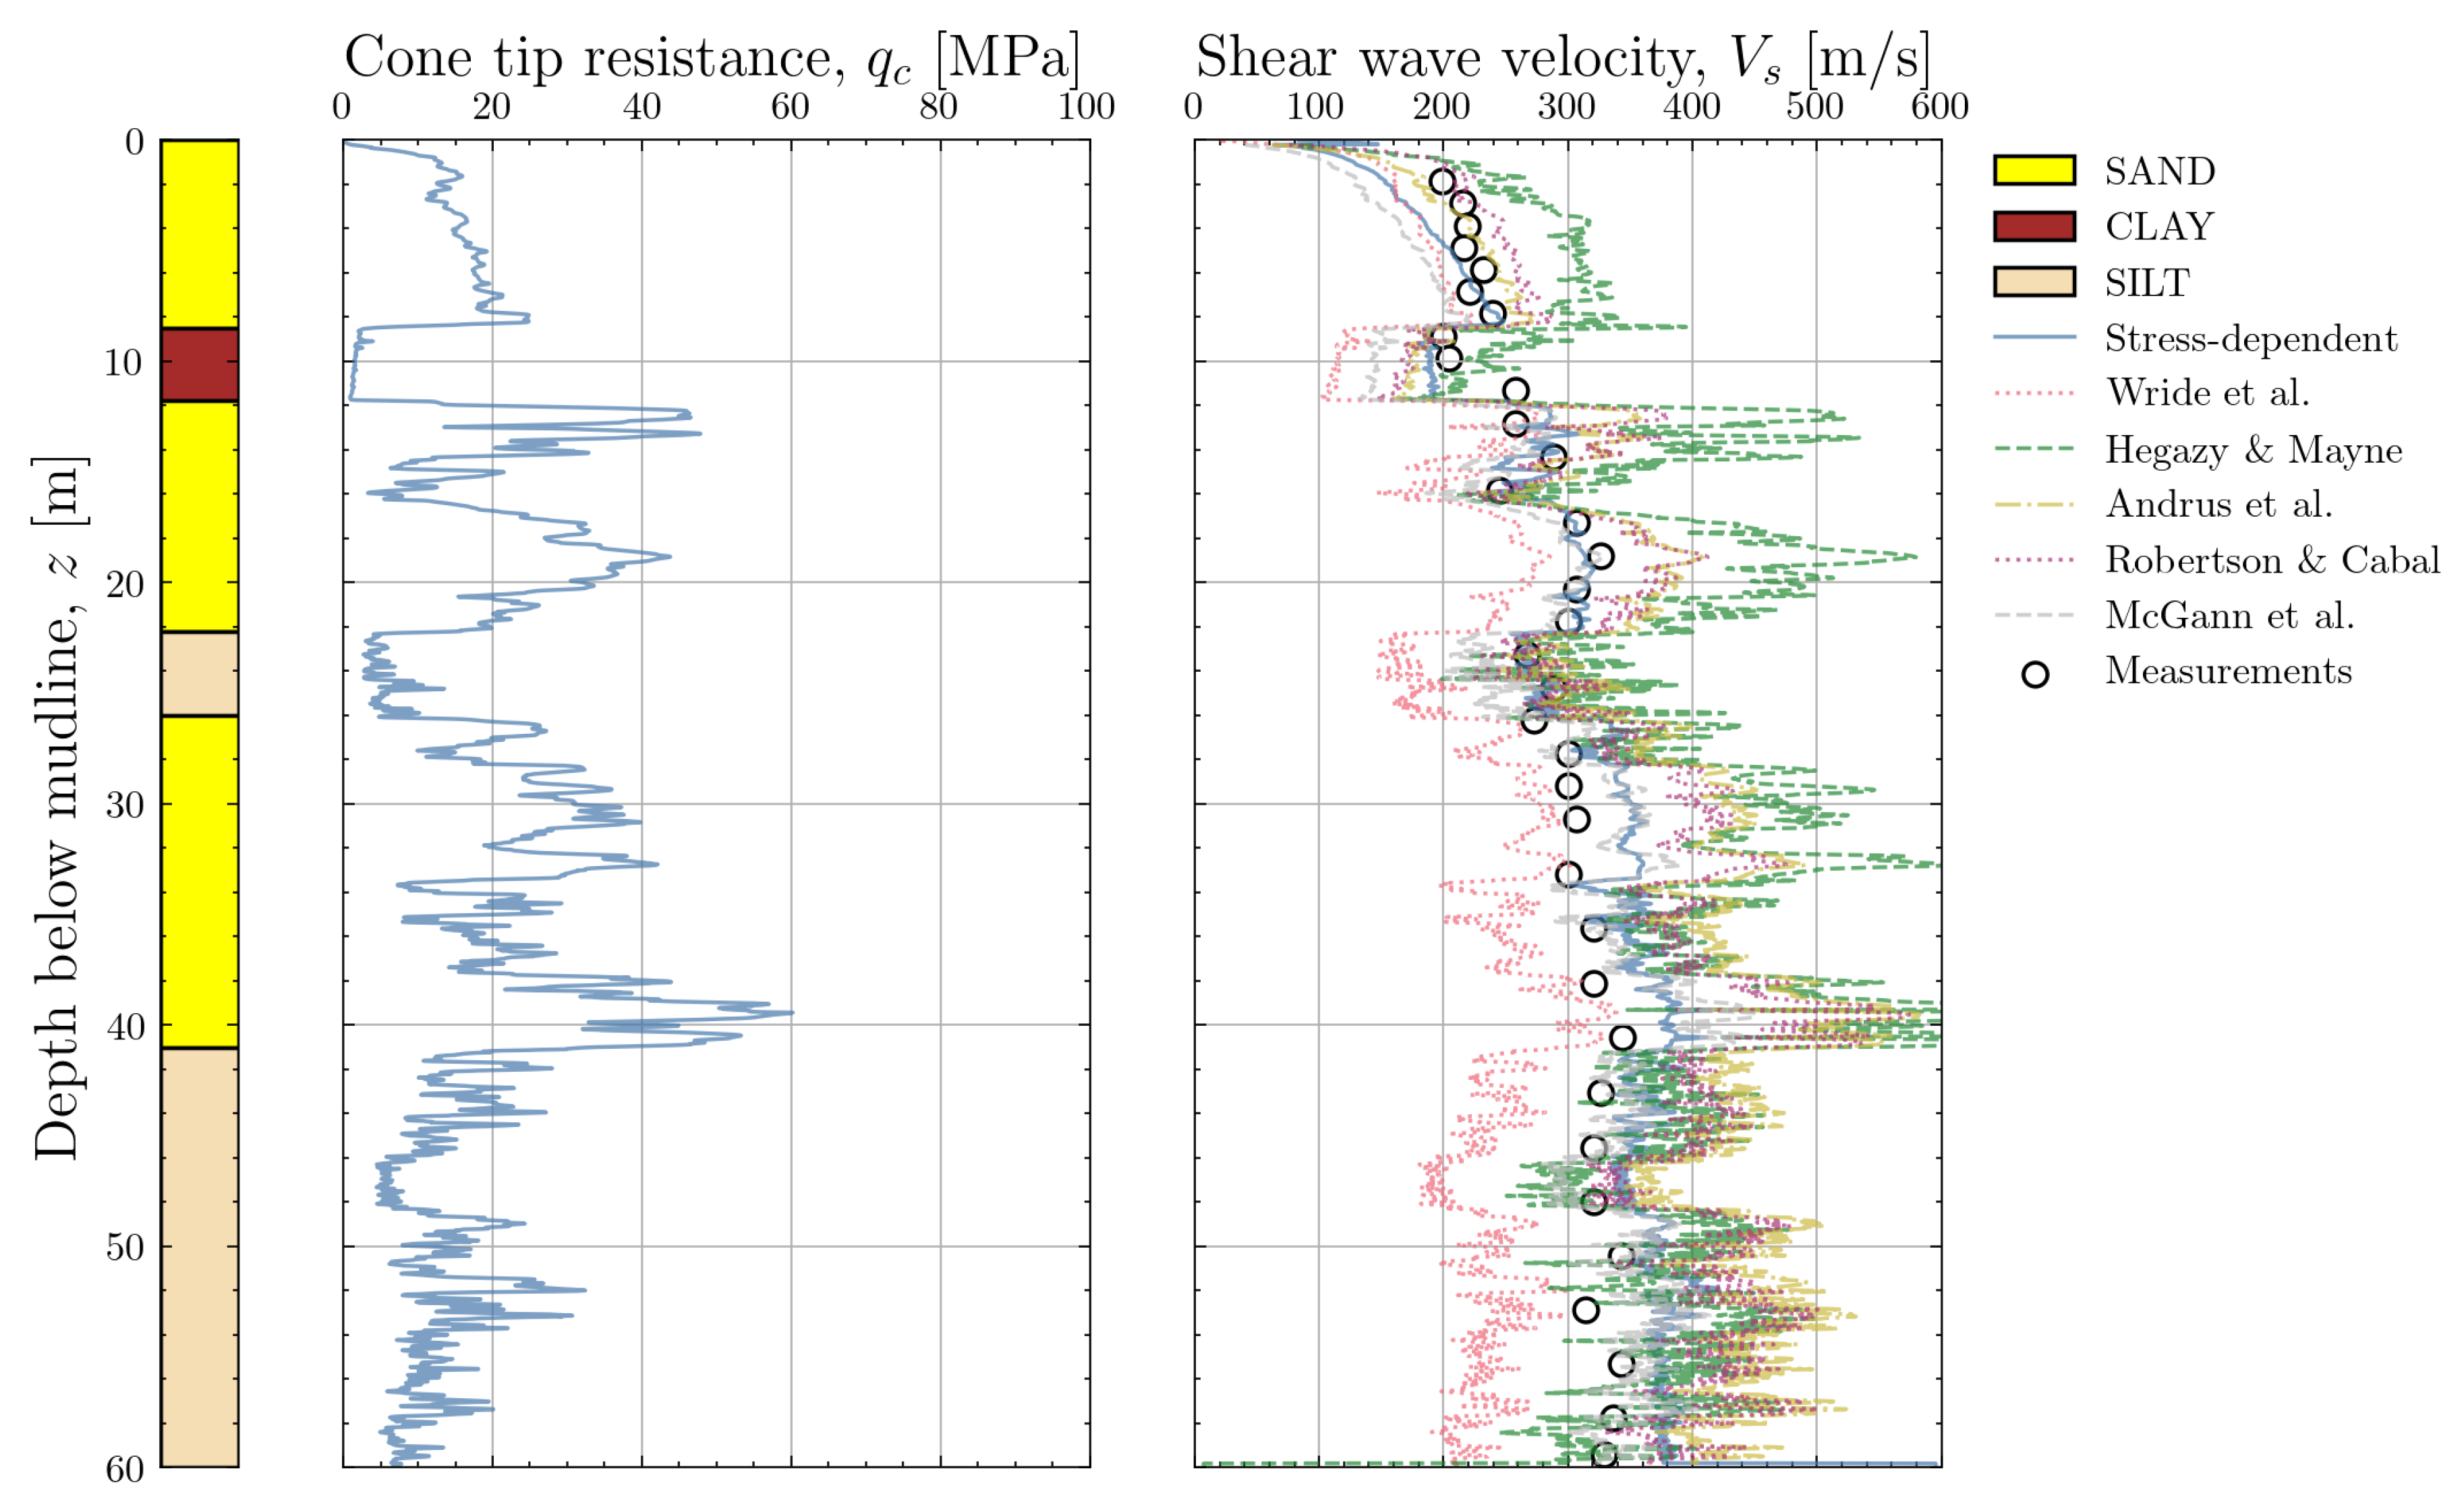
The correlations evaluated in this paper can be assessed against data gathered at two site investigation locations where both shear wave velocity measurements and conventional CPT measurements are available:
IJV162-SCPT: A test location from the Ijmuiden Ver offshore wind farm zone characterised by uniform sandy conditions;
IJV038-SCPT: A test location from the Ijmuiden Ver offshore wind farm zone characterised by a layered profile with an alternation of sand, clay and silt.
The shear wave velocity for each of the correlations can be calculated from the location-specific CPT data. The profile obtained with the new stress-dependent correlation is also calculated. These predictions can be compared against the measurements.
6.1. Sandy Location
Figure 28 show the results for the sandy location IJV162-SCPT. The cone resistance trace confirms the uniformity of the location. The direct
measurements are shown as black dots in the right-hand panel of the plot. The variations of the
predictions with the different correlations are immediately apparent. As expected, the correlation by Hegazy and Mayne [
10] leads to an overprediction of
and the correlation of Wride et al. [
11] to a pronouced underprediction. The correlations by Andrus et al. [
12], Robertson and Cabal [
14], McGann et al. [
15] and the new stress-dependent correlation show a good match with the measurents between 5m and 15m depth. For deeper depths, the correlations by Andrus et al. [
12] and Robertson and Cabal [
14] start to diverge from the measurements and show an overprediction of
. For shallow depths, all correlations underpredict the measured
but according to ISO 19901-8:2014, the data in this depth range is not reliable. The new stress-dependent correlation and the correlation by McGann et al. [
15] perform well over the entire profile. The ratio of calculated to measured
is summarised in
Table 4 where the average and coefficient of variation of this ratio are shown, both for the entire calibration dataset and the location-specific estimates at IJV162. The location-specific metrics confirm the conclusions from the dataset although the COV for IJV162 generally appears to be lower. This is because IJV162 has a uniform sandy ground profile whereas the calibration datasets contains a range of soil types.
6.2. Layered Location
Figure 29 show the results for the layered location IJV038-SCPT. The cone resistance trace and the stratigraphic log show a layer of sand down to 8.5m depth, overlying a clay layer. The clay layer is 3.3m thick and below, sand with variable relative density is observed. Between 22m and 26m depth, a layer of silty material is observed underlain by sand until 41m. For there to the bottom of the test, silty material is found. The direct
measurements are again shown as black dots in the right-hand panel of the plot. The variations of the
predictions with the different correlations are again apparent and these variations exist in all layers. For the correlations by Hegazy and Mayne [
10] and Wride et al. [
11] an over- and underprediction of
is respectively noticed. In the sandy layers, the correlations by Andrus et al. [
12] and Robertson and Cabal [
14] show an overprediction of
. This overprediction is more limited than the one for the Hegazy and Mayne [
10] correlation. In the clay and silt layer, the correlations by Andrus et al. [
12] and [
14] appear to give good predictions, but due to the lack of measurements in the clay layer, this is not conclusive. The correlation by McGann et al. [
15] again performs well in the sandy layers but in the clay and shallowest silt layer, an underprediction of
is noticed. The new stress-dependent correlation provides the most accurate prediction of
except for an overprediction of
in the sand layer between 26m and 41m depth. For shallow depths, an underprediction of
is noticed. Even though the model formulation of the new stress-dependent correlation is relatively simple, with only
and
as features, a reliable estimate of
can still be obtained for a layered profile in the North Sea. The ratio of calculated to measured
is summarised in
Table 5 where the average and coefficient of variation of this ratio are shown, both for the entire calibration dataset and the location-specific estimates at IJV038. The location-specific metrics again confirm the conclusions from the dataset and now the site-specific COV for IJV038 is closer to the global value. This can be explained because the ground profile at IJV038 now contains a range of soil types which spans the soil types present in the calibration dataset.
7. Conclusions and Recommendations
This paper presents a critical evaluation of existing CPT-based correlations for the estimation of small-strain stiffness or shear wave velocity. Defining an accurate soil stiffness profile is an essential tasks for offshore wind turbine monopile design and the natural frequencies of the wind turbine structure calculated during the design stage depend on the selected soil stiffness profile. However, by comparing the performance of existing correlations from the literature with field data gathered at North Sea site, significant differences in terms of correlation accuracy were observed which would also affect the natural frequency estimates for wind turbine structures with monopile foundations.
To ensure that small-strain shear modulus or shear wave velocity are properly estimated for Tertiary and Quaternary deposits in the Southern North Sea, a dataset was assembled with more than 3000 in-situ shear wave velocity measurements with the seismic cone. This provided the necessary basis for evaluating the performance of various CPT-based correlations from the literature. When using S-PCPT measurements for evaluating a correlation, the quality of the data processing also needs to be checked to ensure that the measurements are of sufficient quality. For this reason, only data collected from seafloor CPTs were retained in this study and near-surface data was discarded.
Out of the available literature, the correlation proposed by Robertson and Cabal [
14] showed the best match to the measured data. The correlation showed a nearly neutral bias and a relatively small coefficient of variation for the ratio of calculated to measured
when evaluated on a dataset of more than 3000 offshore S-PCPT measurements from the North Sea. The
score for the
estimates obtained with the Robertson and Cabal [
14] correlation was low (
=0.155) but it was still the highest
among all evaluated correlations. The correlations predicting
showed better performance than those which predict
directly. It is therefore recommended to use a correlation for
and then use location-specific unit weights to convert
to
.
Even though the correlation by Robertson and Cabal [
14] leads to relatively good estimates of
when compared to the dataset with direct measurements, it can be meaningful to explicitly capture the stress-dependence of
in the mathematical formulation of a CPT-based correlation for
. The theoretical framework by Cha et al. [
40] was thus modified to include the soil behaviour type index
in the
estimation model formulation to capture the effect of soil type. When calibrated to the North Sea data, this correlation showed a slightly improved bias and COV compared to the results of the correlation by Robertson and Cabal [
14]. The
score for the new correlation was equal to 0.370 which is higher than all other evaluated correlation. Because the correlation only uses four calibration coefficients, recalibrating it for new sites will be straightforward. Having an explicit stress-dependence in the model can be meaningful for geotechnical engineering calculations. For example, when the overburden stress is increased during construction of the foundation (e.g. due to placement of scour protection), a stress-dependent framework can quantify this increase. When considering farm-wide geotechnical design or back-analysis of monopile foundations, the stress-dependent model can lead to reliable estimates of the small-strain shear modulus while allowing the effects of a scour protection layer to be studied.
When applied to two example locations from a Southern North Sea site, the potential variations in
estimates when using different correlations become apparent. The correlation by Hegazy and Mayne [
10] leads to systematic overestimation of
and the correlation by Wride et al. [
11] to systematic underestimation of
. The correlation by Robertson and Cabal [
14] shows an acceptable performance although an overprediction of
in deeper sand layers is noticed. The newly developed stress-dependent model shows the most accurate predictions at the example locations which is partly explained because this model was specifically calibrated to North Sea data. The results from all correlations should be treated with caution for shallow soils. The reliability of
models in the top 5m of the soil still needs to be investigated further. The S-PCPT in this depth range was deemed unreliable and alternative means of
characterisation such as Multichannel Analysis of Surface Waves (MASW) need to be considered. However, such measurements are rarely performed offshore.
When evaluating new project sites which have a distinctive geological history, it is recommended to repeat this critical evaluation of the different CPT-based correlations using the available in-situ measurements. It should also be noted that all CPT-based correlations discussed in this paper were developed for silica soils. In geological provinces with different mineralogy (e.g. carbonate soils), the results of the correlations should be treated with caution. If necessary, project-specific data can be used to recalibrate the coefficients of the correlations from the literature or the stress-dependent correlation proposed in this paper. When is derived from CPT data at locations where S-PCPT data is not available, the additional uncertainty introduced by using a correlation instead of a direct measurement should always be recognised.
Author Contributions
Conceptualization and methodology, Stuyts, B. and Sastre Jurado, C.; data curation, formal analysis and investigation, Stuyts. B.; data curation, formal analy, Stuyts, B.; writing—original draft preparation, Stuyts, B..; writing—review and editing, Kheffache, A.; supervision, Weijtjens, W. and Devriendt, C.; funding acquisition, Devriendt, C. All authors have read and agreed to the published version of the manuscript.
Funding
The authors would like to acknowledge the support of the Belgian Ministry of Economic Affairs through the ETF project WINDSOIL project. The support of VLAIO through the De Blauwe Cluster SBO SOILTWIN project is also acknowledged.
Data Availability Statement
-
Some or all data, models, or code that support the findings of this study are publically available:
- –
Public-domain geotechnical data from the Dutch and German offshore wind farms as provided by RVO.nl and BSH
- –
Processed S-PCPT data for the Dutch and German wind farms (DOI 10.5281/zenodo.10986518)
-
Some or all data, models, or code generated or used during the study are proprietary or confidential in nature and may only be provided upon request with restrictions (e.g.~anonymized data)
- –
Geotechnical data from the Belgian and Danish offshore wind farms
References
- WindEurope. Offshore Wind in Europe: Key trends and statistics 2019. Technical report, 2020.
- Seidel, M.; Voormeeren, S.; van der Steen, J.B. State-of-the-art design processes for offshorewind turbine support structures. Published in: Stahlbau, Volume 85, Issue 9 (9/2016). Copyright © 2016 Ernst & Sohn Verlag für Architektur und technische Wissenschaften GmbH & Co. KG, Berlin, 2016; p. 14. [Google Scholar]
- Schafhirt, S.; Page, A.; Eiksund, G.R.; Muskulus, M. Influence of Soil Parameters on the Fatigue Lifetime of Offshore Wind Turbines with Monopile Support Structure 2016. p. 10.
- Simoncelli, M.; Zucca, M.; Ghilardi, M. Structural health monitoring of an onshore steel wind turbine. Journal of Civil Structural Health Monitoring, 2024; 1–15. [Google Scholar] [CrossRef]
- Devriendt, C.; Weijtjens, W.; El-Kafafy, M.; De Sitter, G. Monitoring resonant frequencies and damping values of an offshore wind turbine in parked conditions. IET Renewable Power Generation 2014, 8, 433–441. [Google Scholar] [CrossRef]
- Kallehave, D.; LeBlanc, C.; Liingaard, M. Modification of the API P-Y formulation of initial stiffness of sand. Integrated Geotechnologies - Present and Future;, 2012; pp. 465–472.
- Byrne, B.; McAdam, R.A.; Burd, H.; Houlsby, G.; Martin, C.M.; Beuckelaers, W.; Zdravkovic, L.; Taborda, D.; Potts, D.; Jardine, R. ; others. PISA: new design methods for offshore wind turbine monopiles. Offshore Site Investigation Geotechnics 8th International Conference Proceeding. Society for Underwater Technology, 2017, Vol. 142, pp. 142–161.
- Rix, G.J.; Stokoe, K.H. Correlation of initial tangent modulus and cone penetration resistance. Calibration chamber testing. New York: Elsevier, 1991, pp. 351–362.
- Mayne, P.; Rix, G. Gmax-qc relationships for clays. Geotechnical Testing Journal GTJODJ 1993, 16 Nr 1, 54–60. [Google Scholar] [CrossRef]
- Hegazy, Y.A.; Mayne, P.W. A global statistical correlation between shear wave velocity and cone penetration data. In Site and geomaterial characterization; 2006; pp. 243–248.
- Wride, C.; Robertson, P.; Biggar, K.; Campanella, R.; Hofmann, B.; Hughes, J.M.; Küpper, A.; Woeller, D. Interpretation of in situ test results from the CANLEX sites. Canadian Geotechnical Journal 2000, 37, 505–529. [Google Scholar] [CrossRef]
- Andrus, R.D.; Mohanan, N.P.; Piratheepan, P.; Ellis, B.S.; Holzer, T.L. Predicting shear-wave velocity from cone penetration resistance. Proceedings of the 4th international conference on earthquake geotechnical engineering, Thessaloniki, Greece, 2007, Vol. 2528.
- Tonni, L.; Simonini, P. Shear wave velocity as function of cone penetration test measurements in sand and silt mixtures. Engineering geology 2013, 163, 55–67. [Google Scholar] [CrossRef]
- Robertson, P.; Cabal, K.L. Guide to Cone Penetration Testing. Technical report, 2015.
- McGann, C.R.; Bradley, B.A.; Jeong, S. Empirical correlation for estimating shear-wave velocity from cone penetration test data for banks Peninsula loess soils in Canterbury, New Zealand. Journal of Geotechnical and Geoenvironmental Engineering 2018, 144, 04018054. [Google Scholar] [CrossRef]
- Peuchen, J.; Kaltekis, K.; Klein, M.; Murali, M.; Erp, F.; Hicks, M. Characteristic Values for Geotechnical Design of Offshore Monopiles in Sandy Soils - Case Study. 2020.
- Phoon, K.K.; Tang, C. Characterisation of geotechnical model uncertainty. Georisk: Assessment and Management of Risk for Engineered Systems and Geohazards 2019, 13, 101–130. [Google Scholar] [CrossRef]
- Cameron.; Doorn, D.; Laban, C.; Streif, H. Cameron.; Doorn, D.; Laban, C.; Streif, H. Geology of the Southern North Sea Basin. Proceedings Coastlines of the Southern North Sea. The Eight Symposium on Coastal and Ocean Management, 1993; 15–28. [Google Scholar]
- Ottesen, D.; Batchelor, C.; Dowdeswell, J.; Løseth, H. Morphology and pattern of Quaternary sedimentation in the North Sea Basin (52–62 N). Marine and Petroleum Geology 2018, 98, 836–859. [Google Scholar] [CrossRef]
- Fookes, P.G.; Parrish, D.G. Observations on small-scale structural discontinuities in the London Clay and their relationship to regional geology. Quarterly Journal of Engineering Geology and Hydrogeology 1969, 1, 217–240. [Google Scholar] [CrossRef]
- Verschuren, M. An integrated 3D approach to clay tectonic deformation and the development of a new 3D surface modeling method. PhD thesis, Ghent University, 1992.
- Gibbard, P.L.; Lewin, J. Filling the North Sea Basin: Cenozoic sediment sources and river styles (André Dumont medallist lecture 2014). Geologica Belgica 2016. [Google Scholar] [CrossRef]
- Fugro. IJmuiden Ver Wind Farm Zone – Sites I-IV - Integrated Ground Model. RVO Report IJV_20230127_RVO_IGM_FUG 04, 2023.
- Netherlands Enterprise Agency (RVO). Development of Offshore Wind Farms in the Netherlands, 2021.
- Bundesamt Für Seeschiffart und Hydrographie. Data Hub Preliminary Investigation of Sites, 2023.
- SolidGround. Energinet Energy Island North Sea - Seismic geotechnical interpretation of seismic dual setup. Technical report, 2023.
- Masters, T.A.; Juszkiewicz, P.; Mandolini, A.; Christian, H. A Critical Appraisal of the Benefits of and Obstacles to Gaining Quality Data with Offshore Seismic CPT and PS Logging. Offshore Technology Conference. OnePetro, 2019.
- Masters, T.; Czech, T.; Sullivan, C.; Cambeilh, C.; Verbeek, G. A critical appraisal of methods for and obstacles to obtaining, processing and interpreting useful data from offshore seismic cone penetration testing. Proceedings of the 9th Int. Conf. on Offshore Site Investigation and Geotechnics;, 2023.
- Fitzpatrick, E.; Masters, T.; Soage Santos, R. Synthesis of a robust yet easy to implement method for site specific correlation between offshore Piezocone Penetration Test data and shear wave velocity. Proceedings of the 9th Int. Conf. on Offshore Site Investigation and Geotechnics;, 2023.
- Teng, Y.; Meyer, V.; Klinkvort, R.; Lunne, T.; Caferri, L.; Rose, M. Calibrating site-specific Vs correlations in clay and sand for two offshore wind farms. Proceedings of the 9th Int. Conf. on Offshore Site Investigation and Geotechnics;, 2023.
- Hintze, J.L.; Nelson, R.D. Violin plots: a box plot-density trace synergism. The American Statistician 1998, 52, 181–184. [Google Scholar] [CrossRef]
- Stuyts, B. ; RVO.; BSH. Shear wave velocities and associated CPT data for S-PCPT testing in the North Sea, 2024. [CrossRef]
- Hardin, B.O.; Black, W.L. Vibration modulus of normally consolidated clay. Journal of the Soil Mechanics and Foundations Division 1968, 94, 353–369. [Google Scholar] [CrossRef]
- Mayne, P.; Peuchen, J.; Bouwmeester, D. Soil unit weight estimation from CPTs. 2nd International Symposium on Cone Penetration Testing, 2010.
- Burd, H.J.; Taborda, D.M.; Zdravković, L.; Abadie, C.N.; Byrne, B.W.; Houlsby, G.T.; Gavin, K.G.; Igoe, D.J.; Jardine, R.J.; Martin, C.M.; others. PISA design model for monopiles for offshore wind turbines: application to a marine sand. Géotechnique 2020, 70, 1048–1066. [Google Scholar] [CrossRef]
- Stuyts, B.; Sastre Jurado, C.; Kheffache, A.; Gomez Bautista, D. Bayesian estimation of small-strain shear modulus from offshore CPT tests in the North Sea. Submitted to CPT22 Bologna, 2022.
- Karray, M.; Lefebvre, G.; Ethier, Y.; Bigras, A. Influence of particle size on the correlation between shear wave velocity and cone tip resistance. Canadian Geotechnical Journal 2011, 48, 599–615. [Google Scholar] [CrossRef]
- Hegazy, Y.; Mayne, P. Statistical correlations between VS and cone penetration data for different soil types. Proceedings of the international symposium on cone penetration testing, CPT, 1995, Vol. 95, pp. 173–178.
- Simonini, P.; Ricceri, G.; Cola, S. Geotechnical characterization and properties of Venice lagoon heterogeneous silts. Characterisation and engineering properties of natural soils 2007, 4, 2289–2327. [Google Scholar]
- Cha, M.; Santamarina, J.C.; Kim, H.S.; Cho, G.C.; others. Small-strain stiffness, shear-wave velocity, and soil compressibility. J. Geotech. Geoenviron. Eng 2014, 140, 06014011. [Google Scholar] [CrossRef]
- Lyu, C.; Park, J.; Carlos Santamarina, J. Depth-dependent seabed properties: Geoacoustic assessment. Journal of Geotechnical and Geoenvironmental Engineering 2021, 147, 04020151. [Google Scholar] [CrossRef]
Figure 4.
Schematic depositional history for the IJmuiden Ver offshore wind farm zone from the mid-Pleistocene to the mid-Eemian [
23].
Figure 4.
Schematic depositional history for the IJmuiden Ver offshore wind farm zone from the mid-Pleistocene to the mid-Eemian [
23].
Figure 5.
Schematic depositional history for the IJmuiden Ver offshore wind farm zone from the mid-Eemian to present day [
23].
Figure 5.
Schematic depositional history for the IJmuiden Ver offshore wind farm zone from the mid-Eemian to present day [
23].
Figure 6.
Geographical location of the S-PCPT tests in the Belgian, Dutch, German and Danish sectors of the North Sea.
Figure 6.
Geographical location of the S-PCPT tests in the Belgian, Dutch, German and Danish sectors of the North Sea.
Figure 7.
Effect of the CPT testing method on the relation between vertical effective stress and shear wave velocity.
Figure 7.
Effect of the CPT testing method on the relation between vertical effective stress and shear wave velocity.
Figure 8.
Combined box and violin plots of the shear wave velocity dataset.
Figure 8.
Combined box and violin plots of the shear wave velocity dataset.
Figure 9.
Relation between vertical effective stress, total cone resistance, soil behaviour type index and shear wave velocity.
Figure 9.
Relation between vertical effective stress, total cone resistance, soil behaviour type index and shear wave velocity.
Figure 10.
Comparison of calculated and measured
using the correlation by [
33]. The measurements are color-coded according to soil behaviour type index
.
Figure 10.
Comparison of calculated and measured
using the correlation by [
33]. The measurements are color-coded according to soil behaviour type index
.
Figure 11.
Comparison of calculated and measured
using the correlation by Rix and Stokoe [
8]. The measurements are color-coded according to soil behaviour type index
.
Figure 11.
Comparison of calculated and measured
using the correlation by Rix and Stokoe [
8]. The measurements are color-coded according to soil behaviour type index
.
Figure 12.
Comparison of calculated and measured
using the correlation by Mayne and Rix [
9]. The measurements are color-coded according to soil behaviour type index
.
Figure 12.
Comparison of calculated and measured
using the correlation by Mayne and Rix [
9]. The measurements are color-coded according to soil behaviour type index
.
Figure 13.
Comparison of calculated and measured
using the correlation by Peuchen et al. [
16]. The measurements are color-coded according to soil behaviour type index
.
Figure 13.
Comparison of calculated and measured
using the correlation by Peuchen et al. [
16]. The measurements are color-coded according to soil behaviour type index
.
Figure 14.
Comparison of calculated and measured
using the correlation by Wride et al. [
11]. The measurements are color-coded according to soil behaviour type index
.
Figure 14.
Comparison of calculated and measured
using the correlation by Wride et al. [
11]. The measurements are color-coded according to soil behaviour type index
.
Figure 15.
Verification of the linear trend between and identified by Hegazy & Mayne for the North Sea data
Figure 15.
Verification of the linear trend between and identified by Hegazy & Mayne for the North Sea data
Figure 16.
Comparison of calculated and measured
using the correlation by Hegazy and Mayne [
10]. The measurements are color-coded according to soil behaviour type index
.
Figure 16.
Comparison of calculated and measured
using the correlation by Hegazy and Mayne [
10]. The measurements are color-coded according to soil behaviour type index
.
Figure 17.
Comparison of calculated and measured
using the correlation by Andrus et al. [
12]. The measurements are color-coded according to soil behaviour type index
.
Figure 17.
Comparison of calculated and measured
using the correlation by Andrus et al. [
12]. The measurements are color-coded according to soil behaviour type index
.
Figure 18.
Comparison of calculated and measured
using the correlation by Tonni and Simonini [
13]. The measurements are color-coded according to soil behaviour type index
.
Figure 18.
Comparison of calculated and measured
using the correlation by Tonni and Simonini [
13]. The measurements are color-coded according to soil behaviour type index
.
Figure 19.
Predicted variation of
with depth for the 6 reference sediments provided by Lyu et al. [
41].
Figure 19.
Predicted variation of
with depth for the 6 reference sediments provided by Lyu et al. [
41].
Figure 20.
Comparison of calculated and measured
using the correlation by Robertson and Cabal [
14]. The measurements are color-coded according to soil behaviour type index
.
Figure 20.
Comparison of calculated and measured
using the correlation by Robertson and Cabal [
14]. The measurements are color-coded according to soil behaviour type index
.
Figure 21.
Comparison of calculated and measured
using the correlation by McGann et al. [
15]. The measurements are color-coded according to soil behaviour type index
.
Figure 21.
Comparison of calculated and measured
using the correlation by McGann et al. [
15]. The measurements are color-coded according to soil behaviour type index
.
Figure 22.
Combined box and violin plots of the ratio
Figure 22.
Combined box and violin plots of the ratio
Figure 23.
Combined box and violin plots of the ratio
Figure 23.
Combined box and violin plots of the ratio
Figure 24.
Comparison of calculated and measured using the new stress-dependent correlation. The measurements are color-coded according to the soil behaviour type index
Figure 24.
Comparison of calculated and measured using the new stress-dependent correlation. The measurements are color-coded according to the soil behaviour type index
Figure 25.
Dependence of the ratio of calculated to measured on the values of . A marginal histogram for is shown in the uppermost panel and a marginal histogram for the ratio of calculated to measured is shown in the rightmost panel
Figure 25.
Dependence of the ratio of calculated to measured on the values of . A marginal histogram for is shown in the uppermost panel and a marginal histogram for the ratio of calculated to measured is shown in the rightmost panel
Figure 26.
Dependence of the ratio of calculated to measured on the values of . A marginal histogram for is shown in the uppermost panel and a marginal histogram for the ratio of calculated to measured is shown in the rightmost panel
Figure 26.
Dependence of the ratio of calculated to measured on the values of . A marginal histogram for is shown in the uppermost panel and a marginal histogram for the ratio of calculated to measured is shown in the rightmost panel
Figure 27.
Dependence of the ratio of calculated to measured on the values of . A marginal histogram for is shown in the uppermost panel and a marginal histogram for the ratio of calculated to measured is shown in the rightmost panel
Figure 27.
Dependence of the ratio of calculated to measured on the values of . A marginal histogram for is shown in the uppermost panel and a marginal histogram for the ratio of calculated to measured is shown in the rightmost panel
Figure 28.
Comparison of profiles obtained with different correlations with direct measurements for location IJV162-SCPT with uniform sandy soil.
Figure 28.
Comparison of profiles obtained with different correlations with direct measurements for location IJV162-SCPT with uniform sandy soil.
Figure 29.
Comparison of profiles obtained with different correlations with direct measurements for location IJV038-SCPT with layered soil.
Figure 29.
Comparison of profiles obtained with different correlations with direct measurements for location IJV038-SCPT with layered soil.
Table 1.
S-PCPT data sources
Table 1.
S-PCPT data sources
| |
|
|
Robertson soil type class |
Project
site
|
# locations |
# measurements |
3 |
4 |
5 |
6 |
7 |
| Belgian Zone |
7 |
85 |
22 |
36 |
13 |
6 |
8 |
| Borssele |
8 |
79 |
3 |
14 |
13 |
35 |
14 |
| Hollandse Kust Noord |
38 |
570 |
1 |
16 |
81 |
437 |
35 |
| Hollandse Kust West |
30 |
1229 |
15 |
60 |
260 |
887 |
7 |
| Hollandse Kust Zuid |
17 |
219 |
12 |
32 |
48 |
118 |
9 |
Ten Noorden
van Wadden-eilanden |
15 |
282 |
7 |
41 |
35 |
186 |
13 |
| Ijmuiden Ver |
66 |
1250 |
13 |
97 |
171 |
939 |
30 |
| German Zone |
14 |
238 |
2 |
18 |
36 |
142 |
40 |
| Danish Zone |
12 |
193 |
6 |
30 |
52 |
94 |
11 |
Table 2.
Overview of the correlations selected for the review with their input geotechnical parameters and the predicted parameter.
Table 2.
Overview of the correlations selected for the review with their input geotechnical parameters and the predicted parameter.
| Correlation |
Predicted property |
Input geotechnical parameters |
| Hardin & Black (1968) |
|
,
|
| Rix & Stokoe (1991) |
|
,
|
| Mayne & Rix (1993) |
|
|
| Peuchen et al (2020) |
|
, ,
|
| Wride et al (2000) |
|
,
|
| Hegazy & Mayne (2006) |
|
, ,
|
| Andrus et al (2007) |
|
, z, , geological age |
| Tonni & Simonini (2013) |
|
, , ,
|
| Cha et al (2013) |
|
, ,
|
| Robertson & Cabal (2015) |
|
, ,
|
| McGann et al (2018) |
|
, , z
|
Table 3.
Summary of accuracy of selected CPT-based correlations for and on the North Sea dataset in terms of the mean () and coefficient of variation (CoV) of the ratio of calculated to measured or . The score is also shown for each correlation.
Table 3.
Summary of accuracy of selected CPT-based correlations for and on the North Sea dataset in terms of the mean () and coefficient of variation (CoV) of the ratio of calculated to measured or . The score is also shown for each correlation.
| Correlation |
Predicted property |
N |
|
COV |
|
| Hardin & Black (1968) |
|
3058 |
1.570 |
0.652 |
-2.414 |
| Rix & Stokoe (1991) |
|
2656 |
0.809 |
0.713 |
-0.006 |
| Mayne & Rix (1993) |
|
237 |
1.213 |
0.742 |
-4.441 |
| Peuchen et al (2020) |
|
3058 |
0.846 |
0.733 |
-0.017 |
| Wride et al (2000) |
|
3058 |
0.782 |
0.214 |
-0.984 |
| Hegazy & Mayne (2006) |
|
3058 |
1.131 |
0.260 |
-0.949 |
| Andrus et al (2007) |
|
3058 |
1.095 |
0.207 |
-0.065 |
| Tonni & Simonini (2013) |
|
863 |
2.320 |
0.550 |
-76.080 |
| Robertson & Cabal (2015) |
|
3058 |
1.056 |
0.206 |
0.155 |
| McGann et al (2018) |
|
3058 |
0.901 |
0.207 |
0.036 |
Table 4.
Global and location-specific accuracy (at IJV162) of selected CPT-based correlations for in terms of the mean () and coefficient of variation (CoV) of the ratio of calculated to measured .
Table 4.
Global and location-specific accuracy (at IJV162) of selected CPT-based correlations for in terms of the mean () and coefficient of variation (CoV) of the ratio of calculated to measured .
| Correlation |
|
|
|
|
| Wride et al (2000) |
0.782 |
0.811 |
0.214 |
0.073 |
| Hegazy & Mayne (2006) |
1.131 |
1.232 |
0.260 |
0.154 |
| Andrus et al (2007) |
1.095 |
1.085 |
0.207 |
0.127 |
| Robertson & Cabal (2015) |
1.056 |
1.075 |
0.206 |
0.093 |
| McGann et al (2018) |
0.901 |
0.878 |
0.207 |
0.149 |
| Stress-dependent correlation |
1.007 |
0.974 |
0.188 |
0.097 |
Table 5.
Global and location-specific accuracy (at IJV038) of selected CPT-based correlations for in terms of the mean () and coefficient of variation (CoV) of the ratio of calculated to measured .
Table 5.
Global and location-specific accuracy (at IJV038) of selected CPT-based correlations for in terms of the mean () and coefficient of variation (CoV) of the ratio of calculated to measured .
| Correlation |
|
|
|
|
| Wride et al (2000) |
0.782 |
0.779 |
0.214 |
0.173 |
| Hegazy & Mayne (2006) |
1.131 |
1.291 |
0.260 |
0.205 |
| Andrus et al (2007) |
1.095 |
1.187 |
0.207 |
0.175 |
| Robertson & Cabal (2015) |
1.056 |
1.157 |
0.206 |
0.158 |
| McGann et al (2018) |
0.901 |
0.948 |
0.207 |
0.184 |
| Stress-dependent correlation |
1.007 |
1.033 |
0.188 |
0.184 |
|
Disclaimer/Publisher’s Note: The statements, opinions and data contained in all publications are solely those of the individual author(s) and contributor(s) and not of MDPI and/or the editor(s). MDPI and/or the editor(s) disclaim responsibility for any injury to people or property resulting from any ideas, methods, instructions or products referred to in the content. |
© 2024 by the authors. Licensee MDPI, Basel, Switzerland. This article is an open access article distributed under the terms and conditions of the Creative Commons Attribution (CC BY) license (http://creativecommons.org/licenses/by/4.0/).

