Submitted:
27 May 2024
Posted:
27 May 2024
You are already at the latest version
Abstract
Keywords:
1. Introduction
2. Materials and Methods
2.1. Materials
2.2. Preparation of CV@HNT Nanohybrid
2.3. Preparation of “Blank” LDPE, LDPE/HNT, and LDPE/CV@HNT Films
2.4. Preparation of CV Surface-Coated Films
2.5. Fourier Transform Infrared (FTIR) Measurements
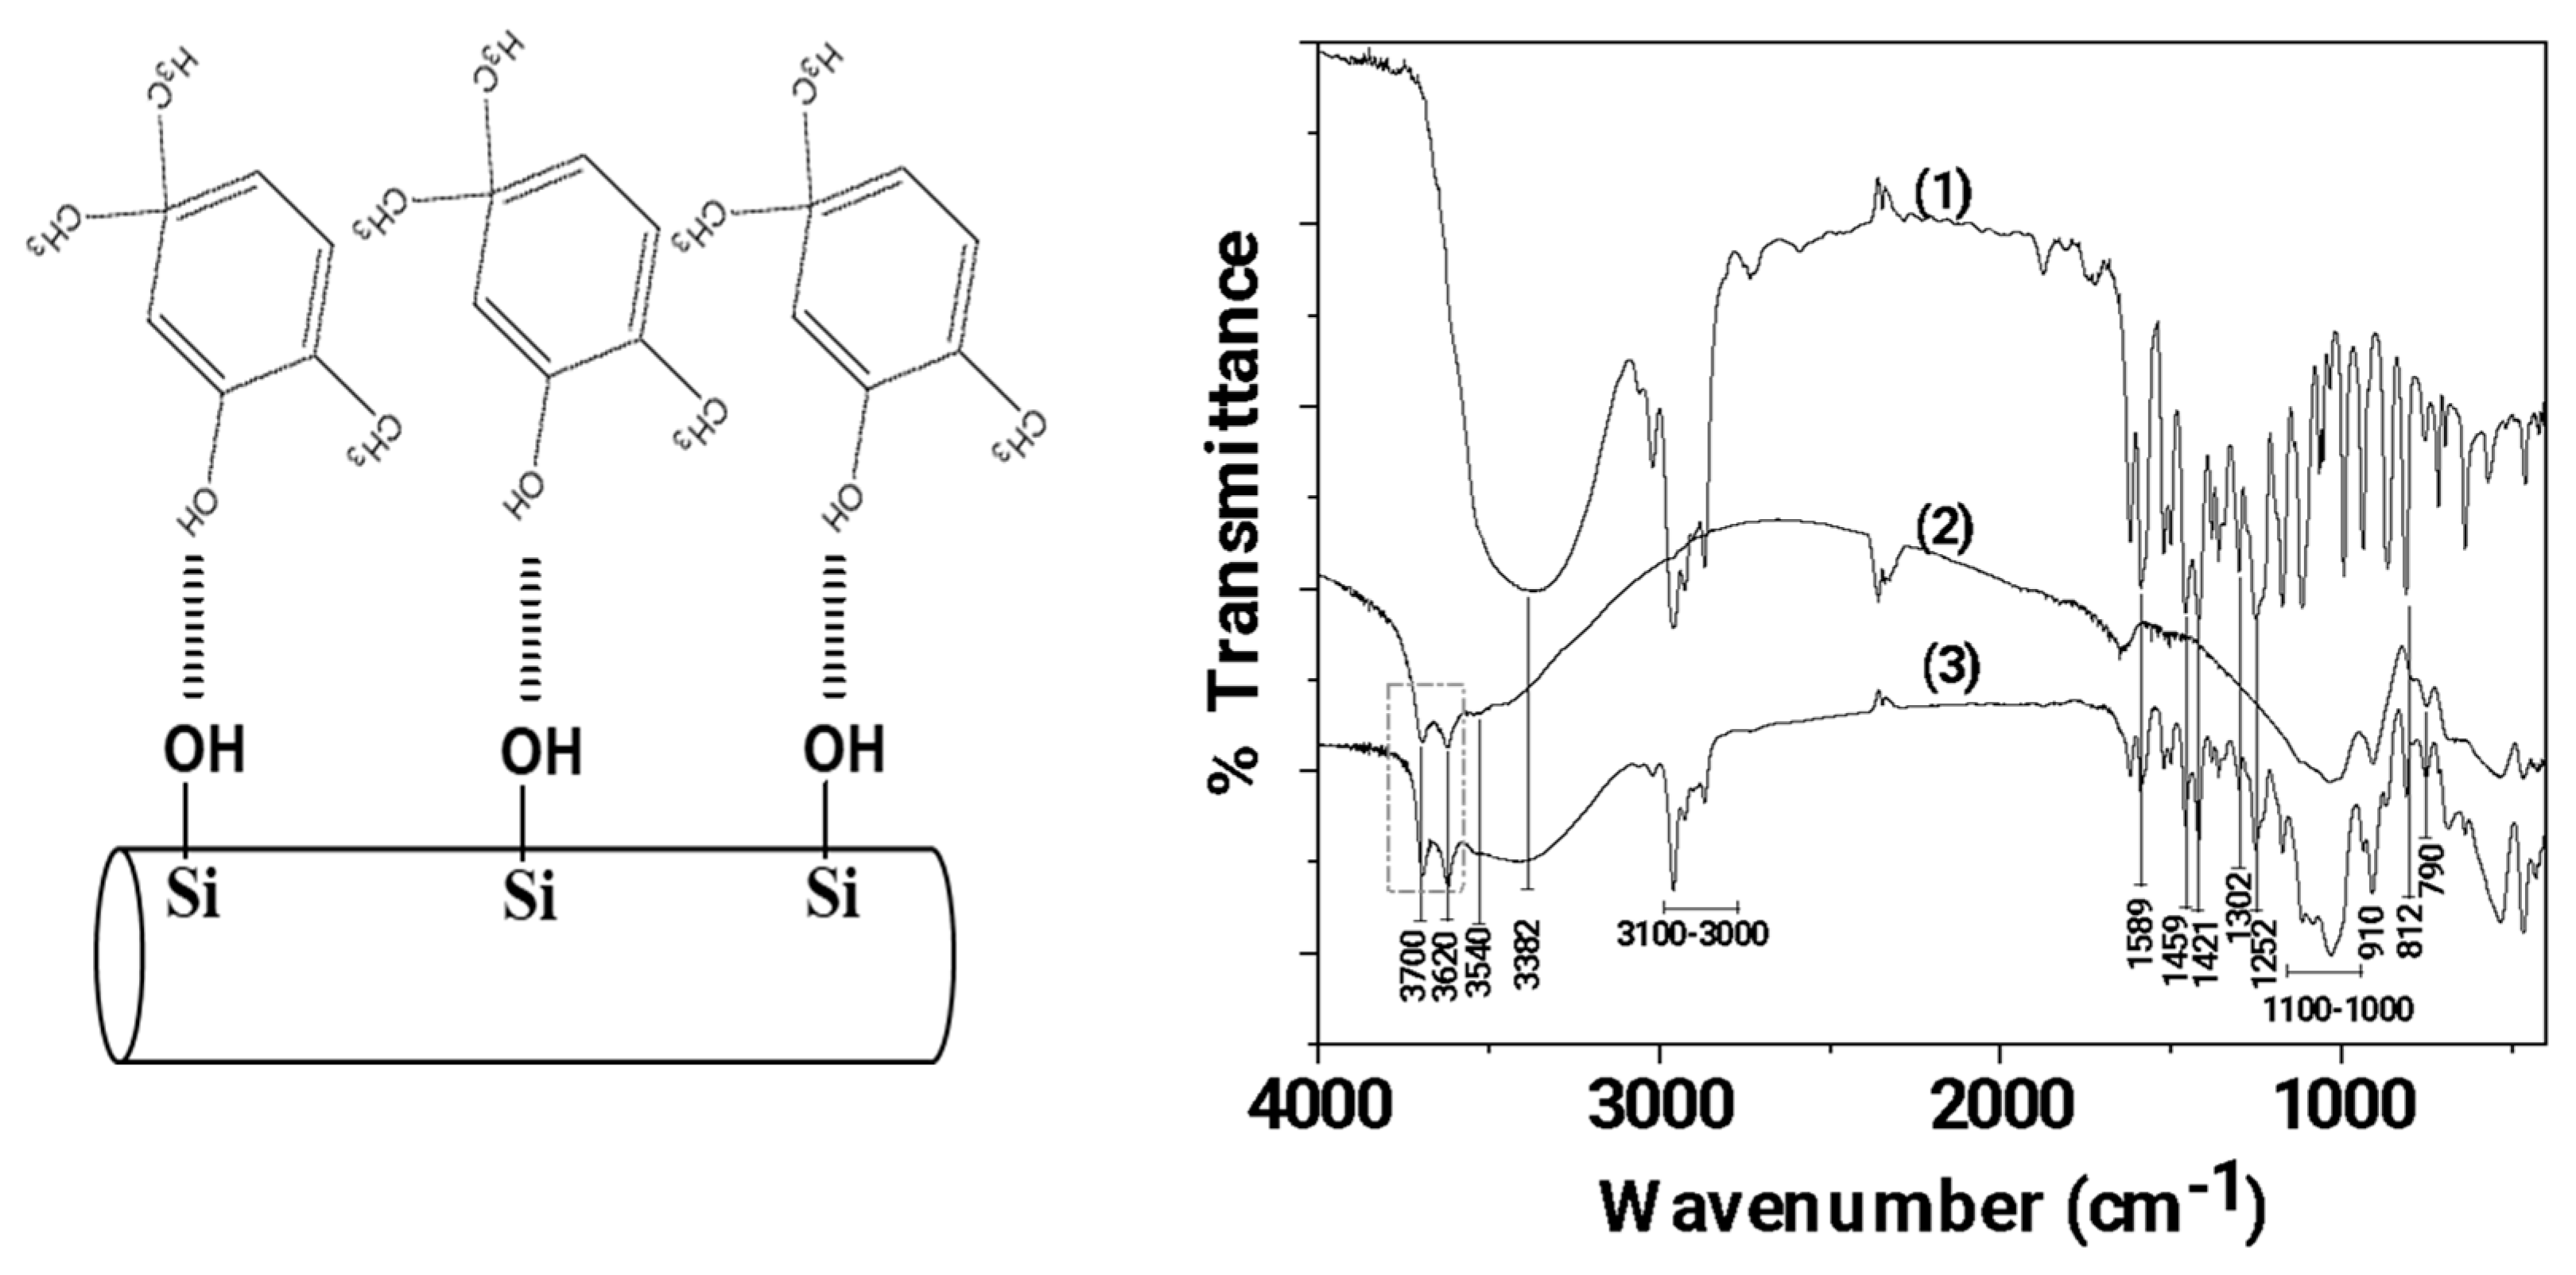
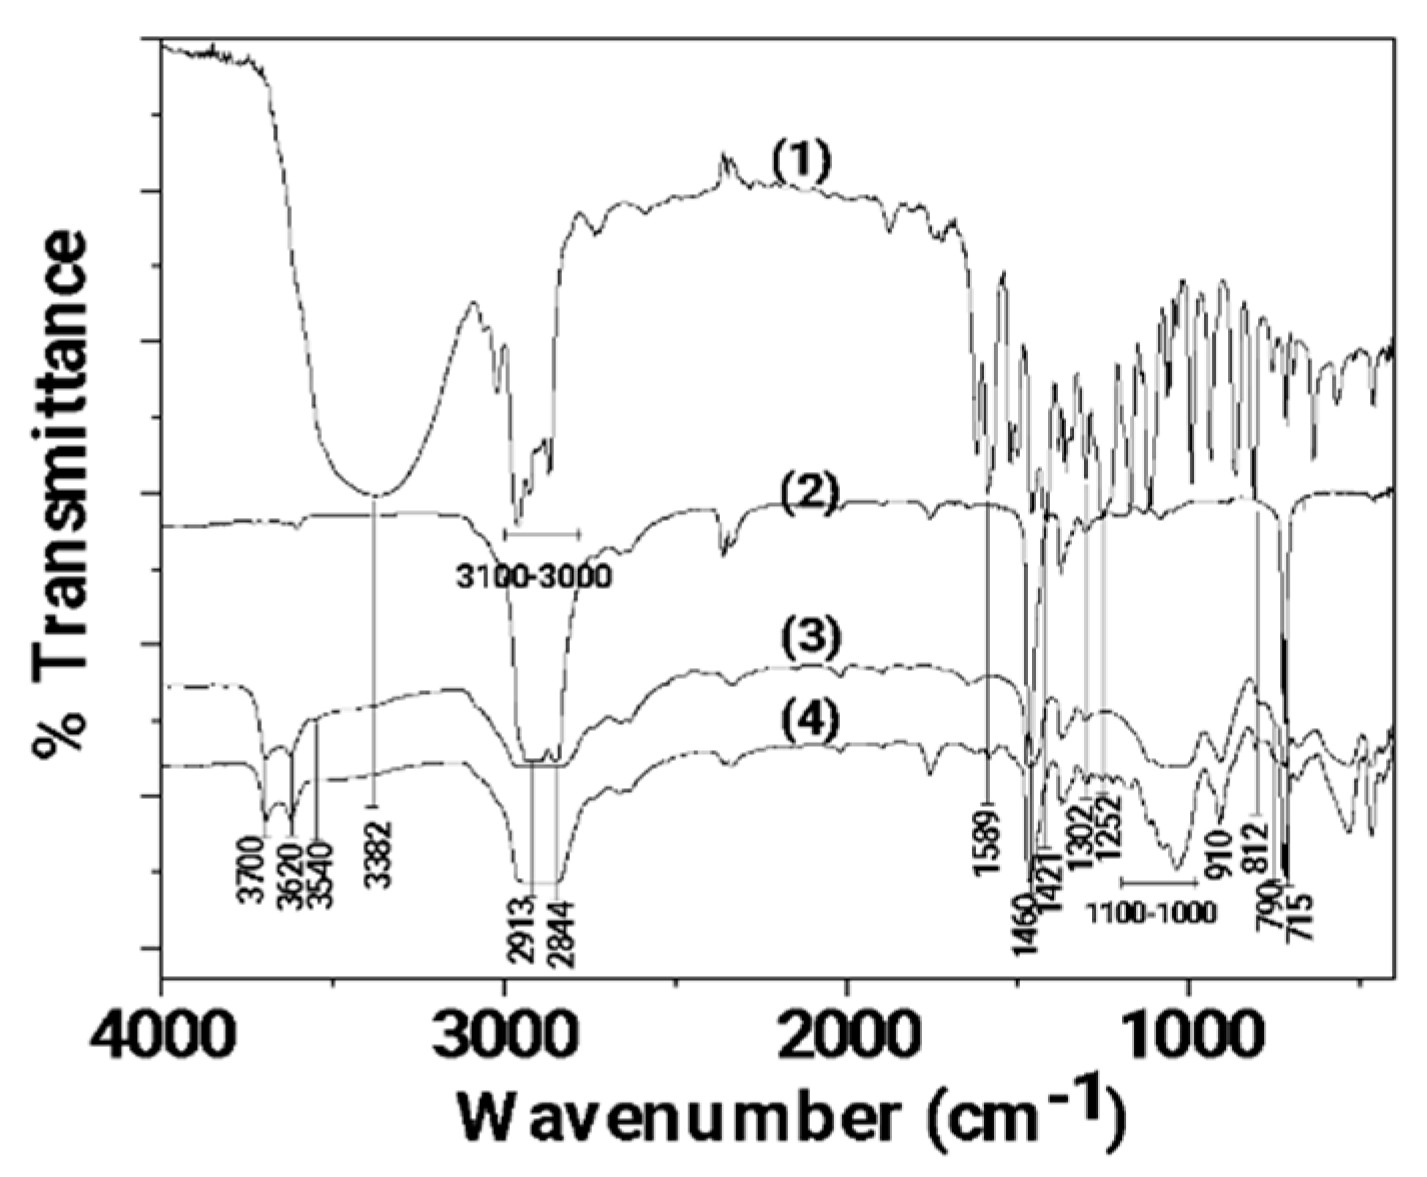
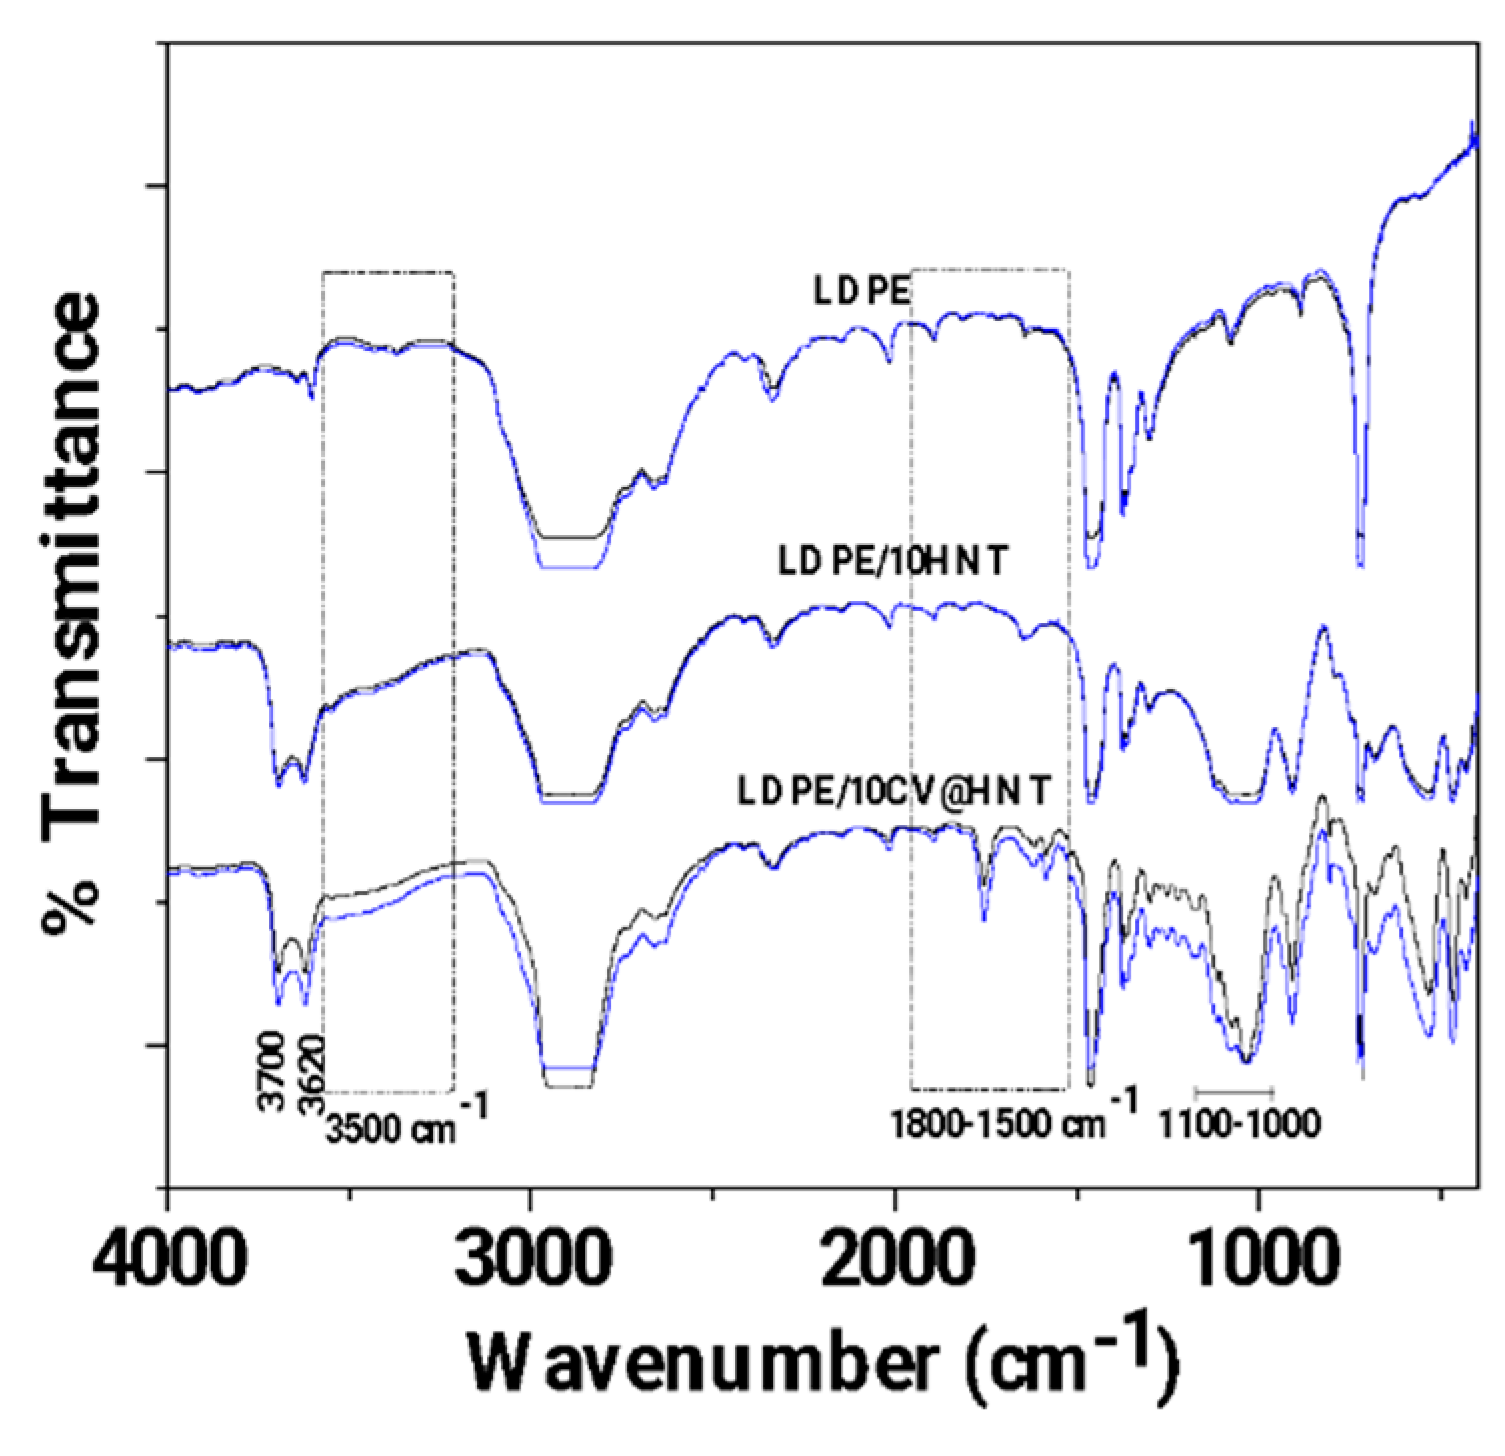
2.5.1. FTIR Characterization of CV@HNT Nanohybrid and All Obtained Films
2.5.2. FTIR Study on Corona Treated Films
2.5.3. FTIR Study on Corona-Treated and Untreated CV-Coated Films
2.5.4. FTIR Study of CV Release from All Obtained Films
2.6. Tensile Properties of Films
2.7. Water/Oxygen Barrier Properties of Obtained Films
2.7.1. Water Vapor Transmission Rate (WVTR) and WATER vapor Diffusion Coefficient (Dwv)
2.7.2. Oxygen Transmission Rate Measurements and Oxygen Permeability
2.8. Control Release Kinetics Studies of CV from Obtained Films
2.9. Antioxidant Activity of Films
2.9.1. Total Antioxidant Activity of Films
2.8.2. Determination of the Effective Concentration (EC50) of Obtained Films
2.9. Statistical Analysis
3. Results
3.1. FTIR characterization
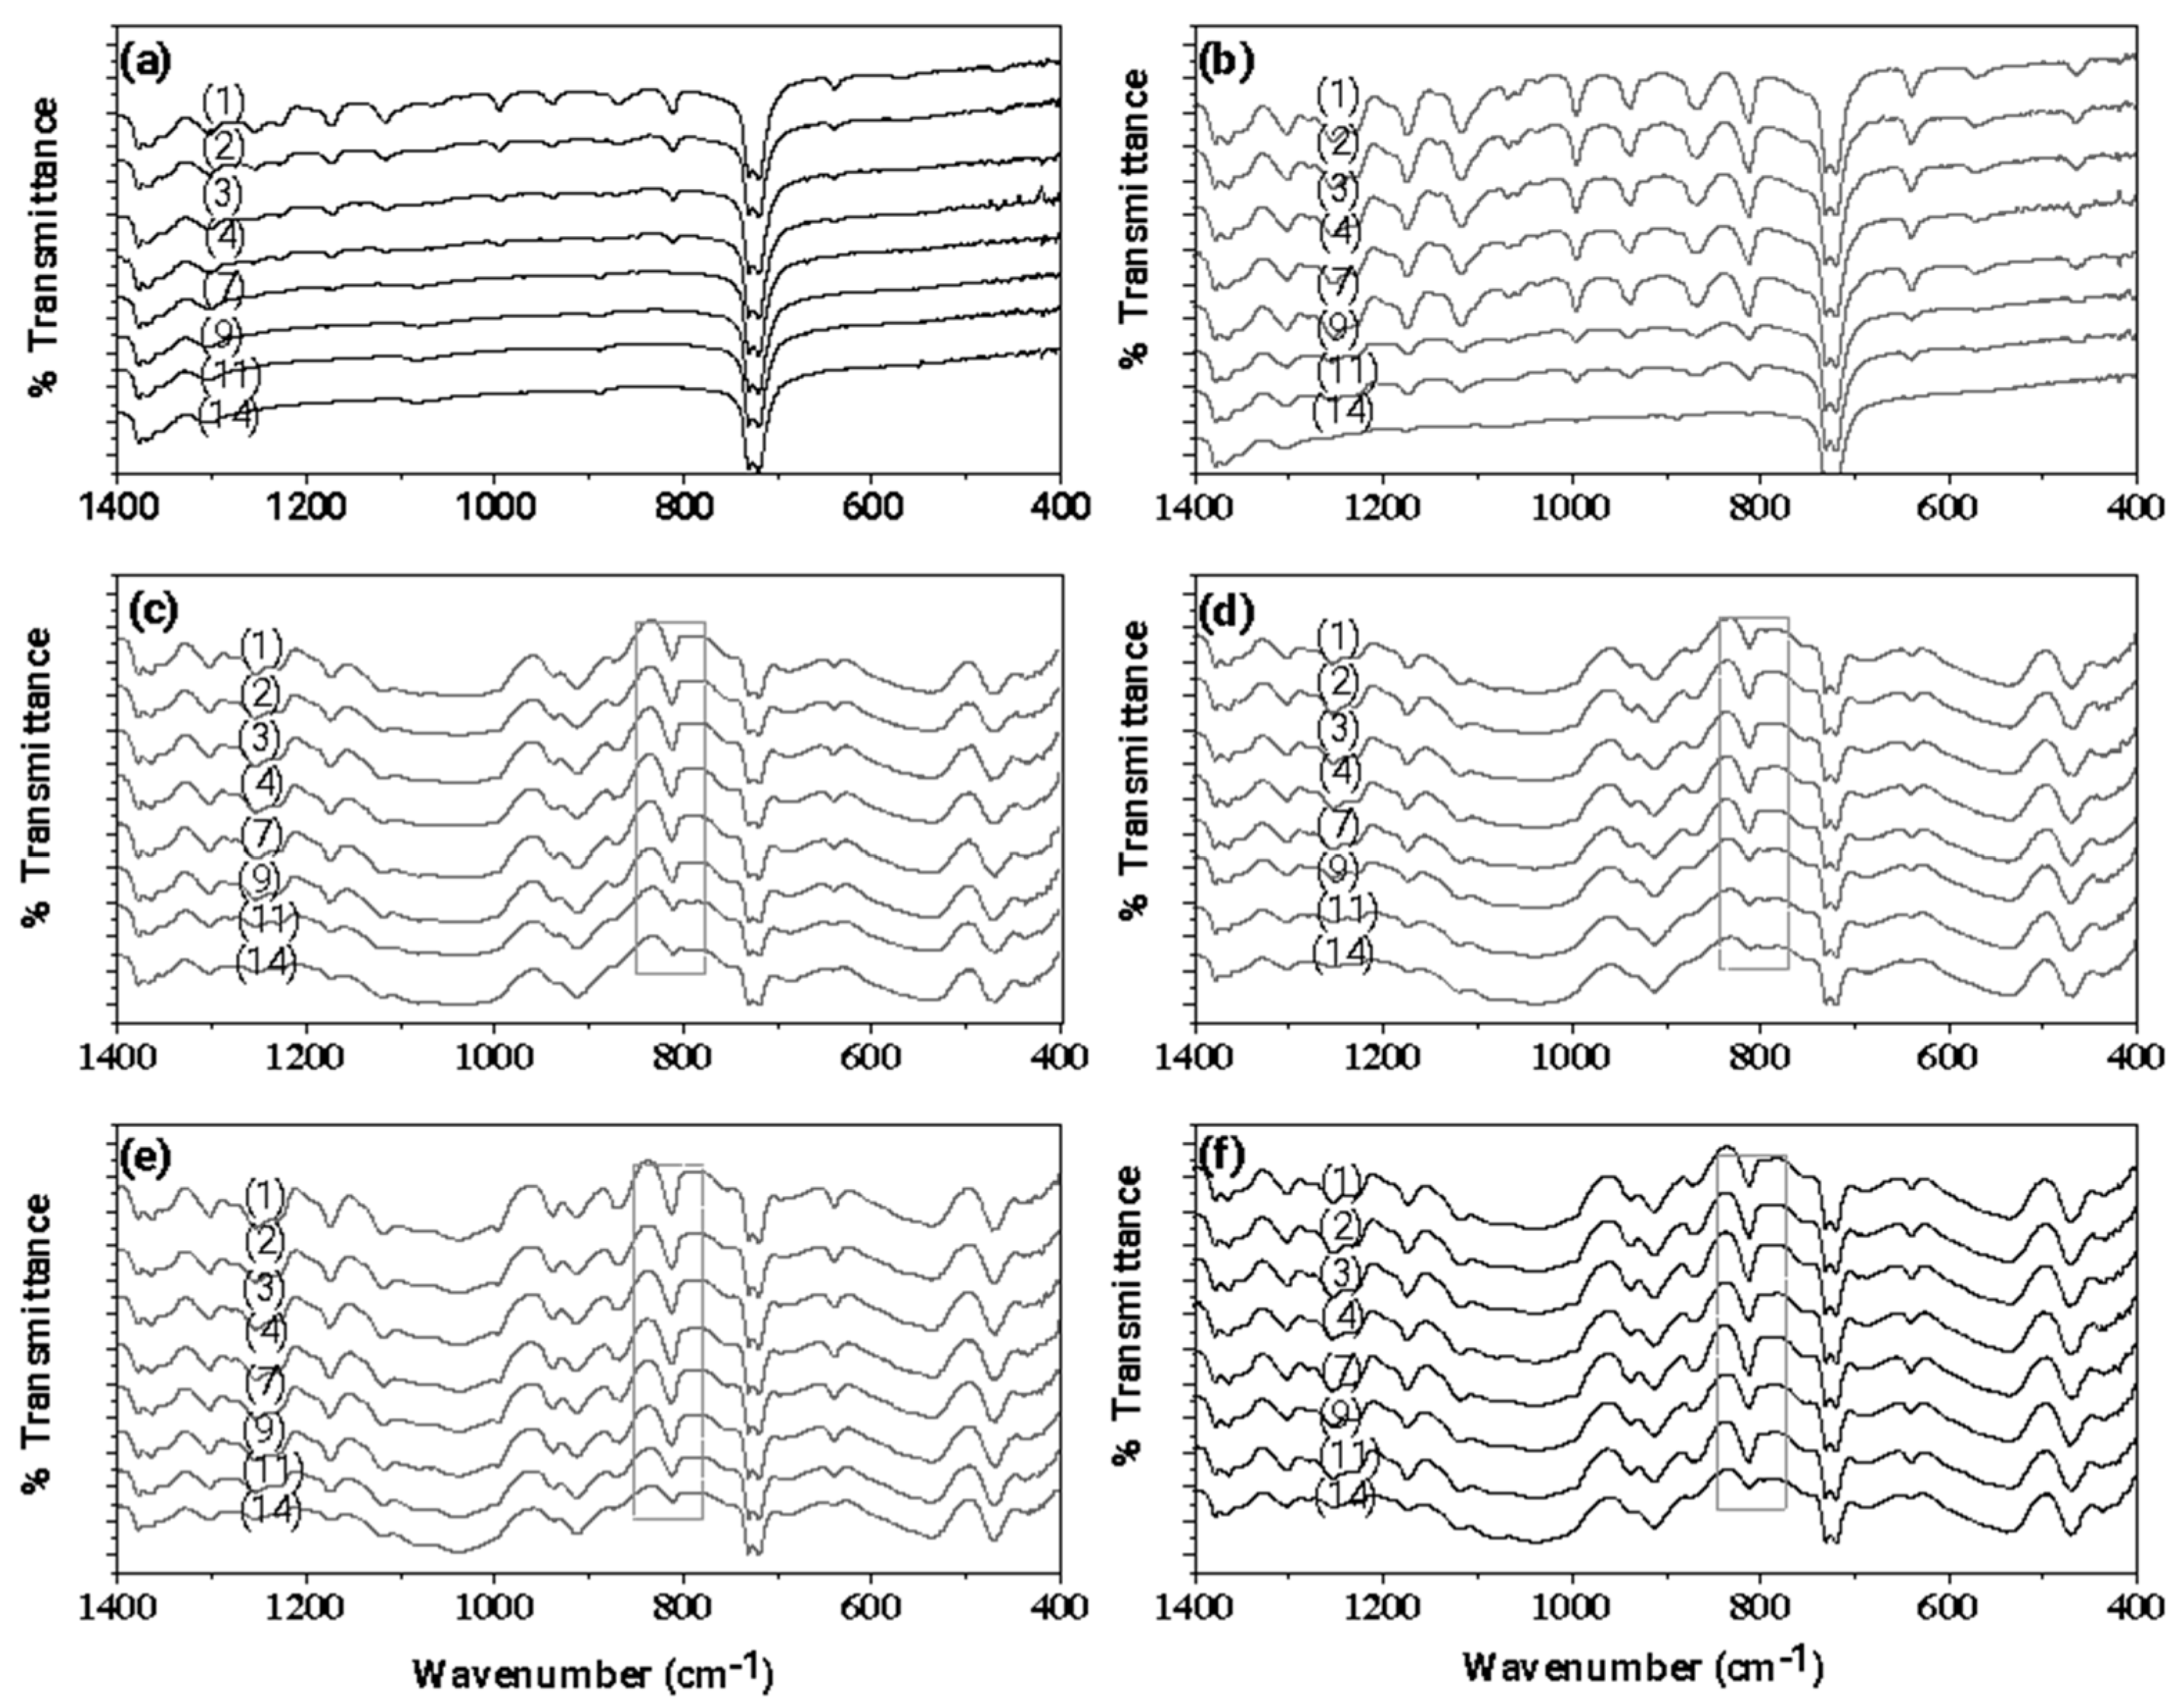
3.2. Tensile Properties

3.3. Water/Oxygen Barrier Properties
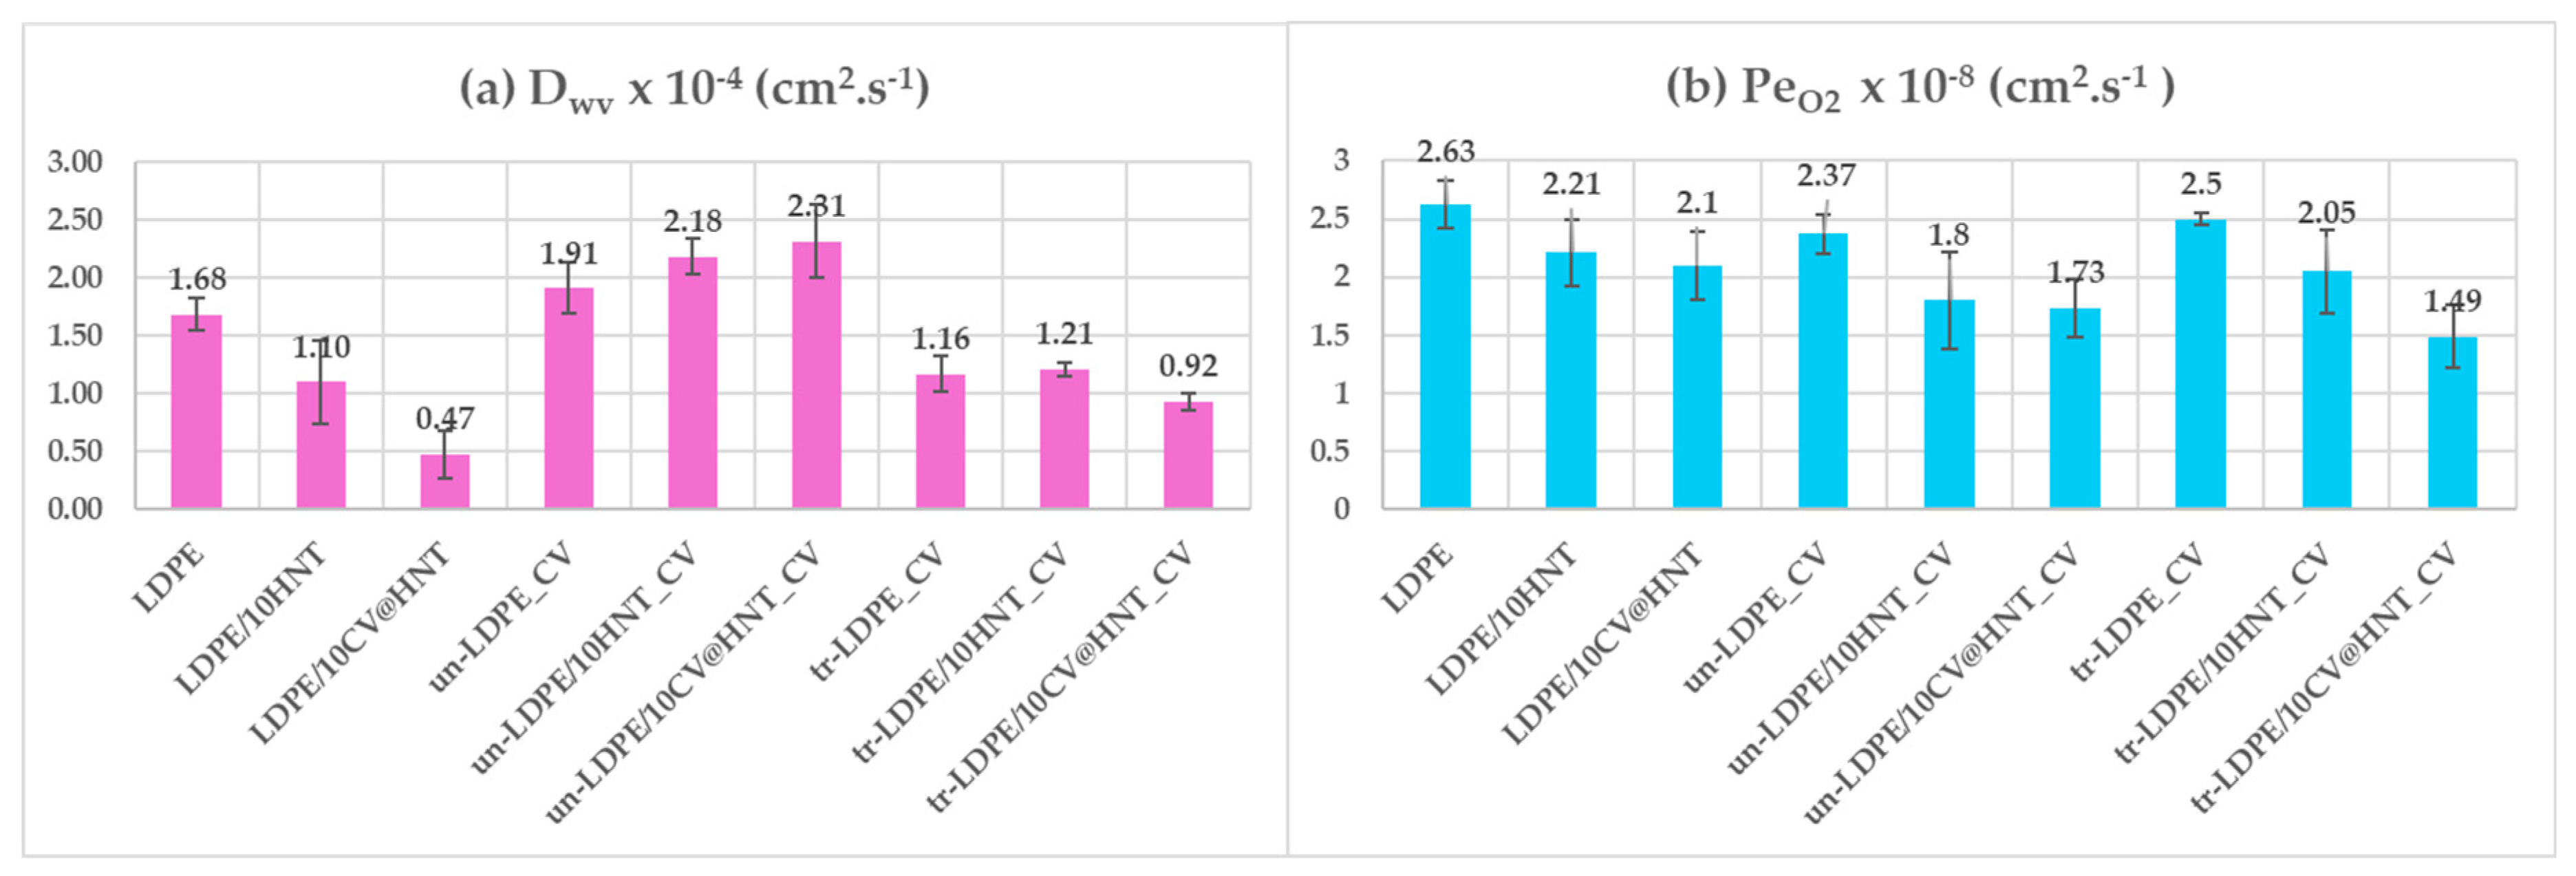
3.4. CV release Kinetics
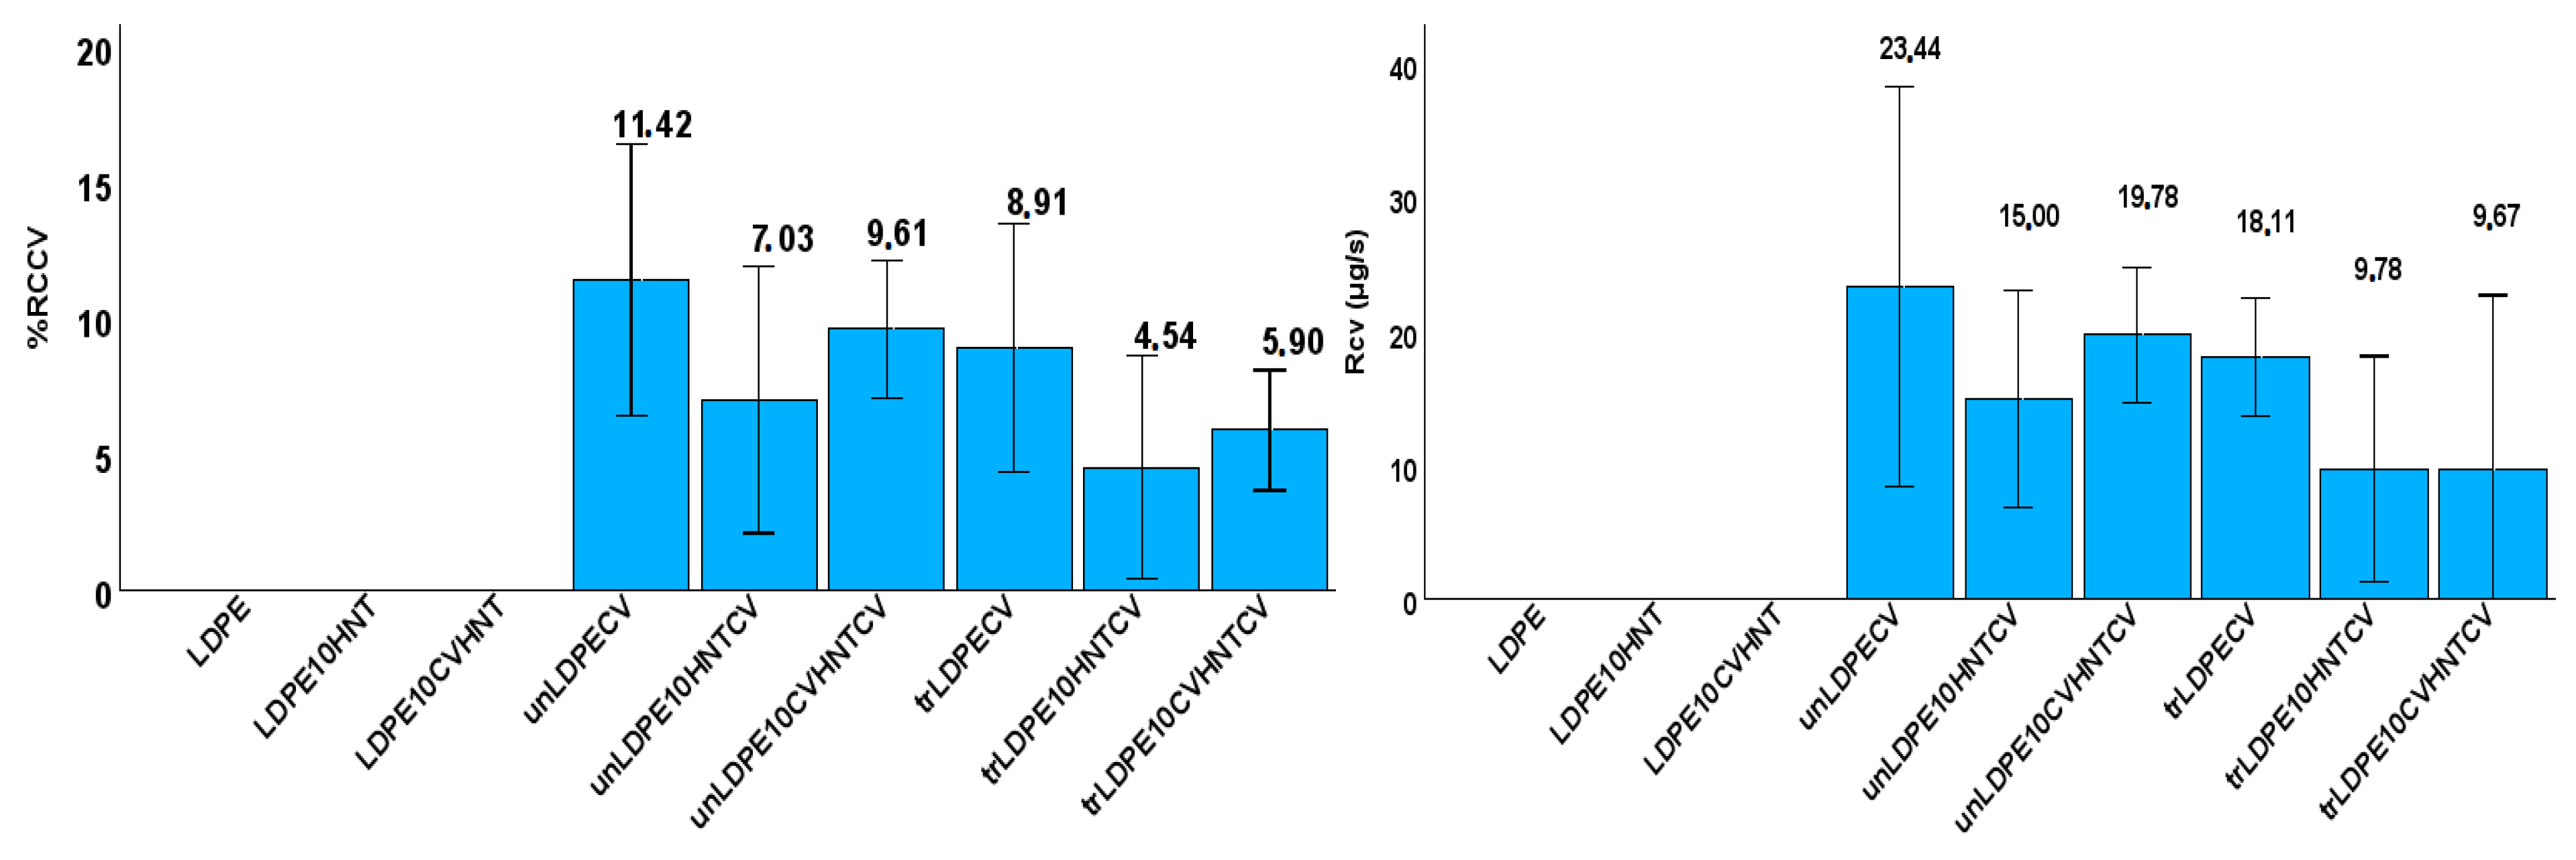
3.5. Antioxidant Activity of Films
4. Discussion
5. Conclusions
Supplementary Materials
Author Contributions
Funding
Data Availability Statement
Conflicts of Interest
References
- Scarano, P.; Sciarrillo, R.; Tartaglia, M.; Zuzolo, D.; Guarino, C. Circular Economy and Secondary Raw Materials from Fruits as Sustainable Source for Recovery and Reuse. A Review. Trends in Food Science & Technology 2022, 122, 157–170. [Google Scholar] [CrossRef]
- Plant Extracts-Based Food Packaging Films - Natural Materials for Food Packaging Application - Wiley Online Library. Available online: https://onlinelibrary.wiley.com/doi/10.1002/9783527837304.ch2 (accessed on 26 July 2023).
- Hamam, M.; Chinnici, G.; Di Vita, G.; Pappalardo, G.; Pecorino, B.; Maesano, G.; D’Amico, M. Circular Economy Models in Agro-Food Systems: A Review. Sustainability 2021, 13, 3453. [Google Scholar] [CrossRef]
- Carpena, M.; Nuñez-Estevez, B.; Soria-Lopez, A.; Garcia-Oliveira, P.; Prieto, M.A. Essential Oils and Their Application on Active Packaging Systems: A Review. Resources 2021, 10, 7. [Google Scholar] [CrossRef]
- Chacha, J.S.; Ofoedu, C.E.; Xiao, K. Essential Oil-Based Active Polymer-Based Packaging System: A Review of Its Effect on the Antimicrobial, Antioxidant, and Sensory Properties of Beef and Chicken Meat. Journal of Food Processing and Preservation 2022, 46, e16933. [Google Scholar] [CrossRef]
- Use of Essential Oils in Bioactive Edible Coatings: A Review | SpringerLink. Available online: https://link.springer.com/article/10.1007/s12393-010-9031-3 (accessed on 8 August 2019).
- Busolo, M.A.; Lagaron, J.M. Antioxidant Polyethylene Films Based on a Resveratrol Containing Clay of Interest in Food Packaging Applications. Food Packaging and Shelf Life 2015, 6, 30–41. [Google Scholar] [CrossRef]
- Coelho, L.B.; Geraldine, R.M.; Silveira, M.F.A.; de Souza, A.R.M.; Torres, M.C.L.; Gonçalves, M.Á.B. Characterization of Films of Low Density Polyethylene Incorporated with Oregano Essential Oil. Research, Society and Development 2020, 9, e3849108722. [Google Scholar] [CrossRef]
- de Araújo, L.O.; Anaya, K.; Pergher, S.B.C. Synthesis of Antimicrobial Films Based on Low-Density Polyethylene (LDPE) and Zeolite A Containing Silver. Coatings 2019, 9, 786. [Google Scholar] [CrossRef]
- Farghal, H.H.; Karabagias, I.; El Sayed, M.; Kontominas, M.G. Determination of Antioxidant Activity of Surface-Treated PET Films Coated with Rosemary and Clove Extracts. Packaging Technology and Science 2017, 30, 799–808. [Google Scholar] [CrossRef]
- Giannakas, A.E.; Salmas, C.E.; Karydis-Messinis, A.; Moschovas, D.; Kollia, E.; Tsigkou, V.; Proestos, C.; Avgeropoulos, A.; Zafeiropoulos, N.E. Nanoclay and Polystyrene Type Efficiency on the Development of Polystyrene/Montmorillonite/Oregano Oil Antioxidant Active Packaging Nanocomposite Films. Applied Sciences 2021, 11, 9364. [Google Scholar] [CrossRef]
- Aitboulahsen, M.; El Galiou, O.; Laglaoui, A.; Bakkali, M.; Hassani Zerrouk, M. Effect of Plasticizer Type and Essential Oils on Mechanical, Physicochemical, and Antimicrobial Characteristics of Gelatin, Starch, and Pectin-Based Films. Journal of Food Processing and Preservation 2020, 44, e14480. [Google Scholar] [CrossRef]
- Souza, A.G.; Ferreira, R.R.; Paula, L.C.; Mitra, S.K.; Rosa, D.S. Starch-Based Films Enriched with Nanocellulose-Stabilized Pickering Emulsions Containing Different Essential Oils for Possible Applications in Food Packaging. Food Packaging and Shelf Life 2021, 27, 100615. [Google Scholar] [CrossRef]
- Abdollahi, M.; Rezaei, M.; Farzi, G. A Novel Active Bionanocomposite Film Incorporating Rosemary Essential Oil and Nanoclay into Chitosan. Journal of Food Engineering 2012, 111, 343–350. [Google Scholar] [CrossRef]
- Almeida, R.R.; Silva Damasceno, E.T.; de Carvalho, S.Y.B.; de Carvalho, G.S.G.; Gontijo, L.A.P.; de Lima Guimarães, L.G. Chitosan Nanogels Condensed to Ferulic Acid for the Essential Oil of Lippia Origanoides Kunth Encapsulation. Carbohydrate Polymers 2018, 188, 268–275. [Google Scholar] [CrossRef] [PubMed]
- Hasani, S.; Ojagh, S.M.; Ghorbani, M. Nanoencapsulation of Lemon Essential Oil in Chitosan-Hicap System. Part 1: Study on Its Physical and Structural Characteristics. International Journal of Biological Macromolecules 2018, 115, 143–151. [Google Scholar] [CrossRef] [PubMed]
- Jiang, J.; Watowita, P.S.M.S.L.; Chen, R.; Shi, Y.; Geng, J.-T.; Takahashi, K.; Li, L.; Osako, K. Multilayer Gelatin/Myofibrillar Films Containing Clove Essential Oil: Properties, Protein-Phenolic Interactions, and Migration of Active Compounds. Food Packaging and Shelf Life 2022, 32, 100842. [Google Scholar] [CrossRef]
- Fiore, A.; Park, S.; Volpe, S.; Torrieri, E.; Masi, P. Active Packaging Based on PLA and Chitosan-Caseinate Enriched Rosemary Essential Oil Coating for Fresh Minced Chicken Breast Application. Food Packaging and Shelf Life 2021, 29, 100708. [Google Scholar] [CrossRef]
- Wongphan, P.; Nampanya, P.; Chakpha, W.; Promhuad, K.; Laorenza, Y.; Leelaphiwat, P.; Bumbudsanpharoke, N.; Sodsai, J.; Lorenzo, J.M.; Harnkarnsujarit, N. Lesser Galangal (Alpinia Officinarum Hance) Essential Oil Incorporated Biodegradable PLA/PBS Films as Shelf-Life Extension Packaging of Cooked Rice. Food Packaging and Shelf Life 2023, 37, 101077. [Google Scholar] [CrossRef]
- Louis, E.; Villalobos-Carvajal, R.; Reyes-Parra, J.; Jara-Quijada, E.; Ruiz, C.; Andrades, P.; Gacitúa, J.; Beldarraín-Iznaga, T. Preservation of Mushrooms (Agaricus Bisporus) by an Alginate-Based-Coating Containing a Cinnamaldehyde Essential Oil Nanoemulsion. Food Packaging and Shelf Life 2021, 28, 100662. [Google Scholar] [CrossRef]
- Arrieta, M.P.; López, J.; Ferrándiz, S.; Peltzer, M.A. Characterization of PLA-Limonene Blends for Food Packaging Applications. Polymer Testing 2013, 32, 760–768. [Google Scholar] [CrossRef]
- Darvish, M.; Ajji, A. Synergistic Antimicrobial Activities of Limonene with Mineral Carriers in LDPE Films for Active Packaging Application. Science Journal of Chemistry 2022, 10, 32. [Google Scholar] [CrossRef]
- Huang, X.; Ge, X.; Zhou, L.; Wang, Y. Eugenol Embedded Zein and Poly(Lactic Acid) Film as Active Food Packaging: Formation, Characterization, and Antimicrobial Effects. Food Chemistry 2022, 384, 132482. [Google Scholar] [CrossRef] [PubMed]
- Srisa, A.; Harnkarnsujarit, N. Antifungal Films from Trans-Cinnamaldehyde Incorporated Poly(Lactic Acid) and Poly(Butylene Adipate-Co-Terephthalate) for Bread Packaging. Food Chemistry 2020, 333, 127537. [Google Scholar] [CrossRef] [PubMed]
- Gámez, E.; Elizondo-Castillo, H.; Tascon, J.; García-Salinas, S.; Navascues, N.; Mendoza, G.; Arruebo, M.; Irusta, S. Antibacterial Effect of Thymol Loaded SBA-15 Nanorods Incorporated in PCL Electrospun Fibers. Nanomaterials (Basel) 2020, 10, 616. [Google Scholar] [CrossRef] [PubMed]
- Ochoa-Velasco, C.E.; Pérez-Pérez, J.C.; Varillas-Torres, J.M.; Navarro-Cruz, A.R.; Hernández-Carranza, P.; Munguía-Pérez, R.; Cid-Pérez, T.S.; Avila-Sosa, R. Starch Edible Films/Coatings Added with Carvacrol and Thymol: In Vitro and In Vivo Evaluation against Colletotrichum Gloeosporioides. Foods 2021, 10, 175. [Google Scholar] [CrossRef] [PubMed]
- Pei, R.S.; Zhou, F.; Ji, B.P.; Xu, J. Evaluation of Combined Antibacterial Effects of Eugenol, Cinnamaldehyde, Thymol, and Carvacrol against E. Coli with an Improved Method. Journal of Food Science 2009, 74, 379–383. [Google Scholar] [CrossRef] [PubMed]
- Babayev, A.; Spasojević, L.; Škrbić, J.; Bučko, S.; Kocić-Tanackov, S.; Bulut, S.; Fraj, J.; Petrović, L.; Milinković Budinčić, J.; Sharipova, A.; et al. Antimicrobial Pseudolatex Zein Films with Encapsulated Carvacrol for Sustainable Food Packaging. Food Packaging and Shelf Life 2023, 37, 101076. [Google Scholar] [CrossRef]
- Sharifi-Rad, M.; Varoni, E.M.; Iriti, M.; Martorell, M.; Setzer, W.N.; Del Mar Contreras, M.; Salehi, B.; Soltani-Nejad, A.; Rajabi, S.; Tajbakhsh, M.; et al. Carvacrol and Human Health: A Comprehensive Review. Phytother Res 2018, 32, 1675–1687. [Google Scholar] [CrossRef] [PubMed]
- Li, Q.; Ren, T.; Perkins, P.; Hu, X.; Wang, X. Applications of Halloysite Nanotubes in Food Packaging for Improving Film Performance and Food Preservation. Food Control 2021, 124, 107876. [Google Scholar] [CrossRef]
- de Oliveira, L.H.; Trigueiro, P.; Souza, J.S.N.; de Carvalho, M.S.; Osajima, J.A.; da Silva-Filho, E.C.; Fonseca, M.G. Montmorillonite with Essential Oils as Antimicrobial Agents, Packaging, Repellents, and Insecticides: An Overview. Colloids and Surfaces B: Biointerfaces 2022, 209, 112186. [Google Scholar] [CrossRef]
- Mitura, K.; Kornacka, J.; Kopczyńska, E.; Kalisz, J.; Czerwińska, E.; Affeltowicz, M.; Kaczorowski, W.; Kolesińska, B.; Frączyk, J.; Bakalova, T.; et al. Active Carbon-Based Nanomaterials in Food Packaging. Coatings 2021, 11, 161. [Google Scholar] [CrossRef]
- Villa, C.C.; Valencia, G.A.; López Córdoba, A.; Ortega-Toro, R.; Ahmed, S.; Gutiérrez, T.J. Zeolites for Food Applications: A Review. Food Bioscience 2022, 46, 101577. [Google Scholar] [CrossRef]
- Videira-Quintela, D.; Martin, O.; Montalvo, G. Emerging Opportunities of Silica-Based Materials within the Food Industry. Microchemical Journal 2021, 167, 106318. [Google Scholar] [CrossRef]
- Kurd, F.; Fathi, M.; Shekarchizadeh, H. Basil Seed Mucilage as a New Source for Electrospinning: Production and Physicochemical Characterization. International Journal of Biological Macromolecules 2017, 95, 689–695. [Google Scholar] [CrossRef] [PubMed]
- Suppakul, P.; Miltz, J.; Sonneveld, K.; Bigger, S.w. Active Packaging Technologies with an Emphasis on Antimicrobial Packaging and Its Applications. Journal of Food Science 2003, 68, 408–420. [Google Scholar] [CrossRef]
- Andrade, M.A.; Barbosa, C.H.; Souza, V.G.L.; Coelhoso, I.M.; Reboleira, J.; Bernardino, S.; Ganhão, R.; Mendes, S.; Fernando, A.L.; Vilarinho, F.; et al. Novel Active Food Packaging Films Based on Whey Protein Incorporated with Seaweed Extract: Development, Characterization, and Application in Fresh Poultry Meat. Coatings 2021, 11, 229. [Google Scholar] [CrossRef]
- Gaikwad, K.K.; Singh, S.; Lee, Y.S. A Pyrogallol-Coated Modified LDPE Film as an Oxygen Scavenging Film for Active Packaging Materials. Progress in Organic Coatings 2017, 111, 186–195. [Google Scholar] [CrossRef]
- Fu, Y.; Dudley, E.G. Antimicrobial-Coated Films as Food Packaging: A Review. Comprehensive Reviews in Food Science and Food Safety 2021, 20, 3404–3437. [Google Scholar] [CrossRef]
- Tyuftin, A.A.; Kerry, J.P. Review of Surface Treatment Methods for Polyamide Films for Potential Application as Smart Packaging Materials: Surface Structure, Antimicrobial and Spectral Properties. Food Packaging and Shelf Life 2020, 24, 100475. [Google Scholar] [CrossRef]
- Louzi, V.C.; Campos, J.S. de C. Corona Treatment Applied to Synthetic Polymeric Monofilaments (PP, PET, and PA-6). Surfaces and Interfaces 2019, 14, 98–107. [Google Scholar] [CrossRef]
- Dai, L.; Xu, D. Polyethylene Surface Enhancement by Corona and Chemical Co-Treatment. Tetrahedron Letters 2019, 60, 1005–1010. [Google Scholar] [CrossRef]
- Božović, A.; Tomašević, K.; Benbettaieb, N.; Debeaufort, F. Influence of Surface Corona Discharge Process on Functional and Antioxidant Properties of Bio-Active Coating Applied onto PLA Films. Antioxidants 2023, 12, 859. [Google Scholar] [CrossRef] [PubMed]
- Giannakas, A.E.; Salmas, C.E.; Moschovas, D.; Zaharioudakis, K.; Georgopoulos, S.; Asimakopoulos, G.; Aktypis, A.; Proestos, C.; Karakassides, A.; Avgeropoulos, A.; et al. The Increase of Soft Cheese Shelf-Life Packaged with Edible Films Based on Novel Hybrid Nanostructures. Gels 2022, 8, 539. [Google Scholar] [CrossRef] [PubMed]
- Constantinos E. Salmas; Aris E. Giannakas; Dimitrios Moschovas; Eleni Kollia; Stsvros Georgopoulos; Christina Gioti; Areti Leontiou; Apostolos Avgeropoulos; Anna Kopsacheili; Learda Avdulai; et al. Kiwi Fruits Preservation Using Novel Edible Active Coatings Based on Rich in Thymol Halloysite Nanostructures and Chitosan/Polyvinyl Alcohol Gels. Gels Bioactive Gel Films and Coatings Applied in Active Food Packaging.
- Giannakas, A.E.; Salmas, C.E.; Moschovas, D.; Karabagias, V.K.; Karabagias, I.K.; Baikousi, M.; Georgopoulos, S.; Leontiou, A.; Katerinopoulou, K.; Zafeiropoulos, N.E.; et al. Development, Characterization, and Evaluation as Food Active Packaging of Low-Density-Polyethylene-Based Films Incorporated with Rich in Thymol Halloysite Nanohybrid for Fresh “Scaloppini” Type Pork Meat Fillets Preservation. Polymers 2023, 15, 282. [Google Scholar] [CrossRef] [PubMed]
- Giannakas, A.E.; Karabagias, V.K.; Moschovas, D.; Leontiou, A.; Karabagias, I.K.; Georgopoulos, S.; Karydis-Messinis, A.; Zaharioudakis, K.; Andritsos, N.; Kehayias, G.; et al. Thymol@activated Carbon Nanohybrid for Low-Density Polyethylene-Based Active Packaging Films for Pork Fillets’ Shelf-Life Extension. Foods 2023, 12, 2590. [Google Scholar] [CrossRef] [PubMed]
- Salmas, C.E.; Kollia, E.; Avdylaj, L.; Kopsacheili, A.; Zaharioudakis, K.; Georgopoulos, S.; Leontiou, A.; Katerinopoulou, K.; Kehayias, G.; Karakassides, A.; et al. Thymol@Natural Zeolite Nanohybrids for Chitosan/Poly-Vinyl-Alcohol Based Hydrogels Applied As Active Pads for Strawberries Preservation 2023.
- Salmas, C.E.; Giannakas, A.E.; Karabagias, V.K.; Moschovas, D.; Karabagias, I.K.; Gioti, C.; Georgopoulos, S.; Leontiou, A.; Kehayias, G.; Avgeropoulos, A.; et al. Development and Evaluation of a Novel-Thymol@Natural-Zeolite/Low-Density-Polyethylene Active Packaging Film: Applications for Pork Fillets Preservation. Antioxidants 2023, 12, 523. [Google Scholar] [CrossRef] [PubMed]
- Salmas, C.E.; Giannakas, A.E.; Baikousi, M.; Kollia, E.; Tsigkou, V.; Proestos, C. Effect of Copper and Titanium-Exchanged Montmorillonite Nanostructures on the Packaging Performance of Chitosan/Poly-Vinyl-Alcohol-Based Active Packaging Nanocomposite Films. Foods 2021, 10, 3038. [Google Scholar] [CrossRef] [PubMed]
- Brand-Williams, W.; Cuvelier, M.E.; Berset, C. Use of a Free Radical Method to Evaluate Antioxidant Activity. LWT - Food Science and Technology 1995, 28, 25–30. [Google Scholar] [CrossRef]
- Karabagias, I.K.; Maia, M.; Karabagias, V.K.; Gatzias, I.; Badeka, A.V. Characterization of Eucalyptus, Chestnut and Heather Honeys from Portugal Using Multi-Parameter Analysis and Chemo-Calculus. Foods 2018, 7, 194. [Google Scholar] [CrossRef]
- Tariq Waece Sadeq; Fouad Hussein Kamel; Karzan Omer Qader A Novel Preparation of Thyme Cream as Superficial Antimicrobial Treatment. Journal of International Pharmaceutical Research 2019, 46, 373–381.
- Valderrama, A.C.S.; De, G.C.R. Traceability of Active Compounds of Essential Oils in Antimicrobial Food Packaging Using a Chemometric Method by ATR-FTIR. American Journal of Analytical Chemistry 2017, 8, 726–741. [Google Scholar] [CrossRef]
- Li, H.; Zhu, X.; Zhou, H.; Zhong, S. Functionalization of Halloysite Nanotubes by Enlargement and Hydrophobicity for Sustained Release of Analgesic. Colloids and Surfaces A: Physicochemical and Engineering Aspects 2015, 487, 154–161. [Google Scholar] [CrossRef]
- Martínez-Camacho, A.P.; Cortez-Rocha, M.O.; Graciano-Verdugo, A.Z.; Rodríguez-Félix, F.; Castillo-Ortega, M.M.; Burgos-Hernández, A.; Ezquerra-Brauer, J.M.; Plascencia-Jatomea, M. Extruded Films of Blended Chitosan, Low Density Polyethylene and Ethylene Acrylic Acid. Carbohydr Polym 2013, 91, 666–674. [Google Scholar] [CrossRef] [PubMed]
- Giannakas, A.; Salmas, C.; Leontiou, A.; Tsimogiannis, D.; Oreopoulou, A.; Braouhli, J. Novel LDPE/Chitosan Rosemary and Melissa Extract Nanostructured Active Packaging Films. Nanomaterials 2019, 9, 1105. [Google Scholar] [CrossRef] [PubMed]
- Giannakas, A.E.; Salmas, C.E.; Leontiou, A.; Baikousi, M.; Moschovas, D.; Asimakopoulos, G.; Zafeiropoulos, N.E.; Avgeropoulos, A. Synthesis of a Novel Chitosan/Basil Oil Blend and Development of Novel Low Density Poly Ethylene/Chitosan/Basil Oil Active Packaging Films Following a Melt-Extrusion Process for Enhancing Chicken Breast Fillets Shelf-Life. Molecules 2021, 26, 1585. [Google Scholar] [CrossRef]
- Munteanu, B.S.; Sacarescu, L.; Vasiliu, A.-L.; Hitruc, G.E.; Pricope, G.M.; Sivertsvik, M.; Rosnes, J.T.; Vasile, C. Antioxidant/Antibacterial Electrospun Nanocoatings Applied onto PLA Films. Materials 2018, 11, 1973. [Google Scholar] [CrossRef]
- Cox, H.J.; Sharples, G.J.; Badyal, J.P.S. Tea–Essential Oil–Metal Hybrid Nanocoatings for Bacterial and Viral Inactivation. ACS Appl. Nano Mater. 2021, 4, 12619–12628. [Google Scholar] [CrossRef]
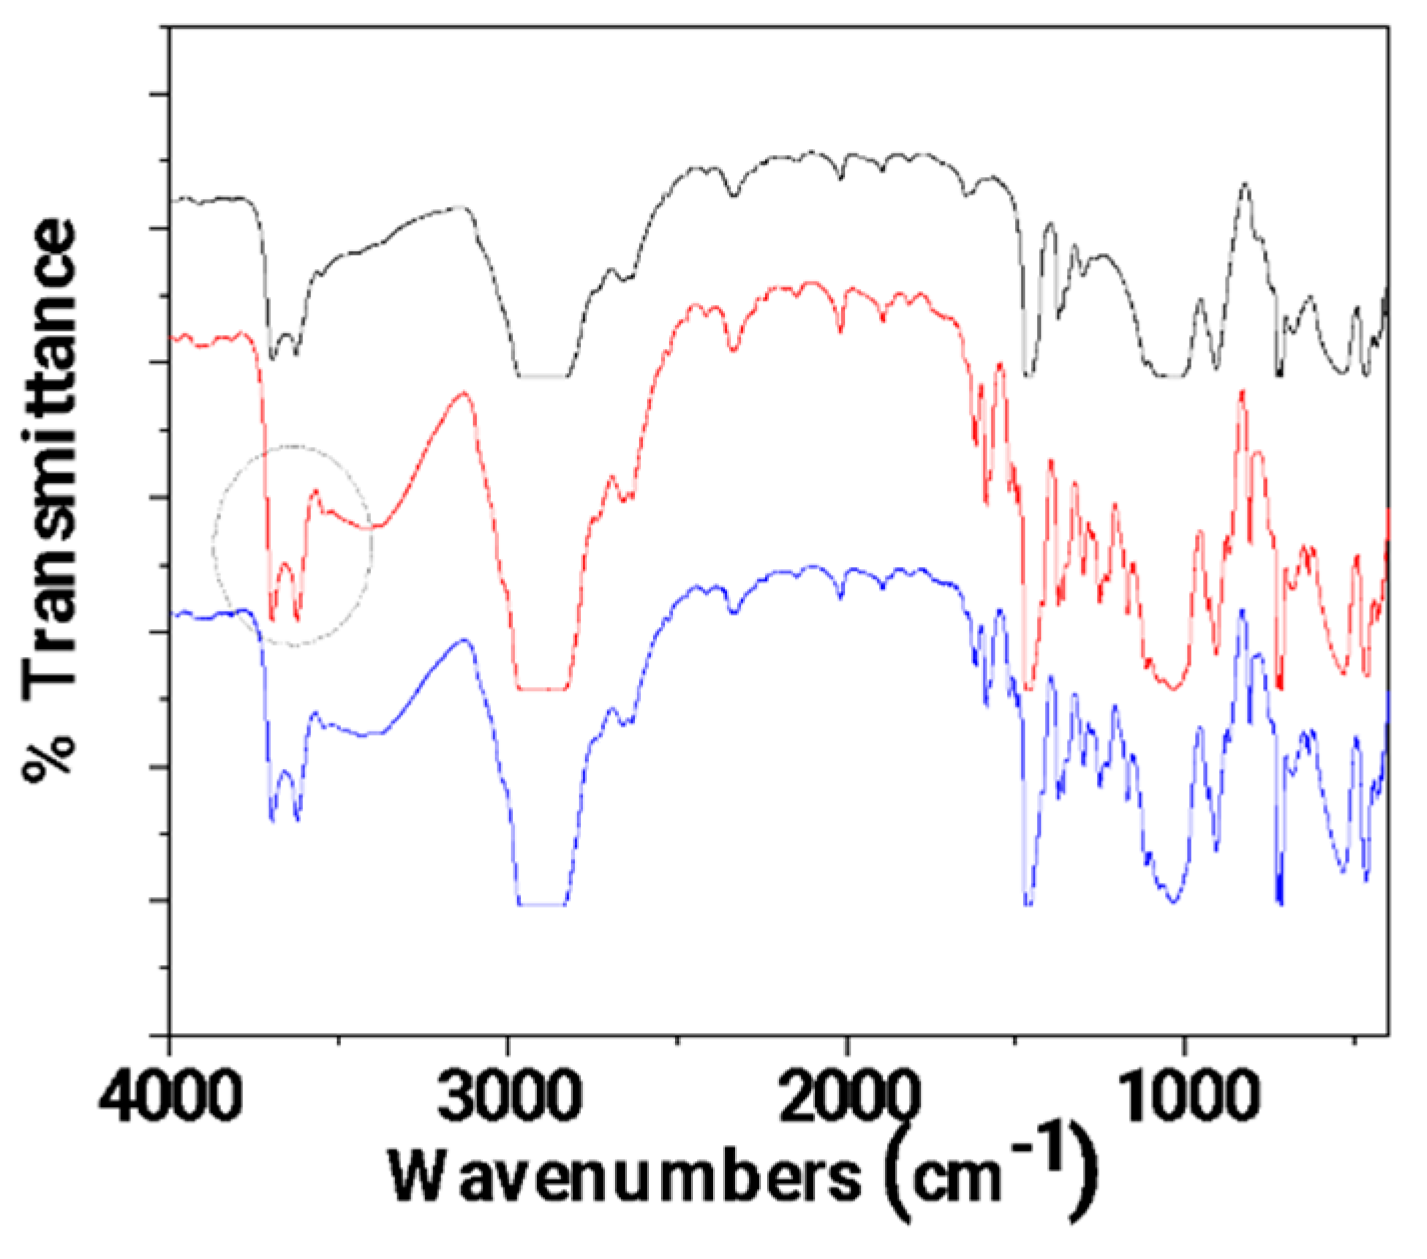
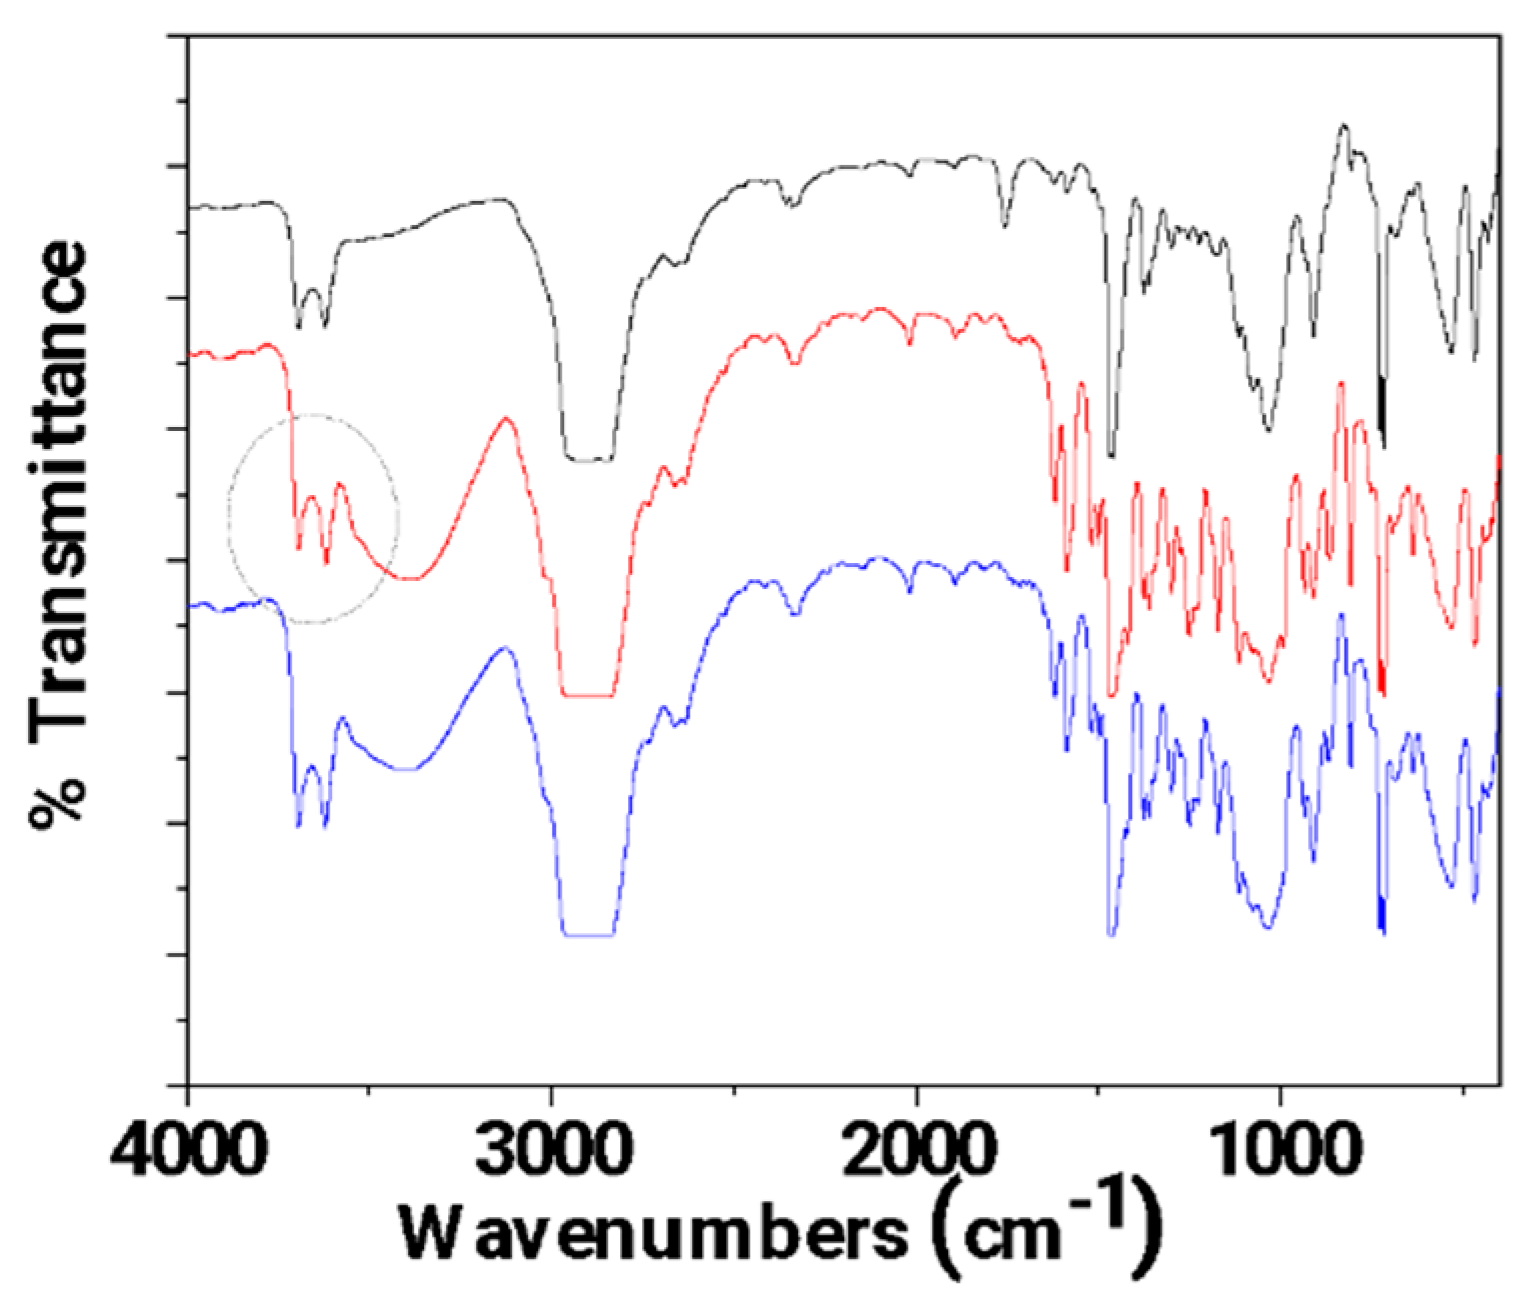

| LDPE(g) | HNT(g) | CV@HNT(g) | Twin extrusion process time (min) -speed (rpm) |
Corona treatment process time (sec) |
CV (μl) | |
|---|---|---|---|---|---|---|
| LDPE | 4.5 | - | - | 3-100 | - | - |
| LDPE/10HNT | 4.5 | 0.5 | - | 3-100 | - | - |
| LDPE/10CV@HNT | 4.5 | - | 0.5 | 3-100 | - | - |
| un-LDPE_CV | 4.5 | - | - | 3-100 | - | 100 |
| un-LDPE/10HNT_CV | 4.5 | 0.5 | - | 3-100 | - | 100 |
| un-LDPE/10CV@HNT_CV | 4.5 | - | 0.5 | 3-100 | - | 100 |
| tr-LDPE_CV | 4.5 | - | - | 3-100 | 30 | 100 |
| tr-LDPE/10HNT_CV | 4.5 | 0.5 | - | 3-100 | 30 | 100 |
| tr-LDPE/10CV@HNT_CV | 4.5 | - | 0.5 | 3-100 | 30 | 100 |
Disclaimer/Publisher’s Note: The statements, opinions and data contained in all publications are solely those of the individual author(s) and contributor(s) and not of MDPI and/or the editor(s). MDPI and/or the editor(s) disclaim responsibility for any injury to people or property resulting from any ideas, methods, instructions or products referred to in the content. |
© 2024 by the authors. Licensee MDPI, Basel, Switzerland. This article is an open access article distributed under the terms and conditions of the Creative Commons Attribution (CC BY) license (http://creativecommons.org/licenses/by/4.0/).


