Submitted:
26 May 2024
Posted:
27 May 2024
You are already at the latest version
Abstract
Keywords:
1. Introduction
2. Results
2.1. Continuous Phase Transitions in 6-Fold Symmetry Systems: The Ramsey Approach
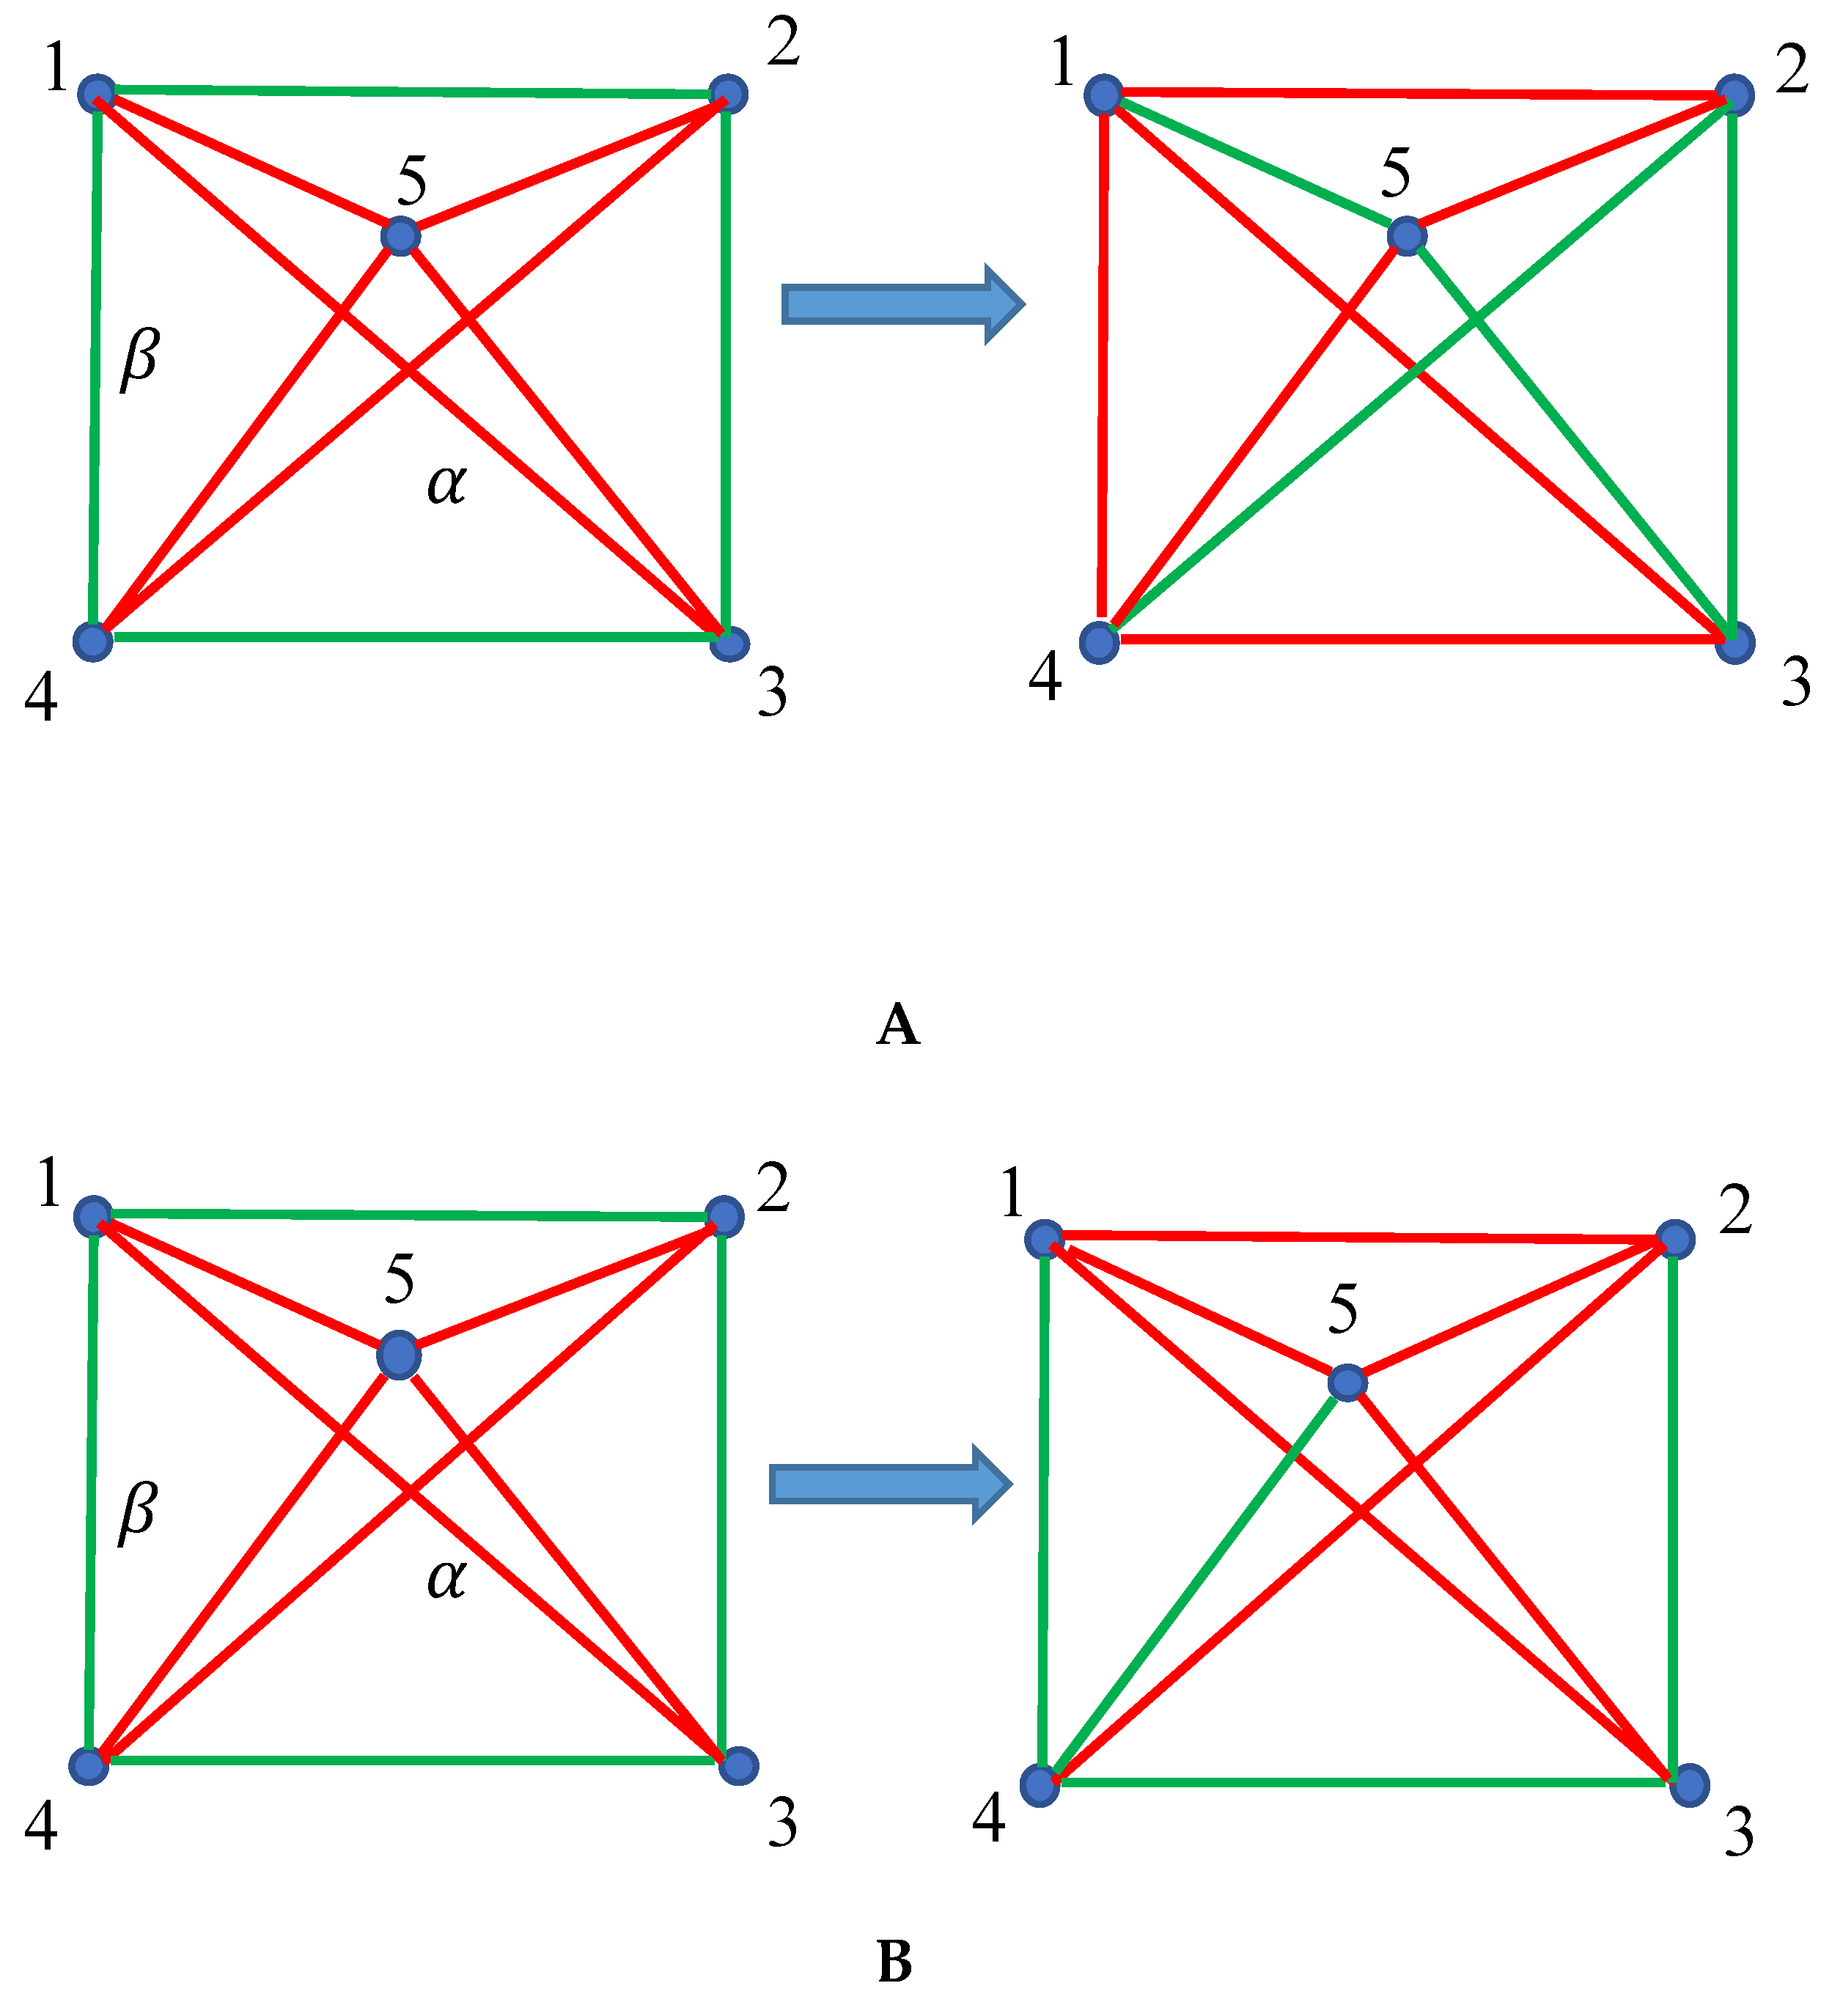
2.2. Continuous Phase Transitions in the Four-Fold Symmetry Systems: The Ramsey Approach
3. Discussion
5. Conclusions
Author Contributions
Funding
Institutional Review Board Statement
Informed Consent Statement
Data Availability Statement
Acknowledgments
Conflicts of Interest
References
- Ehrenfest, P. Phasenumwandlungen im ueblichen und erweiterten Sinn, classifiziert nach dem entsprechenden Singularitaeten des thermodynamischen Potentiales. Verhandlingen der Koninklijke Akademie van Wetenschappen (Amsterdam), Communications from the Physical Laboratory of the University of Leiden, 1993, Supplement No. 75b, 36, 153-157.
- Jaeger G. The Ehrenfest Classification of Phase Transitions: Introduction and Evolution, Archive for History of Exact Sciences 1998, 53 (1), 51-81.
- Schmelzer, J. W. P.; Gokhman, A. R.; Fokin, V. F. Dynamics of first-order phase transitions in multicomponent systems: a new theoretical approach. J. Colloid & Interface Sci. 2004, 272 (1), 109-133.
- Schmelzer, J. W. P.; Abyzov, A. S. Generalized Gibbs’ approach to the thermodynamics of heterogeneous systems and the kinetics of first-order phase transitions. J. Engin. Thermophys. 2007, 16, 119–129.
- Schmelzer, J. W. P.; Abyzov, A. S. Crystallization of glass-forming liquids: Thermodynamic driving force, J. Non-Crystalline Solids, 2016, 449, 41-49.
- Abyzov, A. S.; Schmelzer, J. W. P. Nucleation versus spinodal decomposition in confined binary solutions, J. Chem. Physics 2007, 127, 114504.
- Baierlein, R. Thermal Physics, Cambridge University Press, 1999, Ch. 16, pp.408-409.
- Lifshitz, I. M. Kinetics of Ordering during Second-Order Phase Transitions, J. Exptl. Theoret. Phys. (U.S.S.R.) 1962, 42, 1354-1359.
- Yukhnovskii, I. R. Phase Transitions of the Second Order. Collective Variables Method, World Scientific, Singapore, 1987.
- Franko, V.; Conde, A. Scaling laws for the magnetocaloric effect in second order phase transitions: From physics to applications for the characterization of materials, Int. J. Refrigeration, 2010, 33 (3), 465-473.
- Heffern, E. F. W.; Huelskamp, H.; Sonya, S.; Inglis, R. F. Phase transitions in biology: from bird flocks to population dynamics, Proc. R. Soc. B. 2021, 288, 1111.
- Ramsey, F. P. On a Problem of Formal Logic. In: Gessel, I., Rota, GC. (eds) Classic Papers in Combinatorics. Modern Birkhäuser Classics. Birkhäuser Boston 2009, pp. 264-286.
- Graham, R. L.; Rothschild, B. L.; Spencer, J. H. Ramsey theory, 2nd ed., Wiley-Interscience Series in Discrete Mathematics and Optimization, John Wiley & Sons, Inc., New York, A Wiley-Interscience Publication, 1990, pp. 10-110.
- Di Nasso, M.; Goldbring, I.; Lupini M. Nonstandard Methods in Combinatorial Number Theory, Lecture Notes in Mathematics, vol. 2239, Springer-Verlag, Berlin, 2019.
- Katz, M.; Reimann, J. Introduction to Ramsey Theory: Fast Functions, Infinity, and Metamathematics, Student Mathematical Library Volume: 87; 2018; pp. 1-34.
- Shvalb, N.; Frenkel, M.; Shoval, S.; Bormashenko, Ed. A Note on the Geometry of Closed Loops, Mathematics, 2023, 1960, 11(8).
- Wouters, J.; Giotis, A.; Kang, R.; Schuricht D., Fritz, L. Lower bounds for Ramsey numbers as a statistical physics problem. J. Stat. Mech. 2022, 2022, 0332.
- Shvalb, N.; Frenkel, M.; Shoval, Sh.; Bormashenko Ed. Ramsey theory and thermodynamics, Heliyon 2023, 9 (2), e13561.
- Zhang, F.; Wu, Q.; Wang, X.; Liu, N.; Yang, J.; Hu, Y.; Yu, L.; Wang, X.; Hu, Z.; Zhu, J. 6-Fold-Symmetrical AlN Hierarchical Nanostructures: Synthesis and Field-Emission Properties. J. Phys. Chem. C 2009, 113 (10), 4053–4058.
- Lee, C-H.; Schiros, T.; Santos, E, J.G.; Kim, B.; Yager, K. G.; Kang, S. J.; Lee, S.; Yu, J.; Watanabe, K.; Taniguchi, T.; Hone, J.; Kaxiras, E.; Nuckolls, C.; Kim, P. Epitaxial Growth of Molecular Crystals on van der Waals Substrates for High-Performance Organic Electronics, Adv. Mat. 2014, 26 (18), 2812-2817.
- Talapin, D. V.; Shevchenko, E.V.; Murray, C. B.; Titov, A. V.; Král, P. Dipole−Dipole Interactions in Nanoparticle Superlattices. Nano Lett. 2007, 7 (5), 1213–1219.
- Li, D.; Chen, Q.; Chun, J.; Fichthorn, K.; De Yoreo, J.; Zheng, H. Nanoparticle Assembly and Oriented Attachment: Correlating Controlling Factors to the Resulting Structures, Chem. Rev. 2023, 123 (6), 3127–3159.
- Hendley, R. S.; Zhang, L.; Bevan, M.A. Design rules for 2D field mediated assembly of different shaped colloids into diverse microstructures, Soft Matter 2022, 48, 9273–9282.
- Han, K. Electric and Magnetic Field-Driven Dynamic Structuring for Smart Functional Devices, Micromachines 2023, 14(3), 661.
- Shvalb, N.; Frenkel, M.; Shoval, Sh.; Bormashenko Ed. Universe as a Graph (Ramsey Approach to Analysis of Physical Systems), World J. Physics, 2023, 1(1), 1-24.
- Leko, V. K. Regularities and Peculiarities in the Crystallization Kinetics of Silica Glasses, in the: Glass: Selected Properies and Crystallization; ed. by J. W. P. Schmelzer, de Gruyter, Berlin, Ge, 2014.
- N. Shvalb, M. Frenkel, Sh. Shoval, Ed. Bormashenko Ed. Dynamic Ramsey Theory of Mechanical Systems Forming a Complete Graph and Vibrations of Cyclic Compounds, Dynamics 2023, 3(2), 272-281.
- Landau, L.D.; Lifshitz, E.M. Statistical Physics, 3rd ed.; Course of Theoretical Physics; Elsevier: Oxford, UK, 2011; Volume 5.
- Diamantini, M. C. Landauer Bound and Continuous Phase Transitions, Entropy, 2023, 25(7), 984.
- Astrakharchik, G. E.; Boronat, J.; Kurbakov, I.L.; Lozovik, Yu. E. Quantum Phase Transition in a Two-Dimensional System of Dipoles, Phys. Rev. Lett. 2007, 98, 060405.
- Israelachvili, J. N. Intermolecular and Surface Forces, 3rd Ed., Academic Press, Amsterdam, Netherlands, 2011.
- Janssen, T. The Magnetic Structure of an FCC. Spin Lattice System with Ex-change and Dipolar Interactions. Phys. kondens. Materie 1972, 15, 142-157.
- Siddharthan, R.; Shastry, B. S.; Ramirez, A. P.; Hayashi, A.; Cava, R. J.; Rosenkranz, S. Ising Pyrochlore Magnets: Low-Temperature Properties, “Ice Rules,” and Beyond, Phys. Rev. Lett. 1999, 83, 1854.
- Melko, R. G.; den Hertog, B. C.; Gingras, M. J.P. Long-Range Order at Low Temperatures in Dipolar Spin Ice. Phys. Rev. Lett. 2001, 87, 067203.
- Ruff, J. P.C; Melko, R. G.; Gingras, M, J, P. Finite-Temperature Transitions in Dipolar Spin Ice in a Large Magnetic Field, Phys. Rev. Lett. 2005, 95, 097202.
- Khan, N.; Prishchenko, D.; Skourski, Y.; Mazurenko, V. G.; Tsirlin, A. A. Cubic symmetry and magnetic frustration on the fcc spin lattice in K2IrCl6, Phys. Rev. B, 2019, 99, 144425.
- Axilrod, B. M. Triple-Dipole Interaction. II. Cohesion in Crystals of the Rare Gases, J. Chem. Phys. 1951, 19, 724.
- Singh, A. N.; Dyre, J. C.; Pedersen U. R. Solid–liquid coexistence of neon, argon, krypton, and xenon studied by simulations. J. Chem. Phys. 2021, 154, 134501.
- Ovshinsky, S. R. Reversible electrical switching phenomena in disordered structures, Phys. Rev. Lett. 1968, 21 (20), 1450–1453.
- Pirovano, A.; Lacaita, A. L.; Benvenuti, A.; Pellizzer, F.; Bez, R. Electronic Switching in Phase-Change Memories, IEEE Transact. Electron Devices, 2004, 51 (3), 452-458.
- Wuttig, M.; Yamada, N. Phase-change materials for rewriteable data storage, Nature Mater. 2007, 6, 824–832.
- Pries, J.; Cojocaru-Mirédin, O.; Wuttig, M. Phase-change materials: Empowered by an unconventional bonding Mechanism, MRS Bull. 2019, 44, 699–704.
- Zhang, H-Y.; Zhang, N.; Zhang, Y.; Jiang, H-H.; Zeng, Y-L.; Tang, S-Y.; Li, P-F.; Tang, Y-Y.; Xiong, R. G. Ferroelectric Phase Transition Driven by Switchable Covalent Bonds, Phys. Rev. Lett. 2023, 130, 176802.
- Liao, W-Q.; Zeng, Y-L.; Tang, Y-Y.; Xu, Y-Q.; Huang, X.-Y.; Lv, H-P.; Chen, X-G.; Xiong, R.-G. Dual Breaking of Molecular Orbitals and Spatial Symmetry in an Optically Controlled Ferroelectric. Adv. Mat. 2023, 35 (44), 2305471.
Disclaimer/Publisher’s Note: The statements, opinions and data contained in all publications are solely those of the individual author(s) and contributor(s) and not of MDPI and/or the editor(s). MDPI and/or the editor(s) disclaim responsibility for any injury to people or property resulting from any ideas, methods, instructions or products referred to in the content. |
© 2024 by the authors. Licensee MDPI, Basel, Switzerland. This article is an open access article distributed under the terms and conditions of the Creative Commons Attribution (CC BY) license (http://creativecommons.org/licenses/by/4.0/).


