1. Introduction
The world population is expected to continue growing, with the United Nations prjecting it to reach 9.7 billion by 2050 [
1]. The increase in population leads to higher food demand, necessitating the improvement of agricultural productivity to meet the needs sustainably. However, the global agricultural sector is facing challenges, including limited arable land, more severe natural disasters due to climate change, and labor constraints [
2]. Therefore, the advancement and deployment of novel technologies play a crucial role in enhancing agricultural production and securing long-term food sustainability. The incorporation of technology into agriculture is not a novel concept; however, in the contemporary digital era, technology is revolutionizing agriculture into “Smart Agriculture.” This new paradigm employs technologies like the Internet of Things (IoT) and Cloud Computing to swiftly gather data for analysis and to aid in decision-making. By utilizing information technology, sensors, robotics, and artificial intelligence, Smart Agriculture aims to elevate productivity, diminish costs, and mitigate risks [
3].
The key concept is to use data from various sources for real-time decision-making to optimize management. Improving production efficiency is therefore significant. Currently, smart farming technologies are employed in a variety of methods, including precision agriculture and automated farming systems [
4]. One of the principal technologies propelling smart agriculture, enhancing operational efficiency and productivity within the agricultural sector, is the Internet of Things (IoT). This technology facilitates the interconnection of diverse devices, enabling wireless data exchange across the network [
5].
IoT systems in agricultural applications often incorporate a variety of sensors to monitor environmental and critical parameters in real-time, including temperature, humidity, light intensity, pH, and electrical conductivity (EC) in soil or water. Data from these sensors are transmitted to cloud platforms where they are processed and displayed, enabling farmers to monitor conditions and make decisions remotely. Furthermore, IoT systems can automate control processes based on predefined conditions, such as irrigation when soil moisture levels are low, activating LED lights when natural light is insufficient, or adjusting the pH and EC of nutrient solutions to maintain optimal levels. For instance, in greenhouse farming, sensors monitor parameters like humidity, temperature, light intensity, and pH to ensure optimal growing conditions. Automated systems can control fans, artificial lighting, and irrigation based on sensor data to maintain the ideal environment for crops. This not only enhances crop growth but also reduces water and energy usage [
6,
7]. In hydroponic systems, IoT technologies are employed to monitor and control essential parameters such as water quality, temperature, humidity, and nutrient levels. Systems like iPONICS utilize a network of sensors and a fuzzy inference engine to automate irrigation and maintain optimal conditions, thereby improving crop yield and quality while minimizing manual intervention [
8]. These advancements illustrate how IoT-based systems enhance agricultural practices by providing precise control over environmental factors, leading to increased efficiency and productivity in farming.
Hydroponics is an increasingly significant technology in modern crop production, gaining popularity for its efficiency and sustainability. This method involves growing plants without soil by directly immersing their roots in water enriched with dissolved nutrients. The advantages of hydroponics include water conservation, precise control of fertilizer application according to plant needs, and high yields in limited spaces. It also mitigates issues related to soil-borne diseases, weeds, and chemical contamination [
9,
10]. Several methods exist for nutrient delivery in hydroponic systems, such as the Deep Flow Technique (DFT), which allows roots to be submerged in deep nutrient solutions. This system is particularly appealing due to its cost-effectiveness and ease of management [
11]. Consequently, hydroponic systems are a highly attractive option for urban farming and areas with soil and water limitations.
Chinese celery is a popular vegetable grown in hydroponic systems due to its short life cycle and quick returns. Chinese celery is highly nutritious, rich in vitamins, minerals, and antioxidants [
12]. It is a key ingredient in many dishes, resulting in high market demand. However, traditional cultivation of Chinese celery is quite challenging because it is sensitive to environmental conditions and certain plant diseases. Growing in hydroponic systems can mitigate these problems, but achieving high and consistent yields still requires proper control and management of the growing environment.
Therefore, the researchers have developed an IoT-controlled hydroponic system for cultivating Chinese celery. The objective of this intelligent hydroponic system is to enhance yield and quality while reducing resource usage and labor. The hydroponic greenhouse is equipped with sensors to measure temperature, humidity, water temperature, pH, and EC levels. These sensors are connected to a control unit consisting of a NodeMCU ESP32 microcontroller and relay modules, which control various devices according to predefined conditions. For example, a misting system adjusts the temperature when it exceeds a set threshold, and full-spectrum lighting extends the photosynthesis period. Sensor data is transmitted, stored, and displayed in real-time on the Blynk application, allowing users to configure settings, control operations, and receive notifications via smartphone. The researchers will test the system in a prototype greenhouse, comparing the growth of the produce by measuring the height and weight of the plants, and analyzing the cost-effectiveness of the control system. The results are expected to demonstrate the development of a smart hydroponic system prototype for Chinese celery that achieves high production efficiency, optimizes resource use, and has commercial viability. This approach aims to elevate crop production to a sustainable modern agricultural practice.
2. Literature review
The integration of IoT technology into agricultural practices has led to significant advancements in smart farming and hydroponic systems. With the increasing global population and the consequent rise in food demand, traditional farming methods face numerous challenges such as land and water scarcity, soil degradation, and climate change. This literature review explores various IoT-based solutions for smart farming, focusing on hydroponic systems designed for indoor and vertical farming, their benefits, challenges, and the potential for enhancing crop yield and quality.
Kaur et al. (2023) [
13]. Discusses the design and implementation of an IoT-enabled smart vertical farming system using hydroponic Deep Flow Technique (DFT). The study compares plant growth parameters such as height, leaf length, and weight in controlled and uncontrolled environments, demonstrating that the IoT-based system significantly improves plant growth and nutrient content compared to traditional methods. The study found that the live weight under the automatic system was 58.66 grams, while under the manual system, it was 48.81 grams.
Nikolov et al. (2023) [
14]. Presents a small-scale hydroponic system for indoor farming of leafy vegetables, emphasizing the use of low-cost materials and sensors for remote monitoring and automation. The study that a small hydroponic system maintained optimal air temperature, humidity, and pH levels for growing lettuce, highlighting its simplicity and ease of management for small and medium-sized growers.
Víctor et al. (2022) [
15]. Combine aquaculture and hydroponics, providing a sustainable agricultural method that reduces resource usage and waste. Their study investigates the early production and quality of strawberries in aquaponic systems using commercial hydroponic bands, coupled with tench fish production. Prior research highlights the potential of aquaponics for efficient resource use but lacks specific studies on strawberry performance and fruit quality. The choice of substrate, such as rockwool or bare roots, and the type of fish species are crucial factors influencing the system’s efficiency and profitability. This research aims to fill these gaps by comparing substrate effects on strawberry yield and quality within an aquaponic framework.
Cambra et al. (2018) [
16]. Developed a smart system for controlling bicarbonate levels in irrigation, aimed at enhancing hydroponic precision farming. The system features an auto-calibrated pH sensor network that continuously monitors and adjusts the pH levels in nutrient solutions to maintain optimal conditions for plant growth. Previous research underscores the critical role of water quality in hydroponic systems and highlights the advantages of using wireless sensor networks (WSN) for real-time monitoring and management in precision agriculture. This study addresses existing challenges such as false data acquisition and environmental sustainability by integrating advanced sensor technology with intelligent decision-making algorithms to optimize irrigation practices and improve crop quality and yield.
Cruz et al. (2022) [
17]. Investigates the use of edge computing and IoT for smart strawberry farming. Their study addresses the challenges of disease and pest control in strawberry cultivation by developing an IoT platform that integrates wireless sensor networks (WSN), computer vision (CV), and machine learning (ML). The platform monitors environmental conditions and detects seven common strawberry diseases using the Yolo v5 model, achieving 92% accuracy. Prior research has highlighted the benefits of IoT in precision agriculture, such as improved crop management and resource efficiency.
3. Materials and Methods
The design of a smart farm incorporates an open control system utilizing Internet of Things (IoT) technology, specifically directed towards the cultivation of celery. This research project is supported by JMV Systems & Consulting Co., Ltd., which facilitates the development of a prototype Smart Farm system engineered to autonomously regulate cultivation factors. The primary objective is to conduct a comprehensive study of various factors influencing the expedited and high-quality growth of celery.
3.1. Materials and Equipment
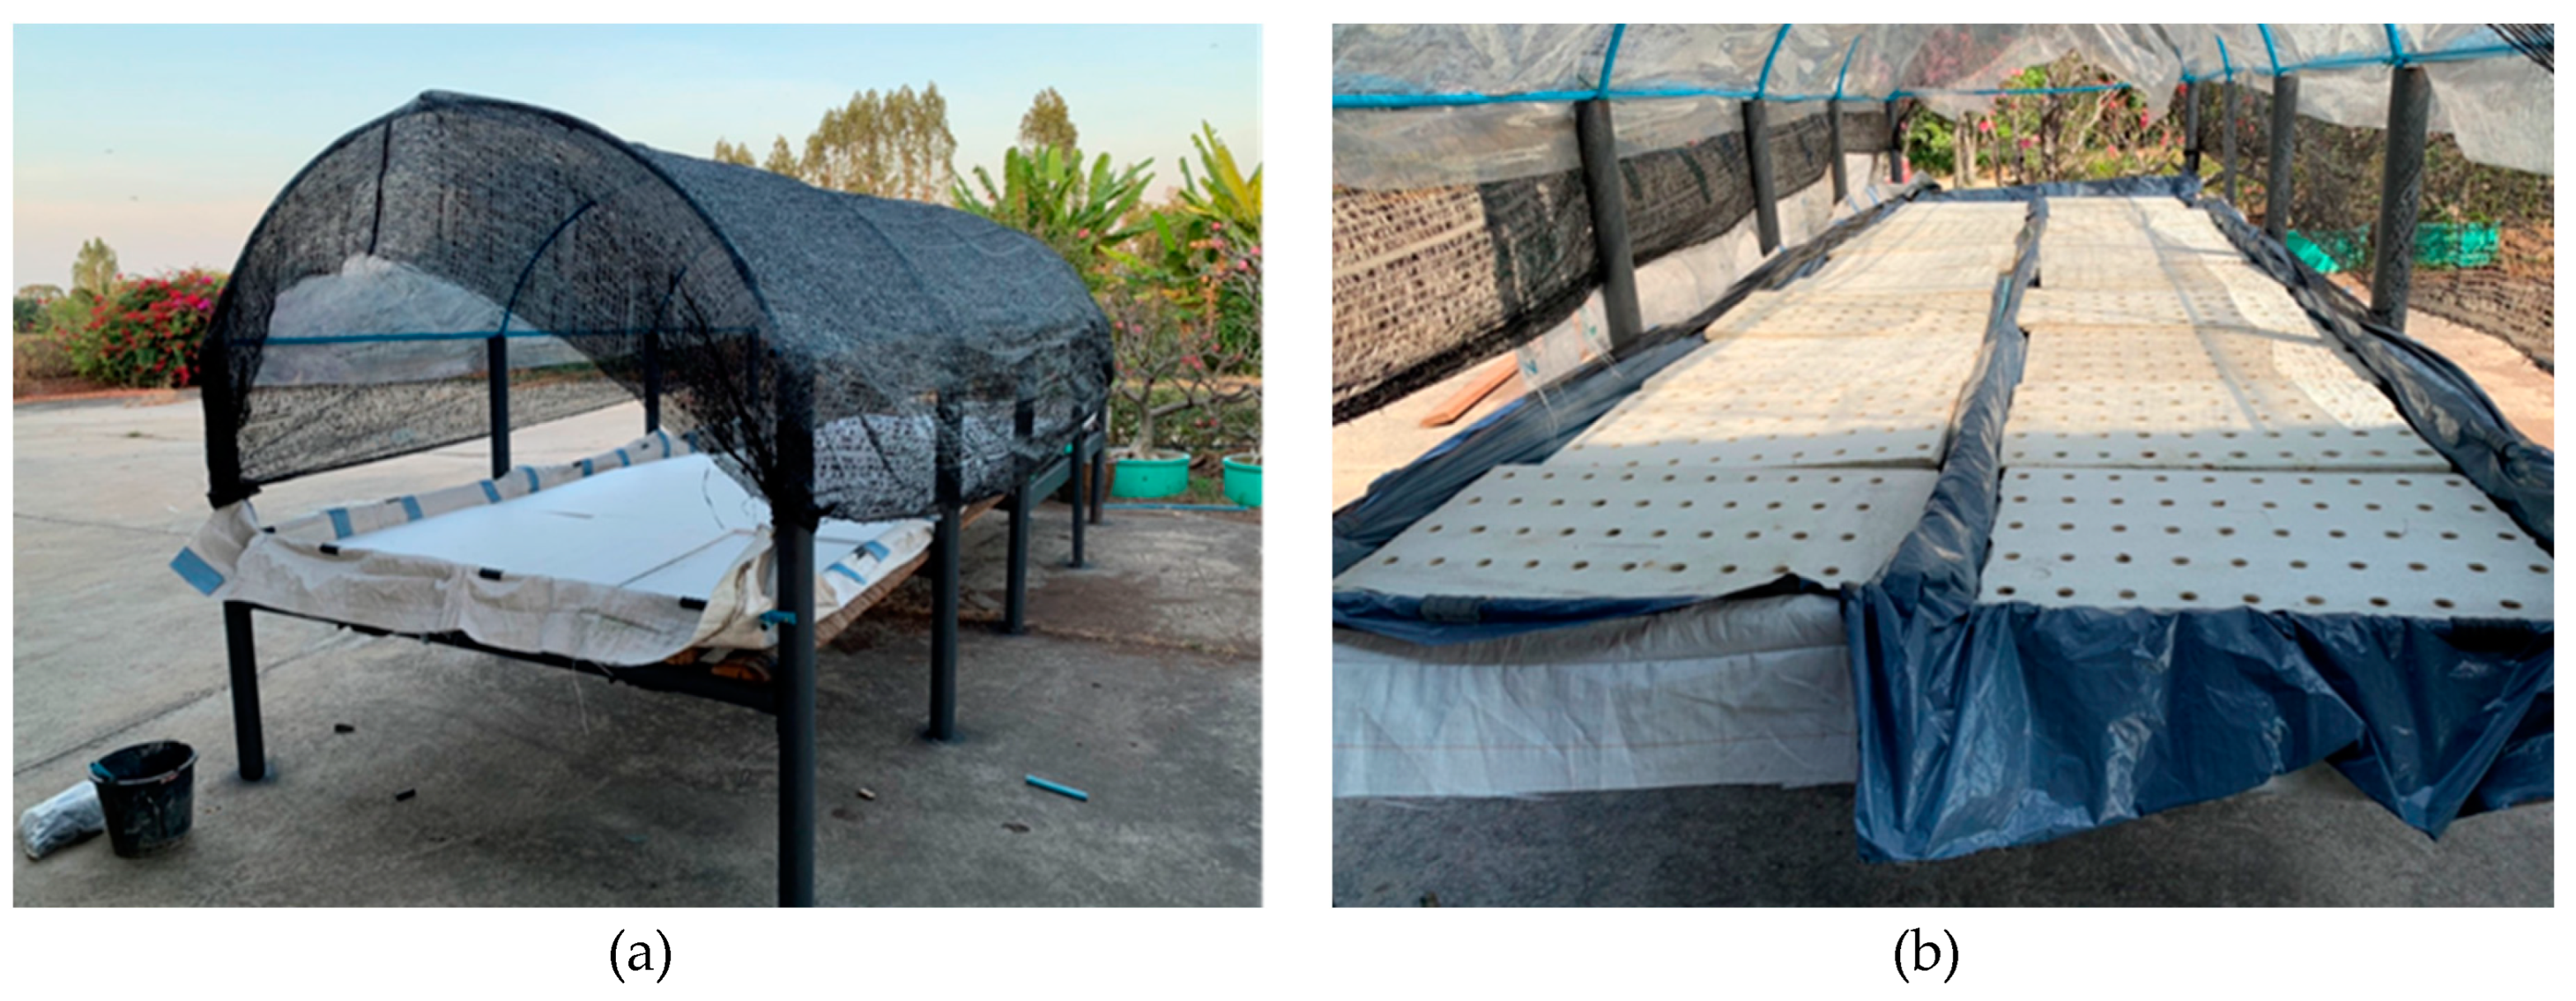
The proposed system will utilize an open greenhouse structure for deep water hydroponic cultivation, measuring 2 meters in width, 6 meters in length, with a growing shelf height of approximately 1.2 meters. The distance from the floor to the roof is approximately 2 meters, allowing the greenhouse to accommodate the cultivation of approximately 800 to 1,000 celery plants per greenhouse, as illustrated in
Figure 1, in the cultivation process, foam trays with approximately 50 planting holes per tray are employed. Once the celery seedlings cultivated in the greenhouse reach an age of approximately 21 days, they undergo a transplanting process to the designated greenhouse. A total of 4 greenhouses will be used for study.
The four cultivation greenhouses will be equipped with different sets of devices and sensors. The equipment used will include the following:
pH sensor, range: 0-14pH (h-101 pH electrode).
Electrical conductivity (EC) range: 0-4400us/cm.
Temperature and humidity sensor.
Waterproof DS18B20 digital temperature water sensor.
ESP32 microcontroller.
LED grow light 3250K LEDs and 660nm red spectrum, AC 220 volts.
Misting Nozzle
Electronic device for the installation of electrical equipment.
3.1. System and Calibration
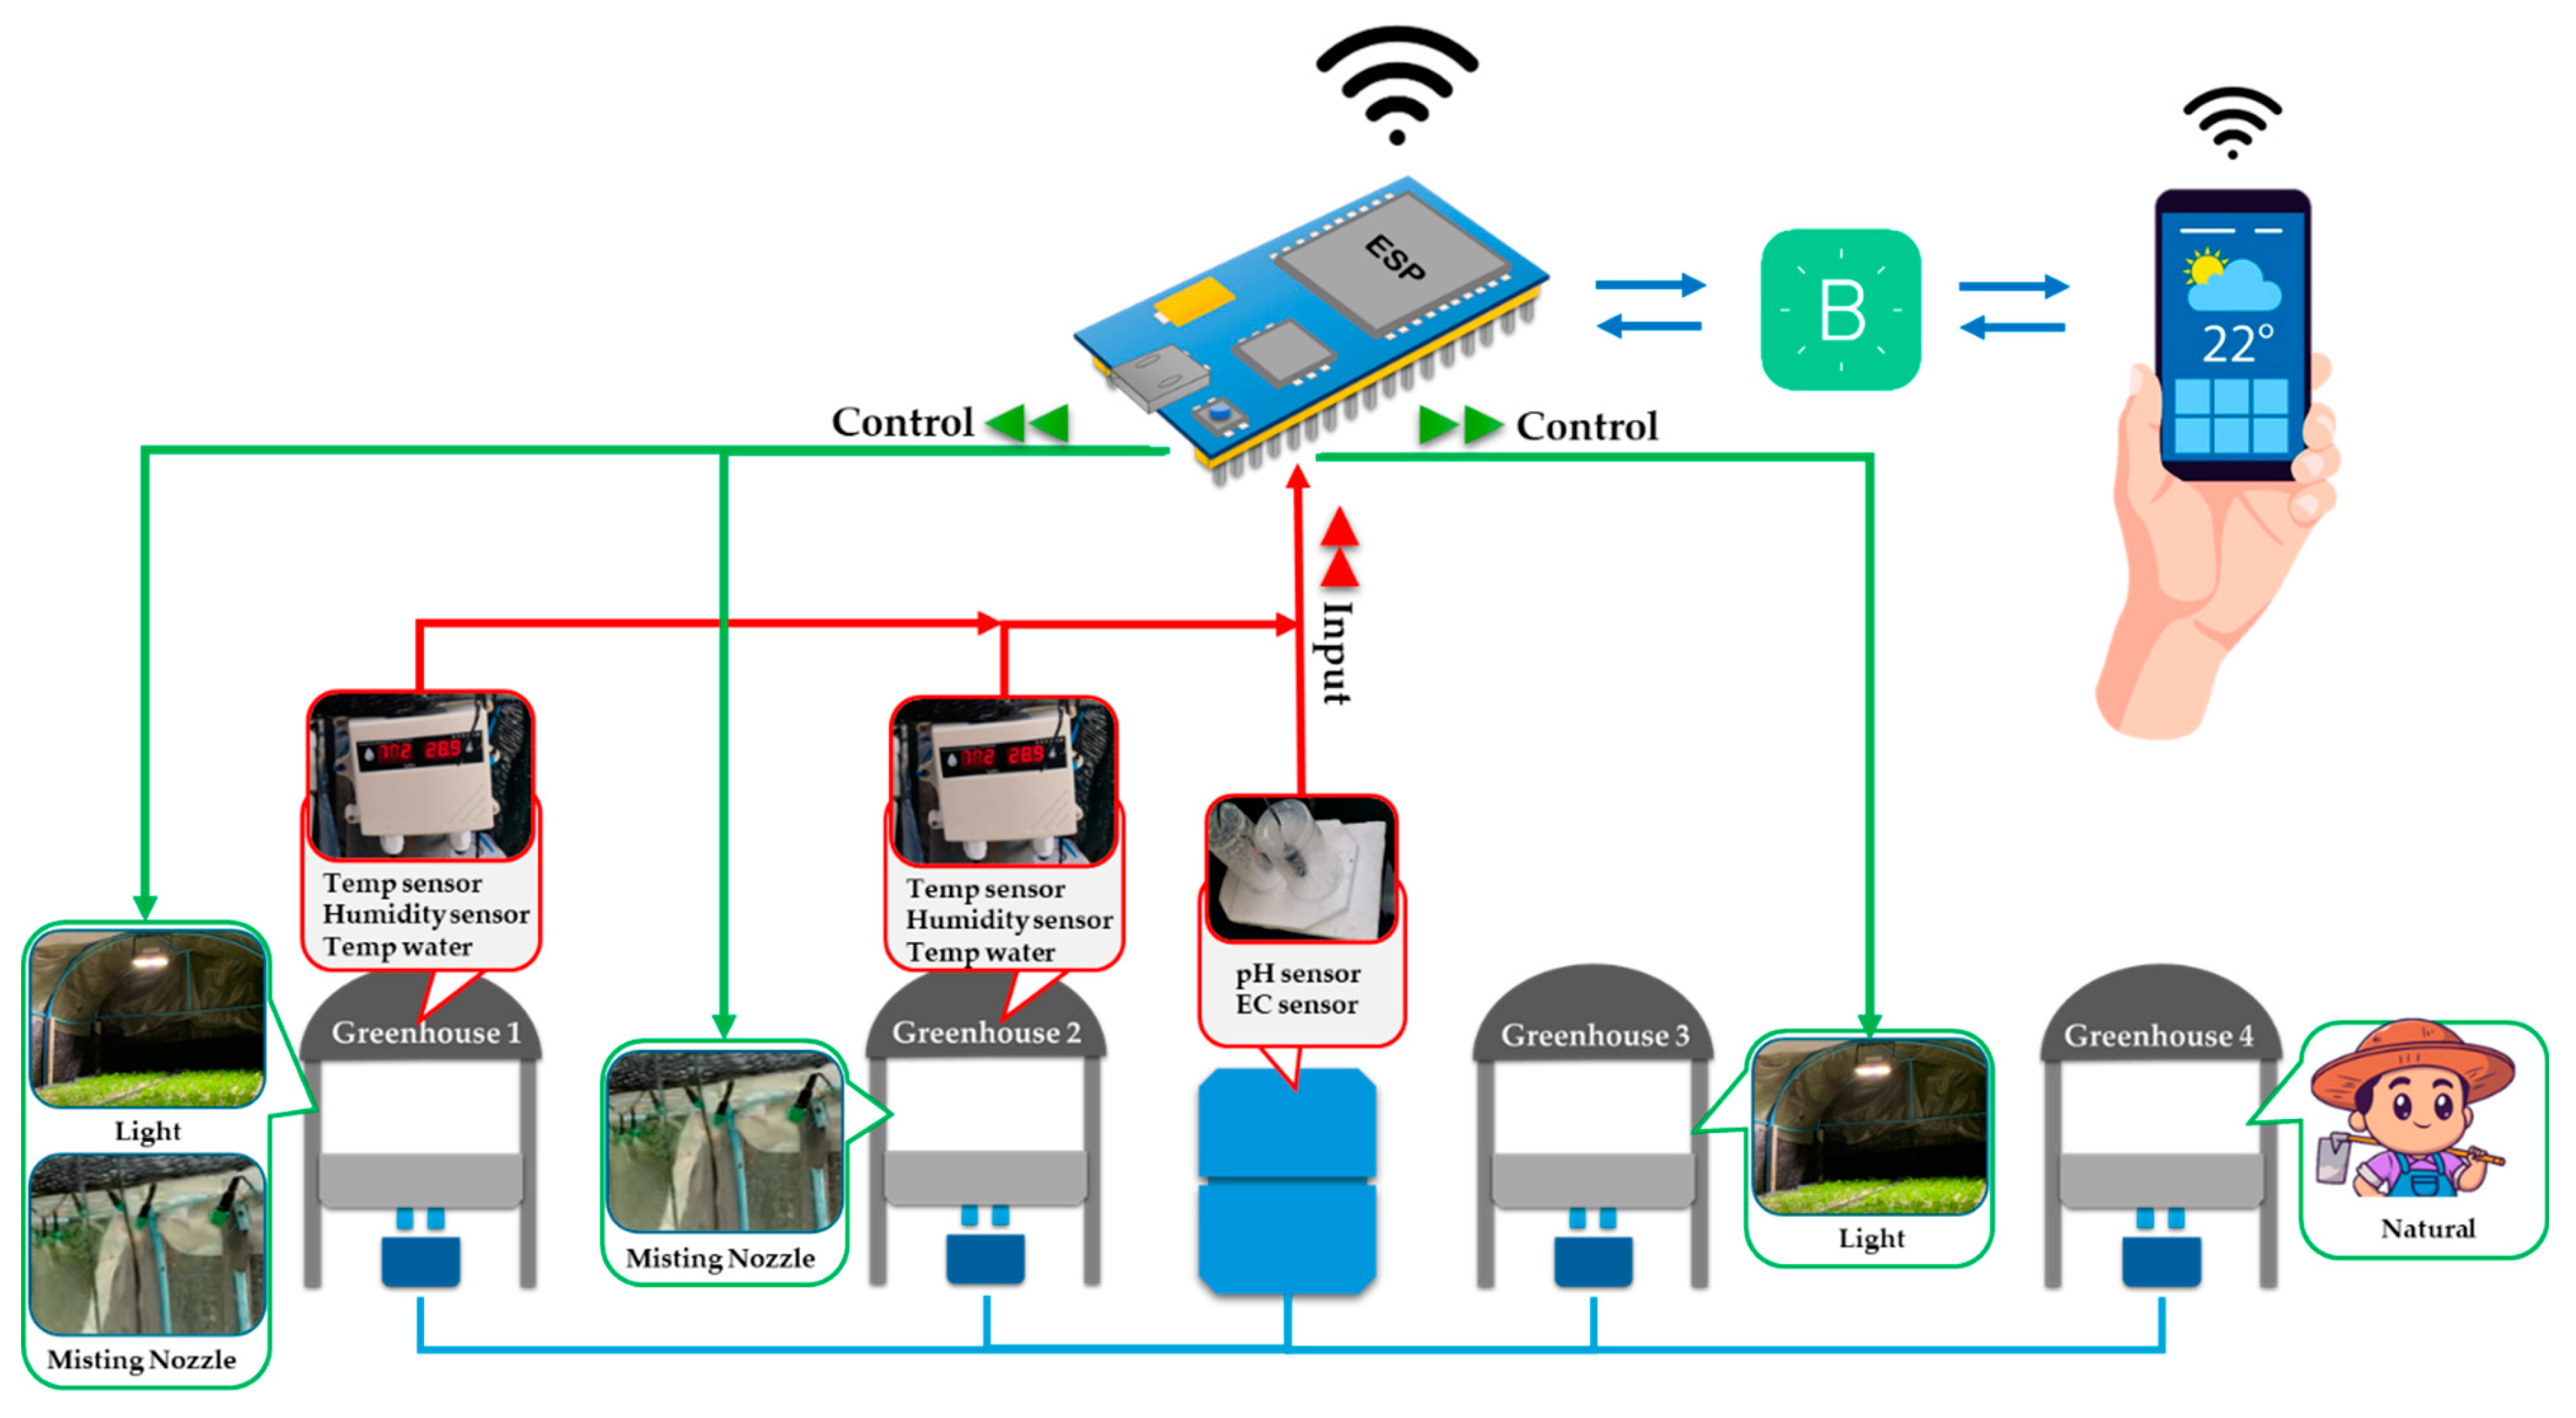
The measurement system will be pivotal in the automated data collection and con-trol of equipment within these greenhouses, operated through an ESP32. Data is collected and managed via the Blynk IoT platform, allowing users to access information or control operations remotely through a dashboard, as illustrated in
Figure 2.
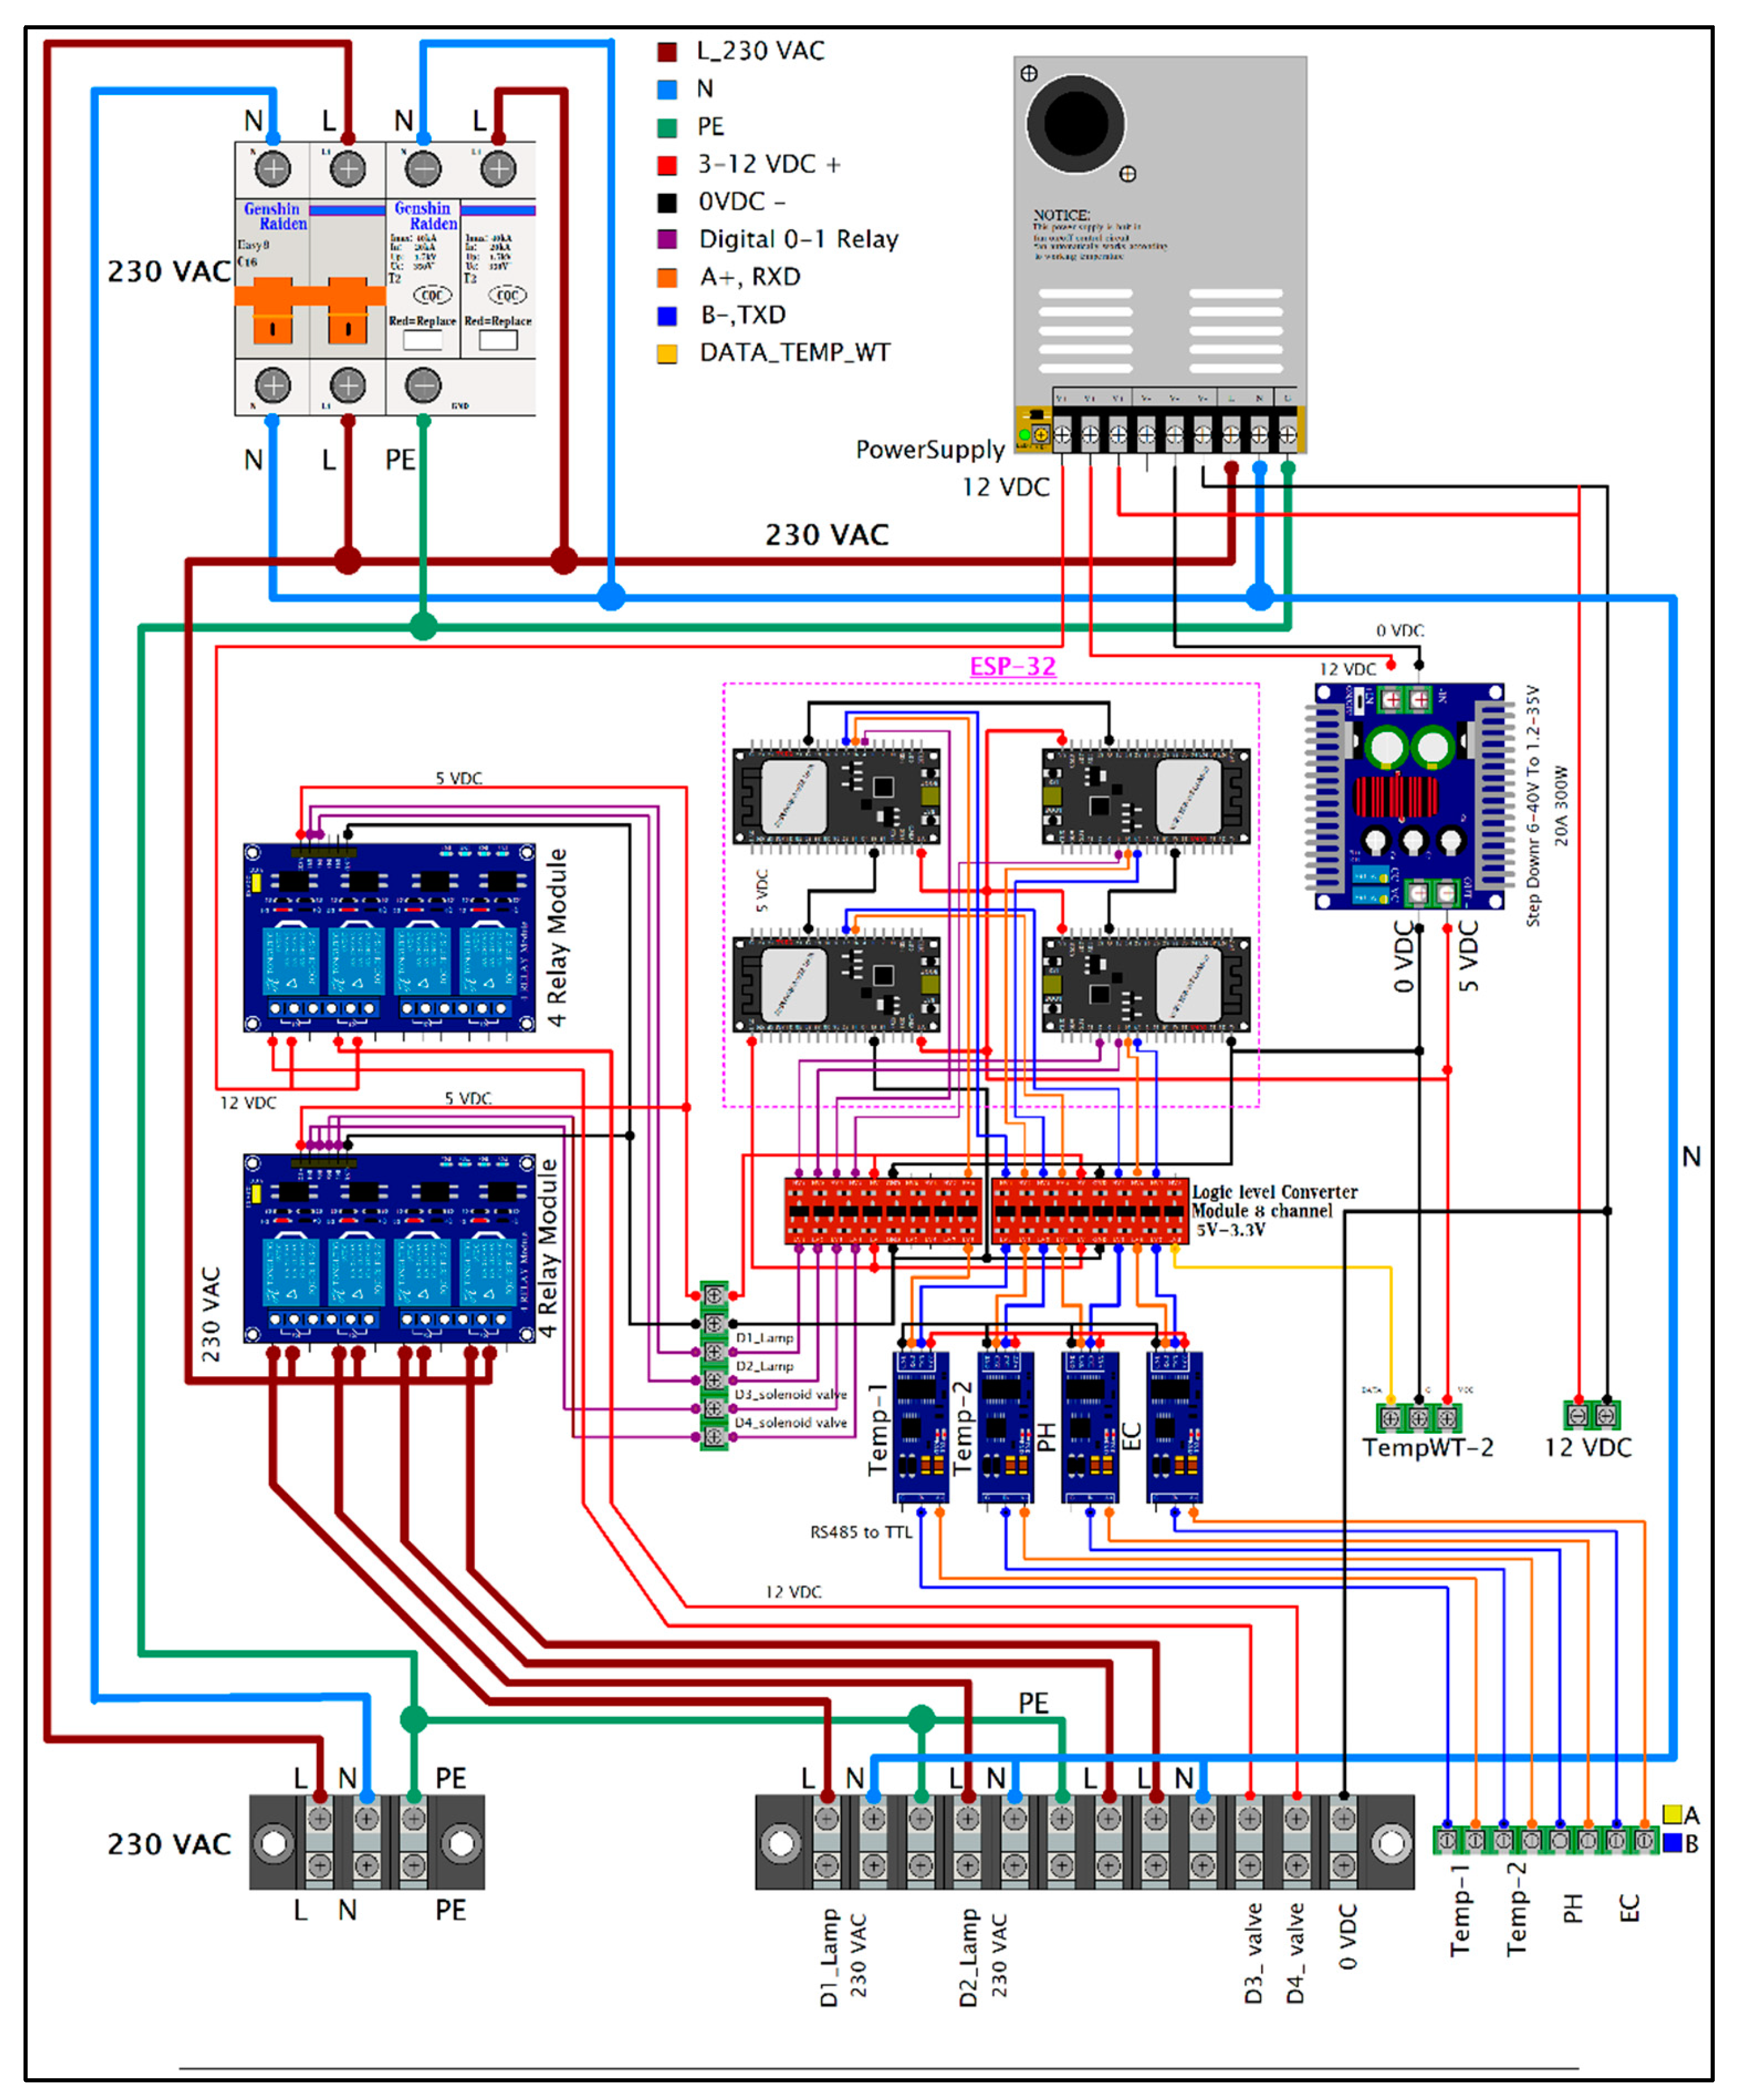
Figure 3 illustrates the control circuit diagram of an IoT system for three hydroponic greenhouses using an ESP32 microcontroller as the main processing unit. The ESP32 receives data from various sensors, including temperature and humidity sensors (Temp/Humidity), water temperature sensors (DS18B20), electrical conductivity sensors (EC), and pH sensors, via MAX485 modules that use RS-485 communication to reduce signal interference and increase signal transmission distance. The ESP32 processes the received data and sends control signals to different devices through relays, powered by a 12VDC power supply with a 12VDC battery backup to ensure continuous system operation. The controlled devices include water pumps, which are switched on and off via 4-channel relays; fog nozzles, controlled by 2-channel relays; and LED lighting systems, managed by 4-channel relays.
Furthermore, the ESP32 is connected to an onboard WiFi module, enabling data transmission to cloud systems like the Blynk IoT platform and allowing convenient system control through mobile applications. All these features contribute to a highly efficient hydroponic greenhouse control system that can optimize environmental conditions for Chinese celery growth and significantly increase yield.
The ESP32 microcontroller acts as the central processing unit, receiving sensor data, analyzing it, and sending appropriate control signals to various actuators. The use of MAX485 modules for RS-485 communication ensures reliable data transmission over longer distances while minimizing signal interference. The incorporation of relays allows the ESP32 to control high-power devices, such as water pumps, fog nozzles, and LED lights, using a 12VDC power supply and a backup battery for uninterrupted operation.
The integration of WiFi connectivity enables the ESP32 to send real-time data to cloud platforms, such as Blynk IoT, and allows users to monitor and control the system remotely through user-friendly mobile applications. This IoT-based approach enhances the overall efficiency of the hydroponic greenhouse control system, enabling precise regulation of environmental factors to promote optimal Chinese celery growth and boost productivity.
Figure 3.
Overview of the control circuits for the 3 greenhouses based on specified factors using ESP32.
Figure 3.
Overview of the control circuits for the 3 greenhouses based on specified factors using ESP32.
Overview of the IoT-based greenhouse control system utilizing the ESP32 microcontroller. The system integrates various sensors and actuators to monitor and manage environmental conditions across multiple greenhouses, with data transmission and control facilitated via the Blynk platform. In the pursuit of diverse factors, three of the greenhouses will be equipped with measurement and control systems for comparative analysis with the fourth greenhouse will be maintained under natural conditions.
ESP32 Module: The central microcontroller responsible for coordinating data collection from various sensors and executing control commands for actuators. It communicates with the Blynk platform to enable remote monitoring and control through a user-friendly dashboard.
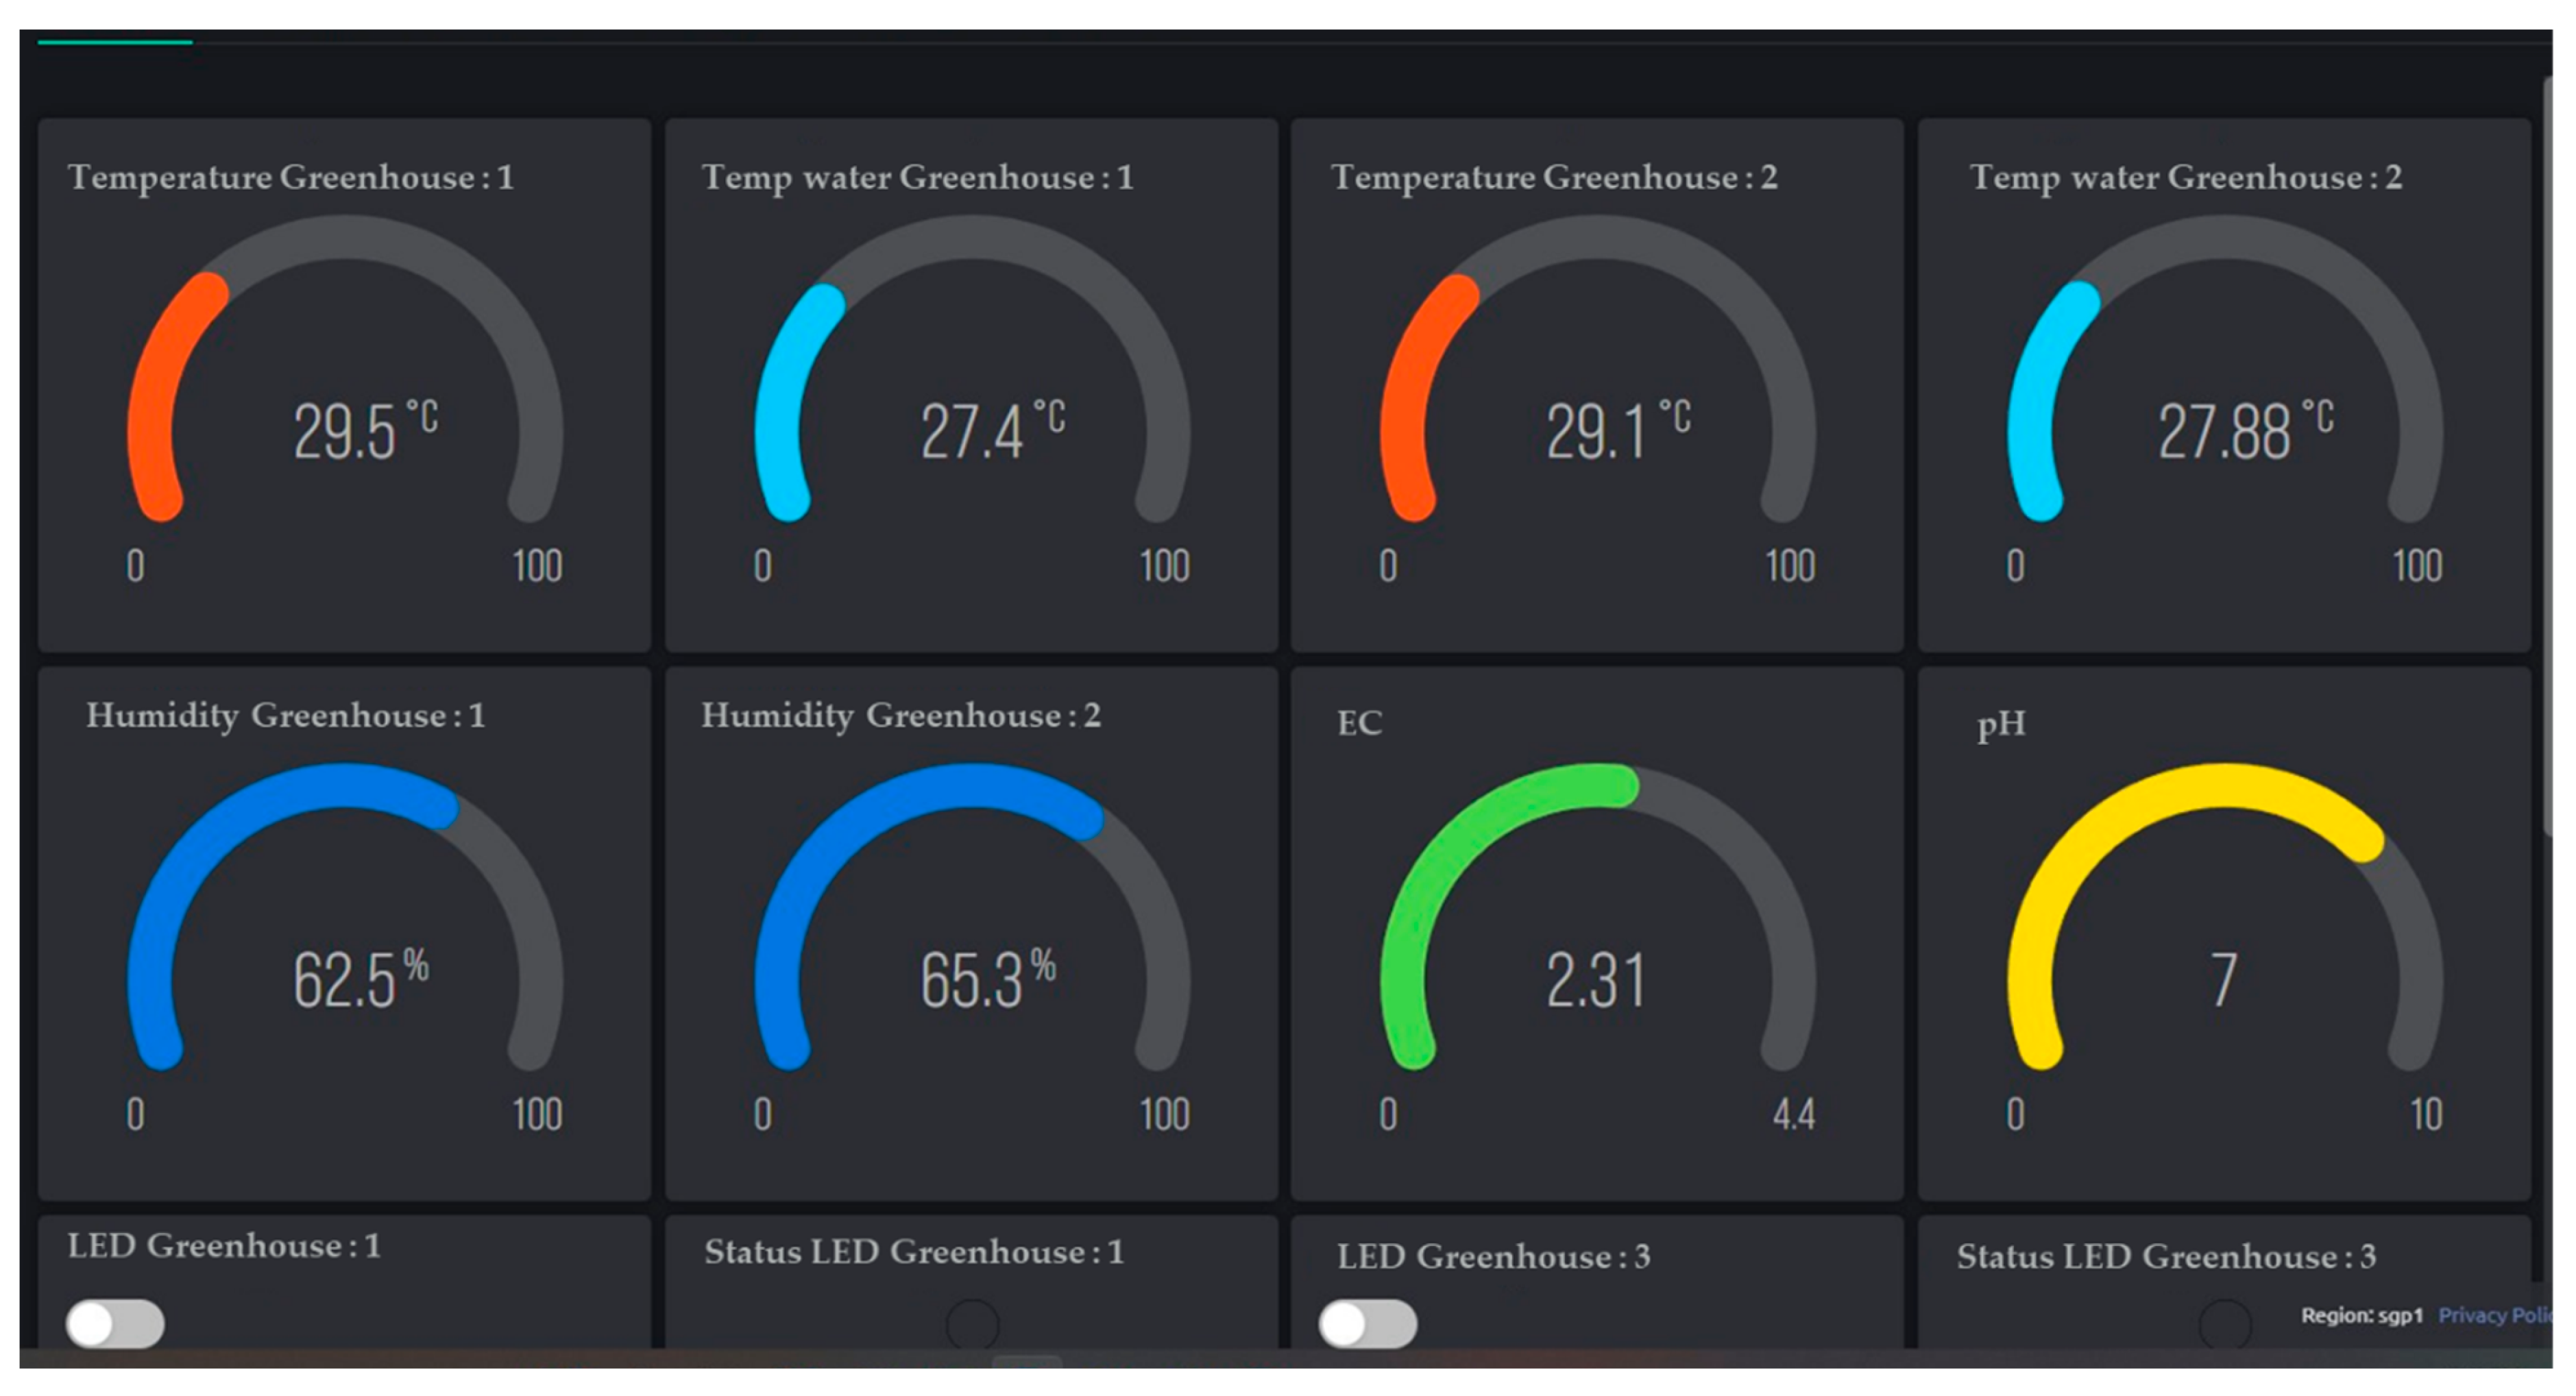
Blynk IoT: This application serves as a platform for constructing user-friendly dashboards, which are accessible through web browsers or smartphone applications. This functionality enables users to access environmental data in real-time from remote locations, enhancing their ability to monitor and control greenhouse operations effectively. Through an intuitively designed dashboard interface, users can seamlessly interact with and manage various environmental parameters and greenhouse equipment. The ESP32 module plays a pivotal role in this setup, as it transmits data from sensors located within the greenhouse directly to the Blynk platform. This integration ensures that users can manage their operations remotely with ease, promoting efficiency and precision in greenhouse management show in
Figure 4.
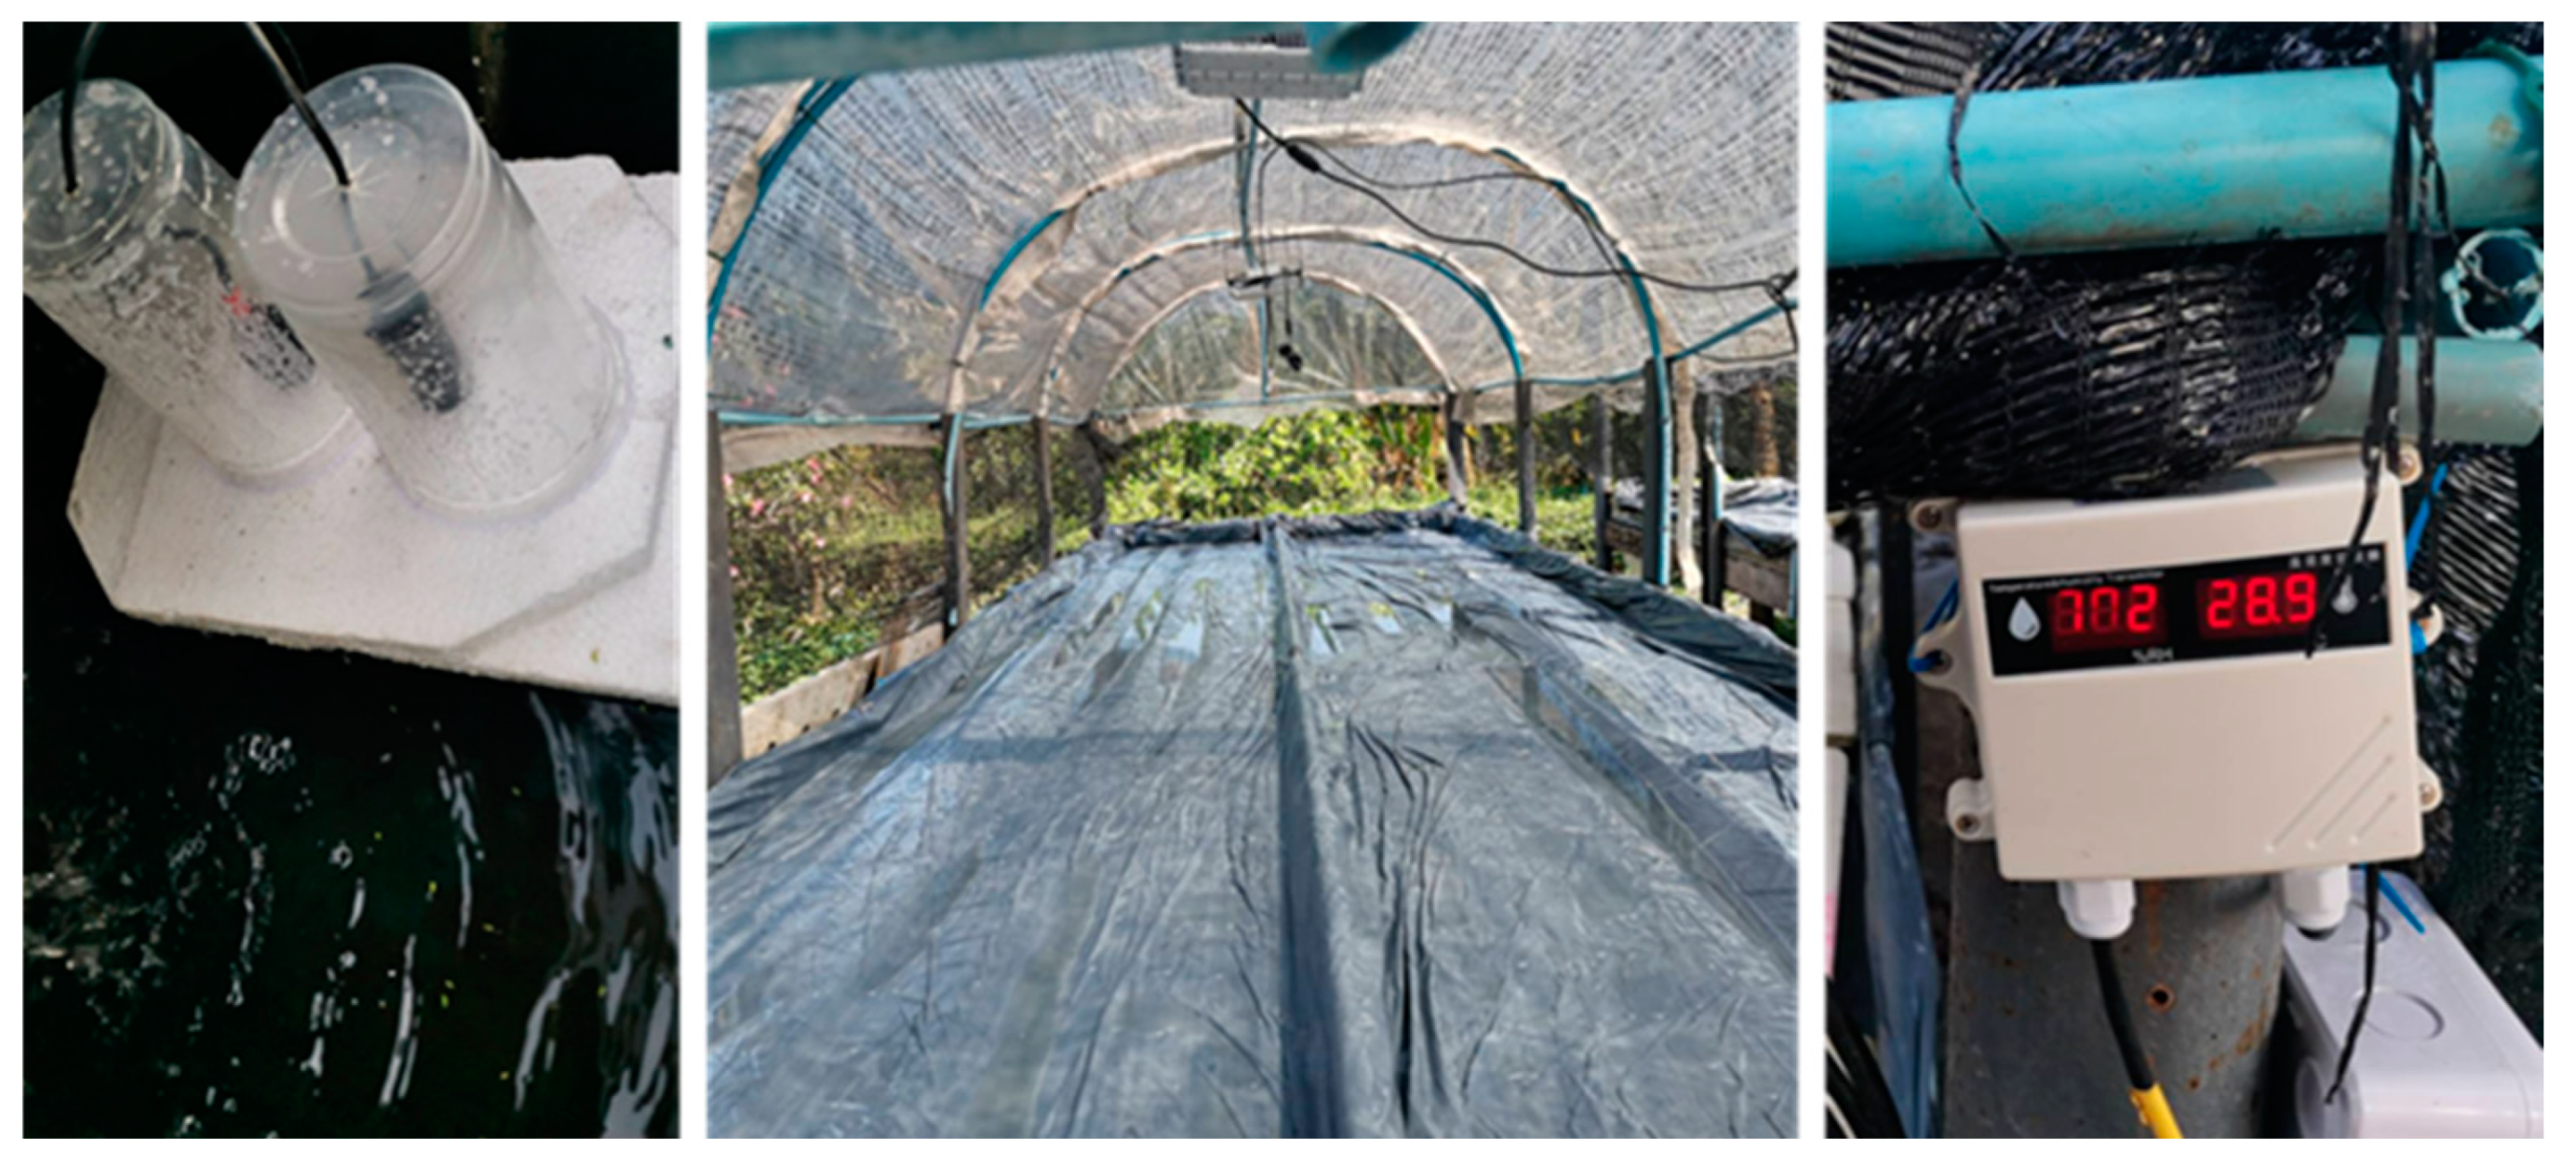
As depicted in
Figure 5, the sensor measuring system has been installed on the greenhouse in accordance with the experimental design. Measuring systems are crucial for collecting data and controlling the equipment and operations within these greenhouses. Consequently, the measurement system has been calibrated with standard equipment to ensure an error margin of no more than 3%, as detailed in
Table 1.
Based on the aforementioned test data, it can be asserted with confidence that the measuring equipment exhibits comparable quality to standard measuring instruments prior to its installation in the greenhouse.
3.3. Methodology
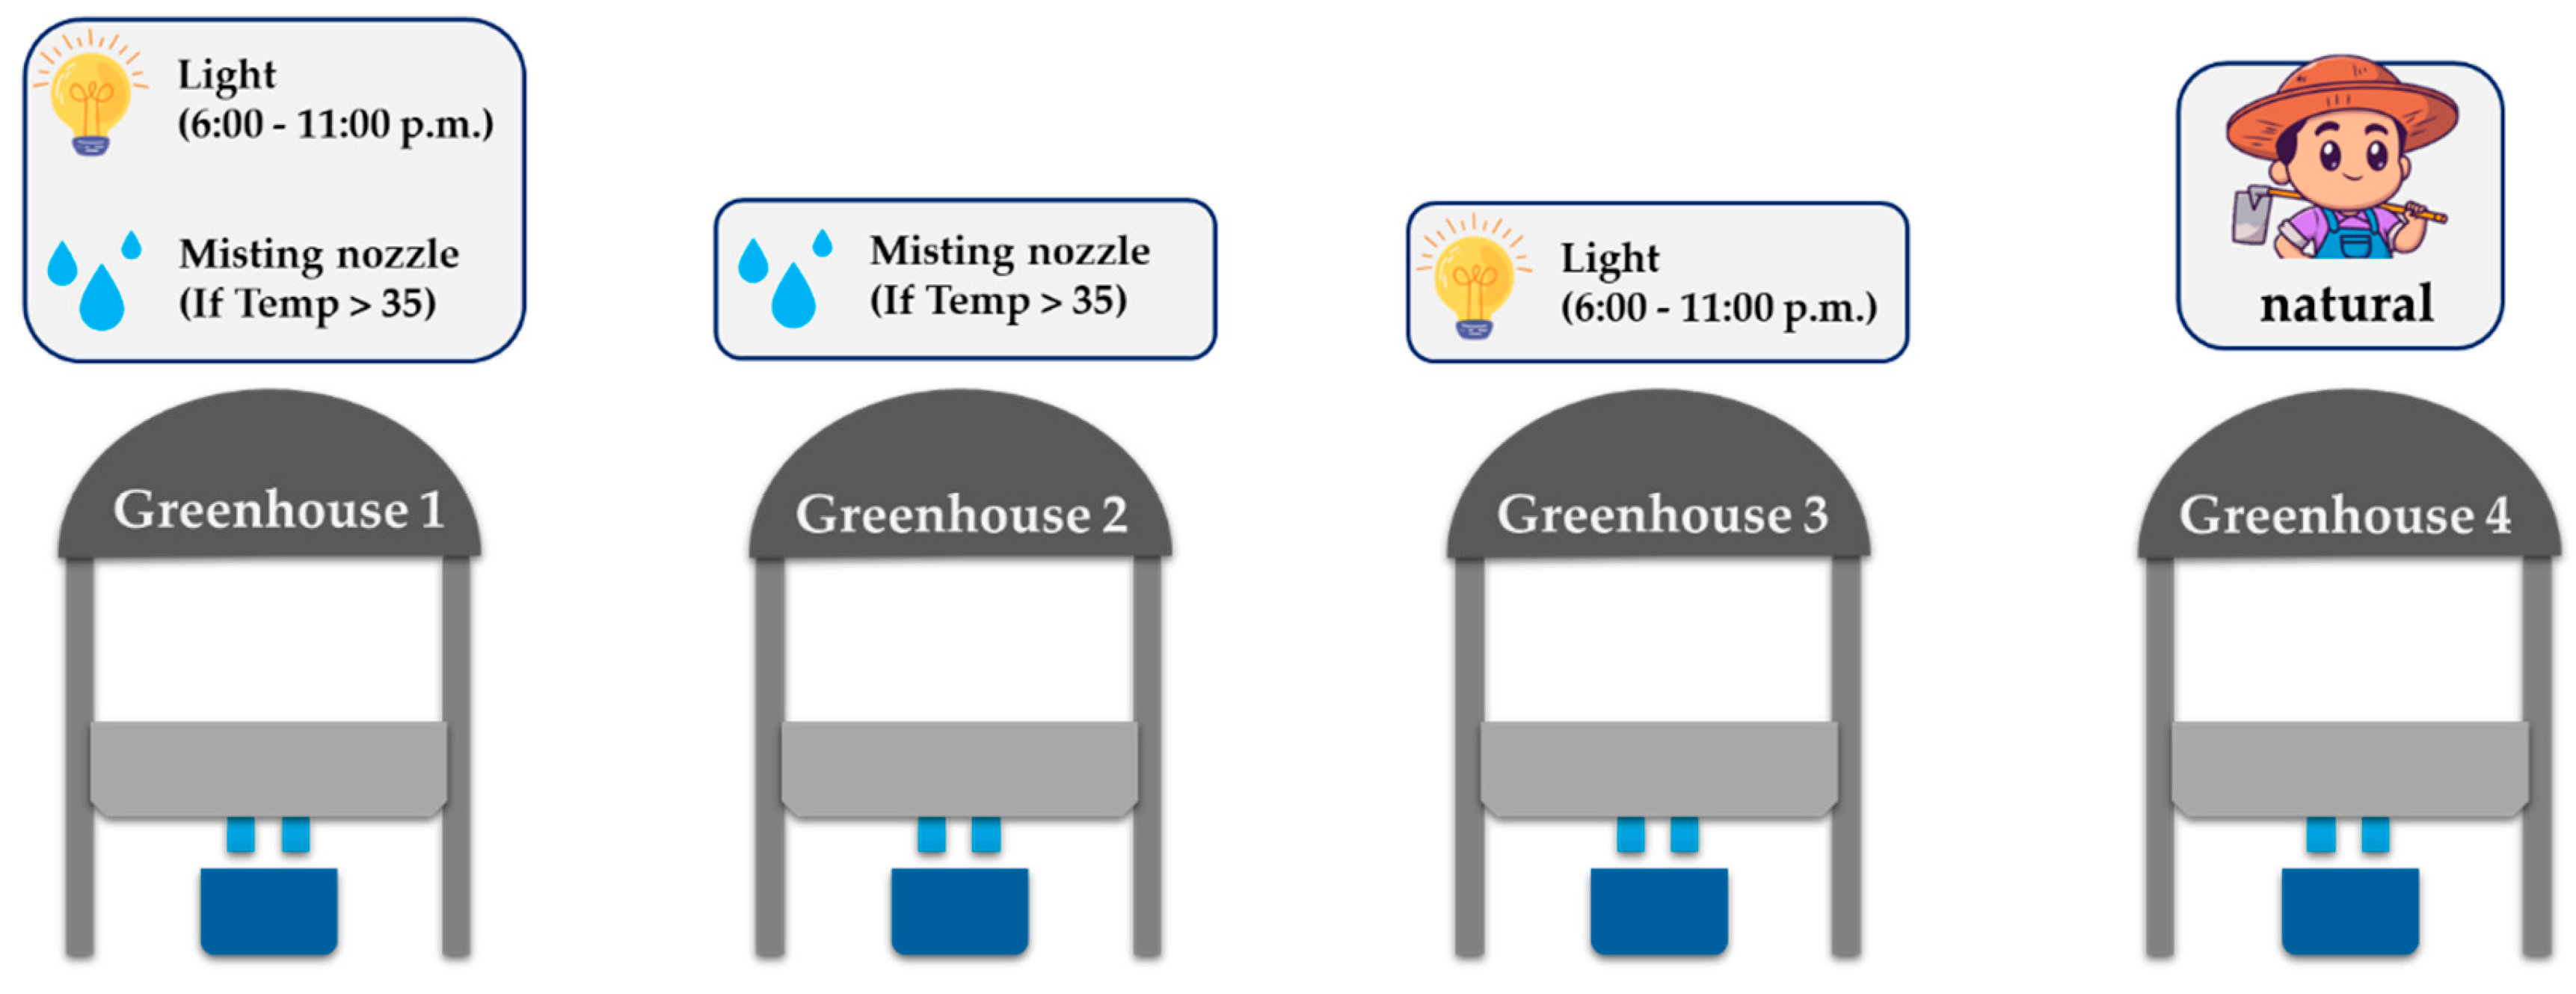
In the pursuit of diverse factors, three of the greenhouses will be equipped with measurement and control systems for comparative analysis with the fourth greenhouse will be maintained under natural conditions. From
Figure 6, the study will be conducted as follows:
Greenhouse 1 is outfitted with temperature and humidity sensors to continuously monitor the climate within the Greenhouse. A misting nozzle operates to control the temperature, maintaining it below 35 degrees Celsius. Furthermore, the period for photosynthesis has been extended by an additional 5 hours through the use of full spectrum grow lights, which are active from 6:00 p.m. to 11:00 p.m.
Greenhouse 2 will exclusively focus on the analysis of temperature factors, adhering to the same control schedule as implemented in Greenhouse 1. Specifically, upon the temperature exceeding 35 degrees Celsius, the misting nozzle unit will be activated. However, it is important to emphasize that Greenhouse 2 will not undergo an extension of photosynthesis duration using LED grow lights.
Greenhouse 3: In this greenhouse, the study will concentrate on the growth of plants affected by an increased amount of photosynthesis. Like Greenhouse 1, the photosynthesis period will be extended from 6:00 p.m. to 11:00 p.m. However, unlike Greenhouses 1 and 2, there will be no temperature control measures in place.
Greenhouse 4: will function as a controlled environment representative of natural conditions, devoid of interventions to manipulate light or temperature factors. Its purpose is to facilitate a comparative analysis, discerning differences between the controlled greenhouse and the one operating under entirely natural conditions.
In this experiment, all four greenhouses will be standardized to control factors that might influence plant growth. Each greenhouse will operate under identical environmental conditions and spatial arrangements. The management of electrical conductivity (EC) in the water and the pH control will also be uniformly maintained across all greenhouses, ensuring that the values for EC and pH are consistent in each.
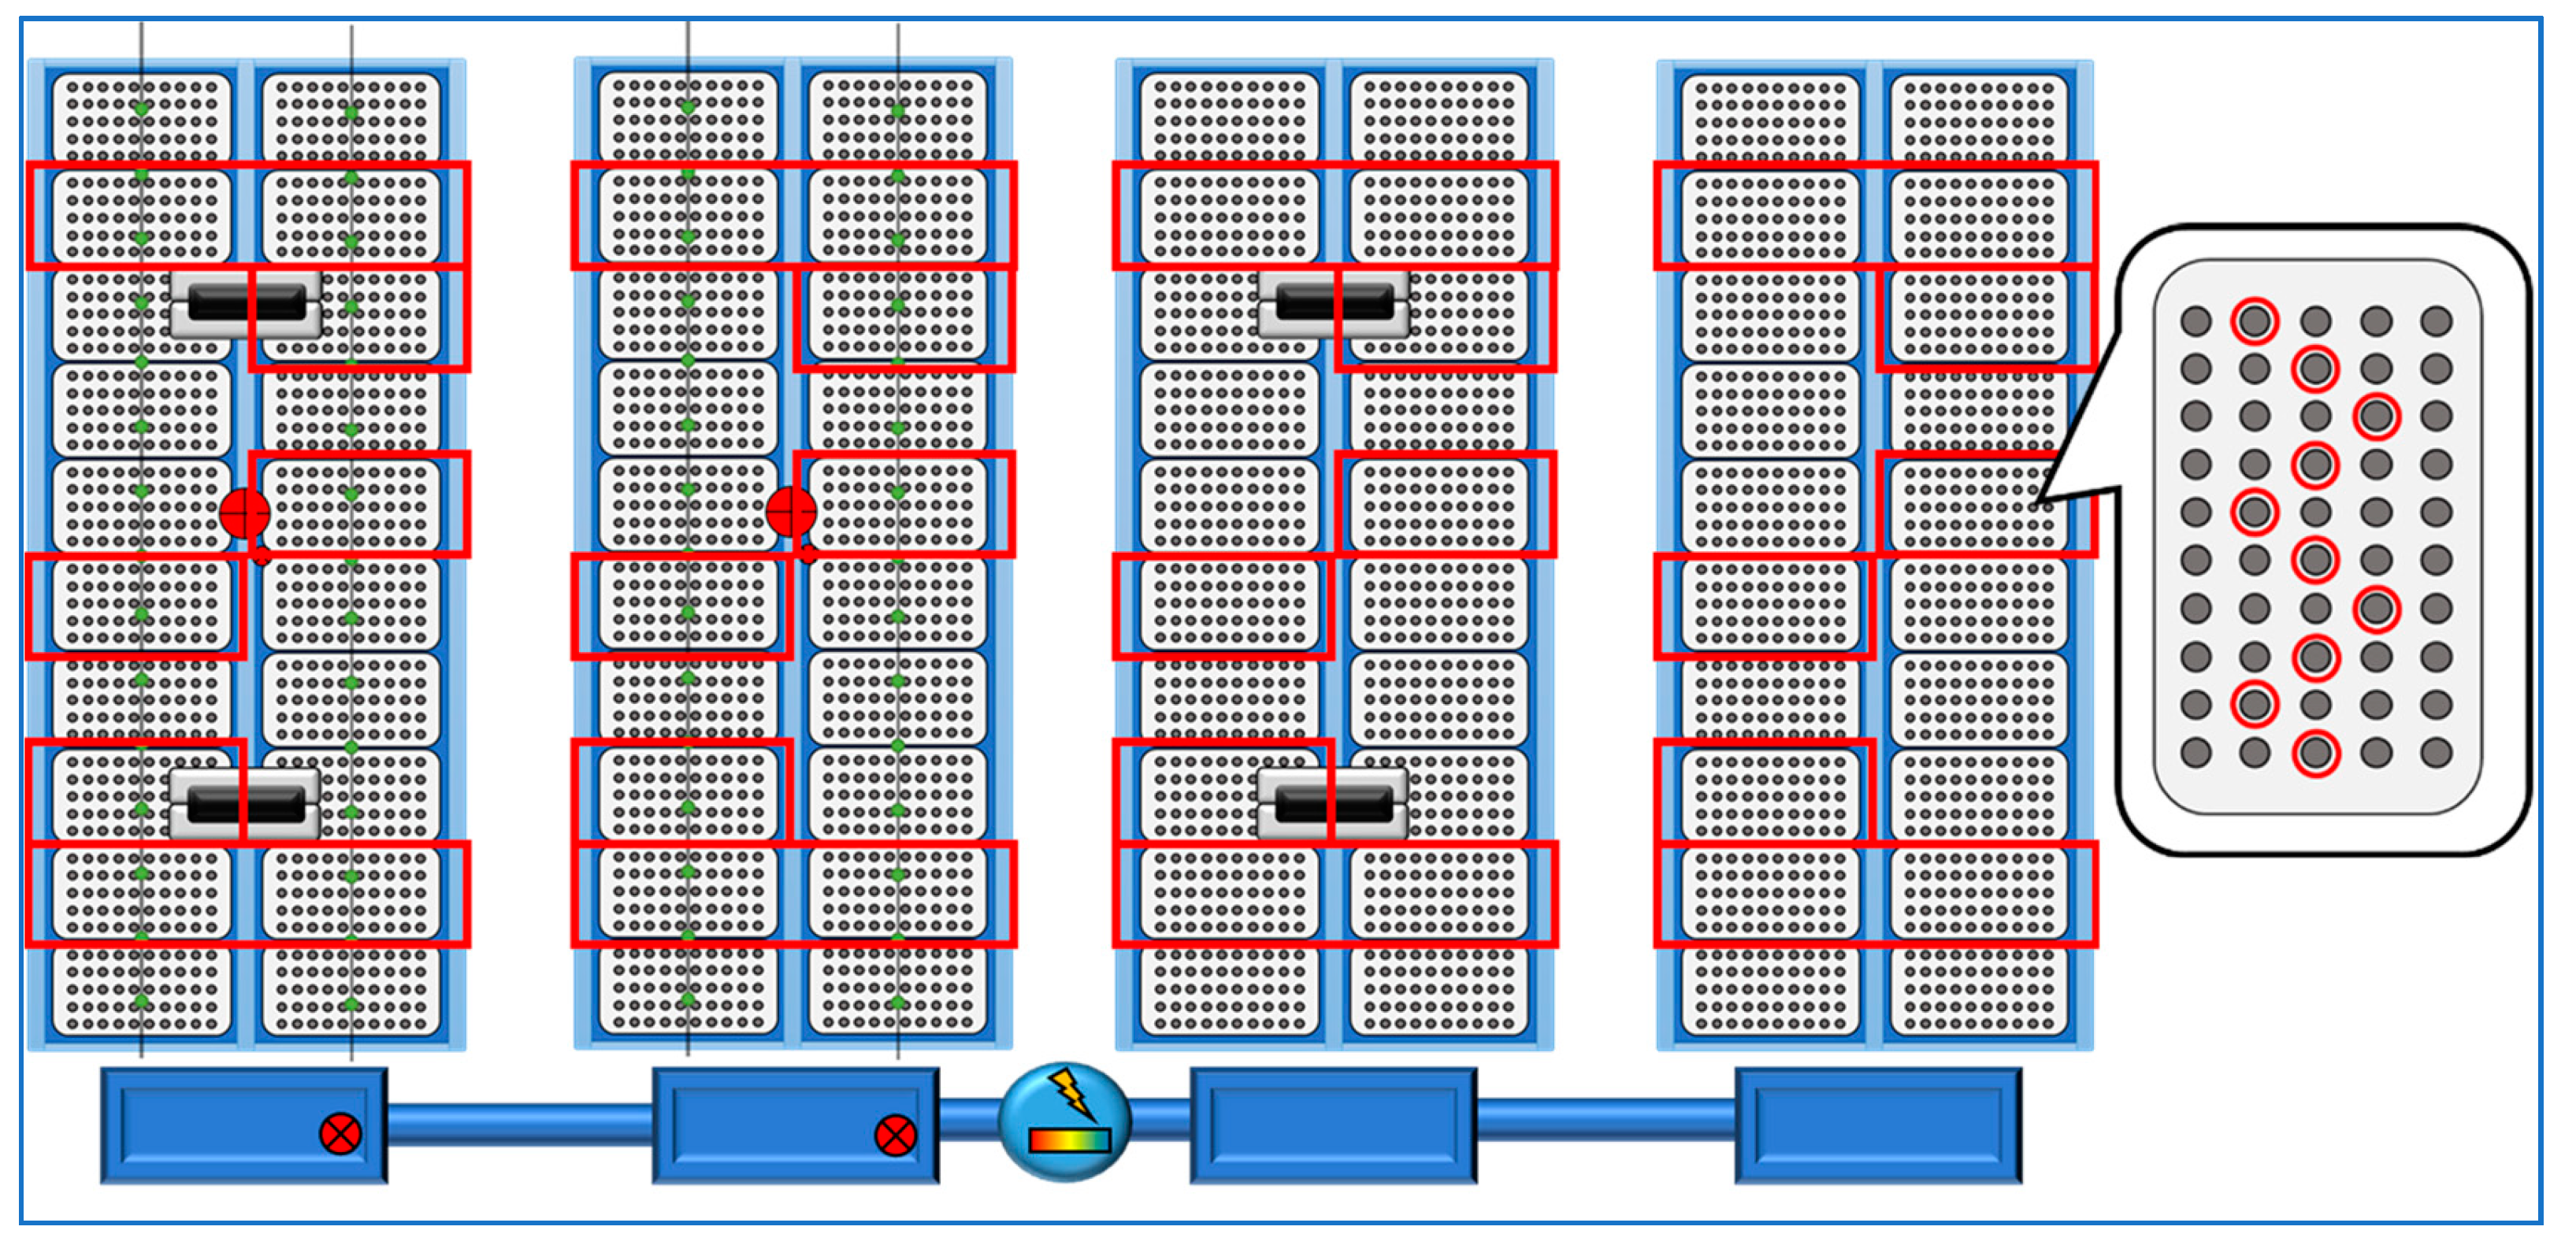
The metrics employed to evaluate the outcomes of controlled and naturally cultivated crops are the weight and height of the celery. These factors constitute primary determinants influencing market acceptability and have been selected as the initial focal points for testing. Consequently, statistical testing assumes a crucial role in determining whether genuine disparities exist in the cultivation outcomes of the two methods. Through the process of data collection, plants designated for data retrieval will be marked, amounting to a total of 80 plants per greenhouse. Consistency will be maintained by collecting data from the same set of plants at intervals of 3-5 days until the point of harvest, without altering the selection of marked plants for data collection as shown in
Figure 7.
In each greenhouse, weights will be measured from 8 selected trays out of a total of 20 propagation trays to monitor the growth of celery plants, as depicted in
Figure 7. From each of these trays, 10 celery plants will be chosen for height measurement. The positions for collecting experimental results will remain consistent throughout the study to ensure uniformity in the experiment. Typically, celery exhibits rapid growth and requires approximately 40 to reach maturity. Therefore, growth data will be collected every 5 to 7 days. Data collection will be consistently conducted on the same selected plants until the final harvest.
The research team implemented the Friedman test to evaluate whether there are statistically significant differences among the celery samples randomly selected from each of the four greenhouses. The following hypotheses were set:
- -
The results from the experiments conducted in all four greenhouses do not demonstrate statistically significant differences.
- -
The results from the experiments conducted in all four greenhouses show statistically significant differences.
The acceptance or rejection of these hypotheses will be analyzed through statistical tests, specifically the Friedman test. This analytical approach aims to ascertain whether there are significant differences in cultivation outcomes across all four greenhouses.
3.4. Friedman Test [18,19]
Statistically, the Friedman test is used to assess groups of samples that are randomly selected and have a similar distribution, utilizing rankings when repeated measurements are taken, and the data can be ranked. This test aims to determine whether the results obtained from the randomly sampled groups differ significantly [
16]. From the experiment, celery was cultivated in all four greenhouses for approximately 40 days, allowing for the collection of growth data a total of eight times.
Table 2 presents the growth results in terms of the weight of the celery, specifically collected during the sixth instance, approximately 30 days after planting.
The weight data from the experiment, as presented in
Table 2, has been arranged into a new table by ranking the data sets. If there are equal values in the table, they are assigned the same rank, and subsequent ranks are adjusted by skipping the number of equal data points. For example, in
Table 3, Tray 6 from Greenhouse 3 and Tray 8 from Greenhouse 4 both have a value of 0.85 kg. These are both ranked as 12 and rank 13 is skipped due to the duplicate values quantity 1 value. Consequently, Tray 7 from Greenhouse 4, which has a value of 0.86 kg, is assigned rank 14, bypassing rank 13.
From
Table 3, after ranking all the experimental data, the average rank in each row of the conditions
and average rank in each column of the conditions
must be calculated using the following equations:
where:
represents the number of conditions (columns).
represents the number of trials (rows).
represents the average rank in each row of the conditions (number of trials).
represents the average rank in each column of the conditions (number of data points in each trial).
represents the mean rank of the total number of observations.
represents the result of the statistical test.
The mean rank of the total number of observations is calculated using the following equation:
The Friedman Test is applied to examine whether samples exhibit identical distributions. The test assesses whether there is any significant difference among the results obtained from the samples, as determined by the following equation:
Substituting the experimental data into Equation 4, the calculation can be performed as follows:
The calculated test value is compared with the percentile of the chi-square () distribution with degrees of freedom equal to (). This value is then compared against the critical value from the chi-square distribution table at a significance level of 0.05. Therefore, 7.8147.
Based on the experimental hypotheses, the acceptance or rejection of a hypothesis depends on the values obtained from the statistical test: if the value from the statistical test is less than 7.8147, the null hypothesis will be accepted, but if the statistical test value is greater than 7.8147, the alternative hypothesis will be accepted:
- -
H0: The results from the experiments conducted in all four greenhouses do not demonstrate statistically significant differences.
- -
H1: The results from the experiments conducted in all four greenhouses show statistically significant differences.
The results from the statistical test for the weight data of the celery show a value of 8.976. Therefore, it can be concluded that the Friedman test yielded a statistical value of 8.976, which is greater than the critical value of 7.8147. Consequently, the alternative hypothesis is accepted.
4. Results
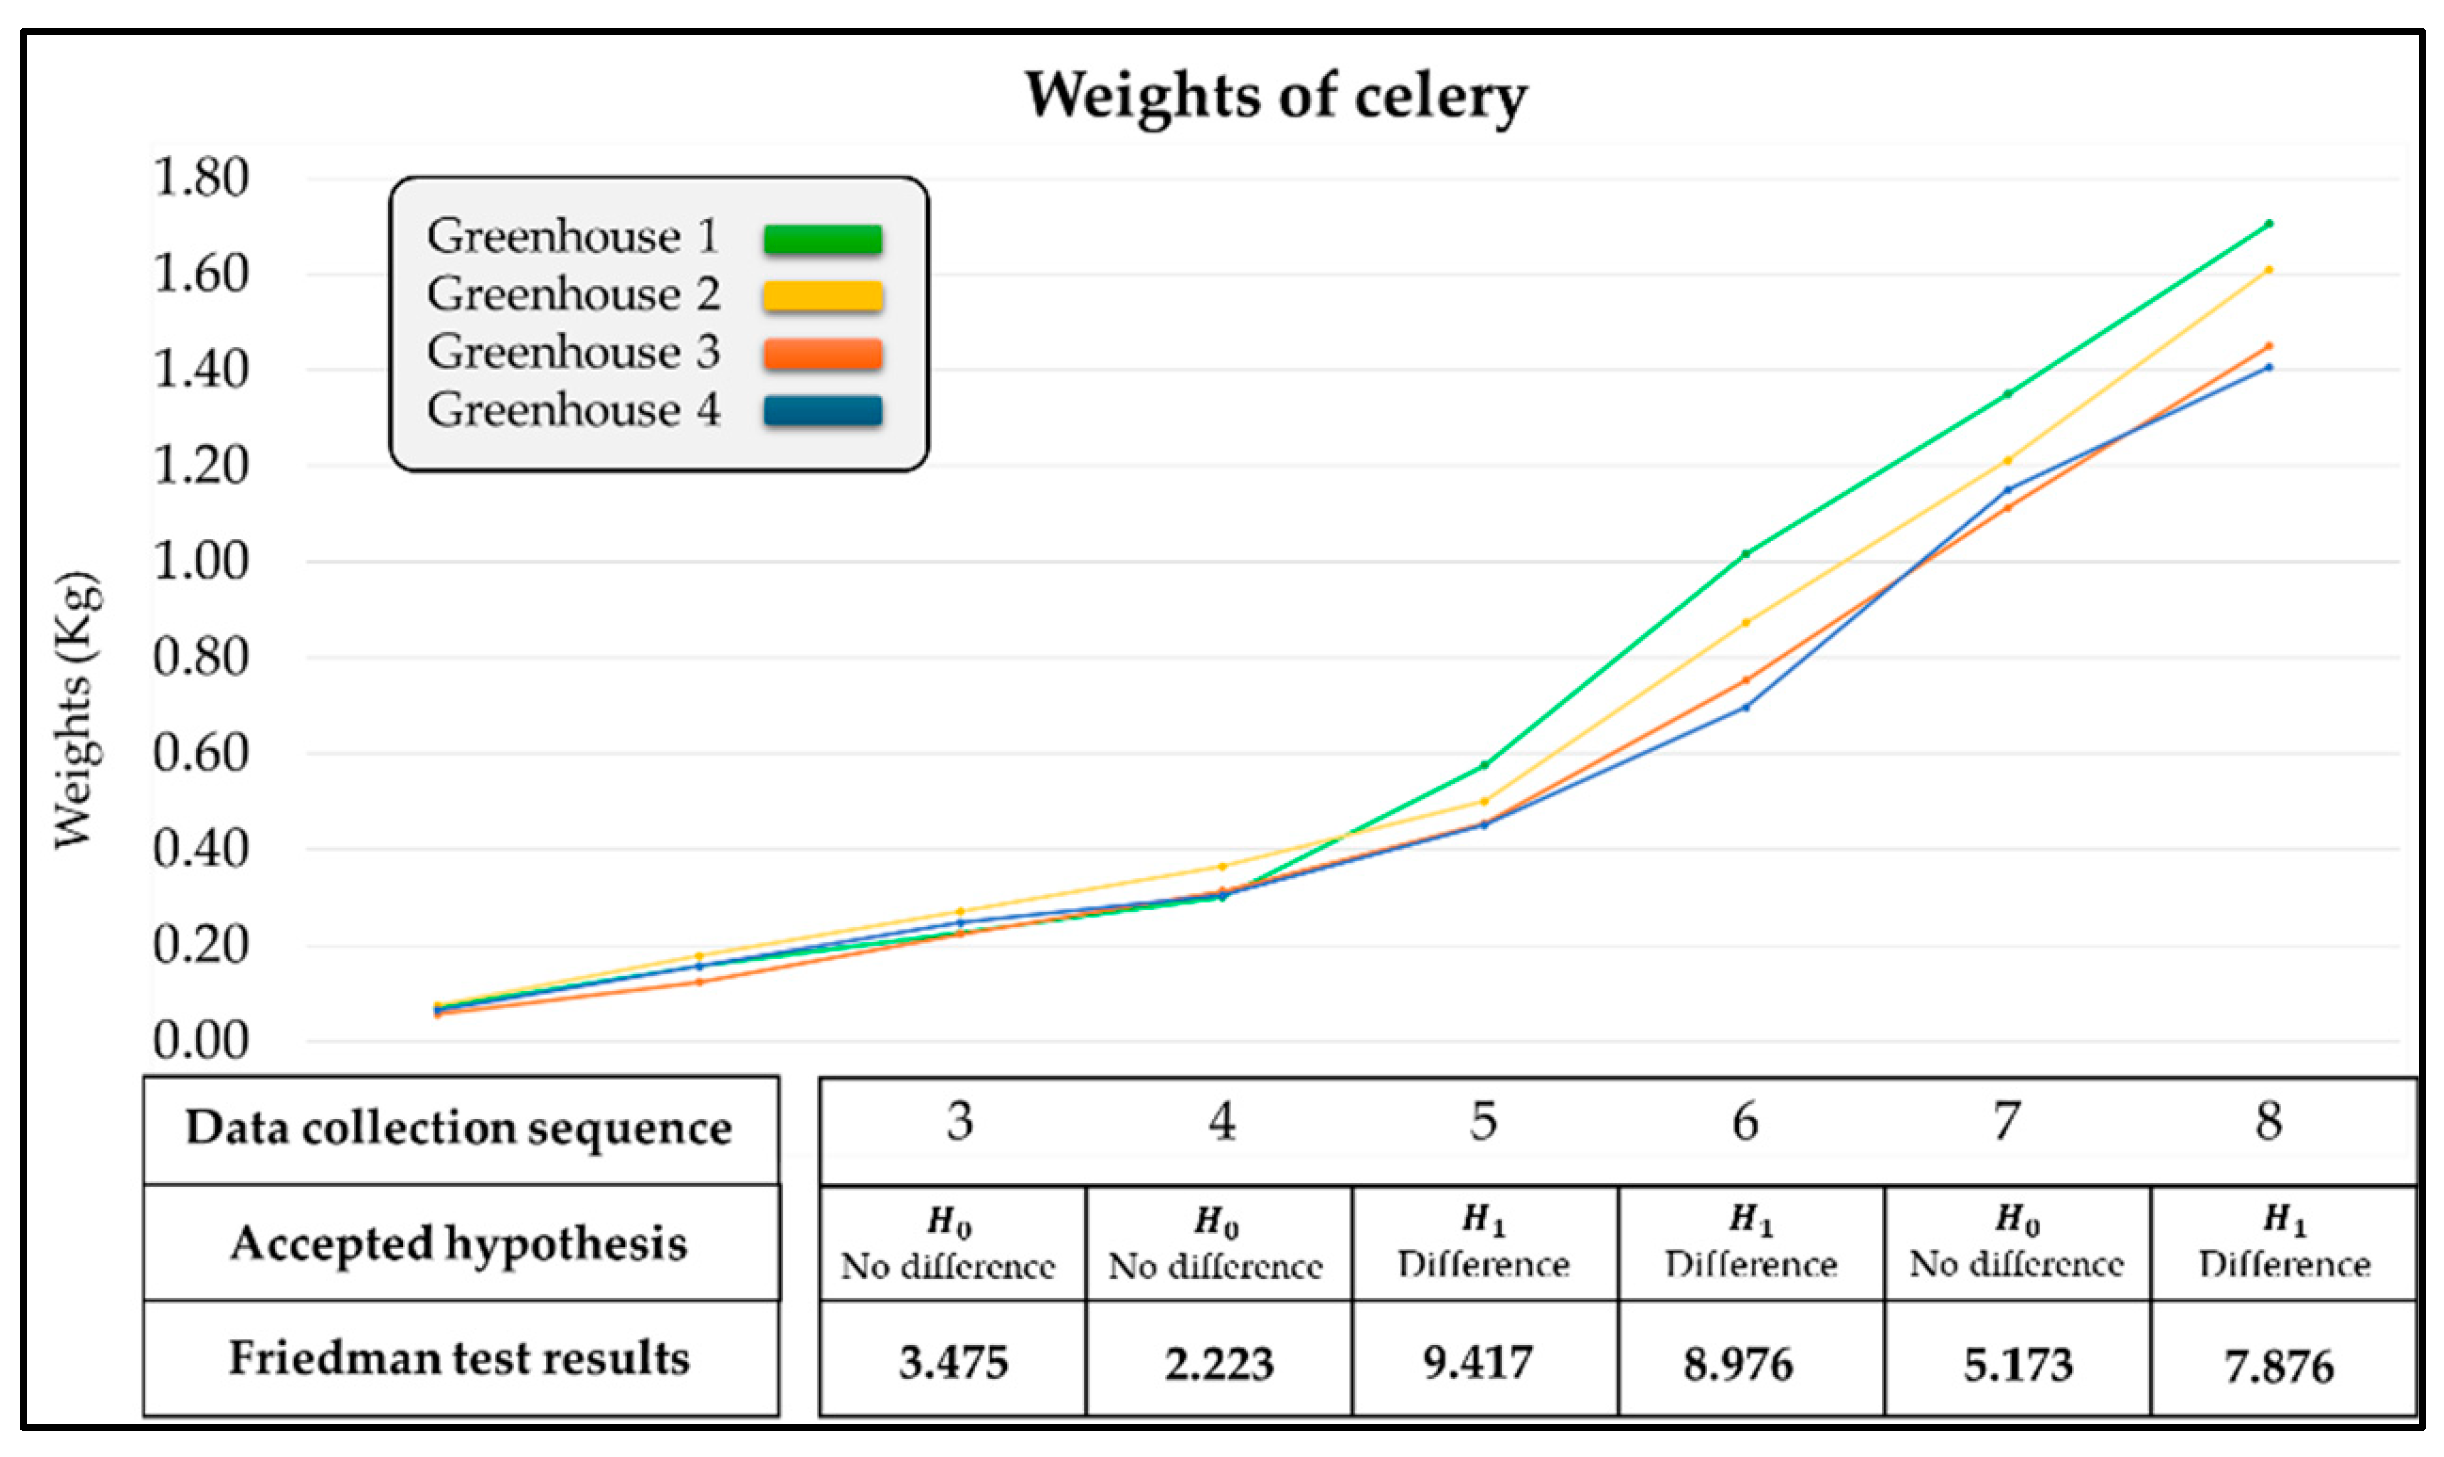
The collection of experimental results regarding the weight and height of celery veg-etables spanned a period of approximately 40 - 45 days, with data collection occurring at aver-age intervals of 5 to 7 days. The experiment yielded a total of 8 sets of data, which were subsequently employed in the statistical Friedman test to assess differences in the weight and height of the celery vegetables as show in
Figure 8. For Friedman test of weight and Friedman test of height as show in
Figure 9. The analysis focused on data collected from the third iteration onwards, as the initial two collections were conducted during the early stages of planting and were thus excluded from the test.
In the analysis of weight differences, the data from the first and second collection instances were excluded from consideration as they represent the initial stages of planting. Form
Figure 8, the Friedman test reveals changes in the celery plants at each data collection interval. Notably, significant differences began to emerge at the fifth collection interval, approximately 24 days after planting, as indicated by a Friedman test value of 9.417, which exceeds the critical value of 7.8147. Furthermore, the Friedman test results from the third data collection through to the final harvest indicate significant differences at the 5, 6, and 8 collection intervals, with the test values exceeding 7.8147. Considering these results, along with the final data collection before harvest, the research team accepted the alternative hypothesis
The results from the experiments conducted in all four greenhouses show statistically significant differences.
Figure 9.
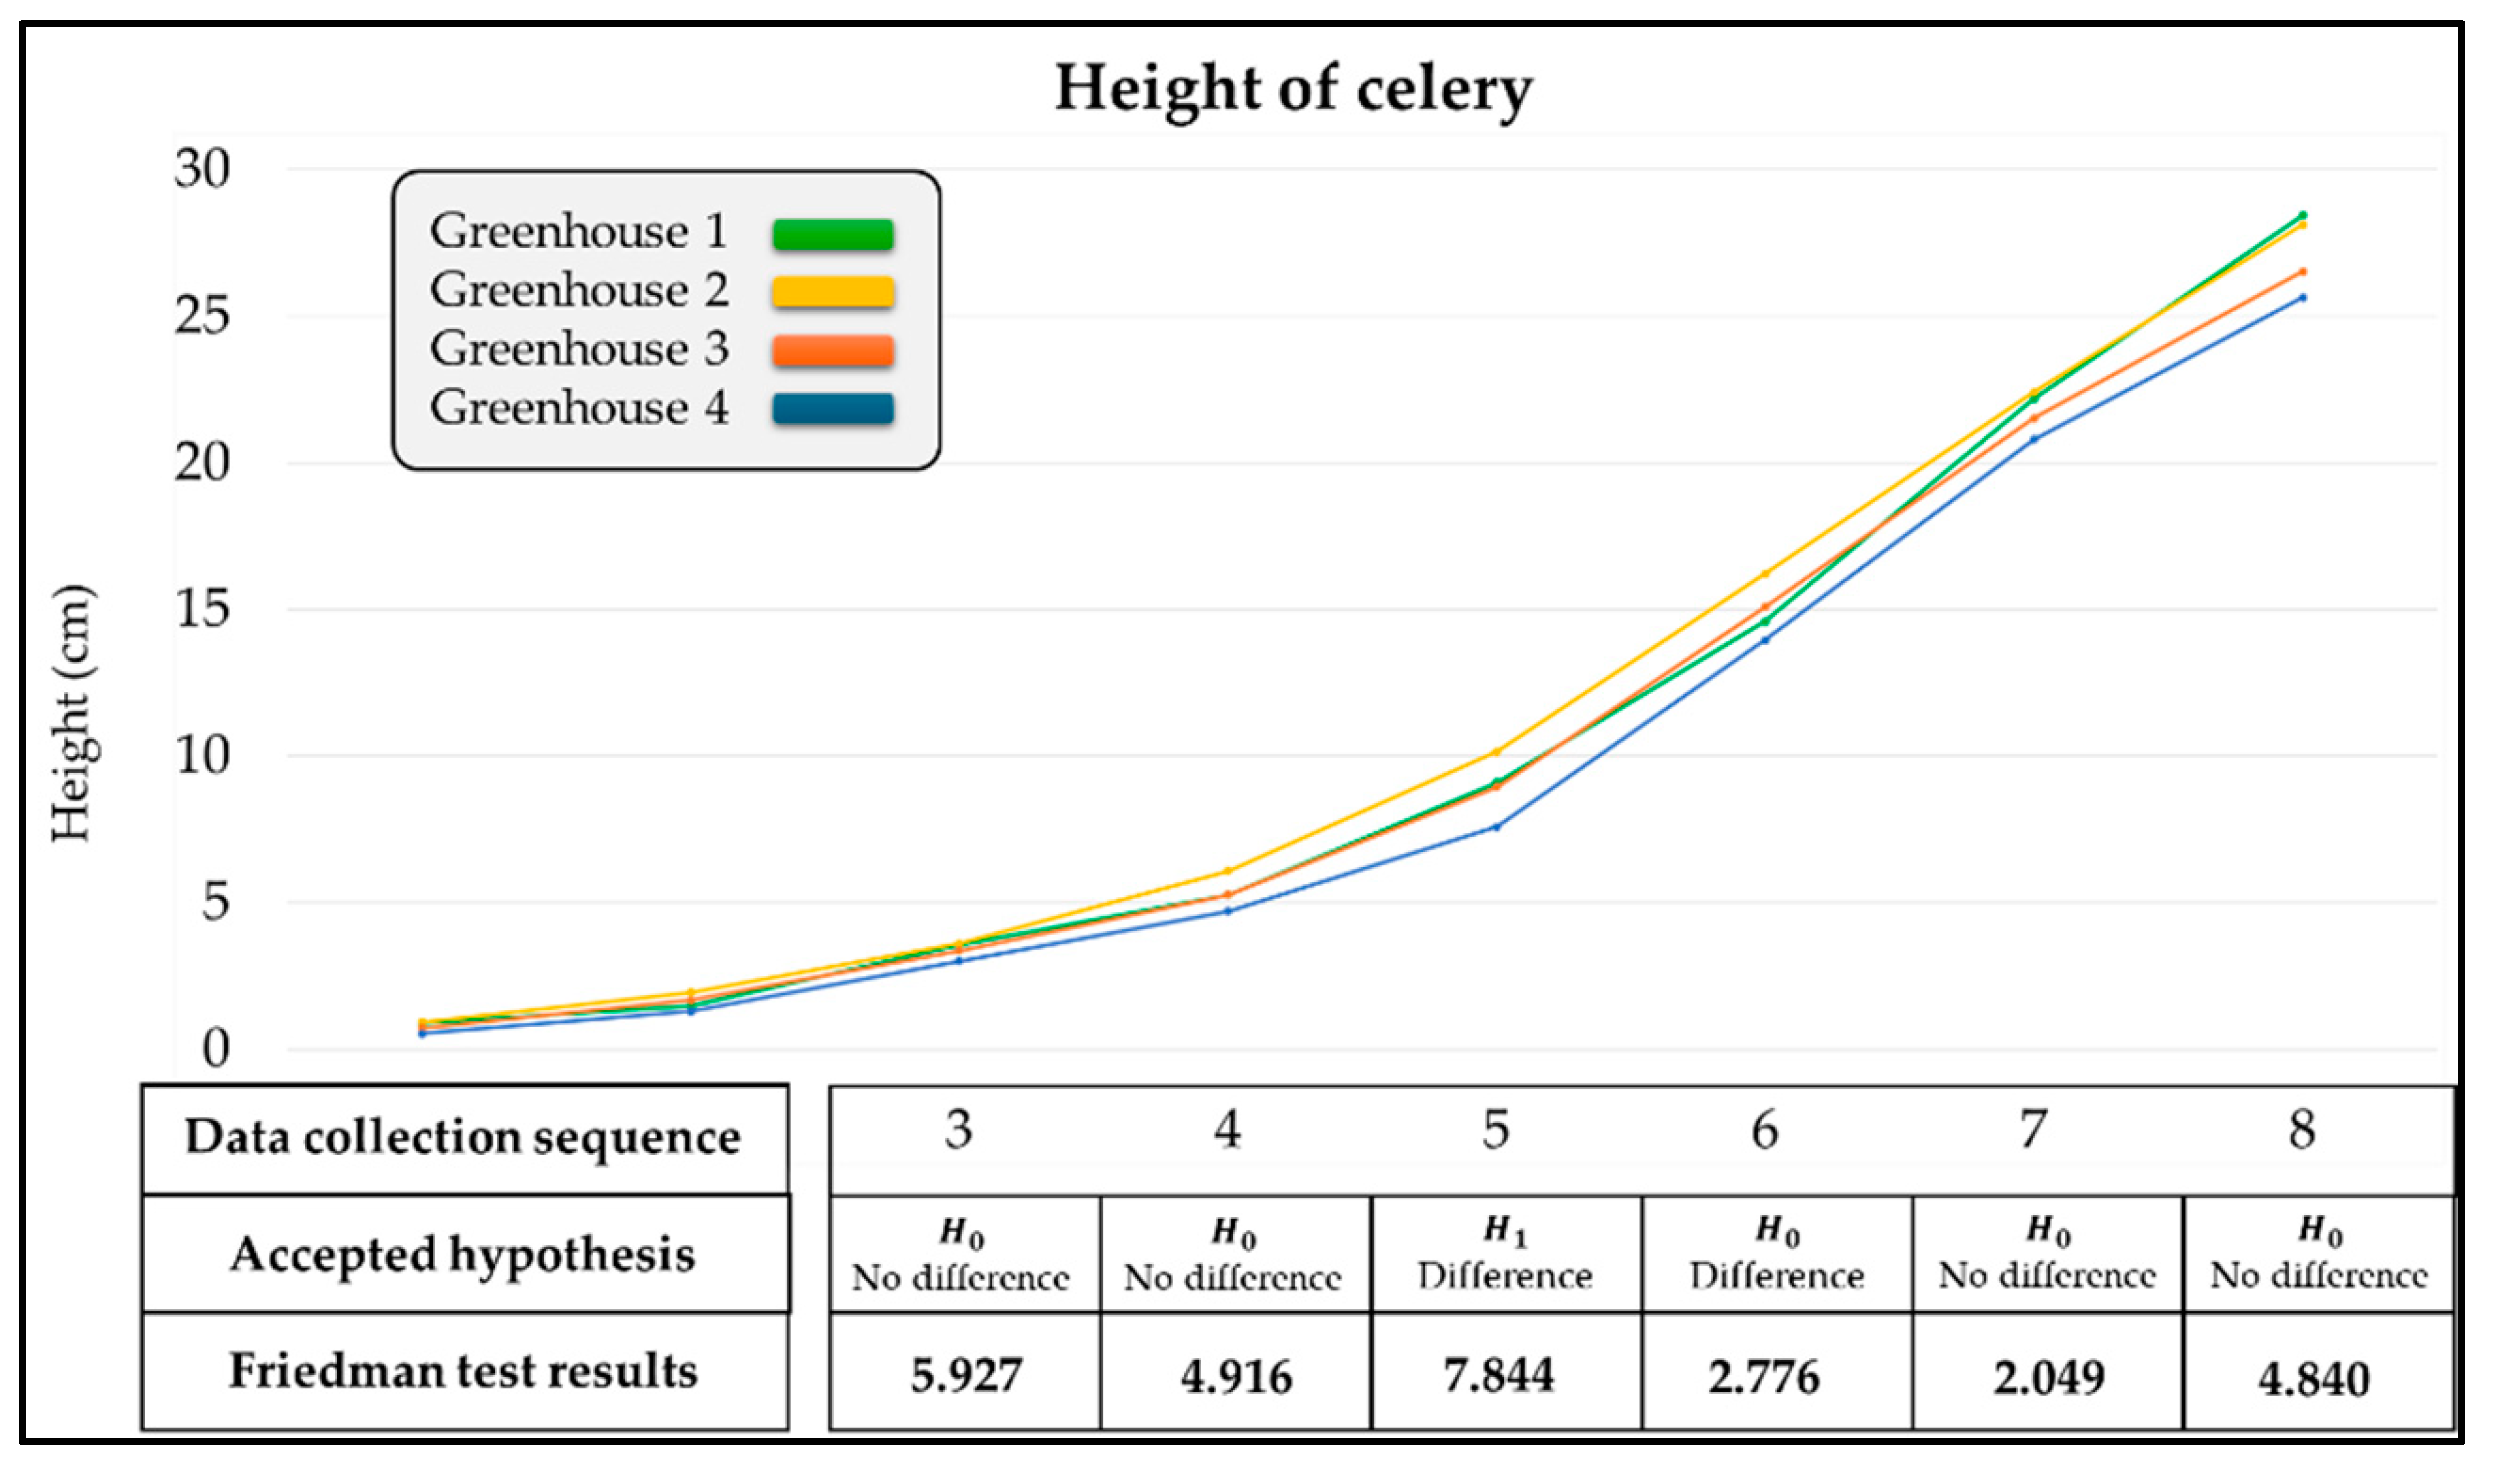
Illustrates the changes in the height of celery grown in all four greenhouses over an approximate 40-day cultivation period.
Figure 9.
Illustrates the changes in the height of celery grown in all four greenhouses over an approximate 40-day cultivation period.
In the analysis of height differences in celery, the data from the first and second collection instances were excluded from consideration as they represent the initial stages of planting. Form
Figure 9, the Friedman test reveals changes in the height of the celery plants at each data collection interval. Notably, significant differences began to emerge at the fifth collection interval, approximately 24 days after planting, indicated by a Friedman test value of 7.844, which exceeds the critical value of 7.8147. Furthermore, the Friedman test results from the third data collection through to the final harvest indicate that height differences were statistically significant only at the fifth collection interval. No significant differences were observed from the sixth through the eighth collection intervals. Considering the final data collection before harvest, the research team accepted the null hypothesis
The results from the experiments conducted in all four greenhouses do not demonstrate statistically significant differences.
4.1. Final Product and Difference Comparison Results
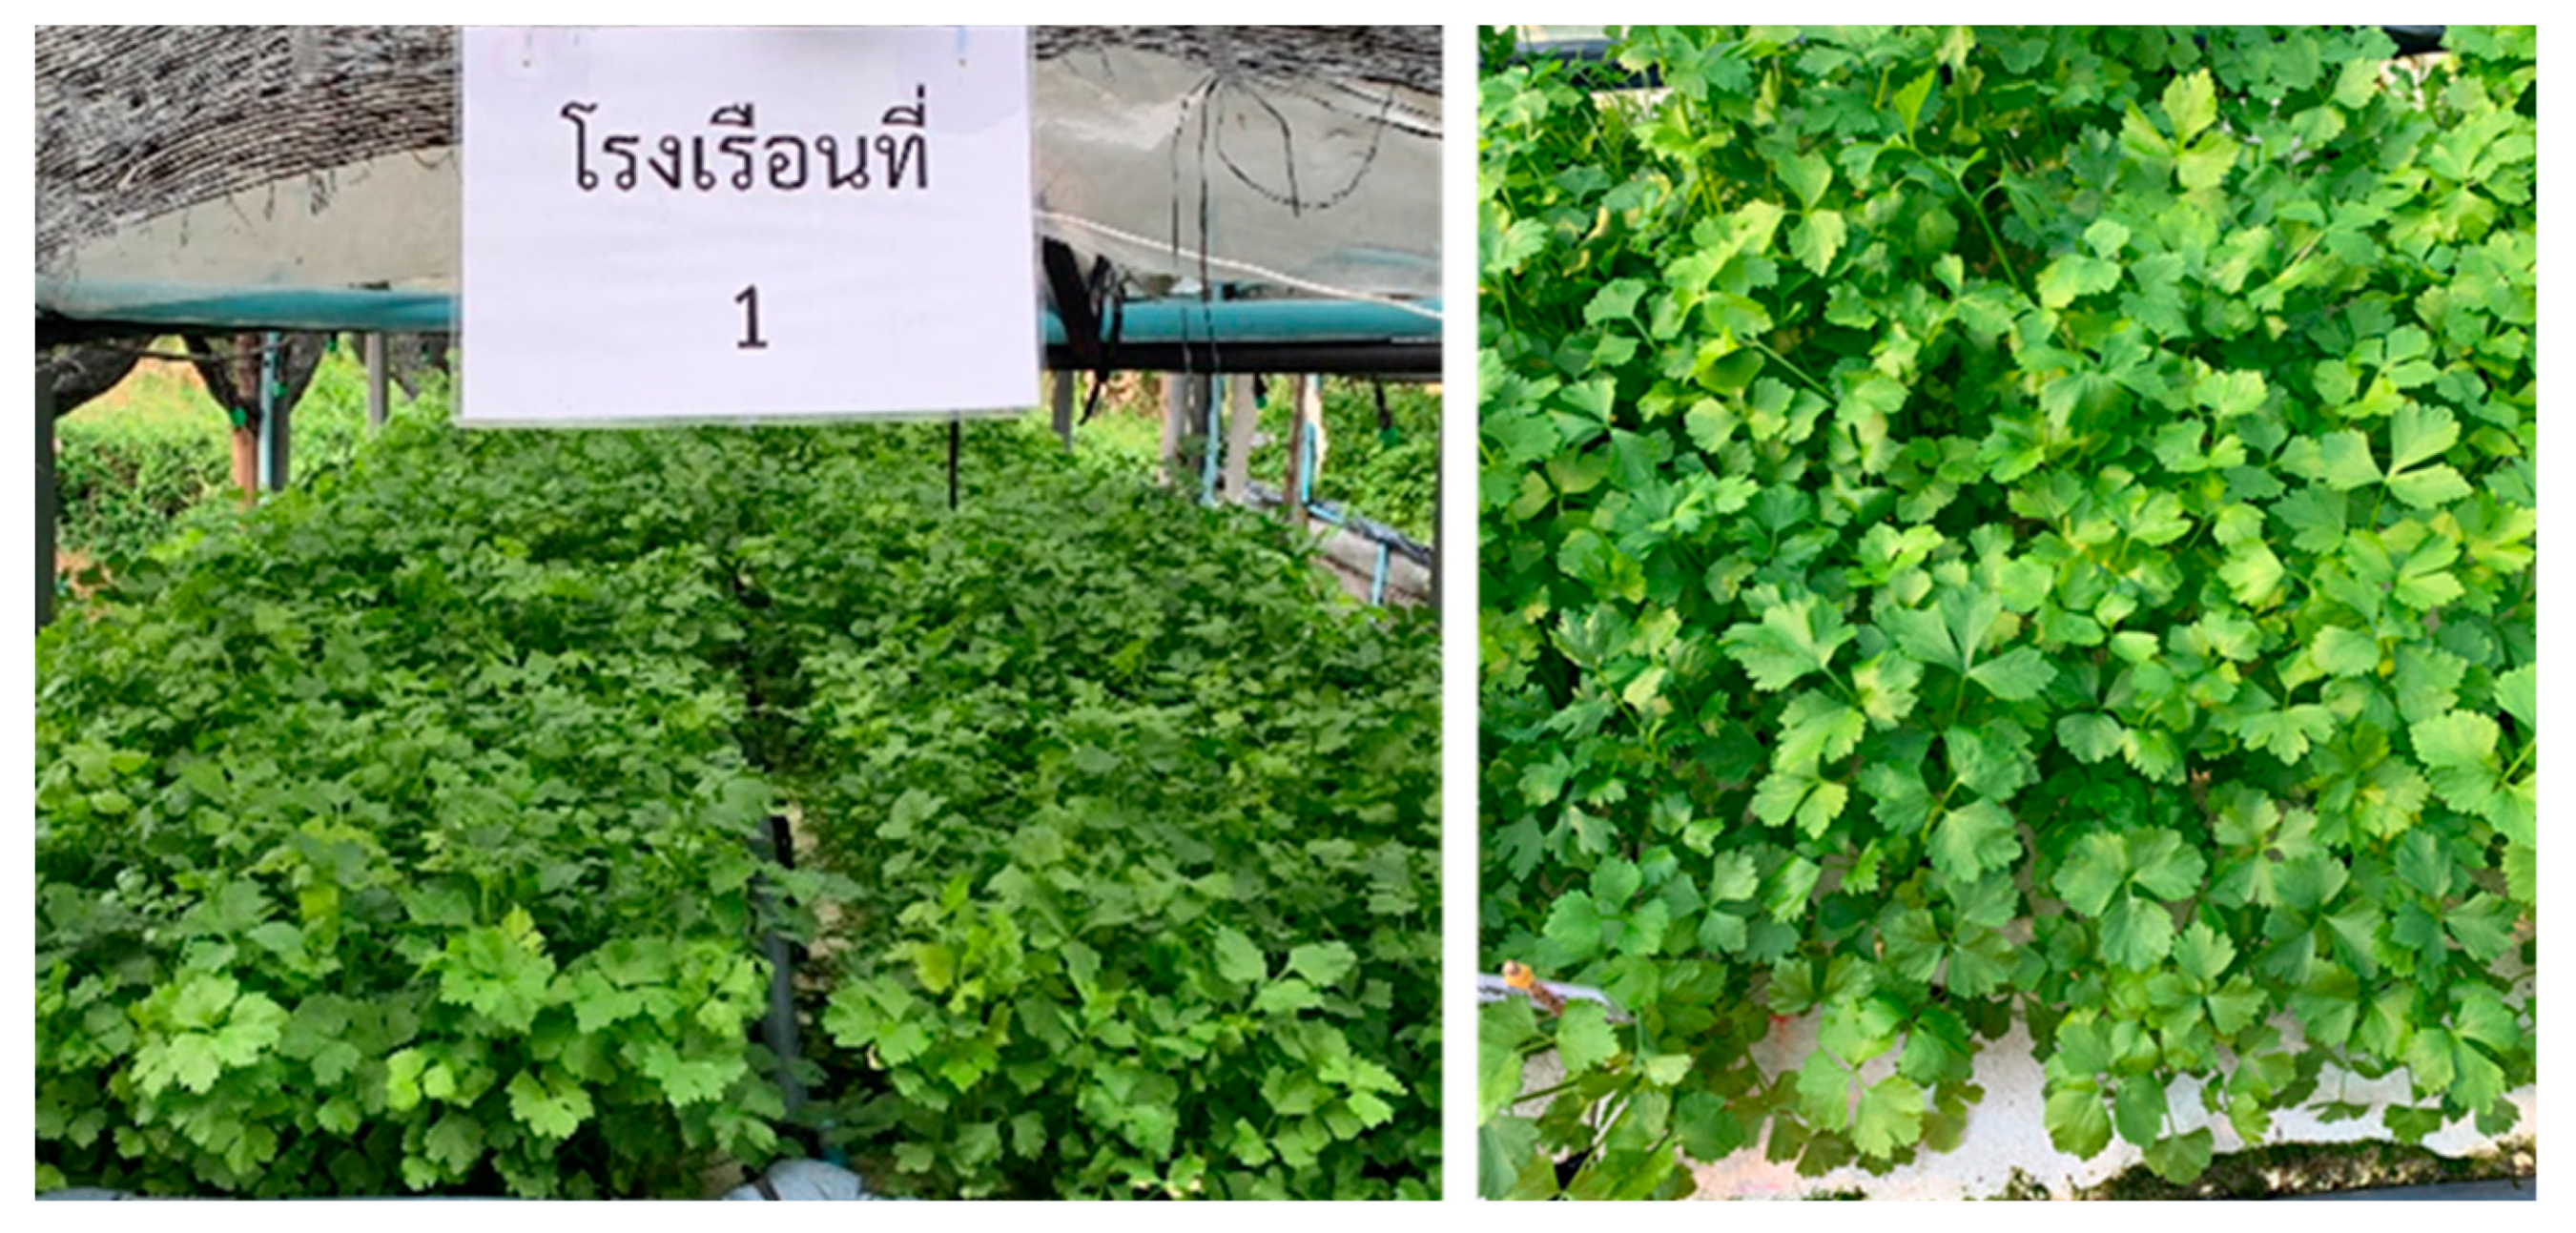
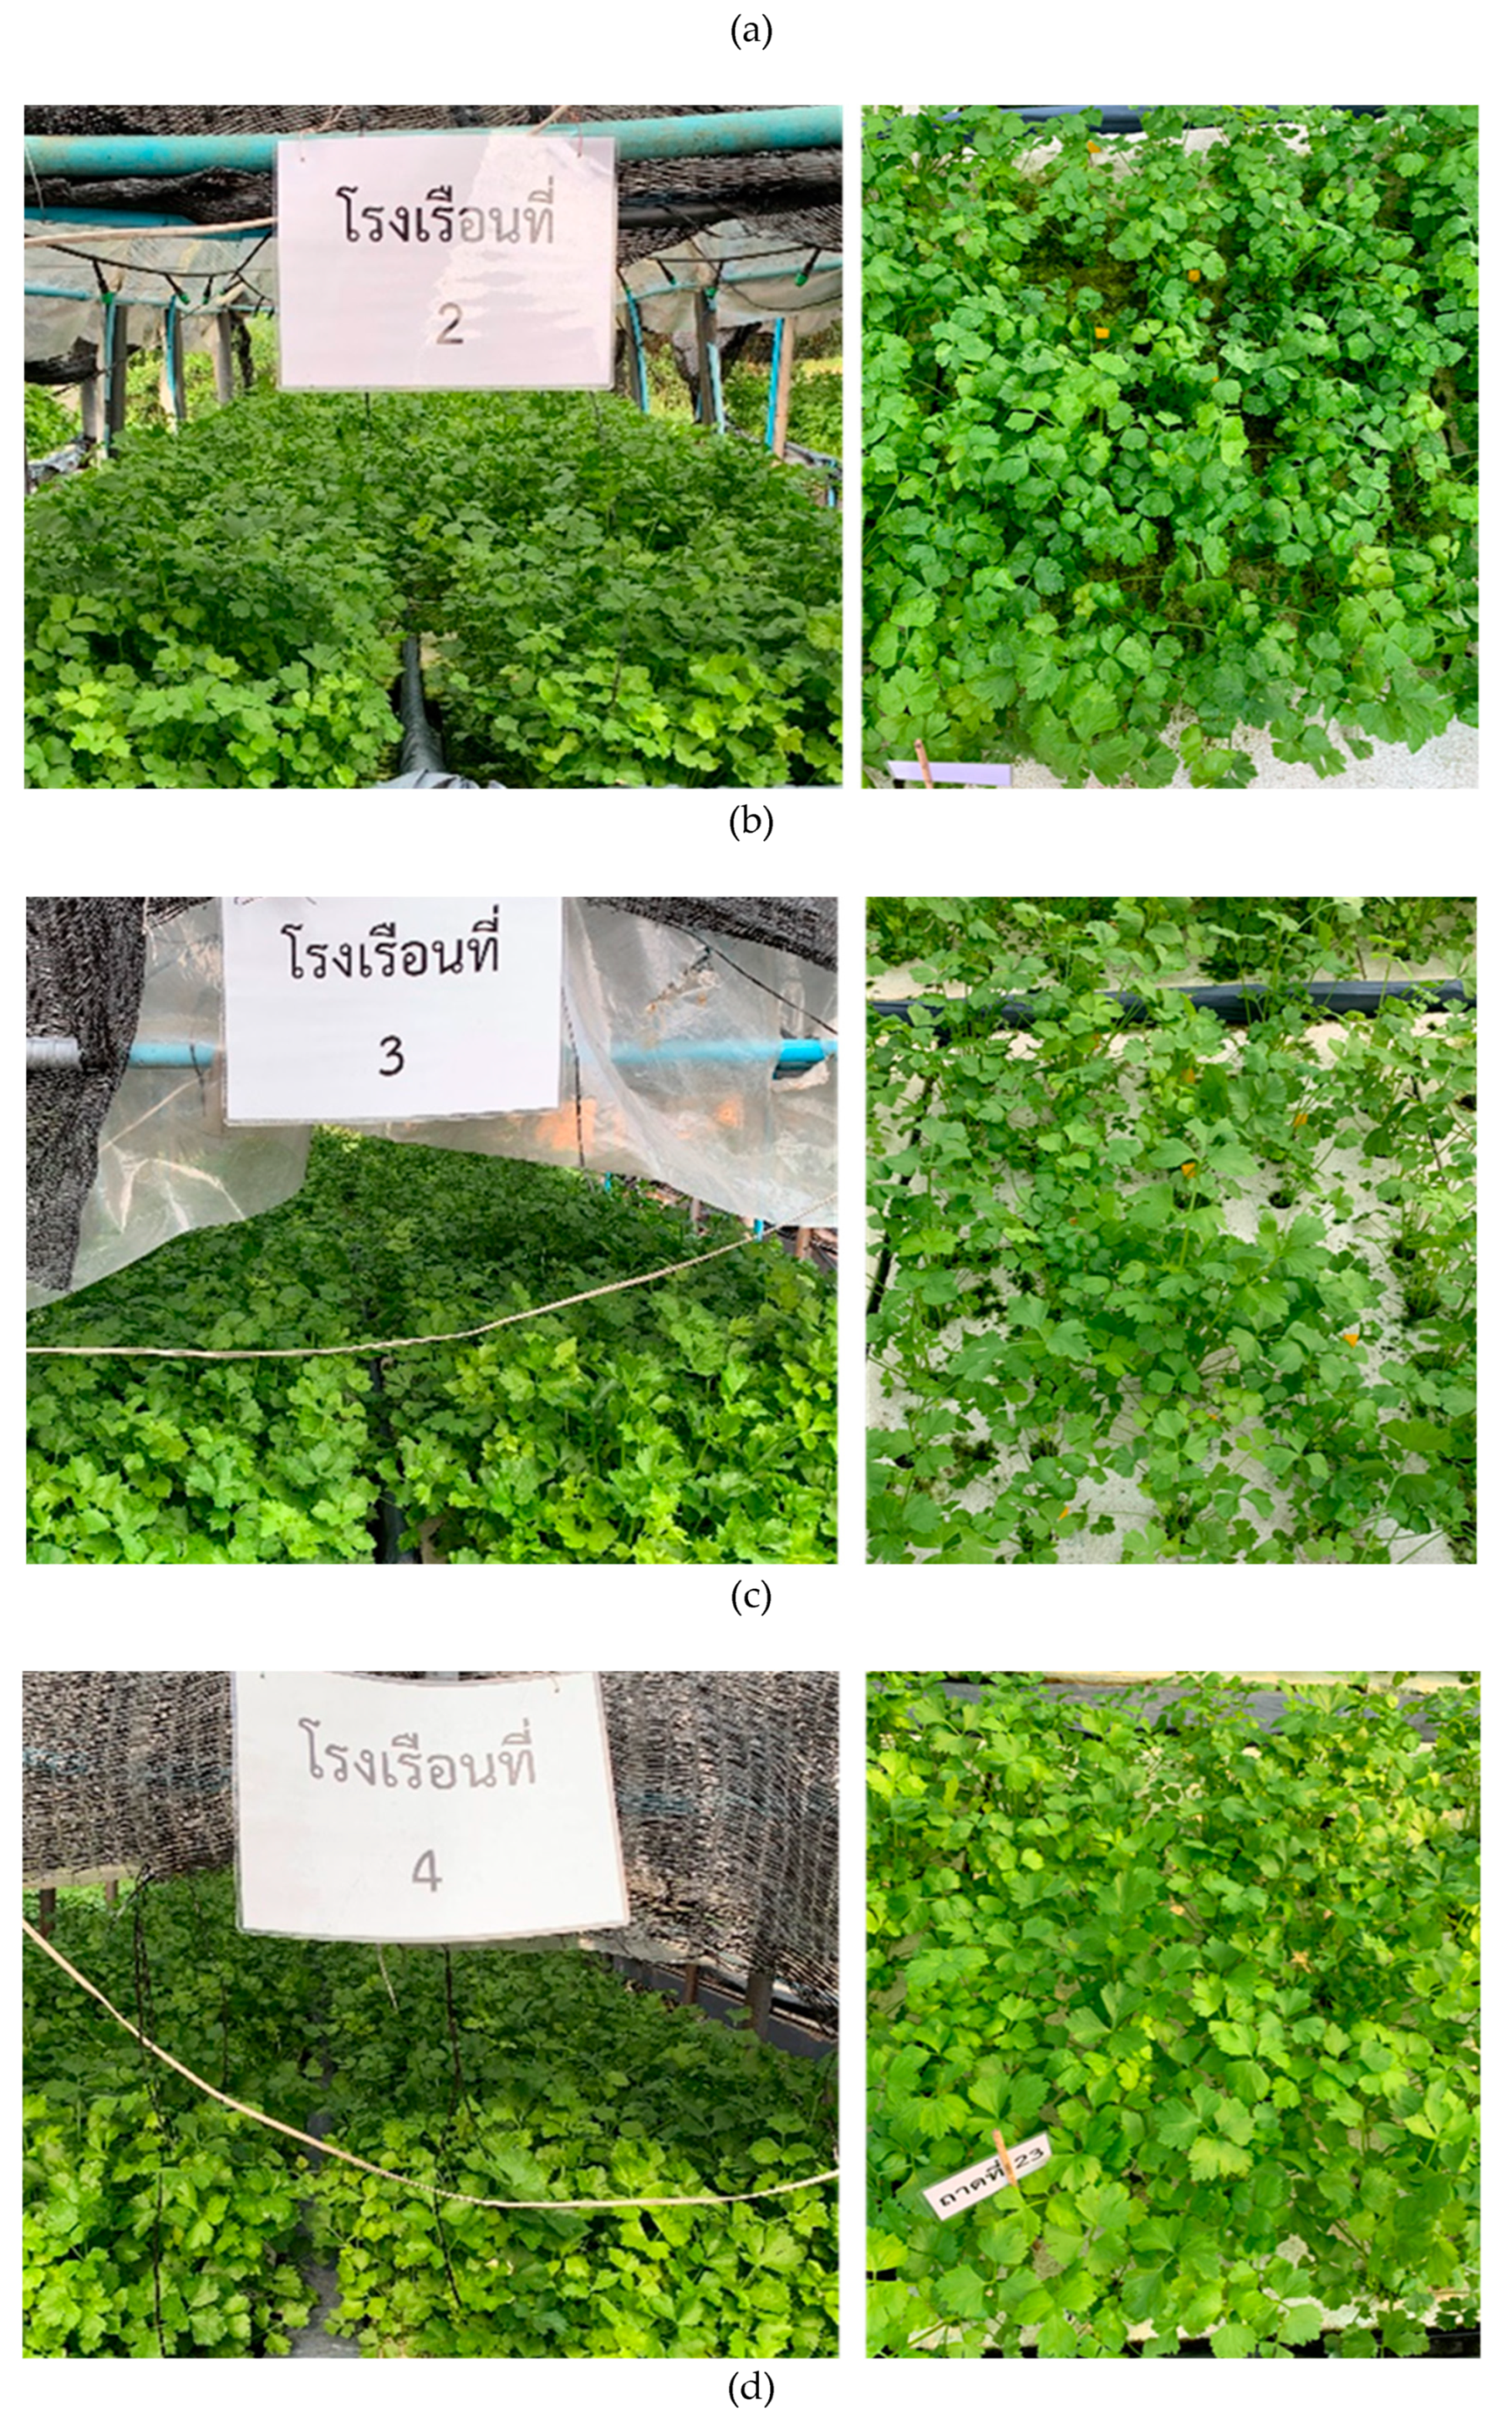
At this stage, the analysis focuses on the differences in the final harvest data before collecting the produce. The comparison is made between the three controlled greenhouses and the one uncontrolled greenhouse to determine the extent of any differences. The final harvest data will include two components: the final weight and the final height. The weight will be calculated based on the total yield from each greenhouse, while the height will be derived from the average height of the celery plants in each greenhouse, as recorded during the eighth data collection shown in
Figure 10.
Based on the data presented in
Table 4 and
Table 5, a comparative analysis was conducted to evaluate the differences in performance between the three controlled greenhouses (Greenhouse 1, 2, and 3, as depicted in Figures 10(a), 10(b), and 10(c), respectively) and the naturally operated greenhouse (Greenhouse 4, as illustrated in
Figure 10(d)). To facilitate this comparison, Greenhouse 4 was designated as the baseline, with its performance metrics normalized to 100%. The findings indicate that: Greenhouse 1, which is controlled for temperature and extends the photosynthesis period, shows a 13.91% increase in weight and a 10.94% increase in height. Greenhouse 2 , controlled only for temperature, shows a 5.26% increase in weight and a 9.69% increase in height. Greenhouse 3, with extend the photosynthesis period alone, shows a 0.75% increase in weight and a 3.44% increase in height.
Figure 10.
The celery yield from Greenhouse 1-4 resulted (a) Greenhouse 1 : weight of 30.3 kg and an average height of 28.45 cm. (b) Greenhouse 2 : weight of 28 kg and an average height of 28.21 cm. (c) Greenhouse 3 : weight of 26.8 kg and an average height of 26.52 cm. (d) Greenhouse 4 : weight of 26.6 kg and an average height of 25.64 cm.
4.2. Comparison of Differences between Temperature Control and Light Exposure Extension
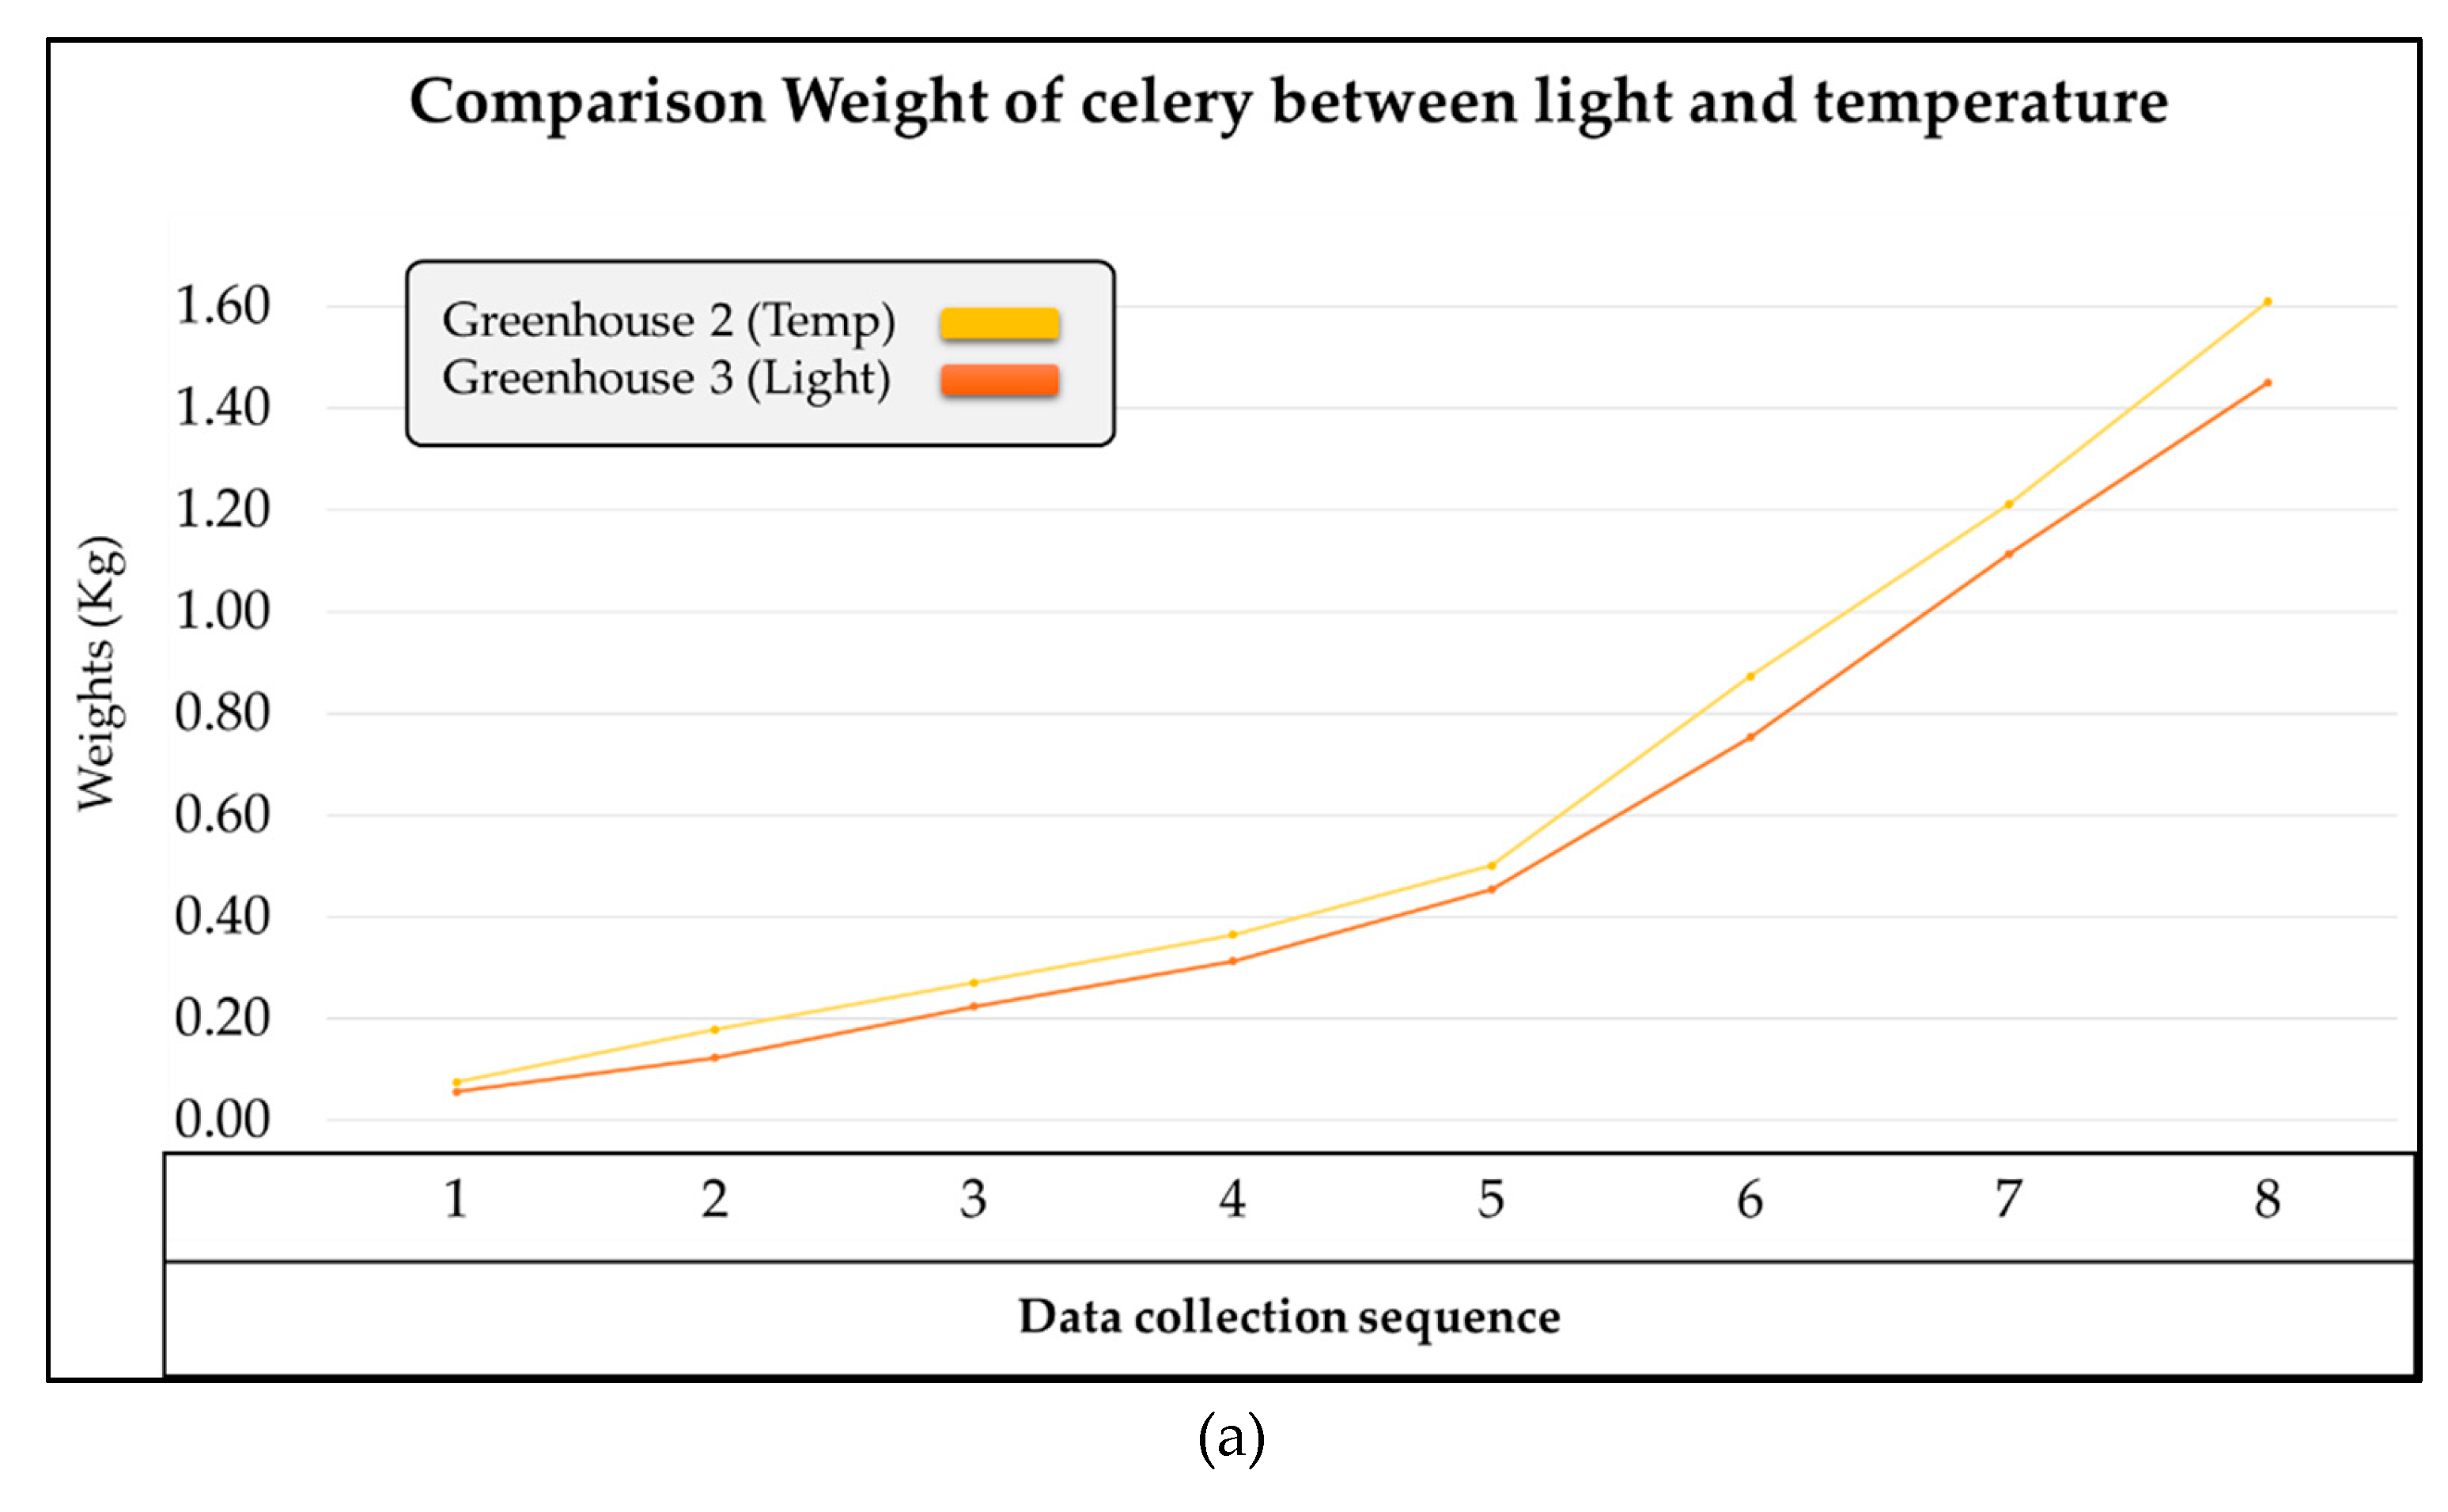
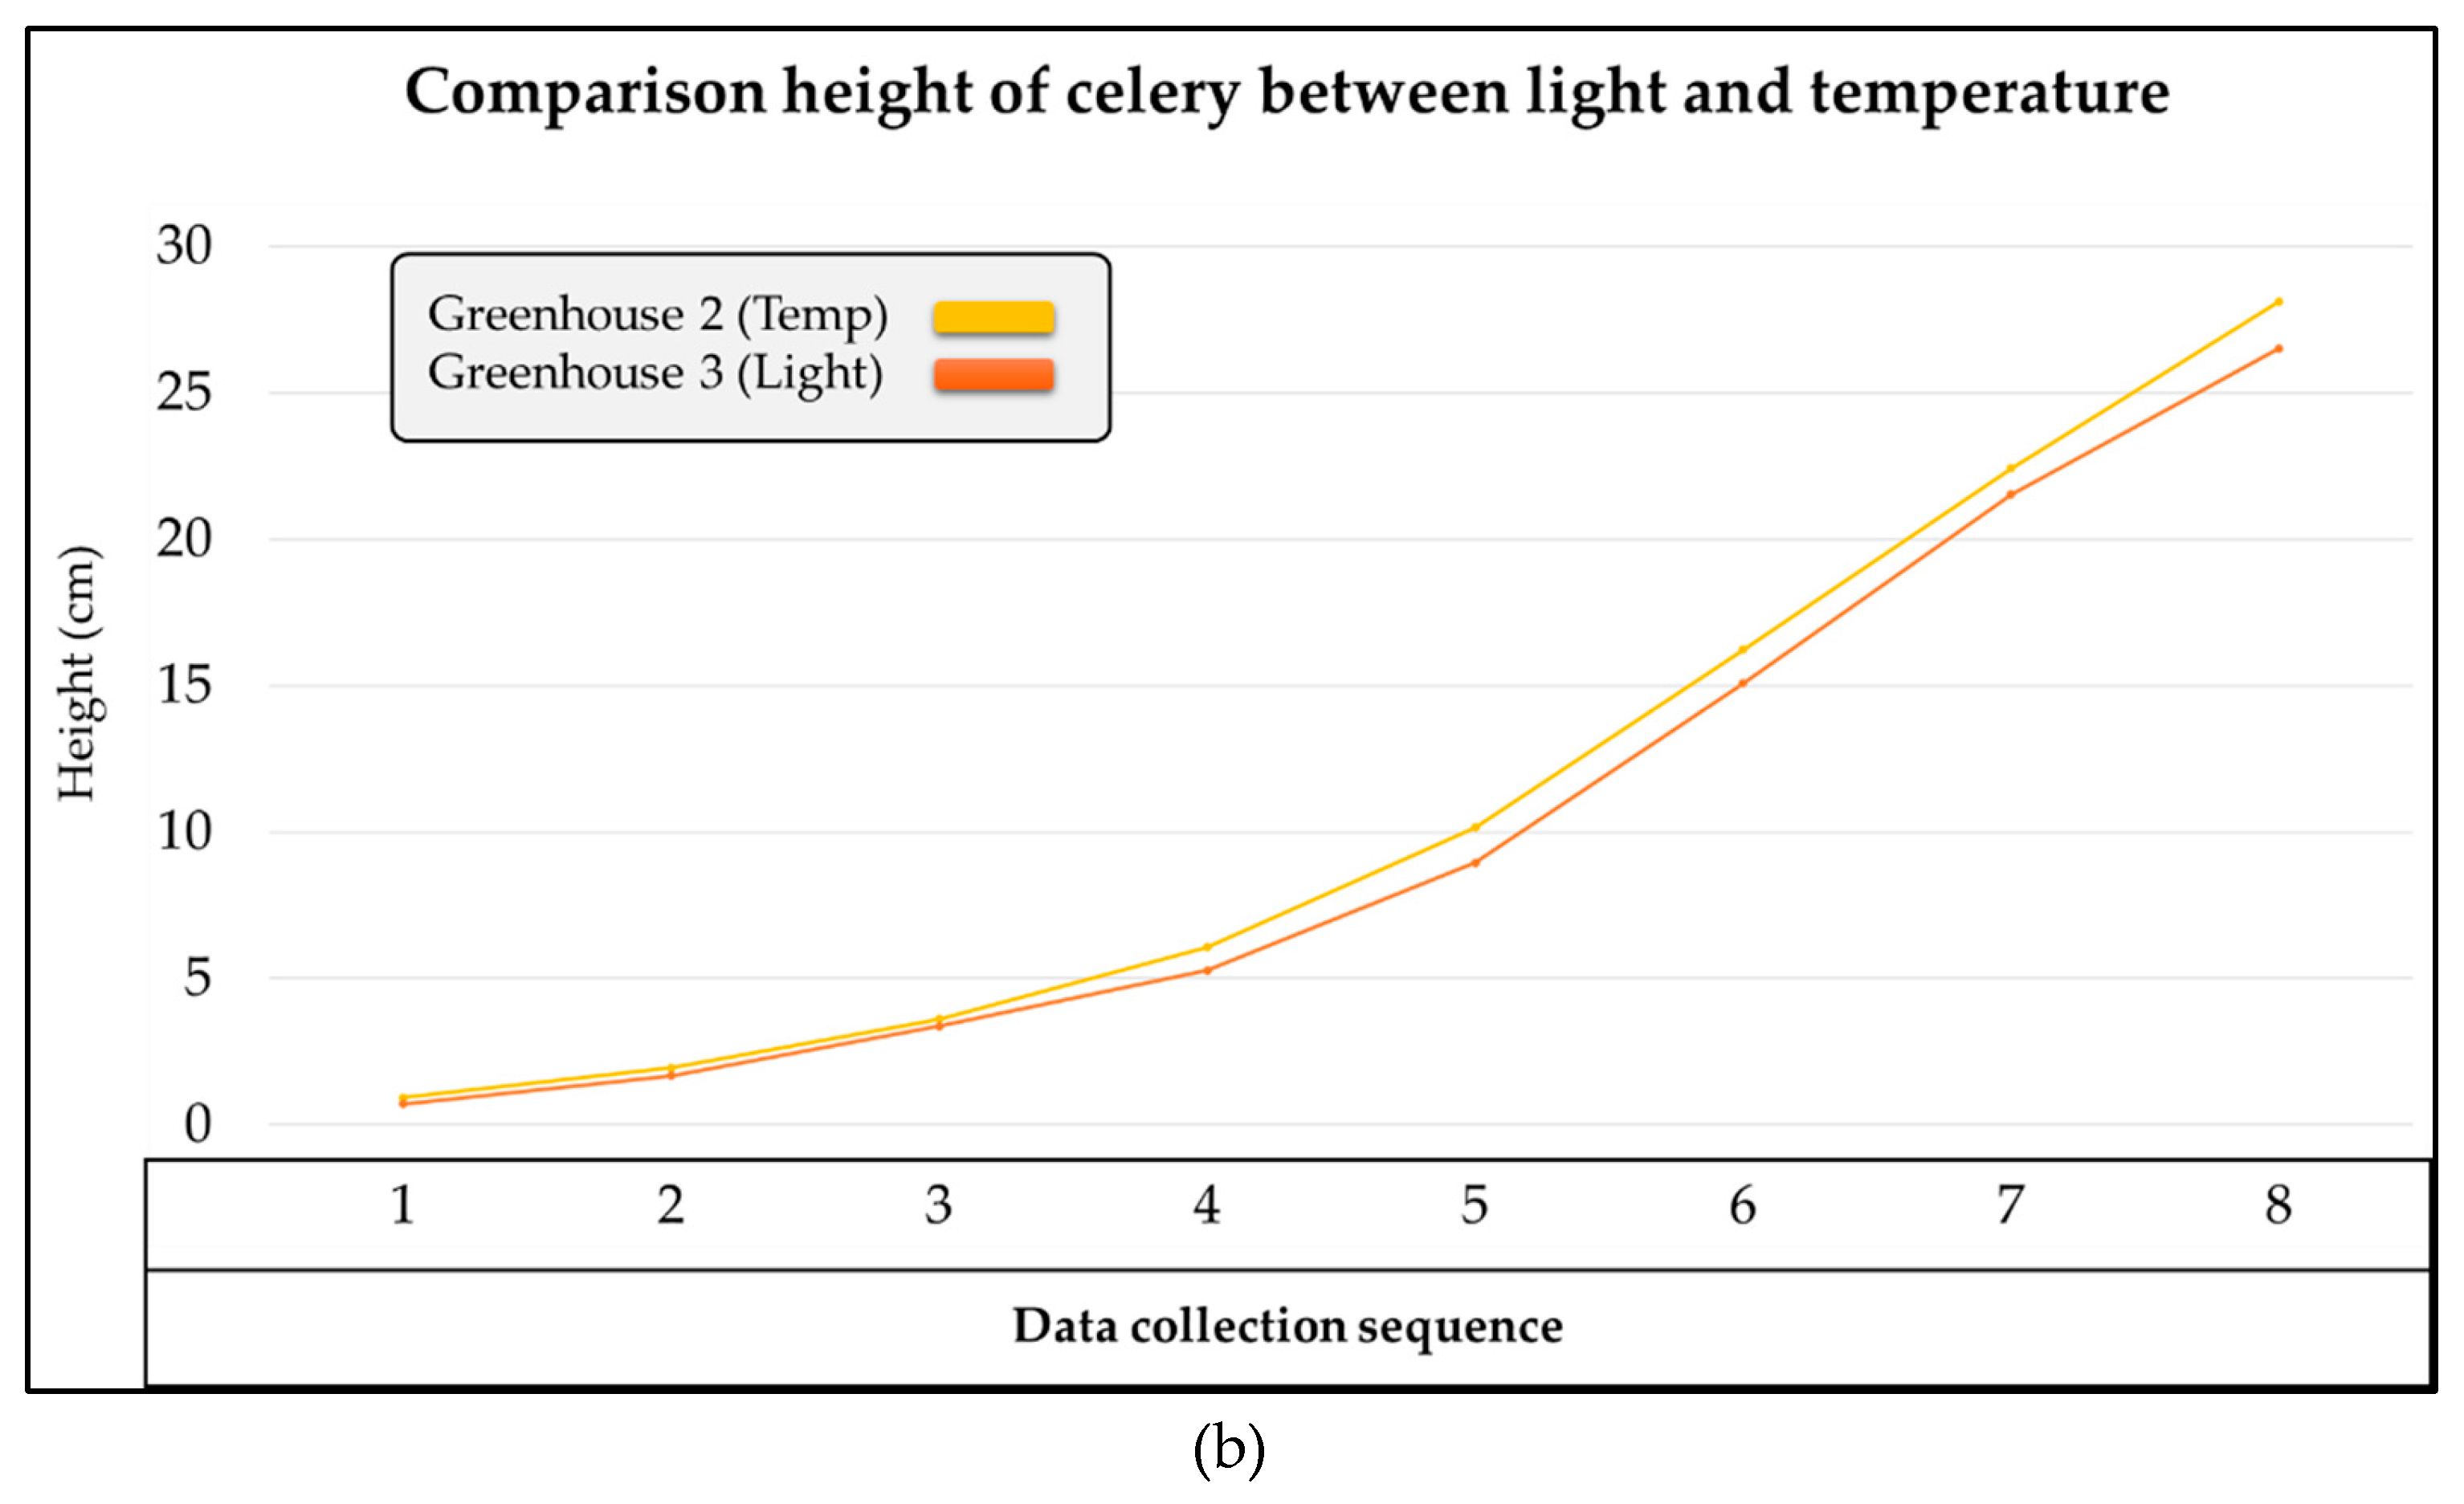
To determine the optimal factors for celery cultivation, the research team compared Greenhouse 2, which was controlled for temperature, with Greenhouse 3, which had extended light exposure. This comparison aims to identify the factors that influence celery growth. The trends in growth changes throughout the cultivation period can be observed in
Figure 11 (a) and (b), while the increases in yield are presented in
Table 6 and
Table 7. Greenhouse 3 was chosen as the baseline at 100% due to its minimal changes in weight and height.
From
Figure 11 the study on factors influencing celery growth, particularly the impact of temperature control within the greenhouse and the extension of light exposure for celery plants, concluded that, under the same environmental and water quality control conditions, temperature control is the most significant factor affecting celery growth. Compared to Greenhouse 3, it is evident from the growth trend graphs—both in terms of weight (
Figure 11(a)) and height (
Figure 11(b)) —that Greenhouse 2 exhibited superior growth in both height and weight at every data collection point. The final experimental results indicated that Greenhouse 2 achieved a weight increase of 4.48% and a height increase of 6.04% compared to Greenhouse 3.
4.3. Economic Analysis
This research project, supported by JMV Systems & Consulting Co., Ltd., aims to enhance the quality and quantity of agricultural yields through a smart farming system while studying the factors that most significantly affect the yields. The goal is to create a cost-effective and profitable smart farm system. Therefore, the research team conducted an economic analysis to determine the breakeven point for each greenhouse, considering the different sets of installed monitoring equipment and their respective payback periods.
The research team calculated the costs involved in designing and constructing each greenhouse, including sensors, electrical equipment, control units, and other necessary materials. Additionally, fixed costs such as electricity, liquid fertilizer, and seeds were considered. The breakeven point depends on the selling price of celery, which ranges from 25 to 180 Thai baht (0.69 – 5 USD$) per kilogram depending on the season, with an average annual selling price of 80 Thai baht (2.2 USD$) per kilogram. Hence, the average revenue was used for the calculations.
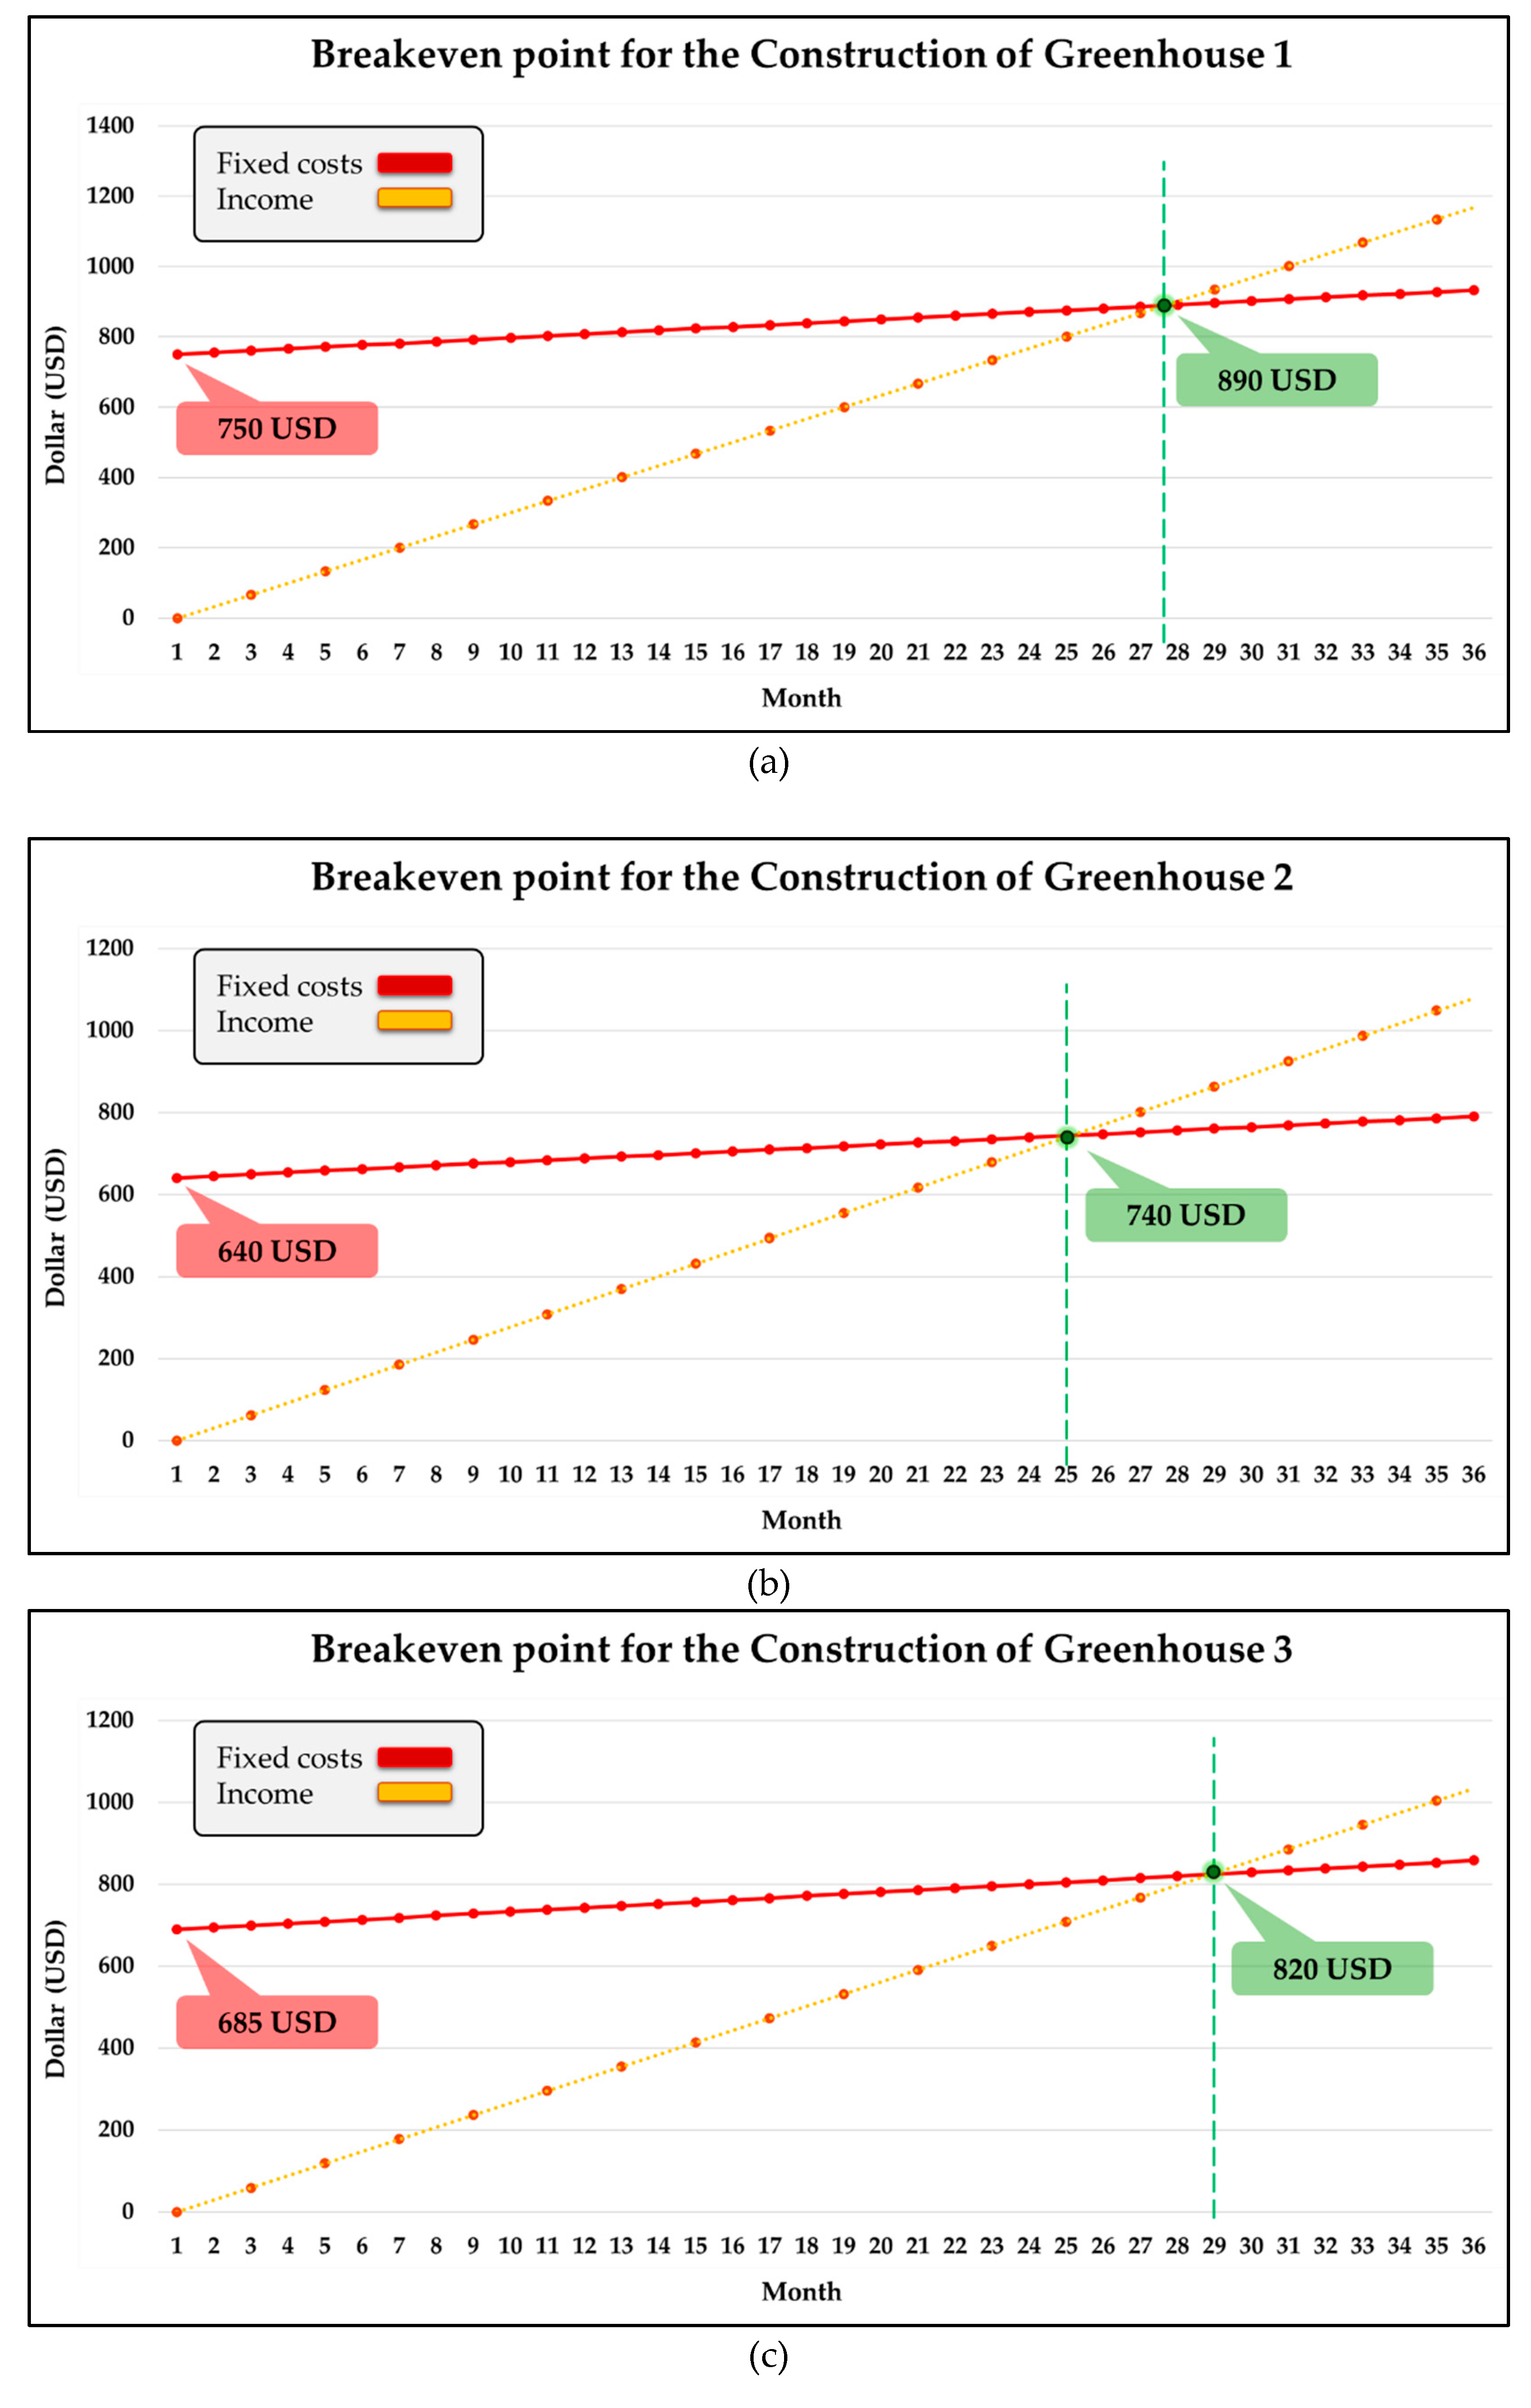
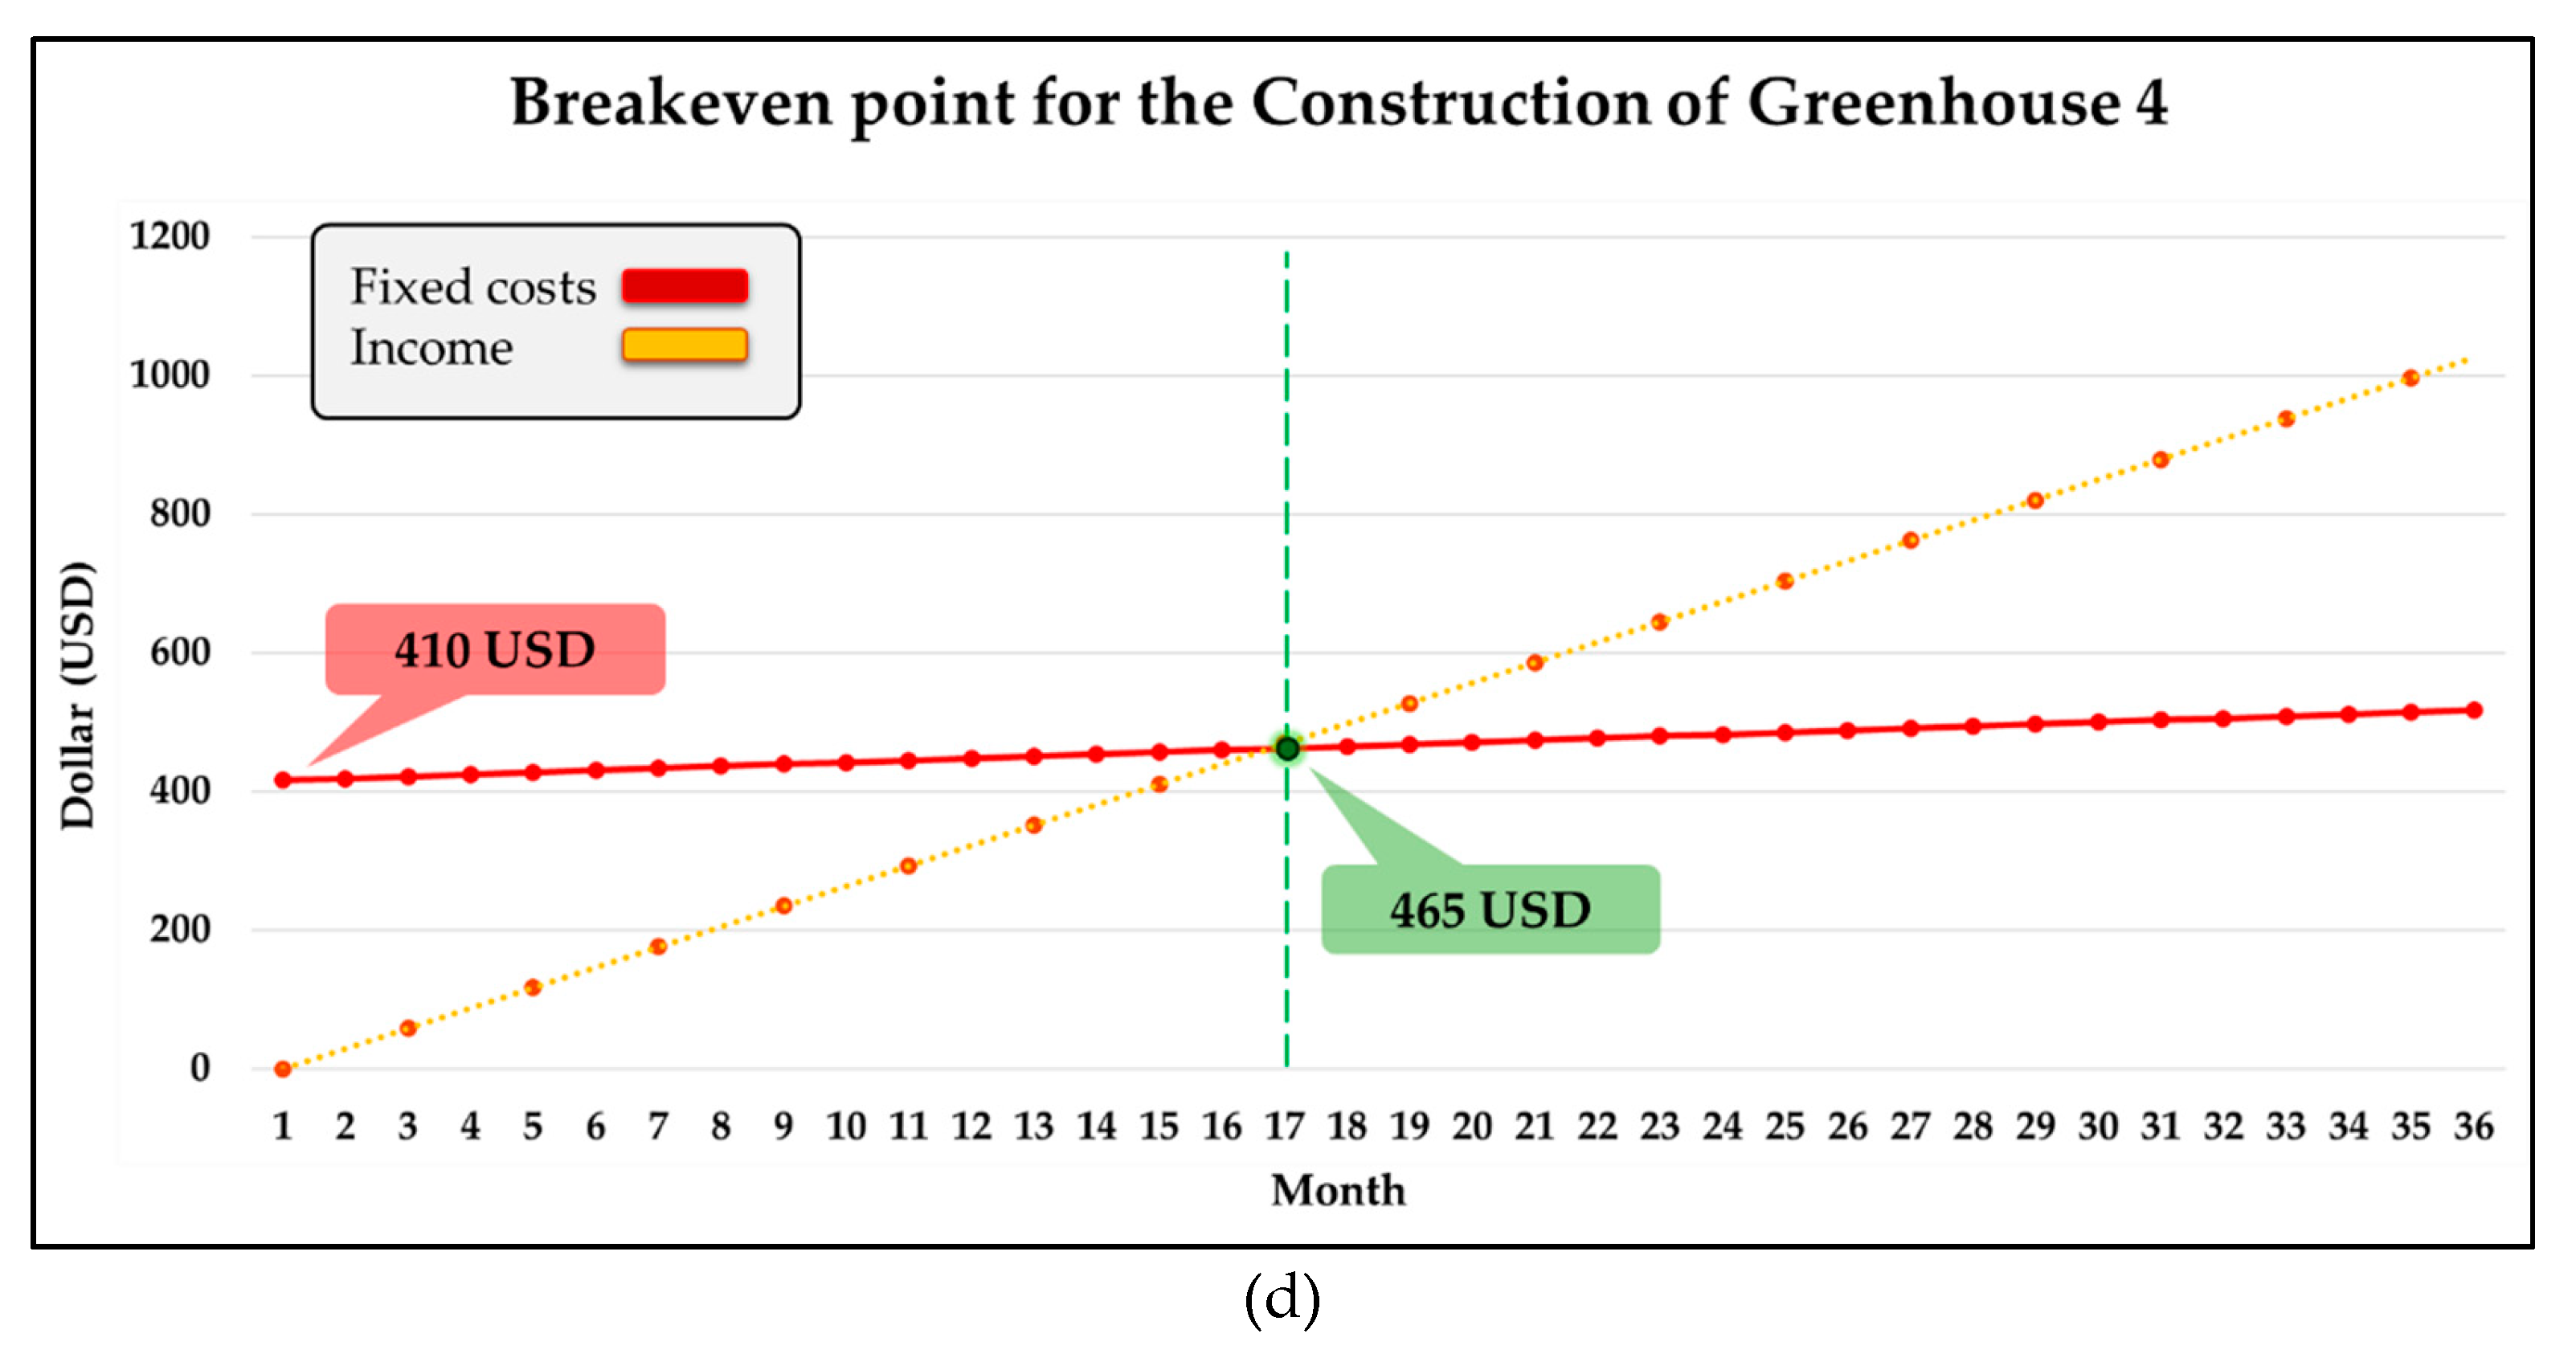
From
Figure 12, the cost analysis for constructing cultivation greenhouses shows that each greenhouse has different construction and monthly operating expenses. Therefore, the costs and breakeven points for each greenhouse can be calculated as follows:
Greenhouse 1 (
Figure 12 (a)): the cost analysis for constructing the cultivation greenhouse, which includes the installation of the irrigation system, sensor system, lighting system, control system, and other related equipment, indicates an initial expenditure of approximately 27,250 baht (750 USD). When combined with other expenses such as electricity, liquid fertilizer, and seed costs, the total monthly expenditure amounts to approximately 200 baht (5.5 USD). The breakeven period for Greenhouse 1, calculated from these costs, is approximately 27 months. Additionally, Greenhouse 1 generates 14% higher revenue compared to Greenhouse 4.
Greenhouse 2 (
Figure 12 (b)): the cost analysis for constructing the cultivation greenhouse, in-stalling the irrigation system, the control system, and other related equipment indicates an initial total expenditure of approximately 23,265 Thai baht (640 USD). When combined with other expenses such as monthly electricity, liquid fertilizer, and seed costs, the total monthly expenditure amounts to approximately 155 Thai baht (4.27 USD). The breakeven period for Greenhouse 2, calculated based on these costs, is approximately 27 months. Additionally, Greenhouse 2 yields a 5% higher revenue compared to Greenhouse 4.
Greenhouse 3 (
Figure 12 (c)): the cost analysis for constructing the cultivation greenhouse under Greenhouse 3 includes expenses for installing the control system and lighting. The initial total expenditure amounts to approximately 25,025 Thai baht (685 USD). The monthly operational expenses, including electricity, liquid fertilizer, and seed costs, total approximately 175 Thai baht (5 USD) per month. The breakeven period for Greenhouse 3 is calculated to be approximately 29 months. Additionally, Greenhouse 3 yields a 1% higher revenue compared to Greenhouse 4.
Greenhouse 4 (
Figure 12 (d)): Greenhouse 4, which does not include any control system installations, incurs an initial construction cost of approximately 15,105 Thai baht (410 USD). The monthly operational expenses, including water, fertilizer, and seed costs, amount to approximately 105 Thai baht (3 USD) per month. Referencing the average sell-ing price, the breakeven period for Greenhouse 4 is approximately 17 months.
5. Discussion
This study demonstrates that an IoT-controlled hydroponic system can significantly enhance the yield and quality of Chinese celery compared to traditional soil-based cultivation. The results indicated that temperature control played a more critical role in promoting celery growth than light exposure. This observation is consistent with previous research, which highlights the importance of maintaining optimal temperature conditions for the cultivation of leafy vegetables in hydroponic environments.
The integration of IoT technology with hydroponics allowed for precise monitoring and control of key environmental parameters, resulting in a more efficient and effective cultivation process. The use of sensors to measure temperature, humidity, pH, and electrical conductivity, coupled with the automated control of misting nozzles and grow lights, enabled a significant reduction in resource use and labor. This system not only improved the overall growth parameters but also ensured consistency in the quality of the produce.
Moreover, the economic analysis revealed that the IoT-controlled greenhouse is more profitable than traditional methods, with a shorter break-even period. The investment in technology was offset by higher yields and better-quality produce, leading to increased revenue. This study underscores the potential of smart farming technologies in transforming traditional agricultural practices and promoting sustainable farming.
6. Conclusions
This study demonstrates that an IoT-controlled hydroponic system can significantly enhance the yield and quality of Chinese celery compared to traditional soil-based cultivation. The results indicate that temperature control plays a more critical role than light exposure in promoting celery growth, which is consistent with previous research highlighting the importance of maintaining optimal temperature conditions for leafy vegetable cultivation in hydroponic environments.
The integration of IoT technology with hydroponics allows for precise monitoring and control of key environmental parameters, resulting in a more efficient and effective cultivation process. The use of sensors to measure temperature, humidity, pH, and electrical conductivity, coupled with the automated control of misting nozzles and LED lights, enables a significant reduction in resource usage and labor. This system not only improves the overall growth parameters but also ensures consistency in the quality of the produce.
Moreover, the economic analysis reveals that the IoT-controlled greenhouse is more profitable than traditional methods, with a shorter breakeven period. The investment in technology is justified by higher yields and better-quality produce, leading to increased revenue. This study underscores the potential of smart farming technologies in transforming traditional agricultural practices and promoting sustainable farming.
Future research should explore the application of this technology to other crops and in different environmental settings to further validate its effectiveness and adaptability. Additionally, advancements in sensor technology and data analytics could further enhance the precision and efficiency of IoT-controlled hydroponic systems.
Author Contributions
Conceptualization, Gittiwat Thananta; Data curation, Kusonsang Duangpakdee; Formal analysis, Kusonsang Duangpakdee; Investigation, Kusonsang Duangpakdee and Somboon Sukpancharoen; Project administration, Somboon Sukpancharoen; Resources, Kusonsang Duangpakdee; Software, Kusonsang Duangpakdee and Gittiwat Thananta; Supervision, Somboon Sukpancharoen; Validation, Gittiwat Thananta and Somboon Sukpancharoen; Writing – original draft, Kusonsang Duangpakdee and Gittiwat Thananta; Writing – review & editing, Somboon Sukpancharoen. All authors have read and agreed to the published version of the manuscript.
Funding
This research was funded by JMV Systems & Consulting Co., Ltd.
Acknowledgments
The authors acknowledge the support provided by JMV Systems & Consulting Co., Ltd. for funding and material support.
Conflicts of Interest
The authors declare no conflicts of interest. The funders had no role in the design of the study; in the collection, analyses, or interpretation of data; in the writing of the manuscript; or in the decision to publish the results.
References
- United Nations, Department of Economic and Social Affairs, Population Division. (2019). World Population Prospects 2019: Highlights. https://population.un.org/wpp/Publications/Files/WPP2019_Highlights.pdf.
- FAO. (2017). The future of food and agriculture – Trends and challenges. http://www.fao.org/3/i6583e/i6583e.pdf.
- Wolfert, S., Ge, L., Verdouw, C., & Bogaardt, M. J. (2017). Big data in smart farming–a review. Agricultural systems, 153, 69-80. [CrossRef]
- Soussi, A., Zero, E., Sacile, R., Trinchero, D., & Fossa, M. (2024). Smart Sensors and Smart Data for Precision Agriculture: A Review. Sensors, 24(8), 2647. [CrossRef]
- Elijah, O., Rahman, T. A., Orikumhi, I., Leow, C. Y., & Hindia, M. N. (2018). An overview of Internet of Things (IoT) and data analytics in agriculture: Benefits and challenges. IEEE Internet of things Journal, 5(5), 3758-3773. [CrossRef]
- García, L., Parra, L., Jimenez, J. M., Lloret, J., & Lorenz, P. (2020). IoT-based smart irrigation systems: An overview on the recent trends on sensors and IoT systems for irrigation in precision agriculture. Sensors, 20(4), 1042. [CrossRef]
- Dhanaraju, M., Chenniappan, P., Ramalingam, K., Pazhanivelan, S., & Kaliaperumal, R. (2022). Smart farming: Internet of Things (IoT)-based sustainable agriculture. Agriculture, 12(10), 1745. [CrossRef]
- Tatas, K., Al-Zoubi, A., Christofides, N., Zannettis, C., Chrysostomou, M., Panteli, S., & Antoniou, A. (2022). Reliable IoT-based monitoring and control of hydroponic systems. Technologies, 10(1), 26. [CrossRef]
- Sambo, P., Nicoletto, C., Giro, A., Pii, Y., Valentinuzzi, F., Mimmo, T., ... & Cesco, S. (2019). Hydroponic solutions for soilless production systems: issues and opportunities in a smart agriculture perspective. Frontiers in plant science, 10, 923. [CrossRef]
- Lakhiar, I. A., Gao, J., Syed, T. N., Chandio, F. A., & Buttar, N. A. (2018). Modern plant cultivation technologies in agriculture under controlled environment: A review on aeroponics. Journal of plant interactions, 13(1), 338-352. [CrossRef]
- Maucieri, C., Nicoletto, C., Van Os, E., Anseeuw, D., Van Havermaet, R., & Junge, R. (2019). Hydroponic technologies. Aquaponics food production systems, 10, 978-3.
- Kooti, W., & Daraei, N. (2017). A review of the antioxidant activity of celery (Apium graveolens L). Journal of evidence-based complementary & alternative medicine, 22(4), 1029-1034. [CrossRef]
- Kaur, G., Upadhyaya, P., & Chawla, P. (2023). Comparative analysis of IoT-based controlled environment and uncontrolled environment plant growth monitoring system for hydroponic indoor vertical farm. Environmental Research, 222, 115313. [CrossRef]
- Nikolov, N. V., Atanasov, A. Z., Evstatiev, B. I., Vladut, V. N., & Biris, S. S. (2023). Design of a Small-Scale Hydroponic System for Indoor Farming of Leafy Vegetables. Agriculture, 13(6), 1191. [CrossRef]
- Fernández-Cabanás, V. M., Delgado, A., Lobillo-Eguíbar, J. R., & Pérez-Urrestarazu, L. (2022). Early production of strawberry in aquaponic systems using commercial hydroponic bands. Aquacultural Engineering, 97, 102242. [CrossRef]
- Cambra, C., Sendra, S., Lloret, J., & Lacuesta, R. (2018). Smart system for bicarbonate control in irrigation for hydroponic precision farming. Sensors, 18(5), 1333. [CrossRef]
- Cruz, M., Mafra, S., Teixeira, E., & Figueiredo, F. (2022). Smart strawberry farming using edge computing and IoT. Sensors, 22(15), 5866. [CrossRef]
- The comparison of the efficience of nonparametric methods for detecting treatment effects in repeated measures in randomized complete block design . Paisalsing, S. (2003). Available online: https://sure.su.ac.th/xmlui/handle/123456789/8325?attempt=2& (accessed on 11 Feb 2024).
- Static table. Available online: https://www2.cs.science.cmu.ac.th/courses/201110/lib/exe/fetch.php?media=normal_table.pdf (accessed on 14 Feb 2024).
Figure 1.
(a) Hydroponic greenhouse structure (b) Foam growing trays for 50 celery plants per section, totaling 18-20 sections, accommodating 800-1,000 plants per greenhouse.
Figure 1.
(a) Hydroponic greenhouse structure (b) Foam growing trays for 50 celery plants per section, totaling 18-20 sections, accommodating 800-1,000 plants per greenhouse.
Figure 2.
Overview of the ESP32 and Blynk IoT greenhouse control system via dashboard.
Figure 2.
Overview of the ESP32 and Blynk IoT greenhouse control system via dashboard.
Figure 4.
A dashboard is employed for the display of data and management of system operations via the Blynk IoT platform.
Figure 4.
A dashboard is employed for the display of data and management of system operations via the Blynk IoT platform.
Figure 5.
The installation of measuring equipment within the greenhouse will be positioned identically across greenhouses conducting the same experiment.
Figure 5.
The installation of measuring equipment within the greenhouse will be positioned identically across greenhouses conducting the same experiment.
Figure 6.
Study plan to investigate factors affecting the growth of celery involves four greenhouses.
Figure 6.
Study plan to investigate factors affecting the growth of celery involves four greenhouses.
Figure 7.
Data collection sites for celery plants are designated within each greenhouse. Three specific locations will be selected for data gathering: the front, middle, and back of the greenhouse, allowing for the sampling of 80 plants per location.
Figure 7.
Data collection sites for celery plants are designated within each greenhouse. Three specific locations will be selected for data gathering: the front, middle, and back of the greenhouse, allowing for the sampling of 80 plants per location.
Figure 8.
Illustrates the changes in the weight of celery grown in all four greenhouses over an approximate 40-day cultivation period.
Figure 8.
Illustrates the changes in the weight of celery grown in all four greenhouses over an approximate 40-day cultivation period.
Figure 11.
Illustrates comparing (a) weight and (b) height between greenhouse 2 (Temp) and greenhouse 3 (Light).
Figure 11.
Illustrates comparing (a) weight and (b) height between greenhouse 2 (Temp) and greenhouse 3 (Light).
Figure 12.
Illustrates breakeven analysis for the construction of (a) Greenhouse 1 Construction prices start at 750USD. (b) Greenhouse 2 Construction prices start at 640USD. (c) Greenhouse 3 Construction prices start at 685USD. (d) Greenhouse 4 Construction prices start at 410USD. .
Figure 12.
Illustrates breakeven analysis for the construction of (a) Greenhouse 1 Construction prices start at 750USD. (b) Greenhouse 2 Construction prices start at 640USD. (c) Greenhouse 3 Construction prices start at 685USD. (d) Greenhouse 4 Construction prices start at 410USD. .
Table 1.
Tolerance of measuring equipment.
Table 1.
Tolerance of measuring equipment.
| Measuring equipment |
Measured value |
Standard value |
Tolerances (%) |
| Temperature (°C) |
36.6 |
36.1 |
1.366% |
| Water temperature (°C) |
29.0 |
28.6 |
1.379% |
| pH sensors |
9.18 |
9.10 |
0.817% |
| EC sensors (mS/cm) |
1413 |
1390 |
1.628% |
| humidity sensors (%) |
59.0 |
60.0 |
1.695% |
Table 2.
The weights of the produce prior to the harvest, recorded after 30 days of cultivation.
Table 2.
The weights of the produce prior to the harvest, recorded after 30 days of cultivation.
| Cultivation tray |
Greenhouse 1
(Kg) |
Greenhouse 2
(Kg) |
Greenhouse 3
(Kg) |
Greenhouse 4
(Kg) |
| 1 |
0.88 |
0.76 |
0.94 |
0.93 |
| 2 |
0.90 |
0.59 |
0.95 |
0.70 |
| 3 |
0.86 |
1.06 |
0.63 |
0.65 |
| 4 |
1.01 |
1.04 |
0.71 |
0.40 |
| 5 |
1.35 |
1.07 |
0.51 |
0.87 |
| 6 |
1.16 |
0.78 |
0.85 |
0.68 |
| 7 |
1.05 |
0.91 |
0.72 |
0.86 |
| 8 |
1.29 |
0.92 |
0.98 |
0.85 |
Table 3.
The weights data of the celery from
Table 2, after ranking, is used to calculate the average for each row and each column.
Table 3.
The weights data of the celery from
Table 2, after ranking, is used to calculate the average for each row and each column.
| Cultivation tray |
Greenhouse 1 (Kg) |
Greenhouse 2 (Kg) |
Greenhouse 3 (Kg) |
Greenhouse 4 (Kg) |
Avg
|
| 1 |
17 |
10 |
22 |
21 |
17.50 |
| 2 |
18 |
3 |
23 |
7 |
12.75 |
| 3 |
14 |
28 |
4 |
5 |
12.75 |
| 4 |
25 |
26 |
8 |
1 |
15.00 |
| 5 |
32 |
29 |
2 |
16 |
19.75 |
| 6 |
30 |
11 |
12 |
6 |
14.75 |
| 7 |
27 |
19 |
9 |
14 |
17.25 |
| 8 |
31 |
20 |
24 |
12 |
21.75 |
| Avg |
24.25 |
18.25 |
13.00 |
10.25 |
16.44 |
Table 4.
Results of comparing the weight of each greenhouse.
Table 4.
Results of comparing the weight of each greenhouse.
| Greenhouse |
Final weight (Kg) |
Increased quantity (%) |
| 1 |
30.3 |
113.91% |
| 2 |
28.0 |
105.26% |
| 3 |
26.8 |
100.75% |
| 4 |
26.6 |
100.00% |
Table 5.
Results of comparing the height of each greenhouse.
Table 5.
Results of comparing the height of each greenhouse.
| Greenhouse |
Final height (cm) |
Increased quantity (%) |
| 1 |
28.445 |
110.94% |
| 2 |
28.124 |
109.69% |
| 3 |
26.521 |
103.44% |
| 4 |
25.639 |
100.00% |
Table 6.
Results of comparing the weight between greenhouse 2 (Temp) and greenhouse 3 (Light).
Table 6.
Results of comparing the weight between greenhouse 2 (Temp) and greenhouse 3 (Light).
| Greenhouse |
Final weight (Kg) |
Increased quantity (%) |
| 2 |
28.0 |
104.48% |
| 3 |
26.8 |
100.00% |
Table 7.
Results of comparing the height between greenhouse 2 (Temp) and greenhouse 3 (Light).
Table 7.
Results of comparing the height between greenhouse 2 (Temp) and greenhouse 3 (Light).
| Greenhouse |
Final height (cm) |
Increased quantity (%) |
| 2 |
28.124 |
106.04% |
| 3 |
26.521 |
100.00% |
|
Disclaimer/Publisher’s Note: The statements, opinions and data contained in all publications are solely those of the individual author(s) and contributor(s) and not of MDPI and/or the editor(s). MDPI and/or the editor(s) disclaim responsibility for any injury to people or property resulting from any ideas, methods, instructions or products referred to in the content. |
© 2024 by the authors. Licensee MDPI, Basel, Switzerland. This article is an open access article distributed under the terms and conditions of the Creative Commons Attribution (CC BY) license (http://creativecommons.org/licenses/by/4.0/).
