Submitted:
27 May 2024
Posted:
27 May 2024
You are already at the latest version
Abstract
Keywords:
1. Introduction
2. Results
2.1. Measurement of Physiological Indices Related to Drought Damage
2.2. Changes in Flavonoid Level under Drought Stress
2.3. Identification of Flavonoid-Related Candidate Genes through Transcriptome Analysis
2.4. Expression Patterns of Phenylpropanoid Biosynthetic Genes under Drought Stress
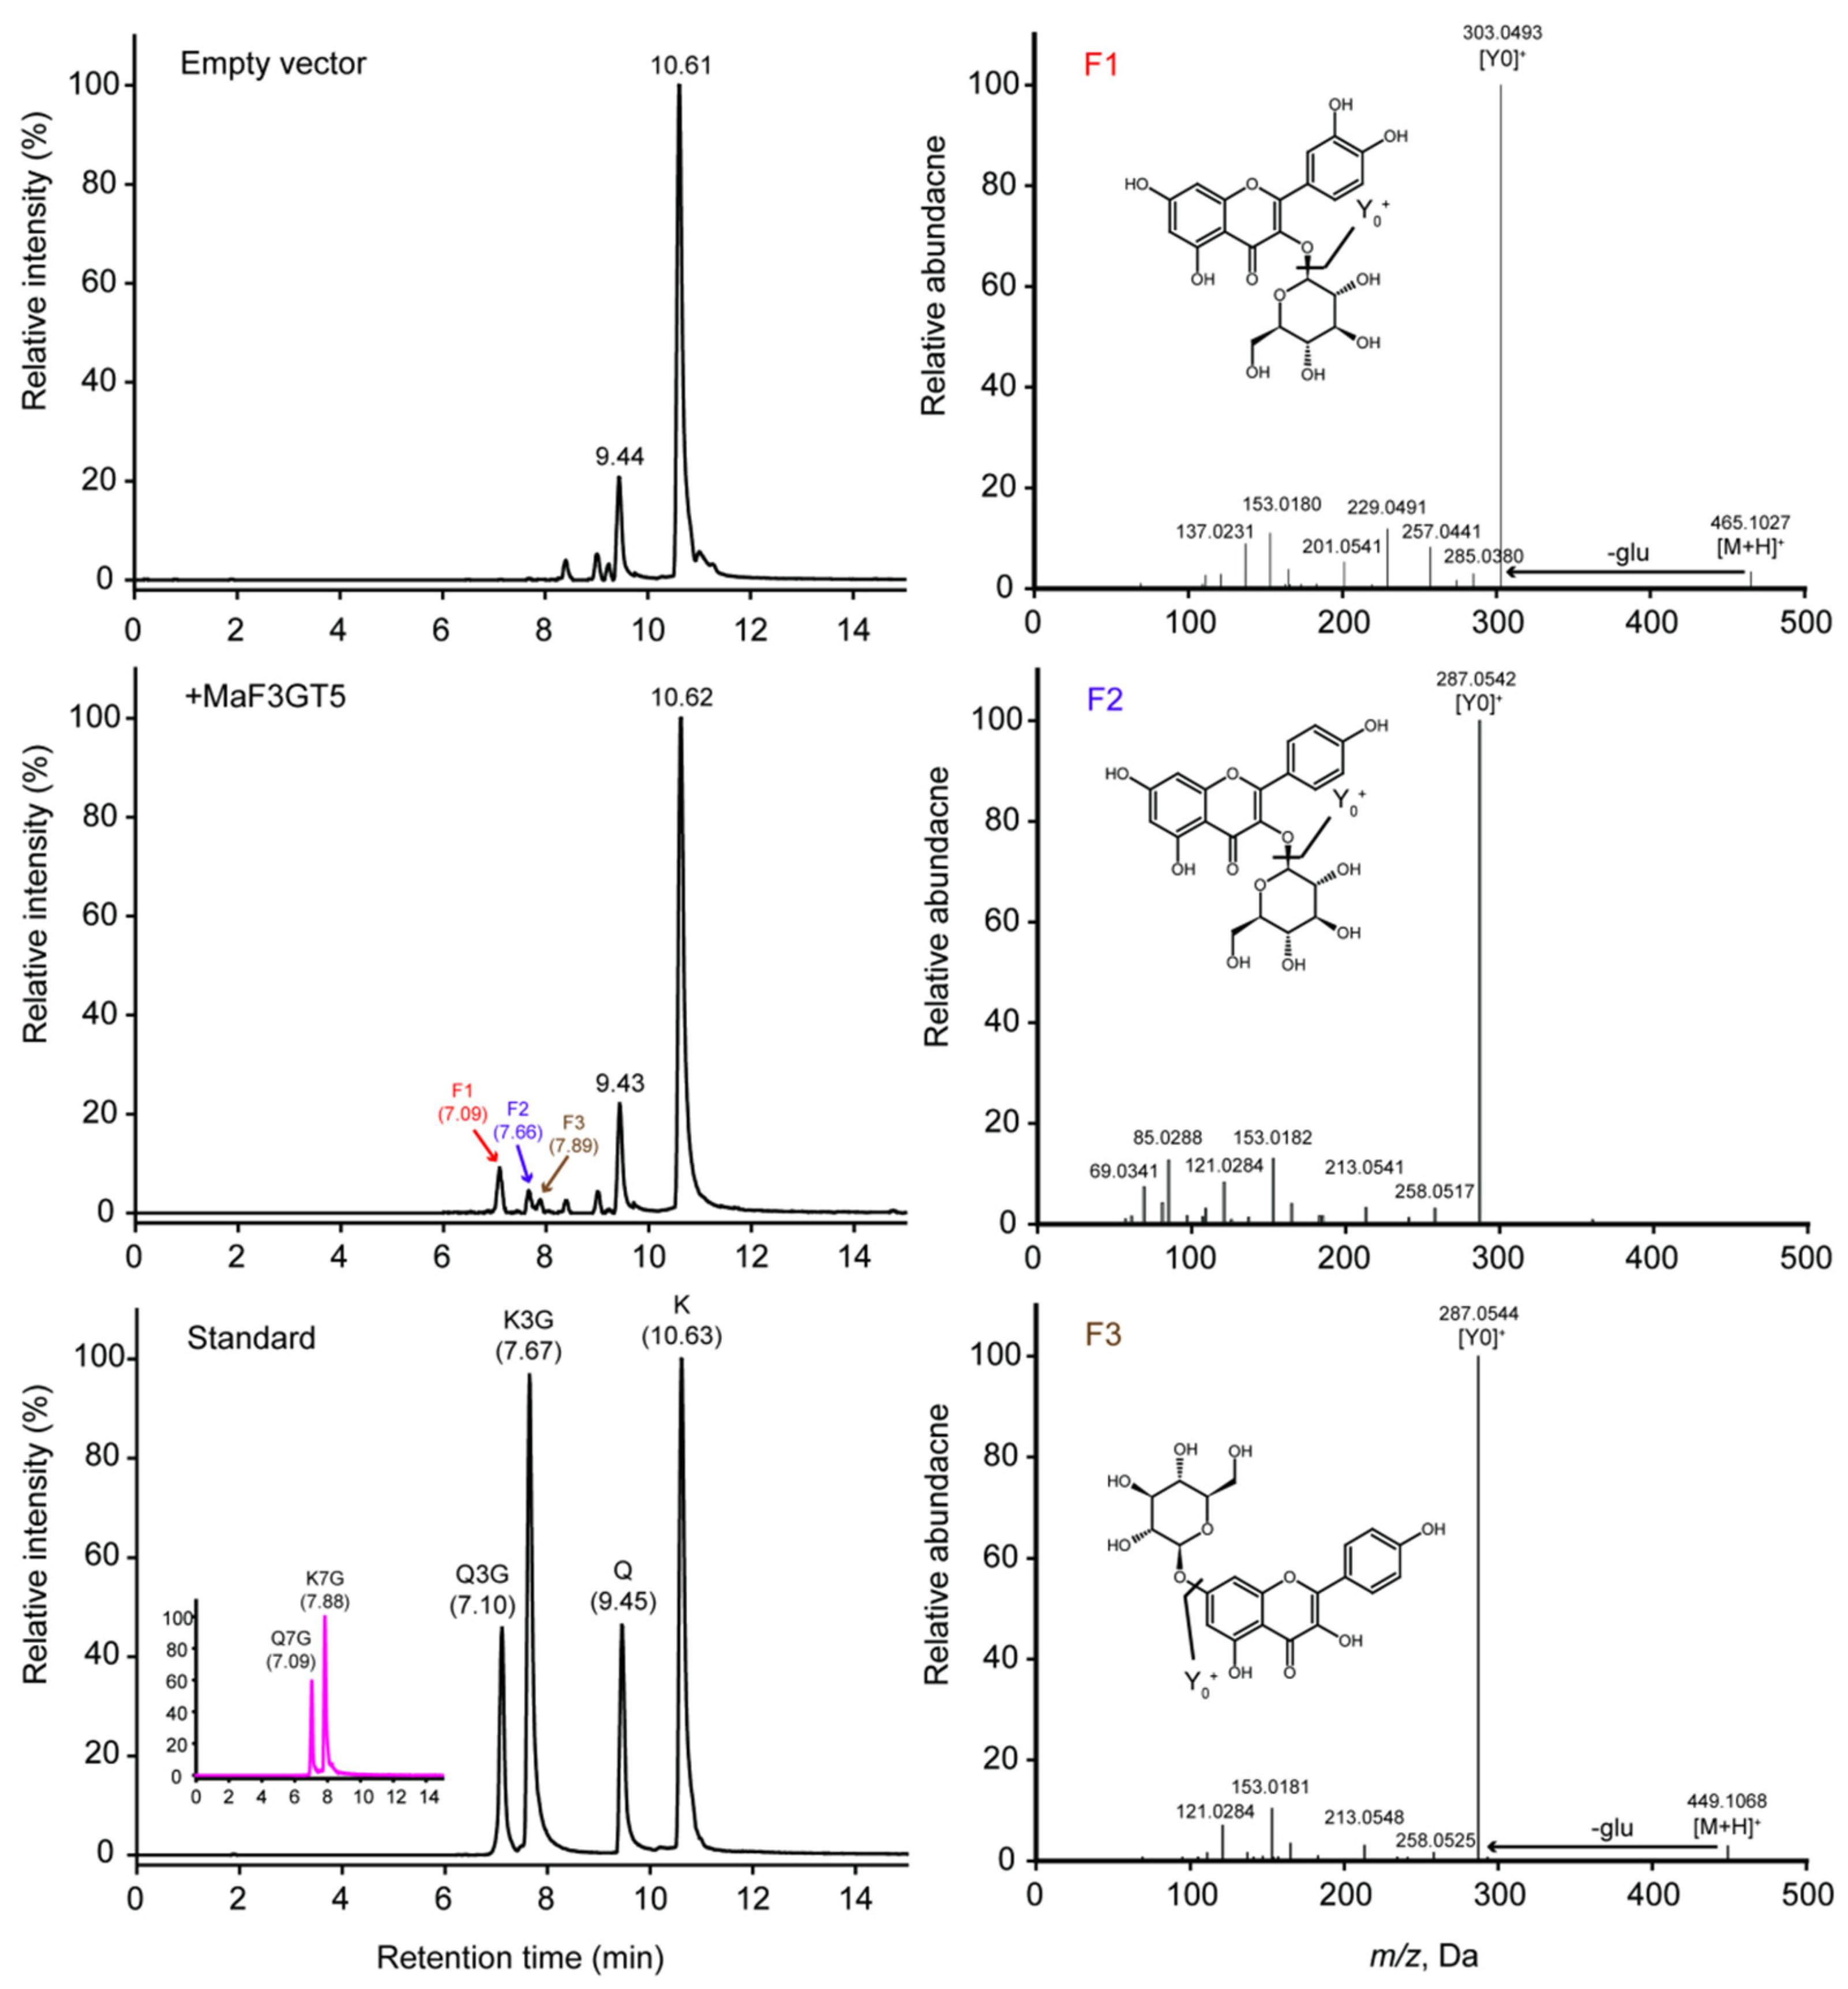
2.5. Characterization of Recombinant MaFLS1 and MaF3GT5 Enzyems
3. Discussion
4. Material and Methods
4.1. Plant Materials and Drought Treatment
4.2. Sample Extraction for Metabolomic Analysis
4.3. UHPLC-MS/MS Analysis Conditions
4.4. Transcriptome Sequencing, Assembly, and Analysis
4.5. Quantitative Real-Time PCR
4.6. Production of Recombinant Protein, In Vitro Enzyme Assay, and Fermentation Test
4.7. Chemicals and Standards
4.8. Statistical Analyses
5. Conclusion
Supplementary Materials
Authors’ Contributions
Funding
Notes
References
- Bhaskarla, V.; Zinta, G.; Ford, R.; Jain, M.; Varshney, R.K.; Mantri, N. Comparative Root Transcriptomics Provide Insights into Drought Adaptation Strategies in Chickpea (Cicer arietinum L.). Int. J. Mol. Sci. 2020, 21, 1781, . [CrossRef]
- Zhang, Q.; Han, L.; Jia, J.; Song, L.; Wang, J.S. Management of drought risk under global warming. Theor. Appl. Climatol. 2016, 125, 187–196.
- Yu, F.; Wan, W.; Lv, M.-J.; Zhang, J.-L.; Meng, L.-S. Molecular Mechanism Underlying the Effect of the Intraspecific Alternation of Seed Size on Plant Drought Tolerance. J. Agric. Food Chem. 2020, 68, 703–711, . [CrossRef]
- Wang, J.; Zhang, L.; Cao, Y.; Qi, C.; Li, S.; Liu, L.; Wang, G.; Mao, A.; Ren, S.; Guo, Y.-D. CsATAF1 Positively Regulates Drought Stress Tolerance by an ABA-Dependent Pathway and by Promoting ROS Scavenging in Cucumber. Plant Cell Physiol. 2018, 59, 930–945, . [CrossRef]
- Cao, P.; Yang, J.; Xia, L.; Zhang, Z.; Wu, Z.; Hao, Y.; Liu, P.; Wang, C.; Li, C.; Yang, J.; et al. Two gene clusters and their positive regulator SlMYB13 that have undergone domestication-associated negative selection control phenolamide accumulation and drought tolerance in tomato. Mol. Plant 2024, 17, 579–597, . [CrossRef]
- Scharwies, J. D.; Dinneny, J. R., Water transport, perception, and response in plants. J Plant Res 2019, 132, (3), 311-324.
- Li, S.; Li, X.; Wei, Z.; Liu, F. ABA-mediated modulation of elevated CO2 on stomatal response to drought. Curr. Opin. Plant Biol. 2020, 56, 174–180, . [CrossRef]
- Guha, A.; Rasineni, G.K.; Reddy, A.R. DROUGHT TOLERANCE IN MULBERRY (MORUS SPP.): A PHYSIOLOGICAL APPROACH WITH INSIGHTS INTO GROWTH DYNAMICS AND LEAF YIELD PRODUCTION. Exp. Agric. 2010, 46, 471–488, . [CrossRef]
- Gao, G.; Lv, Z.; Zhang, G.; Li, J.; Zhang, J.; He, C. An ABA–flavonoid relationship contributes to the differences in drought resistance between different sea buckthorn subspecies. Tree Physiol. 2021, 41, 744–755, . [CrossRef]
- Corso, M.; Vannozzi, A.; Maza, E.; Vitulo, N.; Meggio, F.; Pitacco, A.; Telatin, A.; D’angelo, M.; Feltrin, E.; Negri, A.S.; et al. Comprehensive transcript profiling of two grapevine rootstock genotypes contrasting in drought susceptibility links the phenylpropanoid pathway to enhanced tolerance. J. Exp. Bot. 2015, 66, 5739–5752, . [CrossRef]
- He, N.; Zhang, C.; Qi, X.; Zhao, S.; Tao, Y.; Yang, G.; Lee, T.-H.; Wang, X.; Cai, Q.; Li, D.; et al. Draft genome sequence of the mulberry tree Morus notabilis. Nat. Commun. 2013, 4, 2445. [CrossRef]
- Srivastava, S.; Kapoor, R.; Thathola, A.; Srivastava, R. P., Mulberry (Morus alba) leaves as human food: a new dimension of sericulture. Int. J. Food Sci. Nutr. 2003, 54, (6), 411-416.
- Li, D.; Chen, G.; Ma, B.; Zhong, C.; He, N. Metabolic Profiling and Transcriptome Analysis of Mulberry Leaves Provide Insights into Flavonoid Biosynthesis. J. Agric. Food Chem. 2020, 68, 1494–1504, . [CrossRef]
- Hunyadi, A.; Liktor-Busa, E.; Márki, .; Martins, A.; Jedlinszki, N.; Hsieh, T.J.; Báthori, M.; Hohmann, J.; Zupkó, I. Metabolic Effects of Mulberry Leaves: Exploring Potential Benefits in Type 2 Diabetes and Hyperuricemia. Evidence-Based Complement. Altern. Med. 2013, 2013, 1–10, . [CrossRef]
- Wen, P.; Hu, T.-G.; Linhardt, R.J.; Liao, S.-T.; Wu, H.; Zou, Y.-X. Mulberry: A review of bioactive compounds and advanced processing technology. Trends Food Sci. Technol. 2019, 83, 138–158, . [CrossRef]
- Chaitanya, K.V.; Rasineni, G.K.; Reddy, A.R. Biochemical responses to drought stress in mulberry (Morus alba L.): evaluation of proline, glycine betaine and abscisic acid accumulation in five cultivars. Acta Physiol. Plant. 2009, 31, 437–443, . [CrossRef]
- Li, H.; Li, D.; Yang, Z.; Zeng, Q.; Luo, Y.; He, N. Flavones Produced by Mulberry Flavone Synthase Type I Constitute a Defense Line against the Ultraviolet-B Stress. Plants 2020, 9, 215, . [CrossRef]
- Katsube, T.; Imawaka, N.; Kawano, Y.; Yamazaki, Y.; Shiwaku, K.; Yamane, Y. Antioxidant flavonol glycosides in mulberry (Morus alba L.) leaves isolated based on LDL antioxidant activity. Food Chem. 2006, 97, 25–31, . [CrossRef]
- Chen, A.Y.; Chen, Y.C. A review of the dietary flavonoid, kaempferol on human health and cancer chemoprevention. Food Chem. 2013, 138, 2099–2107, doi:10.1016/j.foodchem.2012.11.139.
- Zhao, S.; Park, C.H.; Li, X.; Kim, Y.B.; Yang, J.; Sung, G.B.; Park, N.I.; Kim, S.; Park, S.U. Accumulation of Rutin and Betulinic Acid and Expression of Phenylpropanoid and Triterpenoid Biosynthetic Genes in Mulberry (Morus alba L.). J. Agric. Food Chem. 2015, 63, 8622–8630, . [CrossRef]
- Gharibi, S.; Tabatabaei, B.E.S.; Saeidi, G.; Talebi, M.; Matkowski, A. The effect of drought stress on polyphenolic compounds and expression of flavonoid biosynthesis related genes in Achillea pachycephala Rech.f. Phytochemistry 2019, 162, 90–98, . [CrossRef]
- Li, B.; Fan, R.; Sun, G.; Sun, T.; Fan, Y.; Bai, S.; Guo, S.; Huang, S.; Liu, J.; Zhang, H.; et al. Flavonoids improve drought tolerance of maize seedlings by regulating the homeostasis of reactive oxygen species. Plant Soil 2021, 461, 389–405, . [CrossRef]
- Niu, Y.; Li, J.; Sun, F.; Song, T.; Han, B.; Liu, Z.; Su, P. Comparative transcriptome analysis reveals the key genes and pathways involved in drought stress response of two wheat (Triticum aestivum L) varieties. Genomics 2023, 115, 110688, . [CrossRef]
- Lucci, N.; Mazzafera, P. Distribution of rutin in fava d'anta (Dimorphandra mollis) seedlings under stress. J. Plant Interactions 2009, 4, 203–208, . [CrossRef]
- Li, D.; Ma, B.; Xu, X.; Chen, G.; Li, T.; He, N. MMHub, a database for the mulberry metabolome. Database 2020, 2020, . [CrossRef]
- Liu, F. R.; Xie, L. F.; Yao, Z. Y.; Zhou, Y. L.; Zhou, W. F.; Wang, J. H.; Sun, Y. Y.; Gong, C. M., Caragana korshinskii phenylalanine ammonialyase is up-regulated in the phenylpropanoid biosynthesis pathway in response to drought stress. Biotechnol Biotec Eq 2019, 33, (1), 842-854.
- Li, M.; Li, H.; Sun, A.; Wang, L.; Ren, C.; Liu, J.; Gao, X. Transcriptome analysis reveals key drought-stress-responsive genes in soybean. Front. Genet. 2022, 13, 1060529, . [CrossRef]
- Cao, X.; Hu, Y.; Song, J.; Feng, H.; Wang, J.; Chen, L.; Wang, L.; Diao, X.; Wan, Y.; Liu, S.; et al. Transcriptome Sequencing and Metabolome Analysis Reveals the Molecular Mechanism of Drought Stress in Millet. Int. J. Mol. Sci. 2022, 23, 10792, . [CrossRef]
- Liu, H.; Sun, H.; Bao, L.; Han, S.; Hui, T.; Zhang, R.; Zhang, M.; Su, C.; Qian, Y.; Jiao, F. Secondary Metabolism and Hormone Response Reveal the Molecular Mechanism of Triploid Mulberry (Morus Alba L.) Trees Against Drought. Front. Plant Sci. 2021, 12, . [CrossRef]
- Yang, J.; Chen, R.; Wang, C.; Li, C.; Ye, W.; Zhang, Z.; Wang, S. A widely targeted metabolite modificomics strategy for modified metabolites identification in tomato. J. Integr. Plant Biol. 2024, . [CrossRef]
- Prescott, A.G.; Stamford, N.P.; Wheeler, G.; Firmin, J.L. In vitro properties of a recombinant flavonol synthase from Arabidopsis thaliana. Phytochemistry 2002, 60, 589–593, . [CrossRef]
- Polturak, G.; Heinig, U.; Grossman, N.; Battat, M.; Leshkowitz, D.; Malitsky, S.; Rogachev, I.; Aharoni, A. Transcriptome and Metabolic Profiling Provides Insights into Betalain Biosynthesis and Evolution in Mirabilis jalapa. Mol. Plant 2018, 11, 189–204, . [CrossRef]
- Guo, Y.; Li, D.; Liu, L.; Sun, H.; Zhu, L.; Zhang, K.; Zhao, H.; Zhang, Y.; Li, A.; Bai, Z.; et al. Seed Priming With Melatonin Promotes Seed Germination and Seedling Growth of Triticale hexaploide L. Under PEG-6000 Induced Drought Stress. Front. Plant Sci. 2022, 13, 932912, . [CrossRef]
- Sharma, A.; Shahzad, B.; Rehman, A.; Bhardwaj, R.; Landi, M.; Zheng, B. Response of Phenylpropanoid Pathway and the Role of Polyphenols in Plants under Abiotic Stress. Molecules 2019, 24, 2452, doi:10.3390/molecules24132452.
- Kim, G. N.; Jang, H. D., Flavonol Content in the Water Extract of the Mulberry (Morus alba L.) Leaf and Their Antioxidant Capacities. J Food Sci 2011, 76, (6), C869-C873.
- Nouraei, S.; Rahimmalek, M.; Saeidi, G., Variation in polyphenolic composition, antioxidants and physiological characteristics of globe artichoke (Cynara cardunculus var. scolymus Hayek L.) as affected by drought stress. Sci Hortic-Amsterdam 2018, 233, 378-385.
- Ju, W.-T.; Kwon, O.-C.; Kim, H.-B.; Sung, G.-B.; Kim, H.-W.; Kim, Y.-S. Qualitative and quantitative analysis of flavonoids from 12 species of Korean mulberry leaves. J. Food Sci. Technol. 2018, 55, 1789–1796, . [CrossRef]
- Yang, L.-L.; Yang, L.; Yang, X.; Zhang, T.; Lan, Y.-M.; Zhao, Y.; Han, M.; Yang, L.-M. Drought stress induces biosynthesis of flavonoids in leaves and saikosaponins in roots of Bupleurum chinense DC. Phytochemistry 2020, 177, 112434, doi:10.1016/j.phytochem.2020.112434.
- Jan, R.; Khan, M.-A.; Asaf, S.; Lubna; Waqas, M.; Park, J.-R.; Asif, S.; Kim, N.; Lee, I.-J.; Kim, K.-M. Drought and UV Radiation Stress Tolerance in Rice Is Improved by Overaccumulation of Non-Enzymatic Antioxidant Flavonoids. Antioxidants 2022, 11, 917, . [CrossRef]
- Wang, A.; Liu, Y.; Li, Q.; Li, X.; Zhang, X.; Kong, J.; Liu, Z.; Yang, Y.; Wang, J. FlbZIP12 gene enhances drought tolerance via modulating flavonoid biosynthesis in Fagopyrum leptopodum. Front. Plant Sci. 2023, 14, 1279468, . [CrossRef]
- Wang, Y.; Chen, S.; Yu, O. Metabolic engineering of flavonoids in plants and microorganisms. Appl. Microbiol. Biotechnol. 2011, 91, 949–956, . [CrossRef]
- Wang, C.; Zhi, S.; Liu, C.; Xu, F.; Zhao, A.; Wang, X.; Tang, X.; Li, Z.; Huang, P.; Yu, M. Isolation and characterization of a novel chalcone synthase gene family from mulberry. Plant Physiol. Biochem. 2017, 115, 107–118, . [CrossRef]
- Ju, W.-T.; Kwon, O.-C.; Kim, H.-B.; Sung, G.-B.; Kim, H.-W.; Kim, Y.-S. Qualitative and quantitative analysis of flavonoids from 12 species of Korean mulberry leaves. J. Food Sci. Technol. 2018, 55, 1789–1796, . [CrossRef]
- Shi, J.; Yan, X.; Sun, T.; Shen, Y.; Shi, Q.; Wang, W.; Bao, M.; Luo, H.; Nian, F.; Ning, G. Homeostatic regulation of flavonoid and lignin biosynthesis in phenylpropanoid pathway of transgenic tobacco. Gene 2022, 809, 146017, . [CrossRef]
- Yang, Z.; Luo, Y.; Xia, X.; He, J.; Zhang, J.; Zeng, Q.; Li, D.; Ma, B.; Zhang, S.; Zhai, C.; et al. Dehydrogenase MnGutB1 catalyzes 1-deoxynojirimycin biosynthesis in mulberry. Plant Physiol. 2023, 192, 1307–1320, . [CrossRef]
- Mavel, S.; Dikic, B.; Palakas, S.; Emond, P.; Greguric, I.; de Gracia, A. G.; Mattner, F.; Garrigos, M.; Guilloteau, D.; Katsifis, A., Synthesis and biological evaluation of a series of flavone derivatives as potential radioligands for imaging the multidrug resistance-associated protein 1 (ABCC1/MRP1). Bioorgan Med Chem 2006, 14, (5), 1599-1607.
- Guo, H.; Cao, P.; Wang, C.; Lai, J.; Deng, Y.; Li, C.; Hao, Y.; Wu, Z.; Chen, R.; Qiang, Q.; et al. Population analysis reveals the roles of DNA methylation in tomato domestication and metabolic diversity. Sci. China Life Sci. 2023, 66, 1888–1902, . [CrossRef]
- Griesser, M.; Vitzthum, F.; Fink, B.; Bellido, M. L.; Raasch, C.; Munoz-Blanco, J.; Schwab, W., Multi-substrate flavonol O-glucosyltransferases from strawberry (Fragaria x ananassa) achene and receptacle. J Exp Bot 2008, 59, (10), 2611-2625.
- Morita, Y.; Hoshino, A.; Kikuchi, Y.; Okuhara, H.; Ono, E.; Tanaka, Y.; Fukui, Y.; Saito, N.; Nitasaka, E.; Noguchi, H.; Iida, S., Japanese morning glory dusky mutants displaying reddish-brown or purplish-gray flowers are deficient in a novel glycosylation enzyme for anthocyanin biosynthesis, UDP-glucose:anthocyanidin 3-O-glucoside-2″-O-glucosyltransferase, due to 4-bp insertions in the gene. Plant J. 2005, 42, (3), 353-363.
- Yonekura-Sakakibara, K.; Nakabayashi, R.; Sugawara, S.; Tohge, T.; Ito, T.; Koyanagi, M.; Kitajima, M.; Takayama, H.; Saito, K., A flavonoid 3-O-glucoside: 2”-O-glucosyltransferase responsible for terminal modification of pollen-specific flavonols in Arabidopsis thaliana. Plant J. 2014, 79, (5), 769-782.
- Yonekura-Sakakibara, K.; Tohge, T.; Niida, R.; Saito, K. Identification of a Flavonol 7-O-Rhamnosyltransferase Gene Determining Flavonoid Pattern in Arabidopsis by Transcriptome Coexpression Analysis and Reverse Genetics. J. Biol. Chem. 2007, 282, 14932–14941, . [CrossRef]

Disclaimer/Publisher’s Note: The statements, opinions and data contained in all publications are solely those of the individual author(s) and contributor(s) and not of MDPI and/or the editor(s). MDPI and/or the editor(s) disclaim responsibility for any injury to people or property resulting from any ideas, methods, instructions or products referred to in the content. |
© 2024 by the authors. Licensee MDPI, Basel, Switzerland. This article is an open access article distributed under the terms and conditions of the Creative Commons Attribution (CC BY) license (http://creativecommons.org/licenses/by/4.0/).


