Submitted:
26 May 2024
Posted:
27 May 2024
You are already at the latest version
Abstract
Keywords:
1. Introduction
2. Materials and Methods
3. Results and Discussion
3.1. Mechanical Properties
3.2. Surface Quality of Milled Samples
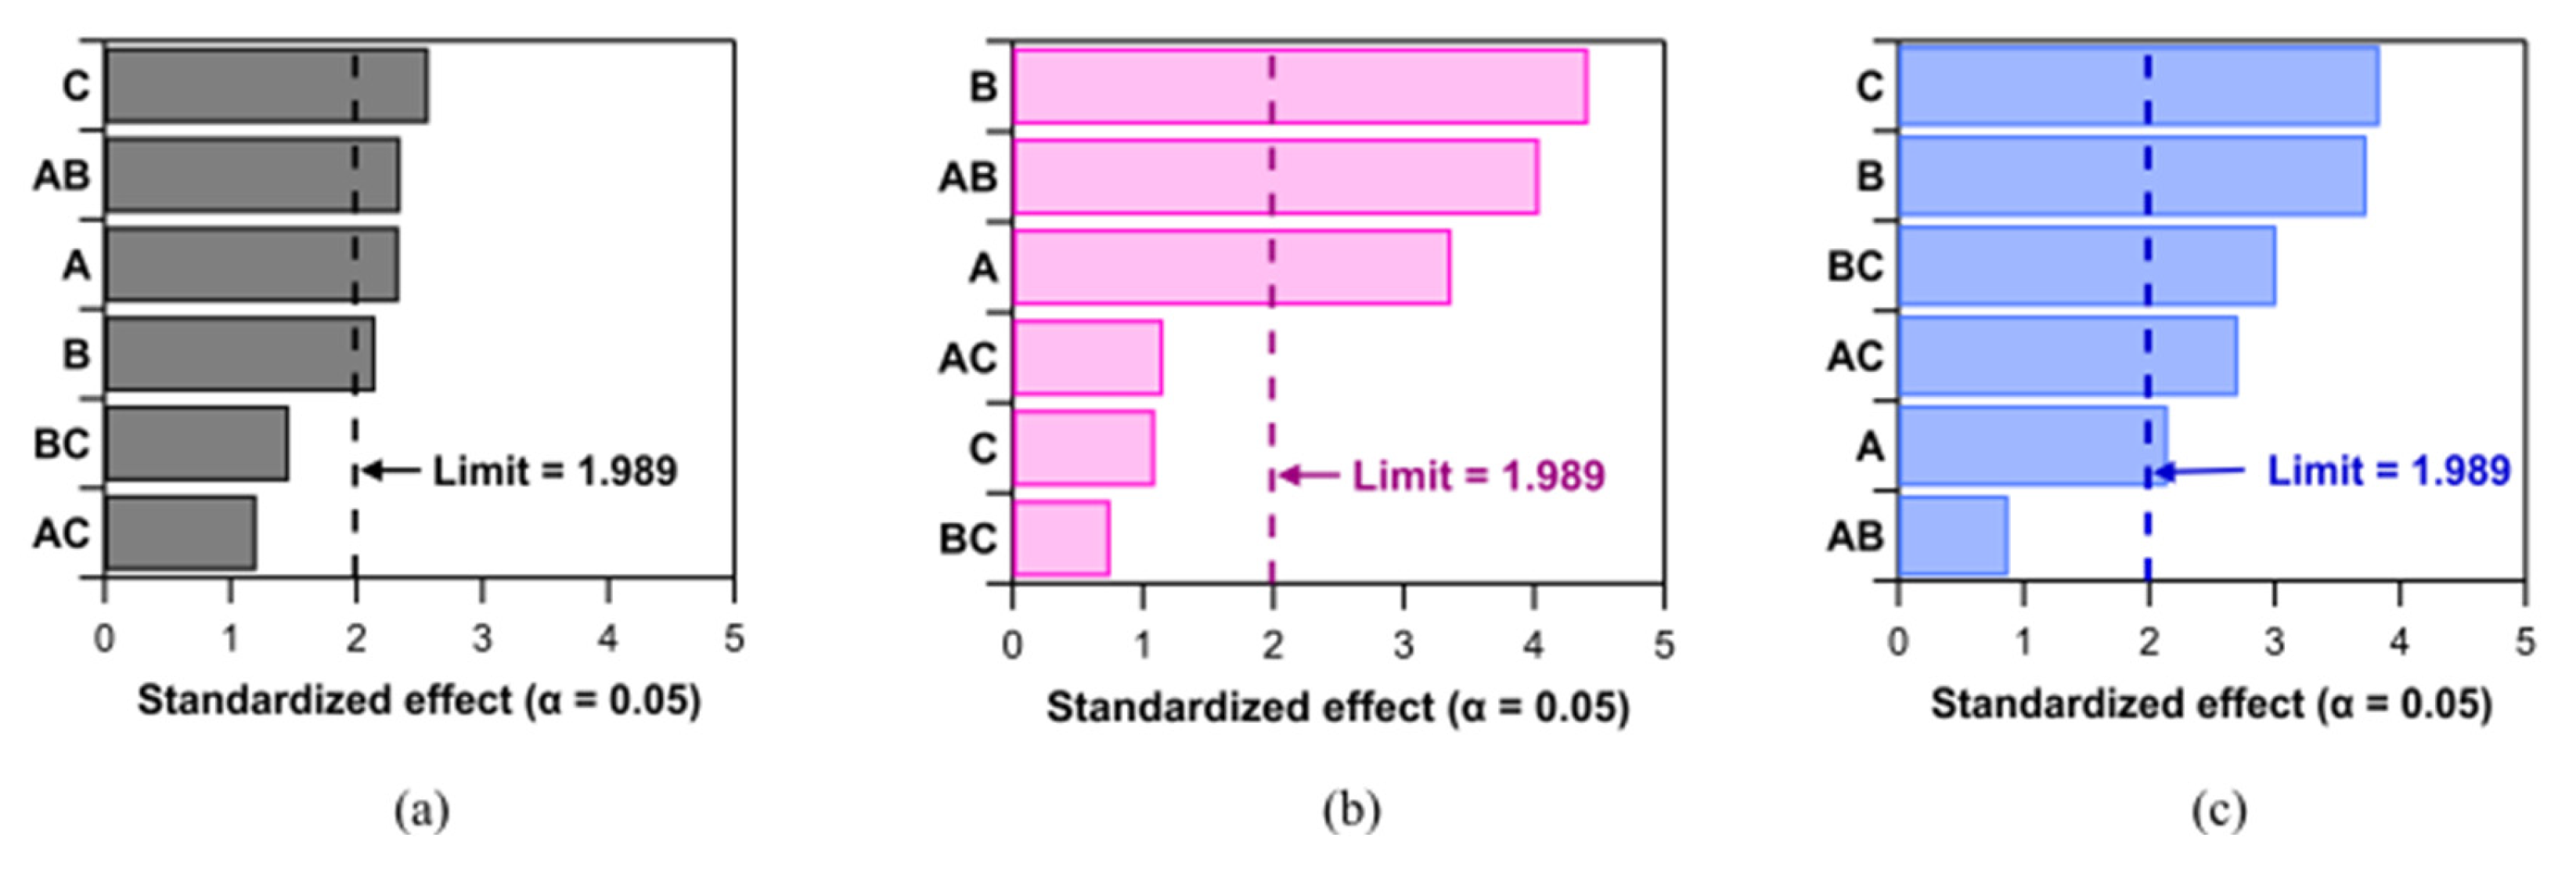
- the depth of cut is more impactful for PLA and CF-PETG, indicating its crucial role in burr formation;
- the feed Rate is the most critical for burr height in the case of PETG and also significant for PLA and CF-PETG. The speed of material feed into the cutting tool affects the material’s deformation and the subsequent burr size.
- the rotational Speed is significant for PETG and CF-PETG, rotational speed affects the cutting action’s temperature and pressure, influencing burr formation.
- interaction effects are important for all materials but vary in their order of impact. For PLA, the combination of feed rate and depth of cut (BC) and the combination of rotational speed and depth of cut are significant, whereas for PETG and CF-PETG, the interaction of feed rate and rotational speed (AB) is more critical.
3.3. Industrial Applications and Future Outlook
4. Conclusions
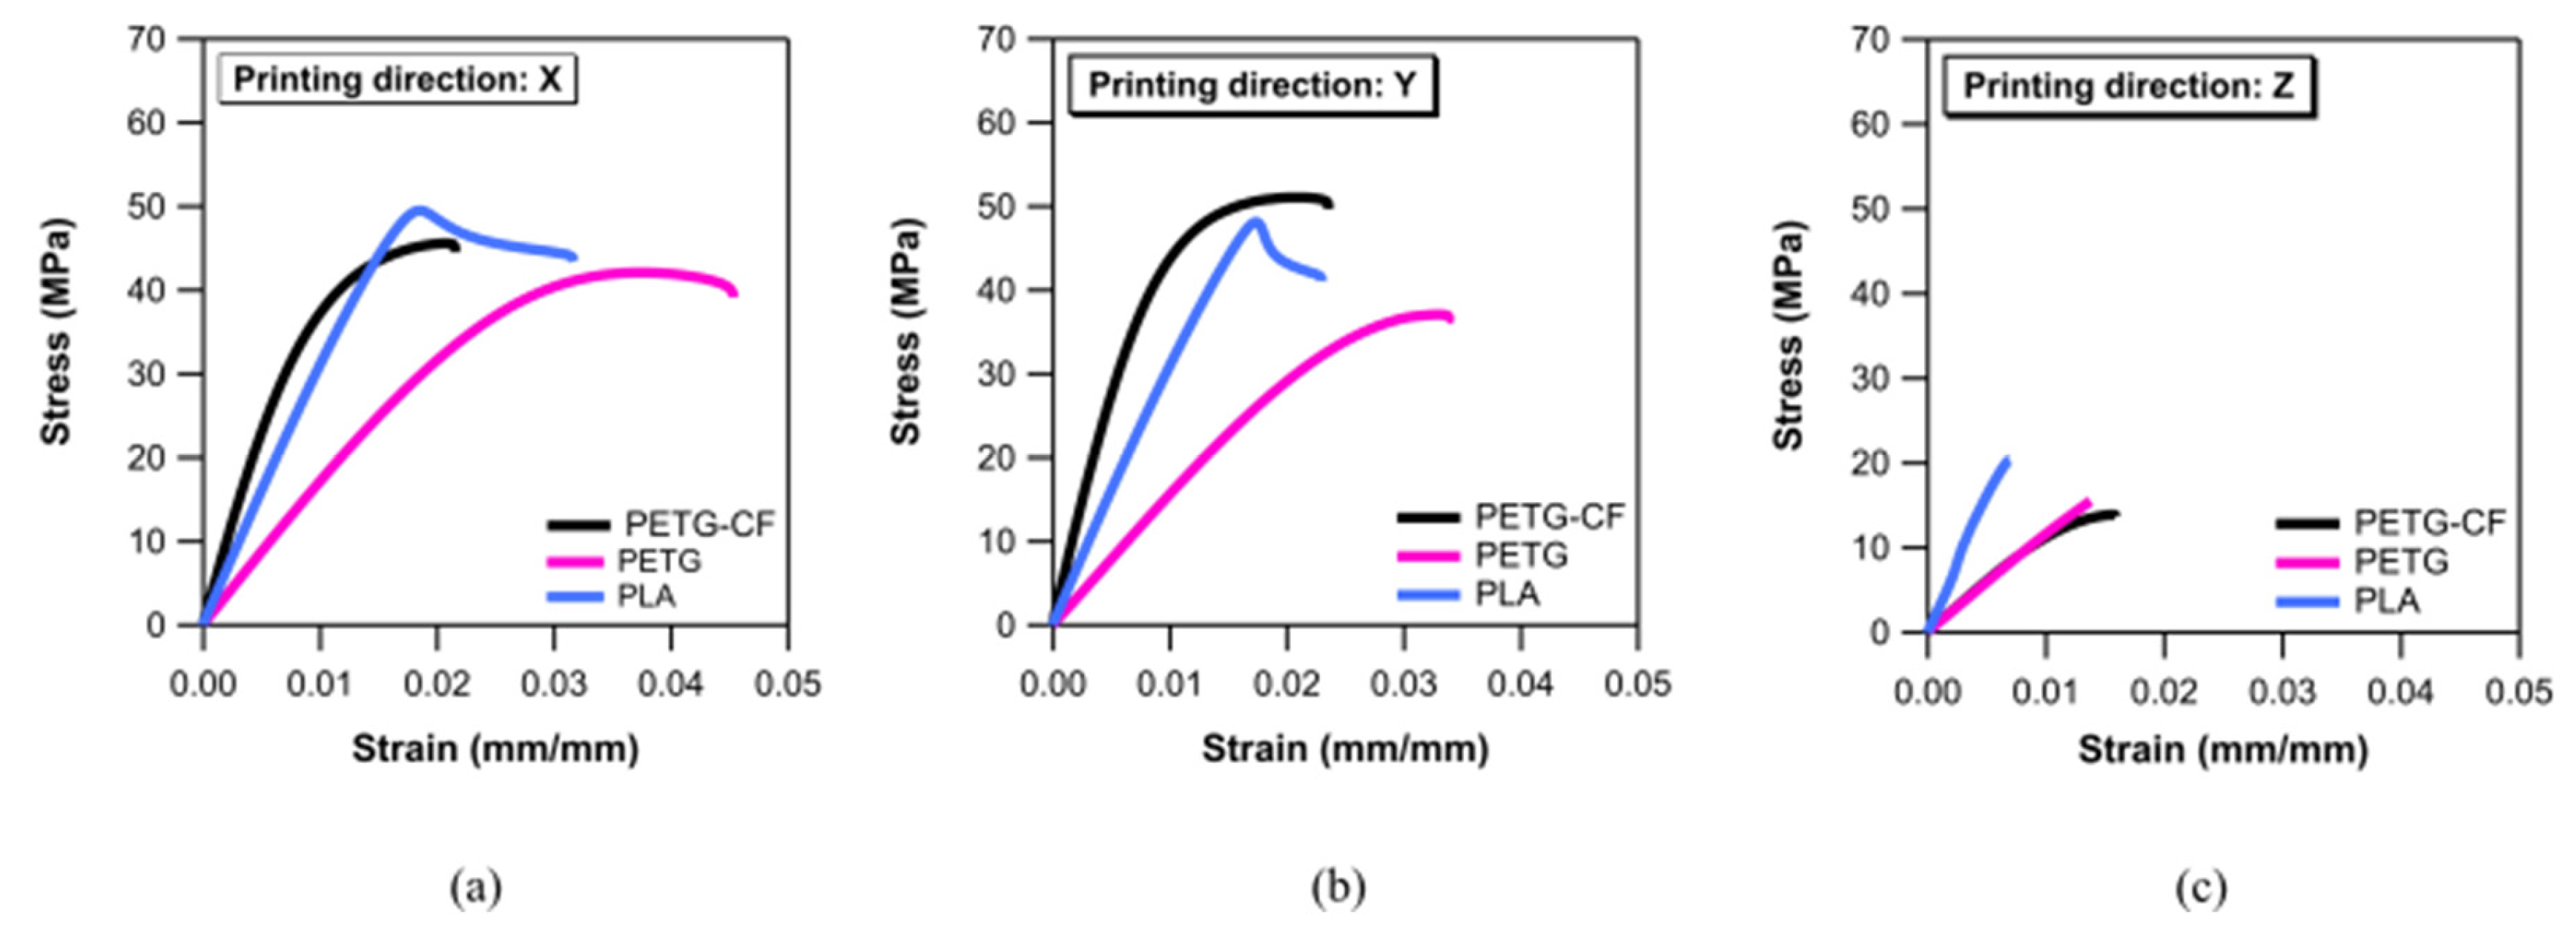
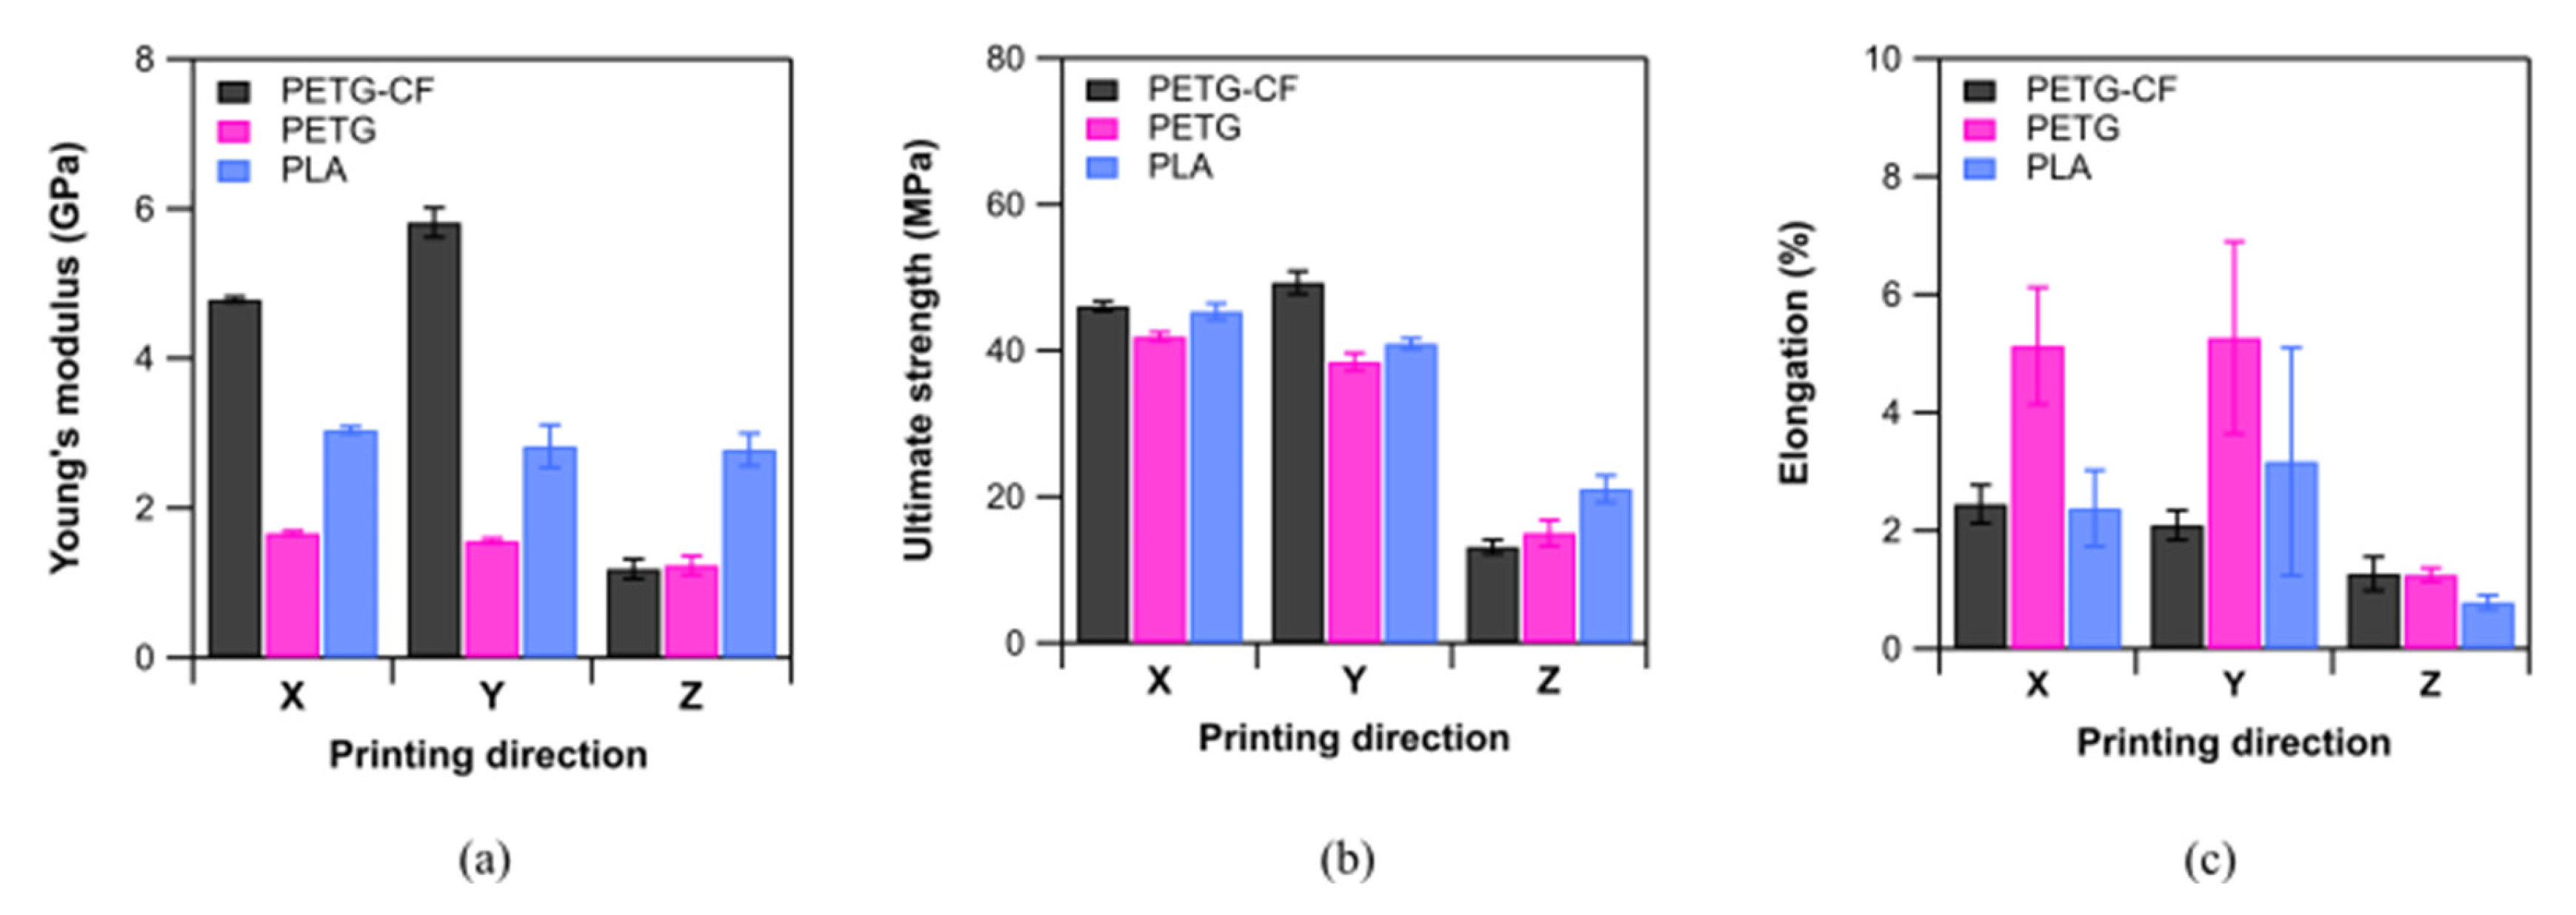
- in terms of mechanical properties, CF-PETG has better performances in terms of stiffness and strength compared to PETG and PLA, particularly notable in the Y direction. The consistency of properties between the X and Y directions for PLA and PETG suggests a uniform material behavior within the print bed plane. Aligning with the inherent limitations of FDM technology in achieving robust inter-layer bonding, all materials exhibit poor mechanical properties in the Z direction. Furthermore, the elongation at break for all materials is notably lower in the Z direction, highlighting the brittle nature of FDM materials when subjected to stress perpendicular to the layer planes. It’s noteworthy that CF-PETG exhibits significantly reduced ductility compared to PETG and PLA.
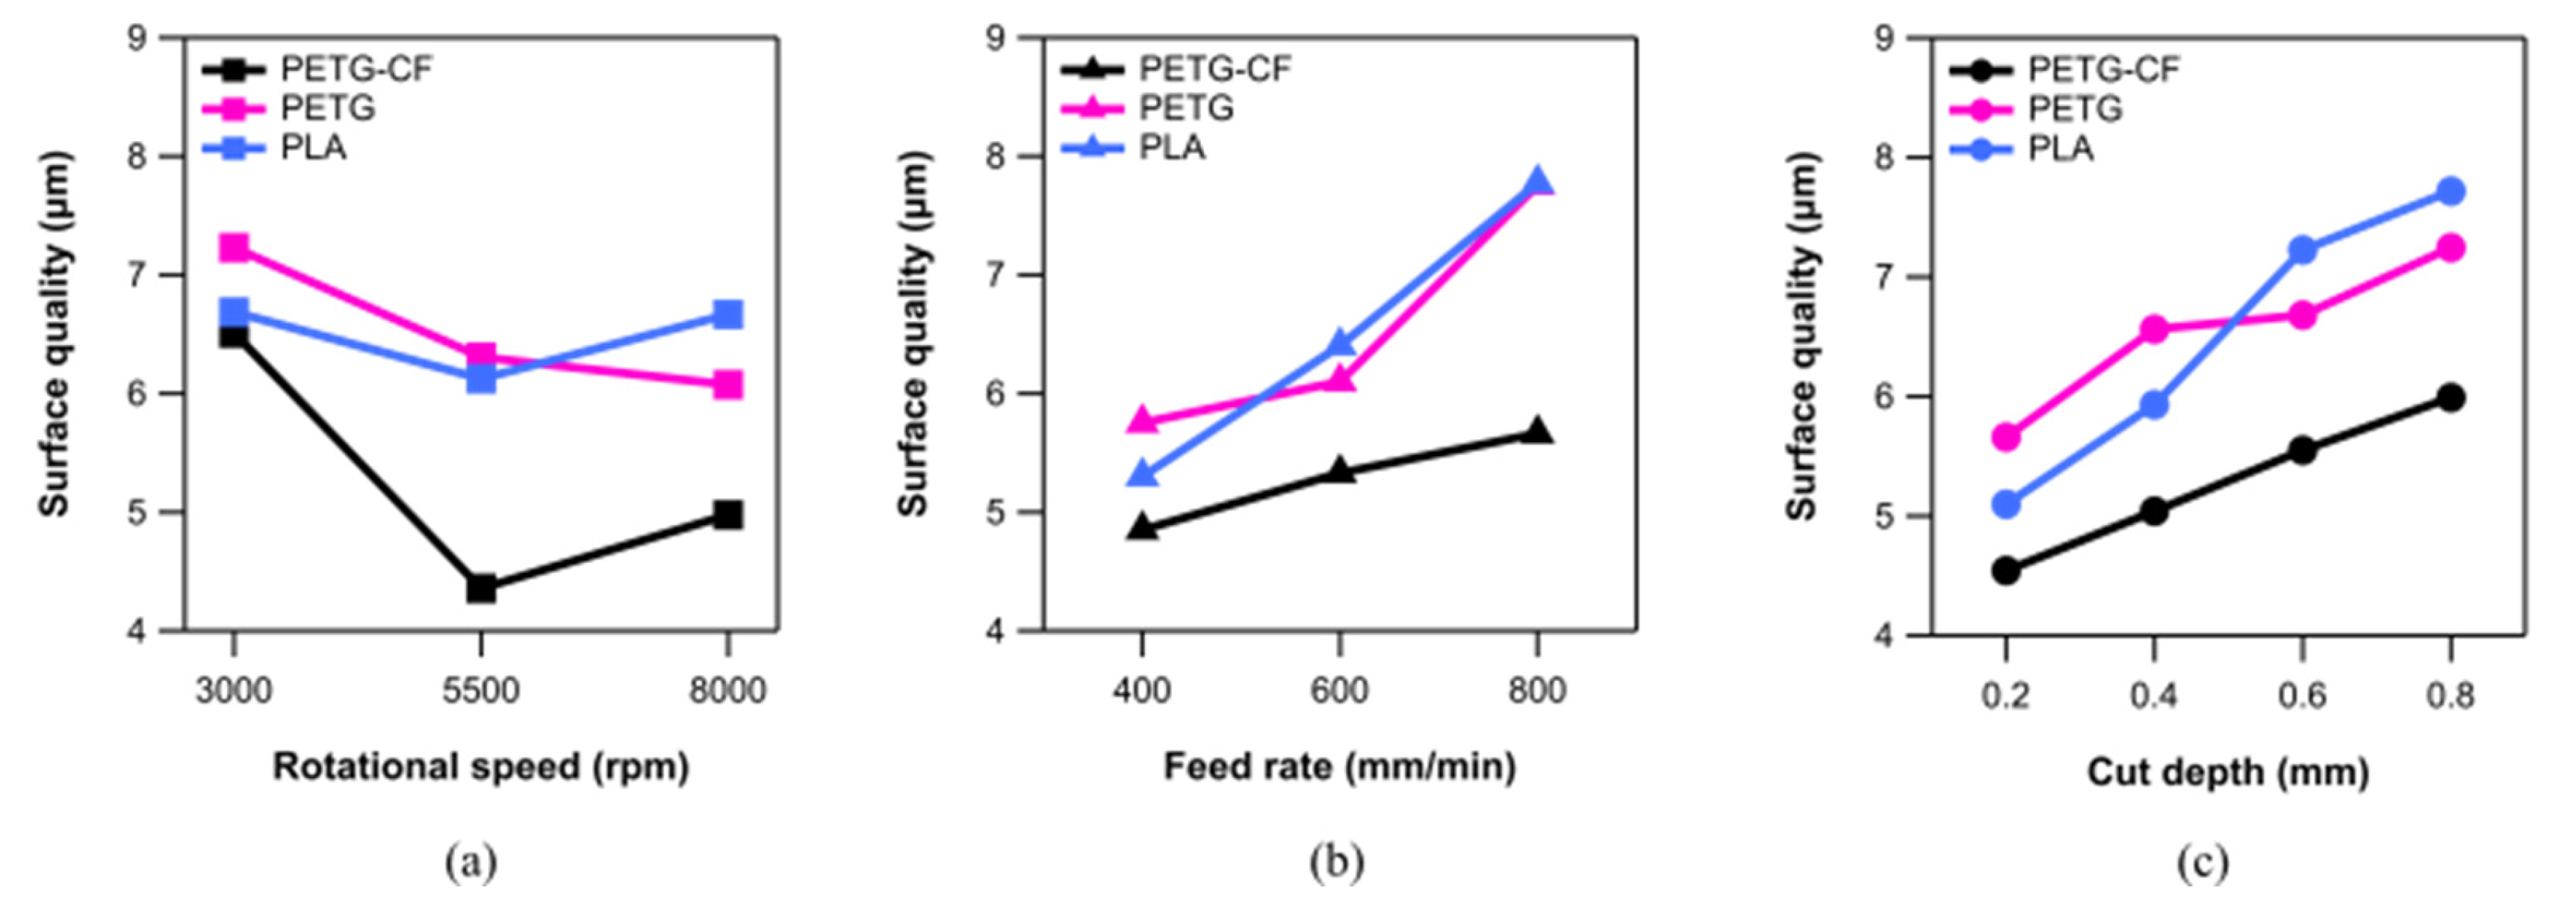
- CF-PETG demonstrates a lower surface roughness attributed to carbon fiber reinforcement, which enhances material uniformity and structural stability during milling. Carbon fibers have inherent properties that contribute to reduced friction during the milling process. They can act as a self-lubricating agent, which helps in decreasing the friction coefficient between the tool and the material. Lower friction results in smoother surface, reduced heat generation, and, consequently, lesser chances of material deformation;
- generally, PLA and PETG exhibit significantly higher surface roughness among all considered conditions compared to CF-PETG;
- the burr heights of PLA and PETG are comparable with CF-PETG but with specific trends for each material, underscoring the need for precise control during machining to achieve optimal results. According to experimental results the presence of carbon fiber do not significantly reduce the burr formation during the milling process;
- the relationship between feed rate, depth of cut, and material finish is complex, with lower feed rate and lower depth of cuts improving surface finish at the cost of increased burr formation, which requires additional operation to remove;
- milling can refine 3D printed parts by removing excess material, thus smoothing surfaces, and correcting dimensional inaccuracies, which is pivotal for parts demanding tight tolerances. This combined additive and subtractive manufacturing approach is promising for industries like aerospace and automotive, offering cost-effectiveness in producing functional prototypes and custom components.
Author Contributions
Funding
Data Availability Statement
Conflicts of Interest
References
- Murr, L.E. Frontiers of 3D Printing/Additive Manufacturing: From Human Organs to Aircraft Fabrication†. J. Mater. Sci. Technol. 2016, 32, 987–995. [Google Scholar] [CrossRef]
- Rinaldi, M.; Cecchini, F.; Pigliaru, L.; Ghidini, T.; Lumaca, F.; Nanni, F. Additive Manufacturing of Polyether Ether Ketone (PEEK) for Space Applications: A Nanosat Polymeric Structure. Polymers 2021, 13, 11. [Google Scholar] [CrossRef] [PubMed]
- Sun, J.; Zhou, W.; Huang, D.; Fuh, J.Y.H.; Hong, G.S. An Overview of 3D Printing Technologies for Food Fabrication. Food Bioprocess Technol 2015, 8, 1605–1615. [Google Scholar] [CrossRef]
- Lille, M.; Nurmela, A.; Nordlund, E.; Metsä-Kortelainen, S.; Sozer, N. Applicability of Protein and Fiber-Rich Food Materials in Extrusion-Based 3D Printing. J. Food Eng. 2018, 220, 20–27. [Google Scholar] [CrossRef]
- Palo, M.; Holländer, J.; Suominen, J.; Yliruusi, J.; Sandler, N. 3D Printed Drug Delivery Devices: Perspectives and Technical Challenges. Expert Rev. Med. Devices 2017, 14, 685–696. [Google Scholar] [CrossRef] [PubMed]
- Labonnote, N.; Rønnquist, A.; Manum, B.; Rüther, P. Additive Construction: State-of-the-Art, Challenges and Opportunities. Autom. Constr. 2016, 72, 347–366. [Google Scholar] [CrossRef]
- Singh, S.; Ramakrishna, S. Biomedical Applications of Additive Manufacturing: Present and Future. Curr. Opin. Biomed. Eng. 2017, 2, 105–115. [Google Scholar] [CrossRef]
- Clini, P.; El Mehtedi, M.; Nespeca, R.; Ruggeri, L.; Raffaelli, E. A Digital Reconstruction Procedure from Laser Scanner Survey to 3d Printing: The Theoretical Model of the Arch of Trajan (Ancona). SCIRES-IT - SCIentific RESearch Inf. Technol. 2018, 7, 1–12. [Google Scholar] [CrossRef]
- Gibson, I.; Rosen, D.; Stucker, B.; Khorasani, M. Additive Manufacturing Technologies; Springer International Publishing: Cham, Switzerland, 2021; ISBN 978-3-030-56126-0. [Google Scholar]
- Abdulhameed, O.; Al-Ahmari, A.; Ameen, W.; Mian, S.H. Additive Manufacturing: Challenges, Trends, and Applications. Adv. Mech. Eng. 2019, 11, 1687814018822880. [Google Scholar] [CrossRef]
- Skylar-Scott, M.A.; Mueller, J.; Visser, C.W.; Lewis, J.A. Voxelated Soft Matter via Multimaterial Multinozzle 3D Printing. Nature 2019, 575, 330–335. [Google Scholar] [CrossRef]
- Kafle, A.; Luis, E.; Silwal, R.; Pan, H.M.; Shrestha, P.L.; Bastola, A.K. 3D/4D Printing of Polymers: Fused Deposition Modelling (FDM), Selective Laser Sintering (SLS), and Stereolithography (SLA). Polymers 2021, 13, 3101. [Google Scholar] [CrossRef] [PubMed]
- Tymrak, B.M.; Kreiger, M.; Pearce, J.M. Mechanical Properties of Components Fabricated with Open-Source 3-D Printers under Realistic Environmental Conditions. Materials & Design 2014, 58, 242–246. [Google Scholar] [CrossRef]
- Brydson, J.A. Plastics Materials; Elsevier: Amsterdam, The Netherlands, 1999; ISBN 978-0-08-051408-6. [Google Scholar]
- Tsai, H.-H.; Wu, S.-J.; Wu, Y.-D.; Hong, W.-Z. Feasibility Study on the Fused Filaments of Injection-Molding-Grade Poly(Ethylene Terephthalate) for 3D Printing. Polymers 2022, 14, 2276. [Google Scholar] [CrossRef] [PubMed]
- Moreno Nieto, D.; Alonso-García, M.; Pardo-Vicente, M.-A.; Rodríguez-Parada, L. Product Design by Additive Manufacturing for Water Environments: Study of Degradation and Absorption Behavior of PLA and PETG. Polymers 2021, 13, 1036. [Google Scholar] [CrossRef] [PubMed]
- Li, W.; Zhao, X.; Liu, Y.; Ouyang, Y.; Li, W.; Chen, D.; Ye, D. Hygrothermal Aging Behavior and Flexural Property of Carbon Fiber-Reinforced Polyethylene Terephthalate Glycol Composites. Text. Res. J. 2023, 93, 1005–1018. [Google Scholar] [CrossRef]
- Guessasma, S.; Belhabib, S.; Nouri, H. Printability and Tensile Performance of 3D Printed Polyethylene Terephthalate Glycol Using Fused Deposition Modelling. Polymers 2019, 11, 1220. [Google Scholar] [CrossRef] [PubMed]
- Somireddy, M.; Czekanski, A.; Singh, C.V. Development of Constitutive Material Model of 3D Printed Structure via FDM. Mater. Today Commun. 2018, 15, 143–152. [Google Scholar] [CrossRef]
- Garzon-Hernandez, S.; Arias, A.; Garcia-Gonzalez, D. A Continuum Constitutive Model for FDM 3D Printed Thermoplastics. Compos. Part B Eng. 2020, 201, 108373. [Google Scholar] [CrossRef]
- Bandinelli, F.; Peroni, L.; Morena, A. Elasto-Plastic Mechanical Modeling of Fused Deposition 3D Printing Materials. Polymers 2023, 15, 234. [Google Scholar] [CrossRef]
- Mohamed, O.A.; Masood, S.H.; Bhowmik, J.L. Optimization of Fused Deposition Modeling Process Parameters: A Review of Current Research and Future Prospects. Adv. Manuf. 2015, 3, 42–53. [Google Scholar] [CrossRef]
- Chacón, J.M.; Caminero, M.A.; García-Plaza, E.; Núñez, P.J. Additive Manufacturing of PLA Structures Using Fused Deposition Modelling: Effect of Process Parameters on Mechanical Properties and Their Optimal Selection. Materials & Design 2017, 124, 143–157. [Google Scholar] [CrossRef]
- Popescu, D.; Zapciu, A.; Amza, C.; Baciu, F.; Marinescu, R. FDM Process Parameters Influence over the Mechanical Properties of Polymer Specimens: A Review. Polymer Testing 2018, 69, 157–166. [Google Scholar] [CrossRef]
- Gordelier, T.J.; Thies, P.R.; Turner, L.; Johanning, L. Optimising the FDM Additive Manufacturing Process to Achieve Maximum Tensile Strength: A State-of-the-Art Review. Rapid Prototyping Journal 2019, 25, 953–971. [Google Scholar] [CrossRef]
- Wang, S.; Ma, Y.; Deng, Z.; Zhang, S.; Cai, J. Effects of Fused Deposition Modeling Process Parameters on Tensile, Dynamic Mechanical Properties of 3D Printed Polylactic Acid Materials. Polymer Testing 2020, 86, 106483. [Google Scholar] [CrossRef]
- Cojocaru, V.; Frunzaverde, D.; Miclosina, C.-O.; Marginean, G. The Influence of the Process Parameters on the Mechanical Properties of PLA Specimens Produced by Fused Filament Fabrication—A Review. Polymers 2022, 14, 886. [Google Scholar] [CrossRef] [PubMed]
- Durgashyam, K.; Indra Reddy, M.; Balakrishna, A.; Satyanarayana, K. Experimental Investigation on Mechanical Properties of PETG Material Processed by Fused Deposition Modeling Method. Materials Today: Proceedings 2019, 18, 2052–2059. [Google Scholar] [CrossRef]
- Ajay Kumar, M.; Khan, M.S.; Mishra, S.B. Effect of Machine Parameters on Strength and Hardness of FDM Printed Carbon Fiber Reinforced PETG Thermoplastics. Materials Today: Proceedings 2020, 27, 975–983. [Google Scholar] [CrossRef]
- Yao, T.; Deng, Z.; Zhang, K.; Li, S. A Method to Predict the Ultimate Tensile Strength of 3D Printing Polylactic Acid (PLA) Materials with Different Printing Orientations. Composites Part B: Engineering 2019, 163, 393–402. [Google Scholar] [CrossRef]
- Jayanth, N.; Jaswanthraj, K.; Sandeep, S.; Mallaya, N.H.; Siddharth, S.R. Effect of Heat Treatment on Mechanical Properties of 3D Printed PLA. Journal of the Mechanical Behavior of Biomedical Materials 2021, 123, 104764. [Google Scholar] [CrossRef]
- Bhandari, S.; Lopez-Anido, R.A.; Gardner, D.J. Enhancing the Interlayer Tensile Strength of 3D Printed Short Carbon Fiber Reinforced PETG and PLA Composites via Annealing. Additive Manufacturing 2019, 30, 100922. [Google Scholar] [CrossRef]
- Sood, A.K.; Ohdar, R.K.; Mahapatra, S.S. Improving Dimensional Accuracy of Fused Deposition Modelling Processed Part Using Grey Taguchi Method. Materials & Design 2009, 30, 4243–4252. [Google Scholar] [CrossRef]
- Alexopoulou, V.E.; Christodoulou, I.T.; Markopoulos, A.P. Effect of Printing Speed and Layer Height on Geometrical Accuracy of FDM-Printed Resolution Holes of PETG Artifacts. Engineering Proceedings 2022, 24, 11. [Google Scholar] [CrossRef]
- Bhosale, V.; Gaikwad, P.; Dhere, S.; Sutar, C.; Raykar, S.J. Analysis of Process Parameters of 3D Printing for Surface Finish, Printing Time and Tensile Strength. Materials Today: Proceedings 2022, 59, 841–846. [Google Scholar] [CrossRef]
- Mani, M.; Karthikeyan, A.G.; Kalaiselvan, K.; Muthusamy, P.; Muruganandhan, P. Optimization of FDM 3-D Printer Process Parameters for Surface Roughness and Mechanical Properties Using PLA Material. Materials Today: Proceedings 2022, 66, 1926–1931. [Google Scholar] [CrossRef]
- Wahab Hashmi, A.; Singh Mali, H.; Meena, A. Improving the Surface Characteristics of Additively Manufactured Parts: A Review. Materials Today: Proceedings 2023, 81, 723–738. [Google Scholar] [CrossRef]
- Altan, M.; Eryildiz, M.; Gumus, B.; Kahraman, Y. Effects of Process Parameters on the Quality of PLA Products Fabricated by Fused Deposition Modeling (FDM): Surface Roughness and Tensile Strength. Materials Testing 2018, 60, 471–477. [Google Scholar] [CrossRef]
- Barrios, J.M.; Romero, P.E. Improvement of Surface Roughness and Hydrophobicity in PETG Parts Manufactured via Fused Deposition Modeling (FDM): An Application in 3D Printed Self–Cleaning Parts. Materials 2019, 12, 2499. [Google Scholar] [CrossRef]
- Kadhum, A.H.; Al-Zubaidi, S.; Abdulkareem, S.S. Effect of the Infill Patterns on the Mechanical and Surface Characteristics of 3D Printing of PLA, PLA+ and PETG Materials. ChemEngineering 2023, 7, 46. [Google Scholar] [CrossRef]
- Hadeeyah, A.; Jamhour, H.; Emhemed, I.; Alhadar, F.; Masmoudi, N.; Wali, M. The Impact Of Carbon Fiber on the Surface Properties of the 3D Printed PEGT Product. Journal of Pure & Applied Sciences 2023, 22, 23–27. [Google Scholar] [CrossRef]
- Vidakis, N.; David, C.; Petousis, M.; Sagris, D.; Mountakis, N.; Moutsopoulou, A. The Effect of Six Key Process Control Parameters on the Surface Roughness, Dimensional Accuracy, and Porosity in Material Extrusion 3D Printing of Polylactic Acid: Prediction Models and Optimization Supported by Robust Design Analysis. Advances in Industrial and Manufacturing Engineering 2022, 5, 100104. [Google Scholar] [CrossRef]
- Lalehpour, A.; Janeteas, C.; Barari, A. Surface Roughness of FDM Parts after Post-Processing with Acetone Vapor Bath Smoothing Process. Int J Adv Manuf Technol 2018, 95, 1505–1520. [Google Scholar] [CrossRef]
- Demircali, A.A.; Yilmaz, D.; Yilmaz, A.; Keskin, O.; Keshavarz, M.; Uvet, H. Enhancing Mechanical Properties and Surface Quality of FDM-Printed ABS: A Comprehensive Study on Cold Acetone Vapor Treatment. Int J Adv Manuf Technol 2024, 130, 4027–4039. [Google Scholar] [CrossRef]
- Pandey, P.M.; Reddy, N.V.; Dhande, S.G. Improvement of Surface ®nish by Staircase Machining in Fused Deposition Modeling. Journal of Materials Processing Technology 2003, 9. [Google Scholar]
- Lalegani Dezaki, M.; Mohd Ariffin, M.K.A.; Ismail, M.I.S. Effects of CNC Machining on Surface Roughness in Fused Deposition Modelling (FDM) Products. Materials 2020, 13, 2608. [Google Scholar] [CrossRef] [PubMed]
- El Mehtedi, M.; Buonadonna, P.; Carta, M.; El Mohtadi, R.; Marongiu, G.; Loi, G.; Aymerich, F. Effects of Milling Parameters on Roughness and Burr Formation in 3D- Printed PLA Components. Procedia Computer Science 2023, 217, 1560–1569. [Google Scholar] [CrossRef]
- El Mehtedi, M.; Buonadonna, P.; Loi, G.; El Mohtadi, R.; Carta, M.; Aymerich, F. Surface Quality Related to Face Milling Parameters in 3D Printed Carbon Fiber-Reinforced PETG. Journal of Composites Science 2024, 8, 128. [Google Scholar] [CrossRef]
- Cococcetta, N.M.; Pearl, D.; Jahan, M.P.; Ma, J. Investigating Surface Finish, Burr Formation, and Tool Wear during Machining of 3D Printed Carbon Fiber Reinforced Polymer Composite. Journal of Manufacturing Processes 2020, 56, 1304–1316. [Google Scholar] [CrossRef]
- Guo, C.; Liu, X.; Liu, G. Surface Finishing of FDM-Fabricated Amorphous Polyetheretherketone and Its Carbon-Fiber-Reinforced Composite by Dry Milling. Polymers 2021, 13, 2175. [Google Scholar] [CrossRef] [PubMed]
- Pămărac, R.G.; Petruse, R.E. Study Regarding the Optimal Milling Parameters for Finishing 3D Printed Parts from ABS and PLA Materials. Acta Universitatis Cibiniensis. Technical Series 2018, 70, 66–72. [Google Scholar] [CrossRef]
- El Mehtedi, M.; Buonadonna, P.; El Mohtadi, R.; Aymerich, F.; Carta, M. Surface Quality Related to Machining Parameters in 3D-Printed PETG Components. Procedia Computer Science 2024, 232, 1212–1221. [Google Scholar] [CrossRef]
- García-Domínguez, A.; Claver, J.; Camacho, A.M.; Sebastián, M.A. Considerations on the Applicability of Test Methods for Mechanical Characterization of Materials Manufactured by FDM. Materials 2020, 13, 28. [Google Scholar] [CrossRef] [PubMed]
- Mahesh, V.; Joseph, A.S.; Mahesh, V.; Harursampath, D.; Vn, C. Investigation on the Mechanical Properties of Additively Manufactured PETG Composites Reinforced with OMMT Nanoclay and Carbon Fibers. Polymer Composites 2021, 42, 2380–2395. [Google Scholar] [CrossRef]
- Bex, G.J.P.; Ingenhut, B.L.J.; Cate, T.; Sezen, M.; Ozkoc, G. Sustainable Approach to Produce 3D -printed Continuous Carbon Fiber Composites: “A Comparison of Virgin and Recycled <span style=“font-variant:small-caps;”>PETG”</span>. Polymer Composites 2021, 42, 4253–4264. [Google Scholar] [CrossRef]
- Oksman, K.; Skrifvars, M.; Selin, J.-F. Natural Fibres as Reinforcement in Polylactic Acid (PLA) Composites. Compos. Sci. Technol. 2003, 63, 1317–1324. [Google Scholar] [CrossRef]
- Vinyas, M.; Athul S, J.; Harursampath, D.; Nguyen Thoi, T. Mechanical Characterization of the Poly Lactic Acid (PLA) Composites Prepared through the Fused Deposition Modelling Process. Mater. Res. Express 2019, 6, 105359. [Google Scholar] [CrossRef]
- Giltrow, J.P.; Lancaster, J.K. Carbon-Fibre Reinforced Polymers as Self-Lubricating Materials. Proc. Inst. Mech. Eng. Conf. Proc. 1967, 182, 147–157. [Google Scholar] [CrossRef]


| Authors | FDM-printed material | ) | ) |
|---|---|---|---|
| Pamarac et al. [51] | ABS | 3500 rpm | 35 – 840 mm/min |
| Pamarac et al. [51] | PLA | 3500 rpm | 35 – 1880 mm/min |
| Lalelgani et al. [46] | PLA | 3283 – 10504 rpm | 1000 mm/min |
| El Mehtedi et al. [47] | PLA | 3500–8000 rpm | 400–800 mm/min |
| Lalegani Dezaki et al. [46] | PLA | 3500 rpm | 1200 mm/min |
| Guo et al. [50] | PEEK and CF-PEEK | 3000–12,500 rpm | 0.02–0.1 mm/teeth |
| Cococcetta et al. [34] | Onyx and CF-Onyx | 6000 rpm | 600–1200 mm/min |
| Vallejo et al. [36] | PETG and CF-PETG | 3500 rpm | 800 mm/min |
| El Mehtedi et al. [48,52] | PETG and CF-PETG | 3500–8000 rpm | 400–800 mm/min |
| Factors | Levels | ||||||
|---|---|---|---|---|---|---|---|
| Name | Type | Units | Symbols | 1 | 2 | 3 | 4 |
| Rotational speed () | Numeric | [rpm] | A | 3000 | 5500 | 8000 | - |
| Feed Rate () | Numeric | [mm/min] | B | 400 | 600 | 800 | - |
| Depth of cut () | Numeric | [mm] | C | 0.2 | 0.4 | 0.6 | 0.8 |
| Material | Printing direction | [MPa] | [MPa] | |
|---|---|---|---|---|
| PETG | X | 1661.1 ± 30.4 | 41.9 ± 0.6 | 5.1 ± 1.0 |
| Y | 1560.8 ± 34.1 | 38.5 ± 1.2 | 5.3 ± 1.6 | |
| Z | 1233.4 ± 126.2 | 15.0 ± 1.8 | 1.3 ± 0.1 | |
| X Mahesh et al. [54] | 1768.1 ± 15.9 | 51.9 ± 2.3 | - | |
| X Bex et al. [55] | 2010 ± 27 | 52.2 ± 0.8 | 4.6 ± 0.1 | |
| Z Bex et al. [55] | 1870 ± 51 | 23.1 ± 2.2 | 1.9 ± 0.3 | |
| X | 4784.5 ± 37.2 | 46.1 ± 0.7 | 2.4 ± 0.4 | |
| CF-PETG | Y | 5816.8 ± 197.9 | 49.3 ± 1.6 | 2.1 ± 0.3 |
| Z | 1186.2 ± 133.7 | 13.2 ± 1.0 | 1.3 ± 0.3 | |
| X (10% CF) Mahesh et al. [54] | 2757.7 ± 22.7 | 50.4 ± 2.9 | - | |
| X | 3058.1 ± 51.6 | 48.8 ± 0.6 | 2.4 ± 0.7 | |
| PLA | Y | 2871.4 ± 297.9 | 46.0 ± 4.3 | 3.2 ± 2.0 |
| Z | 2812.8 ± 278.0 | 20.3 ± 2.6 | 0.8 ± 0.1 | |
| X Oksman et al. [56] | 3400 | 53 | 2 | |
| X Vynias et al. [57] | 3470 | 47 | 1.4 |
Disclaimer/Publisher’s Note: The statements, opinions and data contained in all publications are solely those of the individual author(s) and contributor(s) and not of MDPI and/or the editor(s). MDPI and/or the editor(s) disclaim responsibility for any injury to people or property resulting from any ideas, methods, instructions or products referred to in the content. |
© 2024 by the authors. Licensee MDPI, Basel, Switzerland. This article is an open access article distributed under the terms and conditions of the Creative Commons Attribution (CC BY) license (http://creativecommons.org/licenses/by/4.0/).


