1. Introduction
We observed phase separation regions (PSR) while studying magnetic dynamics in yttrium iron garnets (YIG) [
1,
2]. Previously, PSR were observed only in crystals with magnetic ions that have variable valence or in crystals containing impurities that cause a change in the valence of magnetic ions. In [
2,
3] a mechanism was proposed, firstly introduced in [
3], that assumes that in magnetic crystals with a domain structure, at the boundaries between 180-degree magnetic domains, in the Neel-type domain walls, structural distortions occur that breaks the central symmetry. This results in the formation of a local electric field in the domain walls, leading to the accumulation of electrons within them. Ferromagnetically polarized electrons contribute to the double exchange process and the formation of PSR containing free and polarized charge carriers.
In this work, cyclotron resonance (CR) has been detected on charge carriers located in nanosized local regions [
1]. The results presented in this paper suggest that CR exists in YIG and is manifested in magnetic dynamics at fairly high microwave frequencies (about 30 GHz) at room temperature.
YIG single crystals have cubic symmetry (Oh10). Fe3+ ions occupy two different positions: three ions are in the oxygen tetrahedron, and two ions are in the oxygen octahedron. Nonmagnetic Y3+ ions are located in oxygen dodecahedrons. The spins of Fe3+ ions in different positions in the crystal have opposite orientations, forming a magnetic structure with a difference magnetic moment with a Néel temperature TN=560 K (ferrimagnetic state). At low frequencies, YIG shows itself as a good dielectric. In this case, cyclotron resonance is possible only in local regions (PSR), containing free electrons.
CR is a type of magnetic resonance that occurs when free charge carriers absorb electromagnetic energy in the presence of a magnetic field. This phenomenon was first proposed in theoretical works [
4,
5,
6,
7] and later confirmed experimentally [
8,
9]. The basic principles of CR have been discussed in detail in several monographs and review articles [
10,
11].
Free charged particles move in an applied permanent magnetic field H in a spiral with its axis directed along the field. In this case, electrons form coils in a plane perpendicular to the H, i.e. the motion in that plane is finite and periodic. This situation is subject to quantization, and the solution to the Schrödinger equation results in a discrete set of states with constant energy described by the quantum number,
n (Landau levels). Thus, the continuous spectrum of electrons without a magnetic field becomes discrete in the presence of the H
where
is the energy of the nth level,
is the charge,
is the mass of the electron,
ħ is Planck's constant,
is the speed of light. The Landau levels have a finite width
Each level is degenerate, and the splitting of states within levels is determined by the quantum number “
l”:
From a classical point of view, the quantization of an electron's energy in a magnetic field corresponds to the quantization of its orbital radius. Cyclotron resonance is the transition between adjacent
n and
n+1 states, induced by an alternating electric field. Accordingly, the frequency of CR is determined by expression:
The CR frequency for a free electron gas coincides with the spin resonance frequency (EPR, FMR for a g-factor is equal to 2 and there is no anisotropy). However, its nature is different. If spin resonances are based on magnetic dipole transitions, which are excited by the magnetic component h~ of the alternating field, perpendicular to the field H, then CR is an electric dipole transition and is excited by the electric component ε~, perpendicular to the field H.
The intensity of electric dipole transitions is much greater than the intensity of magnetic dipole transitions. Therefore, a lower electron concentration is needed to observe CR. This is used when studying CR in solids, because a low concentration reduces the probability of electron scattering and allows for the conditions necessary to observe CR to be realized. The basic equations for CR in a free electron gas still apply to free carriers in solids, but the values for mass (m) and momentum (k) are replaced with effective parameters - the cyclotron mass (mc) and quasi-momentum (k~). These effective parameters depend on the crystal's properties, such as the type and shape of its Fermi surface, which determine its kinetic characteristics.
For low-symmetry crystals with complex Fermi surfaces, the effective mass is a tensor. In the case of cubic crystals with a simple spherical Fermi surface, this is a scalar quantity, but its magnitude may differ from m. In order for CR to exist, the relaxation time of the electrons during precession must be long enough for several rotations to be performed without scattering. In non-magnetic crystals, the main source of scattering is collisions between electrons and phonons in the crystal lattice. Spin-spin and spin-lattice relaxation mechanisms are usually less significant. Due to a decrease in temperature, a concentration of charge carriers can be achieved in semiconductor crystals that makes both main mechanisms of electronic relaxation quite small.
Recently, low-dimensional structures - quantum wells - have been extensively studied. In these structures, polarization barriers at the boundaries effectively isolate the inner volume of the well from the rest of the crystal lattice. In these quantum wells, the mean free path of electrons can increase significantly, making it possible to observe quantum effects even at high temperatures [
12]. However, there is an additional limitation for CR in quantum wells. The frequency at which CR can occur must be higher than a minimum value, which depends on the size of the quantum well in the direction perpendicular to the magnetic field, i.e., the plane of the electron orbits at CR. This minimum frequency is determined by the condition that the radius of the cyclotron orbit (
rc) must be smaller than the size of the well (Lt).
here,
Vf is the velocity of electrons on the Fermi surface.
N is the electron concentration on the Fermi surface, and is its volume. Phase separation regions are a variant of a quantum well, and polarization barriers at their boundaries can provide conditions for the existence of CR at high temperatures. From the point of view of observing CR, the main feature of YIG and other ferromagnetically ordered crystals compared to non-magnetic semiconductors is the presence of intense, homogeneous (FMR), and inhomogeneous magnetic system excitations, which can strongly influence delocalized electron excitations (CR). In order to identify CR features that distinguish it from magnetic system spin excitations in a crystal, it is necessary to create conditions where spin and electronic vibrations weakly influence each other. This is taken into account in the experimental methodology developed in this work. We will assume that, in YIG, as in many other cubic crystals, the Fermi surface has a simple shape - a spheroid or an ellipsoid that is elongated along its major axis.
2. Materials and Methods
The samples were oriented such that when measuring the CR, the <111> axis of the crystal was directed along the magnetic field, H. We used YIG single crystal samples in the form of spheres with a diameter of approximately 0.5 mm. The main characteristics of the samples are provided in
Table 1.
In the table, ΔH is the FMR linewidth measured at 30 GHz, ω is the half-width of the swing curves, orientation when gluing samples: direction <111> along the normal, reflex 444, ϴB=26°. The observed scatter of ω values when rotating around the <111> axis indicates some blockiness of the structure.
The measurements were carried out using a magnetic resonance spectrometer in the 8 mm microwave range, using a per-pass scheme. The dependences of the transmission coefficient through the measuring cell with the sample on the magnetic field were measured. A magnetic field H with a range of 0-16 kOe was applied at a speed of 2 Oe/sec. A TE10n fundamental mode resonator, made from a standard waveguide with a cross section of 7.2×3.4 mm, was used as the measuring cell. A sample on a quartz holder was placed in the center of the resonator.
3. Results and Discussion
This section may be divided by subheadings. It should provide a concise and precise description of the experimental results, their interpretation, as well as the experimental conclusions that can be drawn.
When the fundamental mode is excited in the resonator, depending on the frequency, the sample finds itself either at the antinode of the electric field (ε
~ for
n – odd) or at the magnetic field (h
~ for
n – even), where n is the number of half-waves that fit along the length of the resonator. When measuring CR, the frequency corresponding to odd
n is used, and when measuring FMR, the frequency corresponding to even
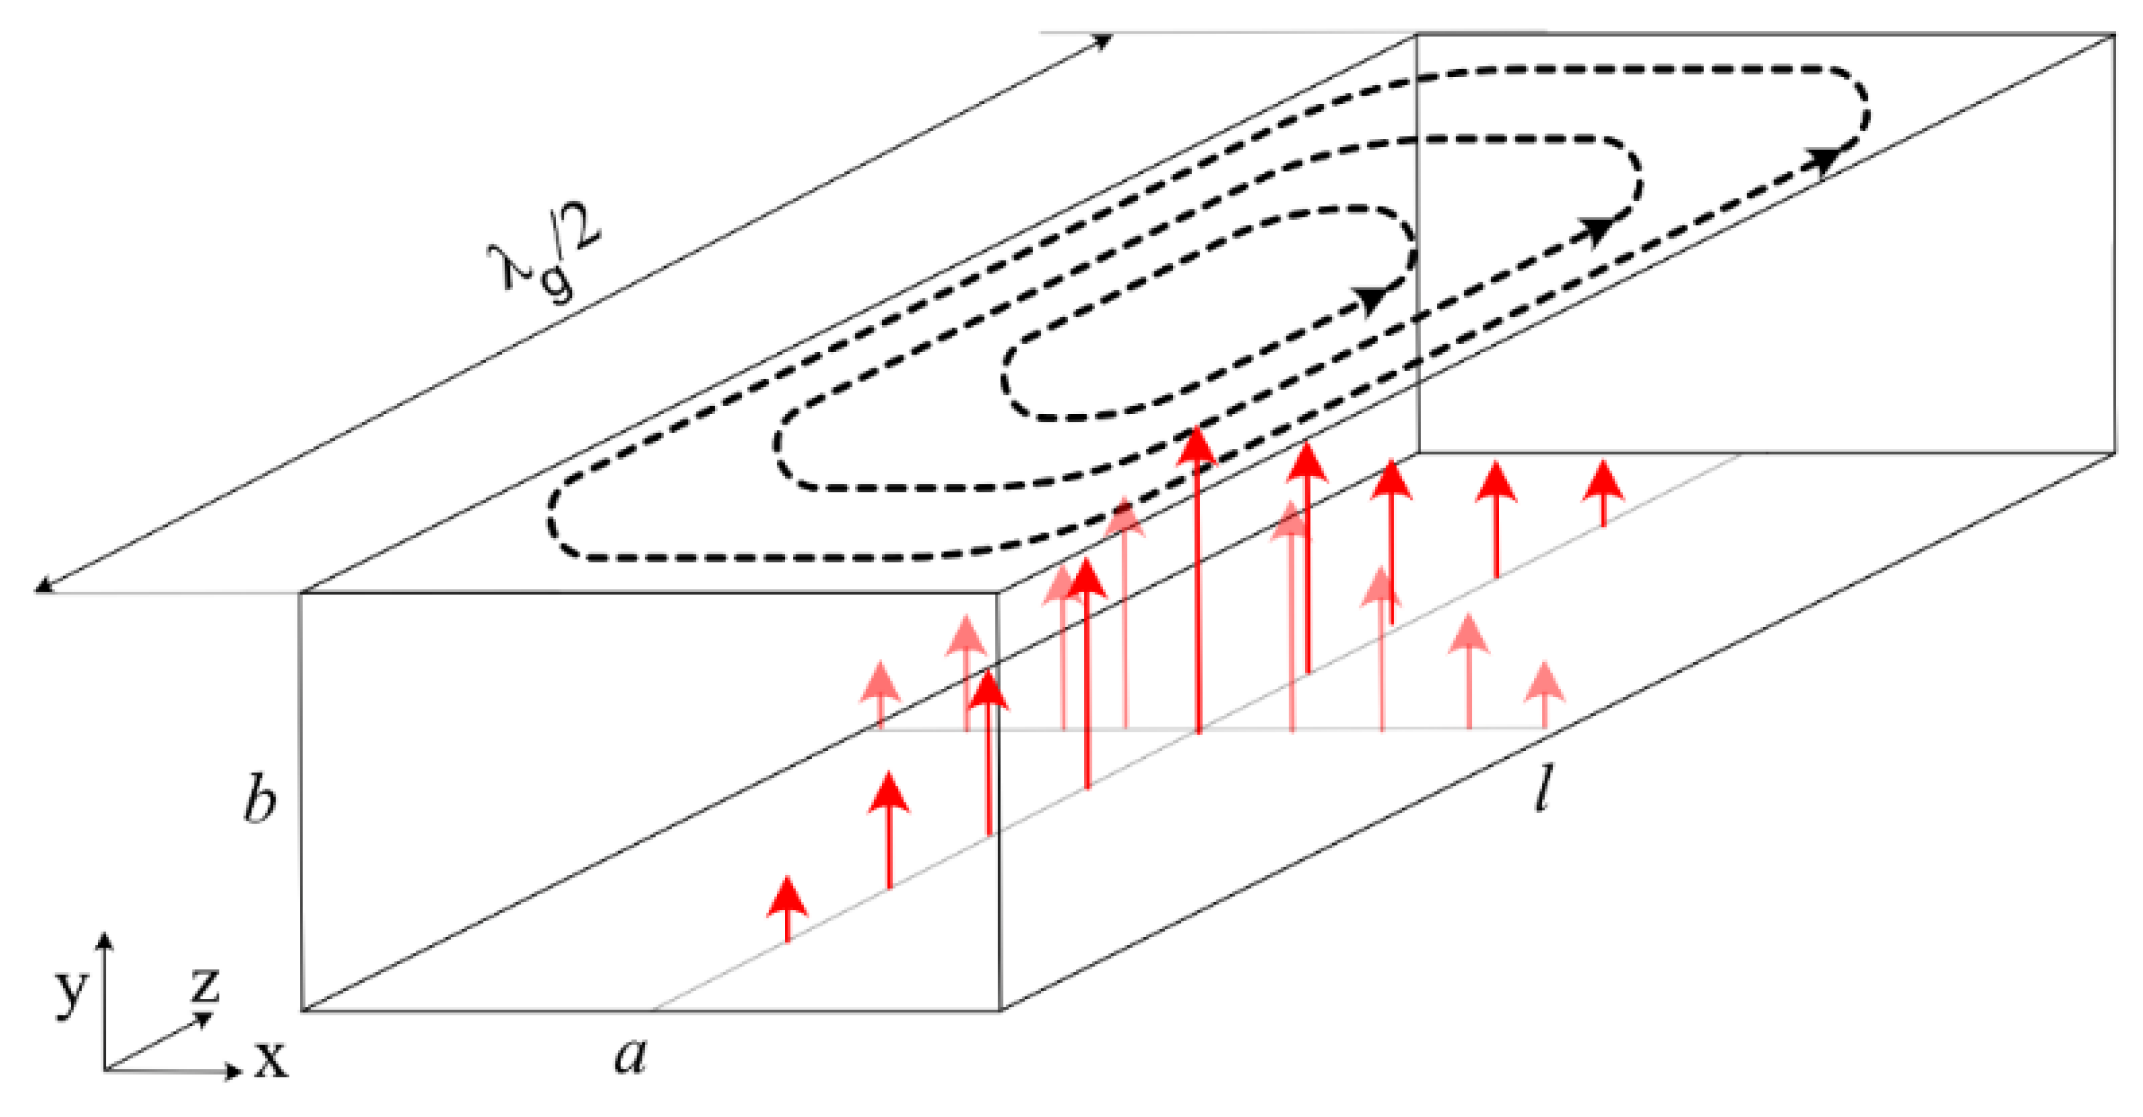
n is used. In the case of CR, the resonator is rotated around the horizontal axis so that the long wall of the cross-section is aligned with the field H (configuration C). When measuring FMR the resonator is installed with the long wall perpendicular to H (configuration F). The structure of the microwave field inside the resonator is shown in
Figure 1.
The electric component of the microwave field, E, has only a Y-component. Its value along the X and Z axes at a given location in the sample is determined by the following expression:
a,
l – the dimensions of the resonator along the x and z axes, respectively.
Since the antinodes and nodes for the electric and magnetic components are shifted by λ
g/4 (λ
g is the wavelength in the resonator) and the polarizations of these components are orthogonal, it is important to ensure maximum possible isolation when measuring CR and FMR. However, in reality, it is necessary to take into account obvious limitations caused by the finite size of the samples, the inaccuracy in their installation, and limitations associated with the redistribution of the microwave field. The presence of gyrotropy in the sample leads to different propagation constants for forward and backward waves in the resonator, making a single-mode state impossible and causing the emergence of higher modes that blur the positions of the antinodes and nodes of the main mode. In addition, when the FMR is excited, a secondary microwave wave is generated. The amplitude of this wave depends on the intensity of the resonance signal, which in turn depends on the width of the resonance curve ΔH, the magnitude of the magnetization of the sample, and its size. This field can exceed the field in the resonator without a sample. It also contains a component perpendicular to the main field, i.e., it is capable of exciting the CR in configuration F [
13,
14,
15].
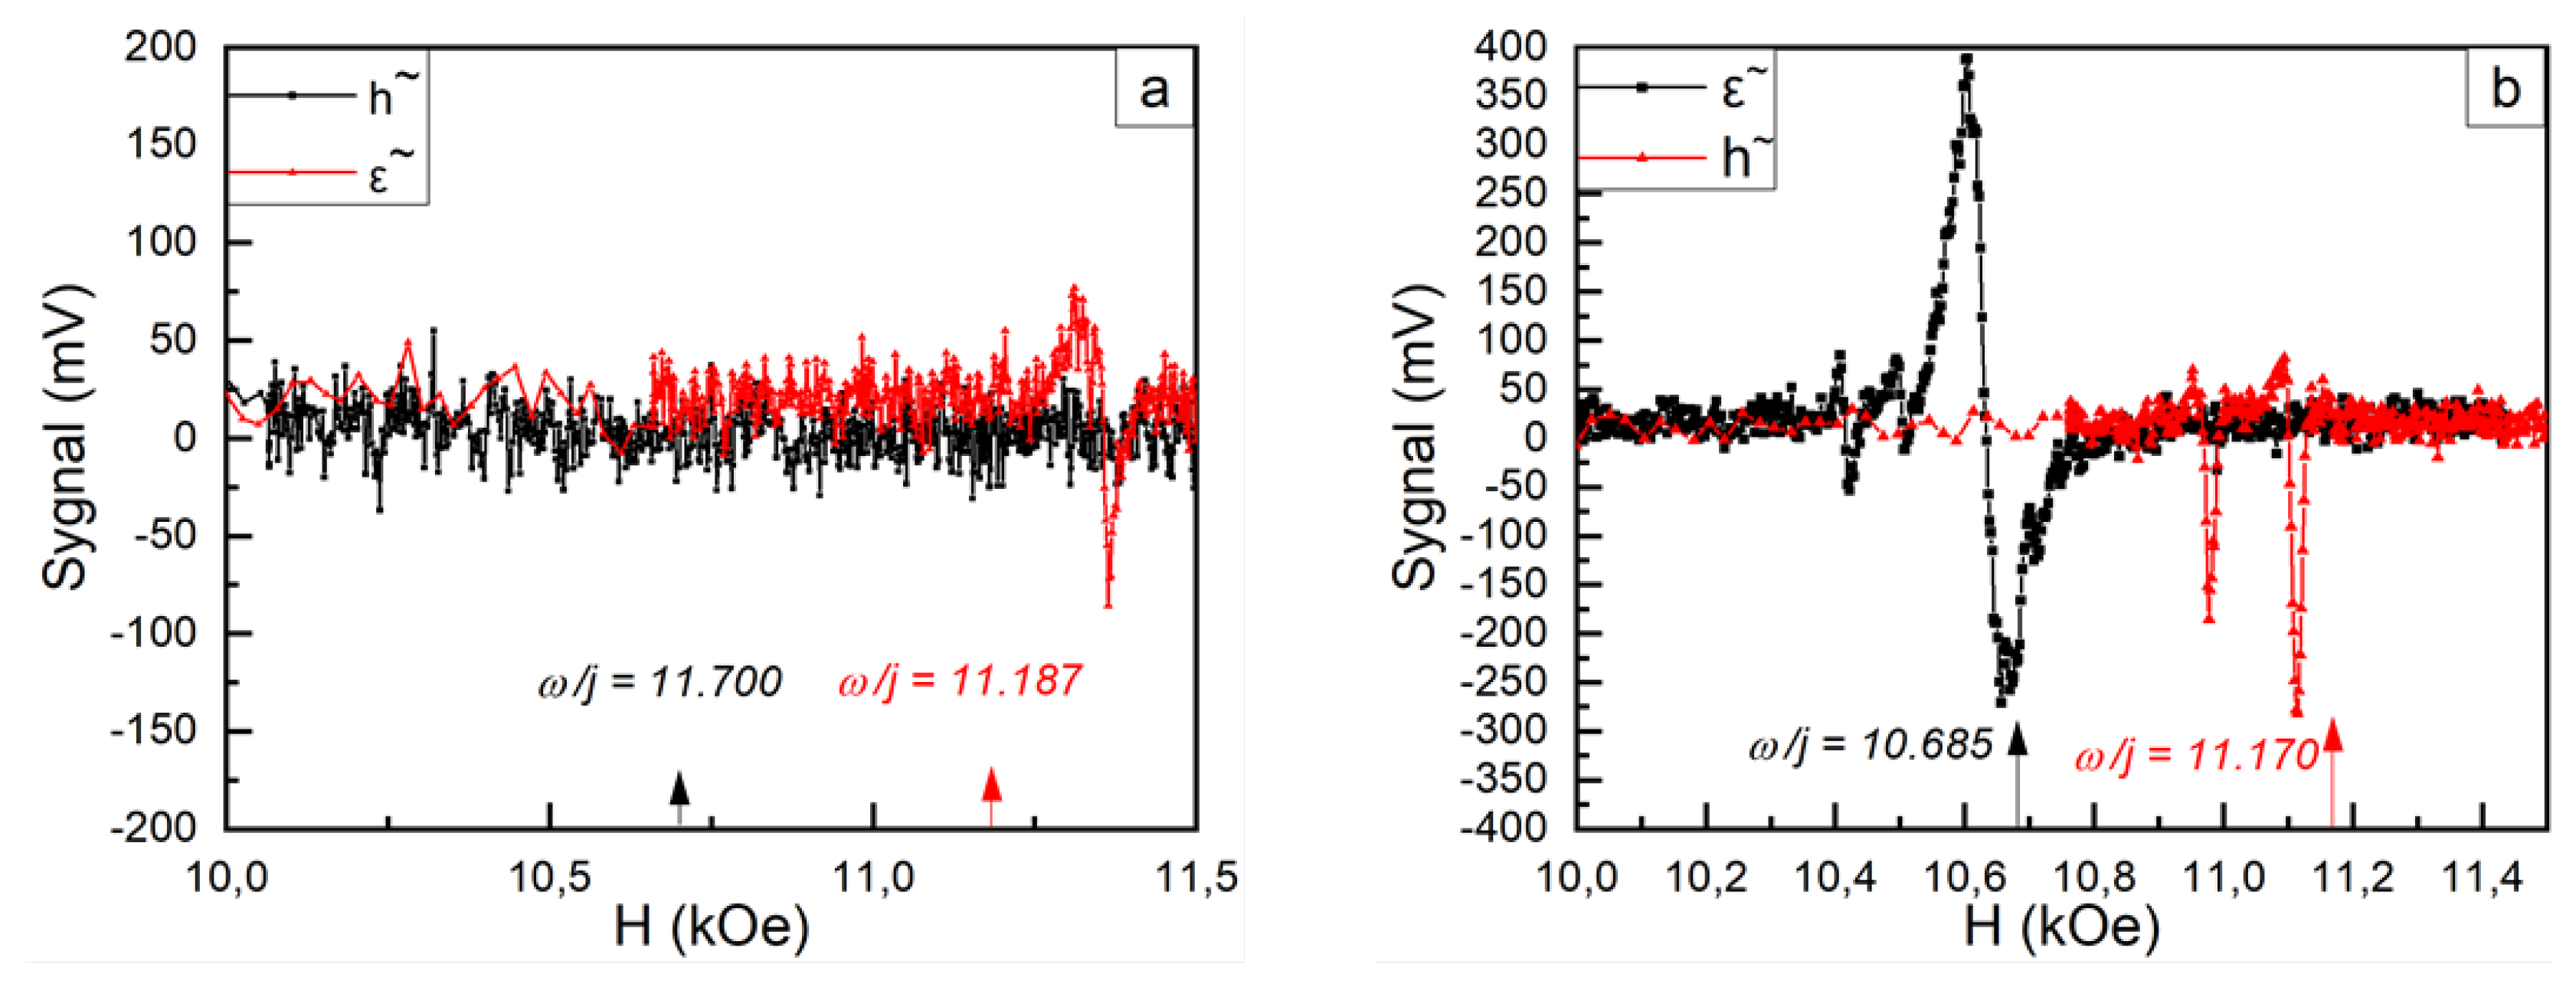
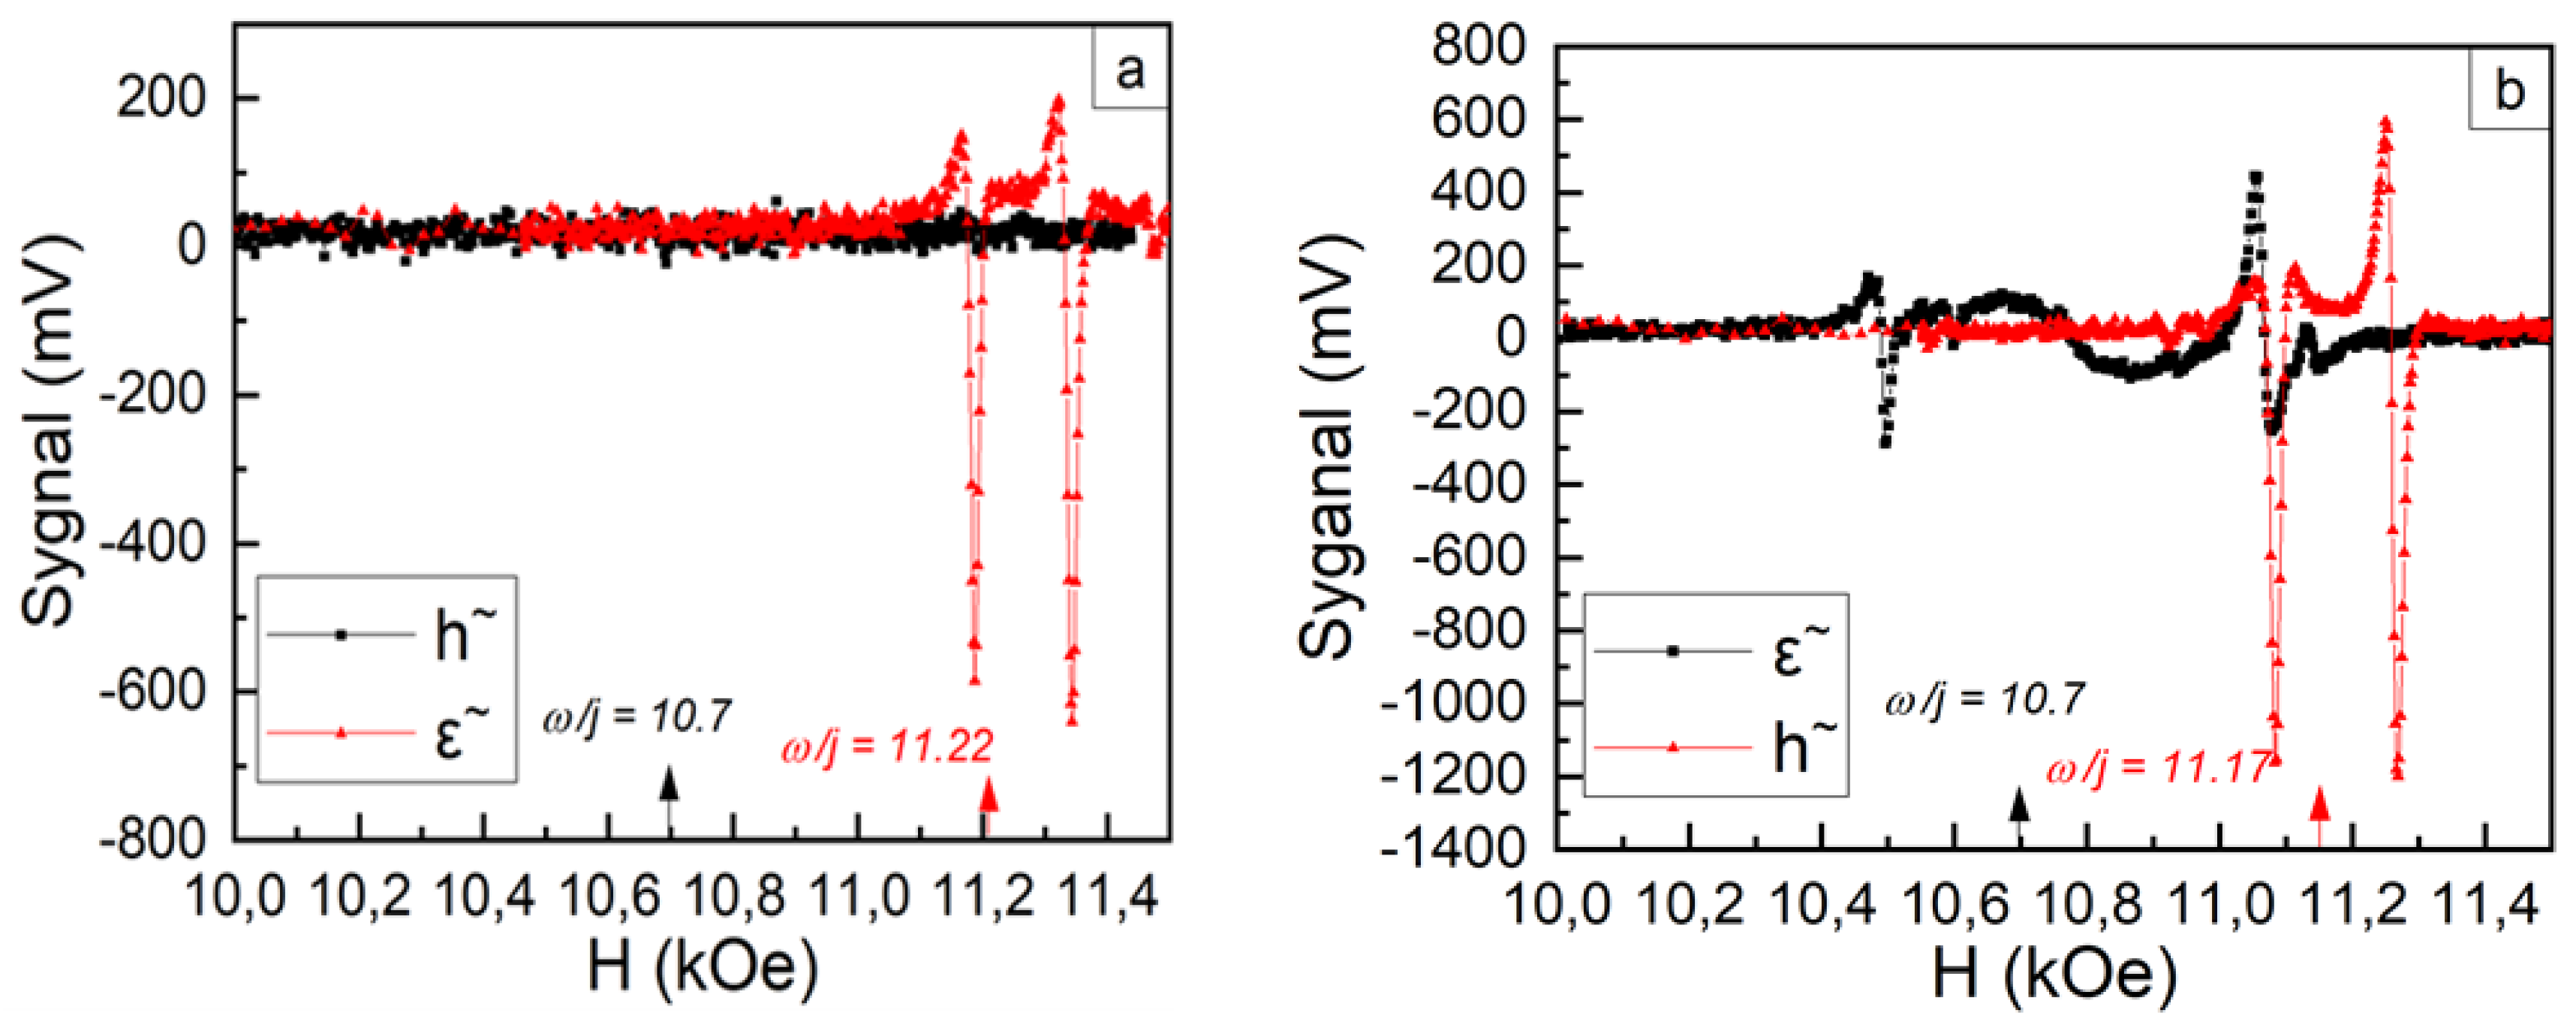
With narrow and intense FMR lines, nonlinear effects may also arise, during which a longitudinal component of the alternating magnetic moment appears during precession. The usual estimate for the threshold microwave field strength, starting from which nonlinear effects become significant, is hc ≤ ΔH/2. Considering all these factors, we used samples with minimal sizes and different ΔH values (see table), and performed measurements at low microwave powers. At the same time, it was possible to establish a fairly weak coupling between FMR and CR in some cases. Figures 2–4 present the results of measurements on samples in configurations C and F at microwave frequencies corresponding to the positions of the samples. Red lines indicate the samples at the antinodes ε~, while black lines represent the samples at h~ antinodes. The configurations and other experimental parameters for each sample are listed in the figure captions. All measurements presented in Figures 2–4 were conducted at a constant level of microwave power incident (P0 = 1 mV). We assessed the power level based on the voltage at the detector (P0), which allows us to compare the relative values of power for different measurements, but not the absolute value.
3.1. Measurement Results for Samples in Resonator
3.1.1. Results for Sample 1
Figure 2 shows the measurement results for sample No. 1. In configuration C, a resonance signal was visible at a frequency corresponding to the position of the sample at the antinode of the electric field (
Figure 2a, red line), when the magnitude of H was close to ω/ɣ. No resonances were detected at the antinode of the magnetic field in the same configuration (
Figure 2a, black line). This suggests that the resonant signal at the antinode of the electric field is associated with CR. For this sample in configuration C, the connection between FMR and CR is weak, and the observed behavior corresponds to the model. In configuration F (
Figure 2b), the FMR was polarization resolved and was observed at the antinode of the magnetic field near H = ω/g (
Figure 2b, black line). Along with the main line, there were also satellites, which may represent inhomogeneous precession types. At the antinode of the electric field in this configuration (
Figure 2b, red line), two intense signals are visible, which we believe to be CR signals. These signals arise due to the splitting of states within the Landau levels based on the quantum number l, as described by formulas 1 and 2. The observed signals correspond to the CR of electrons occupying states split by quantum number l. This interpretation is supported by the small value of the splitting (δω/ω = 0.01-0.015) and the dependence of the ratio of signal amplitudes on microwave power. We will discuss the dependence of signal amplitude on microwave power in more detail later, when we consider the results for sample 3.
It is also possible that these signals correspond to both CR electrons and CR holes, as the microwave wave in the resonator has a linear polarization, and its right-handed circular component excites electrons, while its left-handed circular component excites holes. However, we find this explanation less likely.
3.1.2. Results for Sample 2
Figure 3 shows the measurement results for sample 2, which has a slightly narrower FMR line than sample 1. The results are similar to those obtained for sample 1, as can be seen. In configuration C, the signals are completely identical. In configuration F, however, the signals differ slightly. It should be noted that if samples are oriented the same way in configuration C (<111>||H), then they have different orientations in configuration F because the orientation in the (111) plane is not the same for all samples.
3.1.3. Results for Sample 3
Let us now consider the results for sample 3, which has the narrowest (ΔH ~ 1–2 Oe) FMR line (
Figure 4). In this sample, in configuration C, at the antinode of the electric field, there are still two intense peaks, as in previous cases (
Figure 4a). We classify these peaks as CR, but several weaker signals are also visible at the magnetic field antinode in this configuration compared to the ε
~ antinode, because when FMR is intense, an effective coupling between CR and FMR occurs. At the antinodes of the F configuration's electric fields, signals are observed which differ little from those observed in the C configurations' antinodal regions. Numerous signals are found at the antinodal region of the magnetic fields which are difficult to interpret unambiguously without further research. In the case of a small ΔH, the coupling between magnetic and charge excitations is so strong that mixed modes occur, which are excited by both the electric and magnetic components of the microwave field, with slightly different efficiencies. To reduce this coupling, we measured the extremely low power of the exciting microwave field. Achieving this regime in a resonator is difficult, so these measurements were conducted in a waveguide.
3.2. Results of Measurements in a Waveguide
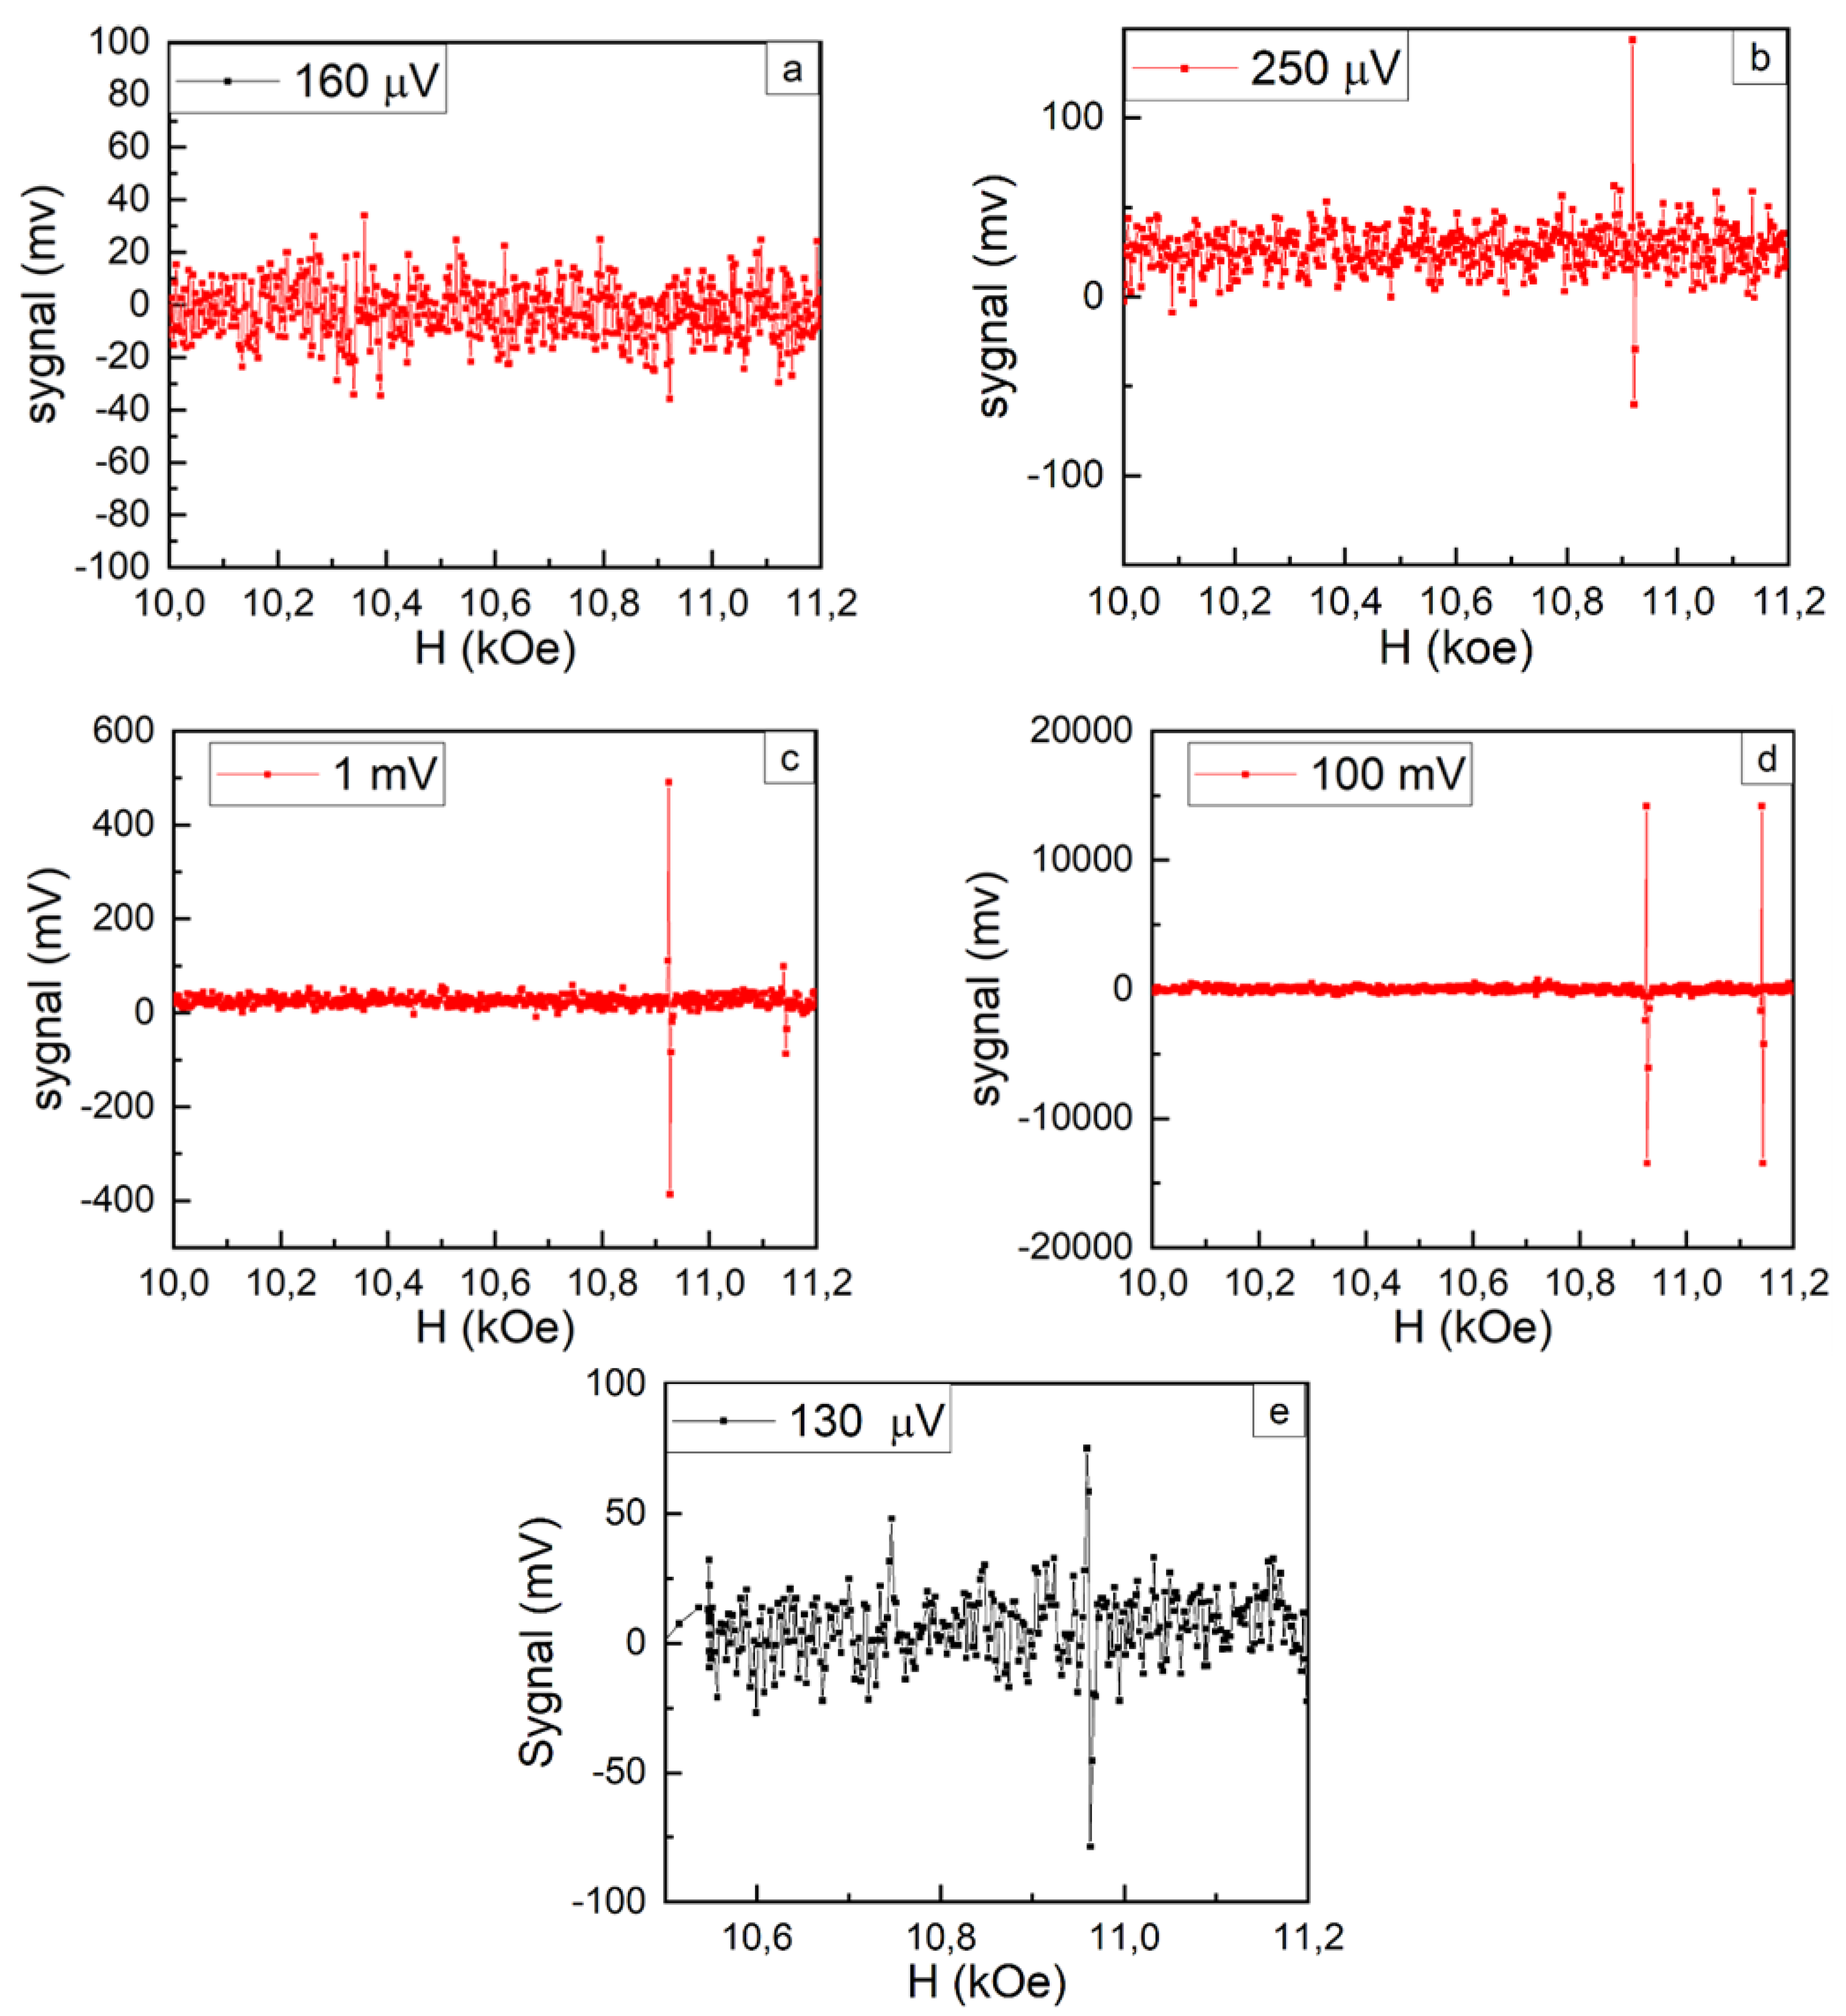
Figure 5 shows the results of these measurements. It can be seen that, in configuration C, at P
0 < 0.2 mV, resonance signals are not observed. At P
0 > 0.2 mV, a resonant signal appears initially, and then, at P
0 > 1 mV, two signals of different intensities are observed. At high power levels, P
0 ~ 100 mV, the amplitudes of both observed signals become equal. In configuration F (
Figure 5d), there is no threshold for microwave field amplitude, and at P
0 ~ 0.13 mV, there is clearly a resonant signal. Since the travelling wave mode is used in the waveguide, conditions for the excitation of both the CR and FMR, in amplitude ε and h, are available in both C and F configurations. However, there is polarization decoupling, which is stronger than in a resonator, due to the lack of higher modes of waves. The microwave threshold observed in configuration C should be attributed to CR. The existence of this threshold for CR is due to the fact that the delocalized electrons in PSR are not completely free. They are weakly bound at the charged boundaries of PSR and require a certain amount of electrical microwave field to release them.
The observed dependence of signals CR on microwave power corresponds to the idea that the presence of two signals is due to splitting in l, and the difference in their intensities corresponds to the difference between the populations of the lower and higher states.
4. Conclusions
In conclusion, we note that the goal of this work was to detect CR in YIG. The obtained set of experimental data gives grounds to assert that CR actually exists in YIG and manifests itself in magnetic resonance spectra at room temperature. It manifests itself as mixed spin-electronic vibrations in some cases, but in other situations, the connection between the ferromagnetic spin and electronic systems is weakened and CR can occur in its "pure" form. However, it always significantly affects the magnetic dynamics of YIG at high microwave frequencies. The possibility of CR existence at room temperature can be explained by the fact that electrons inside PSR are shielded from the crystal lattice, as in other quantum wells. In this case, the effective temperature inside PSR is low and phonon scattering is small. The electron-electronic relaxation mechanism is also small due to the low concentration (N≤10
14 cm
-3) of delocalized electrons [
2], as well as due to the partial correlation of electron orbits at CR due to the magnetic-dipole coupling of their ferromagnetically biased spins.
Author Contributions
Conceptualization B.K. and V.S.; investigation B.K., E.G., M.S. and V.S.; writing—original draft preparation V.S.; review and editing B.K., E.G., M.S. and V.S. All authors have read and agreed to the published version of the manuscript.
Funding
This research received no external funding.
Data Availability Statement
In the present study, references are provided to works in which one can find data confirming some of the specific results of this work. This is reported as the presentation of the main new results obtained in this paper. This is part of the main text. All new data is shared first time.
Conflicts of Interest
The authors declare no conflict of interest.
References
- Khannanov V.K., Golovenchits E.I., Sanina V.A., JETP Lett 2022, 115, 231–238.
- Boris Khannanov, Evgeny Golovenchits, Mikhail Shcheglov and Viktoriya Sanina Nanomaterials 2023,13, 2147.
- Bar'yakhtar, V.G., Lvov, V.A., Yablonskii D.A. Pis'ma Zh. Eksp. Theor. Phys. 1983, 37, 565.
- V.A.Fock, Phys., 1928, Bd.47 , 5, 446-449.
- L.D. Landau, Phys., 1930, Bd.64, 5, 629 - 637.
- Frenkel Ya.I., Bronshtein M.P., Journal of ZhRFKhO, 1930, v.62, Issue 5, p.485 -493.
- Ya.G. Dorfman, DAN USSR, 1951, v. 81, p. 765.
- R.B. Dingle, Proc. Royal Soc. London Ser.A Math. and Phys. Sci., 1952, V. 212, n.1108, p. 94.
- G. Dresselhaus, A.F.K. Kip and C. Kittel Phys. Rev., 1955, 98, 368.
- D. Shoenberg Magnetic oscillations in metals. Cambridge-Univ. Press. 1984.
- V.N. Lazukin, UFN, 1956, v. 59 n.3,553-582.
- V.V. Romanov, V.A. Kogevnikov, C.T. Tracey, N.T. Bagraev, Phys.Techn. Semicond., 2019, v. 53, n.12, p.p. 1647-1650.
- Pistolkors A.A., Xu Yan-Shen, Radio Engineering and Electronics, 1960, v.5, iss. 1, p.p. 3-14.
- Xu Yan-Shen, Radio Engineering and Electronics, 1960, v.5, iss. 1, p.p. 14 -26.
- Alexander Gurevich and Gennadiy Melkov. Magnetic oscillations and waves. Moscow, Nauka, Main Editorial Board for Literature on Physics and Mathematics, 1994, pp. 464.
|
Disclaimer/Publisher’s Note: The statements, opinions and data contained in all publications are solely those of the individual author(s) and contributor(s) and not of MDPI and/or the editor(s). MDPI and/or the editor(s) disclaim responsibility for any injury to people or property resulting from any ideas, methods, instructions or products referred to in the content. |
© 2024 by the authors. Licensee MDPI, Basel, Switzerland. This article is an open access article distributed under the terms and conditions of the Creative Commons Attribution (CC BY) license (http://creativecommons.org/licenses/by/4.0/).


