1. Introduction
Hepatocellular carcinoma (HCC) represents a significant global burden as one of the most prevalent malignant tumors, with increasing incidence and mortality rates, thereby presenting a major challenge to public health and clinical management [
1,
2,
3]. Despite advancements in HCC treatment over the past few decades, the prognosis, particularly for patients with advanced-stage liver cancer, remains discouraging [
1,
4]. Therefore, a comprehensive understanding of HCC pathogenesis and the identification of novel therapeutic targets are of utmost importance.
In recent years, ferroptosis has attracted widespread attention as a new type of cell death. Compared with other common cell death modes (such as apoptosis, necrosis and autophagy), ferroptosis is a cell death characterized by iron-dependent lipid peroxidation [
5,
6,
7]. Excess iron leads to the generation of reactive oxygen species (ROS) through the Fenton reaction (the reaction of iron with hydrogen peroxide converts ferrous iron to ferric iron, while hydrogen peroxide generates hydroxyl radicals) [
8]. Excessive ROS can induce lipid peroxidation on the cell membrane, thereby triggering ferroptosis [
9]. Ferroportin (FPN) is responsible for exporting excess Fe
2+ out of the cell, while auxiliary proteins such as ceruloplasmin and hephaestin assist in the oxidation of Fe
2+ to Fe
3+ for utilization by other tissues or cells [
10]. Cells with elevated iron levels are more susceptible to ferroptosis, which can be blocked by iron chelators such as Deferiprone (DFP) [
11]. Cellular redox homeostasis is maintained by glutathione (GSH) and glutathione peroxidase 4 (GPX4). GPX4 is the only enzyme that can utilize reduced glutathione to eliminate lipid peroxides [
8]. Therefore, inhibition of lipoxygenase (such as NDGA and Zileuton) can effectively reduce the accumulation of lipid peroxides and thus inhibit ferroptosis [
12]. In addition, depletion of glutathione (GSH) levels (such as Erastin) [
13] or inhibition of GPX4 enzyme activity (such as RSL3) [
14] can increase intracellular lipid peroxide levels and induce ferroptosis. For tumor cells, ferroptosis is of great significance because tumor cells rely on high levels of iron to promote invasive growth, making them more sensitive to ferroptosis [
8]. Therefore, induction of ferroptosis has been considered a promising strategy against drug-resistant tumors, especially HCC [
15]. However, further studies are needed to elucidate the regulatory mechanisms of ferroptosis in HCC.
MDH2 is a crucial enzyme in cellular metabolism as it serves as the terminal enzyme of the mitochondrial tricarboxylic acid (TCA) cycle. It utilizes nicotinamide adenine dinucleotide (NAD) as a cofactor to catalyze the conversion of L-malate to oxaloacetate, generating reducing equivalents [
16]. Due to its significant role in the TCA cycle, MDH2 has attracted widespread attention, and researchers have found that it plays a pivotal role in tumor growth, metastasis, and chemotherapy resistance [
17]. As a mitochondrial enzyme, MDH2 is involved in redox reactions and energy metabolism within mitochondria. Mitochondria play a crucial role in intracellular iron storage and metabolism [
18]. Therefore, dysregulation of MDH2 may disrupt intracellular iron balance, potentially impacting the occurrence of ferroptosis. Recent investigations have suggested that reduced MDH2 expression in sarcopenia may promote muscle ferroptosis [
19]. Metabolic enzymes can regulate various cellular activities depending on different stresses [
20,
21,
22]. However, the specific role of MDH2 in HCC and its relationship with HCC ferroptosis remain largely unexplored.
In this study, we demonstrate that MDH2 promotes HCC ferroptosis evasion by inhibiting ubiquitination and degradation of GPX4. Furthermore, MDH2 deficiency sensitizes HCC cells to ferroptosis, which inhibits HCC tumor growth.
2. Materials and Methods
2.1. Cell lines and Cell Culture
Liver cancer cell lines (Huh7, Hep3B, SNU398, PLC/PRF5, HLE, HCCLM3 and HepG2), human normal hepatocytes (L02) and human embryonic kidney cells (HEK-293T) were purchased from the Cell Bank of the Type Culture Collection Committee of the Chinese Academy of Sciences. All cells were cultured in Dulbecco’s modified eagle medium (DMEM, Solarbio, Cat# 11965) containing 10% fetal bovine serum (FBS, Gbico, Cat# 10100147C) at 37°C and 5% CO2. The cells were replaced with culture medium every 1-2 days, and after growing to the logarithmic phase (cells grow to about 80%), follow-up experiments or subcultures could be performed.
2.2. Regents and Antibodies
Regents used in this study including: RSL3 (CSNpharm, Cat# CSN17581); N-acetyl-L-cysteine (NAC, MCE, Cat# HY-B0215); Ferrostatin-1 (Fer-1, Abmole, Cat# M2698); Deferiprone (DFP, Abmole, Cat# M2617); protease inhibitor PMSF (Wuhan Dingguo Biotechnology, Cat# 329-98-6); polybrene (MCE, Cat# HY-112735); puromycin (Solarbio, Cat# P8230); transfection reagent (Pufei Biotech, Cat# 2102-100); paraform-aldehyde (Solarbio, Cat # P1110); TRIzol reagent (Invitrogen, Cat# 15596-026); M5 Su-per plus qPCR RT kit with gDNA remover (Mei5bio, Cat# MF166-plus-T); M5 HiPer One-step RT-PCR Kit (Mei5bio, Cat# MF051-01); ABI QuantStudio 7 Flex with SYBR kit (TransGen, Cat# AQ601-02); MG132 (Biovision, Cat# 1791-5); dodecyl sulfate Sodium (SDS, Solarbio, Cat# S8010); N-Ethylmaleimide (NEM, Solarbio, Cat# N8760); DCFH-DA (MCE, Cat# HY-D0940), PGSK (MCE, Cat# HY-126823); C11-BODIPY581/591 (MCE, Cat# HY-D1691).
The antibodies were as follows: Flag (Sigma, Cat# 66008-3Ig, used at 1:5000); MDH2 (Proteintech, Cat# 15462-1-AP, used at 1:4000); Vinculin (santa cruz , Cat# sc-73614, used at 1:8000); GPX4 (Proteintech, Cat# 67763-1-Ig, used at 1:1000); SLC7A11 (Proteintech, Cat# 18790-1-AP, used at 1:4000 ); HA (santa cruz, Cat# sc-7392, used at 1:5000); MYC (Proteintech, Cat# 60003-2-Ig, used at1:5000); HRP conjugated goat-anti-mouse or rabbit antibody (santa cruz, used at 1:5000).
2.3. Western Blot (WB)
Cells were lysed with RIPA cell lysis buffer (Solarbio, Cat# R0100) containing 1% protease inhibitor PMSF (Wuhan Dingguo Biotechnology, Cat# 329-98-6) for 30 minutes at 4°C, and then the lysates were transferred into 1.5 ml EP tube to centrifuge at 12000 rpm/min for 20 minutes at 4°C. Transfer the supernatant to a new EP tube followed by adding 2× loading buffer at a ratio of 1:1 and mix well to boil it for 10 minutes. Samples were then subjected to SDS-PAGE, after proteins were transferred to a PVDF membrane (Millipore, Cat# 03010040001), the PVDF membrane was blocked in 5% skimmed milk powder (Solarbio, Cat# D8340) for 1 hour at room temperature and then incubated with antibodies. After washing with TBST, ECL chemiluminescence solution kit (Meilunbio, Cat# MA0186) was used for color development, and finally imaging and storage were performed.
2.4. Construction of Stable MDH2 Knockdown Cell Line
The lentivirus was packaged in HEK-293T cells. Briefly, HEK-293T cells were seeded and transfected with the target plasmid (plko.1-puromycin or plko.1-shMDH2 plasmids) and lentivirus packing plasmids PSPAX2 and PMD2.G. After transfection of 48 hours, the supernatant was collected and filtered with a 0.45 μM filter to remove cell debris to infect HCC cells with addition of 5 μg/ml polybrene (MCE, Cat# HY-112735). 48 hours after infection, 2 μg/ml puromycin (Solarbio, Cat# P8230) was added to the culture medium of HCC cells for 2 days to kill the uninfected cells.
Table 1.
Primer sequence for MDH2 shRNA.
Table 1.
Primer sequence for MDH2 shRNA.
| Name |
Forward sequences (5’-3’)
|
Reverse sequences (5’-3’)
|
| shMDH2#1 |
CCGGTGGCCAGTTTCCTTAATTTATCTCGAGATAAATTAAGGAAACTGGCCATTTTTG |
AATTCAAAAATGGCCAGTTTCCTTAATTTATCTCGAGATAAATTAAGGAAACTGGCCA |
| shMDH2#2 |
CCGGTCATTGCCAATCCGGTTAATTCTCGAGAATTAACCGGATTGGCAATGATTTTTG |
AATTCAAAAATCATTGCCAATCCGGTTAATTCTCGAGAATTAACCGGATTGGCAATGA |
2.5. Transient Transfection of Plasmid
Cells were seeded and transfected when the cell density was approximately 80%. The transfection reagent (Pufei Biotech, Cat# 2102-100) were used for transient transfection of plasmid in HCC cells. Briefly, 125 μl of serum-deficient DMEM medium (Solarbio, Cat# 11965) was added to tubes A and B respectively, and then 9 μl of transfection reagent (Pufei Biotech, Cat# 2102-100) was added to tube B. Add 3 μg of plasmids (3.1-SFB or 3.1-MDH2-SFB plasmids) to tube A, carefully add the liquid from tube B to tube A and mix gently. After standing for 15 minutes, the transfection mixture was evenly dispersed into the cells. Shake gently followed by 12-16 hours of culture, then replace with fresh medium and cultured for another 12-24 hours.
2.6. Cell Proliferation Assay
HCCLM3 and HLE cells (3000 cells per well) were seeded into 24-well plates and cultured for 0, 2, 4, and 6 days. Cells were washed three times with PBS and then fixed with 4% paraformaldehyde (Solarbio, Cat# P1110) for 30 minutes at room temperature. Cells were stained with 500 μl crystal violet for 2 minutes and washed to remove the free crystal violet. Add 200 μl of 10% concentration glacial acetic acid to the stained cells in the wells, shake well, dissolve and elute for 1 hour. Finally, transfer the crystal violet dissolved in glacial acetic acid to a 96-well plate, measure the OD value on a microplate reader at a wavelength of 595 nm, calculate the data and draw a growth curve based on the OD value.
2.7. Colony Formation Assay
Cells were detached and counted, 50,000 cells per well were seeded into a 6-well plate and cultured at 37°C and 5% CO2 for 10 days. Cells were washed three times with PBS and fixed with 4% paraformaldehyde (Solarbio, Cat# P1110) for 30 minutes at room temperature followed by staining with 0.1% crystal violet in 20% methanol for 15 minutes. Finally, the stained cells were washed with PBS and photographed or calculated.
2.8. Quantitative Real-Time PCR (RT-qPCR)
Total RNA was extracted from cells using TRIzol reagent (Invitrogen, Cat# 15596-026) according to the manufacturer’s instructions. RNA integrity, quantity, and purity were checked using a NanoDrop 2000c spectrophotometer (Thermo Fisher Scientific). Genomic DNA was removed using M5 Super plus qPCR RT kit with gDNA remover (Mei5bio, Cat# MF166-plus-T). Total RNA was then reverse-transcribed into cDNA using the M5 HiPer One-step RT-PCR Kit (Mei5bio, Cat# MF051-01). Real-time PCR was performed in 20 μL reaction mixtures, and real-time qPCR analysis was performed using ABI QuantStudio 7 Flex with SYBR kit (TransGen, Cat# AQ601-02). Each sample was tested in three biological replicates per assay. Relative gene expression levels were analyzed using the comparative Ct method, where Ct is the threshold number of cycles normalized to GAPDH.
Table 2.
Primers sequences for qPCR.
Table 2.
Primers sequences for qPCR.
| Gene |
Forward sequences (5’-3’)
|
Reverse sequences (5’-3’)
|
| MDH2 |
AAAGTAGCTGTGCTAGGGGC |
GGTCCGAGGTAGCCTTTCAC |
| GPX4 |
GAGGCAAGACCGAAGTAAACTAC |
CCGAACTGGTTACACGGGAA |
| SLC7A11 |
GGTCCATTACCAGCTTTTGTACG |
AATGTAGCGTCCAAATGCCAG |
| GAPDH |
GAAGGTCGGAGTCAACGGAT |
GACGGTGCCATGGAATTTGC |
2.9. IP and Immunoblotting analysis
Cells were harvested and lysed with RIPA cell lysis buffer (Solarbio, Cat# R0100) containing 1% protease inhibitor PMSF (Wuhan Dingguo Biotechnology, Cat# 329-98-6) for 30 minutes at 4°C and then cell lysates were transferred into a 1.5 ml EP tube and centrifuged at 12,000 rpm/min for 20 minutes at 4°C. After centrifugation, the supernatant was transferred to a new EP tube, mixed with 50 μl of protein G-agarose beads and 1 μg of antibody, and incubated for 4 hours at 4°C. After incubation, samples were centrifuged at 3000 rpm/min for 2 minutes, the supernatant was discarded, and the immunoprecipitate was washed three times with RIPA cell lysis buffer (Solarbio, Cat# R0100). Finally, the immunoprecipitate was dissolved in SDS buffer and boiled for 10 minutes before performing SDS-PAGE.
2.10. Ubiquitination Assay
HEK-293T cells were seeded and transiently transfected with plasmids (HA-Ub, Myc-MDH2, Flag-GPX4). 48 hours after transfection, cells were treated with 10 μM MG132 (Biovision, Cat# 1791-5) for 6 hours, then cells were harvested and lysed with RIPA cell lysis buffer (Solarbio, Cat# R0100) containing 1% PMSF (Wuhan Dingguo Biotech, Cat# 329-98-6), sodium dodecyl sulfate (SDS, Solarbio, Cat# S8010) and N-ethylmaleimide (NEM, Solarbio, Cat# N8760), and immunoprecipitation was performed with anti-Flag antibodies (Sigma, Cat# 66008-3Ig). Immunoprecipitated proteins were analyzed by Western blotting using anti-HA antibodies (santa cruz, Cat# sc-7392).
2.11. Cell Death Analysis
Cell death analysis was determined by propidium iodide (PI) staining. Briefly, cells were collected and stained with 10 μg/ml PI for 15 minutes at room temperature in the dark. After staining, cells were centrifuged and washed twice with PBS to remove free PI. The stained cells were resuspend in 500 μl PBS and placed on ice for flow cytometry analysis. Data were analyzed using Flowjo software.
2.12. Cell Viability Assay
Cell viability was determined by CCK-8 assay. Briefly, cells were detached and counted, 3500 cells in 200 μl DMEM were seeded into 96-well plates and cultured. After the culture, 10 μl CCK8 reagent was added to each well to incubate in the incubator for 1 hour. The OD value of each sample was measured at 450 nm on a microplate reader, and the cell viability rate was calculated.
2.13. Intracellular ROS, Fe2+, and Lipid ROS Levels Detection
Intracellular ROS, Fe2+, and lipid ROS levels were determined using flow cytometry according to the manufacture instructions. Briefly, cells were seeded and cultured in 6-well plates. Cells were washed three times with PBS and treated with ROS probe DCFH-DA (MCE, Cat# HY-D0940), Fe2+ probe PGSK (MCE, Cat# HY-126823), lipid ROS probe Cll-BODIPY581/591 (MCE, Cat# HY-D1691) in PBS to incubate for 30 minutes at 37°C. After incubation, cells were detached, collected and washed twice with PBS and finally resuspended in 500 μl PBS on ice and analyzed with flow cytometry. Data were analyzed by Flowjo software.
2.14. Statistical Analysis
GraphPad Prism 9 was used for all statistical analyses. All quantitative data are expressed as the mean ± SD of at least three independent experiments. Differences between experimental groups were analyzed using Student’s t test or one-way ANOVA. Correlations of categorical variables were compared using the Pearson test. p < 0.05 was considered statistically significant.
4. Discussion
Ferroptosis is a type of programmed cell death that results from iron-mediated membrane lipid peroxidation [
7,
9]. Due to activated metabolic activity and higher ROS load in tumor cells, ferroptosis induction is a promising strategy for cancer treatment [
8]. MDH2, the enzyme in TCA cycle, ranked first among ferroptosis-related differentially expressed genes in the GSE1428 dataset [
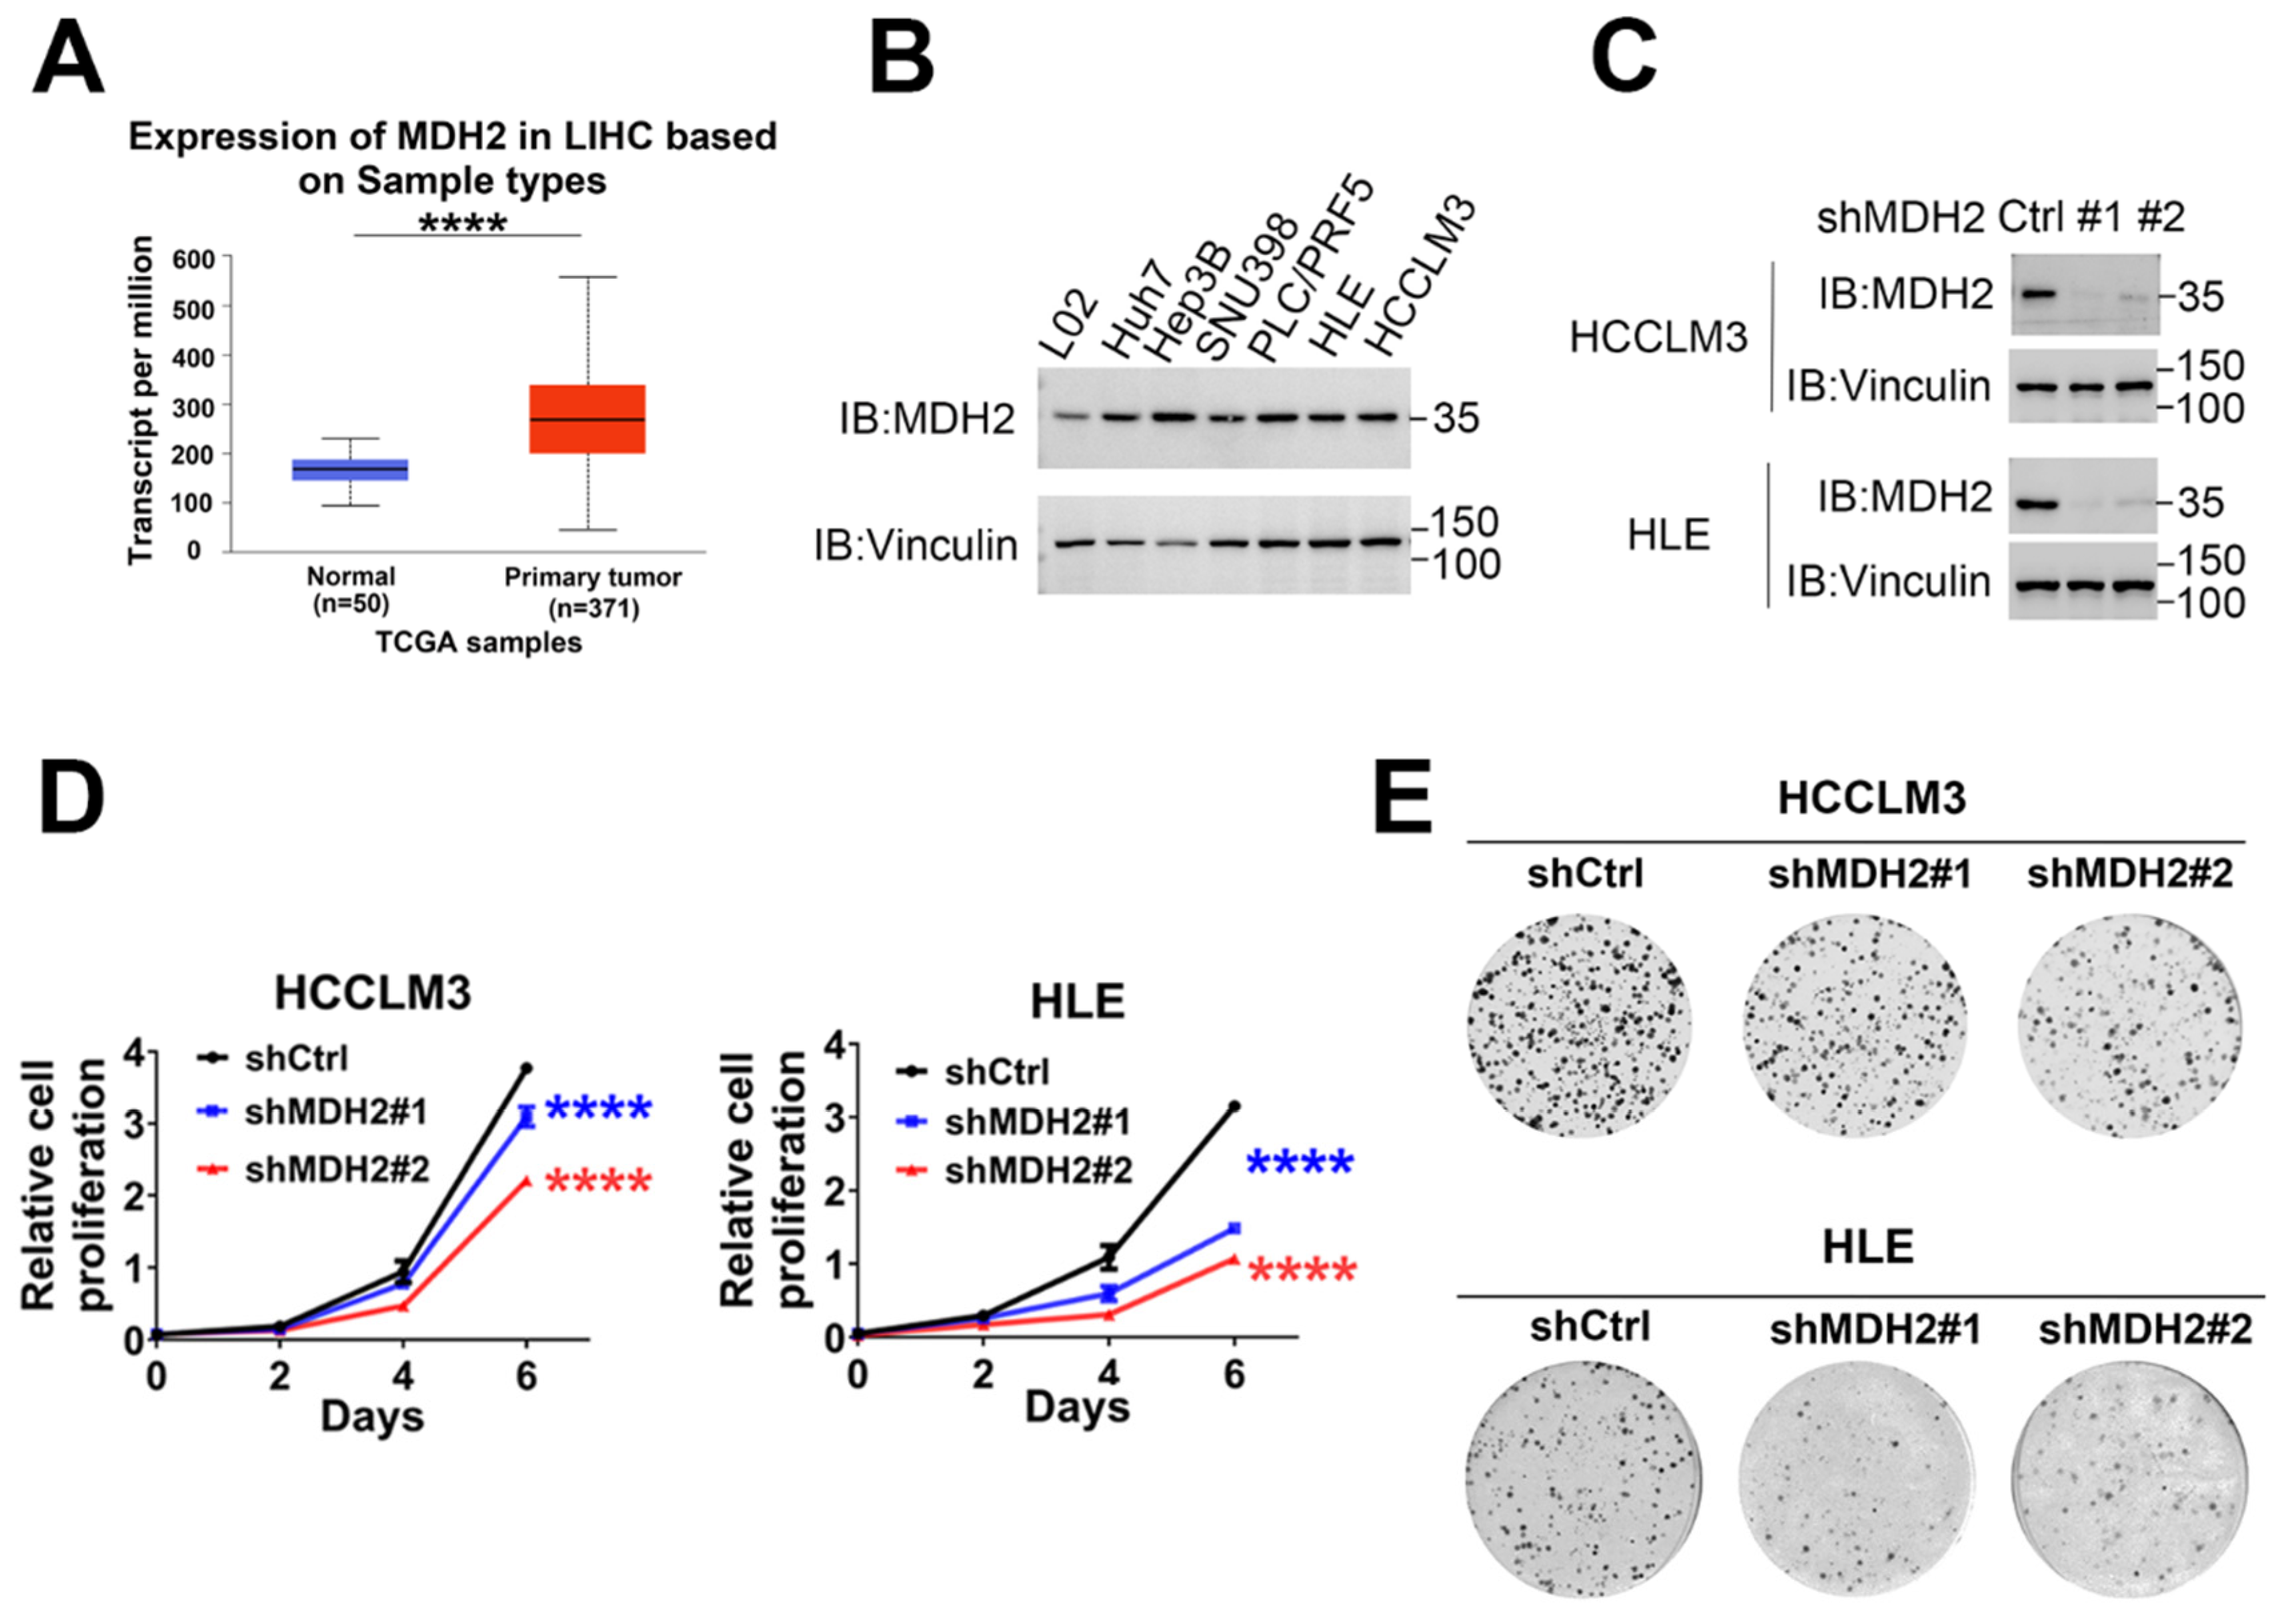
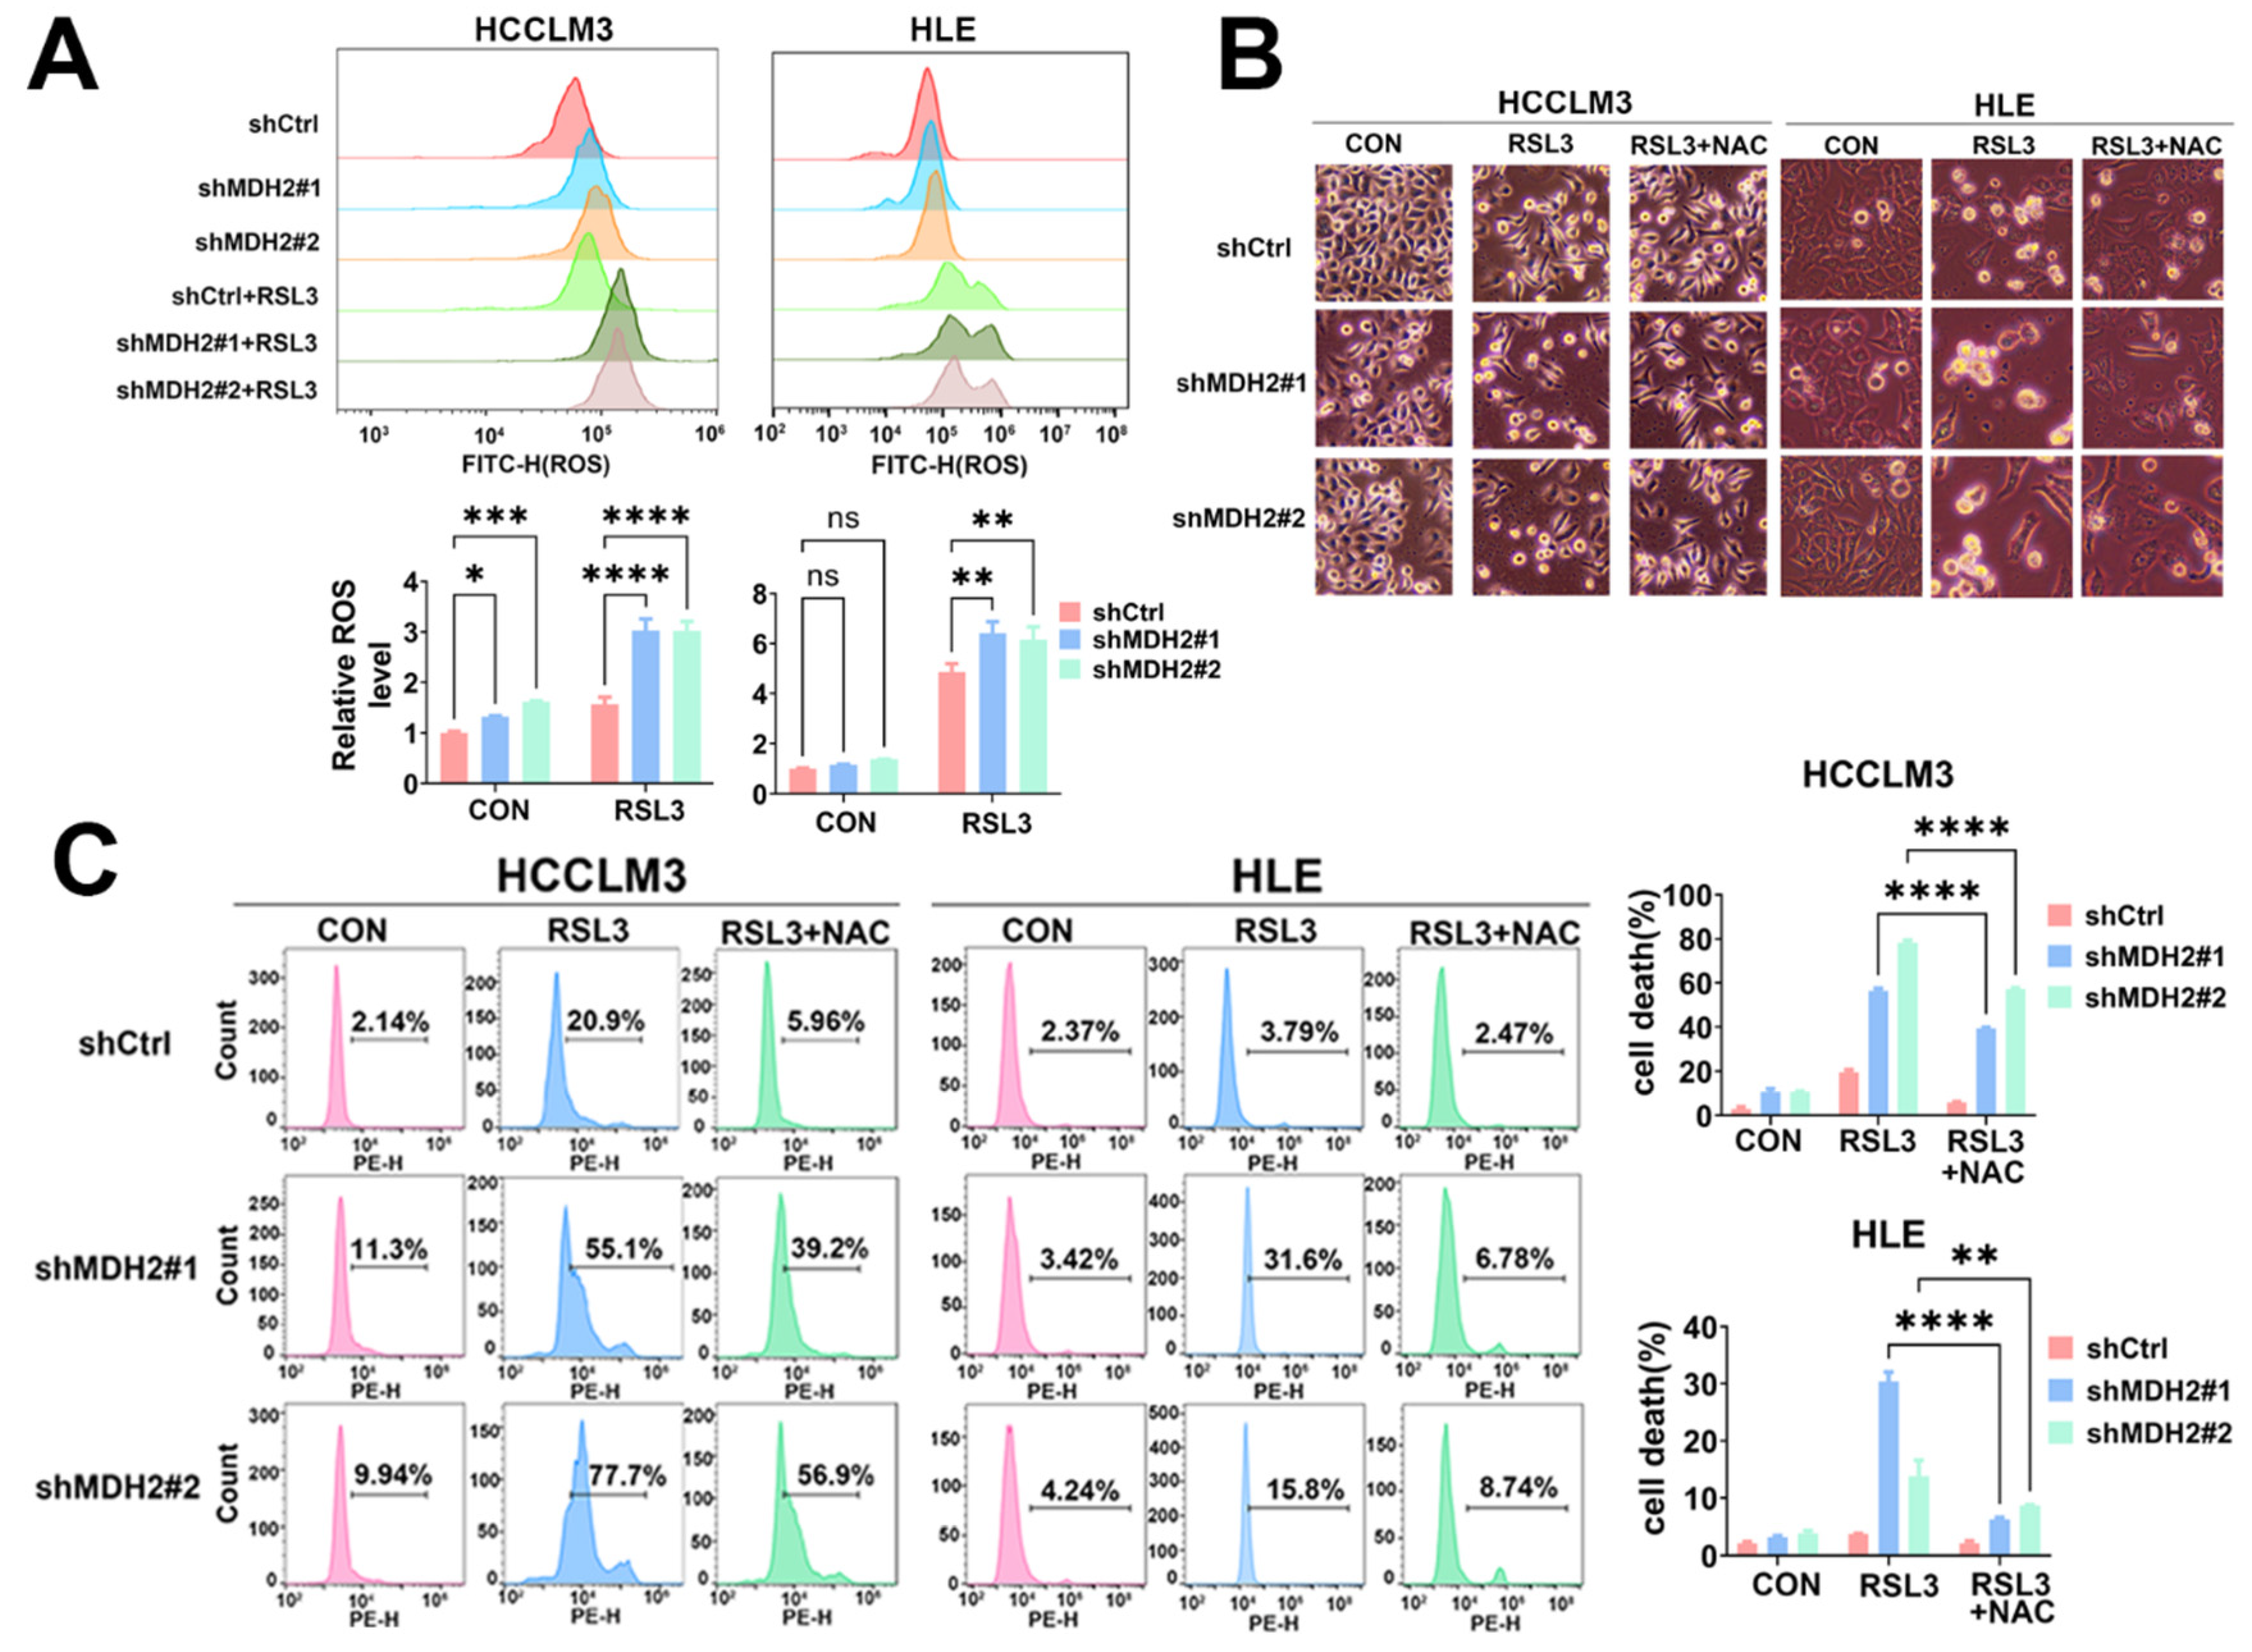
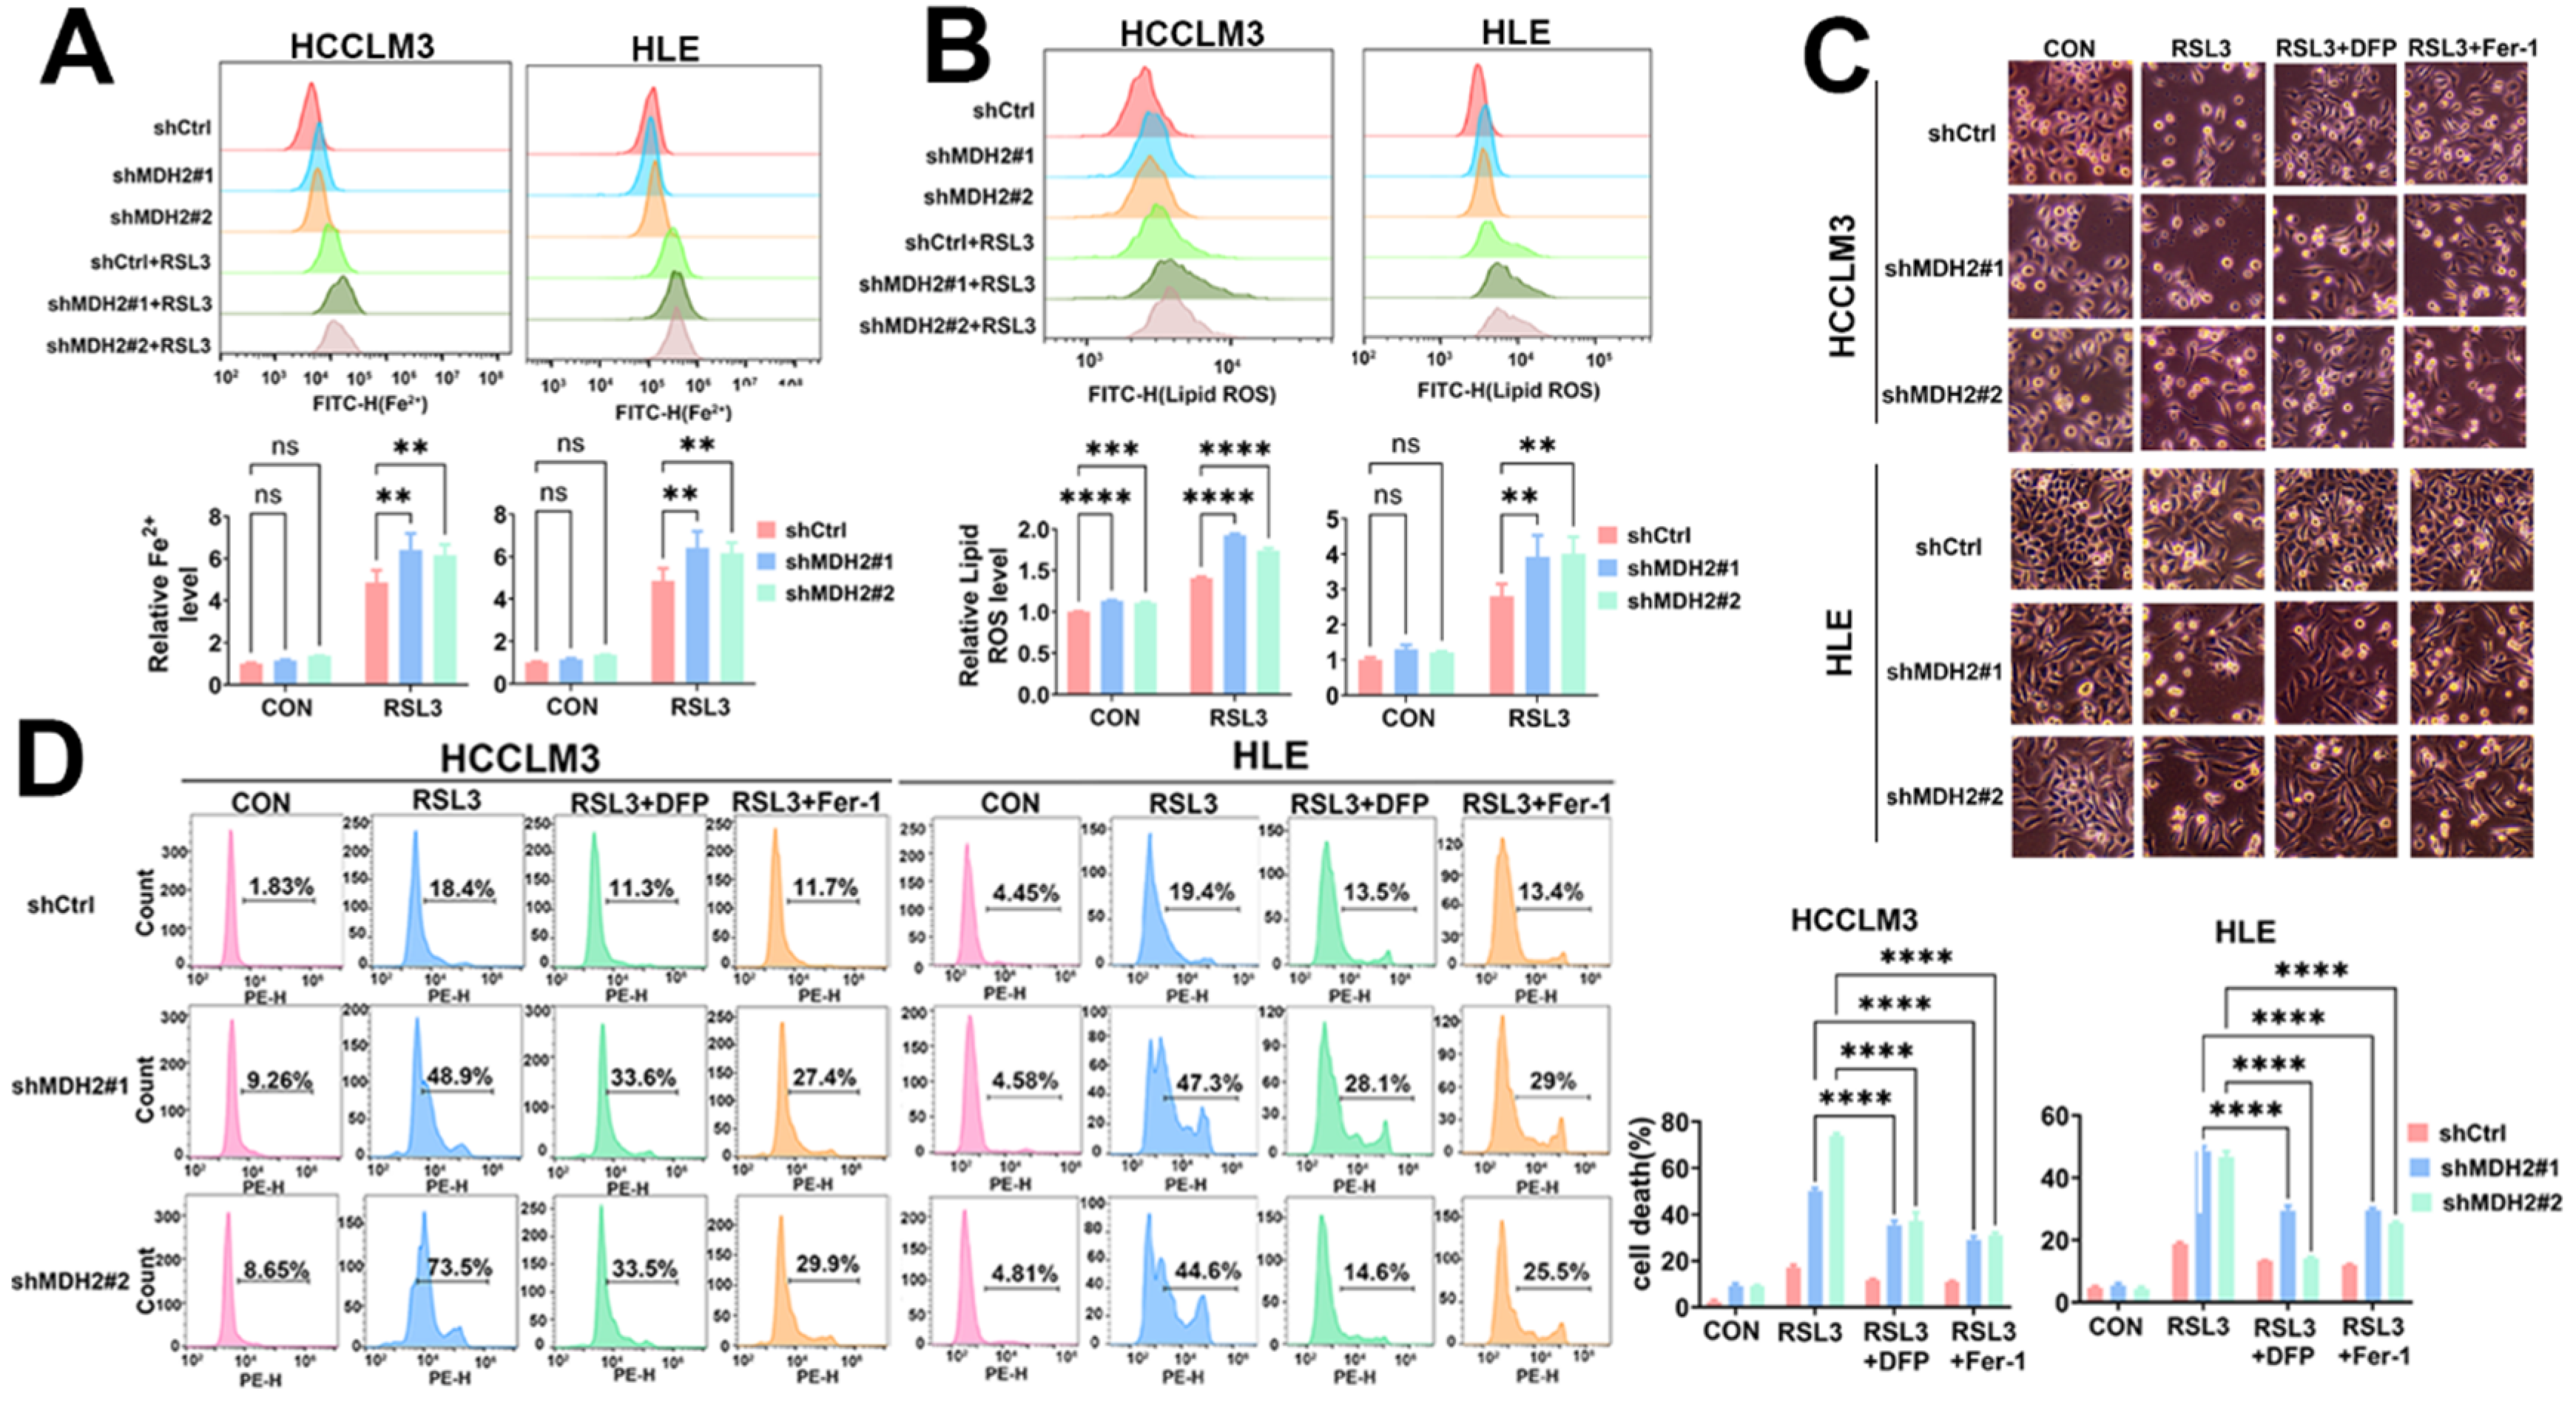
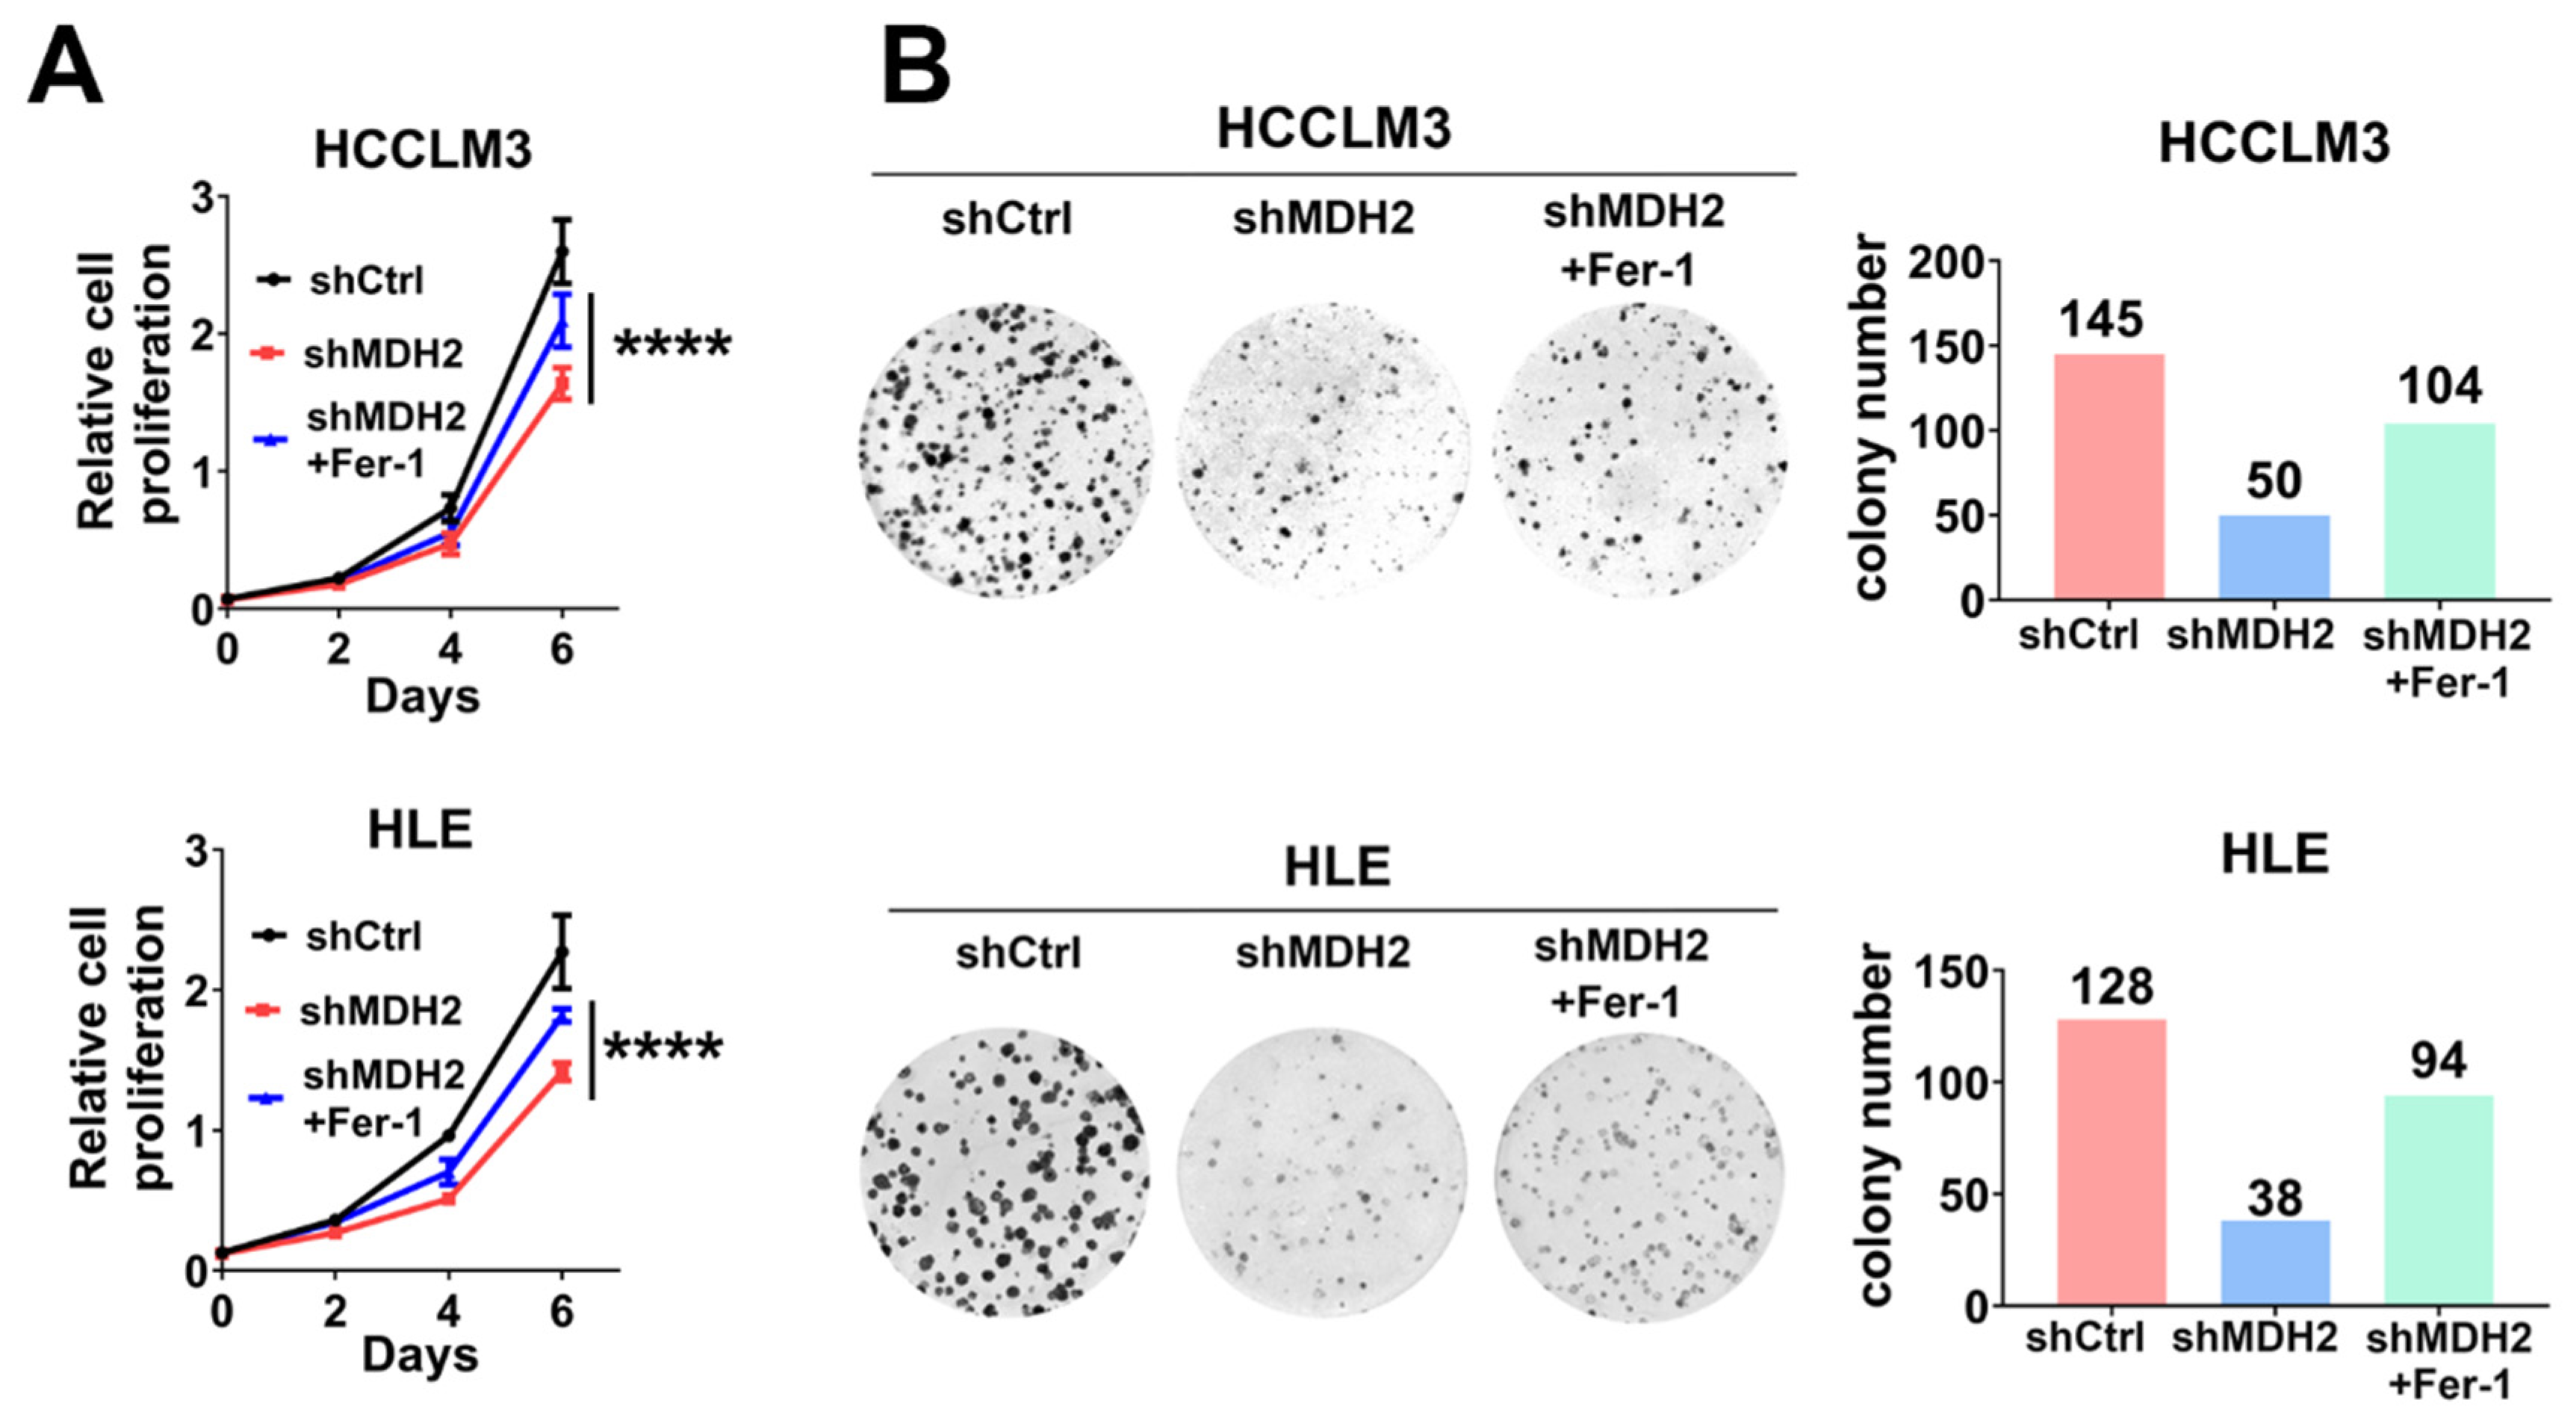
19]. However, its role in tumor ferroptosis is elusive. In this study, through UALCAN website analysis, we found that MDH2 and GPX4 were highly expressed in HCC samples. Knockdown of MDH2 significantly inhibited HCC cell proliferation partially dependent on ferroptosis pathway. Detailed mechanism revealed that knockdown of MDH2 in HCC cells increased RSL3-induced intracellular ROS, Fe
2+ and lipid ROS concentrations, thereby sensitizing HCC cells to RSL3-induced ferroptotic cell death. GPX4 and SLC7A11 are two key proteins that mediate ferroptosis evasion. Knockdown of MDH2 decreased GPX4 protein level by impeding its protein stability, and MDH2 knockdown-mediated sensitization of HCC cells to RSL3-induced ferroptosis was rescued by overexpression of GPX4, suggesting that MDH2 regulates HCC ferroptosis pathway mainly via regulation of GPX4. Moreover, the protein levels of MDH2 and GPX4 were positively correlated in HCC cell lines. Taken together, our study revealed a new role of MDH2 in HCC ferroptosis and progression via regulating GPX4, and MDH2, which was highly expressed in HCC, may upregulate GPX4 to mediate ferroptosis evasion, leading to failure of clinical cancer treatment. Therefore, MDH2 inhibition in combination with ferroptosis inducers may provide a promising strategy for HCC treatment.
Despite our results clearly showed that MDH2 regulated HCC ferroptosis sensitivity via GPX4, there remain unanswered scientific questions and potential directions for further exploration. Ferroptosis is a form of programmed cell death characterized by abnormal increases in iron-dependent lipid peroxidation [
5]. Within the acidic environment of endosomes, six-transmembrane epithelial antigen of prostate 3 (STEAP3) reduces Fe
3+ to Fe
2+. Divalent metal transporter 1 (DMT1) facilitates the transport of Fe
2+ into the cytoplasm, where it partakes in various physiological functions [
30]. Excess iron leads to the generation of ROS through the Fenton reaction [
8]. In this study, we observed that knockdown of MDH2 in HCC cells resulted in the accumulation of intracellular Fe
2+ levels in HCC cells upon RSL3 treatment. Due to the important role of MDH2 in cellular metabolism, MDH2 deficiency may lead to dysregulated of cellular iron metabolism or iron transport, and further studies should clarify this detailed mechanism.
Furthermore, mitochondria play an important role in ferroptosis, so it is crucial to conduct further investigations to elucidate whether knockdown of the mitochondrial enzyme MDH2 influences the occurrence of ferroptosis by perturbing mitochondrial integrity and function. These studies will contribute to a more comprehensive understanding of the role of MDH2 in regulating ferroptosis and its potential impact on mitochondrial dynamics. In addition, although the findings suggested that MDH2 plays a role in ferroptosis resistance by stabilizing GPX4, the precise regulatory mechanism of MDH2 on GPX4 stability requires further study.
Figure 1.
MDH2 promotes HCC cell proliferation. (A) Expression of MDH2 in normal liver tissues and primary LIHC (liver hepatocellular carcinoma) tissues obtained from UALCAN. (B,C) MDH2 protein levels was detected by Western blotting, with Vinculin as a loading control. (D) Cell proliferation assays were performed in control (shCtrl) and MDH2 knockdown (shMDH2#1,shMDH2#2) HCC cells (3000 cells/well) on culture plates at days 0, 2, 4, and 6. Cells were stained with crystal violet followed by dissolving with 10% glacial acetic acid, absorbance at 595 nm was measured and calculated. (E) Indicated cells were seeded in a 6-well plate (500 cells/well), cultured for 10 days and then stained with crystal violet and photographed. Data are represented as the mean±SD (n=3); The results were evaluated with Student’s t-test; ns means not significant; *P < 0.05; **P < 0.01; ***P < 0.001; ****P < 0.0001.
Figure 2.
Knockdown of MDH2 increases RSL3-induced HCC cell death. (A) Control (shCtrl) and MDH2-knockdown (shMDH2#1,shMDH2#2) HCC cells were treated with the indicated RSL3 concentrations for 48 hours, and cell viability was assessed using the CCK-8 assay and IC50 values were calculated. (B) Control (shCtrl) and MDH2-knockdown (shMDH2#1,shMDH2#2) HCC cells treated with or without 5 μM RSL3 for 24 hours were photographed and representative images are shown. (C) Control (shCtrl) and MDH2-knockdown (shMDH2#1,shMDH2#2) HCC cells treated with or without 5 μM RSL3 for 24 hours were collected for PI staining and assayed by flow cytometry (top). Cell death rates were calculated and shown in bar graph (bottom). (D) MDH2 protein levels in control (NC) and MDH2-overexpression (MDH2-OE) HCC cells were assessed by Western blotting, with Vinculin as a loading control. (E) Representative photographs of control (NC) and MDH2-overexpression (MDH2-OE) HCC cells treated with 5 μM RSL3 for 24 hours. (F) Control (NC) and MDH2-overexpression (MDH2-OE) HCC cells treated with or without 5 μM RSL3 for 24 hours were collected for PI staining and assayed by flow cytometry (top). Cell death rates were calculated and shown in bar graph (bottom).
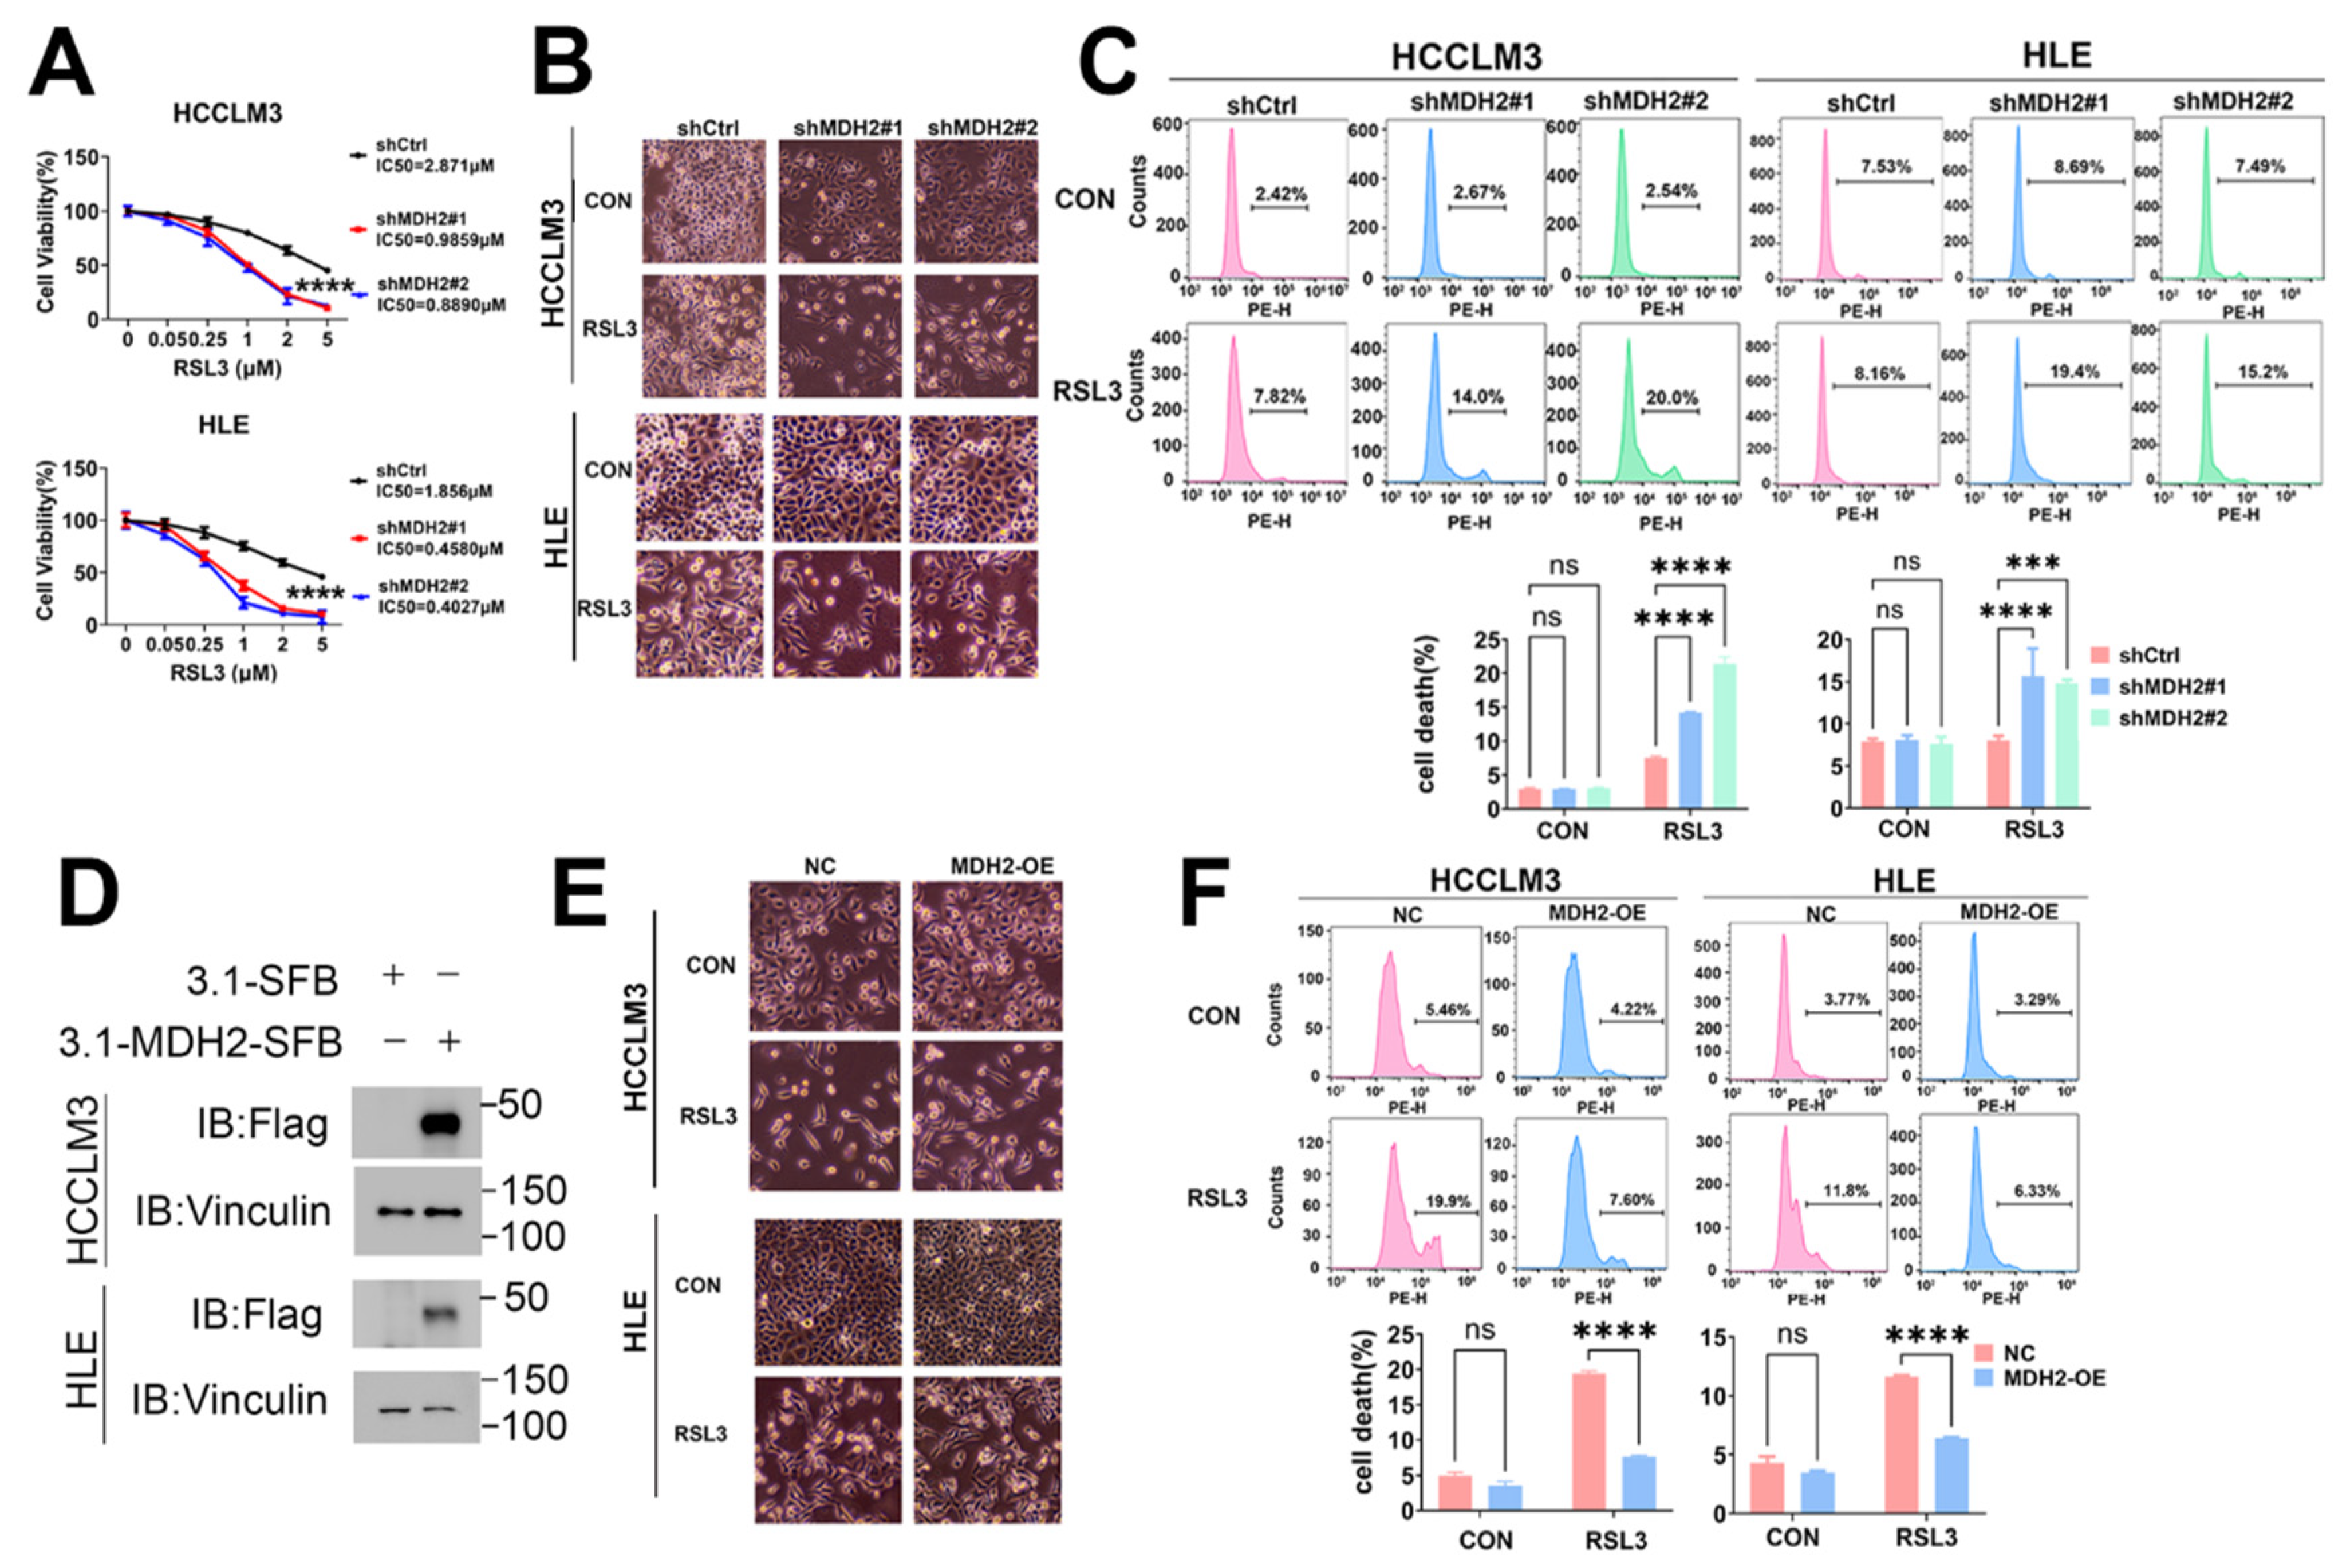
Figure 3.
MDH2 knockdown sensitizes RSL3-induced HCC cell death via upregulated reactive oxygen species. (A) Control (shCtrl) and MDH2-knockdown (shMDH2#1,shMDH2#2) HCC cells treated with or without 5 μM RSL3 for 6 hours were stained with 10 μM DCFH-DA probe for ROS assay using flow cytometry (top). Normalized ROS levels for the indicated cells are shown in the bar graph (bottom). (B) Control (shCtrl) and MDH2-knockdown (shMDH2#1,shMDH2#2) HCC cells treated with or without 5 μM RSL3 or 5 μM N-acetyl-L-cysteine (NAC) for 48 hours were photographed and representative images are shown. (C) Control (shCtrl) and MDH2-knockdown (shMDH2#1,shMDH2#2) HCC cells treated with or without 5 μM RSL3 or 5 μM N-acetyl-L-cysteine (NAC) for 48 hours were collected for PI staining and assayed by flow cytometry (left). Cell death rates were calculated and shown in bar graph (right).
Figure 4.
MDH2 knockdown sensitizes RSL3-induced ferroptosis. (A,B) Control (shCtrl) and MDH2-knockdown (shMDH2#1,shMDH2#2) HCC cells treated with or without 5 μM RSL3 for 6 hours were stained with 10 μM PGSK probe for Fe2+ assay (A) and stained with 10 μM C11-BODIPY581/591 for lipid ROS assay (B) followed by flow cytometry analysis (top). Normalized Fe2+ levels (A) and lipid ROS levels (B) for the indicated cells are shown in the bar graph (bottom). (C) Control (shCtrl) and MDH2-knockdown (shMDH2#1,shMDH2#2) HCC cells treated with or without 5 μM RSL3, 2 μM Ferrostatin-1 (Fer-1) or 50 μM Deferiprone (DFP) for 48 hours were photographed and representative pictures are shown. (D) Control (shCtrl) and MDH2-knockdown (shMDH2#1,shMDH2#2) HCC cells treated with or without 5 μM RSL3, 2 μM Ferrostatin-1 (Fer-1) or 50 μM Deferiprone (DFP) for 48 hours were collected for PI staining and assayed by flow cytometry (left). Cell death rates were calculated and shown in bar graph (right).
Figure 5.
Knockdown of MDH2 inhibits HCC cell growth partially dependent on ferroptosis induction. (A) Cell proliferation assays were performed on control (shCtrl) and MDH2 knockdown (shMDH2#1,shMDH2#2) HCC cells (3000 cells/well) with or without 0.5 μM Ferrostatin-1 (Fer-1) on culture plates at days 0, 2, 4, and 6. Cells were stained with crystal violet followed by dissolving with 10% glacial acetic acid, absorbance at 595 nm was measured and calculated. (B) Control (shCtrl) and MDH2 knockdown (shMDH2#1,shMDH2#2) HCC cells were seeded in a 6-well plate (500 cells/well) and cultured with or without 0.5 μM Ferrostatin-1 (Fer-1) treatment for 10 days and then stained with crystal violet and photographed (left), the colony number was calculated and shown (right).
Figure 6.
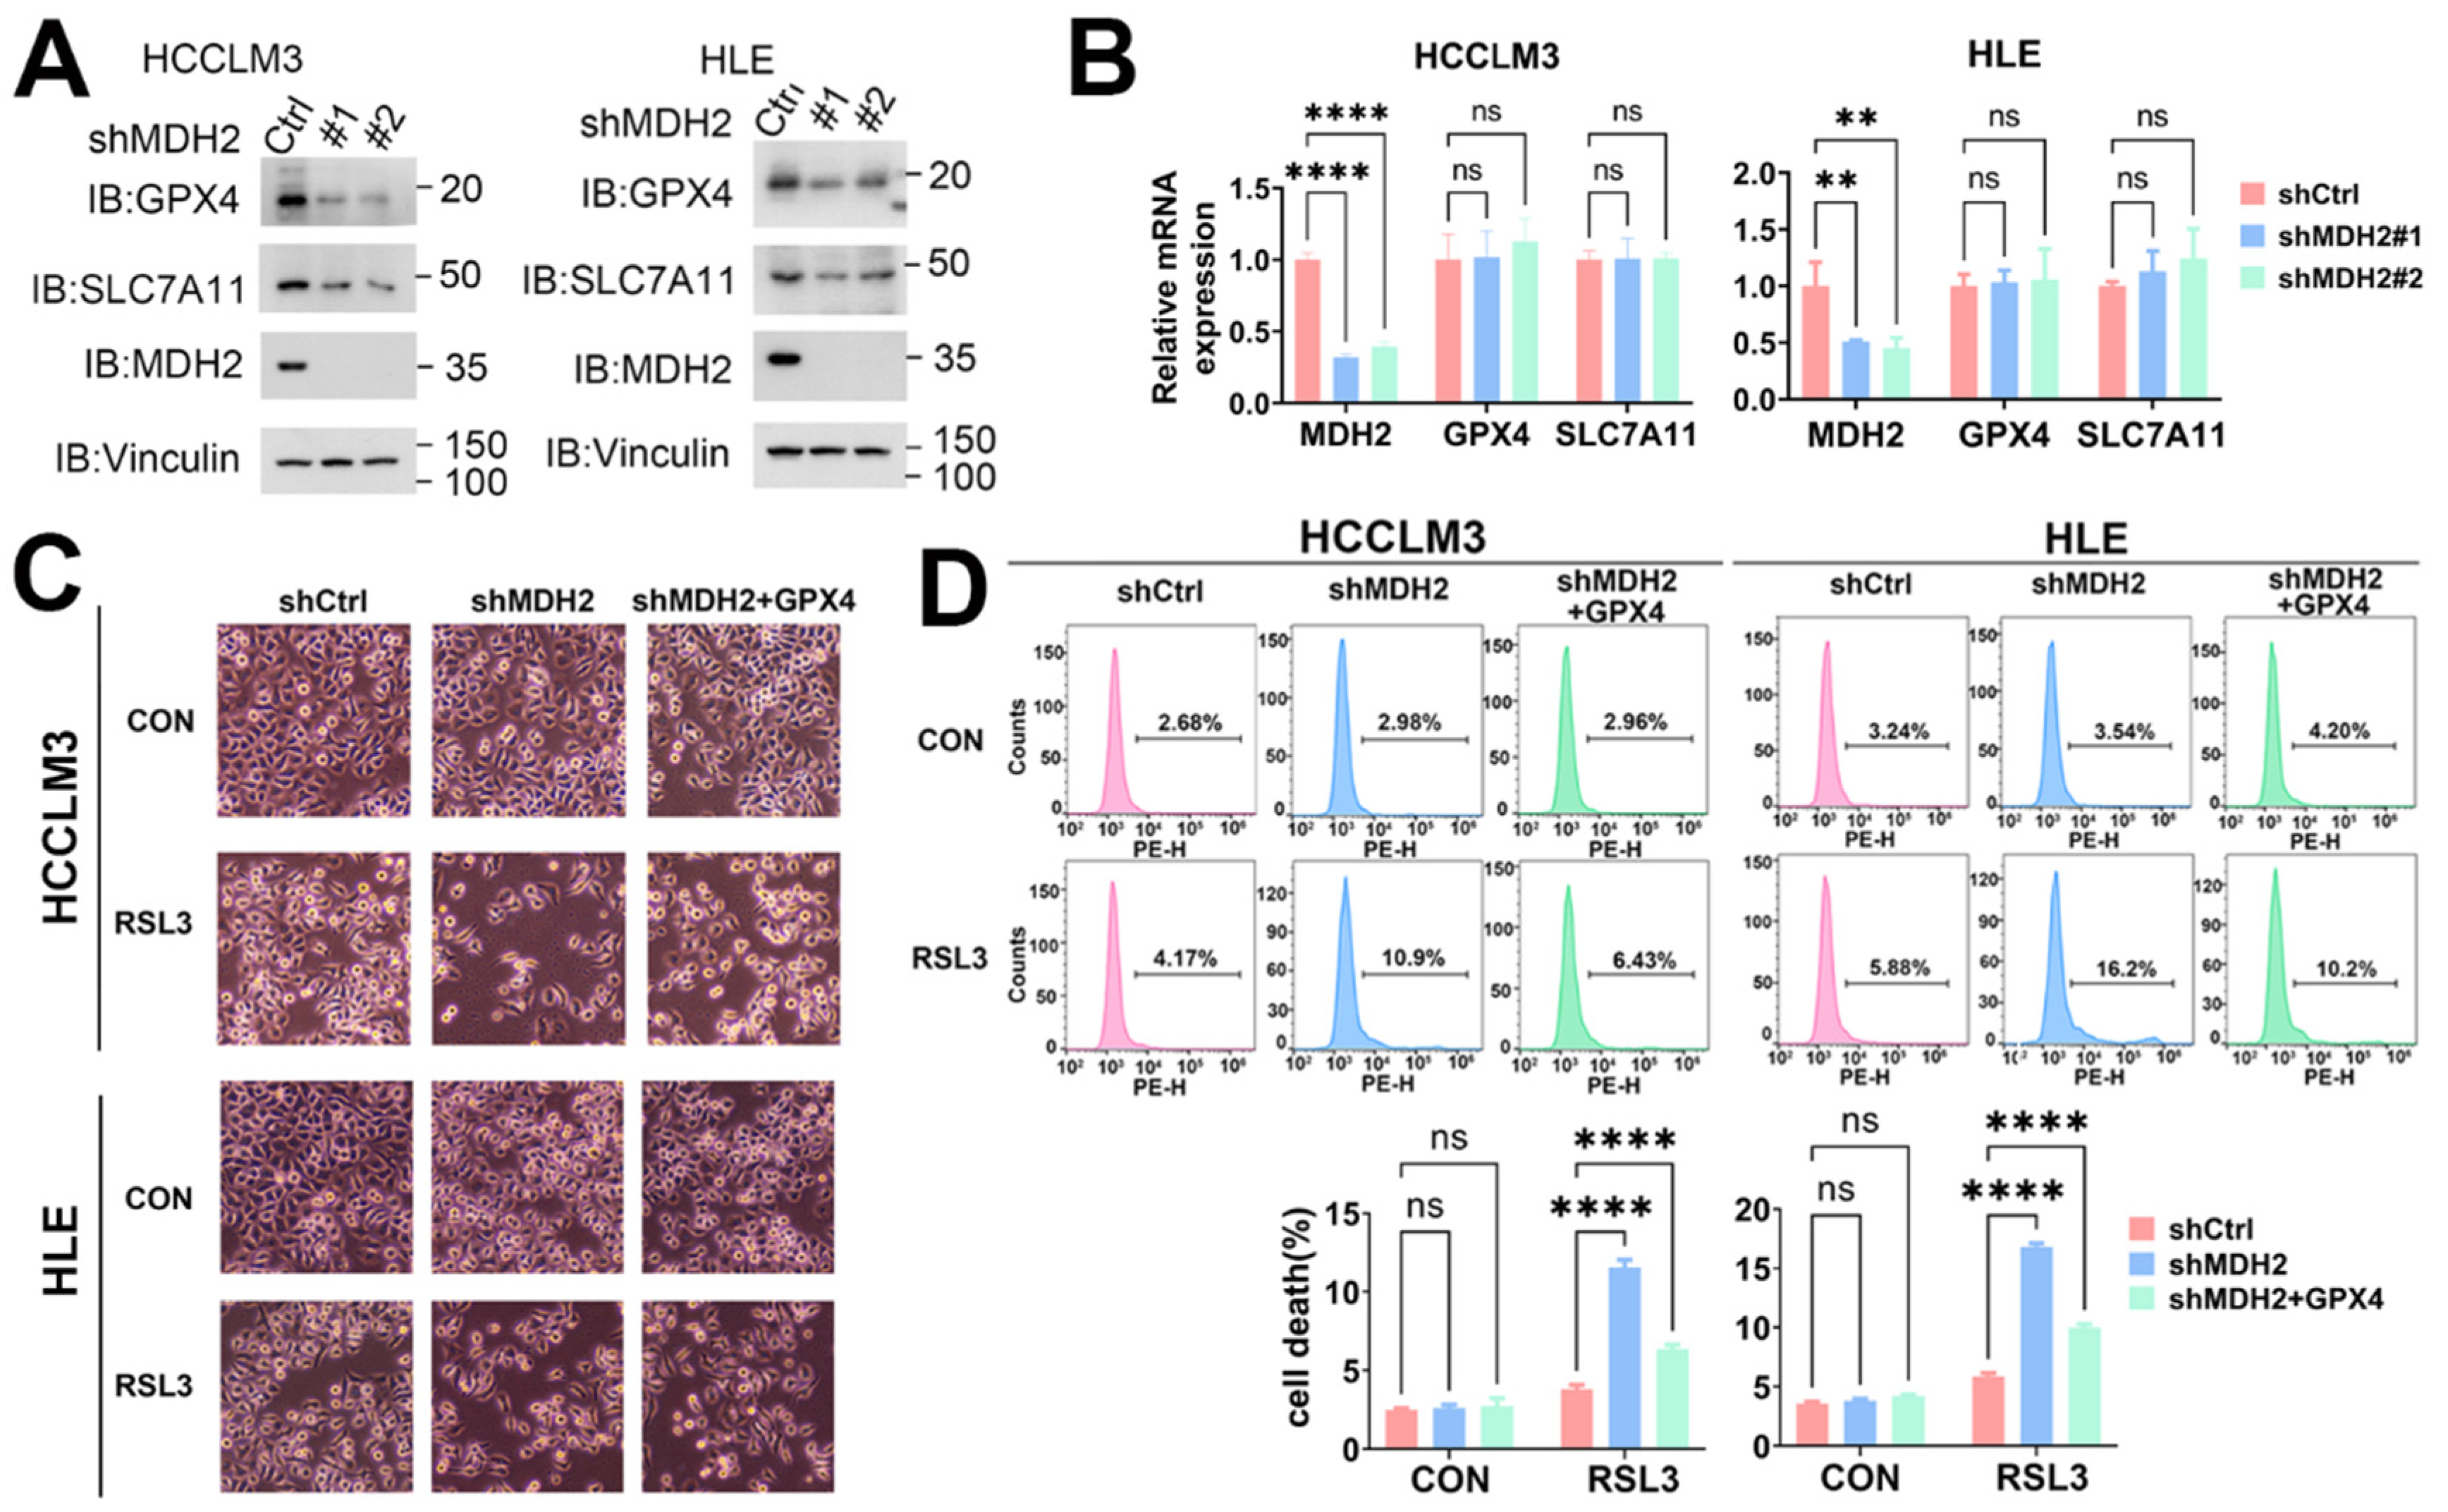
MDH2 induces ferroptosis via GPX4. (A) GPX4, SLC7A11, MDH2 and Vinculin protein levels in control (Ctrl) and MDH2-knockdown (shMDH2#1,shMDH2#2) HCC cells were assessed by Western blotting. (B) MDH2,GPX4 and SLC7A11 mRNA levels in control (shCtrl) and MDH2-knockdown (shMDH2#1,shMDH2#2) HCC cells were determined by RT-qPCR. (C) Control (shCtrl) and MDH2 knockdown (shMDH2) HCC cells with or without GPX4 overexpression were treated with or without 5 μM RSL3 for 24 hours and photographed, the representative images are shown. (D) Control (shCtrl) and MDH2 knockdown (shMDH2) HCC cells with or without GPX4 overexpression treated with or without 5 μM RSL3 for 24 hours were collected for PI staining and assayed by flow cytometry (top). Cell death rates were calculated and shown in bar graph (bottom).
Figure 7.
MDH2 stabilizes GPX4. (A) Control (shCtrl) and MDH2 knockdown (shMDH2#1,shMDH2#2) HCC cells treated with 100 μg/ml CHX for the indicated times were harvested and subjected to Western blotting analysis with indicated antibodies. The quantification of normalized protein levels of GPX4/Vinculin ratio are shown. (B) HEK-293T cells transiently transfected with indicated plasmids for 36 hours were lysed and immunoprecipitated with anti-Flag antibodies, and the samples were subjected to Western blotting analysis with indicated antibodies. (C) GPX4 and MDH2 protein levels were evaluated by Western blotting in human normal hepatocytes (L02) and HCC cell lines (Huh7, Hep3B, SNU398, PLC/PRF5, HLE, HCCLM3 and HepG2) cells, with Vinculin as a loading control (left). Pearson correlation analysis of GPX4/Vinculin and MDH2/Vinculin protein expression in HCC cell lines is shown (right). (D) Expression of GPX4 in normal liver tissues and primary LIHC (liver hepatocellular carcinoma) tissues obtained from UALCAN.
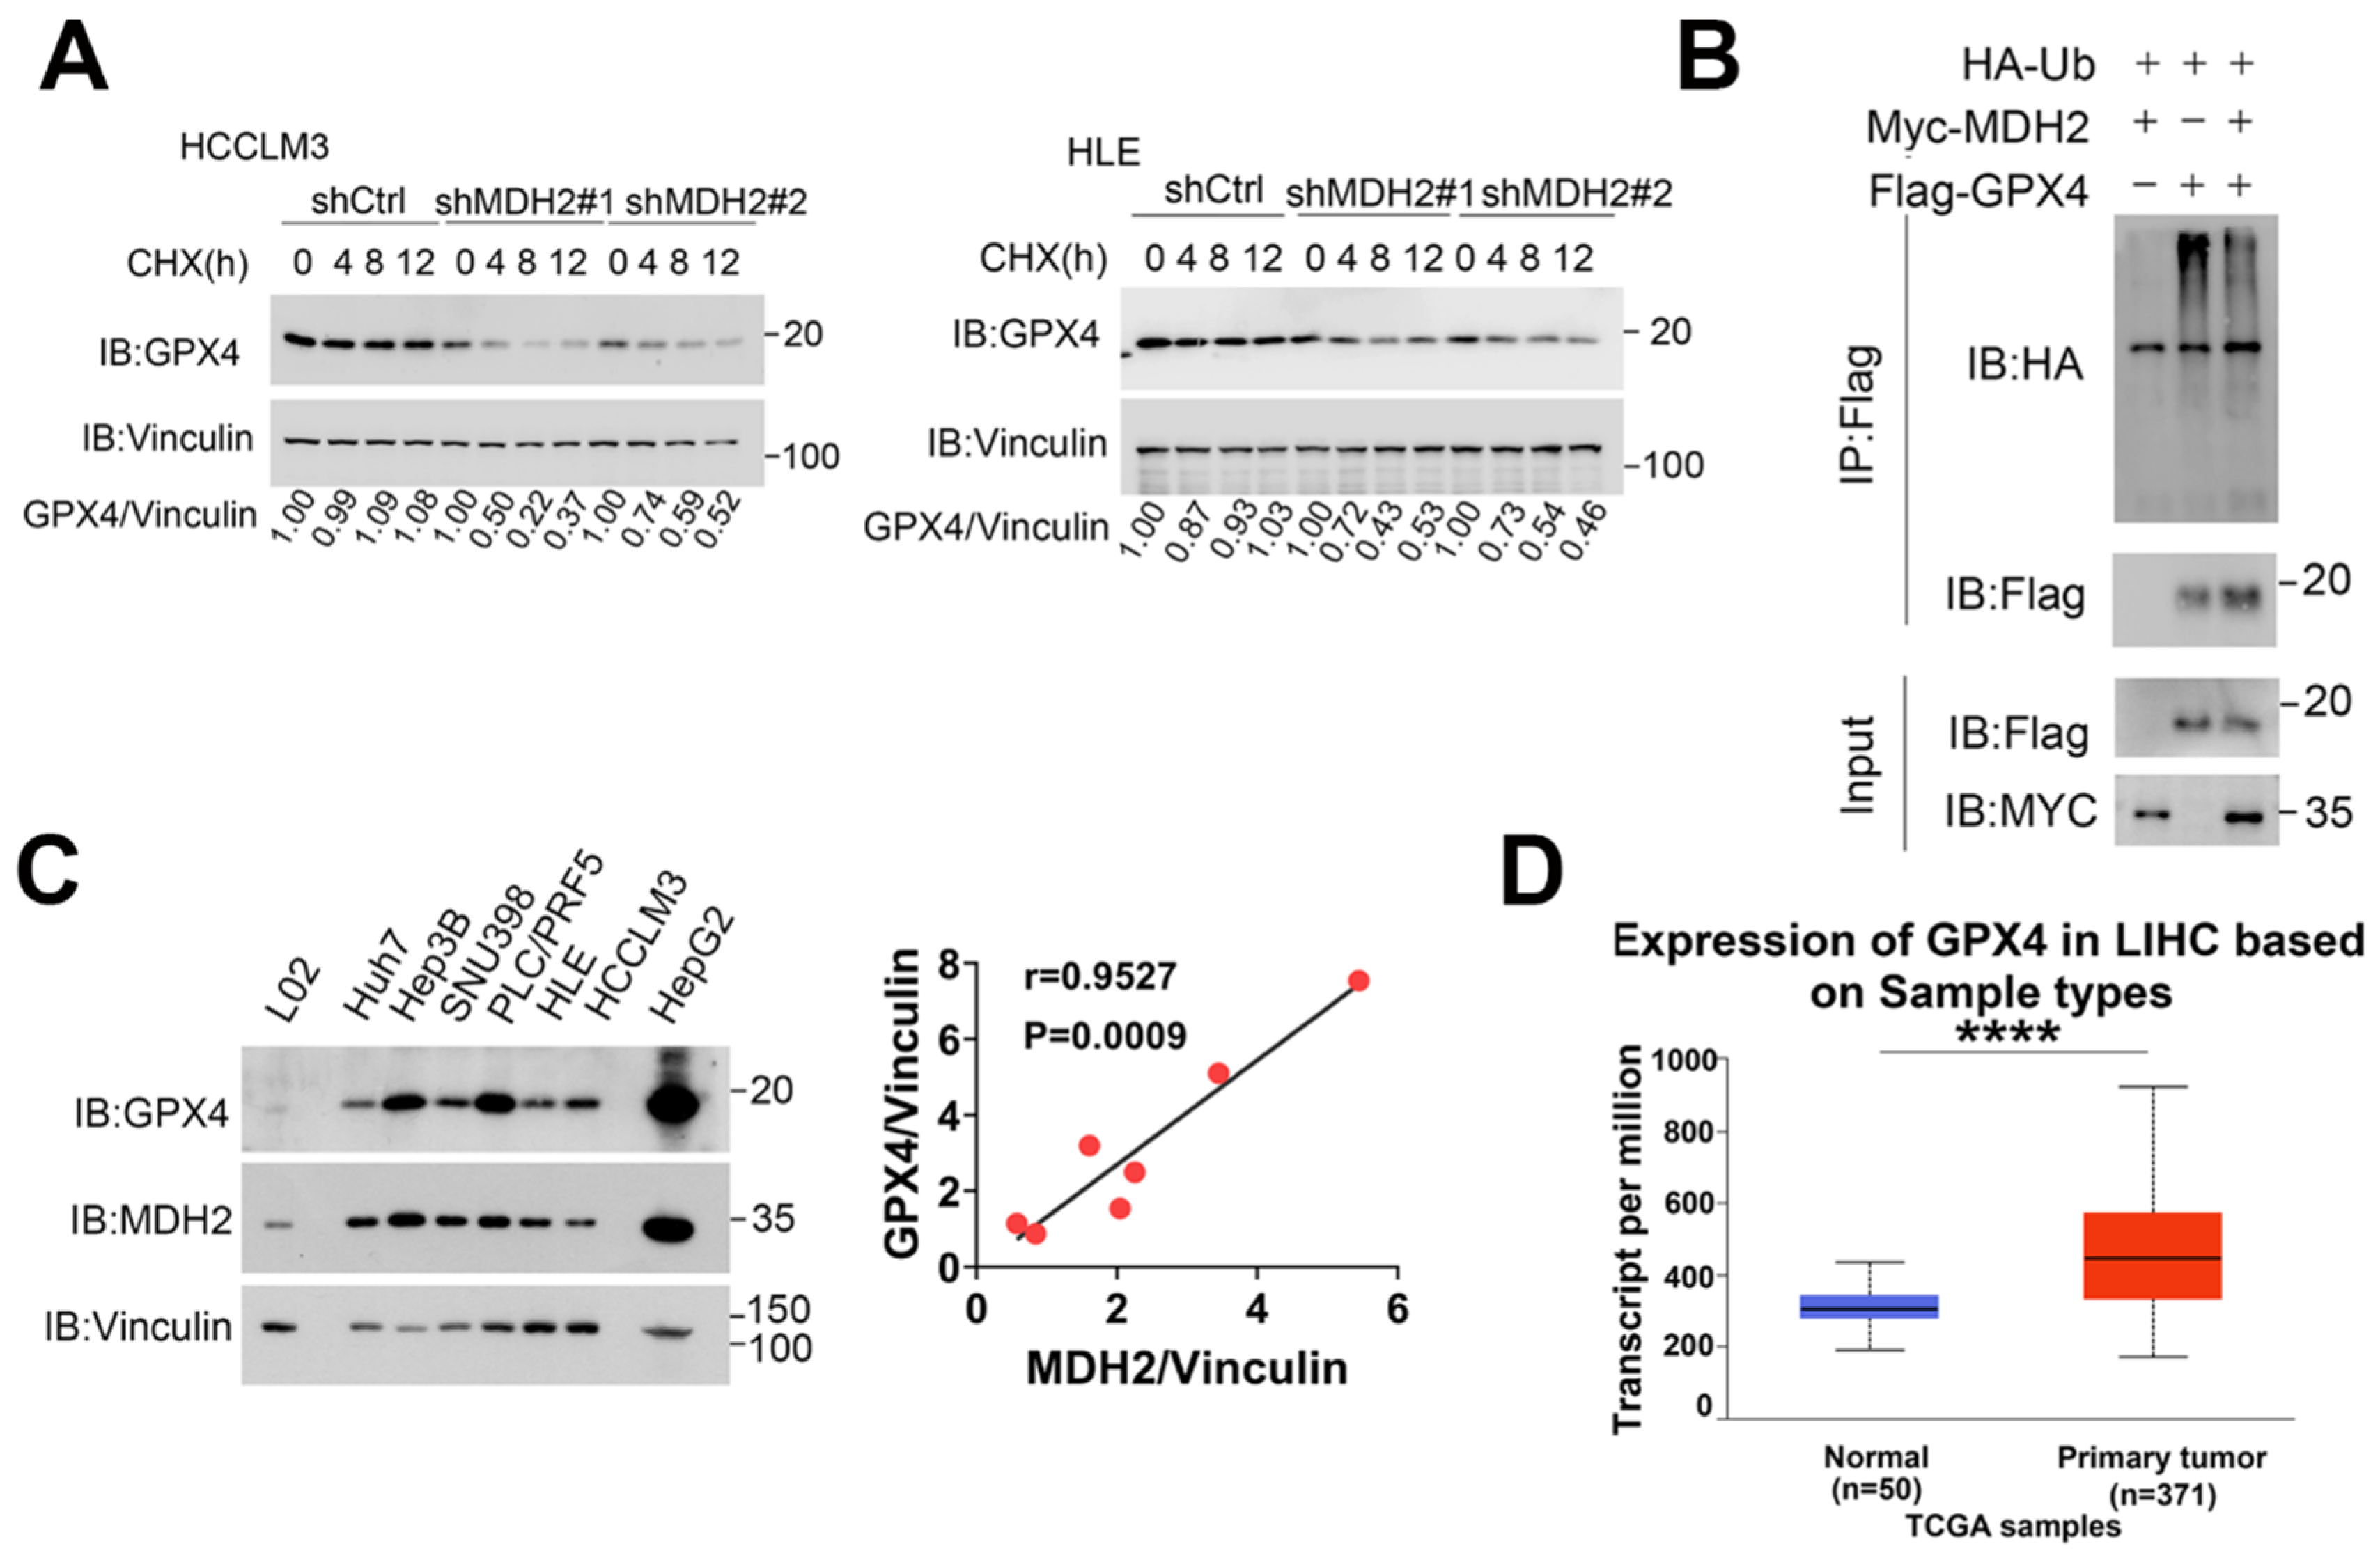
Figure 8.
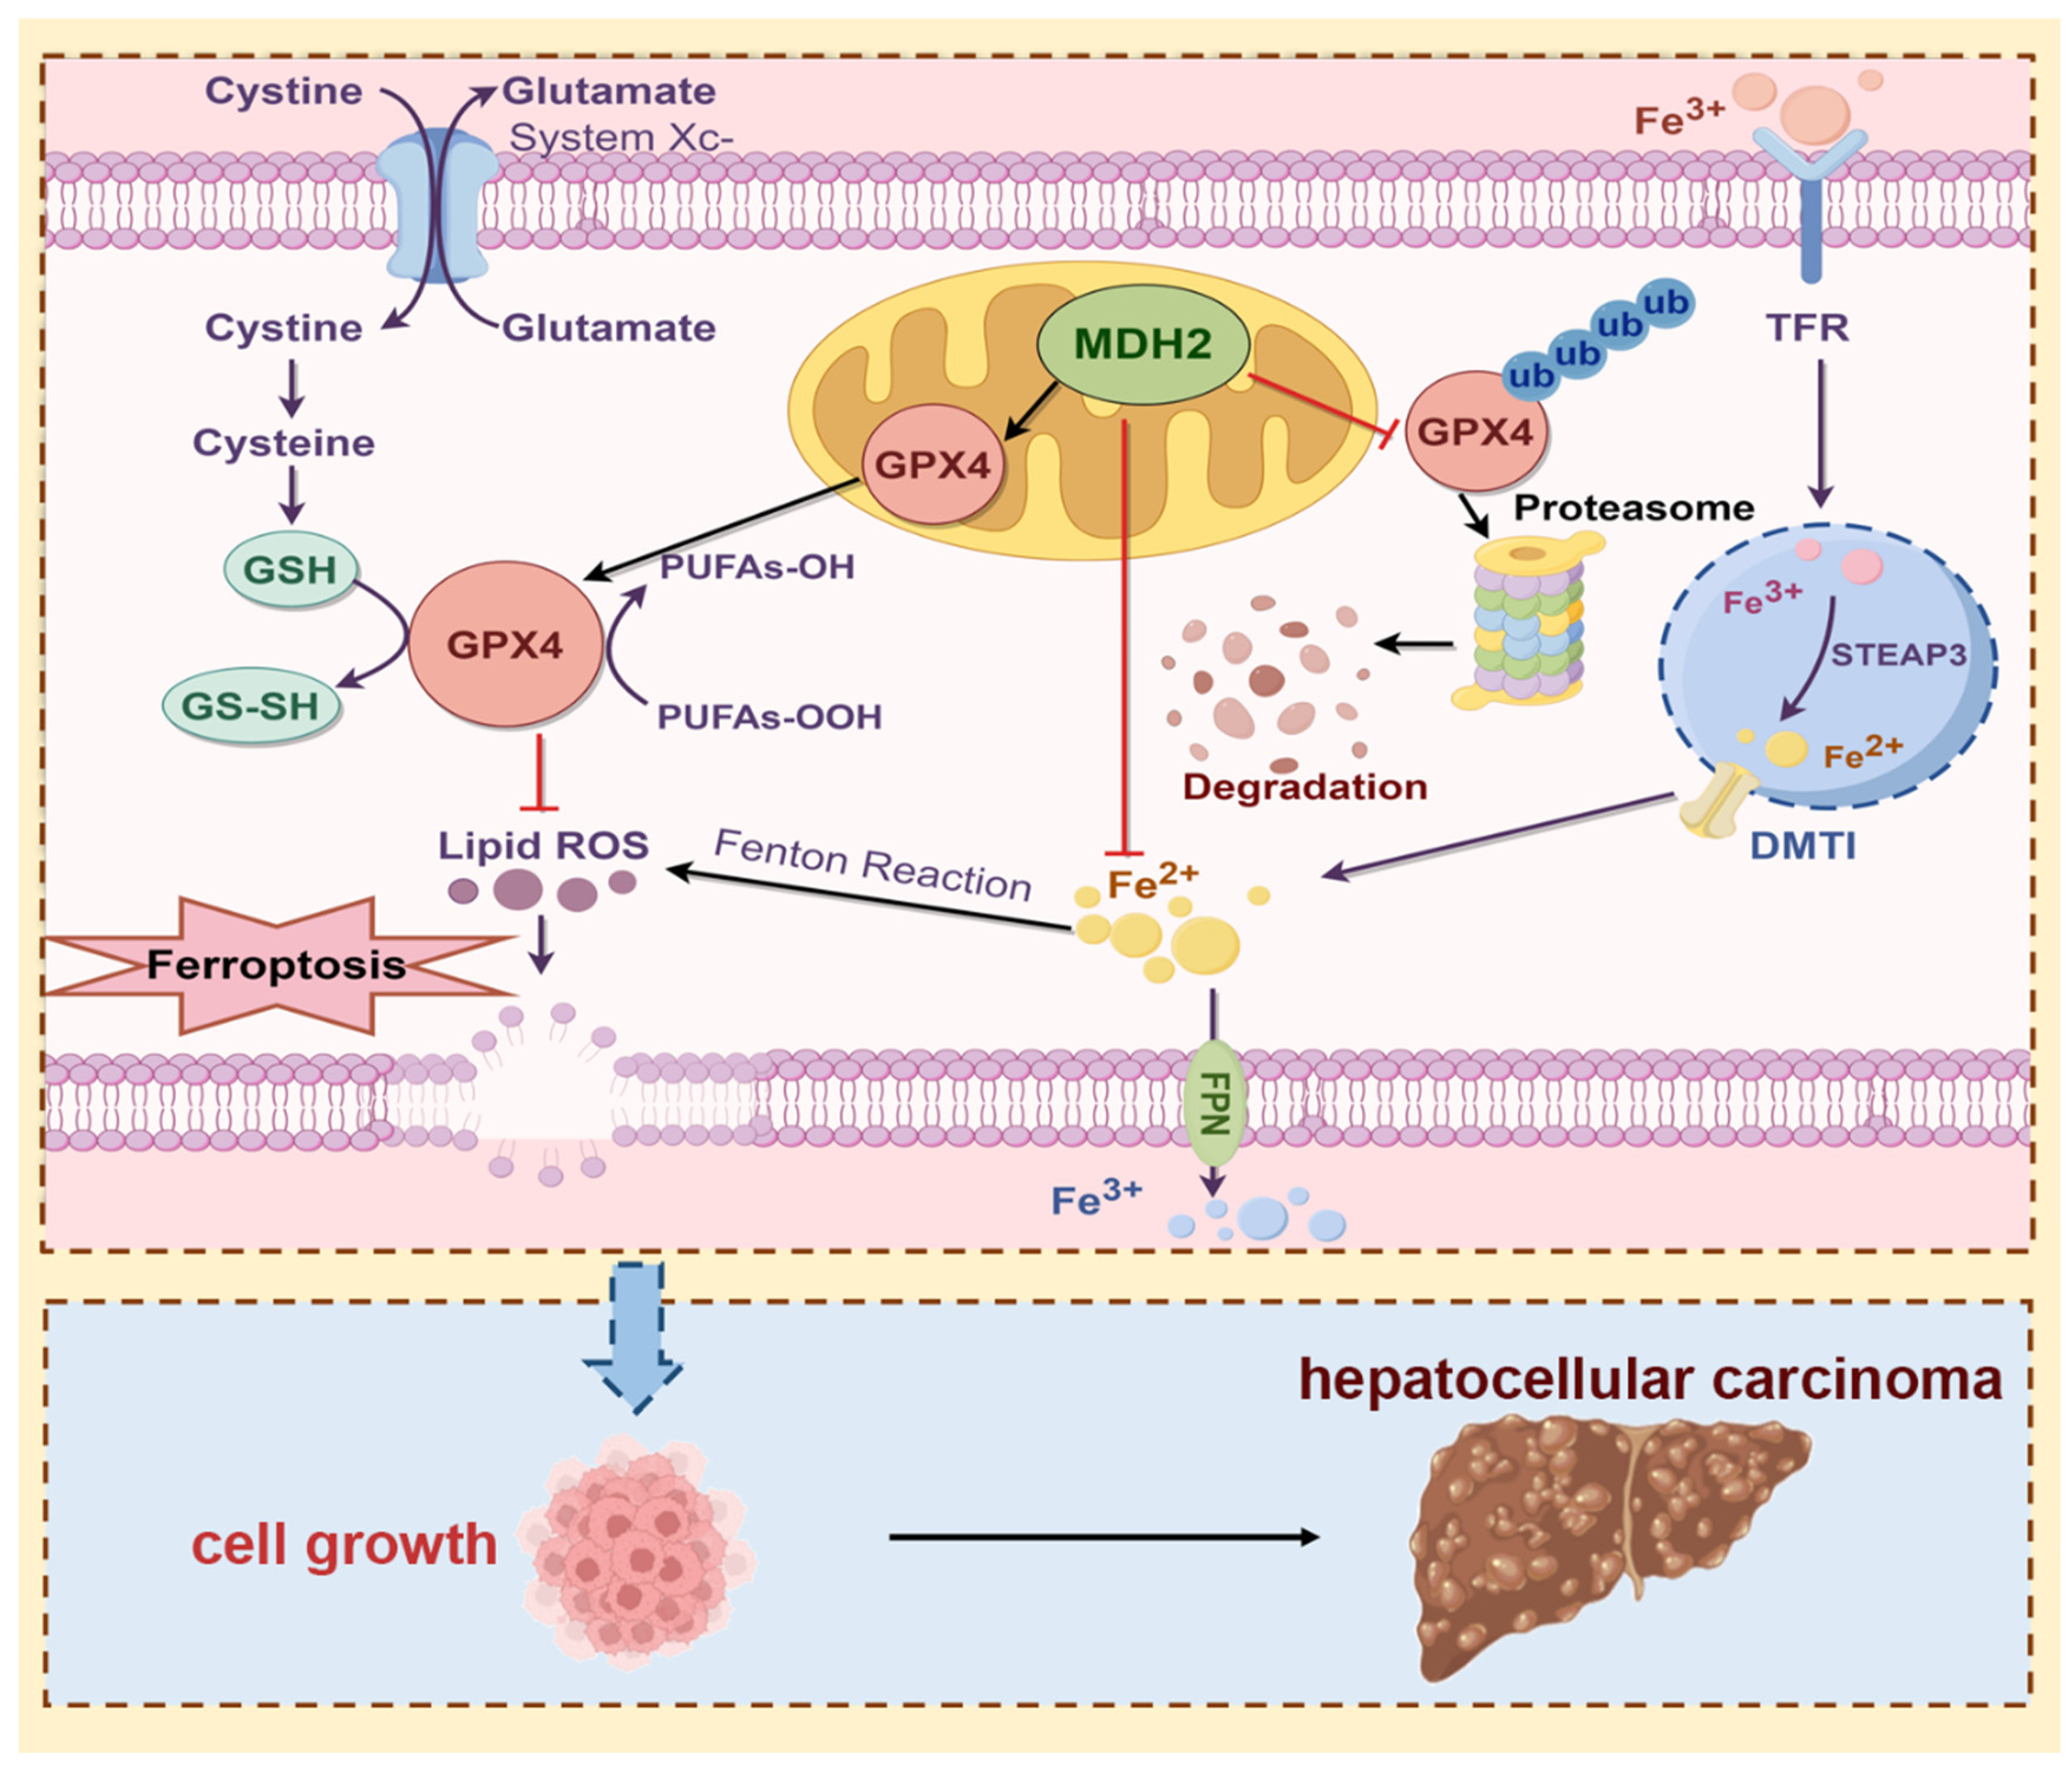
Schematic overview of the proposed mechanism whereby MDH2 promotes HCC progression via mediating ferroptosis evasion (By Figdraw). Highly expressed MDH2 in HCC can reduce GPX4 ubiquitination and degradation to eliminate lipid ROS, leading to resistance to ferroptosis. On the other hand, MDH2 also plays a vital role in intracellular iron homeostasis to eradicate lipid ROS production via Fenton reaction inhibition. Overall, the function of ferroptosis evasion mediated MDH2 promotes HCC progression.
