1. Introduction
It is true that the progress of technological research has had a disjunctive disruptive slope in recent years, with it was able to manufacture various magnetic sensors that are currently used in many applications, but in most of these, its range is limited to 25 mm. [
1]is also found in [
2]. From one point of view and others, a prototype is presented that emits a strong electromagnetic field at a sufficient distance (> 300 mm) that passes through the entire internal density of walls, columns, and slabs of residences. Built with adobe, brick, concrete, and stone, this reading allows us to know the physical state of the building in real time, and the cost of the inputs for assembly is cheap.
Internal cracks and fissures under the surface of building facades are difficult to detect by surface observation, which jeopardizes early intervention and increases the vulnerability of the structure. This phenomenon is especially common in older buildings [
3]. The occurrence of internal damage can be attributed to various factors, such as deterioration of materials over time, structural stress, moisture, poor quality of building material, improvised workmanship of builders, reactions of salts contained in the soil with the surfaces, thermal shrinkage of concrete structures and overloading of the concrete surfaces [
4]. These factors contribute to reducing the service life of the building.
The concept of service life is an essential component of modern structural engineering. It is determined by factors such as design, construction, aging, and maintenance during the life of the structure. [
5]. Guidelines for determining the service life of structures are described in standards such as the standard [
6], the Euro code eight of ACI 530 1-13 [
7].
Crack detection is undoubtedly the most relevant parameter in structural engineering damage assessment. In recent years, there has been an expansion of various methods, among which non-destructive testing (NDT) methods are gaining prominence. These methods allow the evaluation of the structure while it is still operative and is defined as a process that inspects the quality and properties of materials and products without altering the functioning of the assembly [
8]. In the literature [
5]the main non-destructive testing methods are classified into categories such as Acoustic Methods, Radar Methods, Penetrating Radiation, Physical Methods, Thermal Methods and Other Methods (X-ray tomography, etc.). However, the detection of internal defects in walls can be affected by different types of non-invasive methods, which highlights the need for an analysis of the uncertainty of the source [
3].
This design does not affect the aesthetics of the housing, i.e., free to destroy. The assembly process of the equipment is developed using materials, software / 3D program, and tests are performed on piles and 99% in the laboratory, allowing to properly assemble the prototype electromagnetic field (B) solves a latent problem that is the need of the family. Therefore, the aim is to design and implement a prototype to measure structural defects in general construction.
For reinforced concrete, as the temperature increases, the density decreases linearly, but as the temperature increases, the viscosity decreases, as an example for concrete, the density is greater than 1000 kg/m3. However, there are several ways to determine the density of a solid, see. [
9,
10].
1.1. Electromagnetic Field Generation
In his summary [
11] they mention that “the electromagnetic environment factor (EEF) in the far-field region depends on detector position, emission frequency, and molecular orientation”. On the other hand, [
12] achieved “field strengthening affecting surface plasmons at the metal-vacuum boundary, where the amplitude squared of the magnetic field increases approximately 30 times compared to the incident field”. The potential intensity (B) undergoes changes depending on the compactness of the material, i.e., its density (ρ). Reinforced with the theory of [
13]because “it’s originality came from twenty algebraic formulae contributed by Coulomb, Gauss, Ampere, and Faraday, who taught the concepts of the electromagnetic field. The matrix expression is the result of four precise forms which completely describe the electromagnetic phenomena”. For his part, [
14] mentions that the Maxwellian equations allow one to predict the time evolution of (B), expressed in its integral form.
where
E = electric field,
B = magnetic,
q = electric charge,
I = induced current intensity,
= electric and magnetic permeability in vacuum respectively.
Figure 1.
Coil and magnetic field (B).
Figure 1.
Coil and magnetic field (B).
Undoubtedly, the magnetic field produced is generated in the center of the air core.
where:
I = Current flowing through the coil (A).
μ = Permeability of the medium at the center of the coil, expressed in Tm/A.
B = Magnetic induction at the center of the coil, measured in Tesla’s (T).
r = radius of the loop, measured in meters (m).
N = Number of turns or number of turns on a circumference.
However, [
15] put forward an equation for calculating the magnetic field of a coil:
Being: the dimensions of the solenoid, consisting of the radius and the length reached from the number of turns of the wire.
The electromagnetic parameter arises from the design, simulation, and implementation of a coil external to the empty core, so that the magnetic field (B) is sufficiently strong to penetrate the hardness of the object, in this case, the wall. Column, construction slab of different materials, usually measured as a distance in (cm). The inductance (L) is an indispensable element for the prototype. The unit of the wire cross-section (H = henries), for winding, the magnetic permeability (µ) of the material is considered, i.e., (µ) is the ability to absorb attractive forces in time and space, detailed in the following formulas:
where
µo = vacuum permeability.
µr = relative permeability of the material (for this investigation it is air, i.e., µr=1).
For the mathematical calculation of the inductance of this prototype, the following equation is considered:
where:
L = inductance (H).
N = number of turns of AWG 25-gauge enameled wire.
D = diameter of circumference (mm).
d = wire diameter (mm).
π = 3,141592.
Also, the oscillation frequency of each stage in
Figure 2 is given by:
1.2. Structural Deterioration
Background information reports that equipment for measuring concrete toughness exists, such as devices. [
16] observes the “relationship between compressive strength in concrete cylinders and rebound with digital sclerometer.” their methodology is to compare the strength of concrete using the statistical regression method and are destructive. They also predict “concrete strength based on ultrasonic pulse velocity and a quality index of construction materials”. For their part, [
17] in their study “determine the relationship between pathological analysis and the service life of confined masonry dwellings”. Likewise, [
18] concludes that “the use of natural materials in construction is related to a more sustainable lifestyle; this is the main motivation of users and professionals who choose to work in this area.”
Table 1.
Methods used to assess infrastructure.
Table 1.
Methods used to assess infrastructure.
| Masonry structure |
Methods |
Advantages |
| With concrete |
Ultrasonic pulse rate |
Adequate |
| With stone |
Radar |
Ideal |
| Brick and mortar |
Radar or radication |
Adequate |
| With chloride |
Chloride test |
Quick |
| Brick and mortar |
Polarisation resistance |
Recommended |
| With carbonation |
Phenolphthalein indicator |
Economical and simple |
| With concrete |
UPV physical property identifier |
Reliable |
| Faulty |
Infrared thermography |
Excellent |
| With brick |
Destructive |
It is not recommended to |
| Industrial metal plate segment |
DIC 3D systems |
Accuracy |
On structural failures I describe several scientific studies, [
21] They mention that “a real crack is in the form of a spatial curve or surface, but in the crack expression strategy, polylines or planes are usually used taking into account the computational cost”. The crack theory for [
22] means that to identify cracks by (tensile, compression, bending, and horizontal stress “T” induced in the mass and angular momentum “u”) in concrete, an innovative means is needed to improve the construction process and advances in automation, monitoring and control of buildings, achieving a higher quality construction for residents, will have by value:
where:
Rt represents the horizontal tensile strength,
rm represents the specific weight submerged in water, “
h” represents the depth of the crack, and K
0 is the coefficient of pressure at rest of the material.
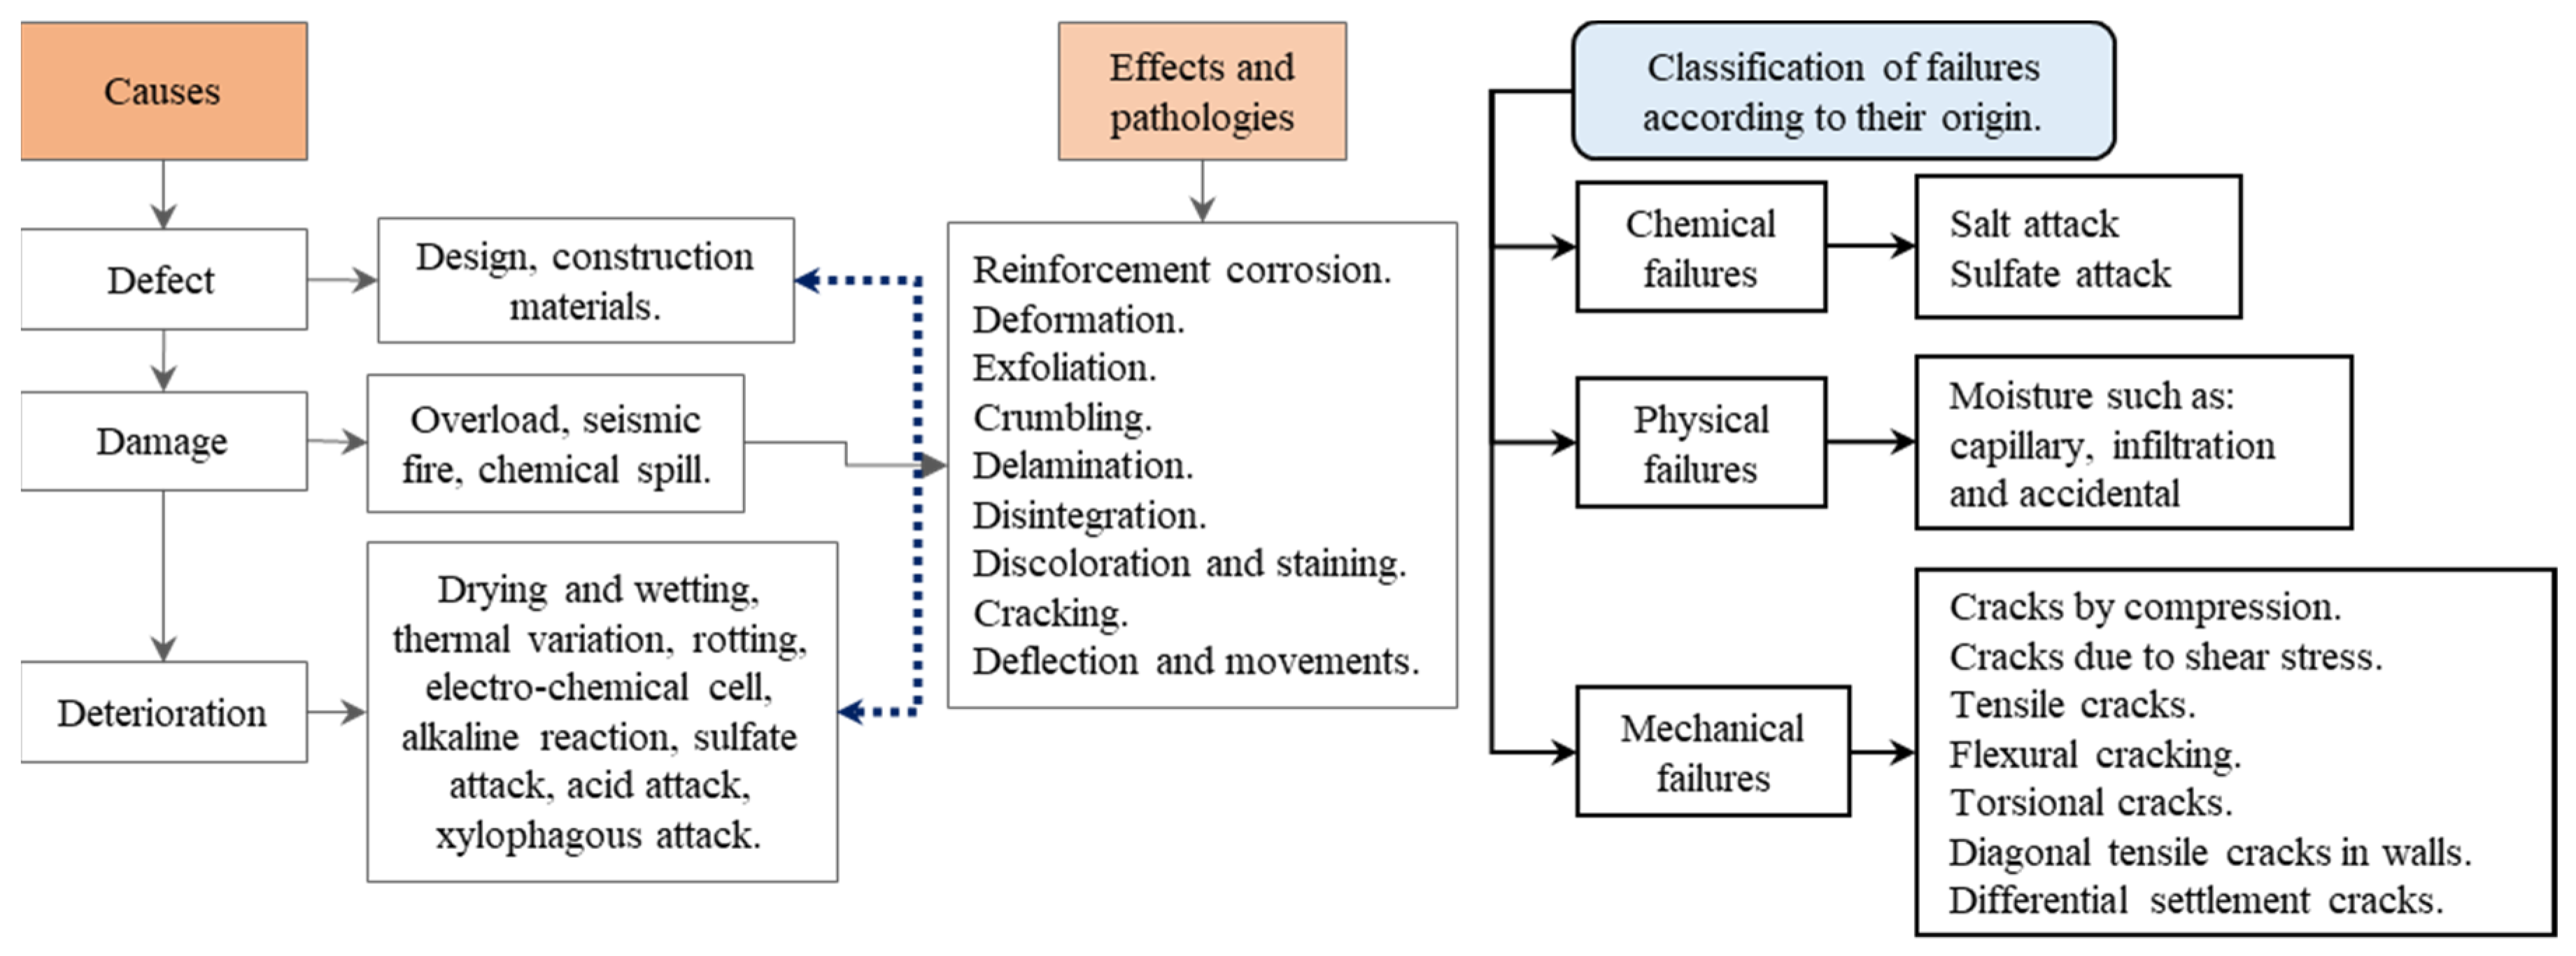
Figure 2.
Pathology of causes and effects of structural failure. Note. Adapted from [
23,
24,
25].
Figure 2.
Pathology of causes and effects of structural failure. Note. Adapted from [
23,
24,
25].
Discontinuity in the mass of structures is considered as a crack or fissure seen in walls, columns, beams, slabs, and others. This is a warning of an event that compromises the durability and serviceability of the structure (dwellings). Also, [
26] mentions that “the specific concrete manufacturing/mixing technology is to consider that the strength and toughness of the moulded material are similar to those characterizing 3D printed concrete”.
The Rockwell and Brinell hardness test based on the ASTM standard is a useful and efficient way of determining material hardness because it measures the depth of penetration of an indenter (hardened steel ball of different diameters) into the experimental pile (metals and plastics). This allows calculation of their relative strength and durability, the formula being:
where: N = 100 to 130 according to the Rockwell scale.
d = penetration depth from zero.
s = 0.001 to 0.002 mm, according to the Rockwell scale.
[
27] mention that the “hardness of a material is defined as the resistance it presents to being easily scratched or penetrated, while penetration consists of pushing a penetrator with a force and low speed for a fixed time”.
[
28] mention “the cracked model, the displacement of stresses. Concluding that when longitudinal cracks appear in the cladding, the safety of the structure is seriously endangered”. Also [
29] concluded that it is necessary to advance in the evaluation of the coating adhesion and the strength of concrete walls to make a more accurate classification.”
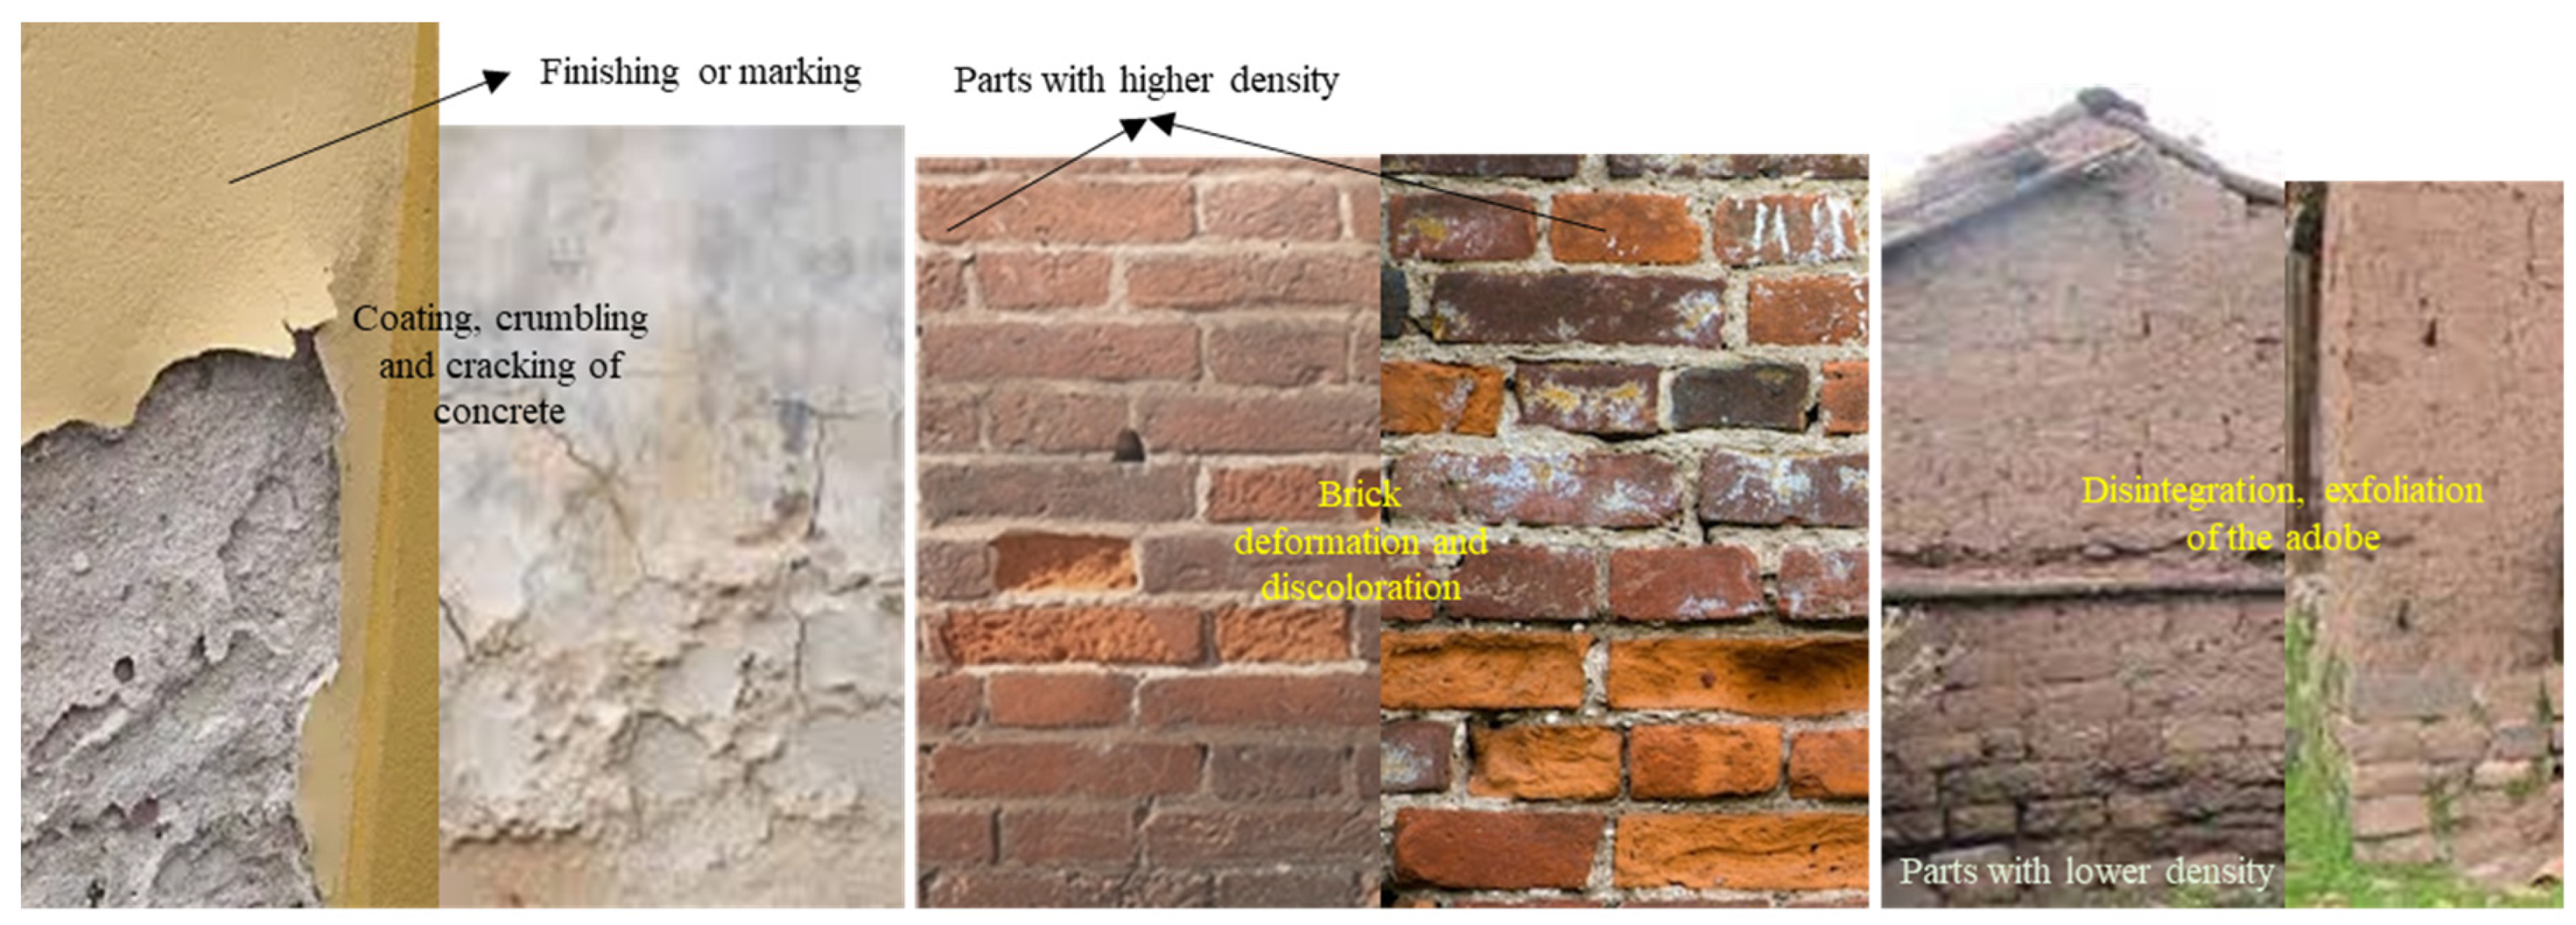
Figure 3.
Visualization of structural failures in dwellings.
Figure 3.
Visualization of structural failures in dwellings.
[
25] mentions that the State is responsible for assisting citizens in various elements, such as access to basic services, promotion of economic dependence, provision of decent employment, number of inhabitants in residential areas, and social development, which increases the quality of life of people. [
30] comment on the “most common types of failure in structural systems is generated by inadequate strength and high stresses in walls, columns and beams, non-adherence of these in shear, vibration, torsion, and puncture”. In addition, [
31] mention that structural pathology “is the systematic and orderly study of the irregular behavior of a structure or its elements, when it presents some type of failure or damage, caused by internal or external factors these structures do not guarantee their stability.” [
32] established two methods of correlation; firstly, core samples of raw asphalt concrete were drilled using a rotary shear compactor for laboratory testing, and then gravitational measurement with water, those indicators of density and volume, establish a direct relationship between the two methods.
[
33] stresses that “in the memory of a work, different tests are carried out, multiple samples are taken, concerning protocols for its final elaboration with standards specific to each country or region”. Likewise, [
34] states that “the joint mortars used for the construction of prisms and walls are made up of the ratio sand/conglomerate/water = 8/2/1, respectively (by weight)”. Also [
35] they allude that “making buildings safe for the population is the task of interest groups such as the state in charge of preventing disasters, inspectors, those who produce the laws, designers, and those who build”.
A structural lightweight concrete has a minimum compressive strength of 17 MPa at 28 days and a maximum density of 1840 kg/m
3. In other words, low density and high strength are not the only attributes that this type of mix possesses; porosity, adhesion, fire resistance, durability, low thermal conductivity, and acoustic insulation are also necessary. [
36]. Also, [
37] mention that “the grouping of sandy soils as results showed that the bulk density ranged from 1.25 to 1.60 g/cm3, i.e., in their study has verified the density of sandy soils”.
2. Materials and Methods
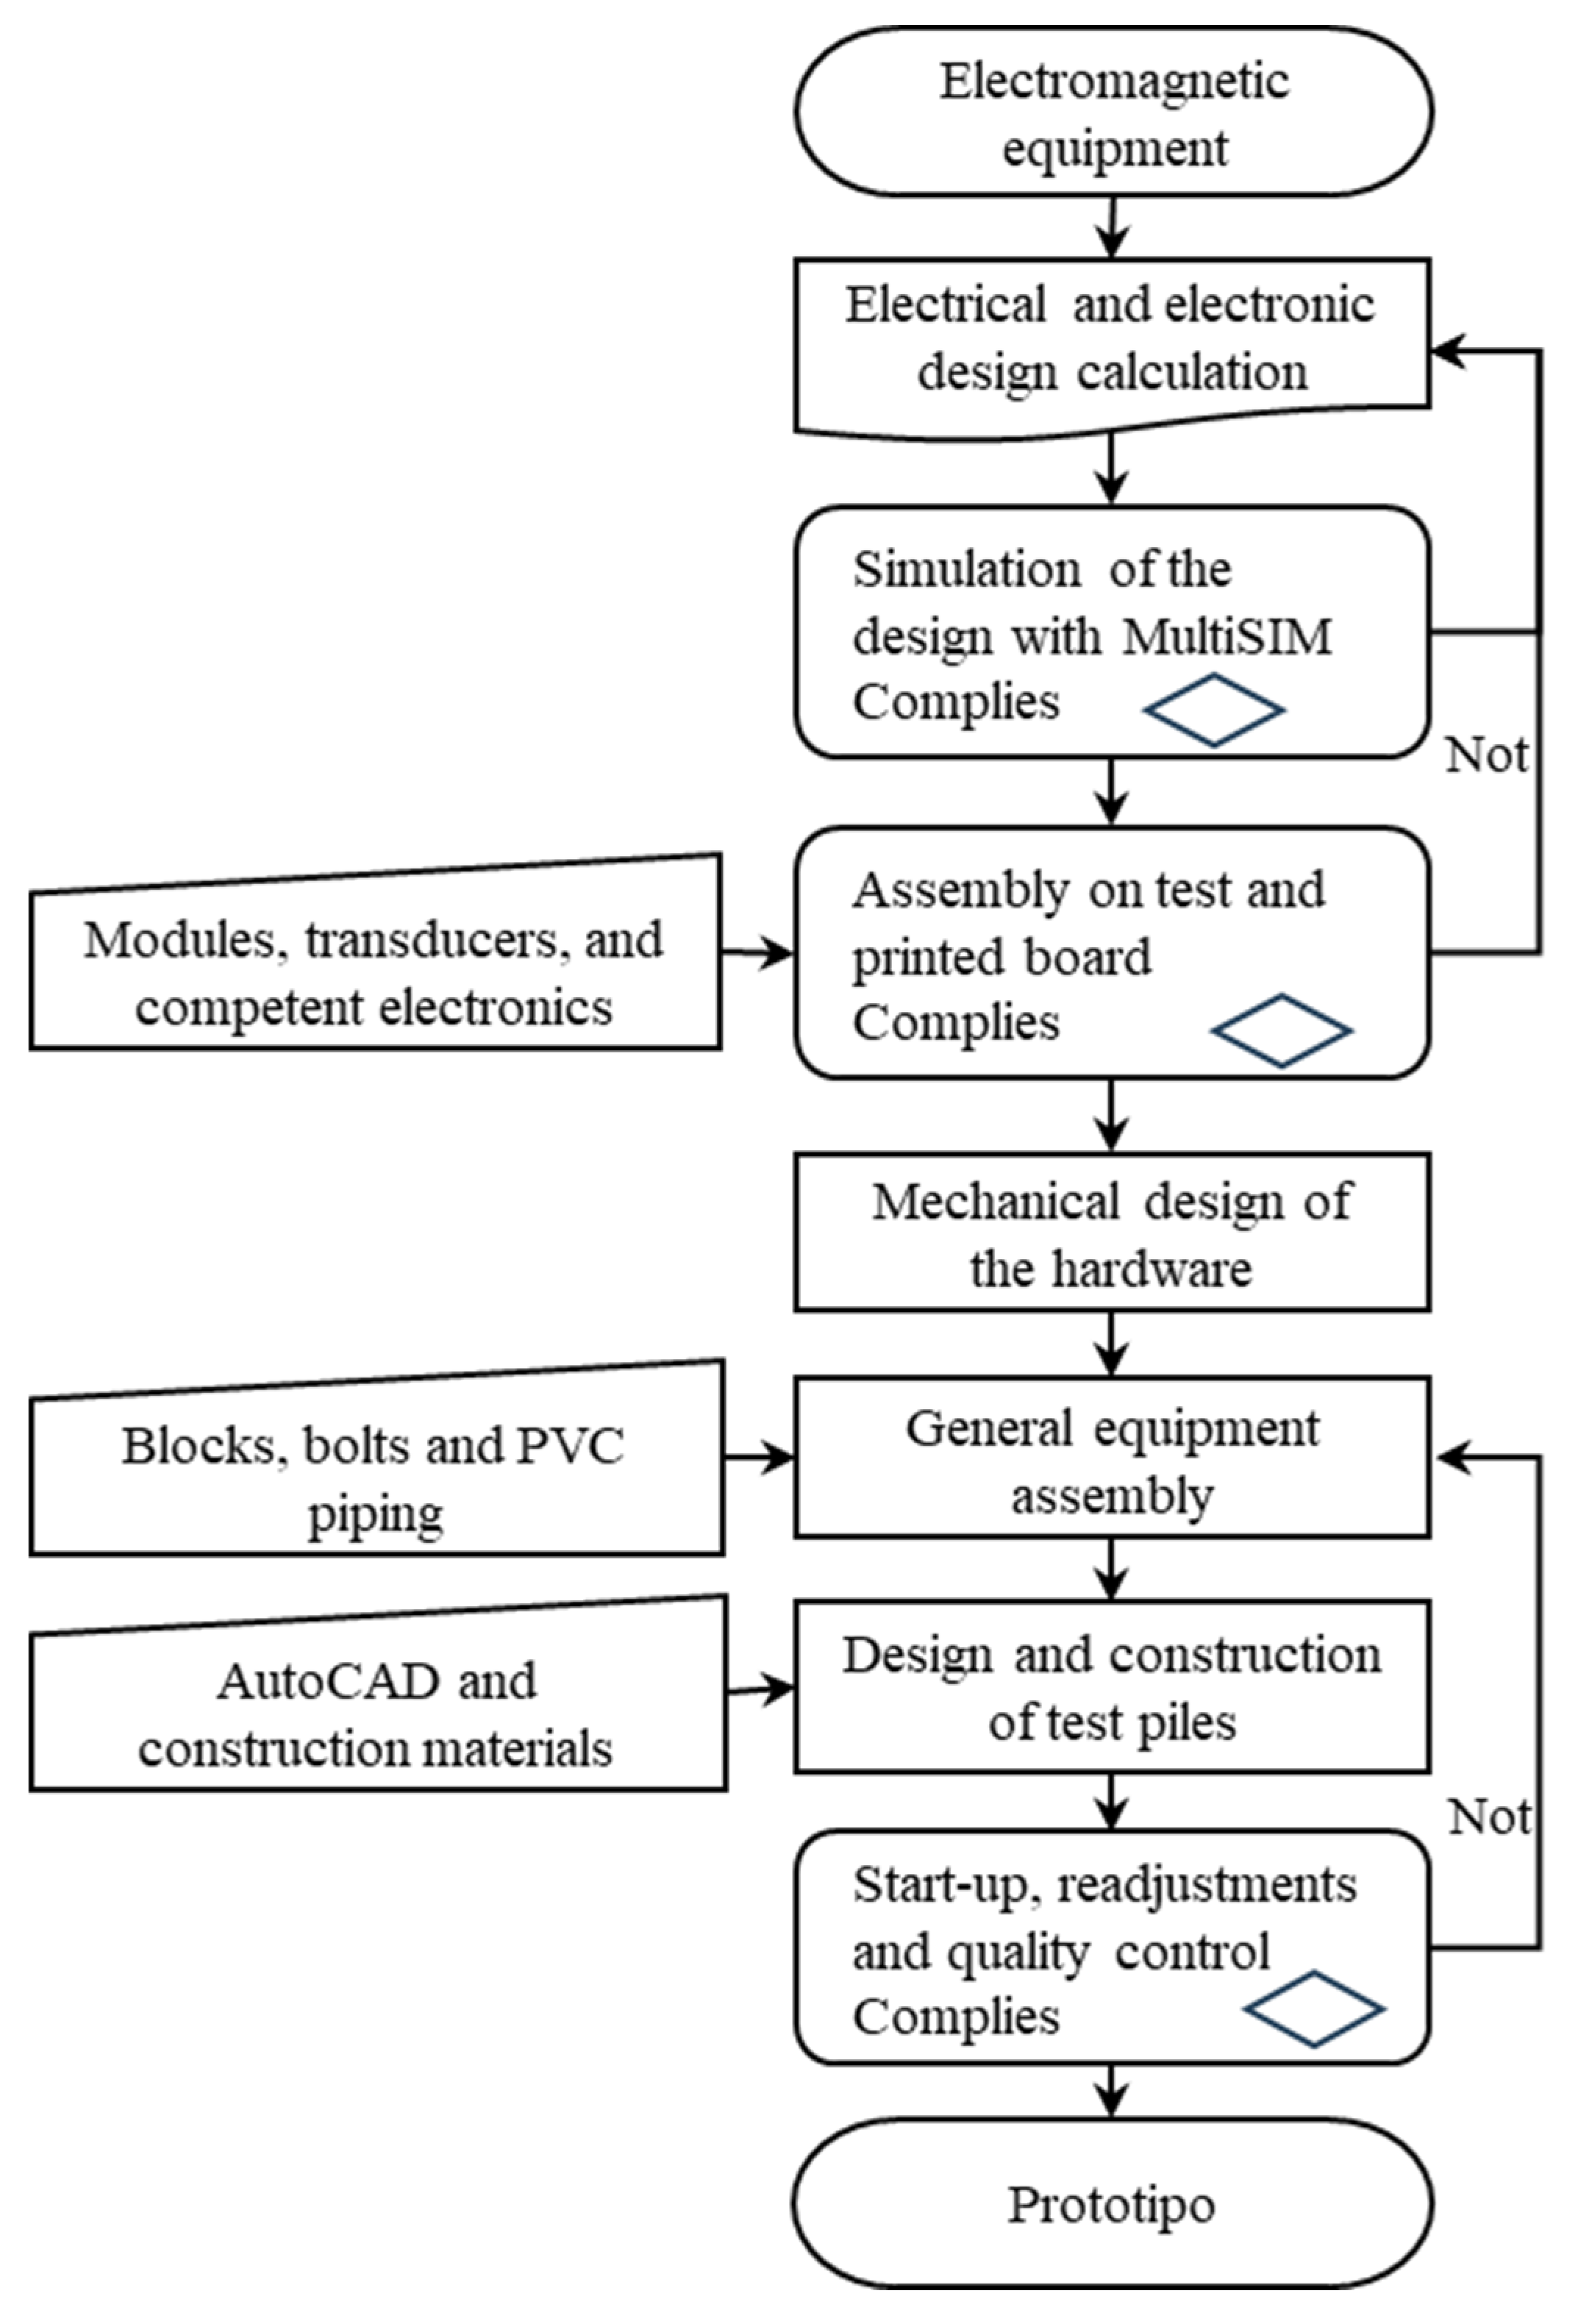
For the design and implementation of the electromagnetic field equipment we used PVC blocks and tubes, laboratory equipment such as an ultra-spectrum analyzer, a digital oscilloscope, a frequency meter, an LCR meter, a computer, and a voltmeter; we also used simulator programs such as N-MULTISIM, Proteus professional, AutoCAD, a set of electronic components, several printed boards, coils, and enameled copper wires, a power supply and batteries, some breadboards; instrumental sets, all of which were indispensable to build the internal and external part of the prototype, a construction tool kit; also, piles made of adobe, concrete, brick, plaster, and others were used for testing following the process:
Internal implementation process.
- a)
Desktop design of the circuit plans.
- b)
Calculate circuit elements using mathematics.
- c)
Installation of electronic software on the computer.
- d)
Simulation of the electronic circuit with Proteus, MULTISIM, and AutoCAD
- e)
Installation and connection of electronic devices on test and printed board.
- f)
Test the operation of the equipment in the laboratory using electronic equipment.
Hardware implementation process.
- a)
Prototype design (equipment).
- b)
Assembly and assembly of the prototype.
- c)
Connection of electronic devices on the prototype - Mold.
- d)
Pile construction with adobe, concrete, brick and plaster, and others.
- e)
Test the operation at the constructed site.
- f)
Readjustments and quality control of equipment.
The method and design of the study are in line with the concepts of [
38,
39]and are considered experimental due to their intentional manipulation of the independent variable (VI) to measure structural failures (DV). This type of research and development innovation (RDI) is applied to turn a need into a solution through scientific knowledge, technological means, and methodological protocols. By virtue of [
40] the conclusions are confronted with the hypothetical-deductive, taking into account what is mentioned by [
41] it is quantitative in approach. The population (N) consists of piles constructed of various types of materials. Then, the sample (n = N). As expressed by, [
42] data collection was obtained from on-site guides and laboratory data analysis. The comparison of density and penetration distance of the magnetic field (B) was carried out, for this purpose I consider [
43] who emphasizes that reflecting and acting appropriately allows one to be the architect of one’s own study, from the assembly procedure to the final product.
Contribution
Failure from a deterioration point of view such as cracks and structural fractures in beams, columns, walls, roofs, and floors is caused by physical, chemical, and mechanical phenomena, as well as by water infiltration, reconstruction, and destruction when installing other services. Poor design, improvised workmanship, and inadequate materials are often ignored.
Figure 4 shows how to design the principles of the beat frequency oscillator (BFO) that serves as a detector of internal coating deterioration as a function of its internal density. I explain to the users, that there is uncertainty if the density of hollow brick is less than 1.1g/cm
3; if the density of baked brick is less than 1.3g/cm3; if the density of concrete/cement is less than 2.2g/cm
3 there are significant risks to the structure.
It is recommended that home builders use techniques and knowledge in construction, regardless of the type of material, to ensure the confidence of families and the durability of the building.
3. Results
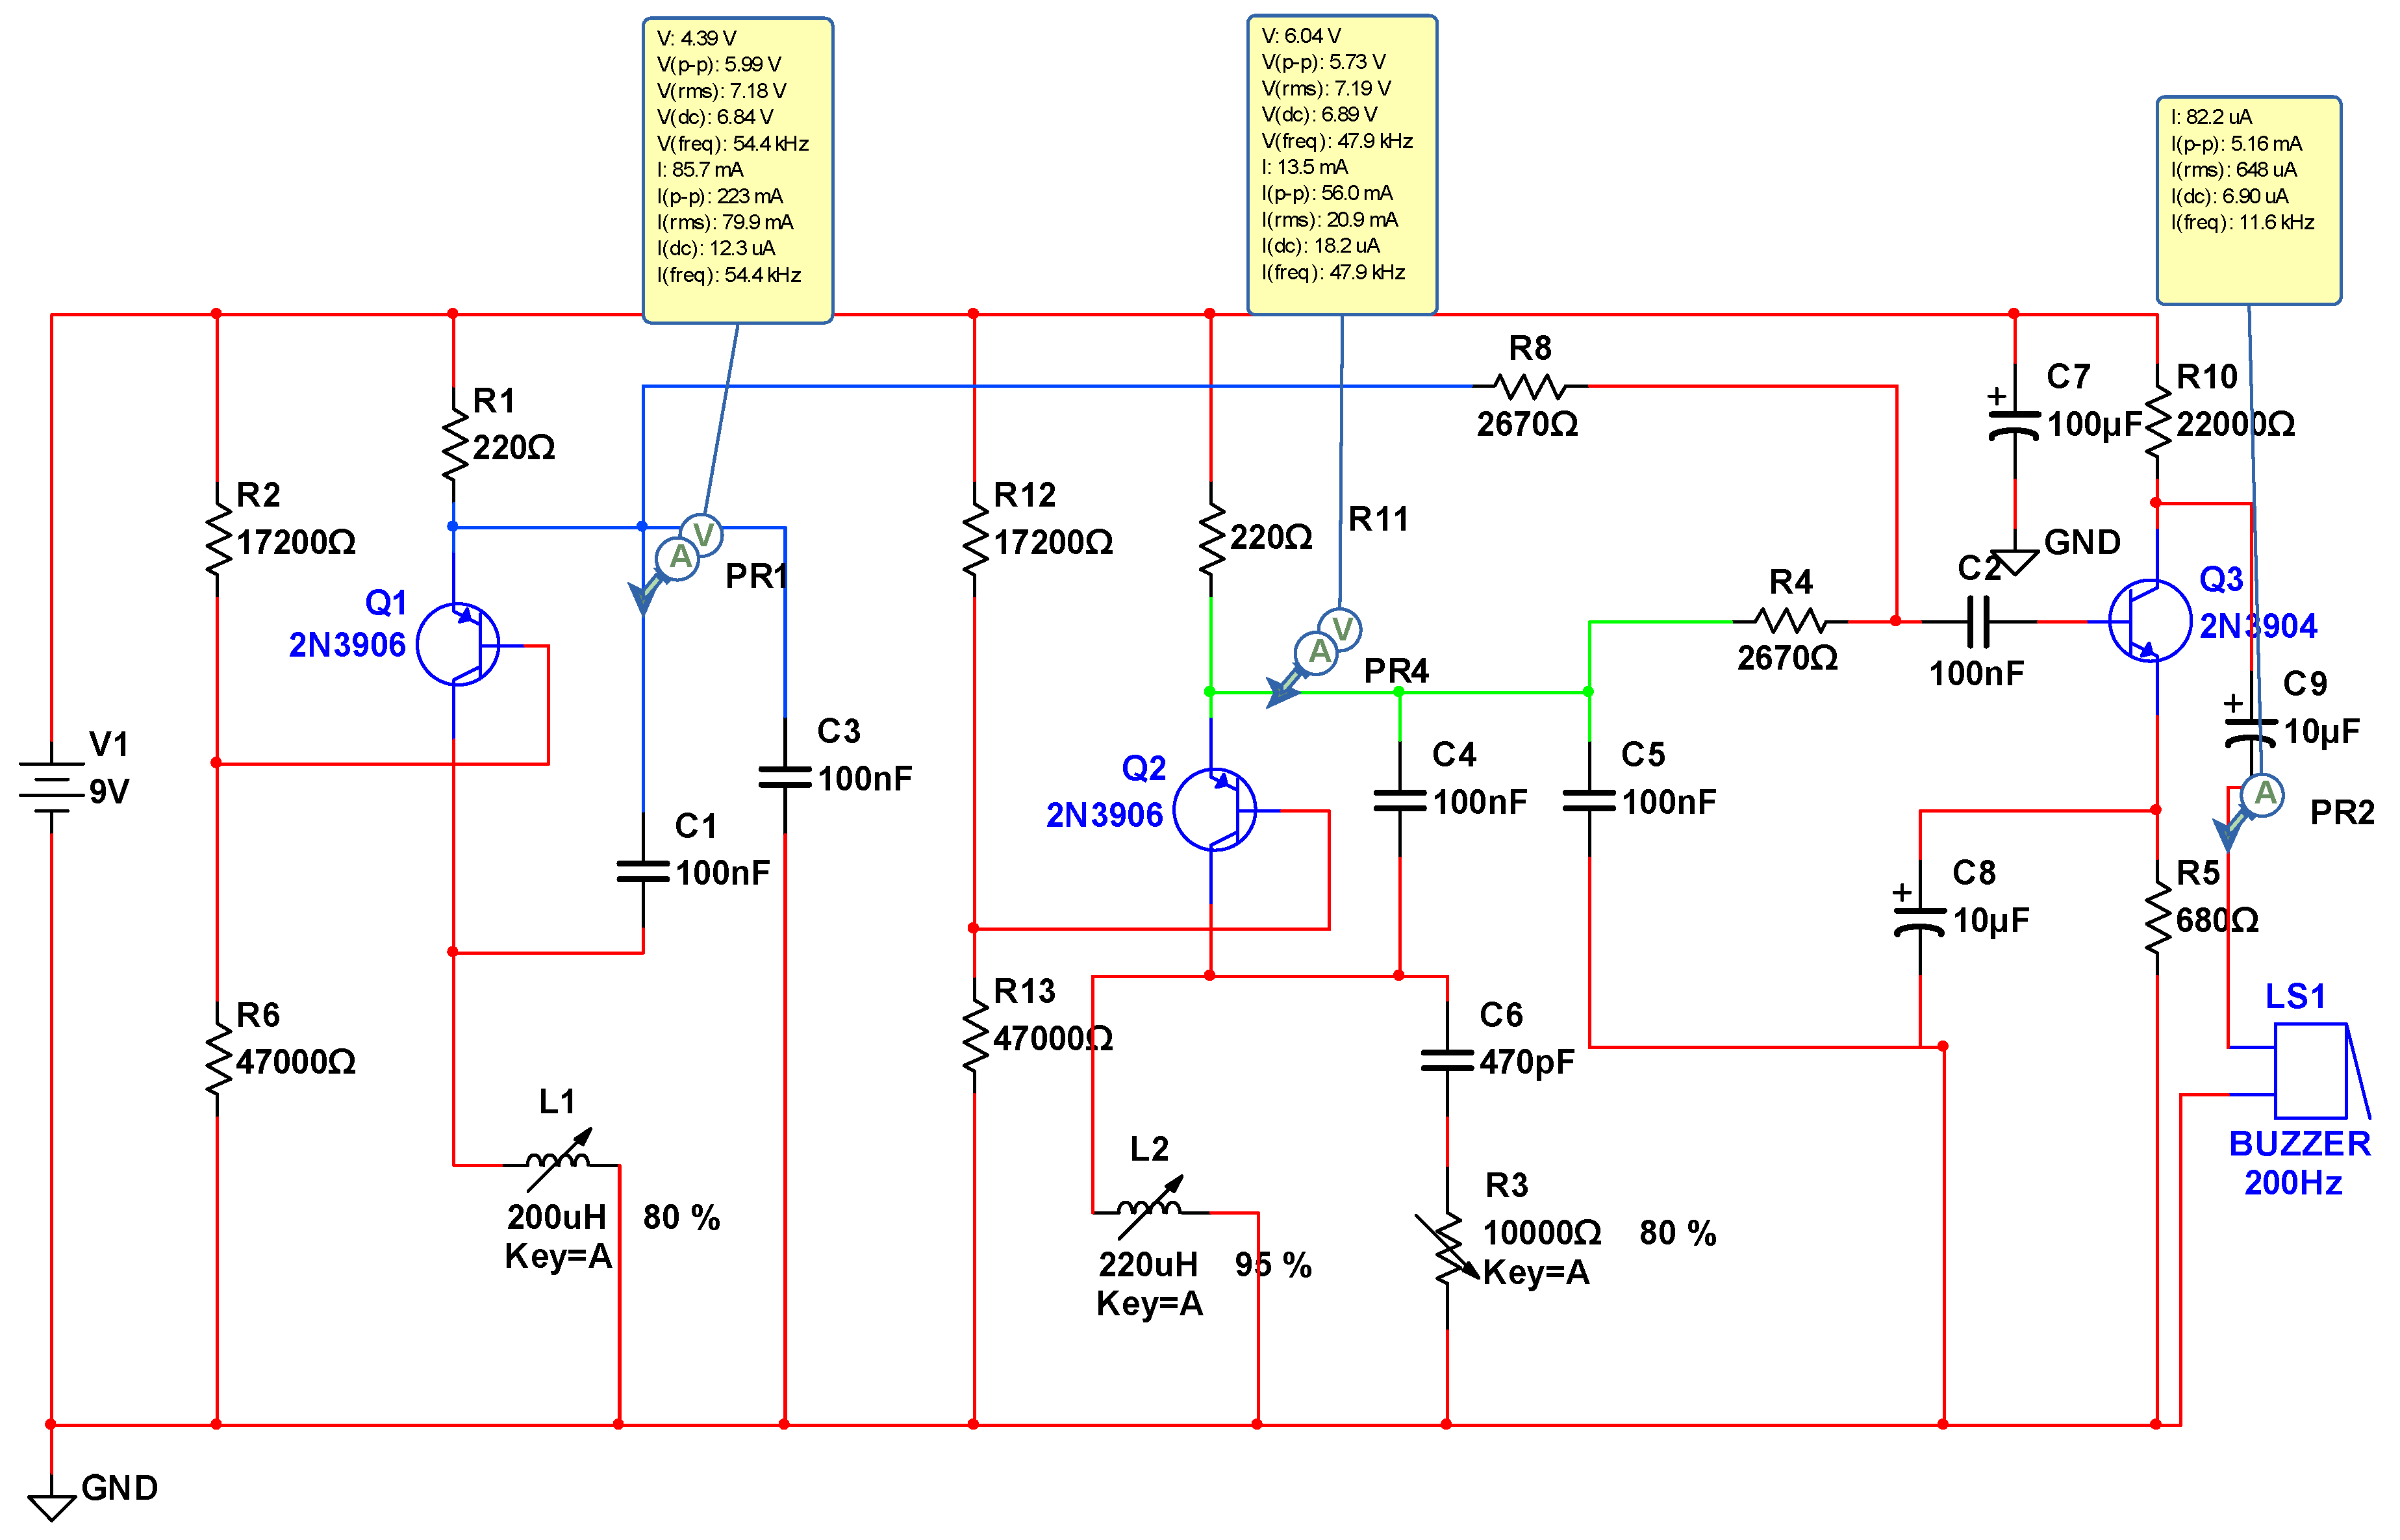
In the design, the use of formulae (mathematical calculations) and the MULTISIM program provide more confidence in simulating the electrical circuit, determining the generation of the magnetic field, the oscillation frequency, the voltage, the current consumed, and the waveforms at each stage.
Figure 5.
Basic design with MULTISIM of the electromagnetic field generator (B). Note: R = resistors, C = ceramic, electrolytic capacitor, Q = transistors, L = inductance, LS1 = transducer, GND = ground, V = supply voltage.
Figure 5.
Basic design with MULTISIM of the electromagnetic field generator (B). Note: R = resistors, C = ceramic, electrolytic capacitor, Q = transistors, L = inductance, LS1 = transducer, GND = ground, V = supply voltage.
Table 2.
Relationship between inductances (Lc - Lm - Ls) and number of turns.
Table 2.
Relationship between inductances (Lc - Lm - Ls) and number of turns.
| # of turns (Nv) |
Lc (µH) |
Lm (µH) |
Ls (µH) |
| 15 |
119,27 |
121,4 |
116,5 |
| 16 |
135,05 |
137,19 |
132,3 |
| 17 |
151,74 |
153,87 |
145,6 |
| 18 |
169,31 |
171,44 |
161,1 |
| 19 |
187,76 |
189,89 |
176,8 |
| 20 |
207,07 |
209,2 |
193,9 |
| 21 |
227,23 |
229,36 |
211,1 |
| 22 |
248,22 |
250,36 |
229,1 |
| 23 |
270,05 |
272,18 |
246,7 |
| 24 |
292,69 |
294,82 |
267,8 |
| 25 |
316,14 |
318,27 |
284,6 |
| 26 |
340,37 |
342,51 |
305,2 |
| Correlation coefficient (r) |
r (Lc; Lm) |
r (Lm; Ls) |
r (Lc; Ls) |
| 1,0000 |
0,9998 |
0,9998 |
| Correlation coefficient (r) |
r (Nv; Lc) |
r (Nv; Lm) |
r (Nv; Ls) |
| 0,9979 |
0,9979 |
0,9986 |
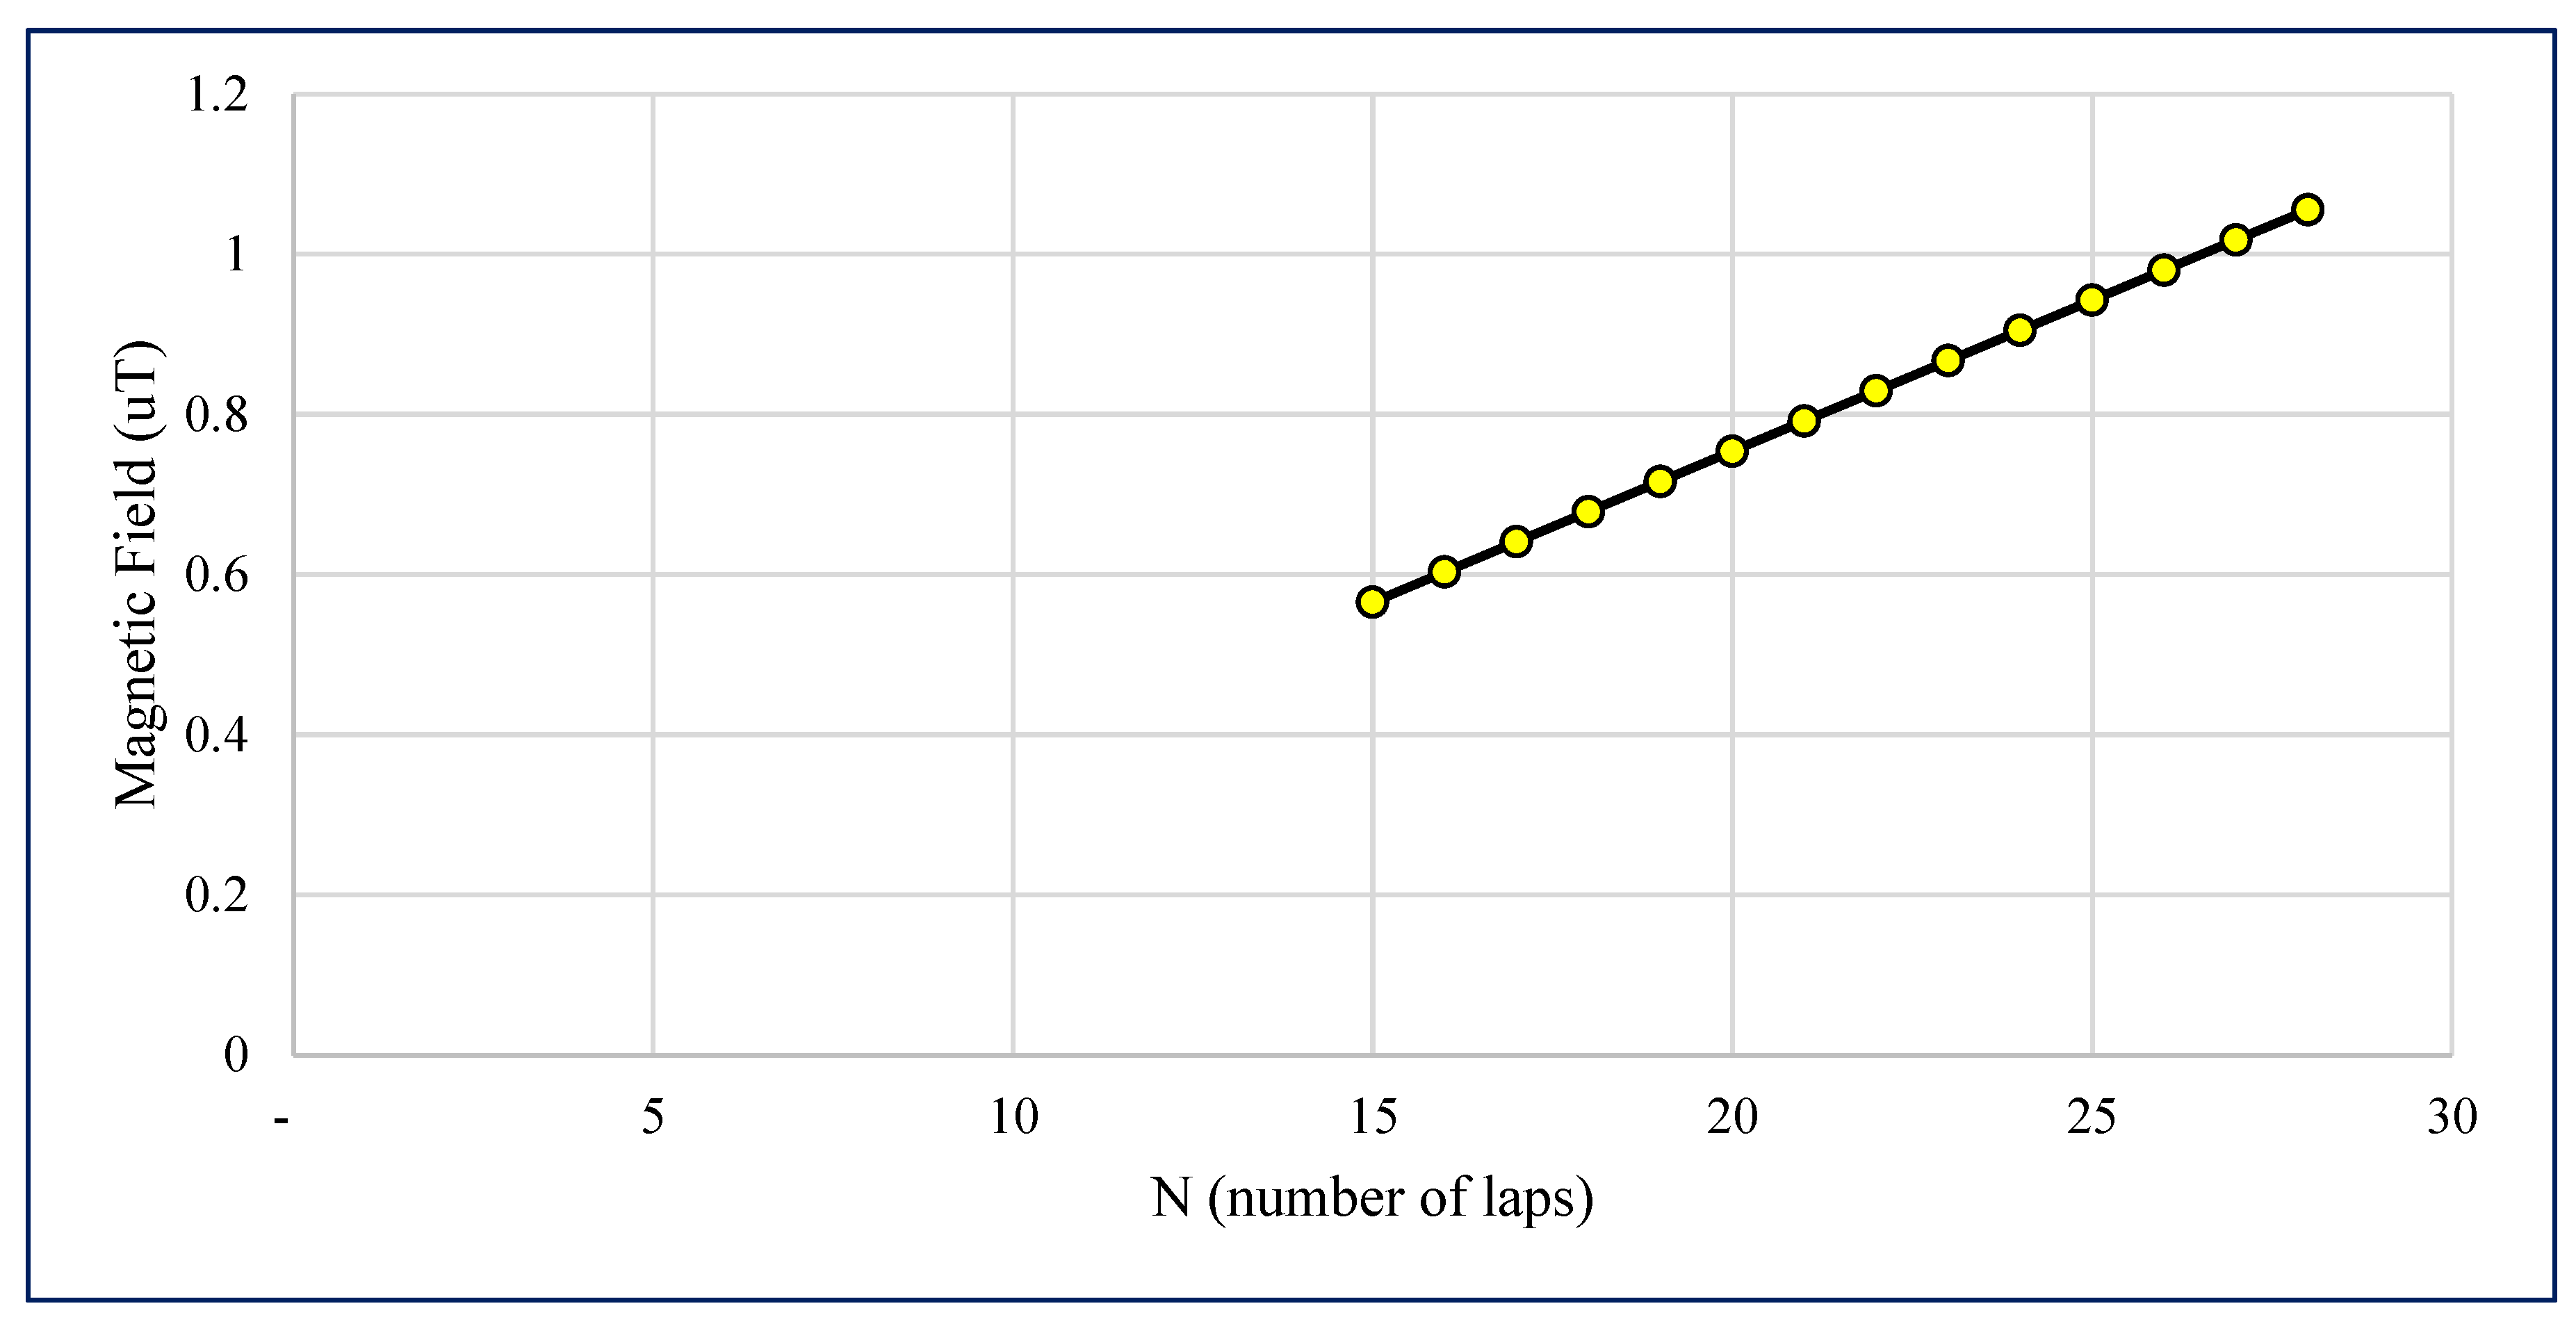
Figure 6.
Correlation between the magnetic field and the number of spirals. Note: own elaboration.
Figure 6.
Correlation between the magnetic field and the number of spirals. Note: own elaboration.
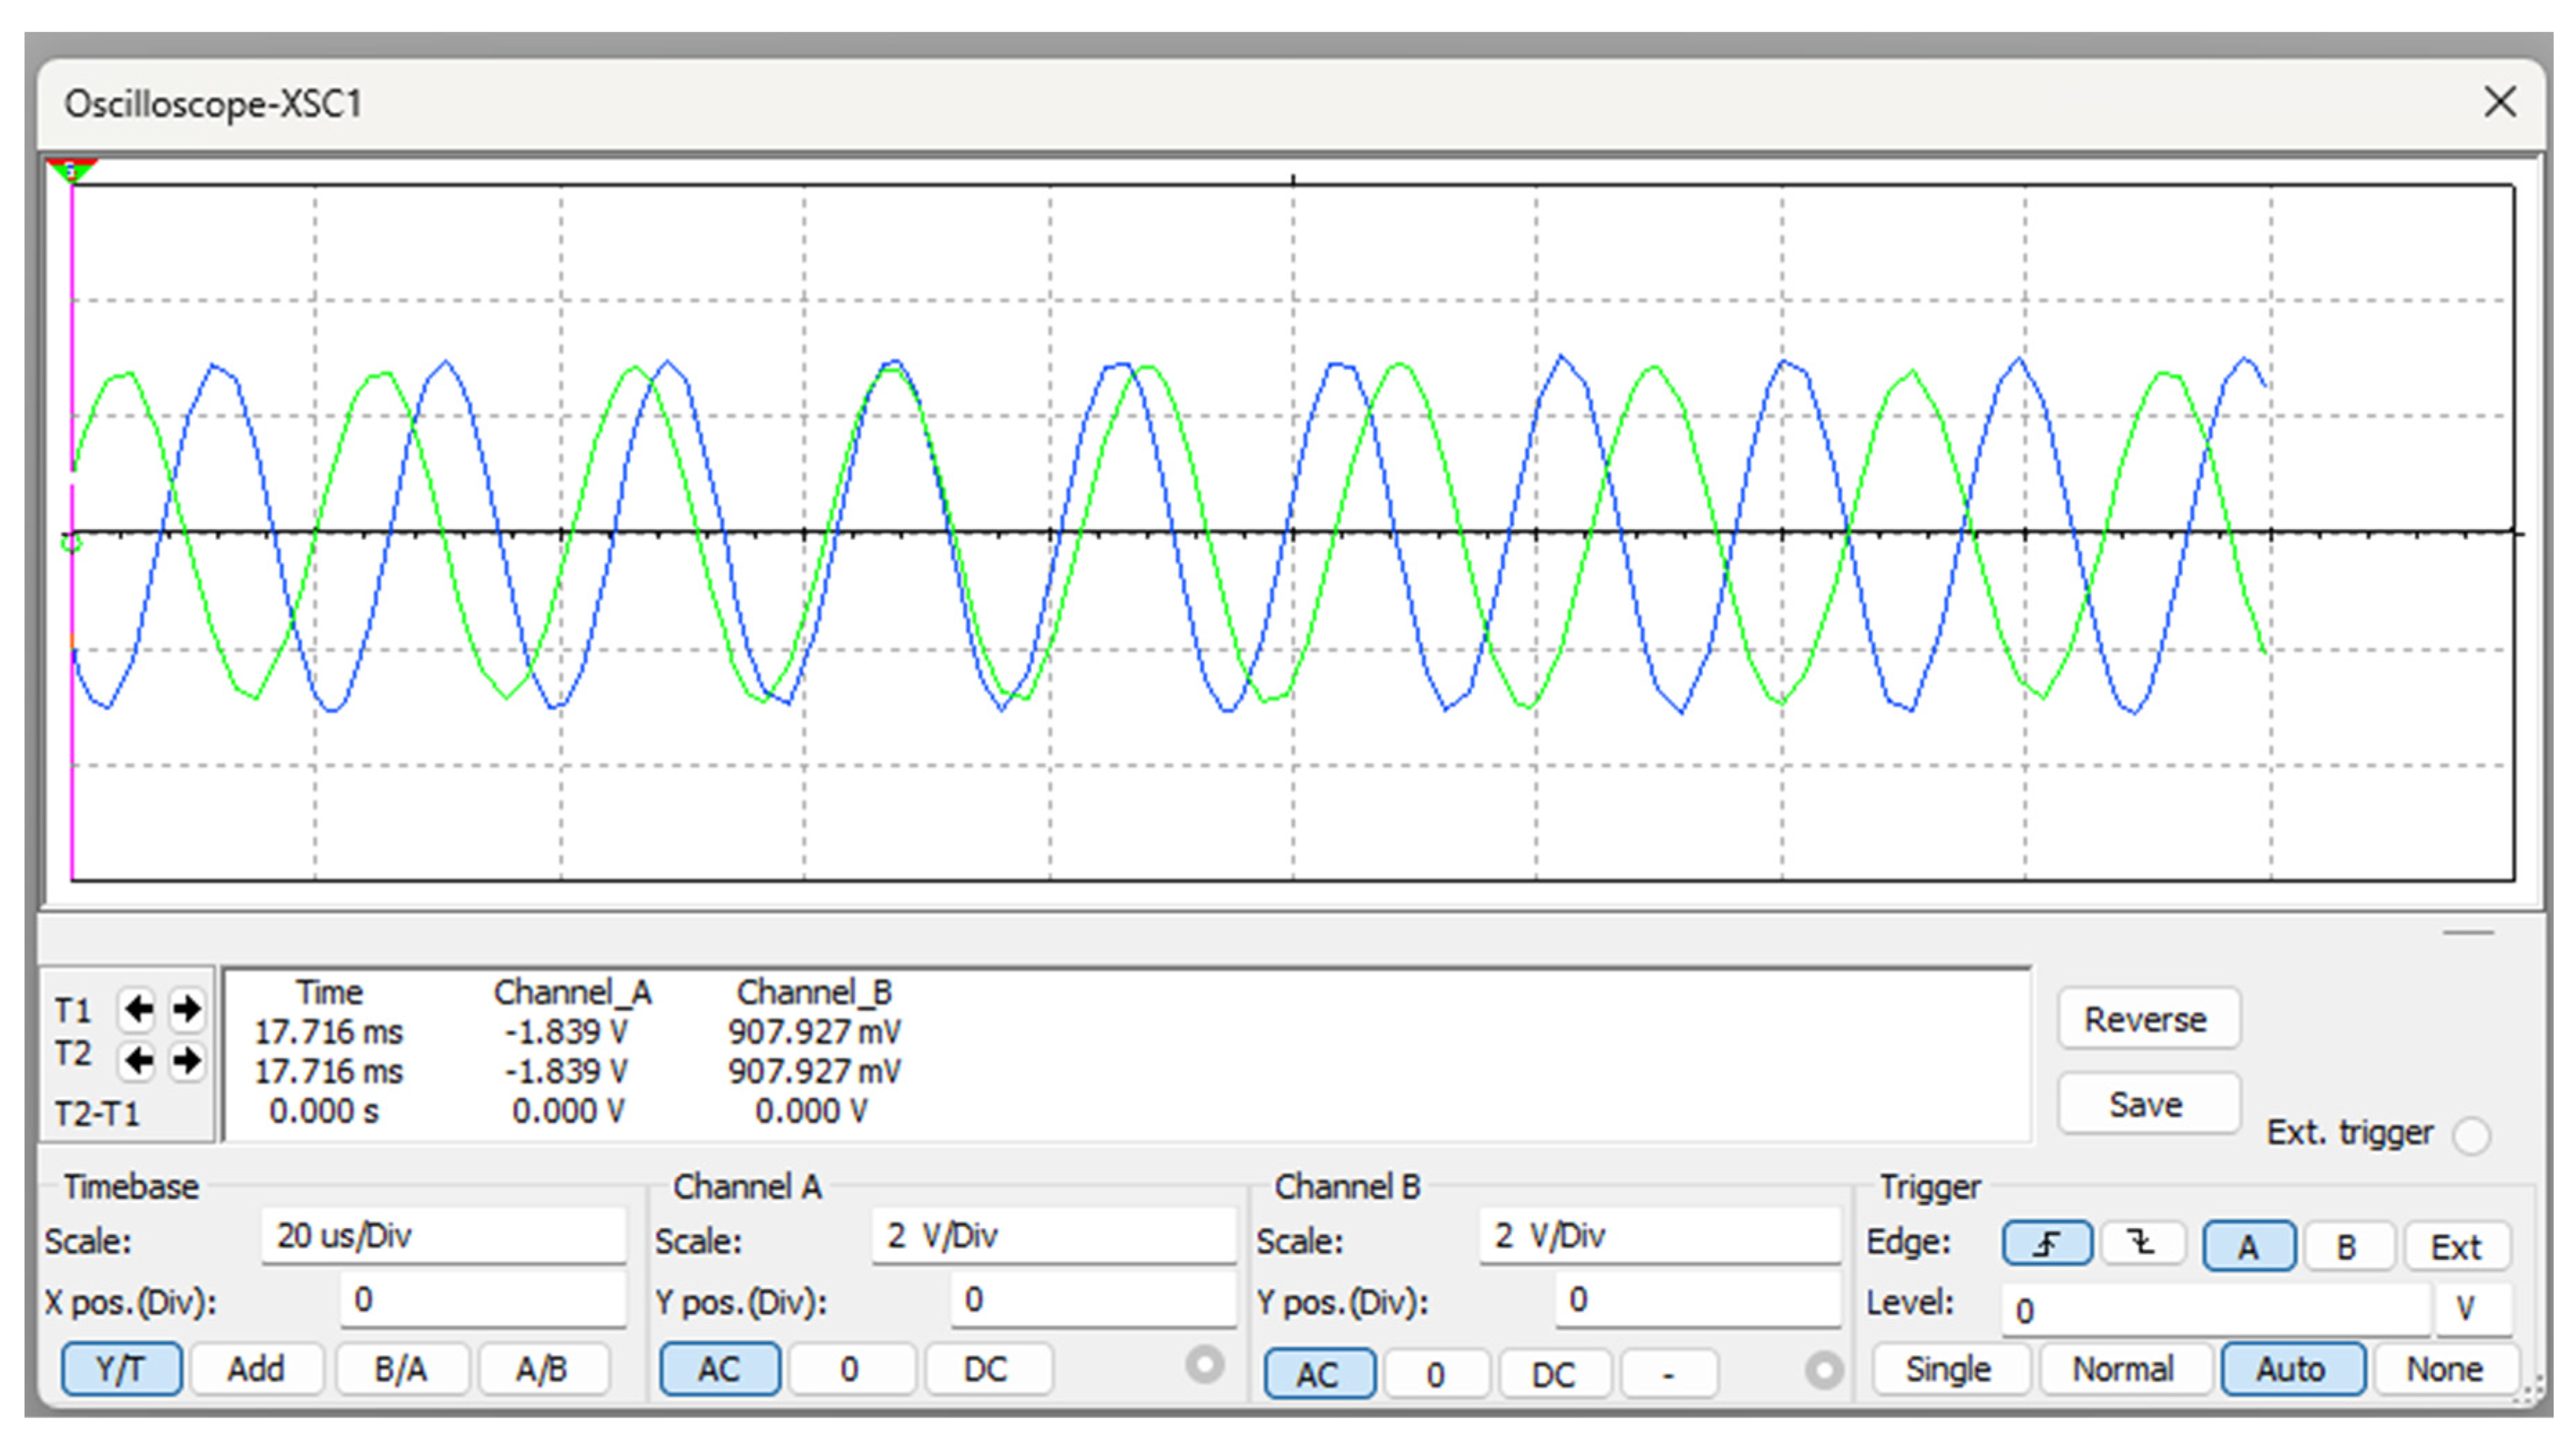
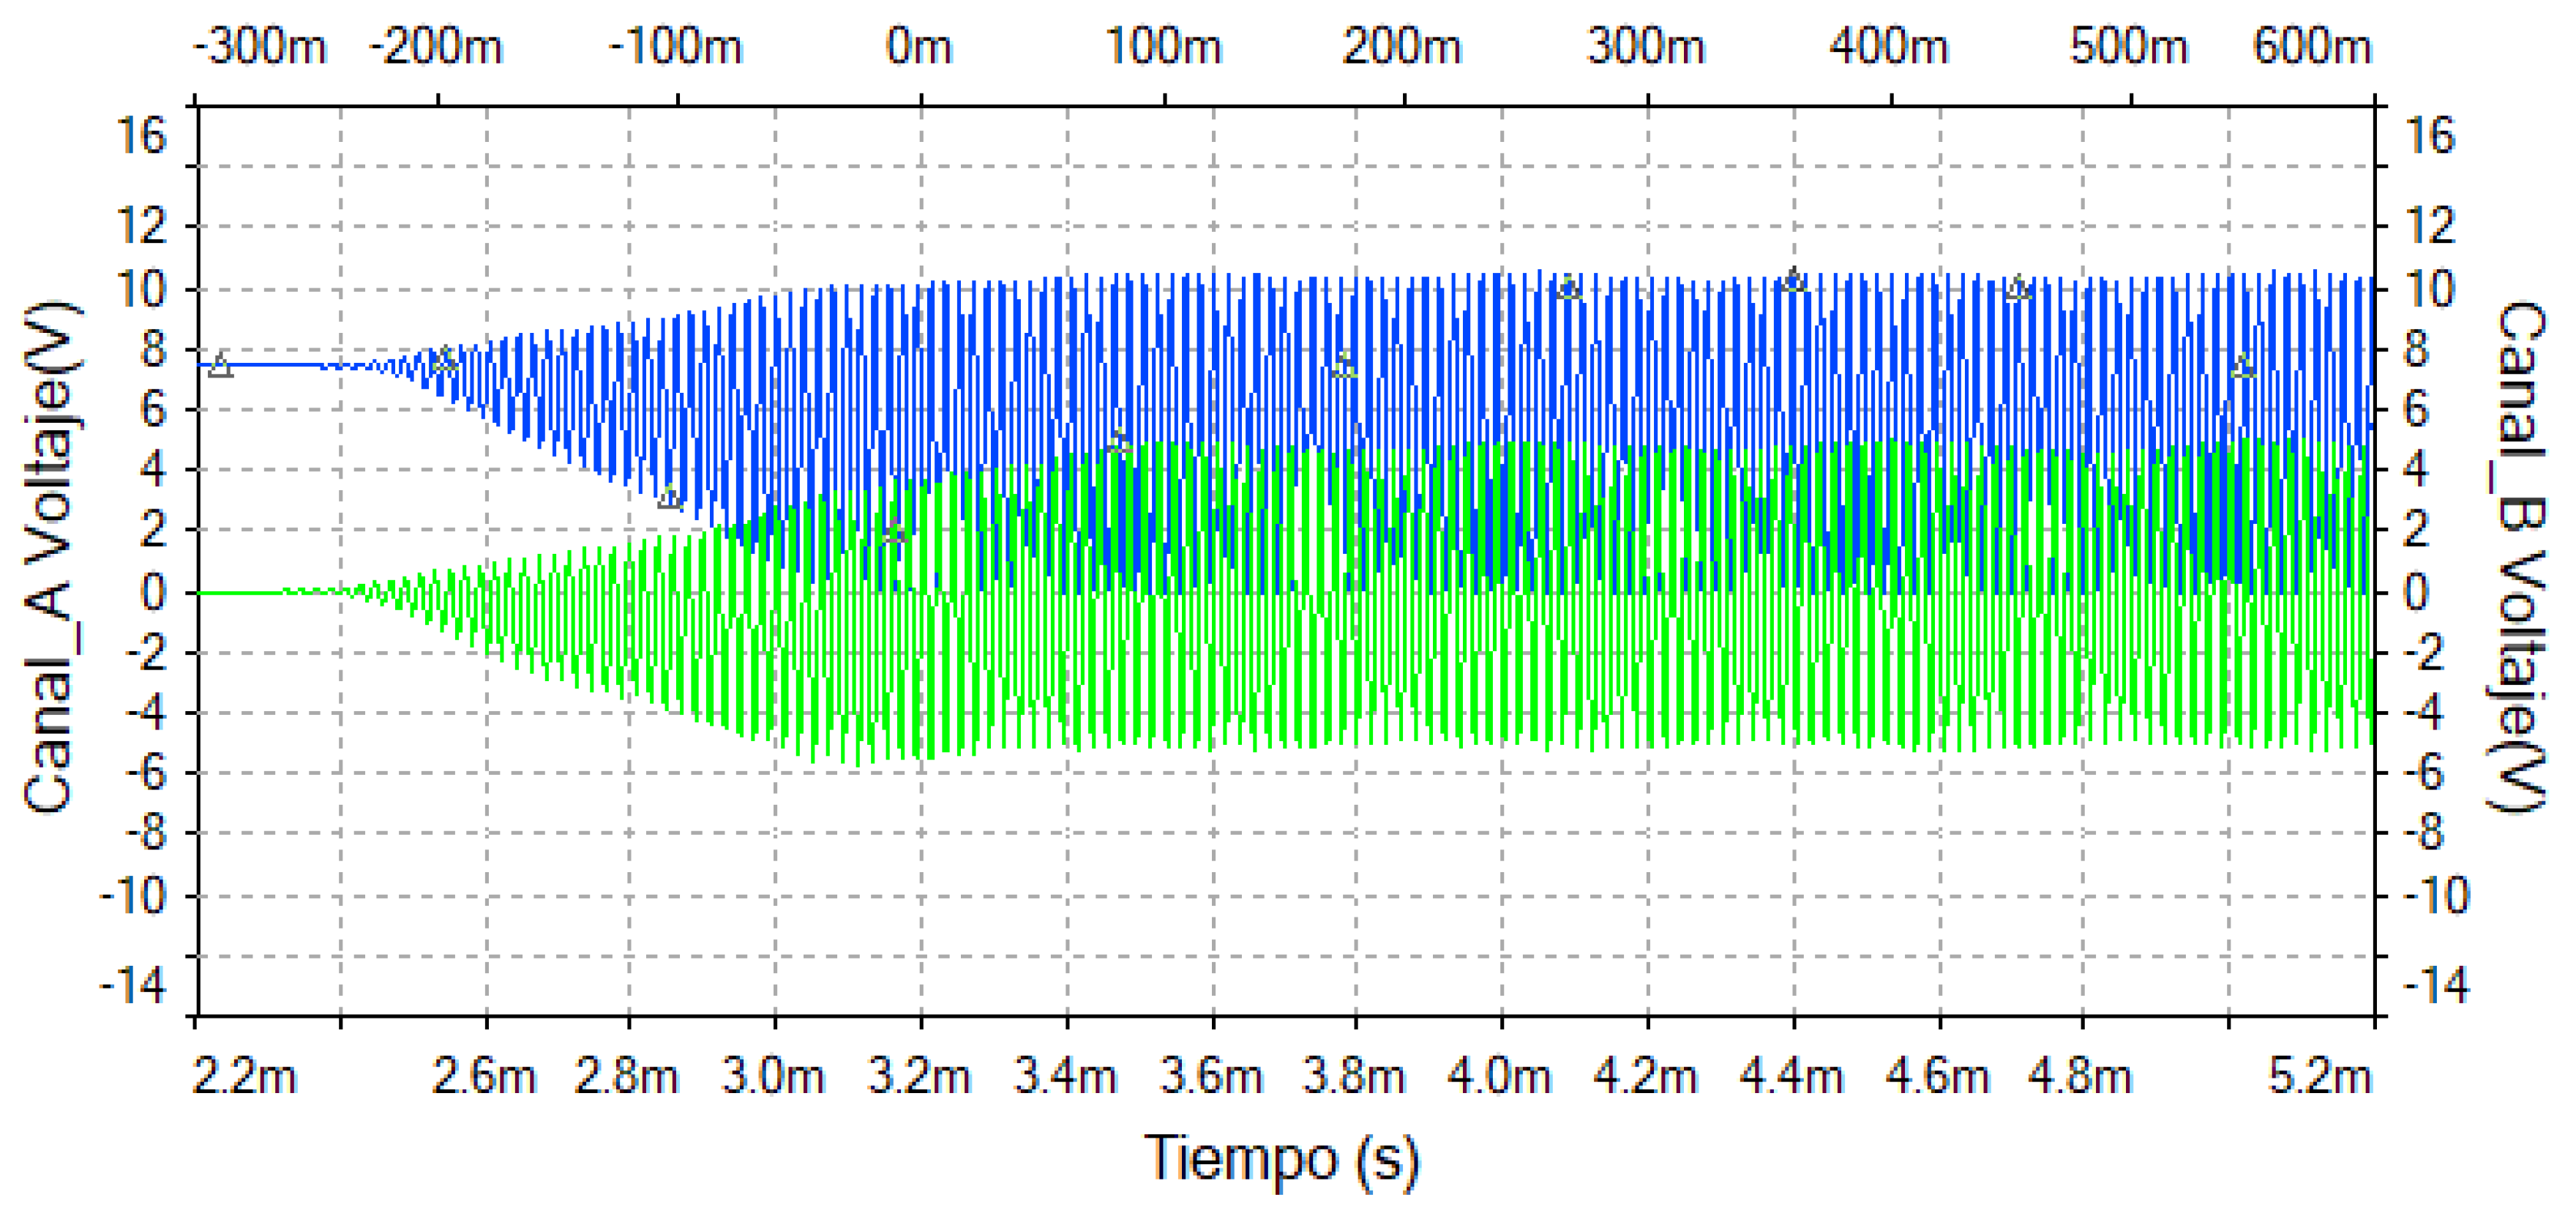
Figure 7.
Sinusoidal signals captured by MILTISIM in the Q1 and Q2 stages. Note: when blue and green sinewaves are introduced into the channels.
Figure 7.
Sinusoidal signals captured by MILTISIM in the Q1 and Q2 stages. Note: when blue and green sinewaves are introduced into the channels.
A and B of the virtual oscilloscope, start at a phase of 90 degrees and then fade out by 180 degrees concerning the central axis.
Figure 8.
Signal amplitude (volts) and period (seconds) are found in channels A and B. Note: the first stage of Q1 is blue and the second stage of Q2 is green.
Figure 8.
Signal amplitude (volts) and period (seconds) are found in channels A and B. Note: the first stage of Q1 is blue and the second stage of Q2 is green.
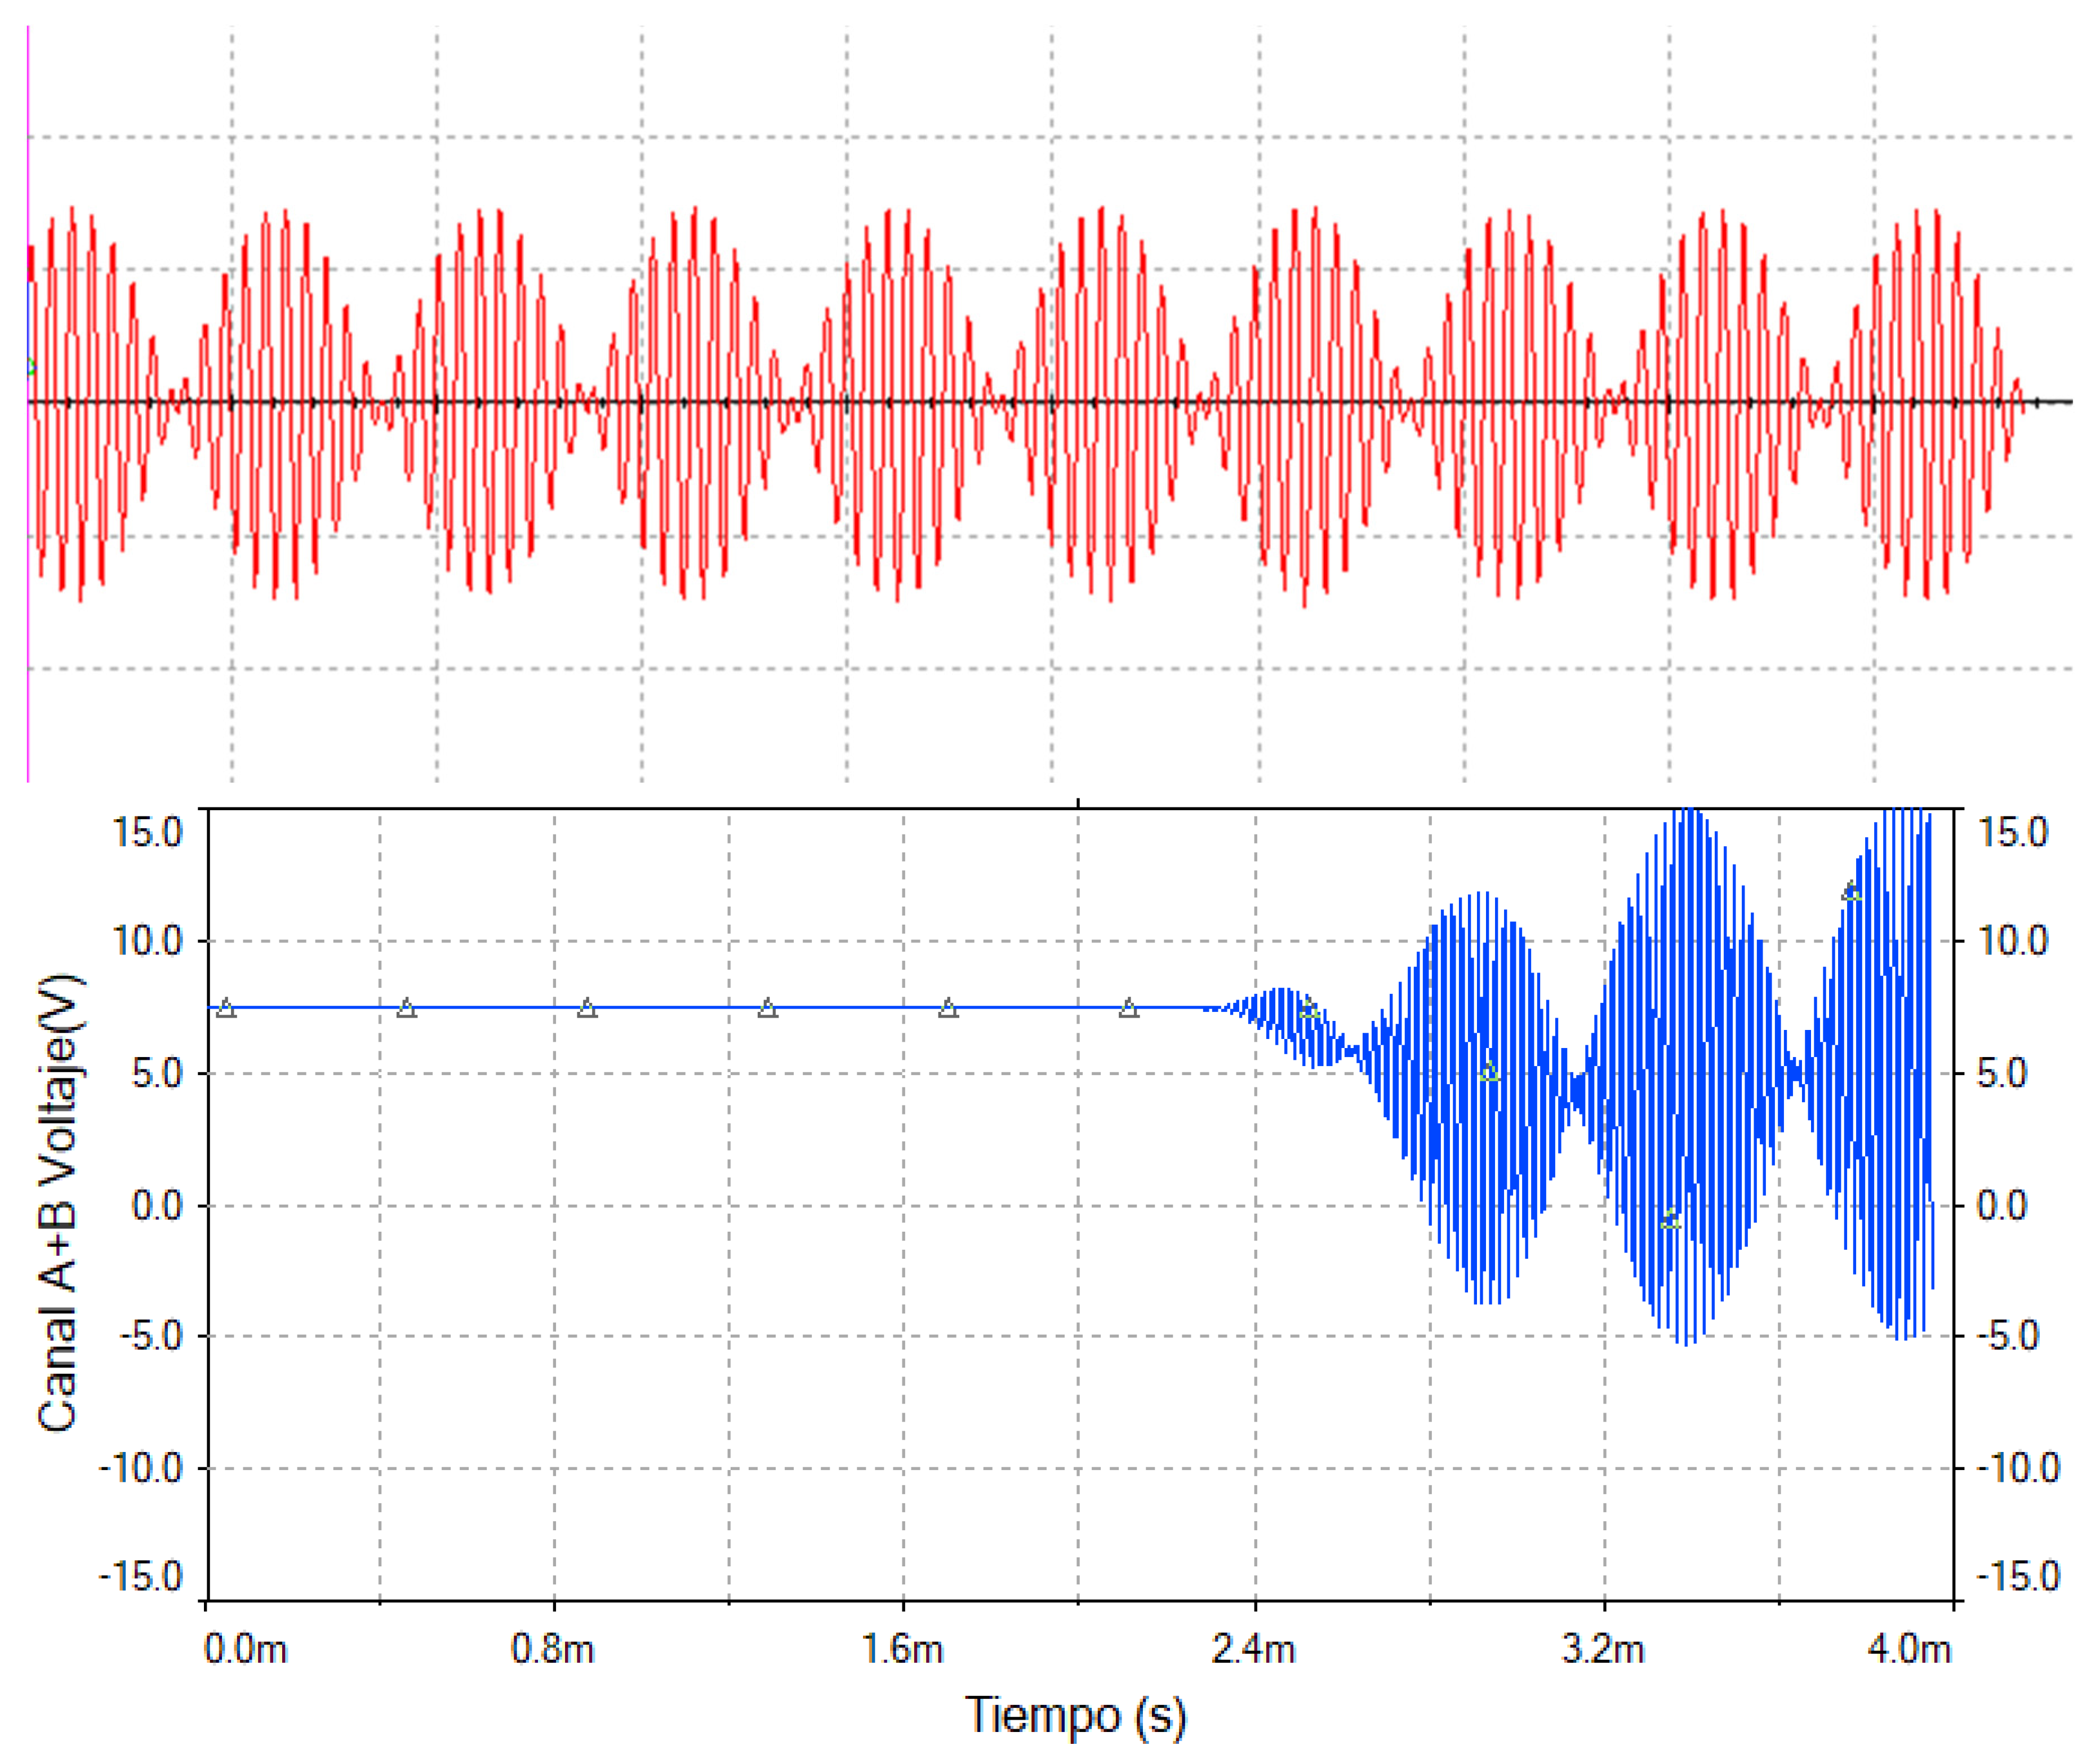
Figure 9.
Sum of sine waves (modulated signal in stage Q3). Note: Signal modulated at an audio frequency is displayed on channels A + B.
Figure 9.
Sum of sine waves (modulated signal in stage Q3). Note: Signal modulated at an audio frequency is displayed on channels A + B.
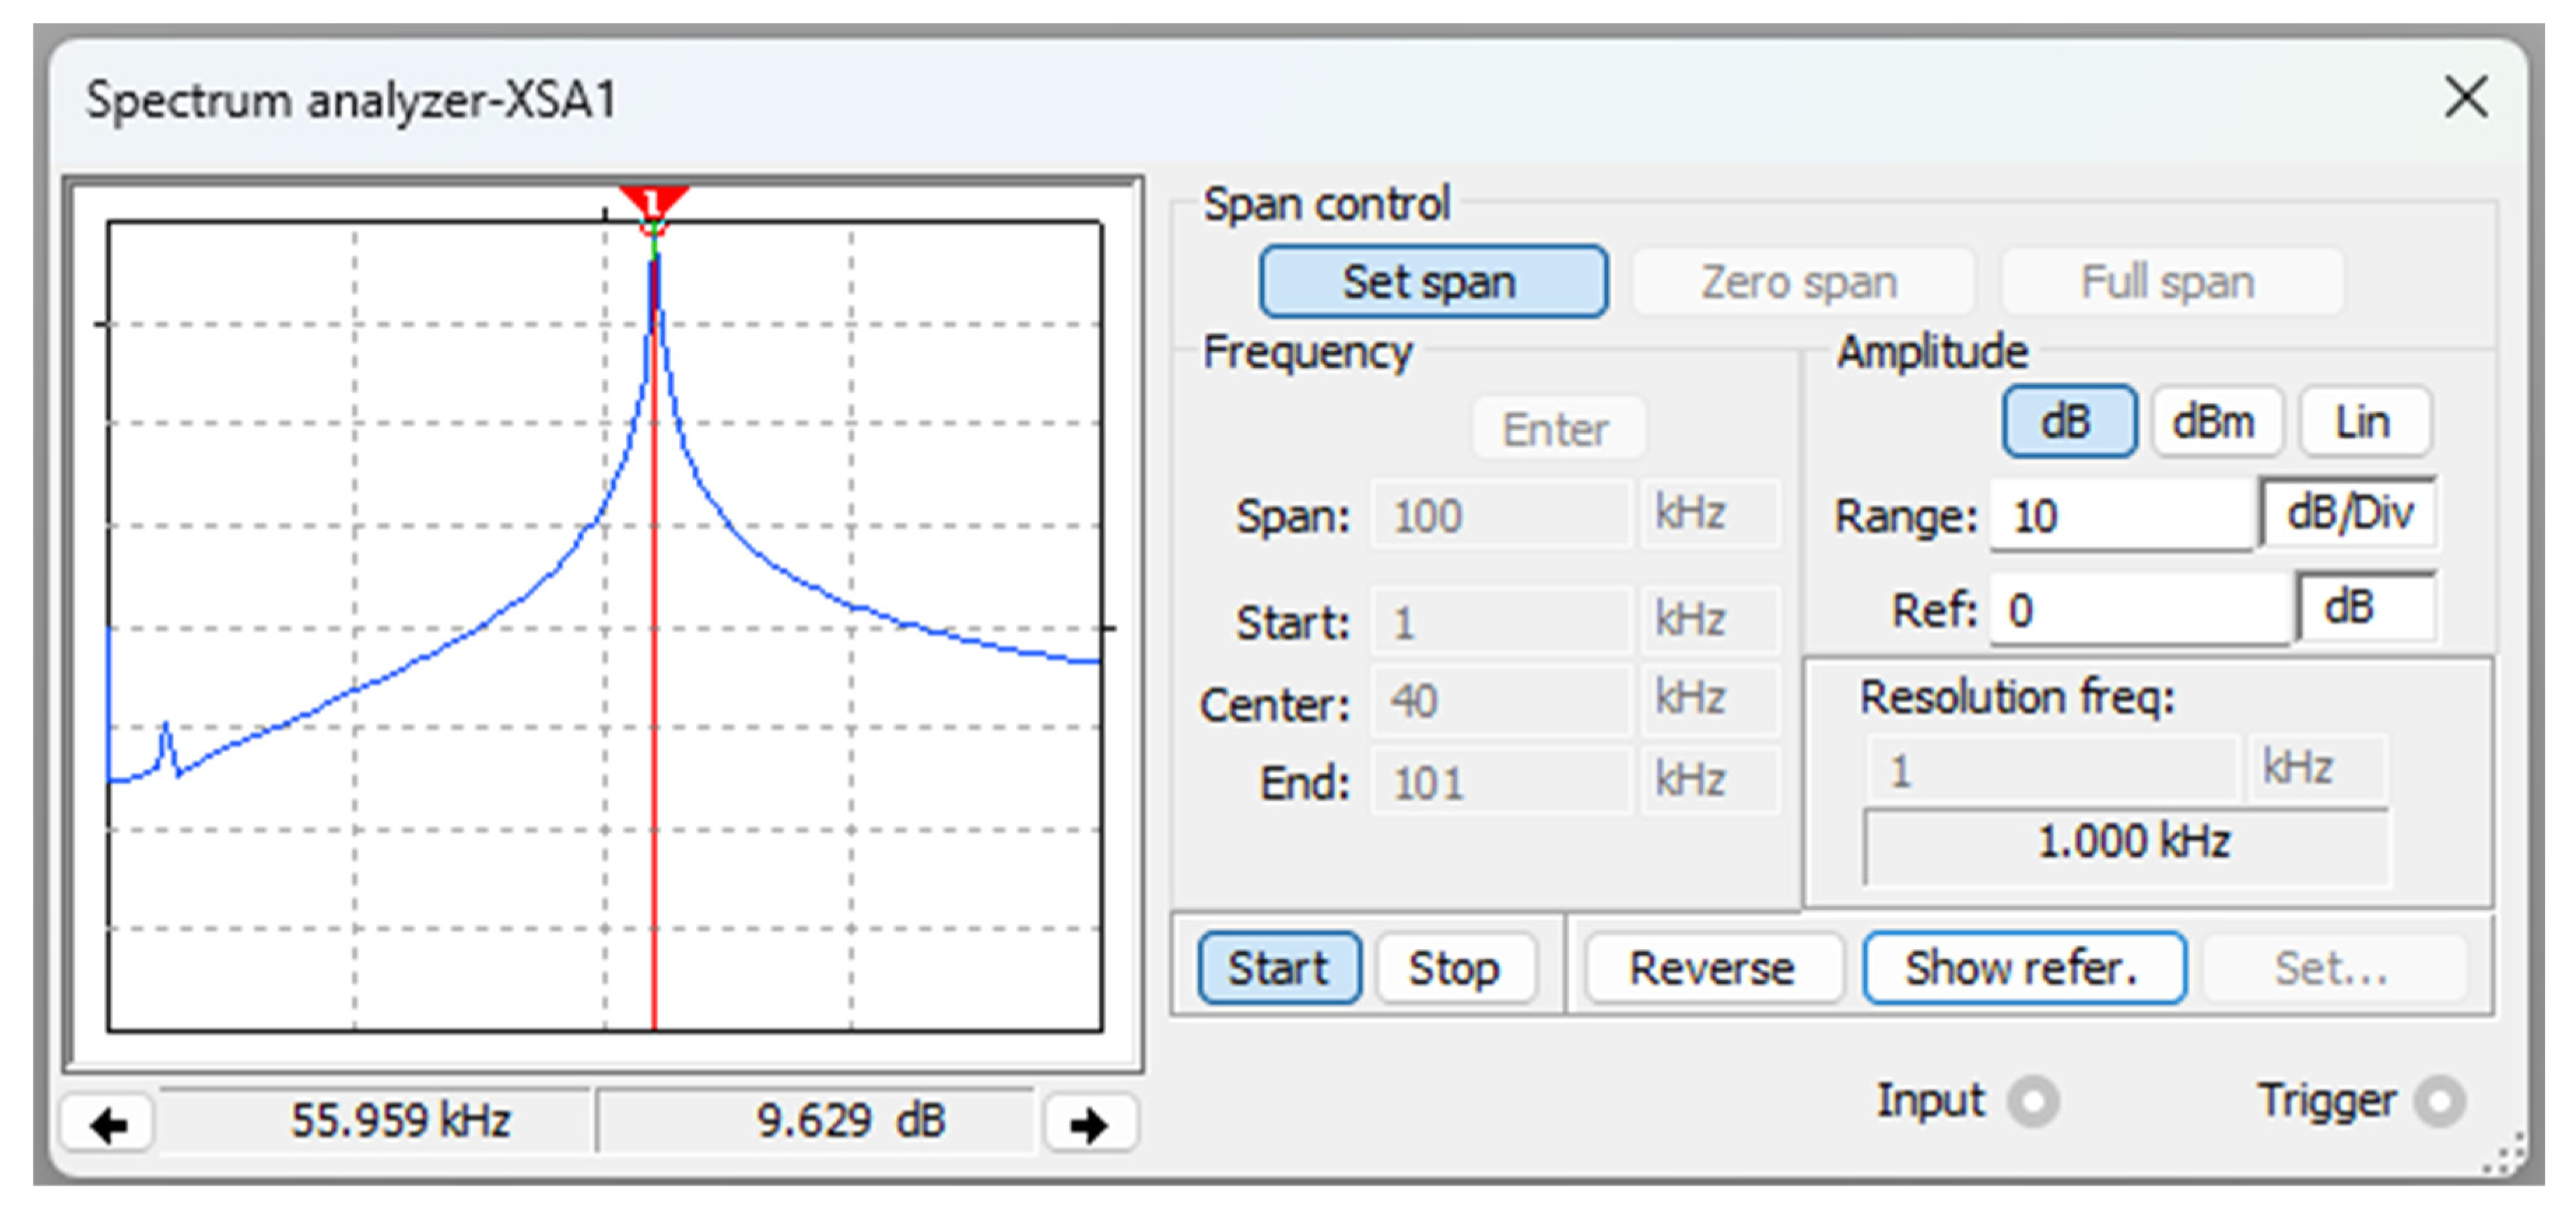
Figure 10.
Electromagnetic spectrum analysis on the prototype. Note: the operating spectrum of the prototype is 56 kHz with a gain of 10 dB.
Figure 10.
Electromagnetic spectrum analysis on the prototype. Note: the operating spectrum of the prototype is 56 kHz with a gain of 10 dB.
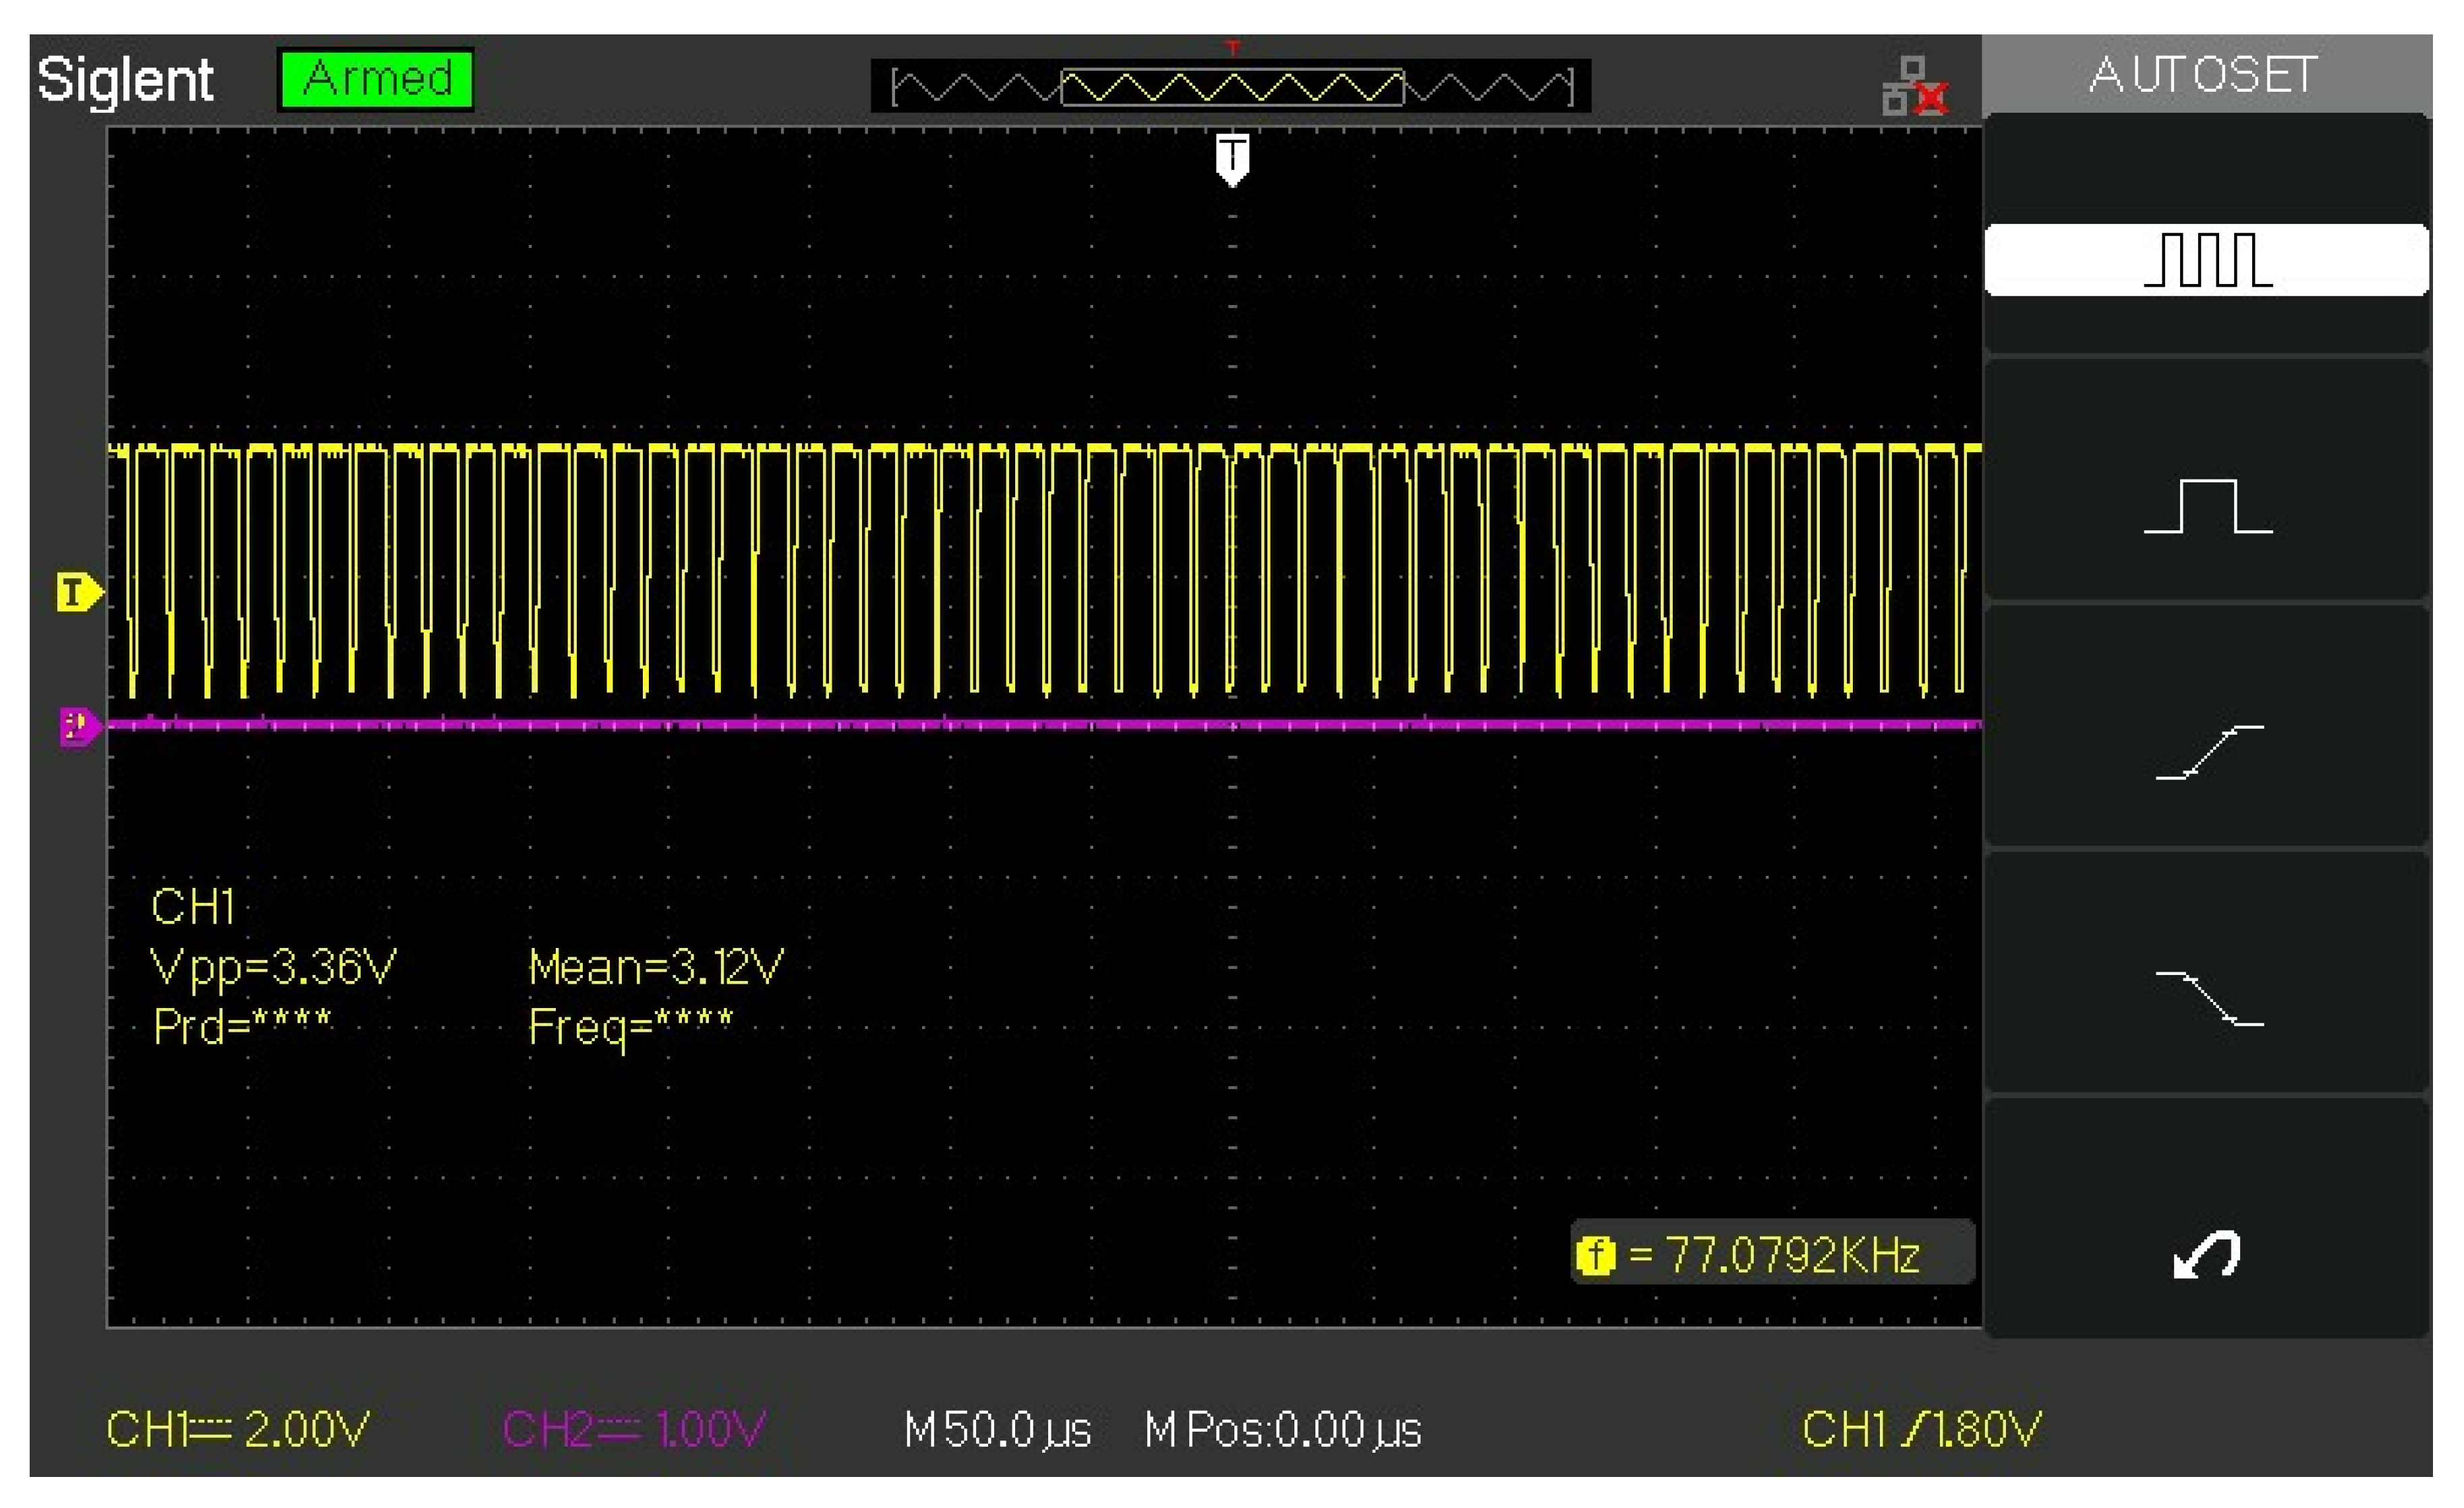
Figure 11.
Carrier signal with audio frequency at the Q3 collector. Note: Q3 operates at a frequency of approximately 12 - 20Khz.
Figure 11.
Carrier signal with audio frequency at the Q3 collector. Note: Q3 operates at a frequency of approximately 12 - 20Khz.
Figure 12.
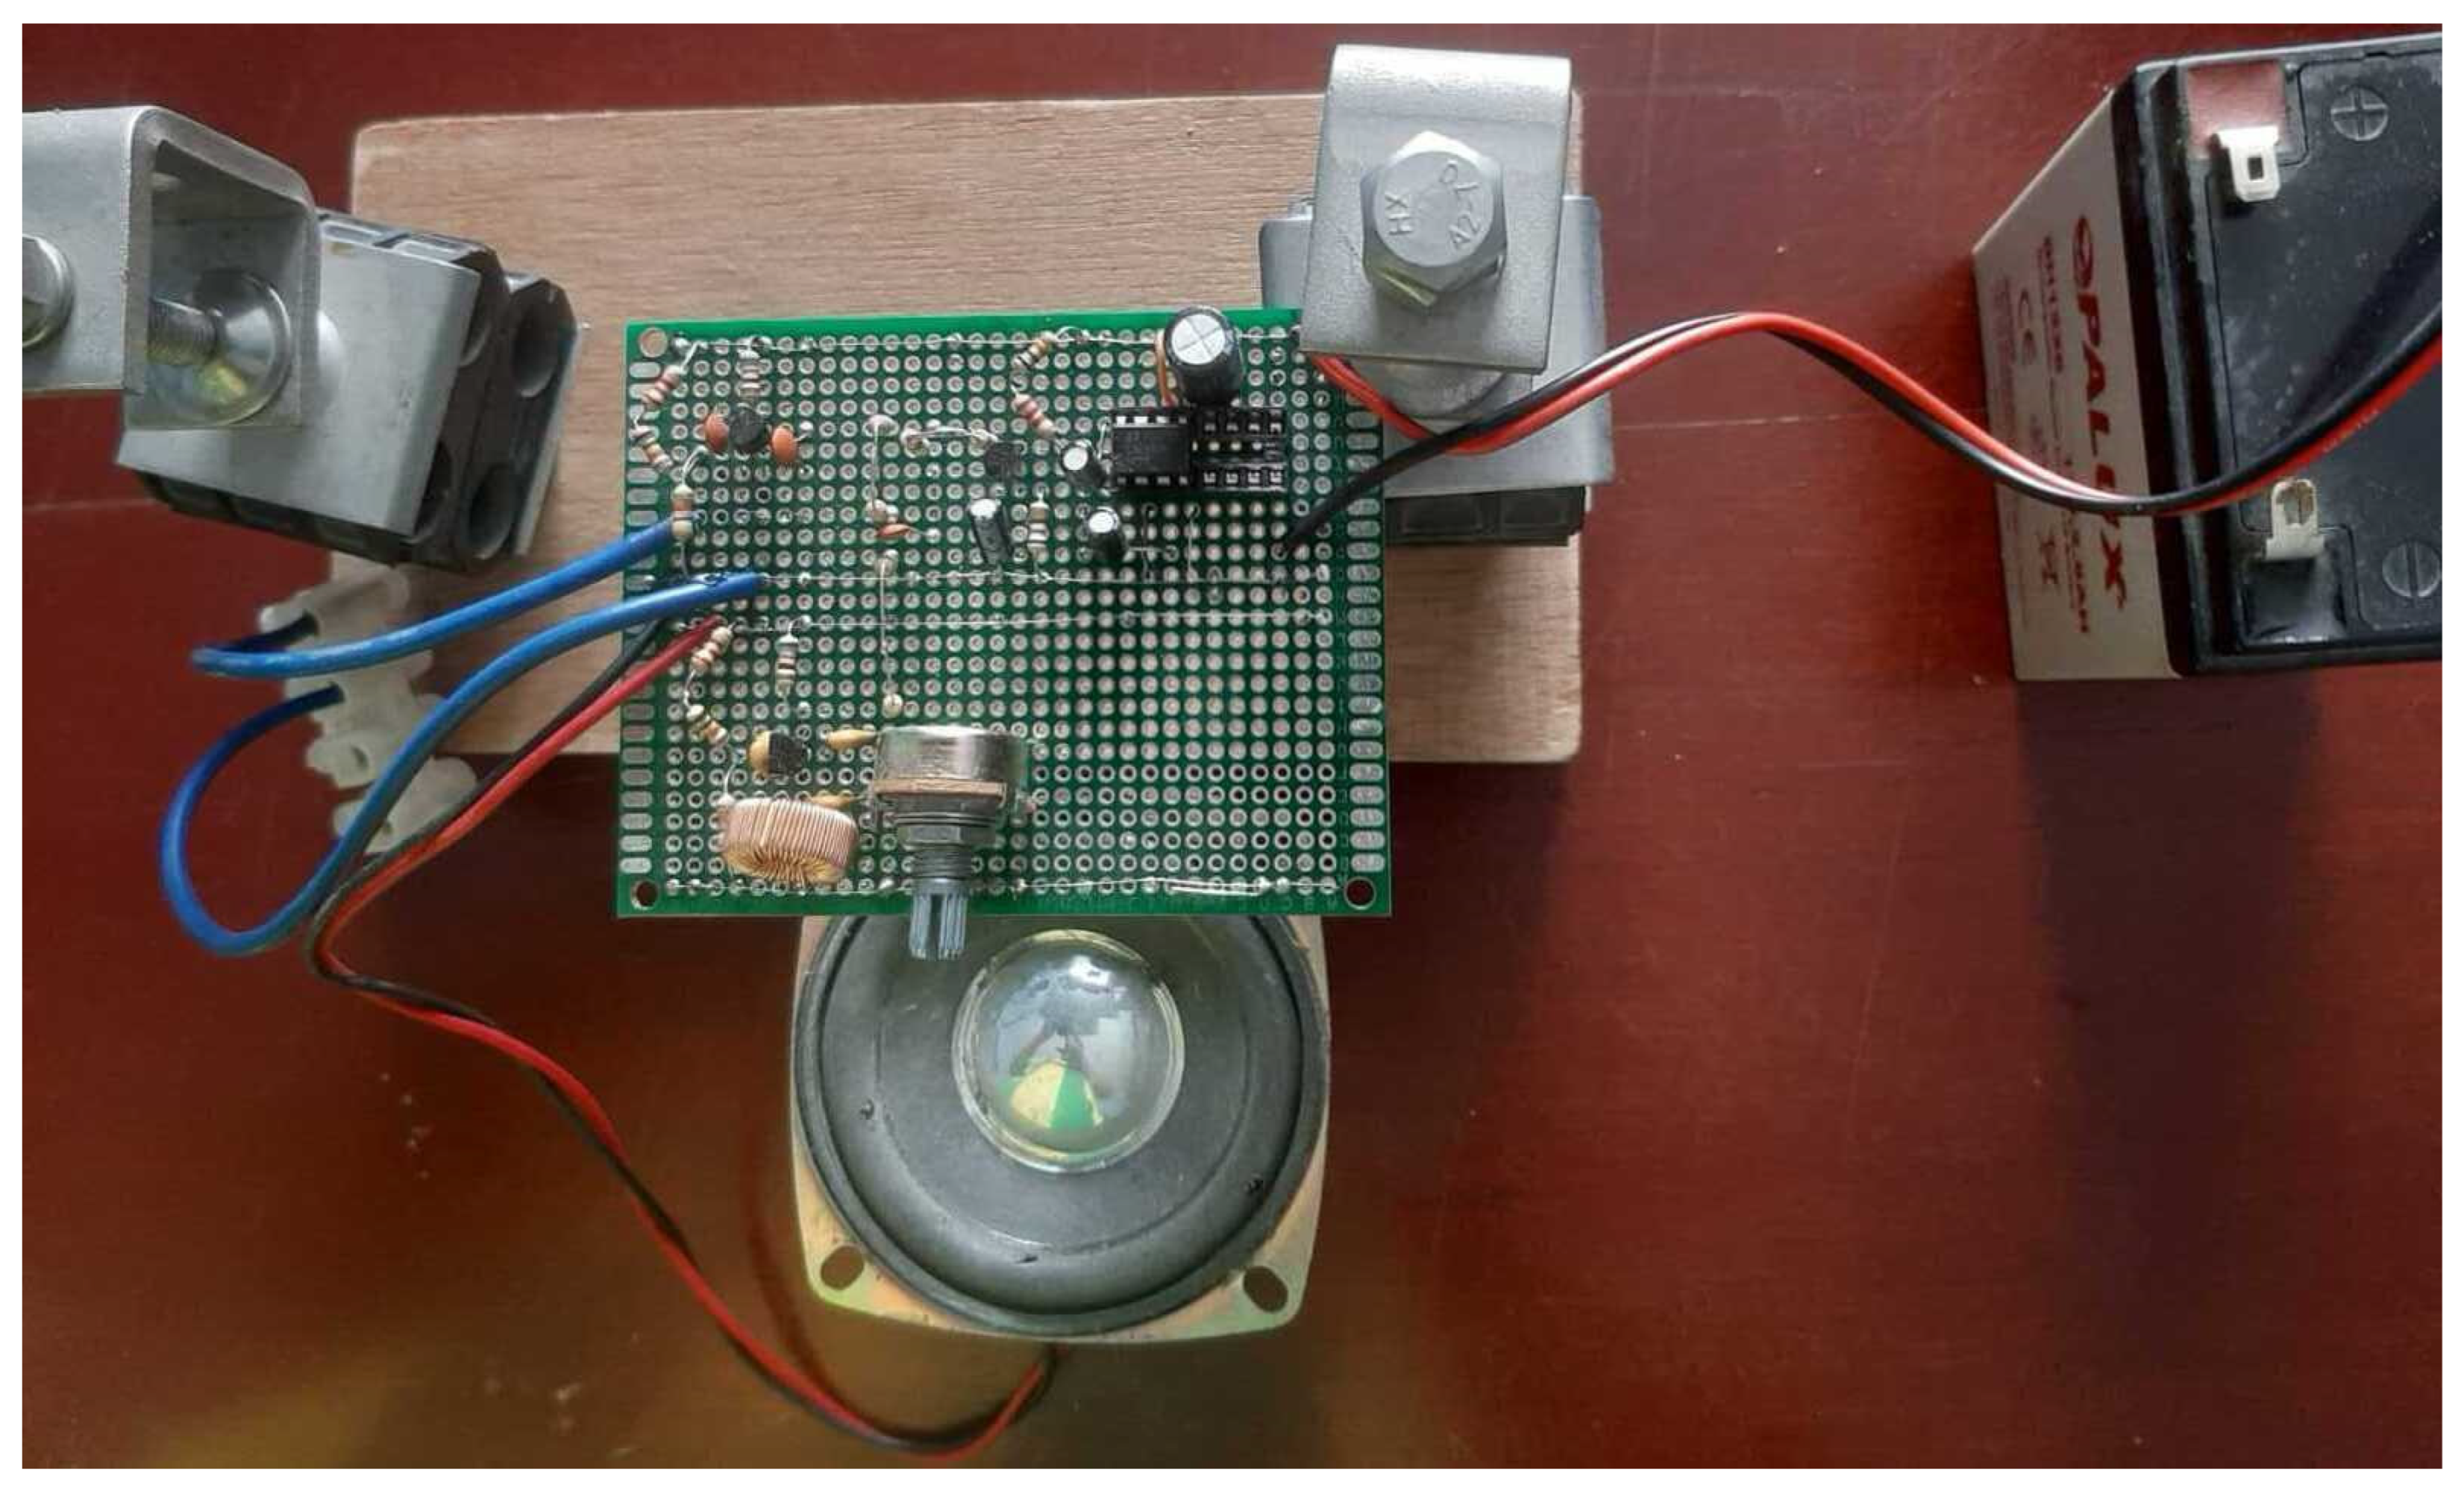
The assembled internal part of the equipment (magnetic field generator). Note: located in the control drawer.
Figure 12.
The assembled internal part of the equipment (magnetic field generator). Note: located in the control drawer.
Figure 13.
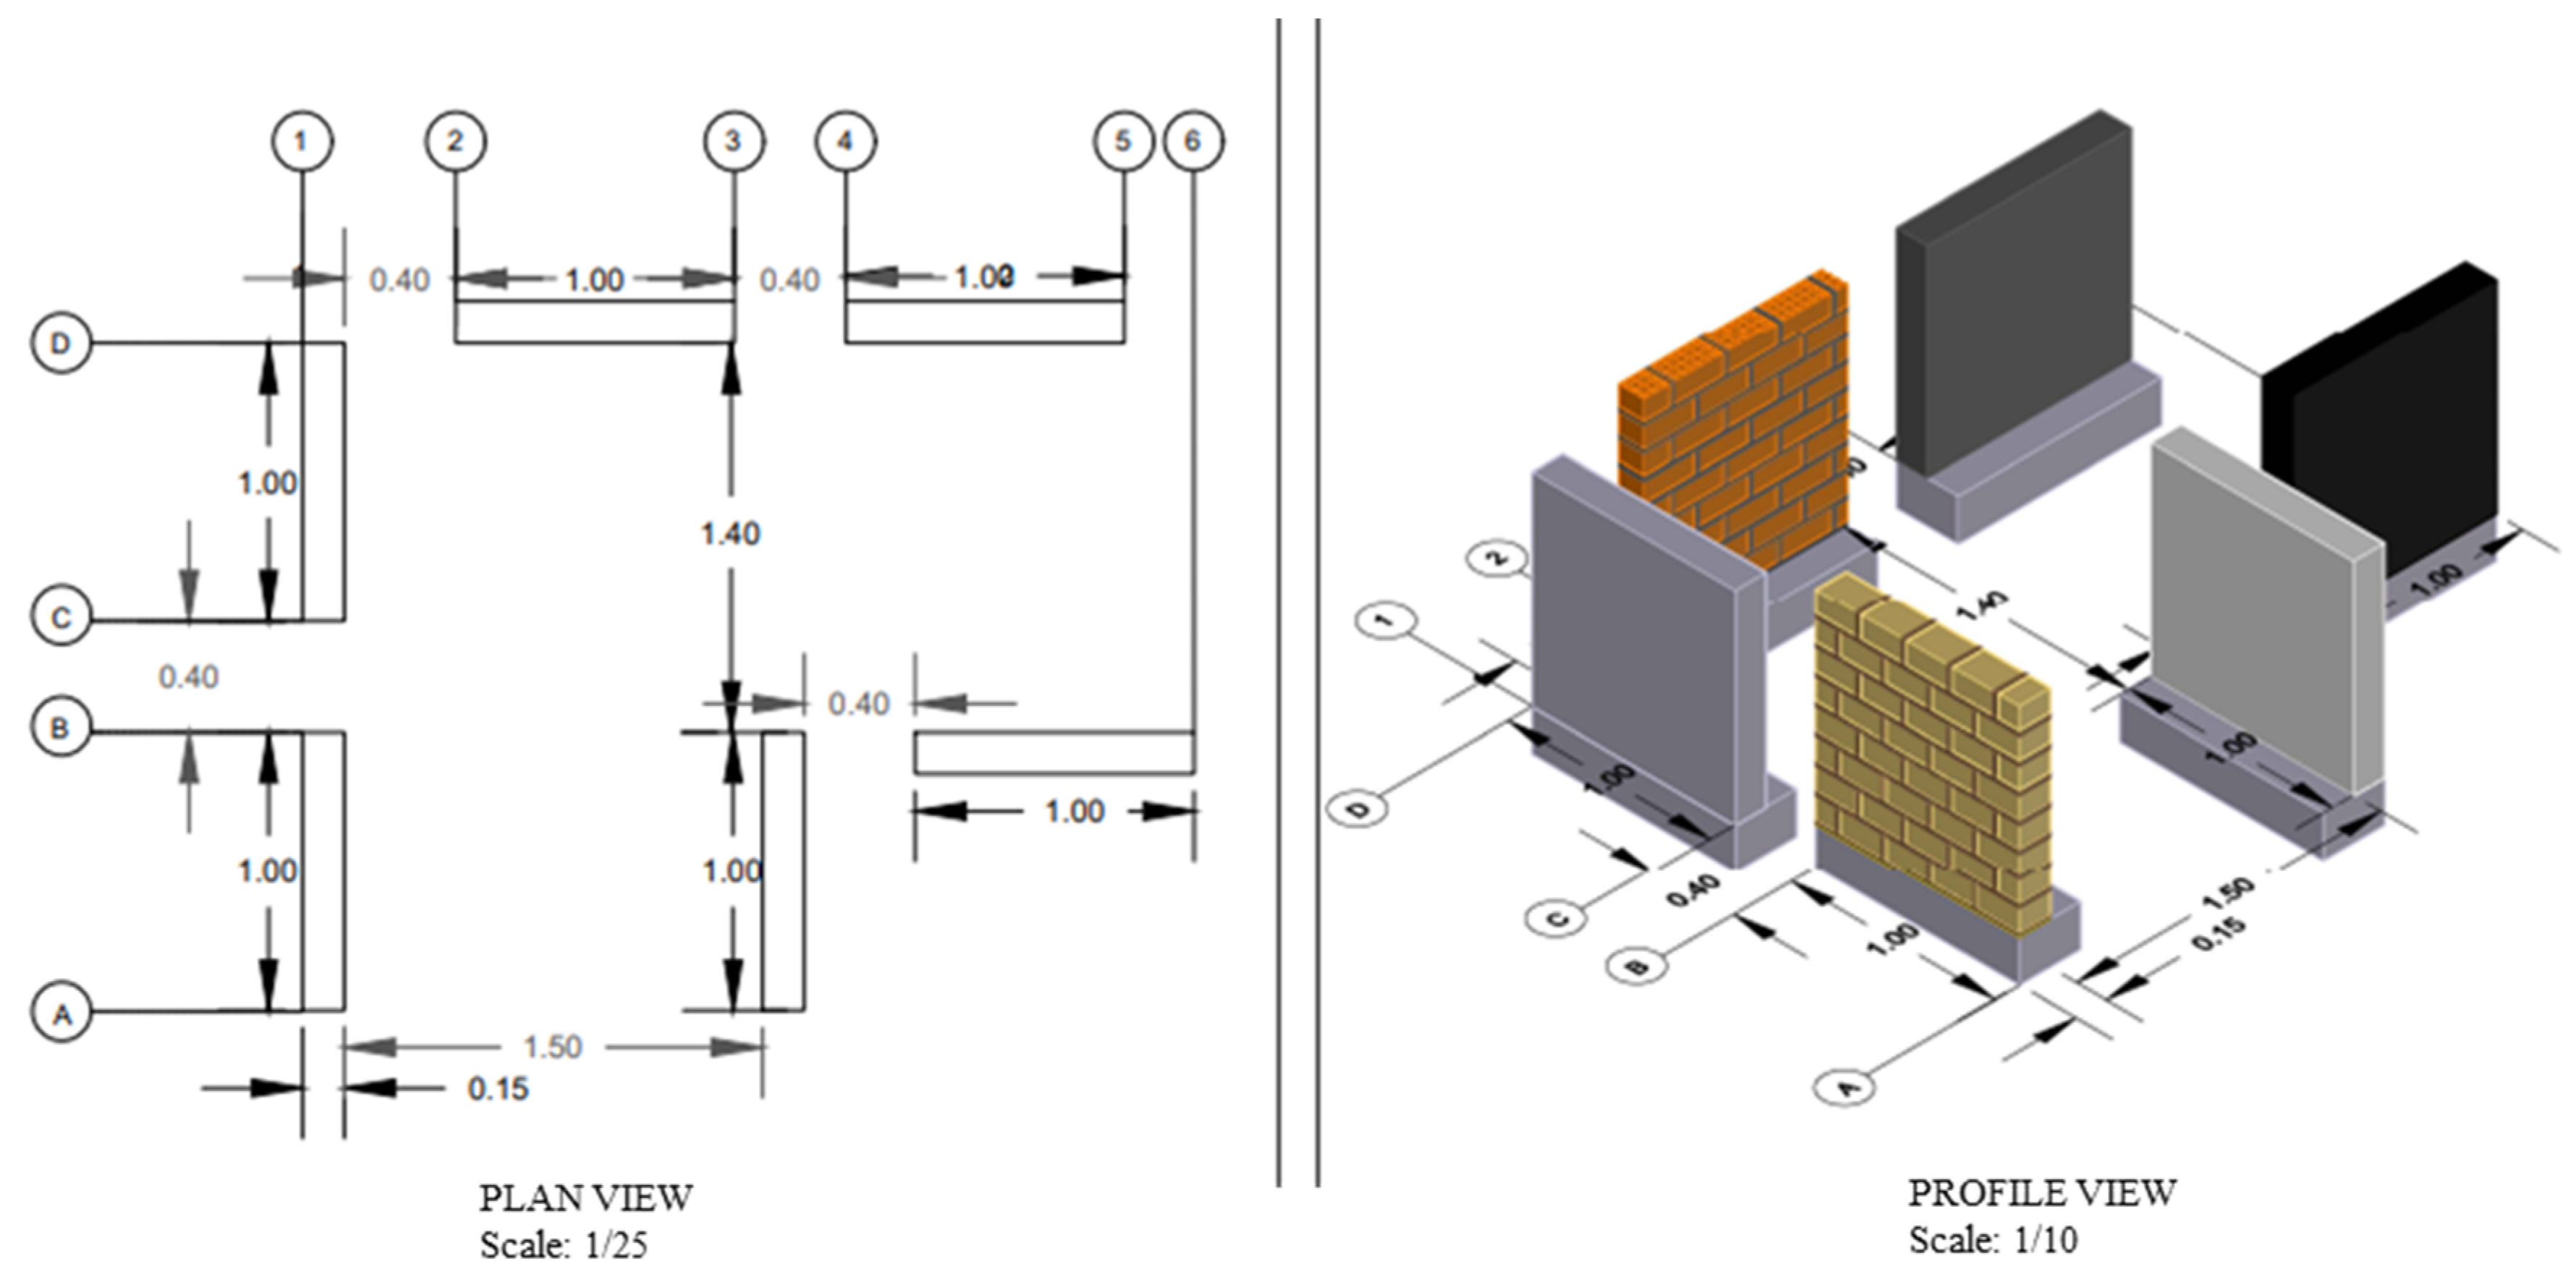
AUTOCAD design of piles of different construction materials.
Figure 13.
AUTOCAD design of piles of different construction materials.
Figure 14.
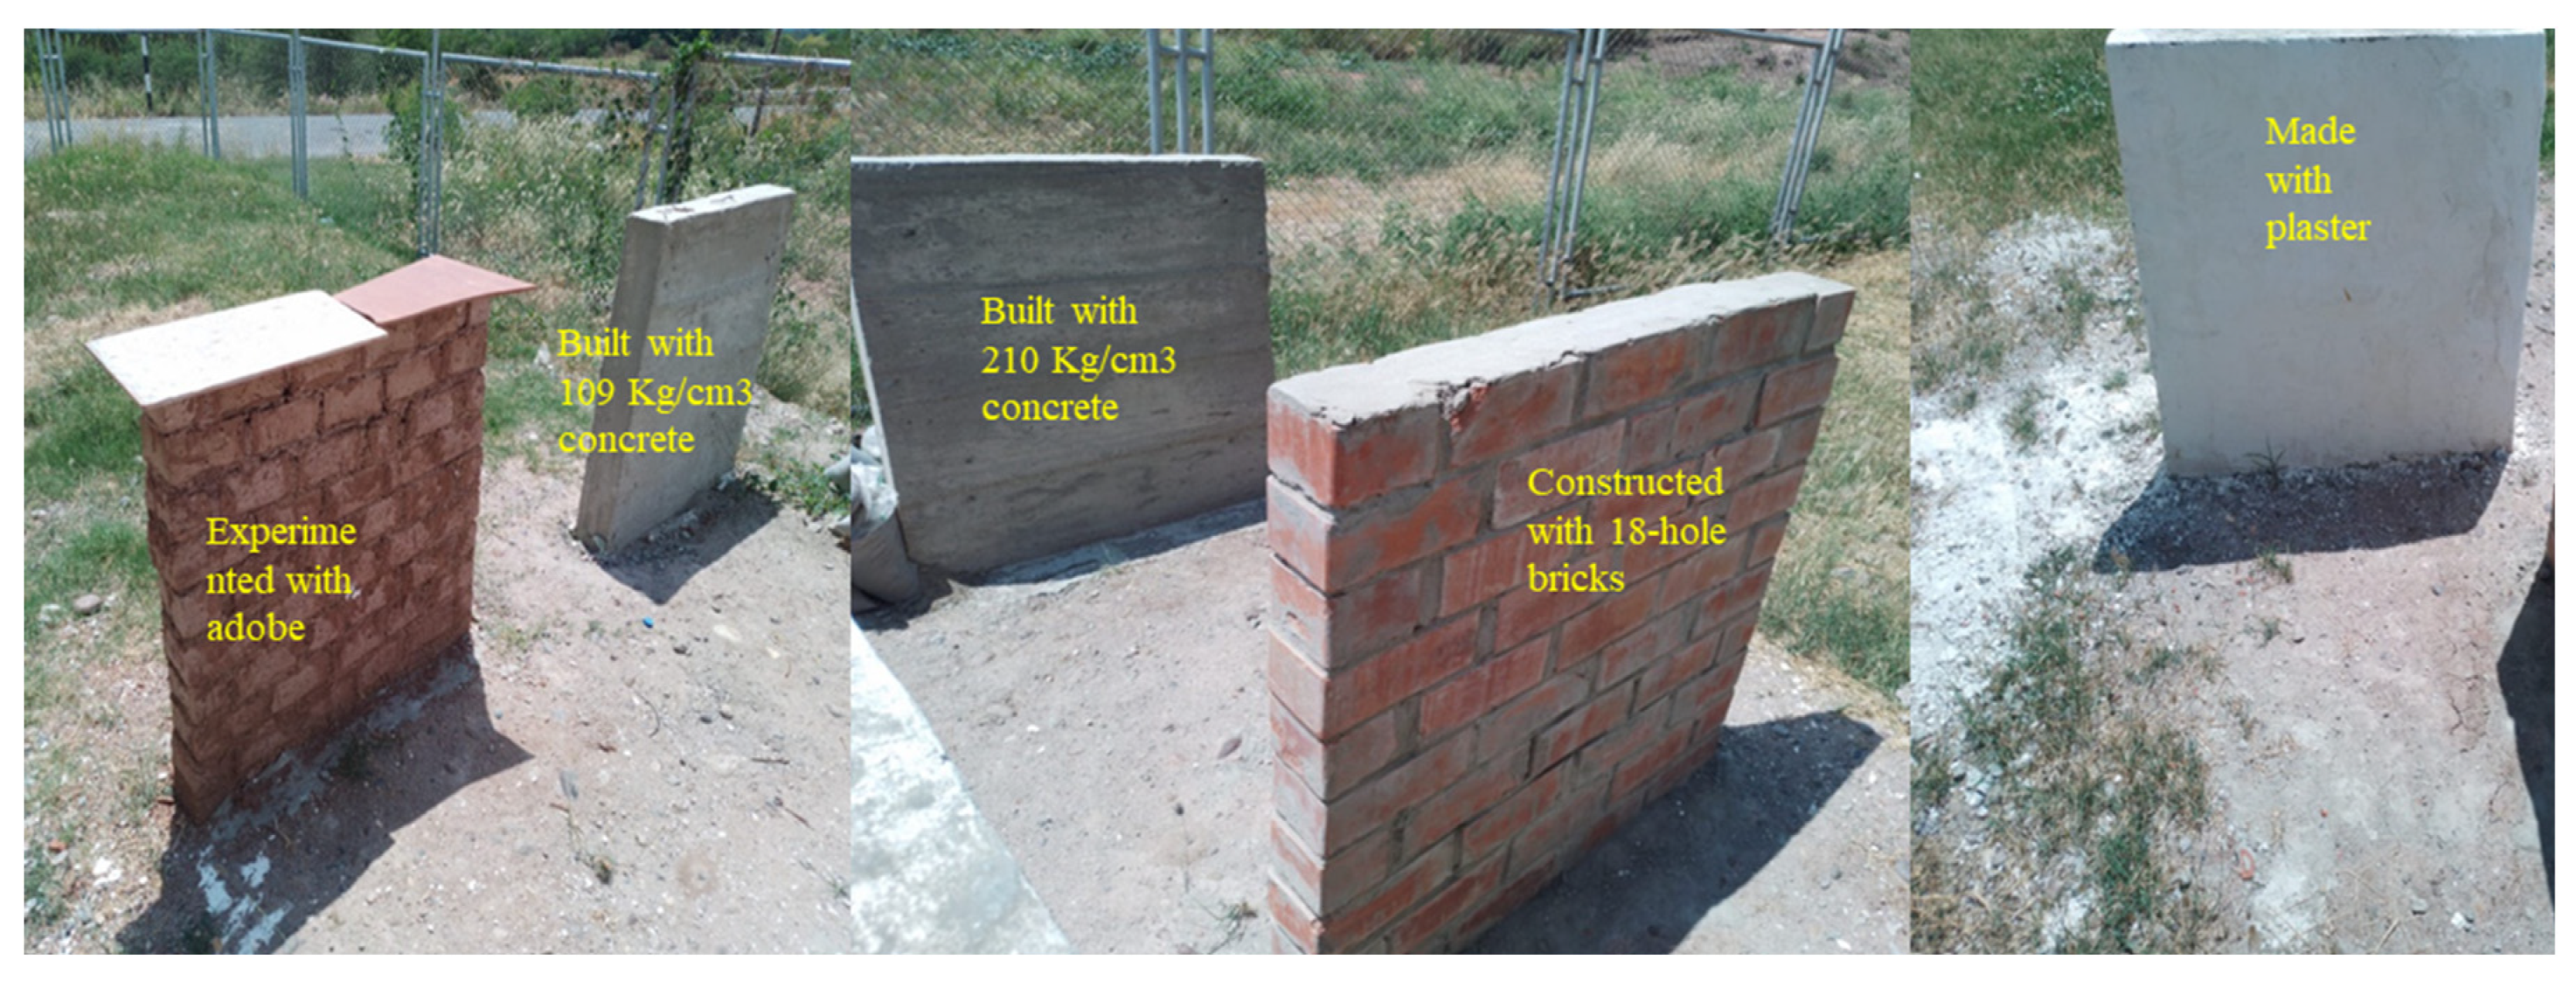
Construction of piles of different construction materials. Note: Piles were constructed with adobe, brick, plaster, concrete, and fine sand.
Figure 14.
Construction of piles of different construction materials. Note: Piles were constructed with adobe, brick, plaster, concrete, and fine sand.
Figure 15.
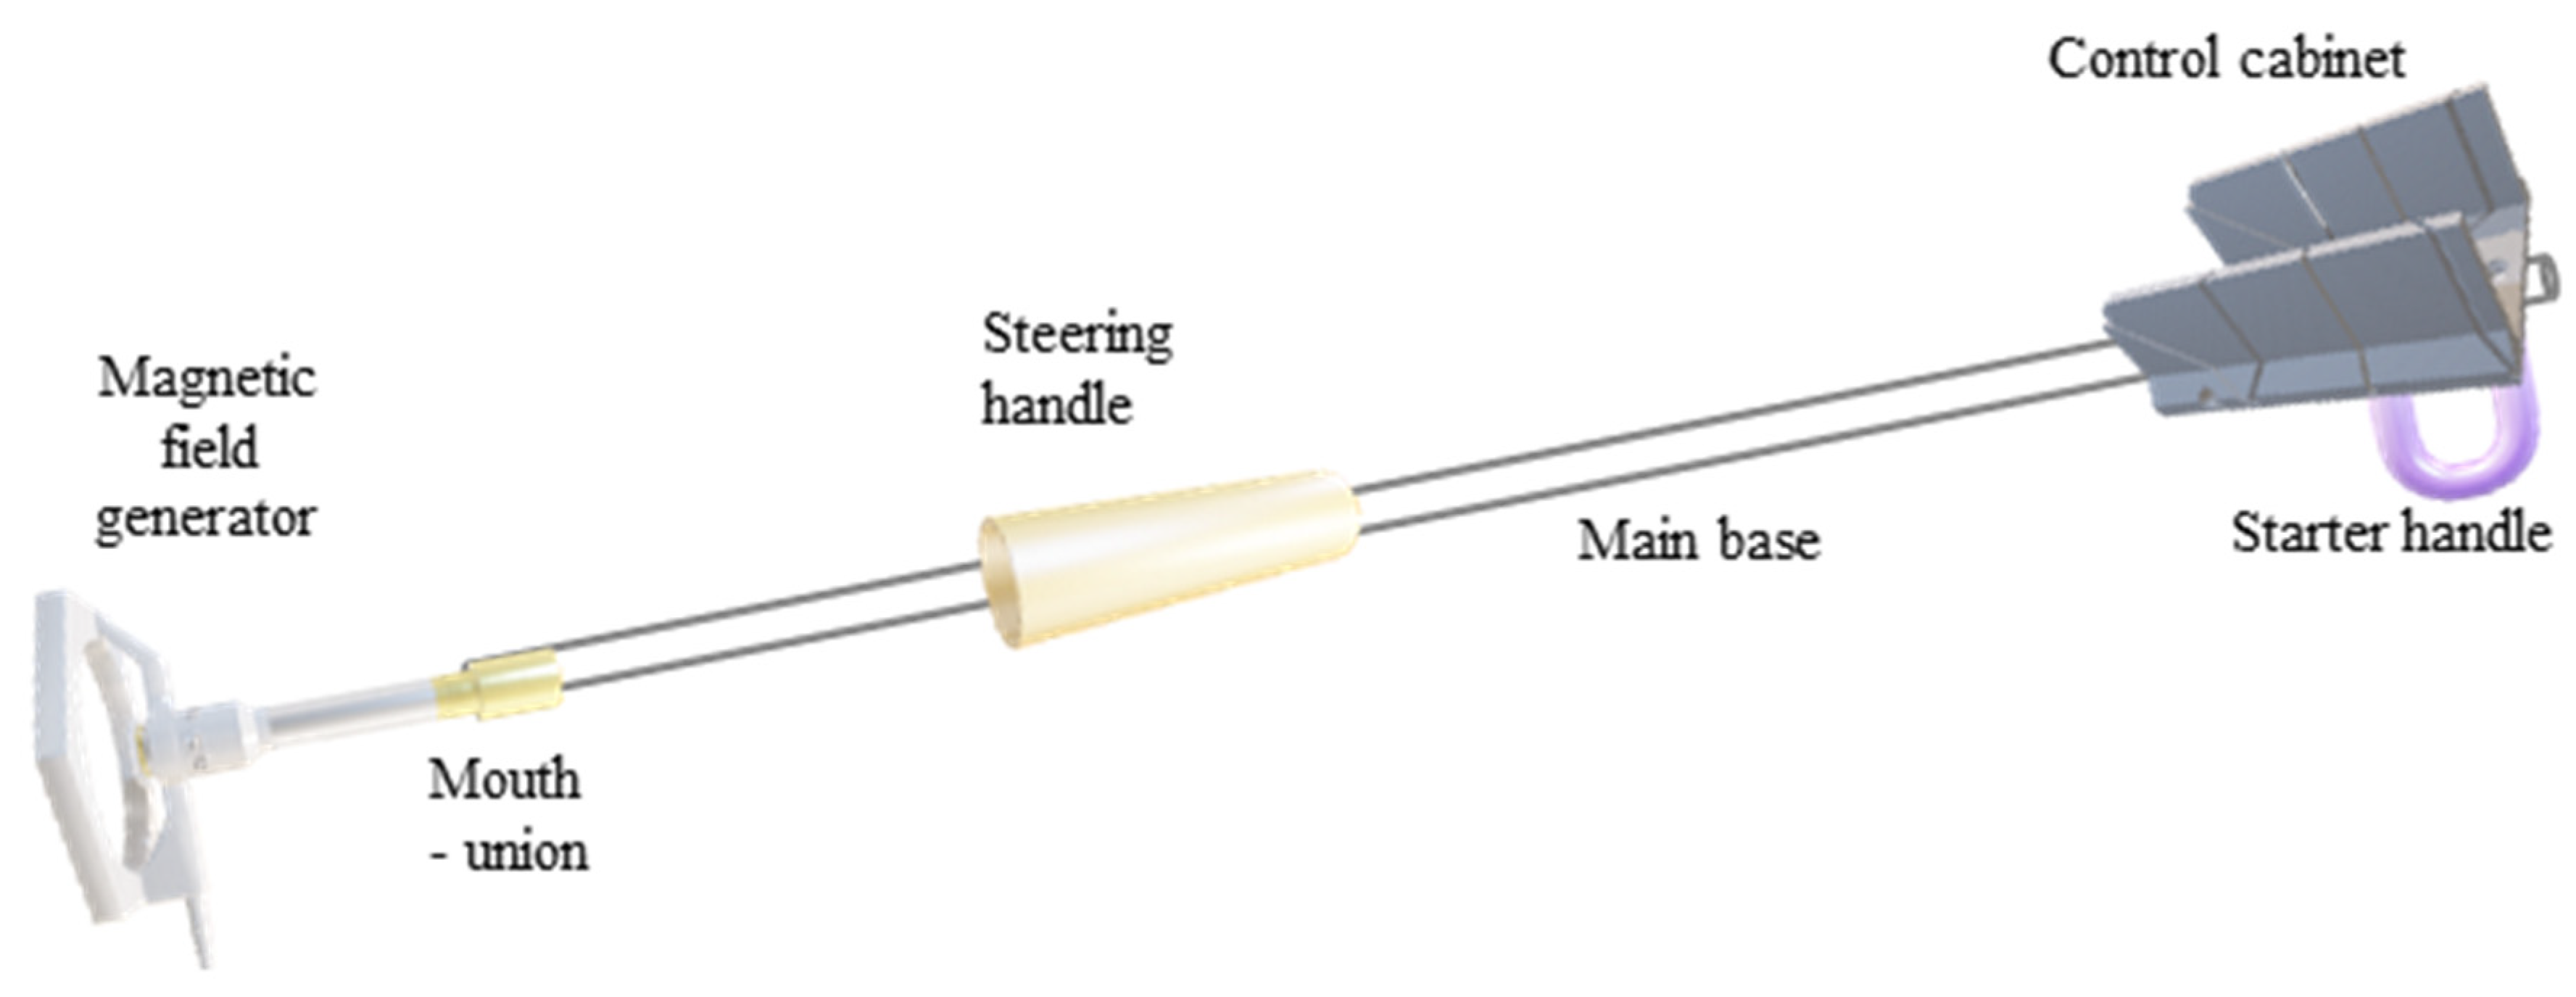
Prototype density-dependent structural failure meter. Note: Performance testing was carried out on piles constructed with adobe material, concrete of strength 210 kg/cm3, 18-hole brick, gypsum, concrete of strength 109 kg/ cm3, and fine sand.
Figure 15.
Prototype density-dependent structural failure meter. Note: Performance testing was carried out on piles constructed with adobe material, concrete of strength 210 kg/cm3, 18-hole brick, gypsum, concrete of strength 109 kg/ cm3, and fine sand.
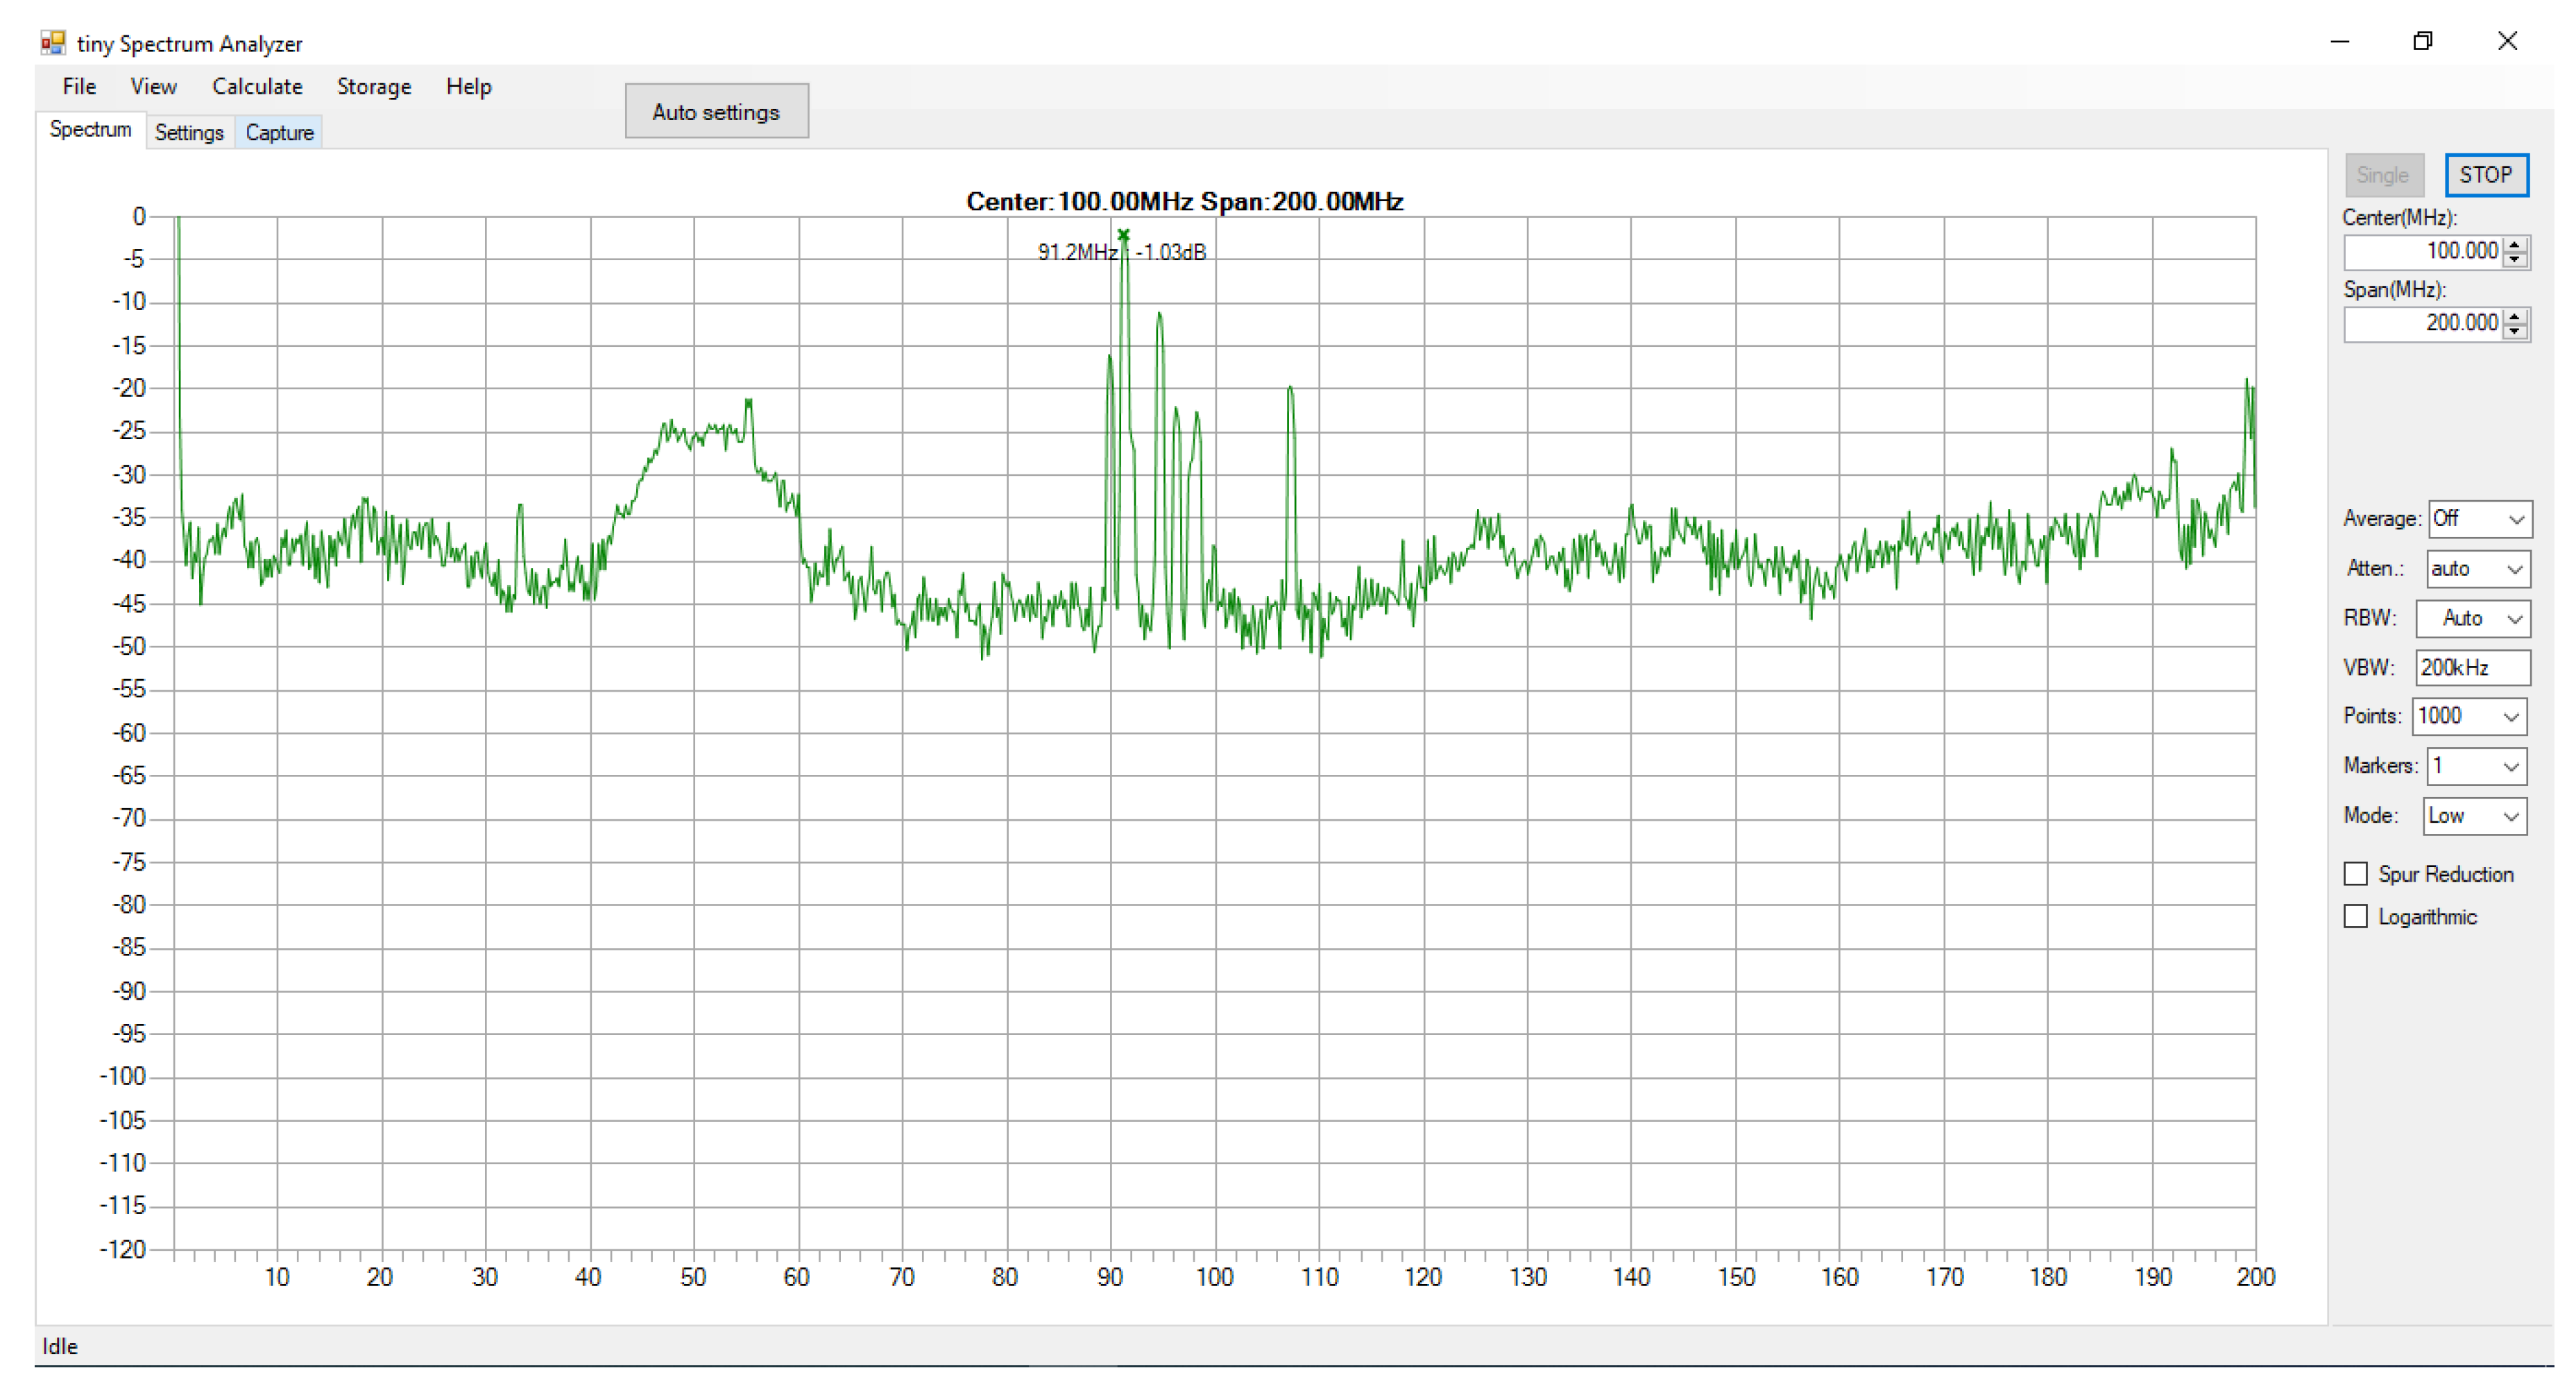
Figure 16.
The electromagnetic spectrum of the prototype is within the established frequency range. Note: The spectrum analyzer displays spectral components in a frequency spectrum of the signals present at the input, i.e., at the output of the prototype.
Figure 16.
The electromagnetic spectrum of the prototype is within the established frequency range. Note: The spectrum analyzer displays spectral components in a frequency spectrum of the signals present at the input, i.e., at the output of the prototype.
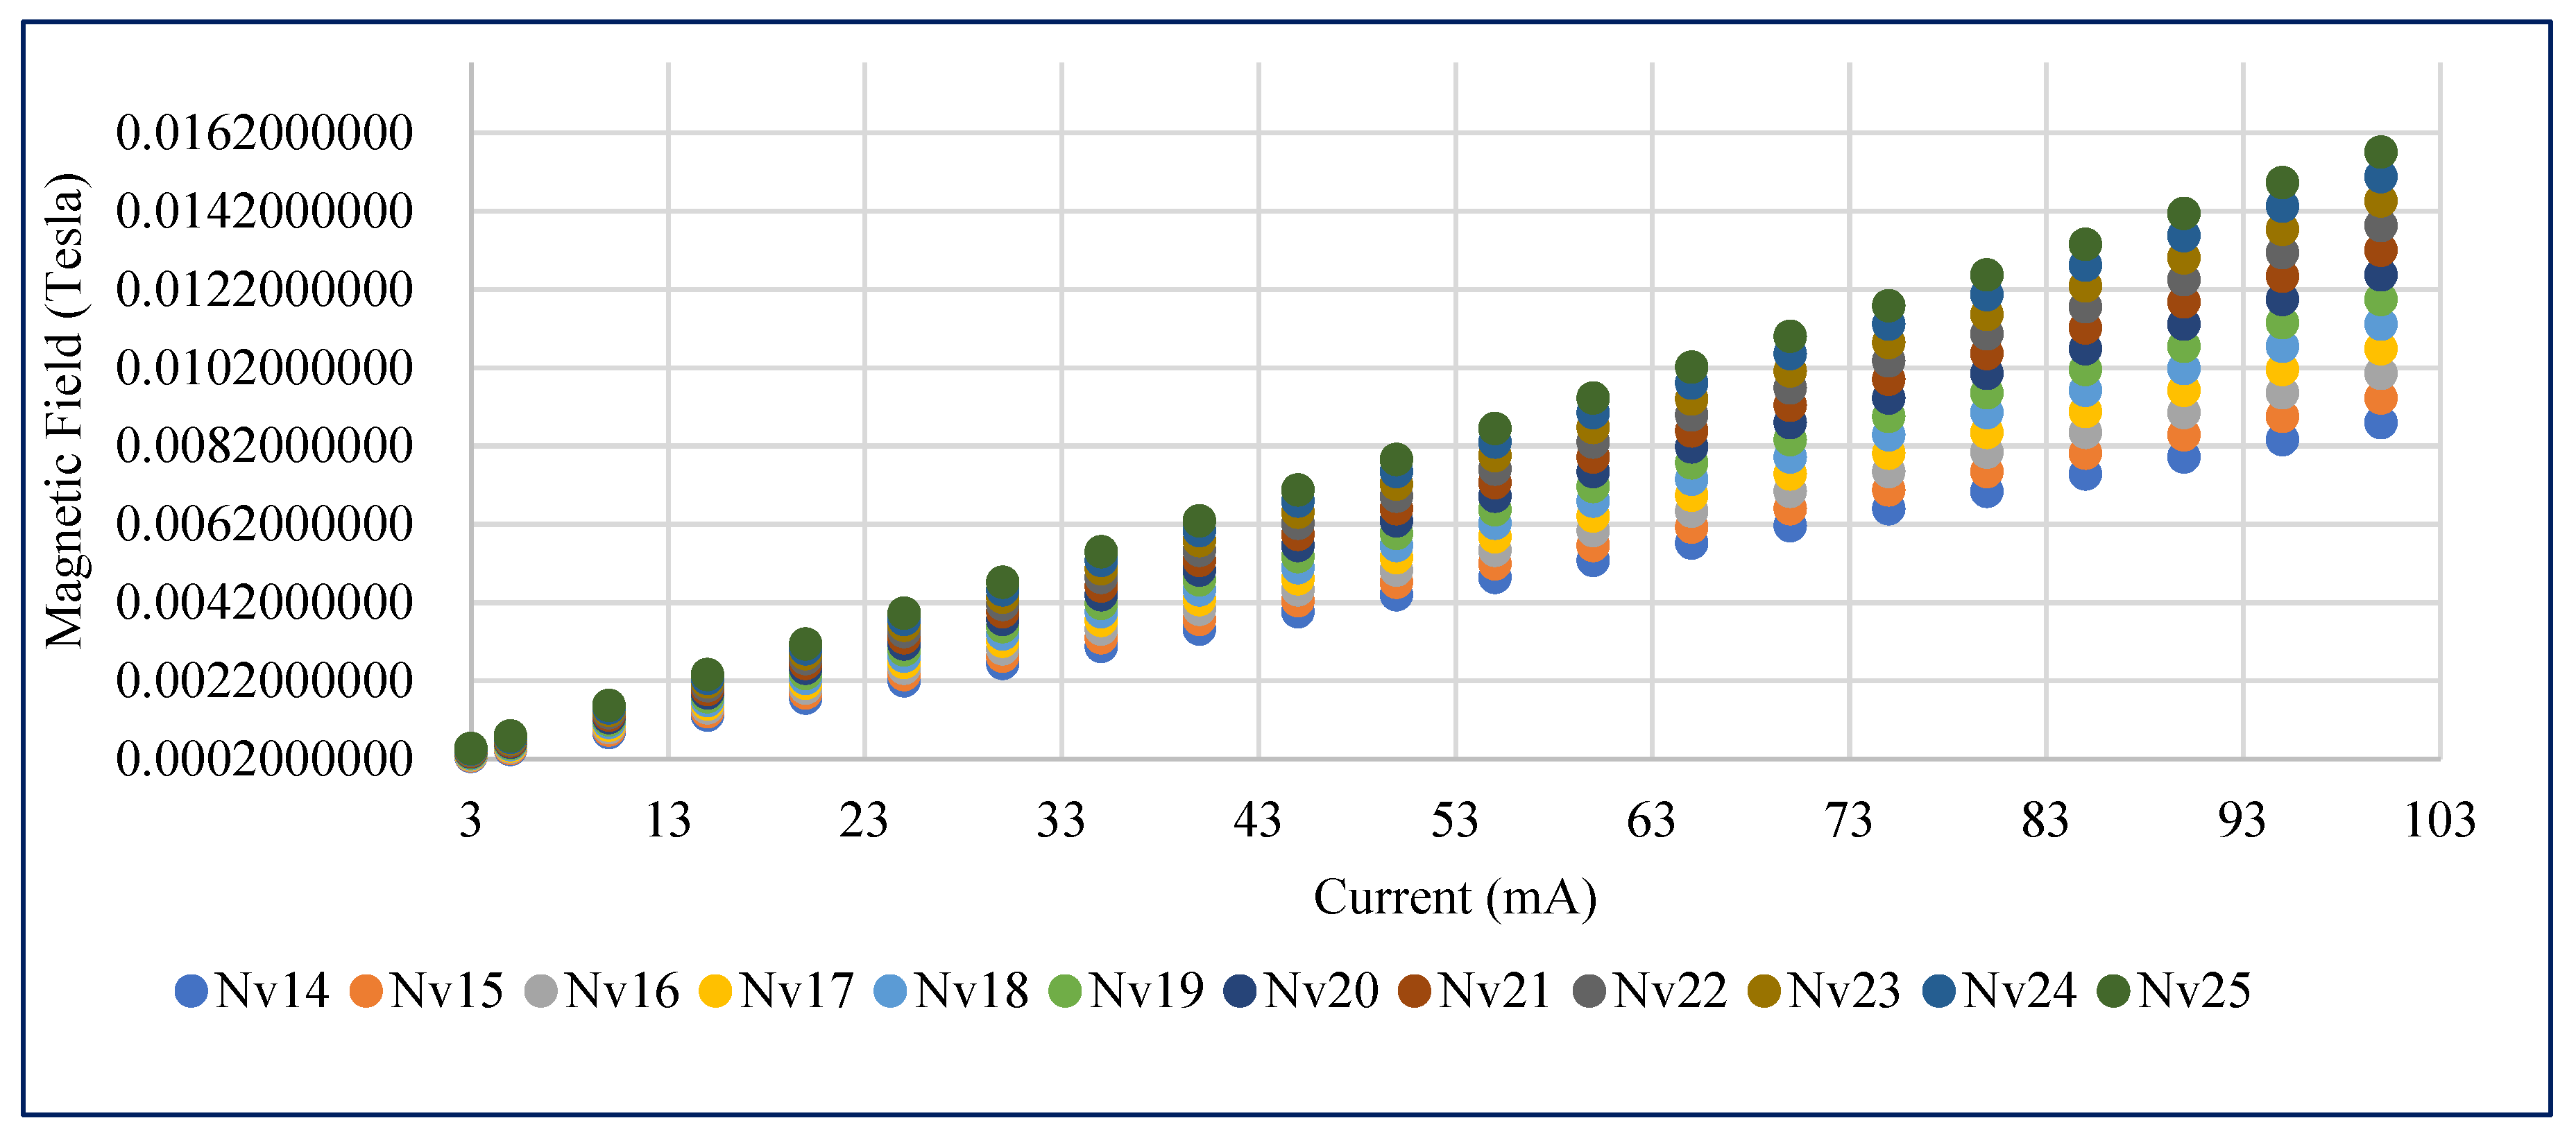
Figure 17.
Increase in magnetic field (B), as current (I) increases. Note: Nv14 - Nv25 are several turns of wire.
Figure 17.
Increase in magnetic field (B), as current (I) increases. Note: Nv14 - Nv25 are several turns of wire.
Table 3.
Density of building materials used in the study.
Table 3.
Density of building materials used in the study.
| Materials |
Density ρ (g/cm3) |
| Air |
0.0013 |
| Wood |
0.6 - 0.9 |
| Ice |
0.92 |
| Water |
1 |
| Grey sand |
1.1 |
| Sea water |
1.025 |
| Brick with holes |
1.14 |
| Cement |
1.15 - 1.40 |
| Adobe |
1.2 - 1.7 |
| Solid mud |
1.2 – 2 |
| Common fired brick |
1.3 - 1.8 |
| Compressed Earth Block |
1.6 - 2.2 |
| Solid brick |
2.1 |
| Fine sand |
2.2 |
| Concrete |
2.2 - 2.5 |
| Earth |
2.5 - 5.5 |
| Rock |
2.7 |
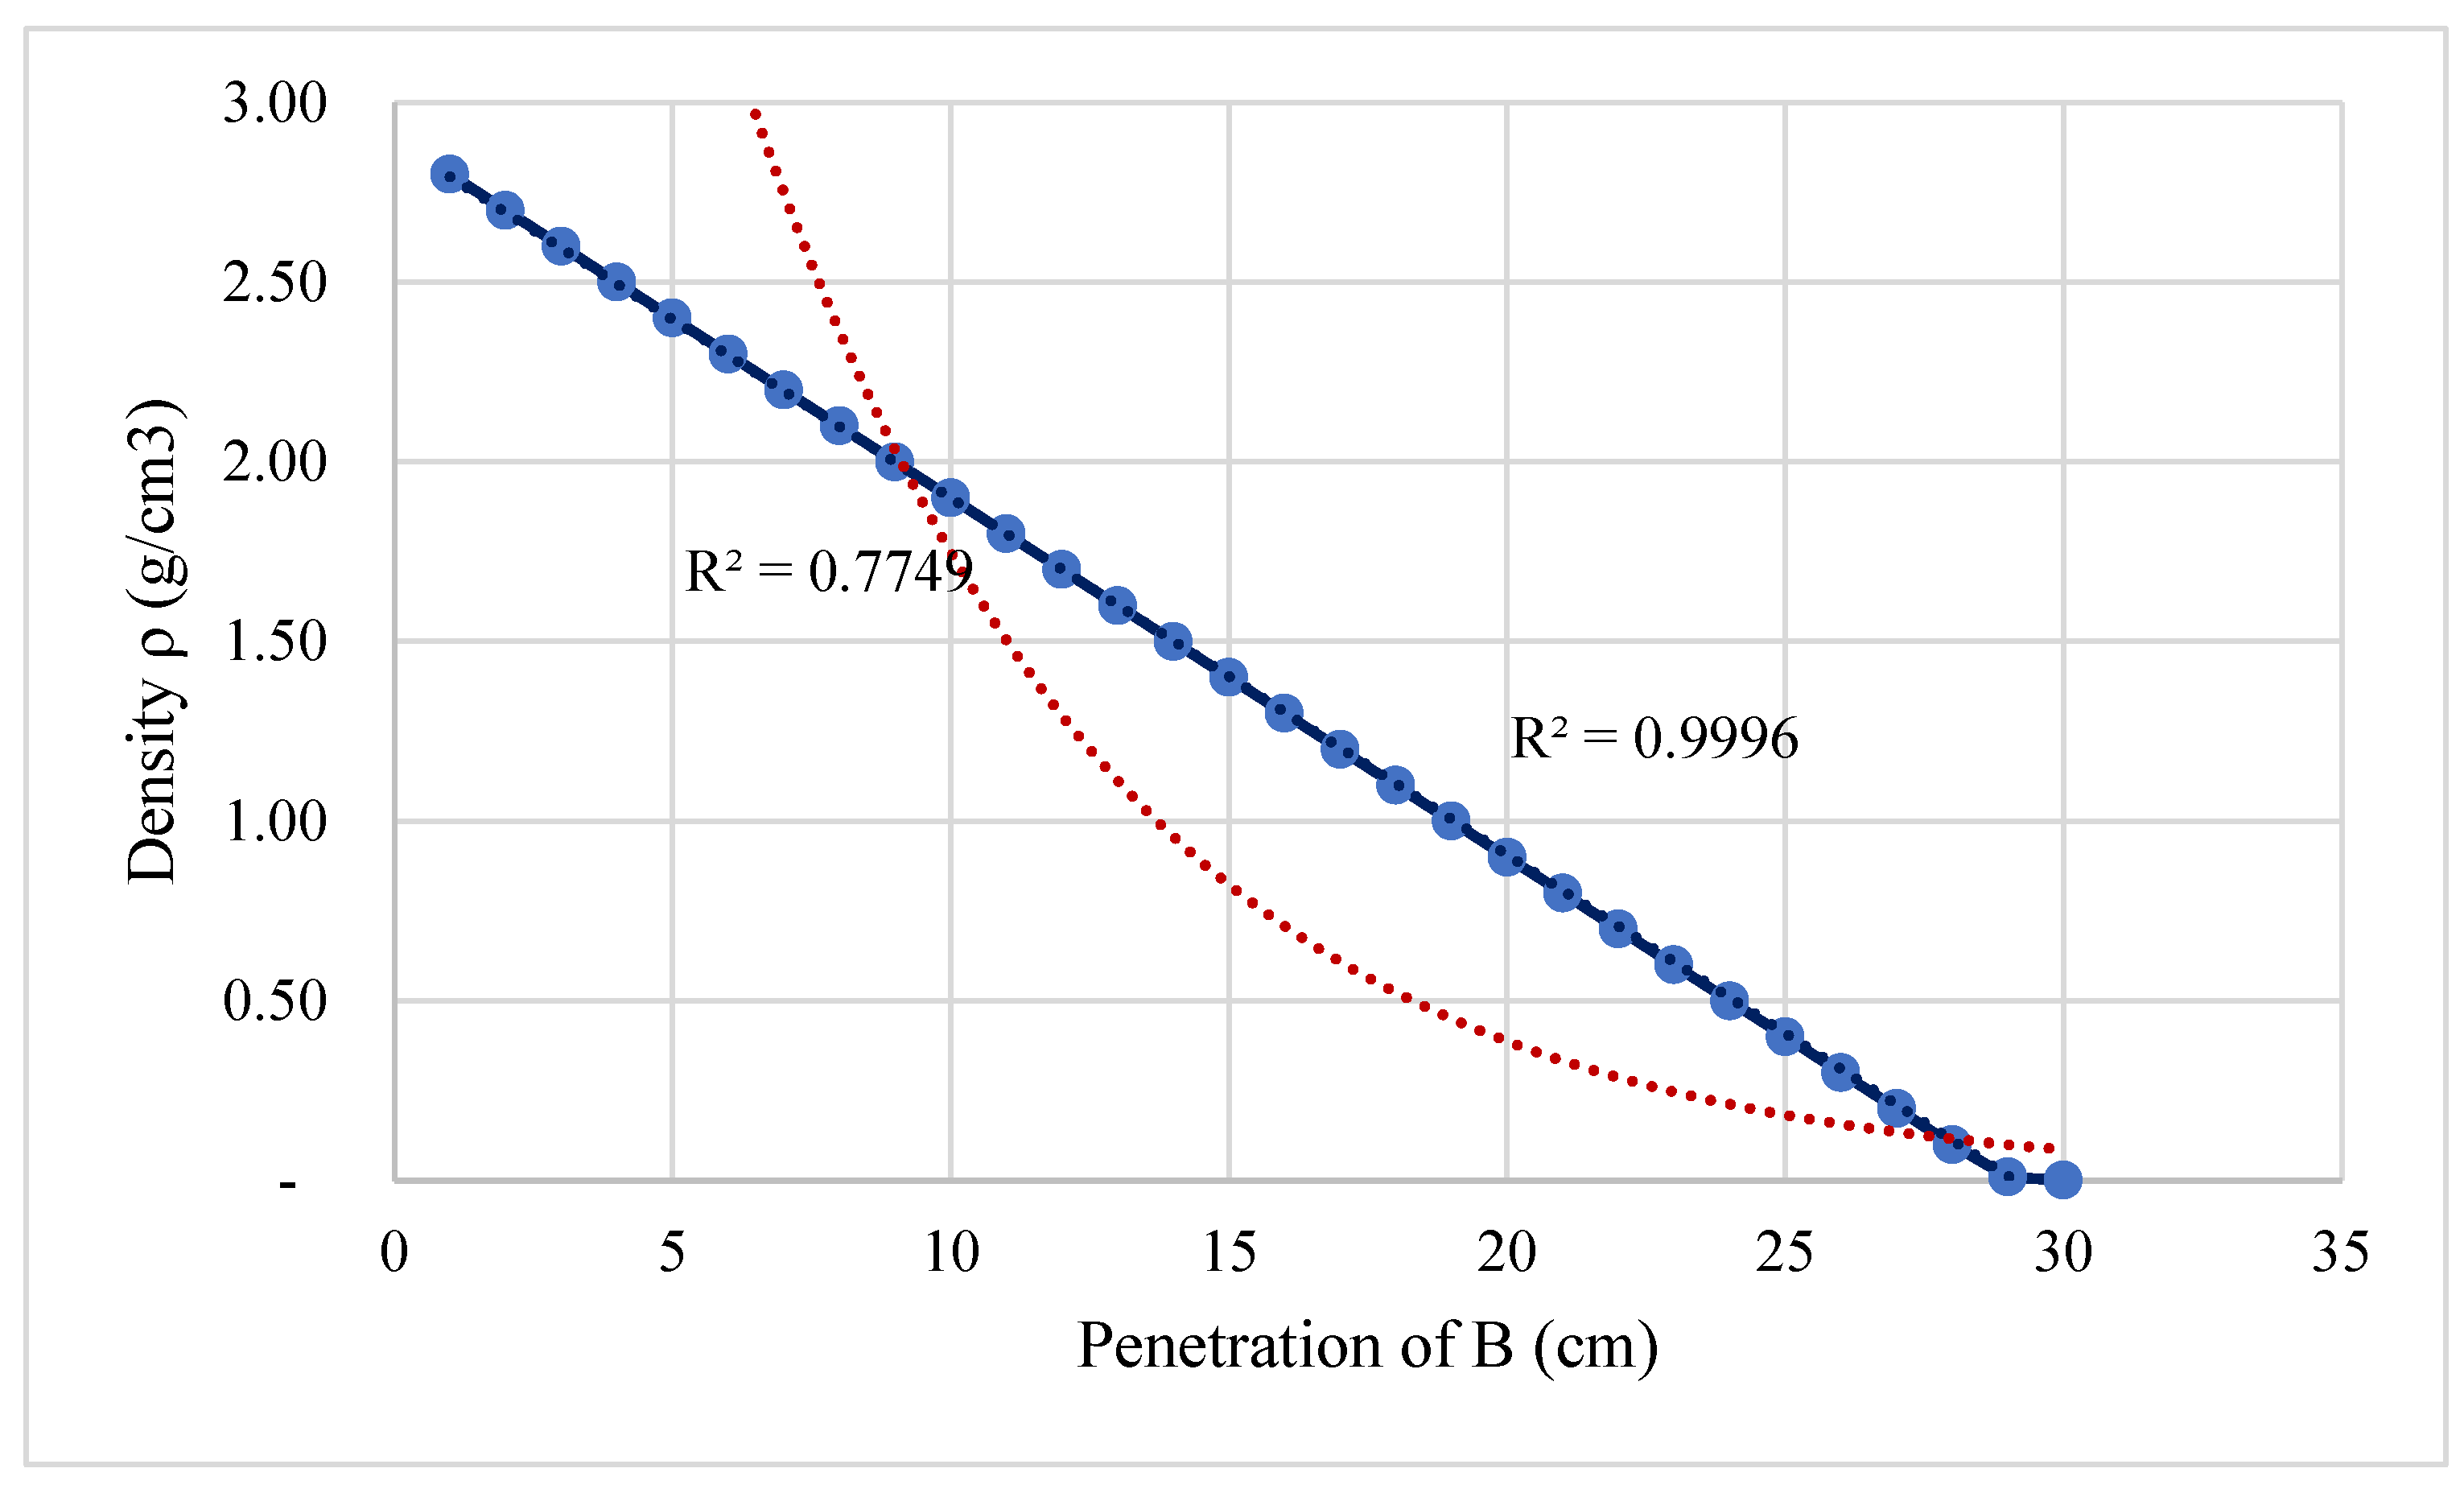
Figure 18.
Magnetic field density and penetration ratio. Note: R is the value of the coefficient that determines the range of the magnetic field versus the density of the material.
Figure 18.
Magnetic field density and penetration ratio. Note: R is the value of the coefficient that determines the range of the magnetic field versus the density of the material.
The fact of testing and checking in the field the operation of the prototype equipment made it possible to find some setting errors, i.e., calibration at an exact point where the frequency (f) of work of the equipment is optimal and, consequently, the penetration range of the magnetic field (B) in the piles regardless of their density. This check is indispensable for the improvement of the equipment.
4. Discussion
[
45] mention that “an incomplete analysis of Faraday’s and Ampere-Maxwell’s laws would allow one to infer that a time-varying magnetic field generates an electric field and vice versa”. I agree with the author because it is not always possible to completely question a mathematical law or formula for reasons specific to the study, rather it is considered as such. From there, the factor (B), depth of penetration, is improved by varying the frequency and current. [
46] conclude that the “maximum penetration intensity and power cohesion coefficient are calculated by simulating the motion paths of electrons in steel” is consistent with what these writers mentioned, since the magnetic and electrical properties equipment designed and implemented detects structural faults, as a function of depth of penetration and material density. For [
47] a “fine-tuning of the external tensor through the quantum critical point can induce significant changes providing new physical participations and technological applications and controls its optical properties” I partially reaffirm what is expressed by the essayist, since the input of the (B) generated by the equipment is adjustable to the type of material according to its thickness.
The law of conservation of mass proposed by Antoine Laurent Lavoisier (1743-1794), among others, mentions “that the scalar magnitude can neither be created nor destroyed, but it can be transformed or change its shape in space”. This law is relevant to the study because it compares the density of building materials, such as adobe, concrete, and brick. [
48] concludes that “the fundamental law of science and its equations is the matrix-vector formulation, which allows the decomposition of theorems, this being a key tool to know the properties of primary and secondary preservation.” I consider that formulas, laws, theorems, and theories allow to scientifically calculate the mechanical properties of the material.
According to [
24]The vulnerability of dwellings is related to the characteristics of the soil, the location, and the slope on which they are situated”. This conclusion is related to the following [
18], that “the use of natural materials in construction is related to a more sustainable style of living”. [
30], that common failures in structures are generated by inadequate concrete strength, insufficient bonding, excessive vibration, and torsional stress. Also, [
17] determined the “correlation that exists between the pathological analysis and the useful life of confined masonry houses”, also [
31] refer that structural pathology studies the irregular behavior of a structure or its elements, and to that, [
35] that the safety of constructions is the task of everyone such as the state, the executors of works, the legislators, the designers, and the owners. These quotations are coherent with the development of the device because in one way or another, it solves the problems exposed by many essayists. Furthermore, this equipment has the advantage that it does not damage the walls, columns or ceilings of houses when measuring density. It provides the relationship between the penetrating power of the magnetic field and the consistency of the material, which means that the magnetic potential is proportional to the viscosity of the material.
5. Conclusions
The prototype design is not so complex because simple formulas from Maxwell and others were used. With the help of the circuit and plane simulator, it provided us with early results as seen in
Figure 5 and
Figure 13. The sinusoidal signals in
Figure 7 show a 180° phase shift within 85 µs of the start time. Thus
Figure 8 indicates the colored possessions of the signal; while
Figure 9 and
Figure 11 show a modulated signal at the audio frequency less than 20 kHz, which is the mixture of two previous parameters.
Table 1 provides a correlation between the calculated inductance measured with RCL (= 1.0000), RCL meter and software (= 0.9998), and the mathematical and computer program (= 0.9998).
Figure 6 provides the trend of electromagnetic forces as a function of the amount of spirals and their diameter. That is, as the number of turns of the wire (N) increases, the magnetic field (µT) increases.
Figure 10 shows the electromagnetic spectrum of the prototype in normal form, which makes its application sustainable and very useful.
For the assembly, similar antecedents were considered, therefore
Figure 15 details the external parts of the prototype, also
Figure 12 indicates the internal content of the control drawer, and the architectural plans of piles established in
Figure 14 were built as shown in
Figure 15, with adobe material, concrete of resistance 210 and 109 kg/cm³, respectively, a brick of 18 holes, plaster, and fine sand. The different densities established in
Table 3 have been determined. The setup of the equipment is to point perpendicular to the wall, column, or ceiling between the piles, the distance of the receiver is placed (> 30 cm), similar thickness that has the standard structures, as the magnetic field penetrates to an object, varies the frequency in kHz, this is the method of deducing from the general state of the property.
Figure 18 shows the correlation coefficient R = 0.9997 as very high, i.e., the lower the density, the greater the penetration range of (B).
The refinement of the equipment is developed in the laboratory at 95% using electronic devices such as a digital oscilloscope, frequency meter, spectrum analyzer, voltmeter, and RCL meter, the accuracy readjustment with pile testing is at 98%. I claim that the more current is fed to the coil, the electromagnetic field increases. As the number of turns increases, it also increases reciprocally, as shown in
Figure 17. In general, constructions tend to deteriorate due to any of the causes mentioned in this study. For this purpose, a prototype of easy use is presented, free of dangers for the operator and the environment observable in
Figure 4 and
Figure 15, its cost is modest, it is autonomous of physical destruction, its advantage is fast, appropriate, and reliable, and it is a different innovation in engineering compared to equipment detailed in
Table 1.


