Submitted:
13 June 2024
Posted:
14 June 2024
You are already at the latest version
Abstract
Keywords:
1. Introduction
1.1. Building Energy Modelling
1.2. PV Systems in the Urban Environment
1.3. Aims and Paper Structure
2. Urban Building Energy Modelling
2.1. Data Acquisition
2.2. Calibration and Validation
2.3. Weather Data and Microclimate Modelling Tools
2.4. Urban Building Energy Modelling Tools
3. Effect of Photovoltaic Systems on the Indoor and Outdoor Environment
3.1. Effect of PV Systems on the Indoor Environment
3.2. Effect of PV Systems on the Outdoor Environment
4. Summary and Conclusions
- A bottom up UBEM approach is well identified in the literature; however, the complexity level of the modelling needs to be carefully assessed; on one hand, a detailed UBEM can lead to a precise simulation; on the other hand, high complexity requires a lot of time for modelling and simulation.
- Poor data acquisition, especially in what concerns non-geometric data, can lead to large errors in the results; calibration and validation of the model, despite complexity, contribute to mitigate the differences obtained.
- Urban heat islands can influence building energy loads; to predict the impact, the coupling between UBEM and radiation and convective models must be considered.
- With the integration of PV panels in building envelopes, in addition to electricity generation, the daylight and energy performance are affected; the reviewed studies are not conclusive about the relationship between these variables.
- The relation between PV systems and indoor thermal and visual comfort must be studied at building level.
- Due to lower thermal mass, PV cell temperatures increase faster than the surrounding urban surface temperatures, due to the solar radiation; consequently, PV efficiency decreases and can promote an increasing in outdoor temperature and building cooling loads; however, the studies do not show consistent results.
- PV systems have higher mean radiant temperatures than urban shades, due to lower light reflectance at higher wavelengths; therefore, PV shades can lead to a lower outdoor comfort level than regular shades.
References
- “Energy Independence and Security”. energy.gov. https://www.energy.gov/eere/energy-independence-and-security (accessed 21 November 2023).
- L.C. Hollaway, “19 - Sustainable energy production: Key material requirements,” in Advanced Fiber-Reinforced Polymer(FRP) Composites for Structural Applications (Second Edition). Ed. J. Bai, 2013, Woodhead Publishing. pp. 675-701.
- “Solar Energy”. seia.org. https://www.seia.org/initiatives/about-solar-energy (accessed 21 November 2023).
- “RENEWABLES 2023 GLOBAL STATUS REPORT - RENEWABLES IN ENERGY DEMAND,” REN 21, 2023. Accessed: 22 November 2023. [Online]. Available: https://www.ren21.net/wp-content/uploads/2019/05/GSR2023_Demand_Modules.pdf.
- “Solar Cities: 21 solar solutions for the city energy transition,” Solar Power Europe, 2023. Accessed: 22 November 2023. [Online]. Available: https://fedarene.org/wp-content/uploads/2023/06/1423_SPE_Energy_Cities_report_03_6c81e208b0.pdf.
- IEA, “Empowering Cities for a Net Zero Future,” IEA, Paris, 2021. Accessed: 22 November 2023. [Online]. Available: https://www.iea.org/reports/empowering-cities-for-a-net-zero-future, License: CC BY 4.0.
- “Energy and smart cities”. European Comission, energy.ec.europa.eu. https://energy.ec.europa.eu/topics/research-and-technology/energy-and-smart-cities_en (accessed 22 November 2023).
- IEA, “Buildings,” IEA, Paris, 2023. Accessed: 22 November 2023. [Online]. Available: https://www.iea.org/energy-system/buildings.
- A. Symons. “The EU green buildings plan aims to slash emissions - but this European country isn’t happy”. euronews.com. https://www.euronews.com/green/2023/02/06/the-eu-green-buildings-plan-aims-to-slash-emissions-but-this-european-country-isnt-happy (accessed 22 November 2023).
- A. Widuto, “Energy Poverty in the EU,” European Parliament, 2023. Accessed: 22 November 2023. [Online]. Available: https://www.europarl.europa.eu/RegData/etudes/BRIE/2022/733583/EPRS_BRI(2022)733583_EN.pdf.
- K. Choi, S. Park, J. Joe, S.-I. Kim, J.-H. Jo, E.-J. Kim and Y.-H. Cho, “Review of infiltration and airflow models in building energy simulations for providing guidelines to building energy modelers,” Renewable and Sustainable Energy Reviews, vol. 181, pp. 113327, July 2023. [CrossRef]
- V.S.K.V. Harish and A. Kumar, “A review on modeling and simulation of building energy systems,” Renewable and Sustainable Energy Reviews, vol. 56, pp. 1272-1292, April 2016. [CrossRef]
- Y. Pan, M. Zhu, Y. Lv, Y. Yang, Y. Liang, R. Yin, Y. Yang, X. Jia, X. Wang, F. Zeng, S. Huang, D. Hou, L. Xu, R. Yin and X. Yuan, “Building energy simulation and its application for building performance optimization: A review of methods, tools, and case studies,” Advances in Applied Energy, vol. 10, pp. 100135, June 2023. [CrossRef]
- E. VanDerHorn and S. Mahadevan, “Digital Twin: Generalization, characterization and implementation,” Decision Support Systems, vol. 145, pp. 113524, June 2021. [CrossRef]
- P. de Wilde, “Building performance simulation in the brave new world of artificial intelligence and digital twins: A systematic review,” Energy and Buildings, vol. 292, pp. 113171, August 2023. [CrossRef]
- “About Building Energy Modelling”. energy.gov. https://www.energy.gov/eere/buildings/about-building-energy-modeling (accessed 22 November 2023).
- S. Tang, D.R. Shelden, C.M. Eastman, P. Pishdad-Bozorgi and X. Gao, “A review of building information modeling (BIM) and the internet of things (IoT) devices integration: Present status and future trends,” Automation in Construction, vol. 101, pp. 127-139, May 2019. [CrossRef]
- M. Deng, C. Menassa and V. Kamat, “From BIM to digital twins: A systematic review of the evolution of intelligent building representations in the AEC-FM industry,” Journal of Information Technology in Construction, vol. 26, pp. 58-83, February 2021. [CrossRef]
- A. Agouzoul, M. Tabaa, B. Chegari, E. Simeu, A. Dandache and K. Alami, “Towards a Digital Twin model for Building Energy Management: Case of Morocco,” Procedia Computer Science, vol. 184, pp. 404-410, January 2021. [CrossRef]
- F. Battini, G. Pernigotto and A. Gasparella, “District-level validation of a shoeboxing simplification algorithm to speed-up Urban Building Energy Modeling simulations,” Applied Energy, vol. 349, pp. 121570, November 2023. [CrossRef]
- Y.Q. Ang, Z.M. Berzolla and C.F. Reinhart, “From concept to application: A review of use cases in urban building energy modeling,” Applied Energy, vol. 279, pp. 115738, December 2020. [CrossRef]
- N. Abbasabadi and M. Ashayeri, “Urban energy use modeling methods and tools: A review and an outlook,” Building and Environment, vol. 161, pp. 106270, August 2019. [CrossRef]
- A. Kirimtat, M.F. Tasgetiren, P. Brida and O. Krejcar, “Control of PV integrated shading devices in buildings: A review,” Building and Environment, vol. 214, pp. 108961, April 2022. [CrossRef]
- X. Zhang, S.-K. Lau, S.S.Y. Lau and Y. Zhao, “Photovoltaic integrated shading devices (PVSDs): A review,” Solar Energy, vol. 170, pp. 947-968, August 2018. [CrossRef]
- M.M. Fouad, L.A. Shihata and A.H. Mohamed, “Modeling and analysis of Building Attached Photovoltaic Integrated Shading Systems (BAPVIS) aiming for zero energy buildings in hot regions,” Journal of Building Engineering, vol. 21, pp. 18-27, January 2019. [CrossRef]
- “Solar Cells and Modules”. csem.ch. https://www.csem.ch/en/technical-focus/solar-cells-and-modules (accessed 22 November 2023).
- K. Pickerel. “An alternative to typical solar installations: Building-integrated photovoltaics”. solarpowerworldonline.com. https://www.solarpowerworldonline.com/2015/07/an-alternative-to-typical-solar-installations-building-integrated-photovoltaics/ (accessed 22 November 2023).
- FLEXLAB. “Building Integrated Photovoltaics”. flexlab.lbl.gov. https://flexlab.lbl.gov/building-integrated-photovoltaics (accessed 22 November 2023).
- “Design framework for BIPV shading devices”. pvmagazine.com. https://www.pv-magazine.com/2022/12/06/design-framework-for-bipv-shading-devices/ (accessed 22 November 2023).
- A. Taşer, B.K. Koyunbaba and T. Kazanasmaz, “Thermal, daylight, and energy potential of building-integrated photovoltaic (BIPV) systems: A comprehensive review of effects and developments,” Solar Energy, vol. 251, pp. 171-196, February 2023. [CrossRef]
- R.A. Mangkuto, D.N.A.T. Tresna, I.M. Hermawan, J. Pradipta, N. Jamala, B. Paramita and Atthaillah, “Experiment and simulation to determine the optimum orientation of building-integrated photovoltaic on tropical building façades considering annual daylight performance and energy yield,” Energy and Built Environment, vol. 5, pp. 414-425, June 2024. [CrossRef]
- C. Zomer, M. Fossati and A. Machado, “Designing with the Sun: Finding balance between aesthetics and energy performance in Building-integrated photovoltaic buildings,” Solar Compass, vol. 6, pp. 100046, June 2023. [CrossRef]
- D.J. Sailor, J. Anand and R.R. King, “Photovoltaics in the built environment: A critical review,” Energy and Buildings, vol. 253, pp. 111479, December 2021. [CrossRef]
- E. Mirabi and P.J. Davies, “A systematic review investigating linear infrastructure effects on Urban Heat Island (UHIULI) and its interaction with UHI typologies,” Urban Climate, vol. 45, pp. 101261, September 2022. [CrossRef]
- Q. Zhou, P. Dong, M. Li and Z. Wang, “Analyzing the interactions between photovoltaic system and its ambient environment using CFD techniques: A review,” Energy and Buildings, vol. 296, pp. 113394, October 2023. [CrossRef]
- S. Zhu, F. Causone, N. Gao, Y. Ye, X. Jin, X. Zhou and X. Shi, “Numerical simulation to assess the impact of urban green infrastructure on building energy use: A review,” Building and Environment, vol. 228, pp. 109832, 2023/01/15/ 2023. [CrossRef]
- T. Susca, F. Zanghirella, L. Colasuonno and V. Del Fatto, “Effect of green wall installation on urban heat island and building energy use: A climate-informed systematic literature review,” Renewable and Sustainable Energy Reviews, vol. 159, pp. 112100, May 2022. [CrossRef]
- F. Johari, G. Peronato, P. Sadeghian, X. Zhao and J. Widén, “Urban building energy modeling: State of the art and future prospects,” Renewable and Sustainable Energy Reviews, vol. 128, pp. 109902, August 2020. [CrossRef]
- C.F. Reinhart and C.C. Davila, “Urban building energy modeling – A review of a nascent field,” Building and Environment, vol. 97, pp. 196-202, February 2016. [CrossRef]
- C. Wang, M. Ferrando, F. Causone, X. Jin, X. Zhou and X. Shi, “Data acquisition for urban building energy modeling: A review,” Building and Environment, vol. 217, pp. 109056, June 2022. [CrossRef]
- S.S. Abolhassani, M. Amayri, N. Bouguila and U. Eicker, “A new workflow for detailed urban scale building energy modeling using spatial joining of attributes for archetype selection,” Journal of Building Engineering, vol. 46, pp. 103661, April 2022. [CrossRef]
- F. Sasso, J. Chambers and M.K. Patel, “Space heating demand in the office building stock: Element-based bottom-up archetype model,” Energy and Buildings, vol. 295, pp. 113264, September 2023. [CrossRef]
- P. Borges, O. Travesset-Baro and A. Pages-Ramon, “Hybrid approach to representative building archetypes development for urban models – A case study in Andorra,” Building and Environment, vol. 215, pp. 108958, May 2022. [CrossRef]
- S. Nejadshamsi, U. Eicker, C. Wang and J. Bentahar, “Data sources and approaches for building occupancy profiles at the urban scale – A review,” Building and Environment, vol. 238, pp. 110375, June 2023. [CrossRef]
- J. Fu, S. Hu, X. He, S. Managi and D. Yan, “Identifying residential building occupancy profiles with demographic characteristics: using a national time use survey data,” Energy and Buildings, vol. 277, pp. 112560, December 2022. [CrossRef]
- M. Ferrando, S. Ferroni, M. Pelle, A. Tatti, S. Erba, X. Shi and F. Causone, “UBEM’s archetypes improvement via data-driven occupant-related schedules randomly distributed and their impact assessment,” Sustainable Cities and Society, vol. 87, pp. 104164, December 2022. [CrossRef]
- C. Fu and C. Miller, “Using Google Trends as a proxy for occupant behavior to predict building energy consumption,” Applied Energy, vol. 310, pp. 118343, March 2022. [CrossRef]
- J.Y. Park, K. Nweye, E. Mbata and Z. Nagy, “CROOD: Estimating crude building occupancy from mobile device connections without ground-truth calibration,” Building and Environment, vol. 216, pp. 109040, May 2022. [CrossRef]
- A. Oraiopoulos and B. Howard, “On the accuracy of Urban Building Energy Modelling,” Renewable and Sustainable Energy Reviews, vol. 158, pp. 111976, April 2022. [CrossRef]
- D. Hou, I.G. Hassan and L. Wang, “Review on building energy model calibration by Bayesian inference,” Renewable and Sustainable Energy Reviews, vol. 143, pp. 110930, June 2021. [CrossRef]
- G. Tardioli, A. Narayan, R. Kerrigan, M. Oates, J. O’Donnell and D.P. Finn, “A methodology for calibration of building energy models at district scale using clustering and surrogate techniques,” Energy and Buildings, vol. 226, pp. 110309, November 2020. [CrossRef]
- A.D. Dilsiz, K.E. Nweye, A.J. Wu, J.H. Kämpf, F. Biljecki and Z. Nagy, “How spatio-temporal resolution impacts urban energy calibration,” Energy and Buildings, vol. 292, pp. 113175, August 2023. [CrossRef]
- M. Singh and R. Sharston, “Quantifying the dualistic nature of urban heat Island effect (UHI) on building energy consumption,” Energy and Buildings, vol. 255, pp. 111649, January 2022. [CrossRef]
- S. Liu, Y.T. Kwok and C. Ren, “Investigating the impact of urban microclimate on building thermal performance: A case study of dense urban areas in Hong Kong,” Sustainable Cities and Society, vol. 94, pp. 104509, July 2023. [CrossRef]
- L. Xu, S. Tong, W. He, W. Zhu, S. Mei, K. Cao and C. Yuan, “Better understanding on impact of microclimate information on building energy modelling performance for urban resilience,” Sustainable Cities and Society, vol. 80, pp. 103775, May 2022. [CrossRef]
- A. Katal, M. Mortezazadeh, L. Wang and H. Yu, “Urban building energy and microclimate modeling – From 3D city generation to dynamic simulations,” Energy, vol. 251, pp. 123817, July 2022. [CrossRef]
- N. Sezer, H. Yoonus, D. Zhan, L. Wang, I.G. Hassan and M.A. Rahman, “Urban microclimate and building energy models: A review of the latest progress in coupling strategies,” Renewable and Sustainable Energy Reviews, vol. 184, pp. 113577, September 2023. [CrossRef]
- M. Bruse and H. Fleer, “Simulating surface–plant–air interactions inside urban environments with a three dimensional numerical model,” Environmental Modelling & Software, vol. 13, pp. 373-384, October 1998. [CrossRef]
- G. Thomas, J. Thomas, G.M. Mathews, S.P. Alexander and J. Jose, “Assessment of the potential of green wall on modification of local urban microclimate in humid tropical climate using ENVI-met model,” Ecological Engineering, vol. 187, pp. 106868, February 2023. [CrossRef]
- A. Forouzandeh, “Prediction of surface temperature of building surrounding envelopes using holistic microclimate ENVI-met model,” Sustainable Cities and Society, vol. 70, pp. 102878, July 2021. [CrossRef]
- O. Aleksandrowicz, T. Saroglou and D. Pearlmutter, “Evaluation of summer mean radiant temperature simulation in ENVI-met in a hot Mediterranean climate,” Building and Environment, vol. pp. 110881, September 2023. [CrossRef]
- N.H. Wong, Y. He, N.S. Nguyen, S.V. Raghavan, M. Martin, D.J.C. Hii, Z. Yu and J. Deng, “An integrated multiscale urban microclimate model for the urban thermal environment,” Urban Climate, vol. 35, pp. 100730, January 2021. [CrossRef]
- S. Mirza, A. Niwalkar, S. Anjum, H. Bherwani, A. Singh and R. Kumar, “Studying impact of infrastructure development on urban microclimate: Integrated multiparameter analysis using OpenFOAM,” Energy Nexus, vol. 6, pp. 100060, June 2022. [CrossRef]
- R. Kadaverugu, V. Purohit, C. Matli and R. Biniwale, “Improving accuracy in simulation of urban wind flows by dynamic downscaling WRF with OpenFOAM,” Urban Climate, vol. 38, pp. 100912, July 2021. [CrossRef]
- M. Mortezazadeh, L.L. Wang, M. Albettar and S. Yang, “CityFFD – City fast fluid dynamics for urban microclimate simulations on graphics processing units,” Urban Climate, vol. 41, pp. 101063, January 2022. [CrossRef]
- J. Wang, L. Wang and R. You, “Evaluating a combined WRF and CityFFD method for calculating urban wind distributions,” Building and Environment, vol. 234, pp. 110205, April 2023. [CrossRef]
- M. Ferrando and F. Causone, “An Overview Of Urban Building Energy Modelling (UBEM) Tools,” in 16th IBPSA International Conference and Exhibition, Rome, Italy, 2019, pp. 3452-3459. [CrossRef]
- T. Hong, Y. Chen, S.H. Lee and M. Piette, “CityBES: A Web-based Platform to Support City-Scale Building Energy Efficiency,” presented at the 5th International Urban Computing Workshop, San Francisco, United States, August, 2016,.
- J.A. Fonseca, T.-A. Nguyen, A. Schlueter and F. Marechal, “City Energy Analyst (CEA): Integrated framework for analysis and optimization of building energy systems in neighborhoods and city districts,” Energy and Buildings, vol. 113, pp. 202-226, February 2016. [CrossRef]
- D. Robinson, F. Haldi, P. Leroux, D. Perez, A. Rasheed and U. Wilke, “CITYSIM: Comprehensive Micro-Simulation of Resource Flows for Sustainable Urban Planning,” presented at the IBPSA 2009 - International Building Performance Simulation Association 2009, Glasgow, Scotland, July 27-30, 2009,.
- C. Reinhart, T. Dogan, J. Jakubiec, T. Rakha and A. Sang, “Umi – An Urban Simulation Environment For Building Energy Use, Daylighting And Walkability,” in Proceedings of Building Simulation, Chambéri, France, August 26-28, 2013, pp. 476-483. [CrossRef]
- B. Polly, C. Kutscher, D. Macumber, M. Schott, S. Pless, B. Livingood and O. Geet, “From Zero Energy Buildings to Zero Energy Districts,” presented at the American Council for an Energy Efficient Economy - 2016 Buildings Summer Study, United States, 2016,.
- L. Teso, L. Carnieletto, K. Sun, W. Zhang, A. Gasparella, P. Romagnoni, A. Zarrella and T. Hong, “Large scale energy analysis and renovation strategies for social housing in the historic city of Venice,” Sustainable Energy Technologies and Assessments, vol. 52, pp. 102041, August 2022. [CrossRef]
- T. Hong, Y. Xu, K. Sun, W. Zhang, X. Luo and B. Hooper, “Urban microclimate and its impact on building performance: A case study of San Francisco,” Urban Climate, vol. 38, pp. 100871, July 2021. [CrossRef]
- A. Oraiopoulos, S. Hsieh and A. Schlueter, “Energy futures of representative Swiss communities under the influence of urban development, building retrofit, and climate change,” Sustainable Cities and Society, vol. 91, pp. 104437, April 2023. [CrossRef]
- M. Mosteiro-Romero and A. Schlueter, “Effects of Occupants and Local Air Temperatures as Sources of Stochastic Uncertainty in District Energy System Modeling,” Energies, vol. 14, pp. 30, April 2021. [CrossRef]
- G. Chen, L. Rong and G. Zhang, “Comparison of urban airflow between solar-induced thermal wall and uniform wall temperature boundary conditions by coupling CitySim and CFD,” Building and Environment, vol. 172, pp. 106732, April 2020. [CrossRef]
- I. Adilkhanova, M. Santamouris and G.Y. Yun, “Coupling urban climate modeling and city-scale building energy simulations with the statistical analysis: Climate and energy implications of high albedo materials in Seoul,” Energy and Buildings, vol. 290, pp. 113092, July 2023. [CrossRef]
- H. Saeed Khan, R. Paolini, P. Caccetta and M. Santamouris, “On the combined impact of local, regional, and global climatic changes on the urban energy performance and indoor thermal comfort—The energy potential of adaptation measures,” Energy and Buildings, vol. 267, pp. 112152, July 2022. [CrossRef]
- N. Buckley, G. Mills, C. Reinhart and Z.M. Berzolla, “Using urban building energy modelling (UBEM) to support the new European Union’s Green Deal: Case study of Dublin Ireland,” Energy and Buildings, vol. 247, pp. 111115, September 2021. [CrossRef]
- J. Wang, W. Liu, C. Sha, W. Zhang, Z. Liu, Z. Wang, R. Wang and X. Du, “Evaluation of the impact of urban morphology on commercial building carbon emissions at the block scale – A study of commercial buildings in Beijing,” Journal of Cleaner Production, vol. 408, pp. 137191, July 2023. [CrossRef]
- N. Buckley, G. Mills, S. Letellier-Duchesne and K. Benis, “Designing an Energy-Resilient Neighbourhood Using an Urban Building Energy Model,” Energies, vol. 14, pp. 17, July 2021. [CrossRef]
- J. Wang, R.E. Kontar, X. Jin and J. King, “Electrifying High-Efficiency Future Communities: Impact on Energy, Emissions, and Grid,” Advances in Applied Energy, vol. 6, pp. 100095, June 2022. [CrossRef]
- R. Flores, S. Houssainy, W. Wang, J. Robertson, K.N. Cu, B. Polly, R. Faramarzi, J. Maclay and J. Brouwer, “Developing and tuning a community scale energy model for a disadvantaged community,” Energy and Buildings, vol. 285, pp. 112861, April 2023. [CrossRef]
- J. Ge, Y. Wang, D. Zhou, Z. Gu and X. Meng, “Building energy demand of urban blocks in Xi’an, China: Impacts of high-rises and vertical meteorological pattern,” Building and Environment, vol. 244, pp. 110749, October 2023. [CrossRef]
- M.M. Uddin, J. Ji, C. Wang and C. Zhang, “Building energy conservation potentials of semi-transparent CdTe integrated photovoltaic window systems in Bangladesh context,” Renewable Energy, vol. 207, pp. 512-530, May 2023. [CrossRef]
- F. Nicoletti, M.A. Cucumo and N. Arcuri, “Building-integrated photovoltaics (BIPV): A mathematical approach to evaluate the electrical production of solar PV blinds,” Energy, vol. 263, pp. 126030, January 2023. [CrossRef]
- X. Feng, T. Ma, Y. Yamaguchi, J. Peng, Y. Dai and D. Ji, “Potential of residential building integrated photovoltaic systems in different regions of China,” Energy for Sustainable Development, vol. 72, pp. 19-32, February 2023. [CrossRef]
- Y. Ye, R. Zhu, J. Yan, L. Lu, M.S. Wong, W. Luo, M. Chen, F. Zhang, L. You, Y. Wang and Z. Qin, “Planning the installation of building-integrated photovoltaic shading devices: A GIS-based spatiotemporal analysis and optimization approach,” Renewable Energy, vol. 216, pp. 119084, November 2023. [CrossRef]
- K. Liu, X. Xu, W. Huang, R. Zhang, L. Kong and X. Wang, “A multi-objective optimization framework for designing urban block forms considering daylight, energy consumption, and photovoltaic energy potential,” Building and Environment, vol. 242, pp. 110585, August 2023. [CrossRef]
- C. Xiang and B.S. Matusiak, “Façade Integrated Photovoltaics design for high-rise buildings with balconies, balancing daylight, aesthetic and energy productivity performance,” Journal of Building Engineering, vol. 57, pp. 104950, October 2022. [CrossRef]
- Z. Fan, Y. Zehui and Y. Liu, “Daylight performance assessment of atrium skylight with integrated semi-transparent photovoltaic for different climate zones in China,” Building and Environment, vol. 190, pp. 107299, March 2021. [CrossRef]
- T. Mendis, Z. Huang, S. Xu and W. Zhang, “Economic potential analysis of photovoltaic integrated shading strategies on commercial building facades in urban blocks: A case study of Colombo, Sri Lanka,” Energy, vol. 194, pp. 116908, March 2020. [CrossRef]
- H. Lee, X. Zhao and J. Seo, “A Study of Optimal Specifications for Light Shelves with Photovoltaic Modules to Improve Indoor Comfort and Save Building Energy,” International Journal of Environmental Research and Public Health, vol. 18, pp. March 2021. [CrossRef]
- H. Wang, C. Lin, Y. Hu, X. Zhang, J. Han and Y. Cheng, “Study on indoor adaptive thermal comfort evaluation method for buildings integrated with semi-transparent photovoltaic window,” Building and Environment, vol. 228, pp. 109834, January 2023. [CrossRef]
- S. Yadav, C. Hachem-Vermette, G.A. Eranki and S.K. Panda, “Performance evaluation of building integrated semitransparent and opaque photovoltaic Trombe wall systems employing periodic thermal models,” Energy and Buildings, vol. 294, pp. 113221, September 2023. [CrossRef]
- X. Ding, Z. Zhang, W. Zhang, X. Yue and Y. Zhang, “Evaluation of the energy-economic-environment potential of urban-scale photovoltaic bus parking lots: The case of Tianjin, China,” Journal of Cleaner Production, vol. 425, pp. 138983, November 2023. [CrossRef]
- G. Del Serrone, P. Peluso and L. Moretti, “Photovoltaic road pavements as a strategy for low-carbon urban infrastructures,” Heliyon, vol. 9, pp. e19977, September 2023. [CrossRef]
- S. Garshasbi, A. Khan and M. Santamouris, “On the cooling energy penalty of urban photovoltaics: a case study in Sydney, Australia,” Energy and Buildings, vol. 294, pp. 113259, September 2023. [CrossRef]
- T.S. Elhabodi, S. Yang, J. Parker, S. Khattak, B.-J. He and S. Attia, “A review on BIPV-induced temperature effects on urban heat islands,” Urban Climate, vol. 50, pp. 101592, July 2023. [CrossRef]


| Software | Characteristics | Reference |
|---|---|---|
| ENVI-met | Allows energy retrofit analysis, urban energy planning, building operations improvement, and energy benchmarking; Simulation time and computational requirements are too high; Adequate to study the impact of common energy efficiency measures; Does not consider the microclimate effect. |
[58,59,60,61] |
| OpenFOAM | Suitable to assess the building demand and the performance of energy systems and renewable energy resource potential; Only allows to estimate the solar potential at rooftops. |
[62,63,64] |
| CityFFD | Contains thermal radiation, behaviour, plant and equipment models; Detailed radiation models, based on simple electrical circuit analogy, allowing to determine surface longwave and shortwave radiance. |
[65,66] |
| Software | Characteristics | Reference |
|---|---|---|
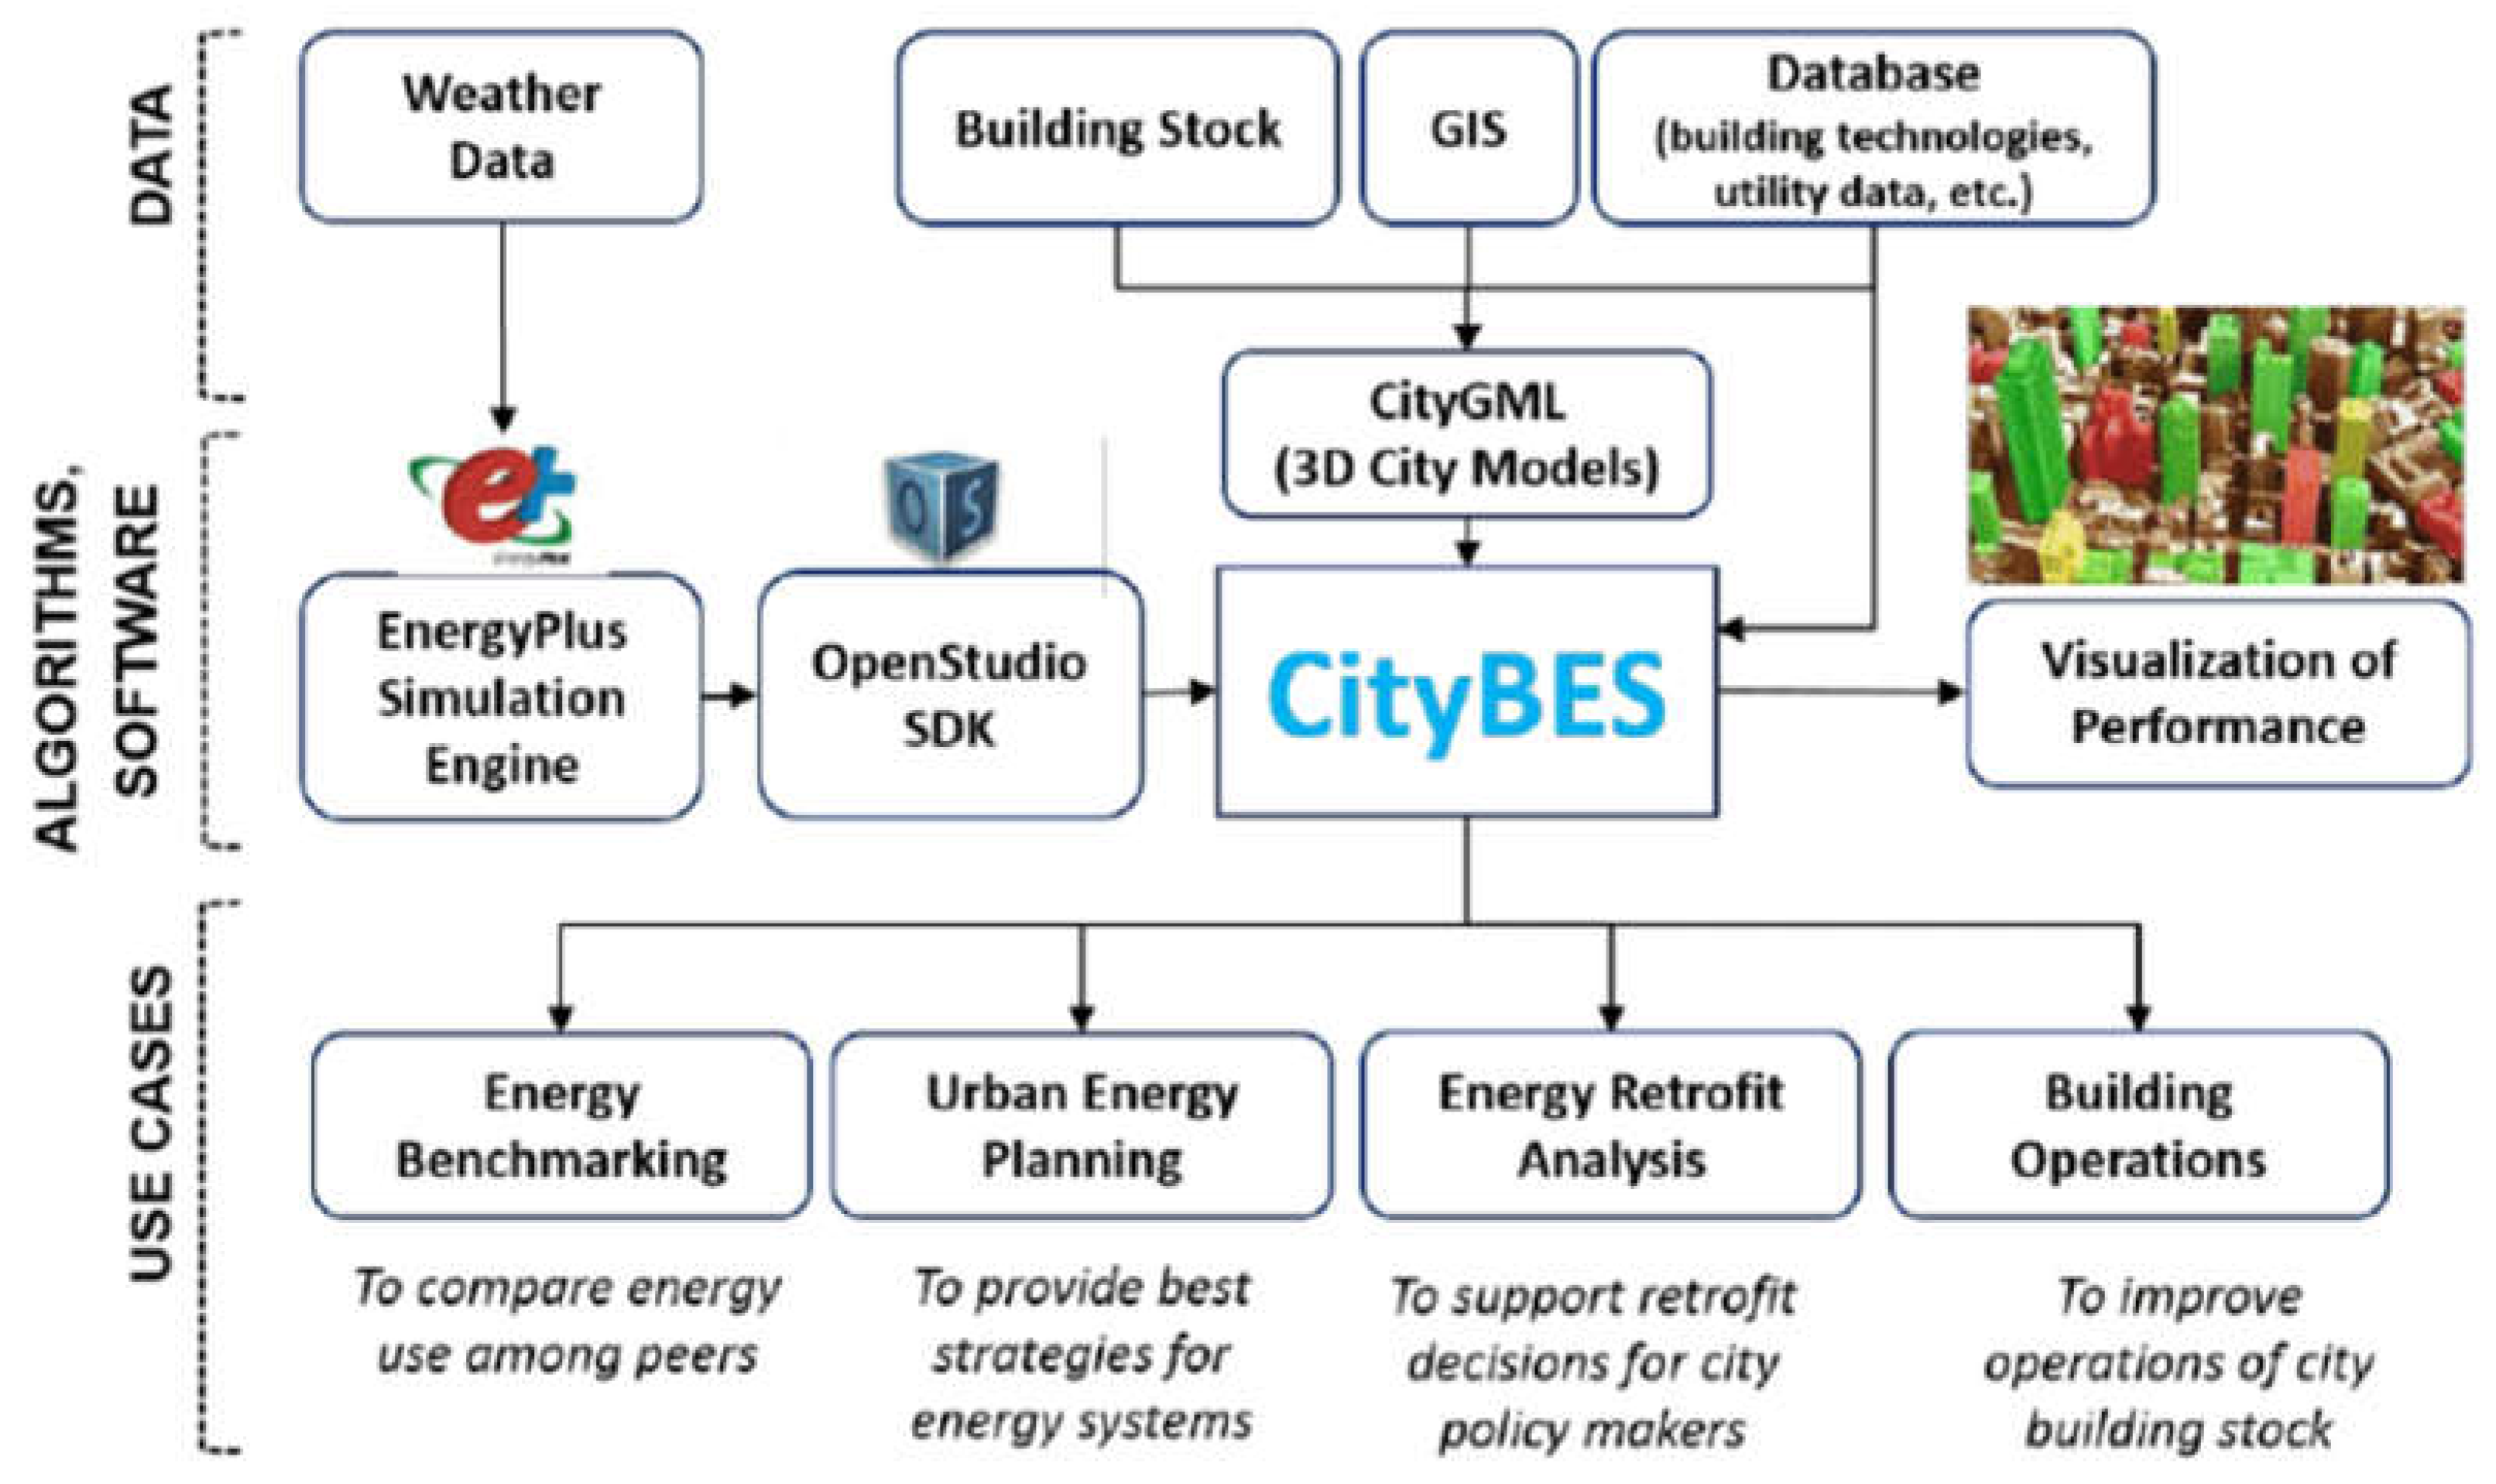
| CityBES | Allows energy retrofit analysis, urban energy planning, building operations improvement, and energy benchmarking; Simulation time and computational requirements are too high; Adequate to study the impact of common energy efficiency measures; Does not consider the microclimate effect. |
[68,73,74] |
| CEA | Suitable to assess the building demand and the performance of energy systems and renewable energy resource potential; Only allows to estimate the solar potential at rooftops. |
[69,75,76] |
| CitySIM | Contains thermal radiation, behaviour, plant and equipment models; Detailed radiation models, based on simple electrical circuit analogy, allowing to determine surface longwave and shortwave radiance. |
[70,77,78,79] |
| UMI | Rhinoceros-based urban modelling design tool; Indicated to assess walkability and to perform daylight and building energy simulations; Allows to evaluate retrofit measures, calculation of operational and embodied carbon emissions, and estimate solar power potential. |
[71,80,81,82] |
| URBANopt | Allows to perform detailed simulations at individual building level; Allows to evaluate building-to-building shading and solar access. |
[72,83,84,85] |
Disclaimer/Publisher’s Note: The statements, opinions and data contained in all publications are solely those of the individual author(s) and contributor(s) and not of MDPI and/or the editor(s). MDPI and/or the editor(s) disclaim responsibility for any injury to people or property resulting from any ideas, methods, instructions or products referred to in the content. |
© 2024 by the authors. Licensee MDPI, Basel, Switzerland. This article is an open access article distributed under the terms and conditions of the Creative Commons Attribution (CC BY) license (http://creativecommons.org/licenses/by/4.0/).


