Submitted:
27 May 2024
Posted:
28 May 2024
You are already at the latest version
Abstract
Successful geophysical exploration works in Gucheng-Yaxi area located in Gaochun District, Jiangsu province, China, have been limited partly due to complex geological condition of the area and high artificial noise in data acquired using electrical and electromagnetic methods. In this work, we deployed the new anti-interference spread spectrum induced polarization method (SSIP) and audio magnetotellurics (AMT) method to detect a copper-polymetallic deposit in the area. Two-dimensional (2D) inversion results at Gucheng-Yaxi Area revealed a high chargeability anomalous zone on SSIP profile that coincided with a zone of moderate resistivity located between two resistor bodies on AMT profile. A follow up 1200 meters drill hole was established at this high chargeability-moderate resistivity zone which encountered polymetallic (copper, lead, zinc, gold and silver) mineralization at the depth ≥ 400 m. Drill hole data analysis showed that mineralization occurs interspaced in marble rock mass at varies depth. Furthermore, several low resistivity-weak chargeability sections were revealed and inferred attributed to Cretaceous sediments and faults. These faults are thought to have played critical role in the polymetallic mineralization genesis. In summary, this work demonstrated the successful of application of SSIP and AMT at detecting a metallic deposit in an area with high artificial noise. Hence the geophysical prospection potential of Gucheng-Yaxi area is great.
Keywords:
Cu-polymetallic deposit
; audio magnetotellurics
; spread spectrum induced polarization
; geophysical methods
; mineral exploration
1. Introduction
The demand for critical mineral resources such as copper, cobalt, lithium and nickel among others, will continue to grow considering current efforts in global transition from fossil fuels energy to more environmentally friendly energy technologies [2,3]. Securing critical minerals supply is therefore a major issue for our society to enable a sustainable future by combating climate change [4,5]. Despite increasing recycling, primary resources will still be necessary to meet demand in the foreseeable future [6]. The discovery of such resource for raw minerals occurs through a progressive series of interconnected steps that involve increasing investment and assumed risk reduction [7]. The first step in this complex process is the surface recognition of showings of mineralization that may be related to an orebody in the subsoil [8]. This phase is followed by the target detailing phase, where a set of indirect investigation techniques are used as a quick and economical alternative [9]. Geophysics is emphasized in this scenario because of the frequent contrast between the physical properties of mineral and country-rock deposits, measurable in the instrument field [10,11]. Electromagnetic (EM) and electrical geophysical methods have been extensively applied successfully in the study and discovery of new mineral deposits [12,13,14,15]. For instance, controlled source magnetotelluric (CSAMT), audio magnetotelluric (AMT) and induced polarization are been applied to study shallow part of a deeper mineralization [16,17,18,19]. The magnetotelluric (MT) sounding and the wide-field electromagnetic (WFEM) method are gaining application to meet the demands for deep resource exploration [20,21,22]. In recent years, a new method called spread-spectrum induced-polarization (SSIP) was proposed based on ZigBee wireless sensor networks and GPS timing to realize synchronous real-time full-waveform acquisition and the real-time data-quality monitoring of massive SSIP receivers [18,23,24].
In this paper, we present new AMT and SSIP data from a potential Cu-polymetallic mineralization in Gucheng-Yaxi Area, Gaochun District, Jiangsu, China. Our exploration in Gaochun draws inspiration from the Chating deposits, as both areas share the same metallogenic belt.
2. Geological Background
Eastern China comprises three main tectonic blocks: the North China Craton (NCC), the Yangtze Block, and the Cathaysia Block (Figure 1a). The Tongbai–Hong’an–Dabie Orogen formed as a result of subduction and continent–continent collision between the South China Block (SCB) (comprising the Yangtze and Cathaysia blocks) and the NCC during the Triassic (Wu and Zheng, 2013). This orogen extends 500 km from the Nanyang Basin in Henan Province in the west to the Tan–Lu regional strike-slip fault in Anhui Province in the east (Figure 1b). The MLYRB hosts extensive late Mesozoic magmatic rocks and ore deposits and is thus one of the most important regions with respect to large-scale Mesozoic magmatic activity and mineralization in eastern China (Figure 1c) (Sun et al., 2012) [1].
The geological characteristics of Gucheng-Yaxi Area remain largely unexplored, with no prior investigations conducted. However, based on our field data, the geological conditions surrounding the survey area primarily consist of Quaternary strata covered by the Lower Cretaceous Ganhe Formation (K1g) in the Gucheng Lake West survey area. The adjacent Quaternary strata include the Early Cretaceous Yixian Formation (K1y) and the Middle Silurian Fentou Formation (S2f). These strata exhibit a general northeast to southwest distribution with an overall northwest trend. Gaochun District can be divided into two tectonic layers on a regional scale. The lower tectonic layer is composed of the Silurian to Triassic systems. The various stratigraphic units (groups and formations) are in conformable or paraconformable contact. The Indosinian movement caused the lower tectonic layer to undergo relatively strong folding, and at the same time produced two sets of longitudinal and transverse faults with northeast and northwest directions (Figure 2). The upper tectonic layer is composed of the Jurassic and Cretaceous systems. It is a set of continental volcanic rocks and inland depression red strata. The strata between the layers are in unconformable contact, and the folding structure is weak. The main faults developed in the area are the northeast-trending Maodong and Maoxi faults (Figure 2). Fault structures are developed, and the phenomena of faulting, missing strata, etc. are relatively common [25].
Figure 1.
Geological sketch map, showing the tectonic locations of the DBO and the MLYRB, and the distribution of late Mesozoic magmatic rocks and polymetallic. Modified from Jun Yan et al., 2021. [1].
Figure 1.
Geological sketch map, showing the tectonic locations of the DBO and the MLYRB, and the distribution of late Mesozoic magmatic rocks and polymetallic. Modified from Jun Yan et al., 2021. [1].
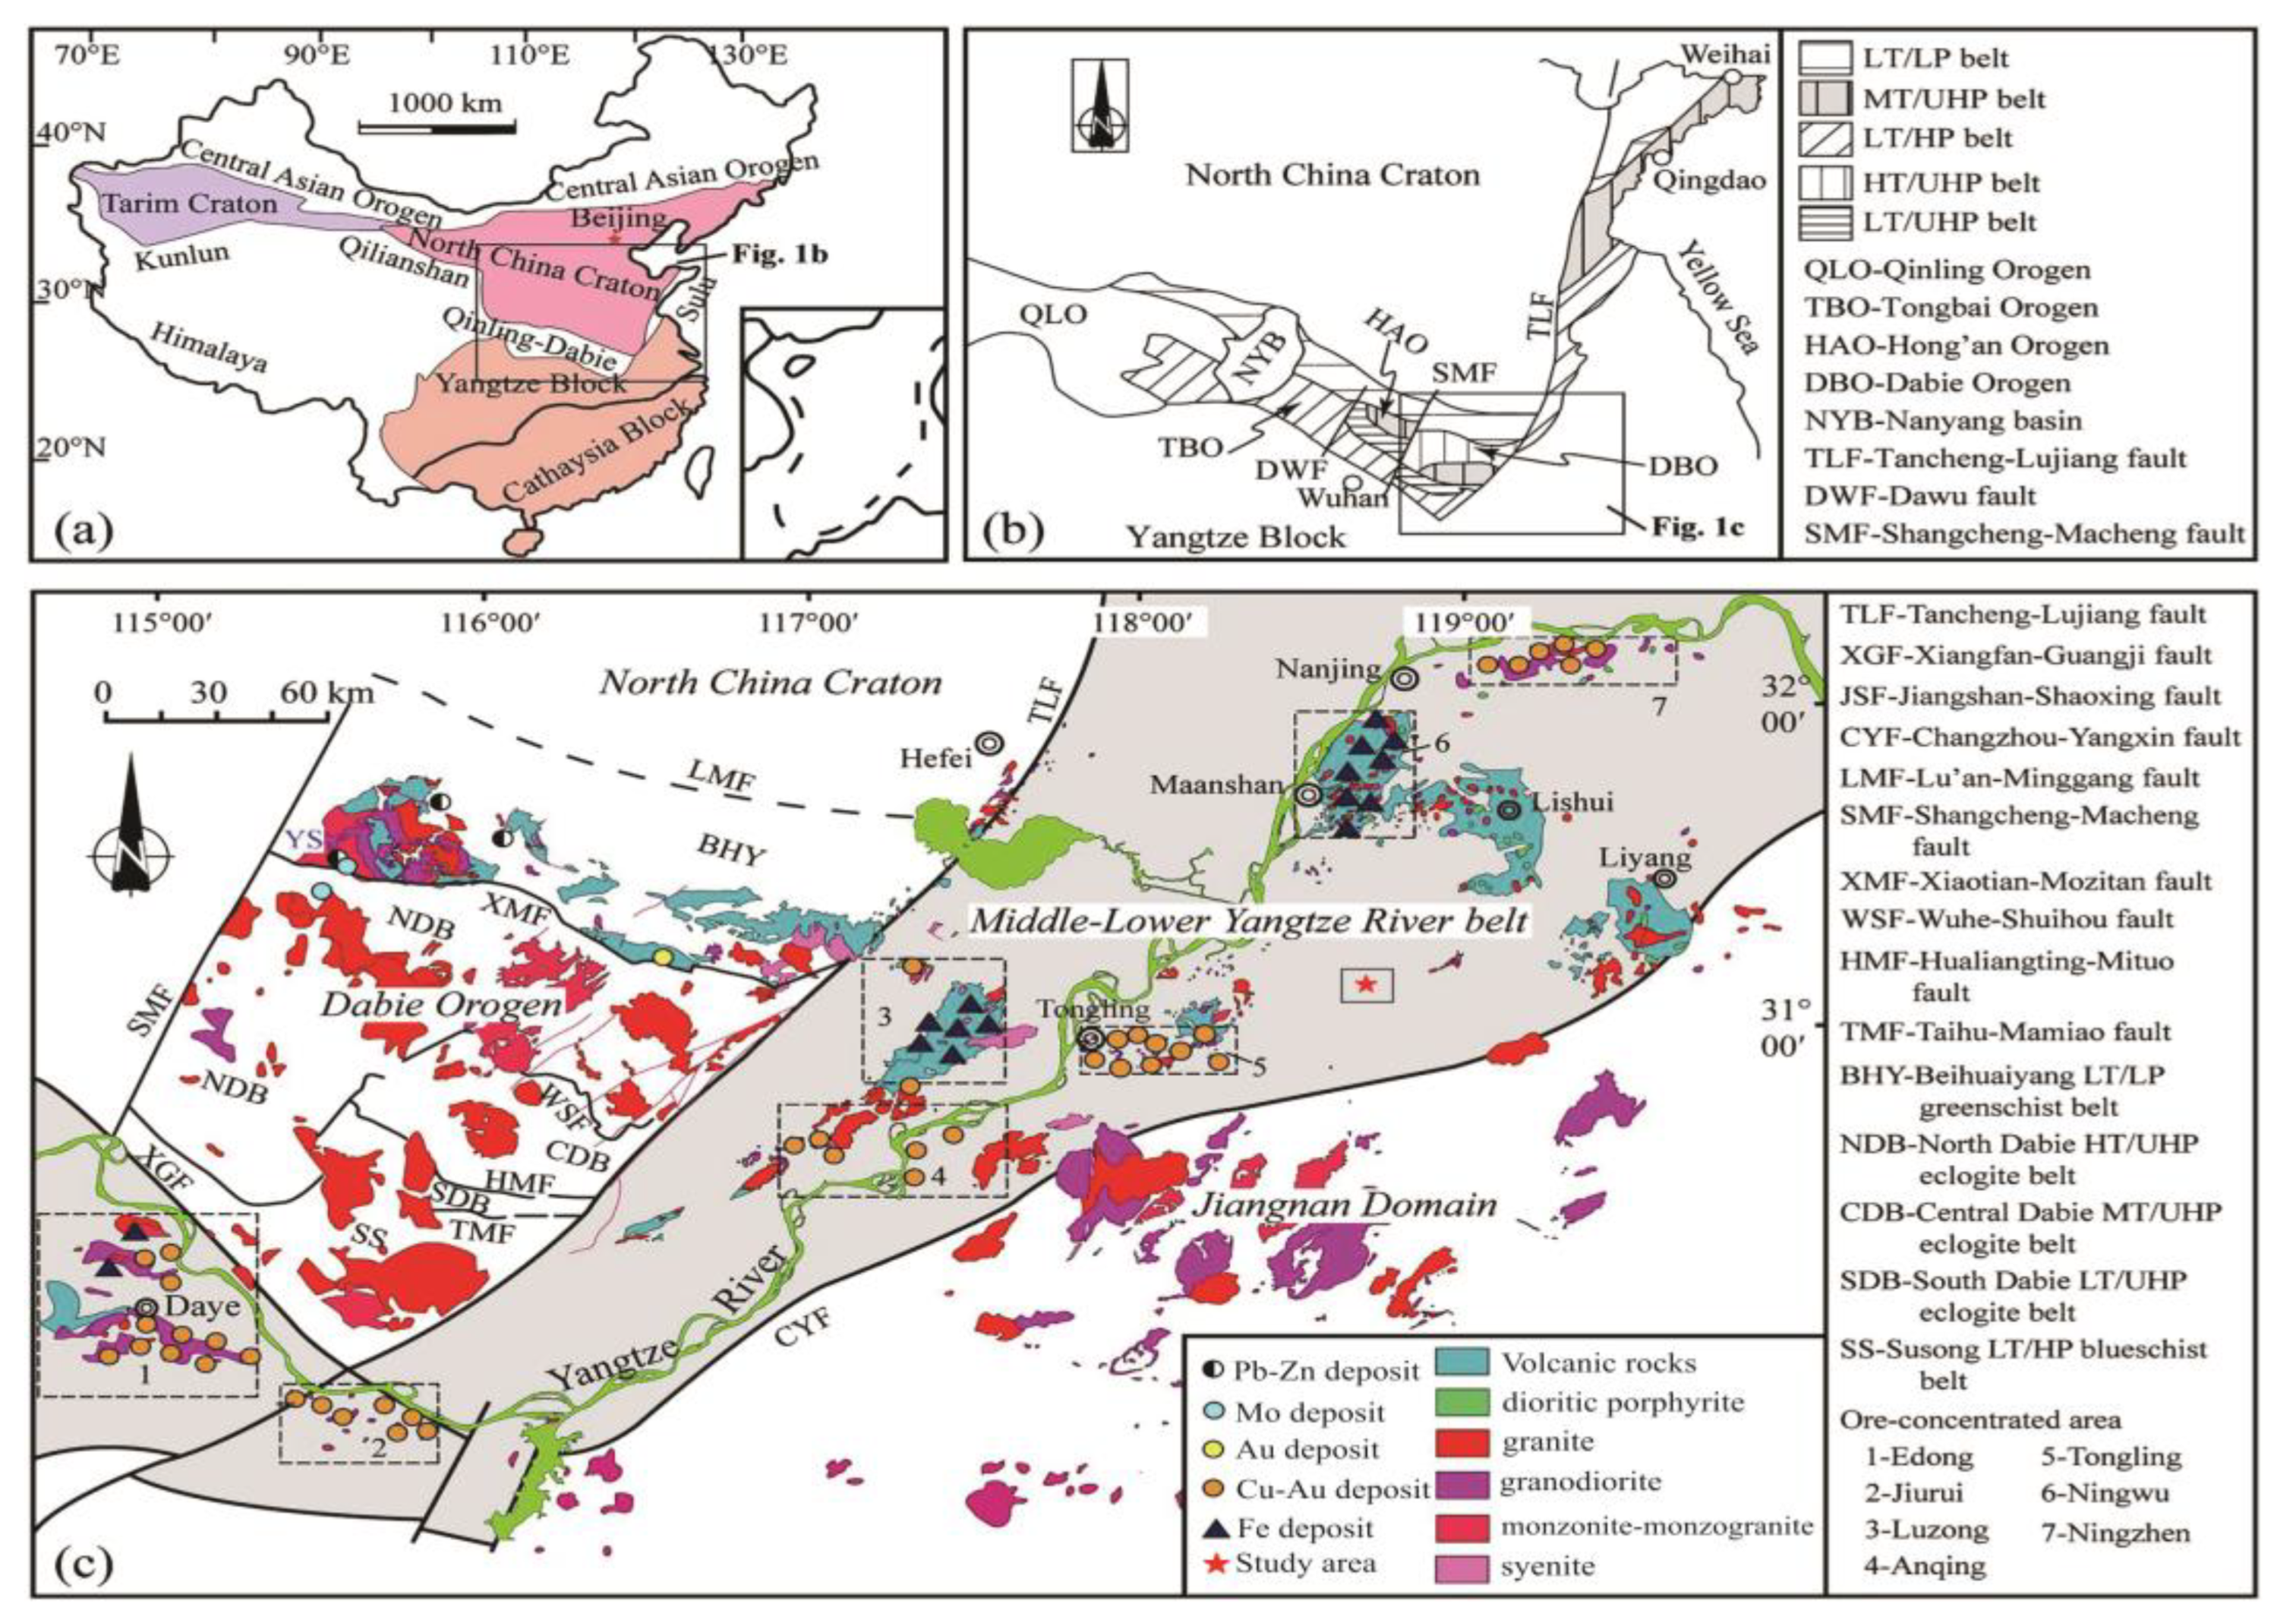
Figure 1.
Regional Tectonic Outline Map of Gaochun area modified from Xu Xiaochun et al., 2019) [25].
Figure 1.
Regional Tectonic Outline Map of Gaochun area modified from Xu Xiaochun et al., 2019) [25].
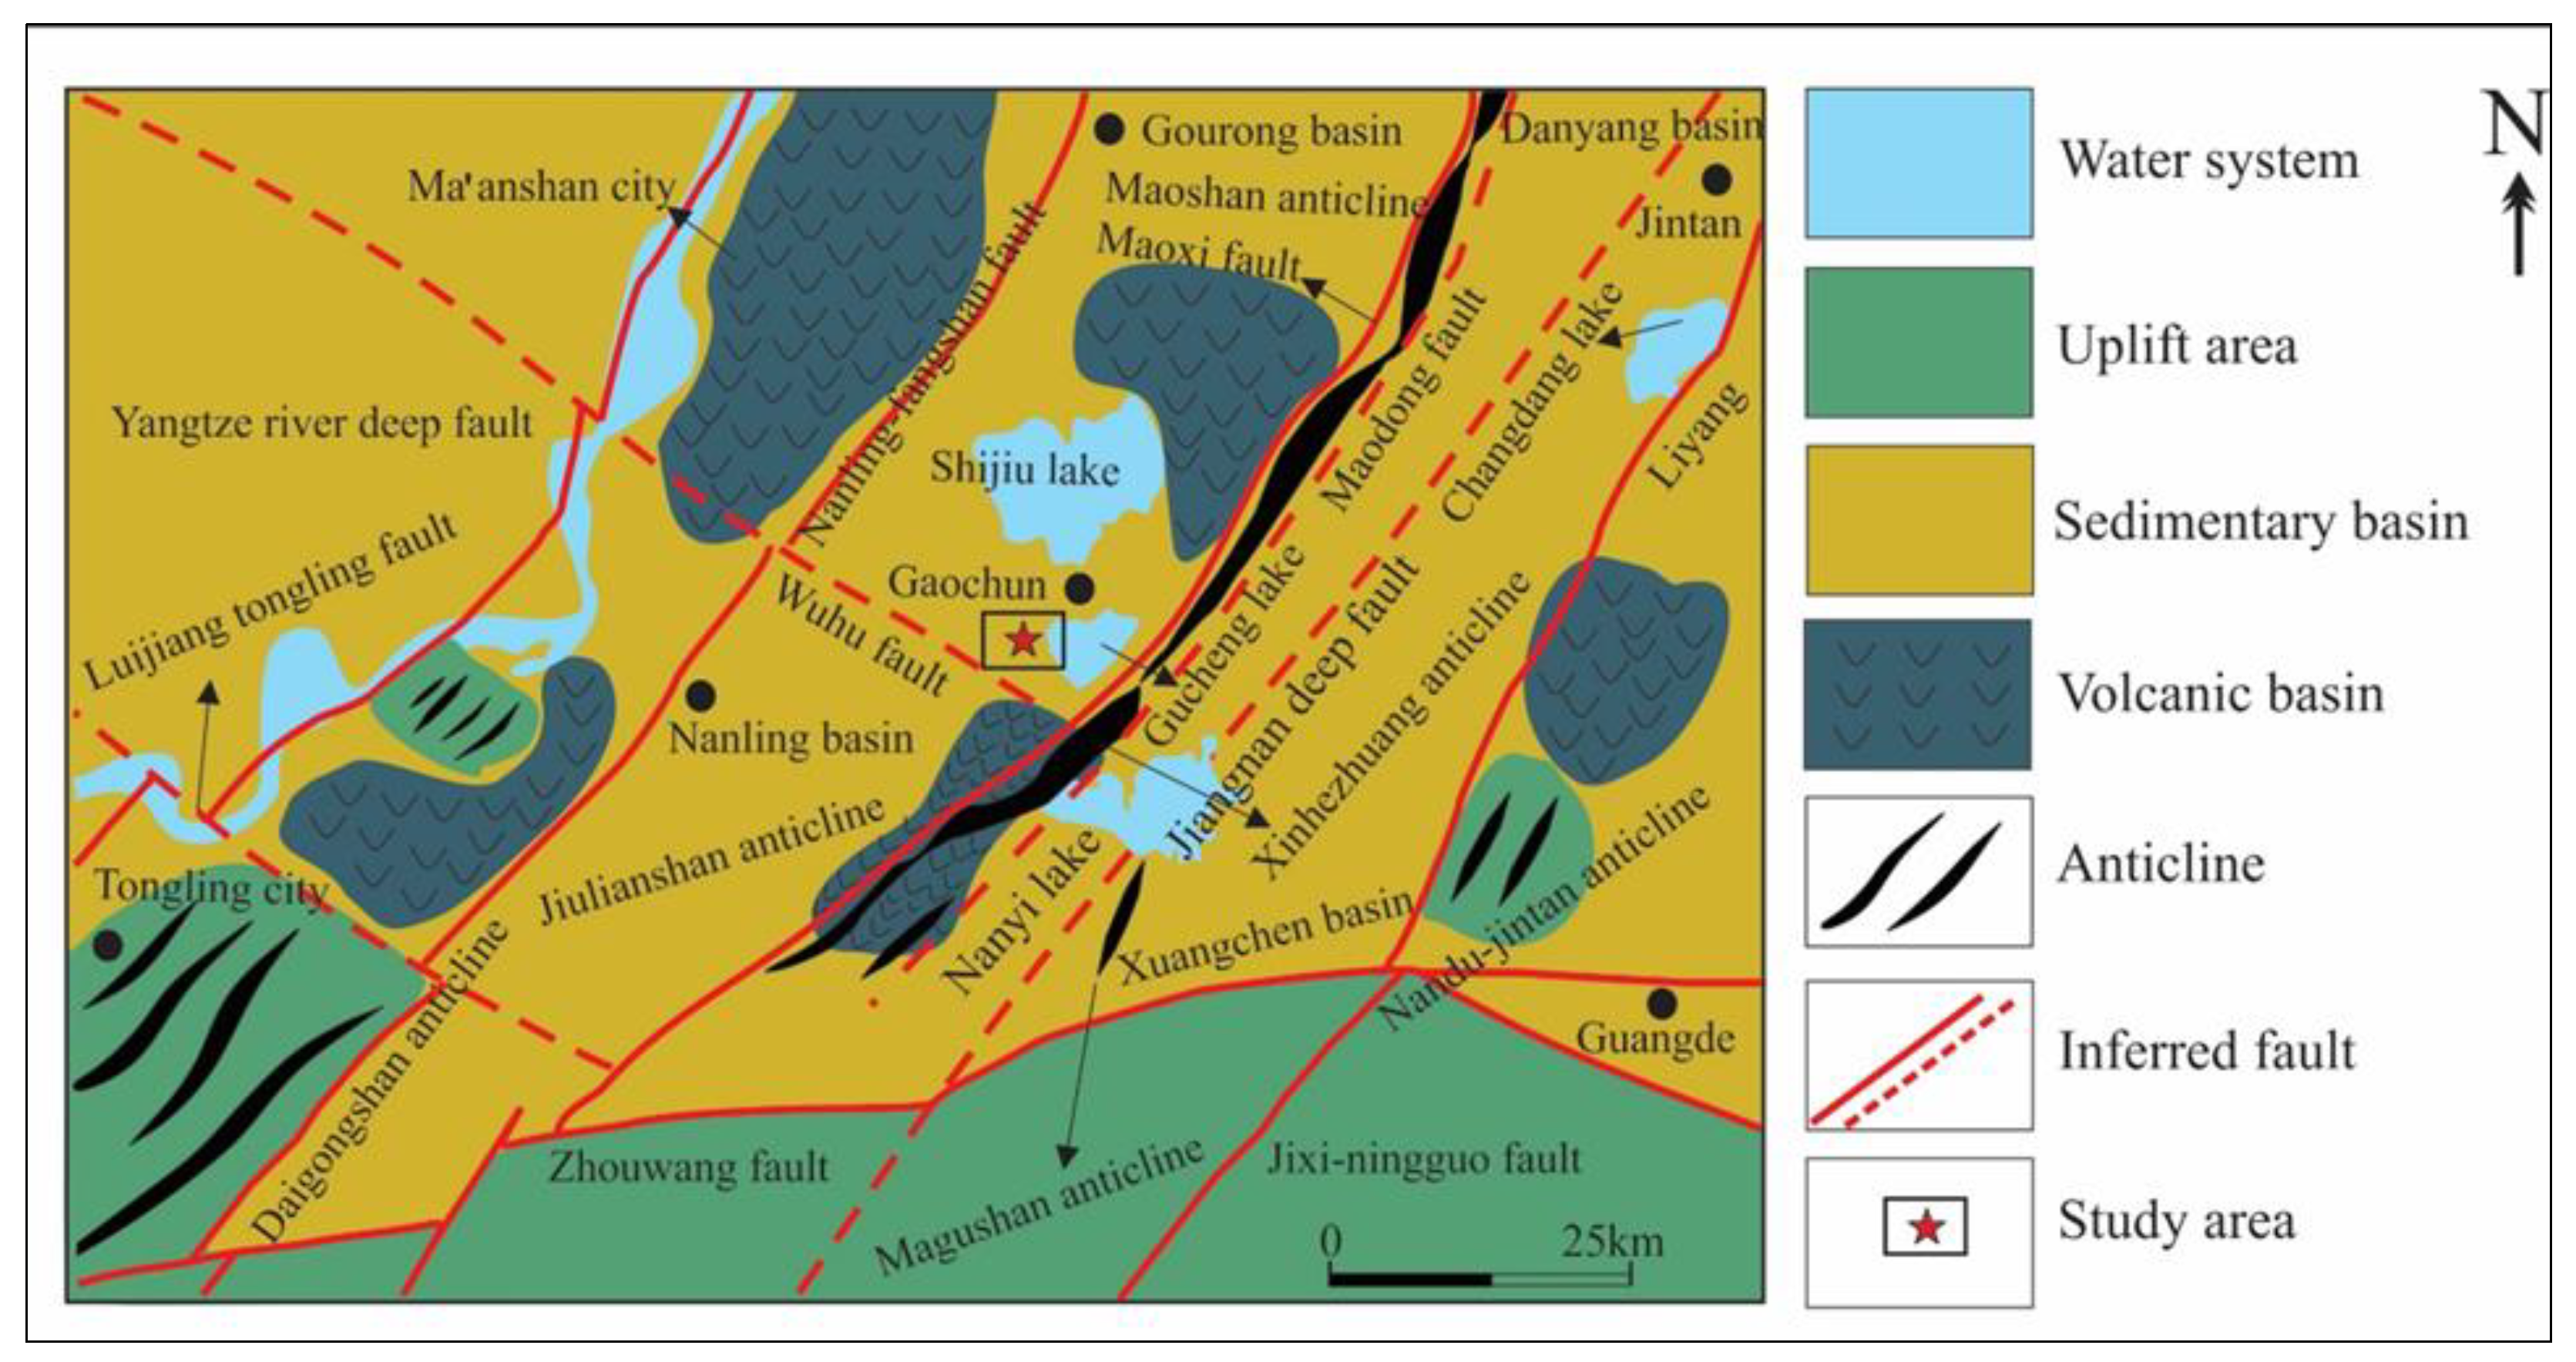
Figure 2.
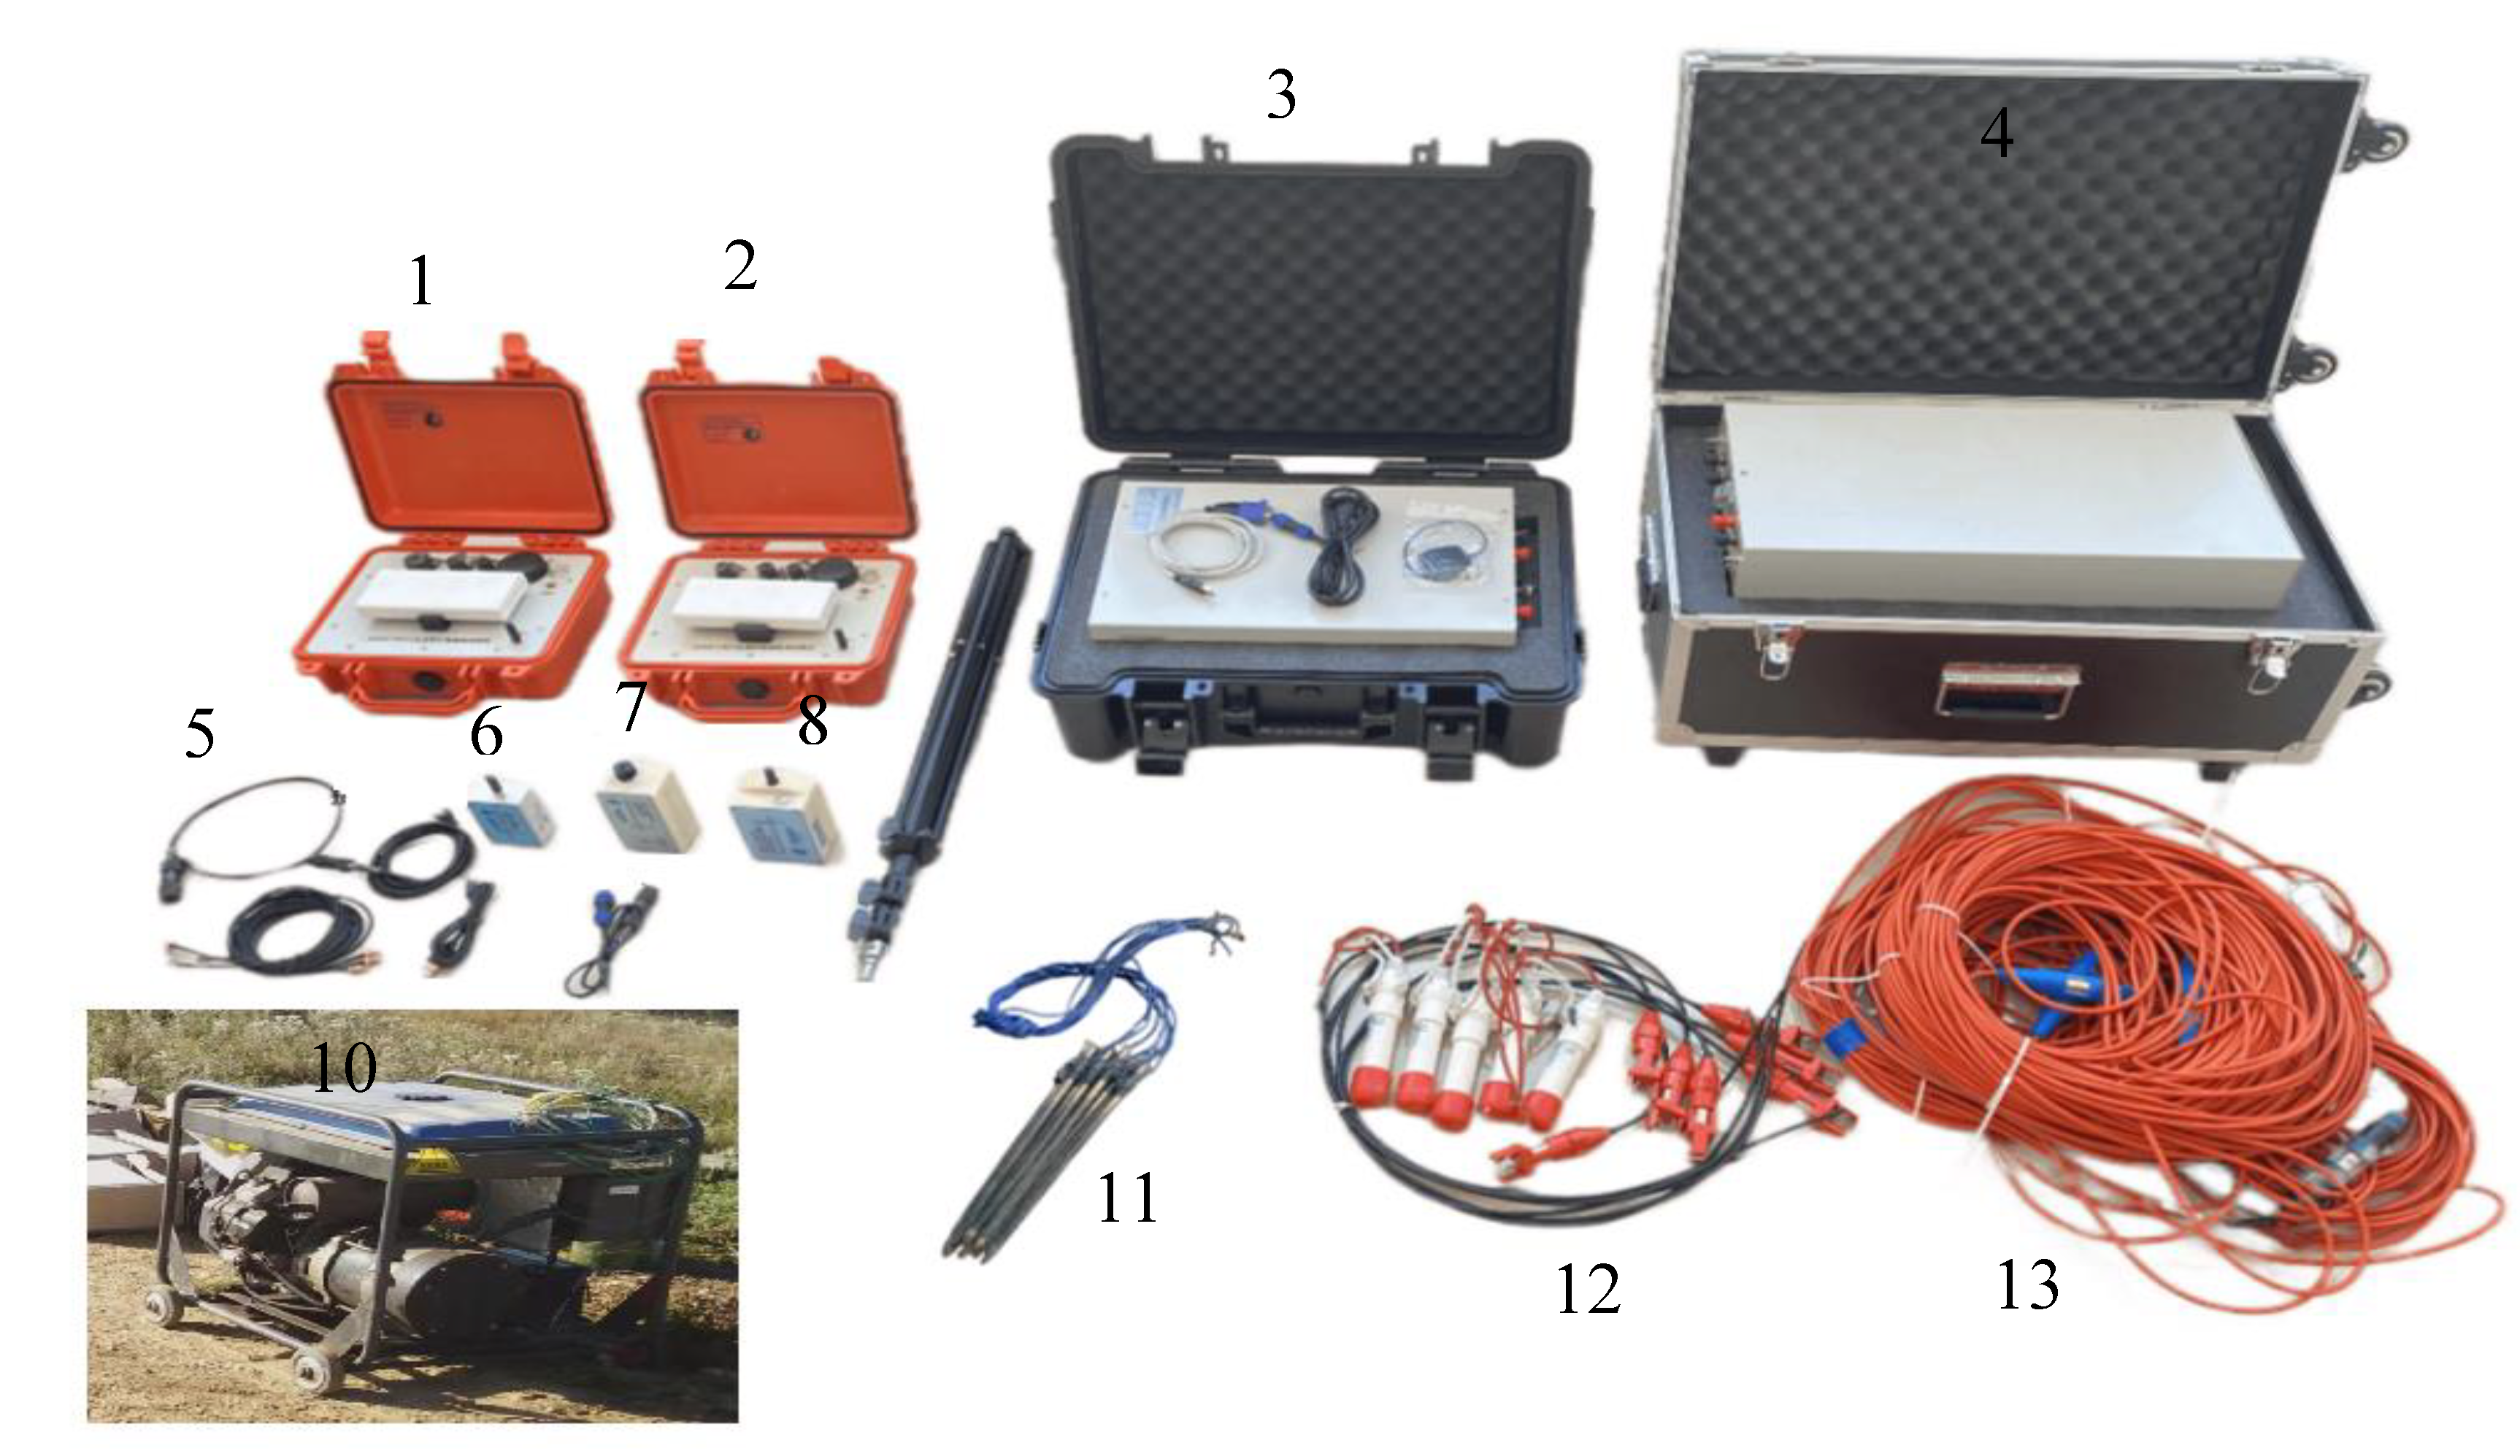
Materials used for the SSIP survey. (1) GS2IP-FW10 Full Waveform SSIP Receiver, (2) GS2IP-FW13 Full-waveform SSIP current acquisition station, (3) SSIP transmitter, (4) GSTP series programmable DC power supply, (5) Receiver power cord, (6) Receiver wireless control box, (7) Current converter, (8) Receiver relay station, (9) Tripod, (10) Power generator, (11) Brass electrodes for current injection, (12) Non-polarizable Pb–PbCl2 electrodes, and (13) SSIP receiving cable.
Figure 2.
Materials used for the SSIP survey. (1) GS2IP-FW10 Full Waveform SSIP Receiver, (2) GS2IP-FW13 Full-waveform SSIP current acquisition station, (3) SSIP transmitter, (4) GSTP series programmable DC power supply, (5) Receiver power cord, (6) Receiver wireless control box, (7) Current converter, (8) Receiver relay station, (9) Tripod, (10) Power generator, (11) Brass electrodes for current injection, (12) Non-polarizable Pb–PbCl2 electrodes, and (13) SSIP receiving cable.
About 5km southwest of the Gucheng-Yaxi prospecting area, a large porphyry copper-gold deposit called Chating was discovered in recent years, which is here taken as reference. The Chating deposit is shallowly overburdened, and the cover of the deposit revealed by the drill holes consists of Quaternary strata with thickness of 3–10 m and Lower Cretaceous strata with a thickness varying from several to hundreds of meters [24]. The sedimentary rocks surrounding the deposit belong to the Lower Triassic Helongshan Formation, which are dominated by limestones with minor argillaceous limestones and mudstones [26]. The ore-bearing rocks of the Chating deposit occur as concealed quartz diorite porphyry stock while the ore hosting structure is breccias inside the porphyry stock [27]. The ore-bearing rocks and the hosting structures are overlaid directly by volcanic rocks, while the wall rocks are marble rocks [28]. The copper mineralization is thought to be closely related to the porphyry alteration, with the main orebodies hosted in the potassic and phyllic alteration [29].
3. Method and Materials
3.1. Audio Magnetotellurics
Audio magnetotellurics (AMT) method is a geophysical method that probes the electrical structure of the subsurface by making use of natural electromagnetic (EM) fields originating from global lightning or sferics (short period signals) and solar wind activities in the ionosphere (long-period signals). The AMT make use of the portion of EM fields that are typically in the frequency band between 1Hz and 10,000 Hz. The method was first introduced by Andrey Nikolayevich Tikhonov in 1950 [30] and Louis Cagniard in 1953 [31]. Later, the method was further developed by Cantwell Thomas in 1960 [32,33] and Keeva Vozoff [34]. In principle, the earth is viewed as a horizontal medium and the magnetotelluric fields as the plane EM waves projected vertically onto the ground [35]. When these waves impinge the ground, large proportions of them are reflected, and a small fraction is transmitted into the subsurface [34]. EM induction causes telluric currents within the subsurface whose magnitude depend on electrical resistivity the subsurface materials. Diffusive signal transmission occurs, resulting in signal decay as the depth increases [36]. The skin depth (δ) defined as the depth (in meters) of EM wave decay in the subsurface when the amplitude diminishes to 1/e of its value at the surface, is given by the following expression [37]:
where ρ is the resistivity in Ωm, f is the frequency in Hz, and μ is the magnetic permeability in H/m
The above expression shows that the low frequency EM fields penetrate to greater depths, and high frequency fields are limited to shallow depths. On the ground, orthogonal EM field components are measured. The frequency response reflects the distribution of the electrical properties of the subsurface medium. The variation of the EM field component with time is converted into a frequency spectrum. EM frequency domain responses such as apparent resistivity and the impedance phase can be computed. Apparent resistivity is calculated using the following expression:
where f is the frequency, ρ is the resistivity, Ex is the electric field and Hy is the magnetic field.
3.2. Audio Magnetotellurics Instruments
The time series data were recorded with GSEM-W10 system. This is an acquisition system that is produced by Giant Sequoia Artificial Intelligence Technology Co., Ltd., Changsha, China [38]. The Internet of Things (IoT) Wideband Ground Electromagnetic Instrument GSEM-W10 integrates Audio Magnetotellurics (AMT) and Magnetotellurics (MT or LMT) capabilities. It features portability, low power consumption, low noise, and high exploration efficiency. Particularly noteworthy is its support for networking observations with hundreds of IoT wideband ground electromagnetic instruments, significantly enhancing exploration accuracy and efficiency while reducing exploration costs. The optimal exploration depth for AMT mode is approximately 1000 meters, while MT mode can achieve a maximum exploration depth of up to 150 kilometers. This allows for simultaneous consideration of exploration depth and accuracy, ultimately reducing user costs.
Figure 3.
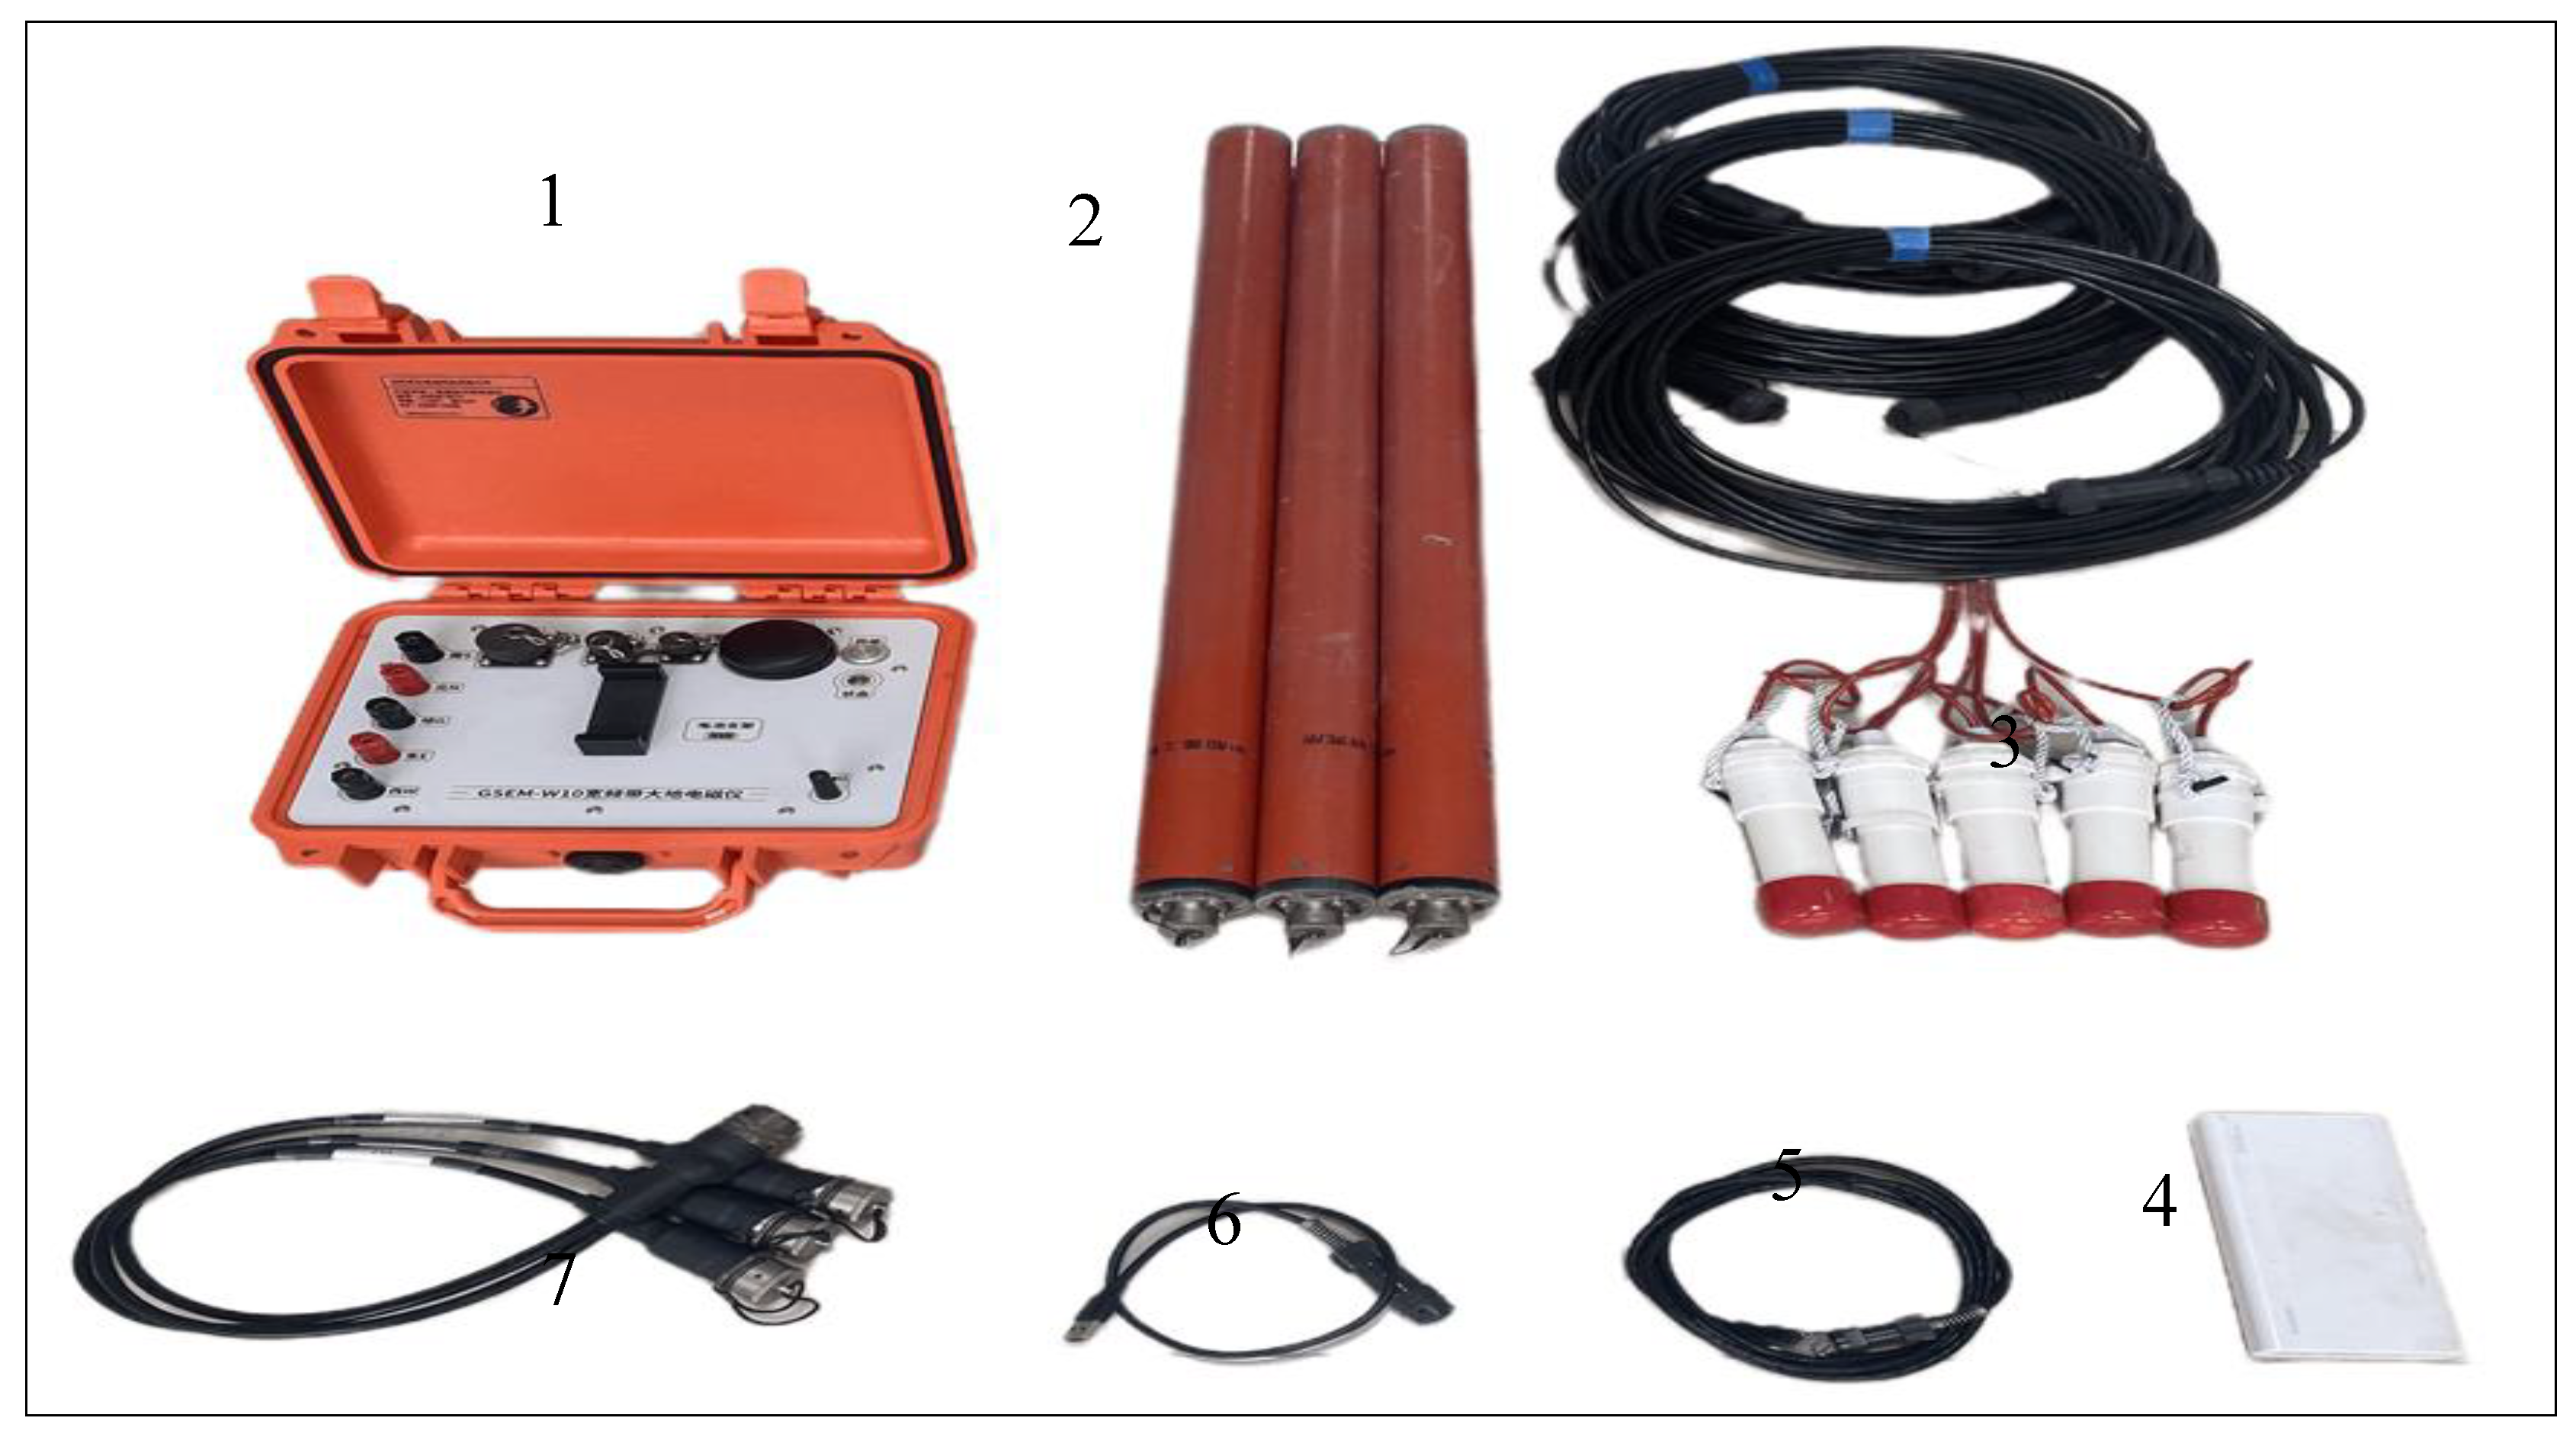
Materials used for Audio magnetotellurics survey. (1) GSEM-W10 AMT acquisition units; (2) Induction Coil Magnetometers (ICM); (3) Non-polarizable Electrodes; (4) Portable power bank; (6 and 7) Connecting field cables.
Figure 3.
Materials used for Audio magnetotellurics survey. (1) GSEM-W10 AMT acquisition units; (2) Induction Coil Magnetometers (ICM); (3) Non-polarizable Electrodes; (4) Portable power bank; (6 and 7) Connecting field cables.
3.3. SSIP
SSIP method is new frequency domain induced polarization (FDIP) method [39]. The method uses spread spectrum communication for geophysical instruments. This system has the characteristics of large depth, high precision, anti-interference, low cost, and high efficiency. It is currently widely used and has produced significant social and economic benefits [24]. The main difference between FDIP and SSIP method is the type of signal used for the injected (primary) current. The SSIP system sends M-sequence pseudo random spread spectrum signals through the transmitter as the primary source current [40,41]. In traditional FDIP the type of signal used for the injected (primary) current are rectangular current waves with boxes of constant durations. In SSIP survey comparison is made between the voltage signals measured on the potential electrodes with the signals transmitted through the current electrodes over several frequencies (i.e., a spectrum of frequency) [18]. The frequency band of SSIP acquisition is 1/16 –1 Hz and the amplitude of primary injected current depend on the strength of EM interferences in the area under survey. That is, in areas with strong EM interferences caused by cultural activity such as mining operations and drilling activities, large primary current amplitudes are transmitted [39]. The apparent complex resistivity for a set of frequencies can be obtained in a way similar to the traditional FDIP approaches:
where ρ(f), U(f) denotes the frequency spectrum of the potential difference data, I(f) is the frequency spectrum of synchronous primary current data, and K corresponds to the geometric factor of the array.
The system represented by the equation has M and N as the voltage electrodes and A and B as the current electrodes. The distance between the individual electrodes is represented by the variables AM, BM, AN, and BN.
In SSIP, comparison is made between the voltage signals measured on the potential electrodes with the signals transmitted through the current electrodes over several frequencies (i.e., a spectrum of frequency).
3.4. SSIP Working Principles and Parameters
The transmission subsystem provides precise synchronous transmission of spread spectrum waves by utilizing cutting-edge technology including high-precision GPS synchronization and a high-power IGBT inverter [14]. The apparatus can broadcast spread spectrum waves with orders between 3 and 9 at frequencies between 1/256 Hz and 8192 Hz. A maximum voltage transmission of 1000V, a maximum current transmission of 10A, and a maximum frequency transmission of 256 frequencies are the characteristics of the frequency wave. Modular series or parallel technologies can be used to increase the sending voltage or sending current with flexibility. Through the use of wireless dispersed network observation, the receiving subsystem is able to perform multi-device combination reception and high-density power supply along the measuring line. It is possible to attain a maximum of 1200 concurrent acquisition channels. It is possible to provide conventional devices for future inversion through the use of channel combination technology. A data capacity increase of more than ten times improves inversion accuracy and reliability.
The exploration array used for spread SSIP deep sounding is a double-sided pole dipole array, as shown in Figure 4 (Land Acquisition Schematic). During construction, the number of measurement points is first calculated based on the profile length and point spacing. Subsequently, all potential electrodes and acquisition stations are arranged simultaneously along the entire profile. Power is then supplied point by point according to the designated power supply points. During each power supply, all channels measure simultaneously. Once all the designated power supply points are completed, the measurement for the entire profile is finished.
During the acquisition, the initial current electrode spacing is set to be 80m. Then, it is increased at C23 up to C27 is set to 200m, and then at between C27 and C28 up to C29 is set to be 250m. the spacing between potential electrodes is constant 40m as you can see in Figure 4. There are 29 current injections inside and outside the receiver array to ensure the high resolution of near-surface structures.
The GS2IP-FW10 were used for data acquisition, this is an acquisition system that is also produced by Giant Sequoia Artificial Intelligence Technology Co., Ltd., Changsha, China. this device accomplishes synchronous real-time full-waveform acquisition and real-time data quality monitoring of large-scale SSIP receivers based on the ZigBee wireless sensor network and GPS timing [38].
4. Data Acquisition and Processing
4.1. AMT Data Acquisition
In June 2022, we conducted an AMT survey in Gucheng-Yaxi Area, Gaochun District, Jiangsu Province, China. The survey involved a single 5000m long line oriented in a south-north direction with 60 stations spaced approximately 100m apart. The line was positioned perpendicular to the assumed geological strike, with the y-axis aligned parallel to the strike and the x-axis along the profile (S-N).
AMT time-variant field data were collected using the GSEM-W10 system developed by Giant Sequoia Artificial Intelligence Technology Co., Ltd., Changsha, China [38]. The data consisted of time series from 53 frequencies ranging from 1Hz to 10400Hz. Two horizontal components of the electric field (Ex and Ey) and two orthogonal components of the magnetic field (Hx and Hy) were measured using induction coil magnetometers (ICM). For electric field measurements, two pairs of non-polarizable lead chloride (Pb-PbCl2) electrodes were utilized, with each measurement point pre-soaked in water to reduce contact resistivity.
Data recording occurred during daytime, with each station measuring for 35 to 40 minutes. Raw data visualization, quality checks, and processing were carried out using the GSEM-pros software [42]. The processing involved transforming time series data into the frequency domain through a statistical Discrete Fourier Transform (DFT) within the GSEM-pros software.
The cross-power spectra obtained from this process allowed for the estimation of the impedance tensor as a function of frequency, providing information about the dimensionality and strike of subsurface structures. Overall, the data quality was deemed good at all surveyed sites.
4.2. SSIP Data Acquisition
The spread spectrum IP collection settings have been developed based on current work area data and the designated exploration depth. The distance from the place of reception is 40 meters.
The maximum length of an individual profile is 2000 meters, which may be adjusted based on the specific characteristics of the terrain. In the western work area of Guchenghu, there exists a vertical gap of 5km between the measuring line and the power supply point B, which is located at an endless distance. The maximum distance for transmitting and receiving signals in the Guchenghu West Work Area is 3km. The waveform being sent is a 5th-order spread spectrum wave, which consists of four frequencies that have been merged. The fundamental frequency is 1/16 Hz. The measurement parameters consist of four parameters related to resistivity, three parameters related to relative phase, and one parameter related to frequency dispersion.
The acquisition of the induced polarization field in the spread spectrum requires preprocessing in order to obtain parameters such as apparent resistivity, relative phase, and dispersion. However, these parameters are currently stored in multiple binary files, with each file corresponding to a specific power supply. It is important to note that these files do not contain any elevation information. In order to perform inversion, it is vital to consolidate all observable resistivity, relative phase, and dispersion values of the corresponding frequency into a single file. Concurrently, the elimination of erroneous data points and the inclusion of elevation data are essential steps. The use of the SipProc software may make these activities easier to carry out.
Figure 6.
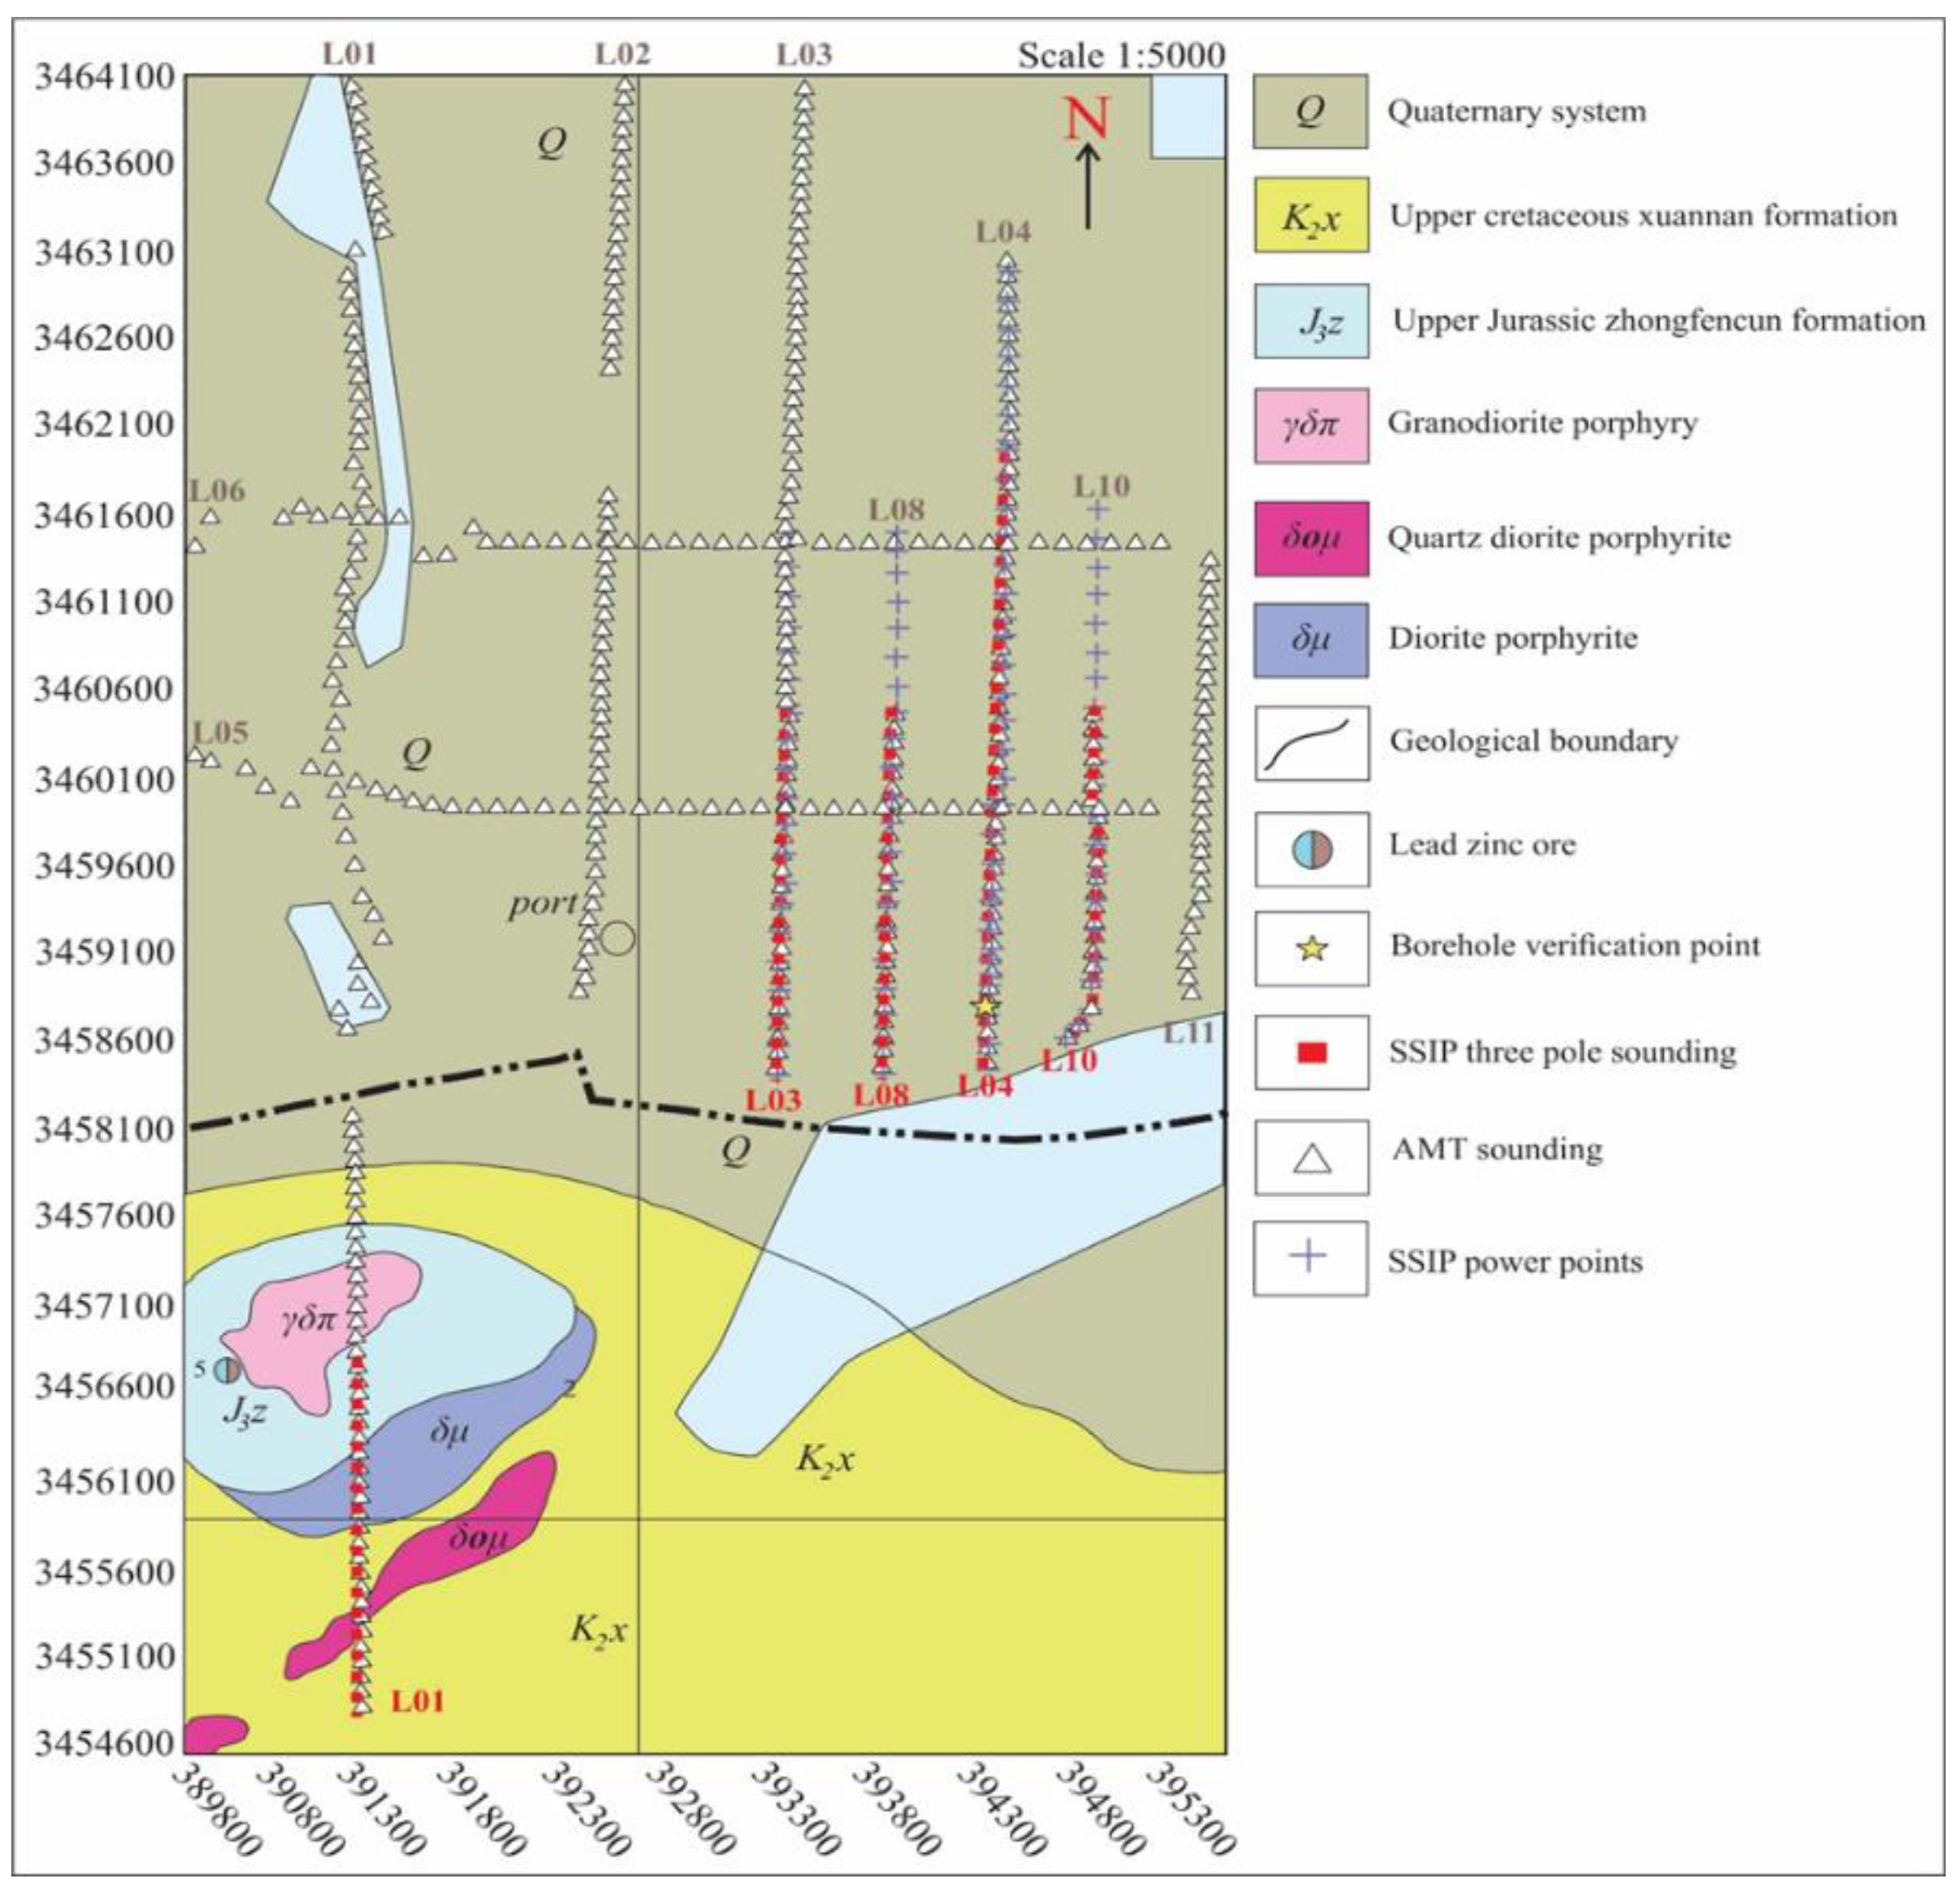
Map showing the AMT and SSIP survey lines on top of an interpretation of the geology across Chating copper-gold deposit L01 and new explored area Cu-polymetallic deposit in Gucheng.
Figure 6.
Map showing the AMT and SSIP survey lines on top of an interpretation of the geology across Chating copper-gold deposit L01 and new explored area Cu-polymetallic deposit in Gucheng.
5. Data Analysis
Using the MTPy software package, we conducted data analysis and visualization on the observed processed AMT data. Here the plot for the resistivity-phase curves, dimensionality, and geoelectric strike are analyzed. The MTPy is an open-source python library for magnetotelluric data analysis, developed by Geoscience Australia [43,44].
5.1. Apparent Resistivity-Phase Curves and Pseudo-Sections
The resistivity-phase curves (Figure 7) show the quality of acquired AMT data for four selected representative sounding stations. The resistivity structure of the study area shows low resistivity at short period with phase angle asymptotic to but greater 45°, and high resistivity at long period with phase angle below 45°. Hence the subsurface can be generally categorized into a shallow conductive layer and a deep resistive layer (Figure 7).
5.2. Dimensionality Analysis
Before performing inversion, we analyzed the dimensionality of the AMT data to see if the phases at a given frequency, computed impedance tensors, and apparent resistivity corresponded to one-, two-, or three-dimensional (1D, 2D, or 3D) geoelectrical structures. Since the phase tensor is unaffected by surface distortions, we used it to analyze dimensionality for this reason [45].
The phase tensor skew (β) parameter in phase tensor analysis provides crucial details regarding the complexity and dimensionality of the AMT data for the subsurface structure. The phase tensor in a one-dimensional Earth or layered subsurface has a circular form, signifying a modest skew angle (β) [45]. The phase tensor is elliptically distributed in the case of a 2-D regional resistivity structure. When dealing with a 2-D regional resistivity structure, the phase tensor takes on an elliptical form. For error-free data, β decreases to zero [46]. The phase tensor in the three-dimensional Earth has huge β values and is non-symmetric. It has also been demonstrated that a quick lateral shift in the phase tensor’s primary axis indicates the presence of three-dimensional structures [45]. It is generally considered that when β ≤ 5° it is approximately 2D, and when β > 5°, it is regarded as a 3D structure [47]. Hence in this work, a criterion for |β| ≤ ± 5° is taken into consideration for a 2D structure.
The pseudo section of phase tensor analysis along L04 profile is shown in Figure 8. The dimensionality of the study is mainly 2D with 3D effects. Nearly all sounding stations are affected by 3D effects at period of about 10-3 s and in the period between 10-1s and 1s. The stations from 208U to 223U and 351U to 371B are seriously affected by 3D effects nearly at all periods. In summary, our AMT data show large β-values and the phase tensors are elliptical and non-symmetric in shape. Since the study area is characterized dominated by 2D with 3D structures, 2D inversion for determinant data is preferred [48].
5.3. Geoelectric Strike Estimation
Geoelectric estimation provides important information for joint interpretation of geological data and AMT data. Hence before AMT data modeling, geoelectric strike estimation is an important step. According to Niasari (2016) [49], the preferred direction of electric current flow in the subsurface due to lateral inhomogeneity of electric conductivity on Earth defines the geoelectric strike. The geoelectric strike also provides information on the stratification of the Earth and its deep structures. In this work, we use the invariants of the impedance tensor (Z) parameter to estimate the geoelectric strike for the subsurface structure [50]. The obtained strikes are shown in Figure 9 as rose diagrams at different decades and all periods. The determined strikes with a 90° ambiguity range between N42.5°E and N67.5°E. The strike values show a decreasing trend with period increase which imply a directional change with depth in the study area. The results from all period range (10-4 s to 1s) show a relatively clear geoelectric strike direction of NE which is in a good agreement with the Northeast - Southwest (NE-SW) regional structure of the area (such as Maoxi fault in Figure 2).
6. Two-Dimensional Inversion
6.1. Audio Magnetotellurics
The process of AMT inversion involves the conversion of impedance values determined at different locations and frequencies into resistivity values at various spatial locations. The project utilizes the ZondMT2D inversion programme, a product of Moscow University in Russia. This software is known for its exceptional dependability in inversion, rapid processing capabilities, and impressive precision. The software has the capability to conduct fundamental processing tasks, including static correction, automated editing, and data filtering, on input impedance data. After that, it makes it easy to quickly make pictures of the apparent resistivity profiles and maps using techniques for parallel inversion. AMT data inversion mainly includes the following steps.
- Data Import: Import all the EDI files obtained from impedance estimation into ZondMT2D software.
- Setting Inversion Meshing Parameters: After importing data and confirming the correct location information of each measurement point, it is necessary to set the grid parameters for inversion
- Automatic editing and filtering of impedance data: In order to remove frequency points with significant interference, impedance data needs to be point filtered before inversion
- Set inversion parameters and invert: After filtering the impedance data, it is necessary to set parameters such as the number of inversion iterations, RMS minimum error, and model resistivity range. Then, based on the interference situation of the data, one of TM mode, TE mode, or equivalent impedance mode is selected for inversion. Generally, equivalent impedance mode is selected for inversion.
6.2. SSIP
The polarization inversion programme used for spread spectrum employs the ZondRes2D inversion software, which was created by Moscow University in Russia. The software’s inventor has engaged in a long-standing collaboration with Professor Chen Rujun from Central South University for over a decade. Throughout this partnership, they have diligently worked together to enhance the collecting technique and refine the data features pertaining to spread spectrum-induced polarization. The use of this method in mineral exploration activities carried out in numerous regions, including Tibet, Yunnan, Guizhou, Henan, Gansu, and others, has demonstrated its dependability and precision. The outcomes of these endeavors have garnered significant recognition from collaborating entities. The input format used by ZondRes2D corresponds to the standard Res2Dinv format generated by the SipProc programme. The particular details of the data content may be seen in Figure 10. The dataset encompasses many metrics, including frequency, location, elevation, resistivity, relative phase, and error, specifically pertaining to a single frequency point. The inversion input file may be generated by defining the parameters for each frequency point in the spread spectrum-induced polarization measurement. ZondRes2D software enables the inversion of measurement data obtained at various frequencies. By comparing the inversion outcomes, it becomes possible to assess the trustworthiness of the resistivity findings and ascertain the trend of induced polarization information. The operational procedures and settings associated with this interface exhibit a certain level of complexity.
7. Results and Discussions
7.1. AMT and SSIP
The 2D resistivity models of L04 are shown in Figure 10, revealing that the overall electrical structures of the Guchen area are not layered. The shallow part of the AMT profile (Figure 10a) is generally low resistivity, and the thickness gradually increases to the north, and the northward fault sediments in the region are also gradually thickened. Combined with the regional geology, it is inferred that the shallow low resistivity zone corresponds to a huge thickness of Jurassic-Cretaceous clastic rocks and volcanic rock covers. Between the southern end of the profile and the 236-measurement point, there are two regions exhibiting notable high resistivity abnormalities. The depth to the first anomaly is 500 meters from the surface located in the southern end reaching the bottom of the profile. The depth to the second high resistivity anomaly is from 200 to 800 meters below the 218-measurement point. A transition zone exists between the two anomalous structures with moderate high resistivity between the depth range of roughly 300–1200 meters.
The SSIP models of the line L04 (Figure 10b and c) correspond to the horizontal relative AMT profile coordinates of 0 - 3.4 km. The transition zone on the AMT profile between high-resistance bodies is characterized by low resistivity and high chargeability (IP) in the SSIP profile (Figure 10c). Taking test AMT and SSIP results obtained from the nearby Chating mining area that have borehole verification as guide, it is inferred that the L04 line section is granodiorite porphyry from the southern end to the 236measurement point. This area is a favorable mineralization site similar to Chating deposit, so based on comprehensive considerations, the area at the depth of around 400m to 1200m at the southern end of the 195-measuring point on the L04 profile (Figure 10) in the west of Gucheng Lake is consistent with the target anomaly feature area. It is recommended to drill at this location at a depth of 1200m. hence a borehole (ZK001) is established for verification which is discussed later.
Figure 11.
Drilling verification results of AMT resistivity profile and SSIP resistivity & chargeability Profile. 1; Quaternary, 2; Lower Cretaceous Ganhe Formation, 3; Lower Cretaceous Zhongfencun Formation, 4; Silt stone, 5; Glutenite, 6; Conglomerate, 7; Dacite volcanic breccia, 8; Limestone, 9; Marble, 10; Pb-Zn ore body, 11; Cu-Au ore body.
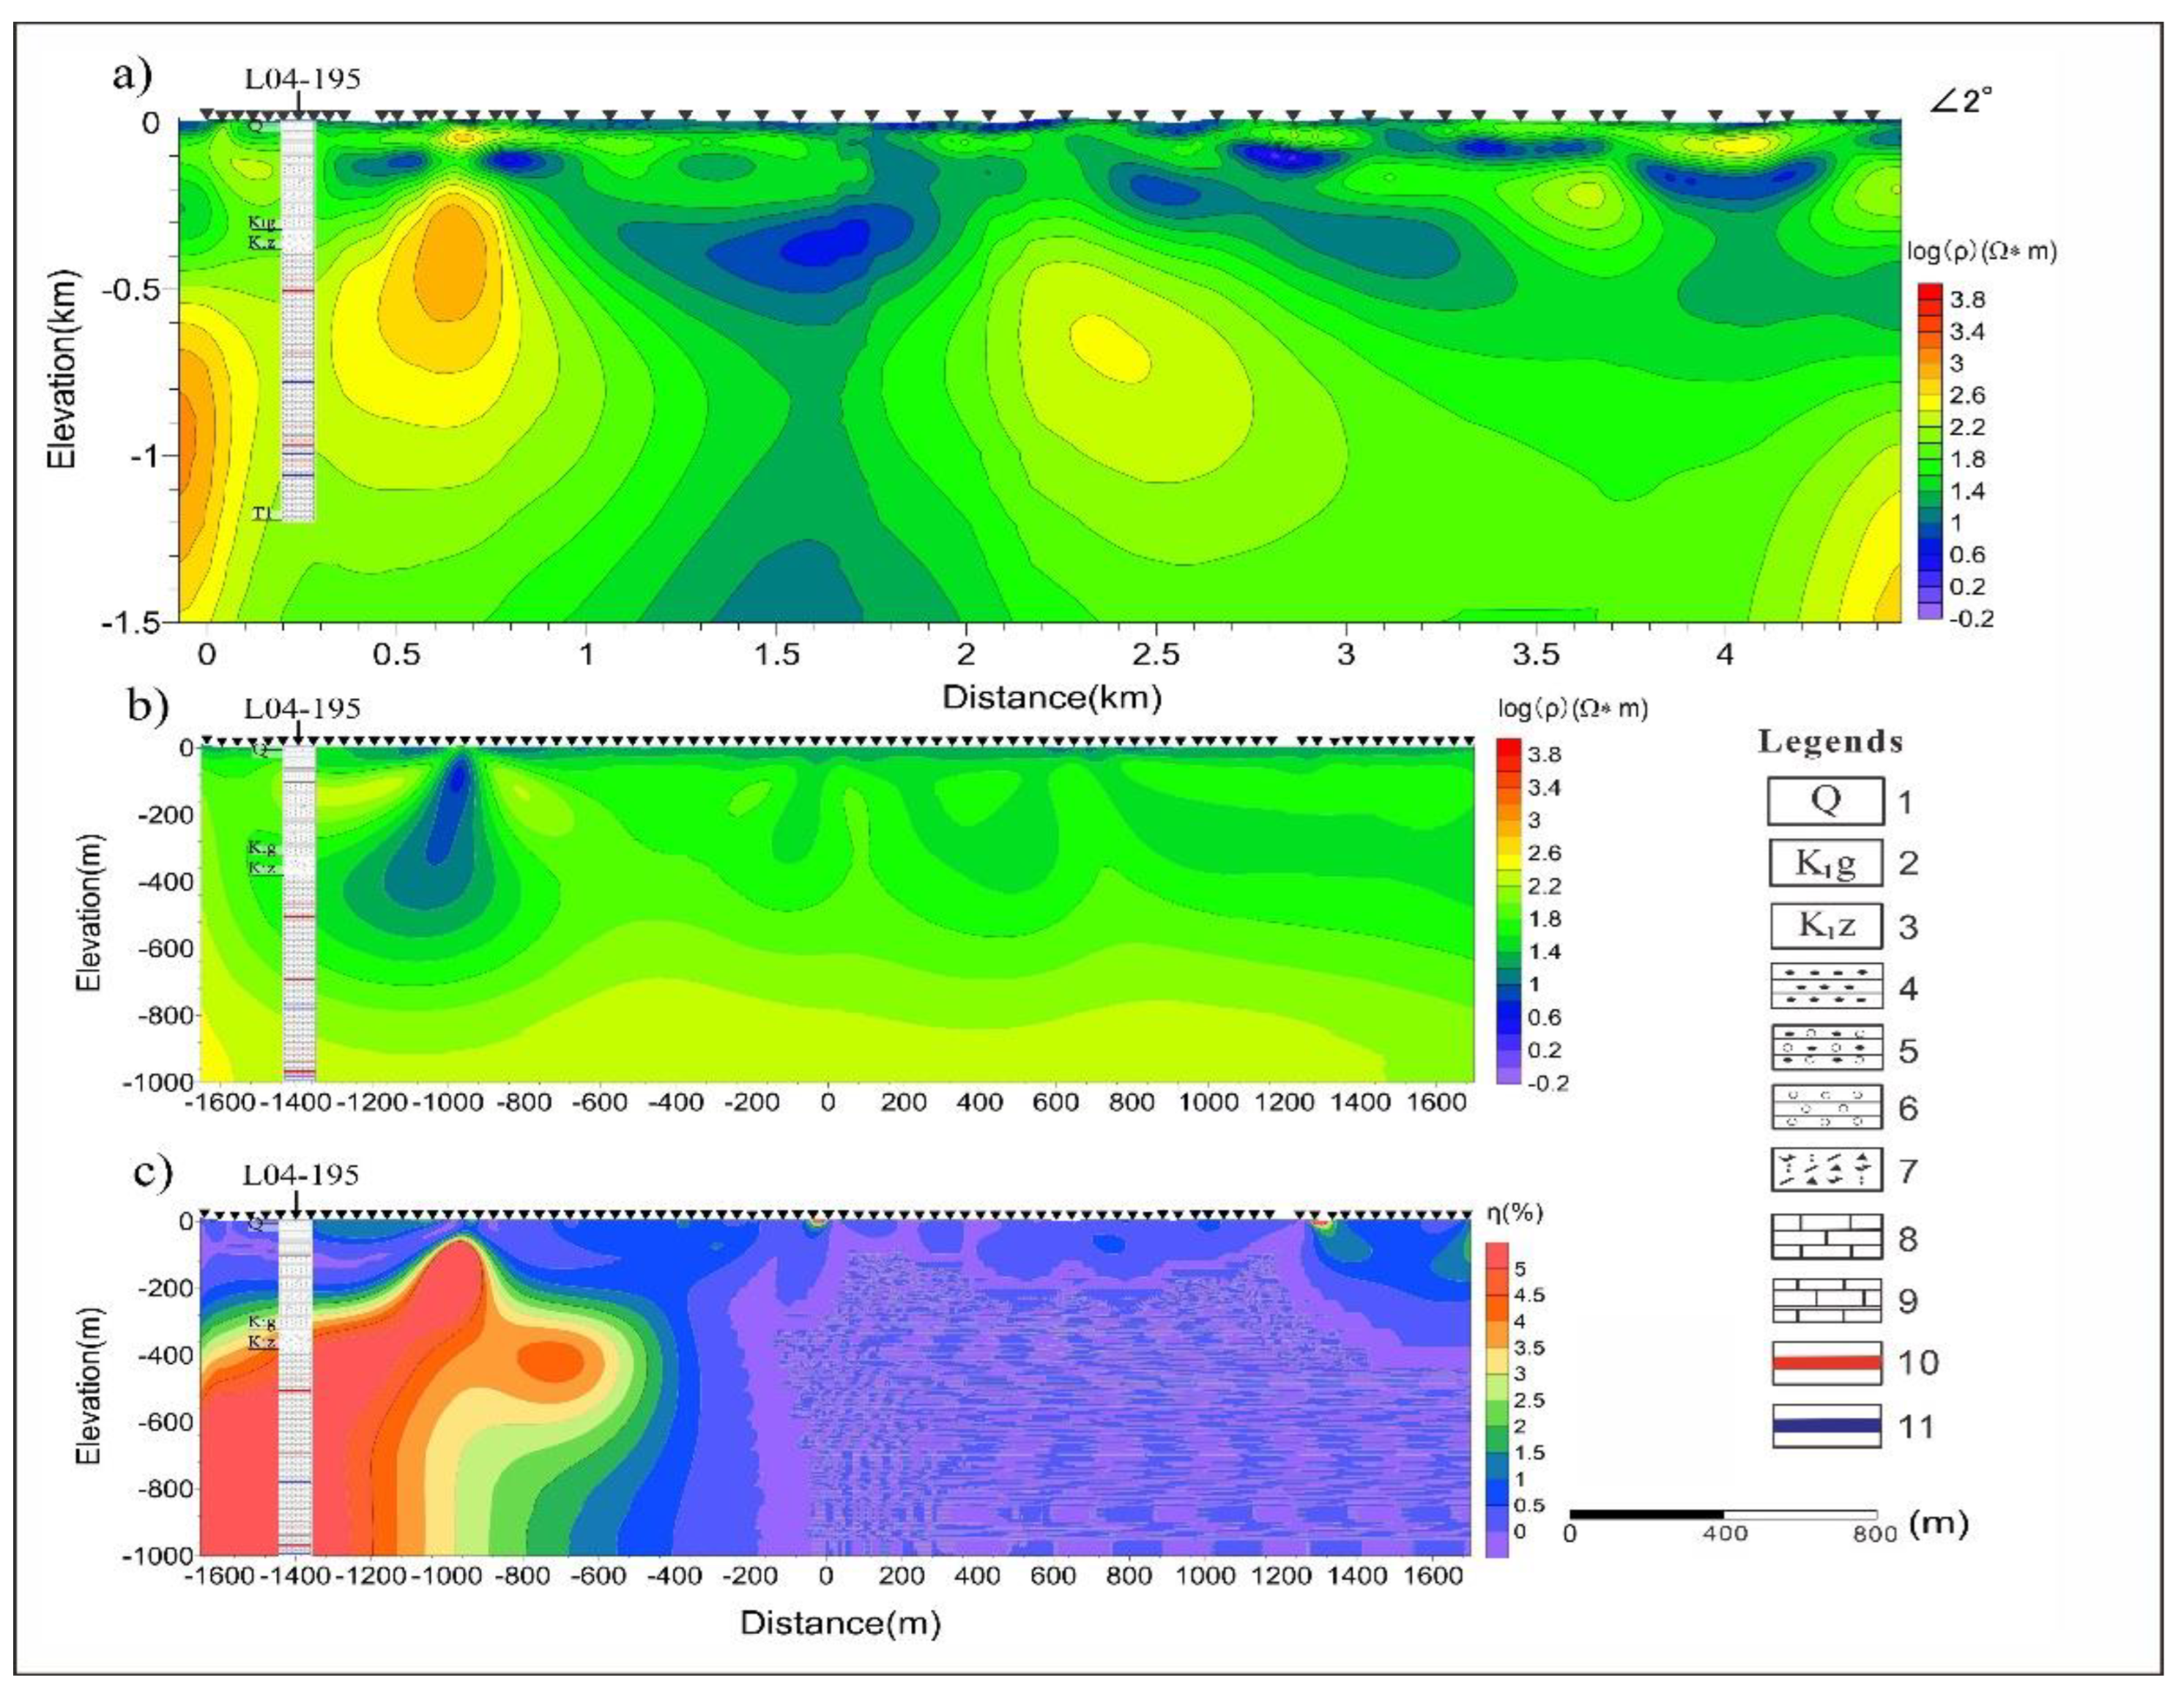
Continuing to the north along the survey line, the high-resistance body of 500~1000m in the middle of the AMT profile of line L04 does not reflect the polarization anomaly in the SSIP inversion profile, and is inferred to be granodiorite. There is an obvious low resistance zone near the 281-measurement point, which extends to the south in the deep part and has a large cutting depth, which is inferred to be the location of the regional fault. Combined with the regional tectonic data, the low-resistivity areas that spread toward the north are speculated be attributed to Lower Triassic carbonate rocks and faults. Meanwhile, the deeper moderate to high resistivity section from 281 measurement point toward the north is inferred to be granodiorite porphyry.
Based on the observed morphology of the high resistivity anomaly, it can be deduced that the geological structure of the L04 line mineralization potential area and the test section at Chating mining area is characterized by a northward intrusion of the southern granodiorite porphyry. This intrusion process may lead to alterations, metasomatism, and mineralization within the area. Porphyry deposits exhibit the presence of finely-grained disseminated pyrite and fine vein pyrite, which have the potential to induce notable induced polarization (IP) anomalies.
7.2. Borehole Verification
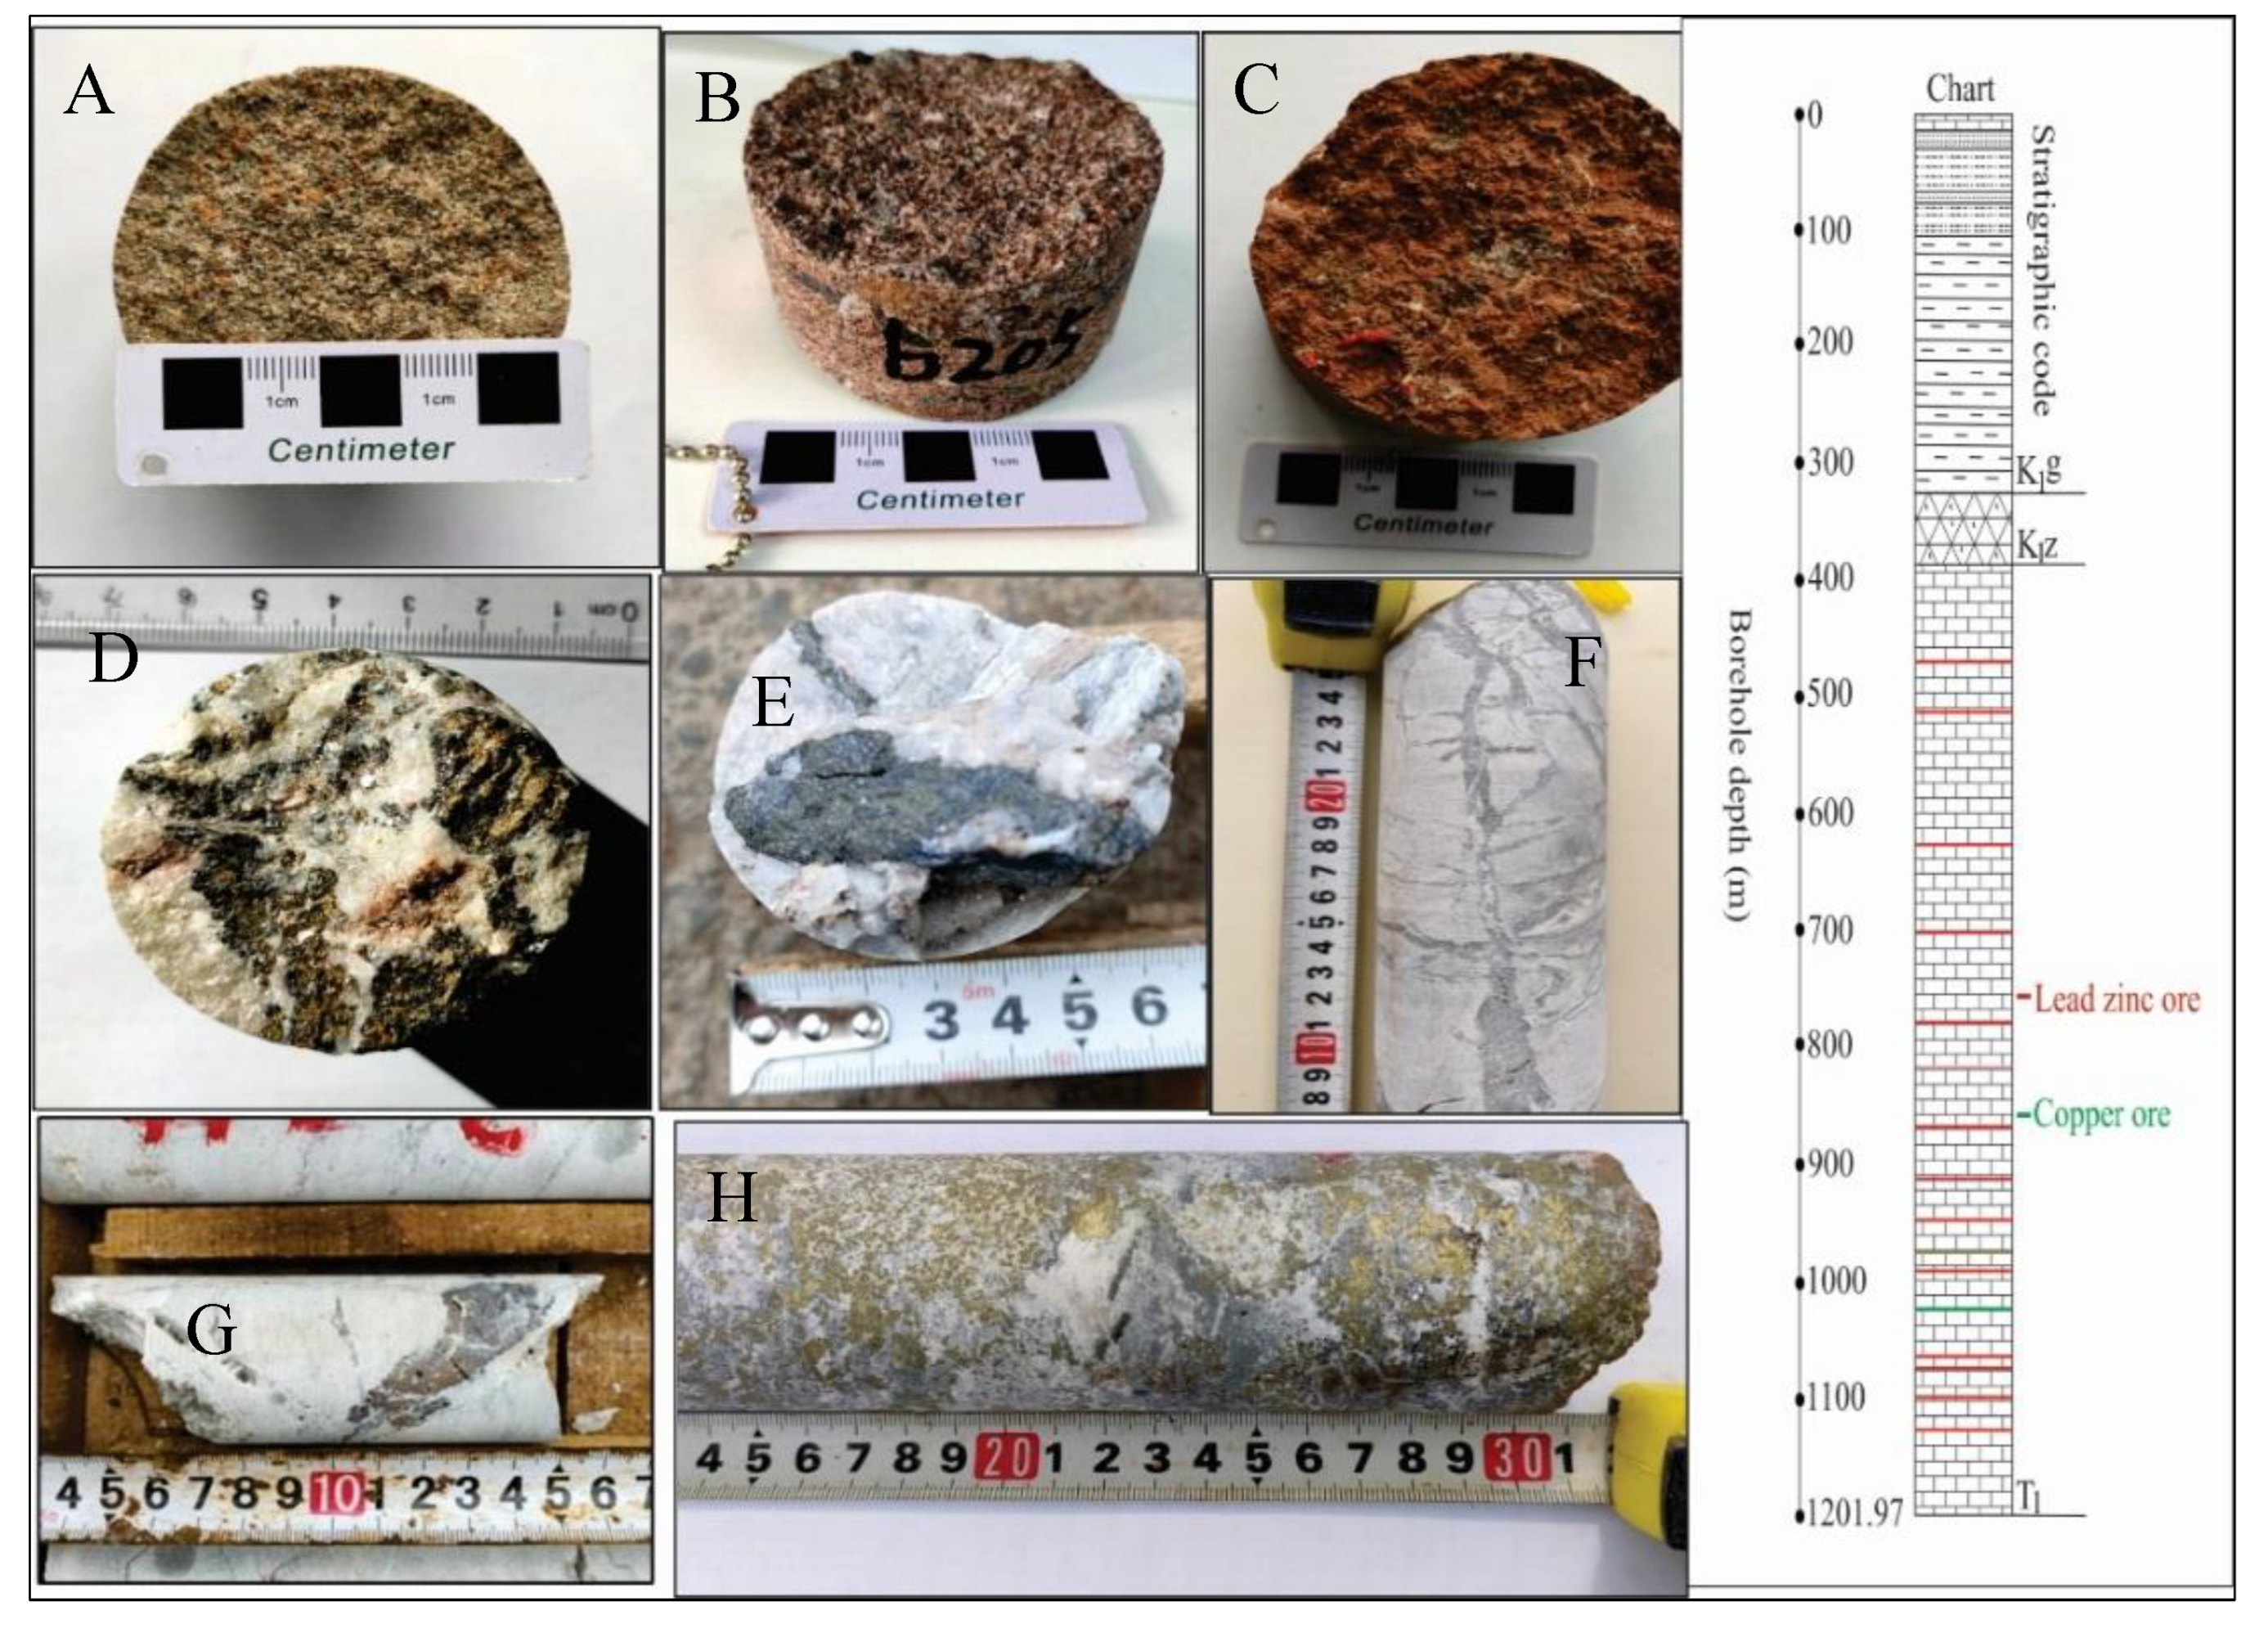
The stratigraphic column obtained from drill hole ZK001 is shown in (Figure 12) to a maximum depth of 1201.97 m. Through verification, a thick mineralized dolomite zone was revealed, and 13 polymetallic veins containing copper, lead, zinc, gold, and silver were newly discovered, with individual vein thickness ranging from approximately 0.15m to 3.4m and a cumulative thickness of 17.03m. Laboratory analysis confirmed the presence of one lead-zinc ore body with a thickness of 3.40m and average grades of Zn 3.13% and Pb 0.58%; one lead-zinc-gold polymetallic ore body with a thickness of 1.25m and grades of Zn 7.45%, Pb 8.14%, Ag 41.52g/t, Au 1.29g/t, Cu 0.16%; one lead polymetallic ore body with a thickness of 1.20m and grades of Pb 0.83%, Zn 0.87%, Au 0.69g/t; one zinc ore body with a thickness of 0.55m and grade of Zn 1.75%; one copper-gold-lead-zinc ore body with a thickness of 1.70m and grades of Cu 3.53%, Zn 2.03%, Pb 2.45%, Ag 114g/t, Au 1.60g/t; four low-grade gold ore bodies; one low-grade silver ore body; and two low-grade zinc ore bodies.
The main lithology in the order from the surface is as follows: quaternary layer with a thickness of about 100 m, K1g with 200 m thickness, K1z with a thickness of about 100m, and from 400 m to 1201.97 is marble from the Triassic (T1). Copper, lead and zinc ores mainly occur interspaced in the marble layer between 400 m and 1201.97m depth. Core samples from the drill hole are presented in Figure 12.
8. Conclusions
This article presented new AMT and SSIP data from a potential Cu-polymetallic mineralization in Gucheng-Yaxi Area, Gaochun District, Jiangsu, China. 2D interpretation was facilitated by undependably inverting the two data sets which provided the best favorable mineralization location for a drill hole for verification. The location of proven Cu-polymetallic mineralization on the AMT profile occurred on the transition zone between two resistivity structures attributed to unmineralized marble. On the SSIP profile, the mineralized zone exhibited the highest chargeability that is distinct from the sounding area. The ore bearing rock is mainly marble rock mass in which mineralization occurs interspaced at varies depth. Several low resistivity zones with weak chargeability anomalies were revealed and inferred to be caused by faults that are thought to have played a vital role during the mineralization process. In summary, this project, using new methods and technologies, achieved a significant breakthrough in the exploration of deeply concealed ore deposits in high-interference areas. It confirmed that the combination of these exploration techniques can identify ore and non-ore bodies at great depths in high-interference covered areas, providing an advanced combination of mineral exploration technologies for Jiangsu’s new round of strategic breakthroughs in mineral exploration. this work demonstrated the successful application of the electrical SSIP method and electromagnetic AMT method to detect a new polymetallic deposit under thick cover in an area with high cultural noise.
Author Contributions
F.U. conceptualized and designed the study, collected and analyzed the data, and wrote the manuscript. Z.X. contributed to the study design and data analysis and critically revised the manuscript for important intellectual content. Z.X. and R.C. provided technical support and expertise in the data analysis and contributed to the interpretation of the results. Y.L., Y.H, H.H., C.S, and W.Q. contributed to the data collection process. All authors have read and agreed to the published version of the manuscript.
Funding
Jiangsu Province Natural Resources Special Fund Project (No. Sucai-zihuan 2023-30); Basic Science Centre Project of the National Natural Science Foundation of China, Grant Number 72088101.
Data Availability Statement
The data generated in this study may be obtained on request by contacting the corresponding author.
Conflicts of Interest
The authors declare no conflicts of interest.
References
- Yan, J.; Liu, X.; Wang, S.; Xie, J.; Liu, J. Metallogenic type controlled by magma source and tectonic regime: Geochemical comparisons of Mesozoic magmatism between the Middle–Lower Yangtze River Belt and the Dabie Orogen, eastern China. Ore Geology Reviews 2021, 133, 104095. [Google Scholar] [CrossRef]
- Calvo, G.; Valero, A. Strategic mineral resources: Availability and future estimations for the renewable energy sector. Environmental Development 2022, 41, 100640. [Google Scholar] [CrossRef]
- Nate, S.; Bilan, Y.; Kurylo, M.; Lyashenko, O.; Napieralski, P.; Kharlamova, G. Mineral policy within the framework of limited critical resources and a green energy transition. Energies 2021, 14, 2688. [Google Scholar] [CrossRef]
- Sovacool, B.K.; Ali, S.H.; Bazilian, M.; Radley, B.; Nemery, B.; Okatz, J.; Mulvaney, D. Sustainable minerals and metals for a low-carbon future. Science 2020, 367, 30–33. [Google Scholar] [CrossRef] [PubMed]
- Ali, S.H.; Giurco, D.; Arndt, N.; Nickless, E.; Brown, G.; Demetriades, A.; Durrheim, R.; Enriquez, M.A.; Kinnaird, J.; Littleboy, A. Mineral supply for sustainable development requires resource governance. Nature 2017, 543, 367–372. [Google Scholar] [CrossRef] [PubMed]
- Fan, E.; Li, L.; Wang, Z.; Lin, J.; Huang, Y.; Yao, Y.; Chen, R.; Wu, F. Sustainable recycling technology for Li-ion batteries and beyond: challenges and future prospects. Chemical reviews 2020, 120, 7020–7063. [Google Scholar] [CrossRef]
- Nickless, E. Resourcing future generations: a contribution by the earth science community. Natural Resources Research 2018, 27, 143–158. [Google Scholar] [CrossRef]
- Mikhailov, A.G.; Vashlaev, I.I. The Technology of Upward Capillary Formation of Waste for Creating a Deposit before Land Reclamation. Advances in Environmental and Engineering Research 2022, 3, 1–13. [Google Scholar] [CrossRef]
- Embeng, S.B.N.; Meying, A.; Ndougsa-Mbarga, T.; Moreira, C.A.; Amougou, O.U.O. Delineation and Quasi-3D Modeling of Gold Mineralization Using Self-Potential (SP), Electrical Resistivity Tomography (ERT), and Induced Polarization (IP) Methods in Yassa Village, Adamawa, Cameroon: A Case Study. Pure and Applied Geophysics 2022, 179, 795–815. [Google Scholar] [CrossRef]
- Cortês, A.R.P.; Moreira, C.A.; Paes, R.A.S.; Veloso, D.I.K. Geophysical and metalogenetic modelling of the copper occurrence in Camaquã Sedimentary Basin, Brazilian Southern. Pure and Applied Geophysics 2019, 176, 4955–4968. [Google Scholar] [CrossRef]
- Parasnis, D.S. Principles of applied geophysics; Springer Science & Business Media: 2012.
- Guo, Z.; Xue, G.; Liu, J.; Wu, X. Electromagnetic methods for mineral exploration in China: A review. Ore Geology Reviews 2020, 118, 103357. [Google Scholar] [CrossRef]
- Smith, R. Electromagnetic induction methods in mining geophysics from 2008 to 2012. Surveys in Geophysics 2014, 35, 123–156. [Google Scholar] [CrossRef]
- Xi, X.; Yang, H.; He, L.; Chen, R. Chromite mapping using induced polarization method based on spread spectrum technology. In Proceedings of the Symposium on the Application of Geophysics to Engineering and Environmental Problems 2013; 2013; pp. 13–19. [Google Scholar]
- He, L.; Chen, L.; Dorji; Xi, X. ; Zhao, X.; Chen, R.; Yao, H. Mapping the geothermal system using AMT and MT in the Mapamyum (QP) field, Lake Manasarovar, Southwestern Tibet. Energies 2016, 9, 855. [Google Scholar] [CrossRef]
- Lv, H.; Xu, L.; Yang, B.; Su, P.; Xu, H.; Wang, H.; Yao, C.; Su, P. Mineralization Based on CSAMT and SIP Sounding Data: A Case Study on the Hadamengou Gold Deposit in Inner Mongolia. Minerals 2022, 12, 1404. [Google Scholar] [CrossRef]
- Zonge, K.L.; Hughes, L.J. Controlled source audio-frequency magnetotellurics. 1991.
- Revil, A.; Vaudelet, P.; Su, Z.; Chen, R. Induced polarization as a tool to assess mineral deposits: A review. Minerals 2022, 12, 571. [Google Scholar] [CrossRef]
- He, L.; Chen, L.; Dorji; He, Z. ; Wang, X.; Xiao, B.; Xu, L.; Zhao, X.; Xi, X.; Yao, H. Mapping chromite deposits with audio magnetotellurics in the Luobusa ophiolite of southern Tibet. Geophysics 2018, 83, B47–B57. [Google Scholar] [CrossRef]
- Yan, L. Advancements in controlled source electromagnetic methods for prospecting unconventional hydrocarbon resources in China. Surveys in Geophysics 2023, 1–38. [Google Scholar] [CrossRef]
- Xue, G.-q. The development of near-source electromagnetic methods in China. Journal of Environmental and Engineering Geophysics 2018, 23, 115–124. [Google Scholar] [CrossRef]
- Ahmed, I.; Liu, H.; Chen, R.; Ahmad, J.; Shah, S.A.; Fahad, S.; Rahim, O.A.; Ullah, F.; Rui, L. Geothermal Resource Exploration in Reshi Town by Integrated Geophysical Methods. Energies 2024, 17, 856. [Google Scholar] [CrossRef]
- Revil, A.; Vaudelet, P.; Su, Z.; Chen, R. Induced polarization as a tool to assess mineral deposits: a review. Minerals 12 (571). 2022. [CrossRef]
- Liu, W.; Chen, R.; Cai, H.; Luo, W. Robust statistical methods for impulse noise suppressing of spread spectrum induced polarization data, with application to a mine site, Gansu province, China. Journal of Applied Geophysics 2016, 135, 397–407. [Google Scholar] [CrossRef]
- XiaoChun, X.; XinYue, X.; QiaoQin, X.; ZhongYang, F.; ShiLong, Q.; Zujun, X. Geological and geochemical characteristics and genesis of the Chating copper-gold deposit in Xuancheng City, Anhui Province. Acta Petrologica Sinica 2019, 35, 3659–3676. [Google Scholar] [CrossRef]
- Xu, X.-y.; Xu, X.-c.; Xie, Q.-q.; Fu, Z.-y.; Lu, S.-m.; Zhao, L.-l. Geological features and ore-forming mechanisms of the Chating Cu–Au deposit: A rare case of porphyry deposit in the Middle–Lower Yangtze River metallogenic belt. Ore Geology Reviews 2022, 144, 104860. [Google Scholar] [CrossRef]
- Qi, H.; Lu, S.; Yang, X.; Zhao, L.; Zhou, Y.; Deng, J.; Li, J. Genesis of Cretaceous igneous rocks and its related large scale porphyry Cu-Au mineralization in Chating, the Middle-Lower Yangtze River Metallogenic Belt: The geochemical constrains. Ore Geology Reviews 2020, 127, 103793. [Google Scholar] [CrossRef]
- Lu, S.; Yang, Q.; Qi, H.; Li, J.; Qian, S.; Zhao, L. A geological-geophysical model for the Chating copper-gold deposit, Xuancheng, Anhui Province. Acta Geologica Sinica—English Edition 2019, 93, 243–244. [Google Scholar] [CrossRef]
- Xiao, Q.; Zhou, T.; Hollings, P.; Wang, S.; Liu, J.; White, N.; Fu, B.; Yuan, F. The role of porphyry-related skarns in the Chating porphyry copper and gold deposit, eastern China. Ore Geology Reviews 2021, 133, 104096. [Google Scholar] [CrossRef]
- Tikhonov, A. On determining electrical characteristics of the deep layers of the Earth’s crust. In Proceedings of the Dokl. Akad. Nauk. SSSR; 1950; pp. 295–297. [Google Scholar]
- Cagniard, L. Basic theory of the magneto-telluric method of geophysical prospecting. Geophysics 1953, 18, 605–635. [Google Scholar] [CrossRef]
- Cantwell, T. Detection and analysis of low frequency magnetotelluric signals. Massachusetts Institute of Technology, 1960.
- Cantwell, T.; Madden, T. Preliminary report on crustal magnetotelluric measurements. Journal of Geophysical Research 1960, 65, 4202–4205. [Google Scholar] [CrossRef]
- Vozoff, K. The magnetotelluric method in the exploration of sedimentary basins. Geophysics 1972, 37, 98–141. [Google Scholar] [CrossRef]
- Price, A. The theory of magnetotelluric methods when the source field is considered. Journal of Geophysical Research 1962, 67, 1907–1918. [Google Scholar] [CrossRef]
- Chave, A.D.; Jones, A.G. The magnetotelluric method: Theory and practice; Cambridge University Press: 2012.
- Nabighian, M.N. Electromagnetic methods in applied geophysics: Voume 1, theory; Society of Exploration Geophysicists: 1988.
- GSAI. Internet of Things Broadband Magnetotelluric Instrument GSEM-W10 [Z]. Available online: https://www.gs-ait.com/home (accessed on 24 January 2024).
- Liu, W.; Chen, R.; Cai, H.; Luo, W.; Revil, A. Correlation analysis for spread-spectrum induced-polarization signal processing in electromagnetically noisy environments. Geophysics 2017, 82, E243–E256. [Google Scholar] [CrossRef]
- CHUN, S.-h.; CHEN, R.-j.; GENG, M.-h. Review of the pseudo-random m sequence and its application in electrical prospecting of exploration geophysics. Progress in Geophysics 2014, 29, 439–446. [Google Scholar]
- He, S.; Guan, J.; Chen, D.; Xu, H.; Wang, Y. A fusion approach for suppression of environmental noise in spread spectrum induced polarization data. Pure and Applied Geophysics 2021, 178, 3619–3628. [Google Scholar] [CrossRef]
- Geophysics, G. Electromagnetic Data Processing Software GSEM-Pros [Z]. GSAI 2024.
- Kirkby, A.L.; Zhang, F.; Peacock, J.; Hassan, R.; Duan, J. The MTPy software package for magnetotelluric data analysis and visualisation. Journal of Open Source Software 2019, 4, 1358. [Google Scholar] [CrossRef]
- Krieger, L.; Peacock, J.R. MTpy: A Python toolbox for magnetotellurics. Computers & geosciences 2014, 72, 167–175. [Google Scholar]
- Caldwell, T.G.; Bibby, H.M.; Brown, C. The magnetotelluric phase tensor. Geophysical Journal International 2004, 158, 457–469. [Google Scholar] [CrossRef]
- Booker, J.R. The magnetotelluric phase tensor: a critical review. Surveys in Geophysics 2014, 35, 7–40. [Google Scholar] [CrossRef]
- Ren, W.; Ren, Z.; Xue, G.; Chen, W.; Zhao, P.; Liu, J. Three-dimensional audio magnetotelluric imaging of the Yangyi geothermal field in Tibet, China. Journal of Applied Geophysics 2023, 211, 104966. [Google Scholar] [CrossRef]
- Pedersen, L.B.; Engels, M. Routine 2D inversion of magnetotelluric data using the determinant of the impedance tensor. Geophysics 2005, 70, G33–G41. [Google Scholar] [CrossRef]
- Niasari, S.W. A short introduction to geological strike and geo-electrical strike. In Proceedings of the AIP Conference Proceedings; 2016. [Google Scholar]
- Weaver, J.T.; Agarwal, A.K.; Lilley, F. Characterization of the magnetotelluric tensor in terms of its invariants. Geophysical Journal International 2000, 141, 321–336. [Google Scholar] [CrossRef]
Figure 4.
Schematic diagram of SSIP for pole-dipole sounding.
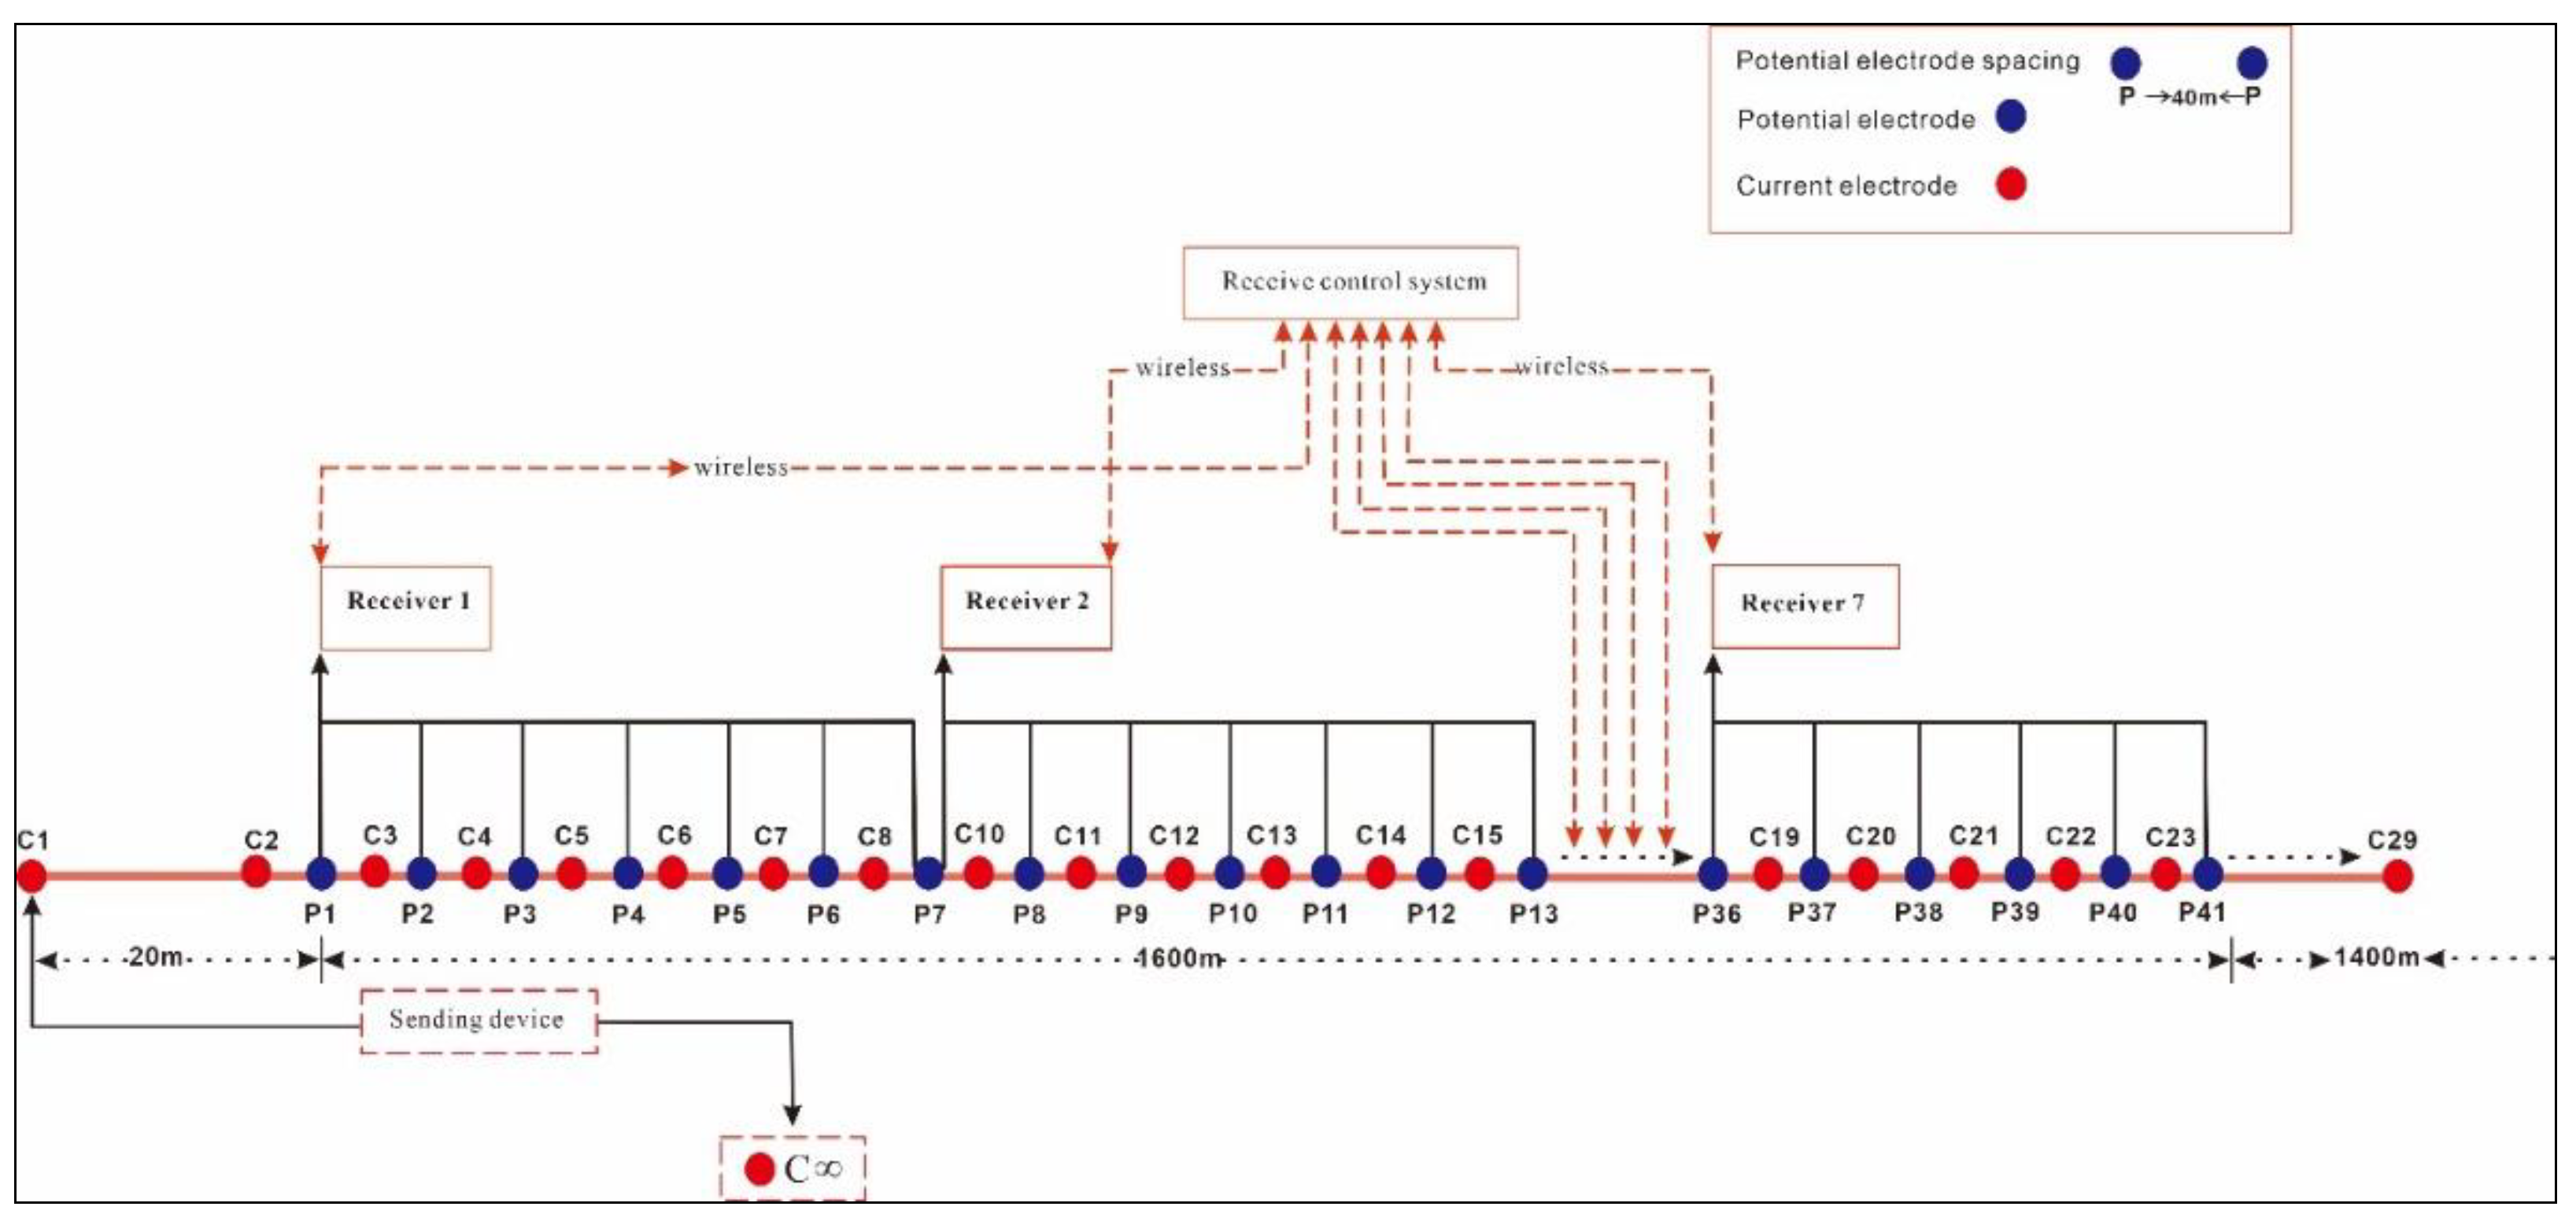
Figure 7.
Observed apparent resistivity-phase curves for four typical AMT stations, (a) L04-001, (b) L04-008, (c)L04-022, and (d)L04-056.
Figure 7.
Observed apparent resistivity-phase curves for four typical AMT stations, (a) L04-001, (b) L04-008, (c)L04-022, and (d)L04-056.
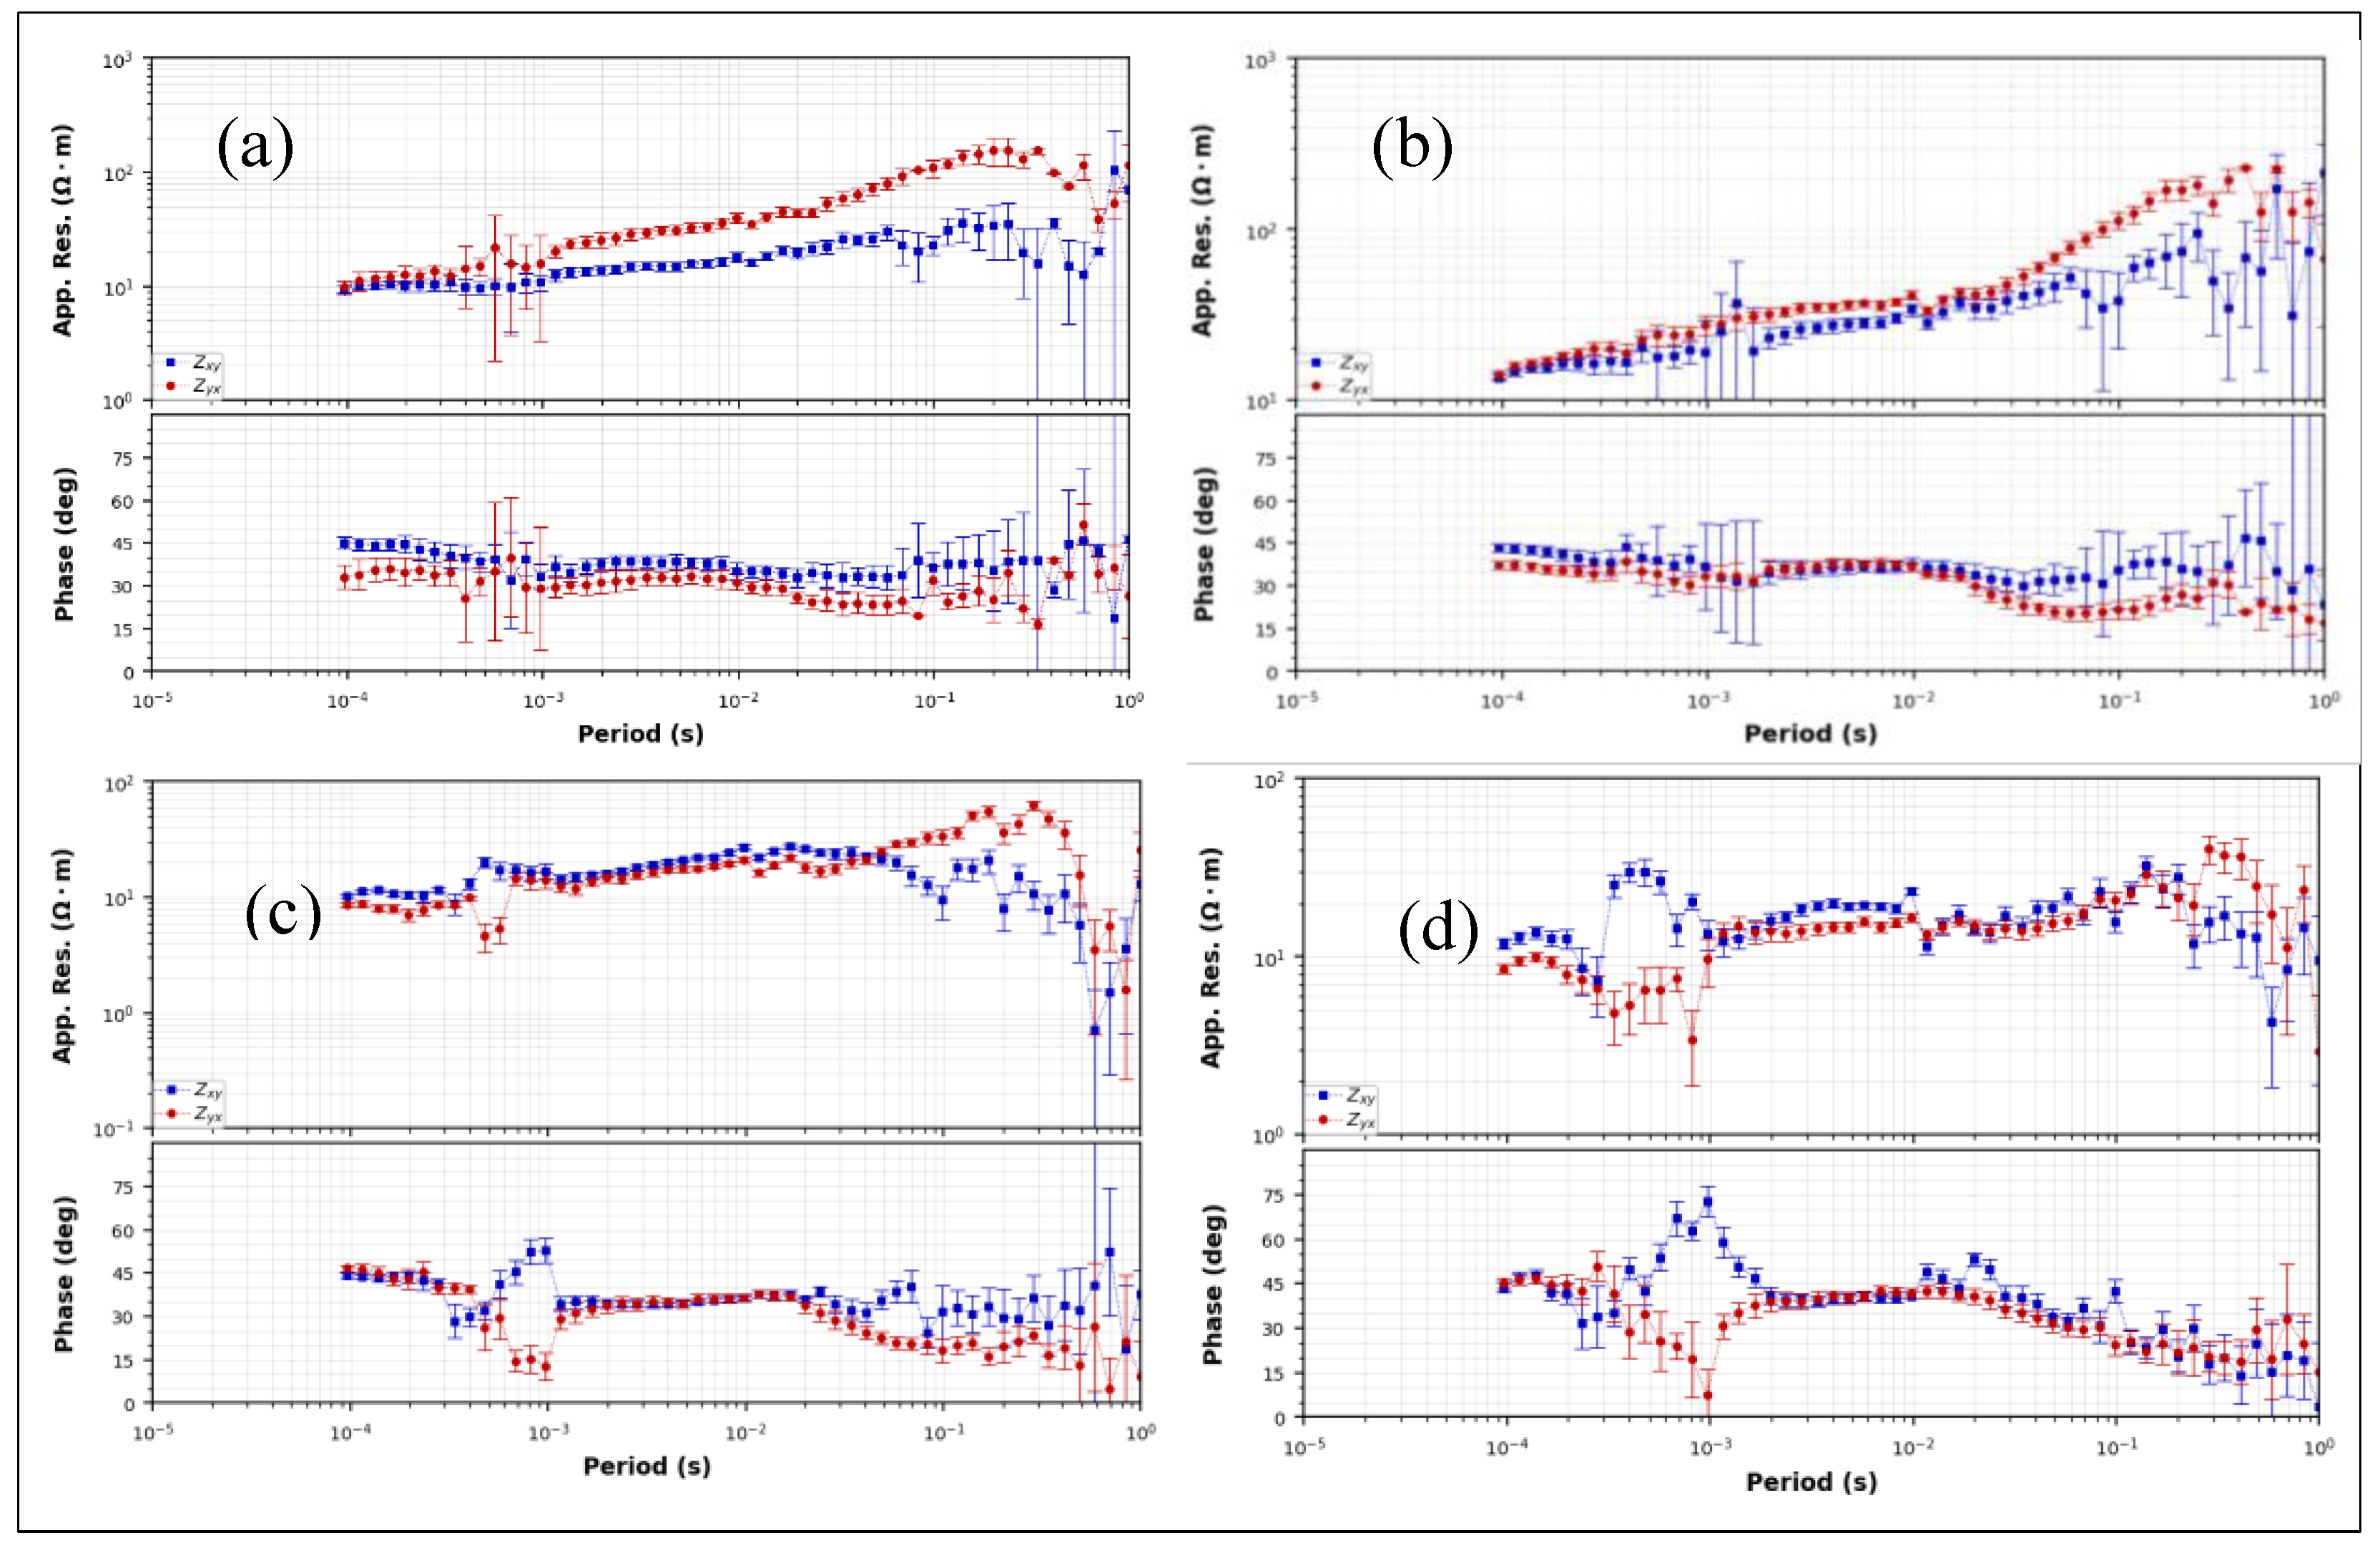
Figure 8.
Phase tensor ellipses for the AMT survey line 4 at Gucheng-Yaxi area for all times.
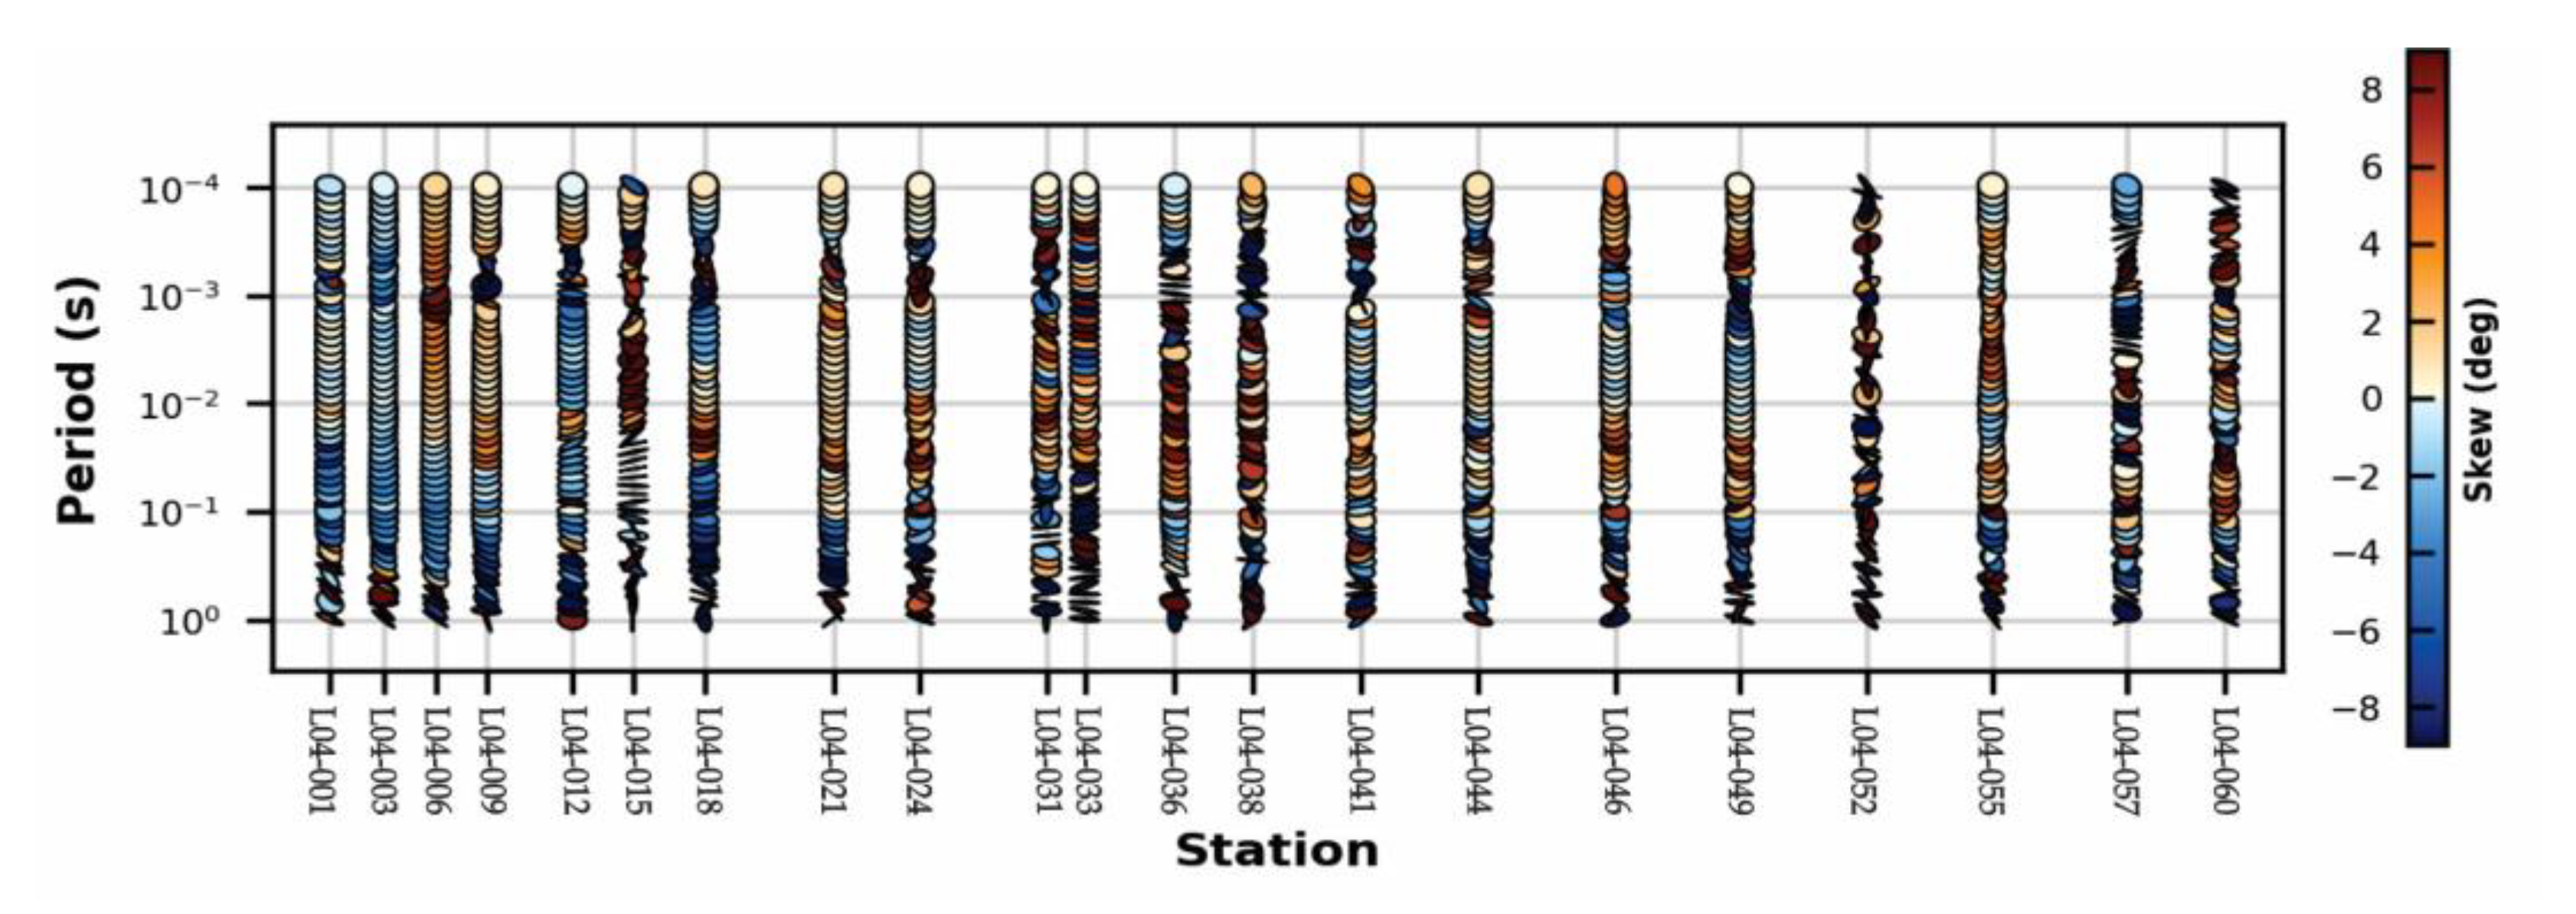
Figure 9.
Multi-period rose plot for the geoelectrical strike determined by impedance tensor invariants (Z) at decades and all periods. North (N) is assumed as 0° and strike angle measured positive clockwise.
Figure 9.
Multi-period rose plot for the geoelectrical strike determined by impedance tensor invariants (Z) at decades and all periods. North (N) is assumed as 0° and strike angle measured positive clockwise.
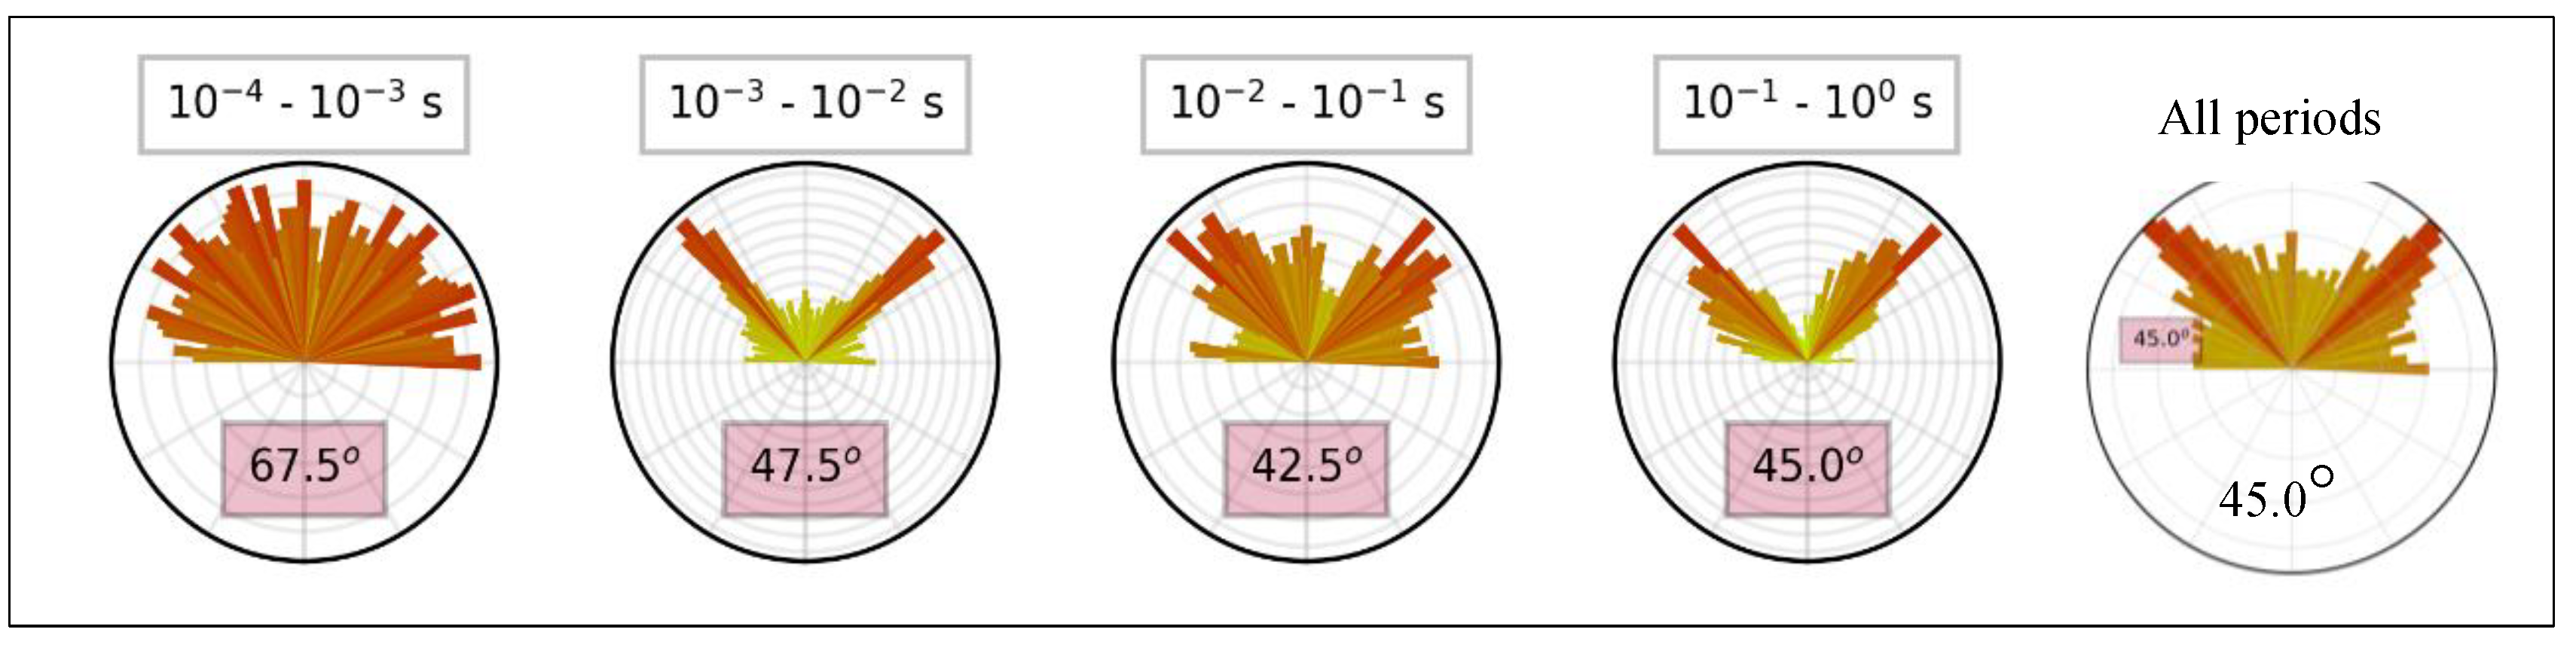
Figure 10.
Two-dimensional inversion results for (a) AMT resistivity data, (b) SSIP resistivity data, and (c) SSIP chargeability data.
Figure 10.
Two-dimensional inversion results for (a) AMT resistivity data, (b) SSIP resistivity data, and (c) SSIP chargeability data.
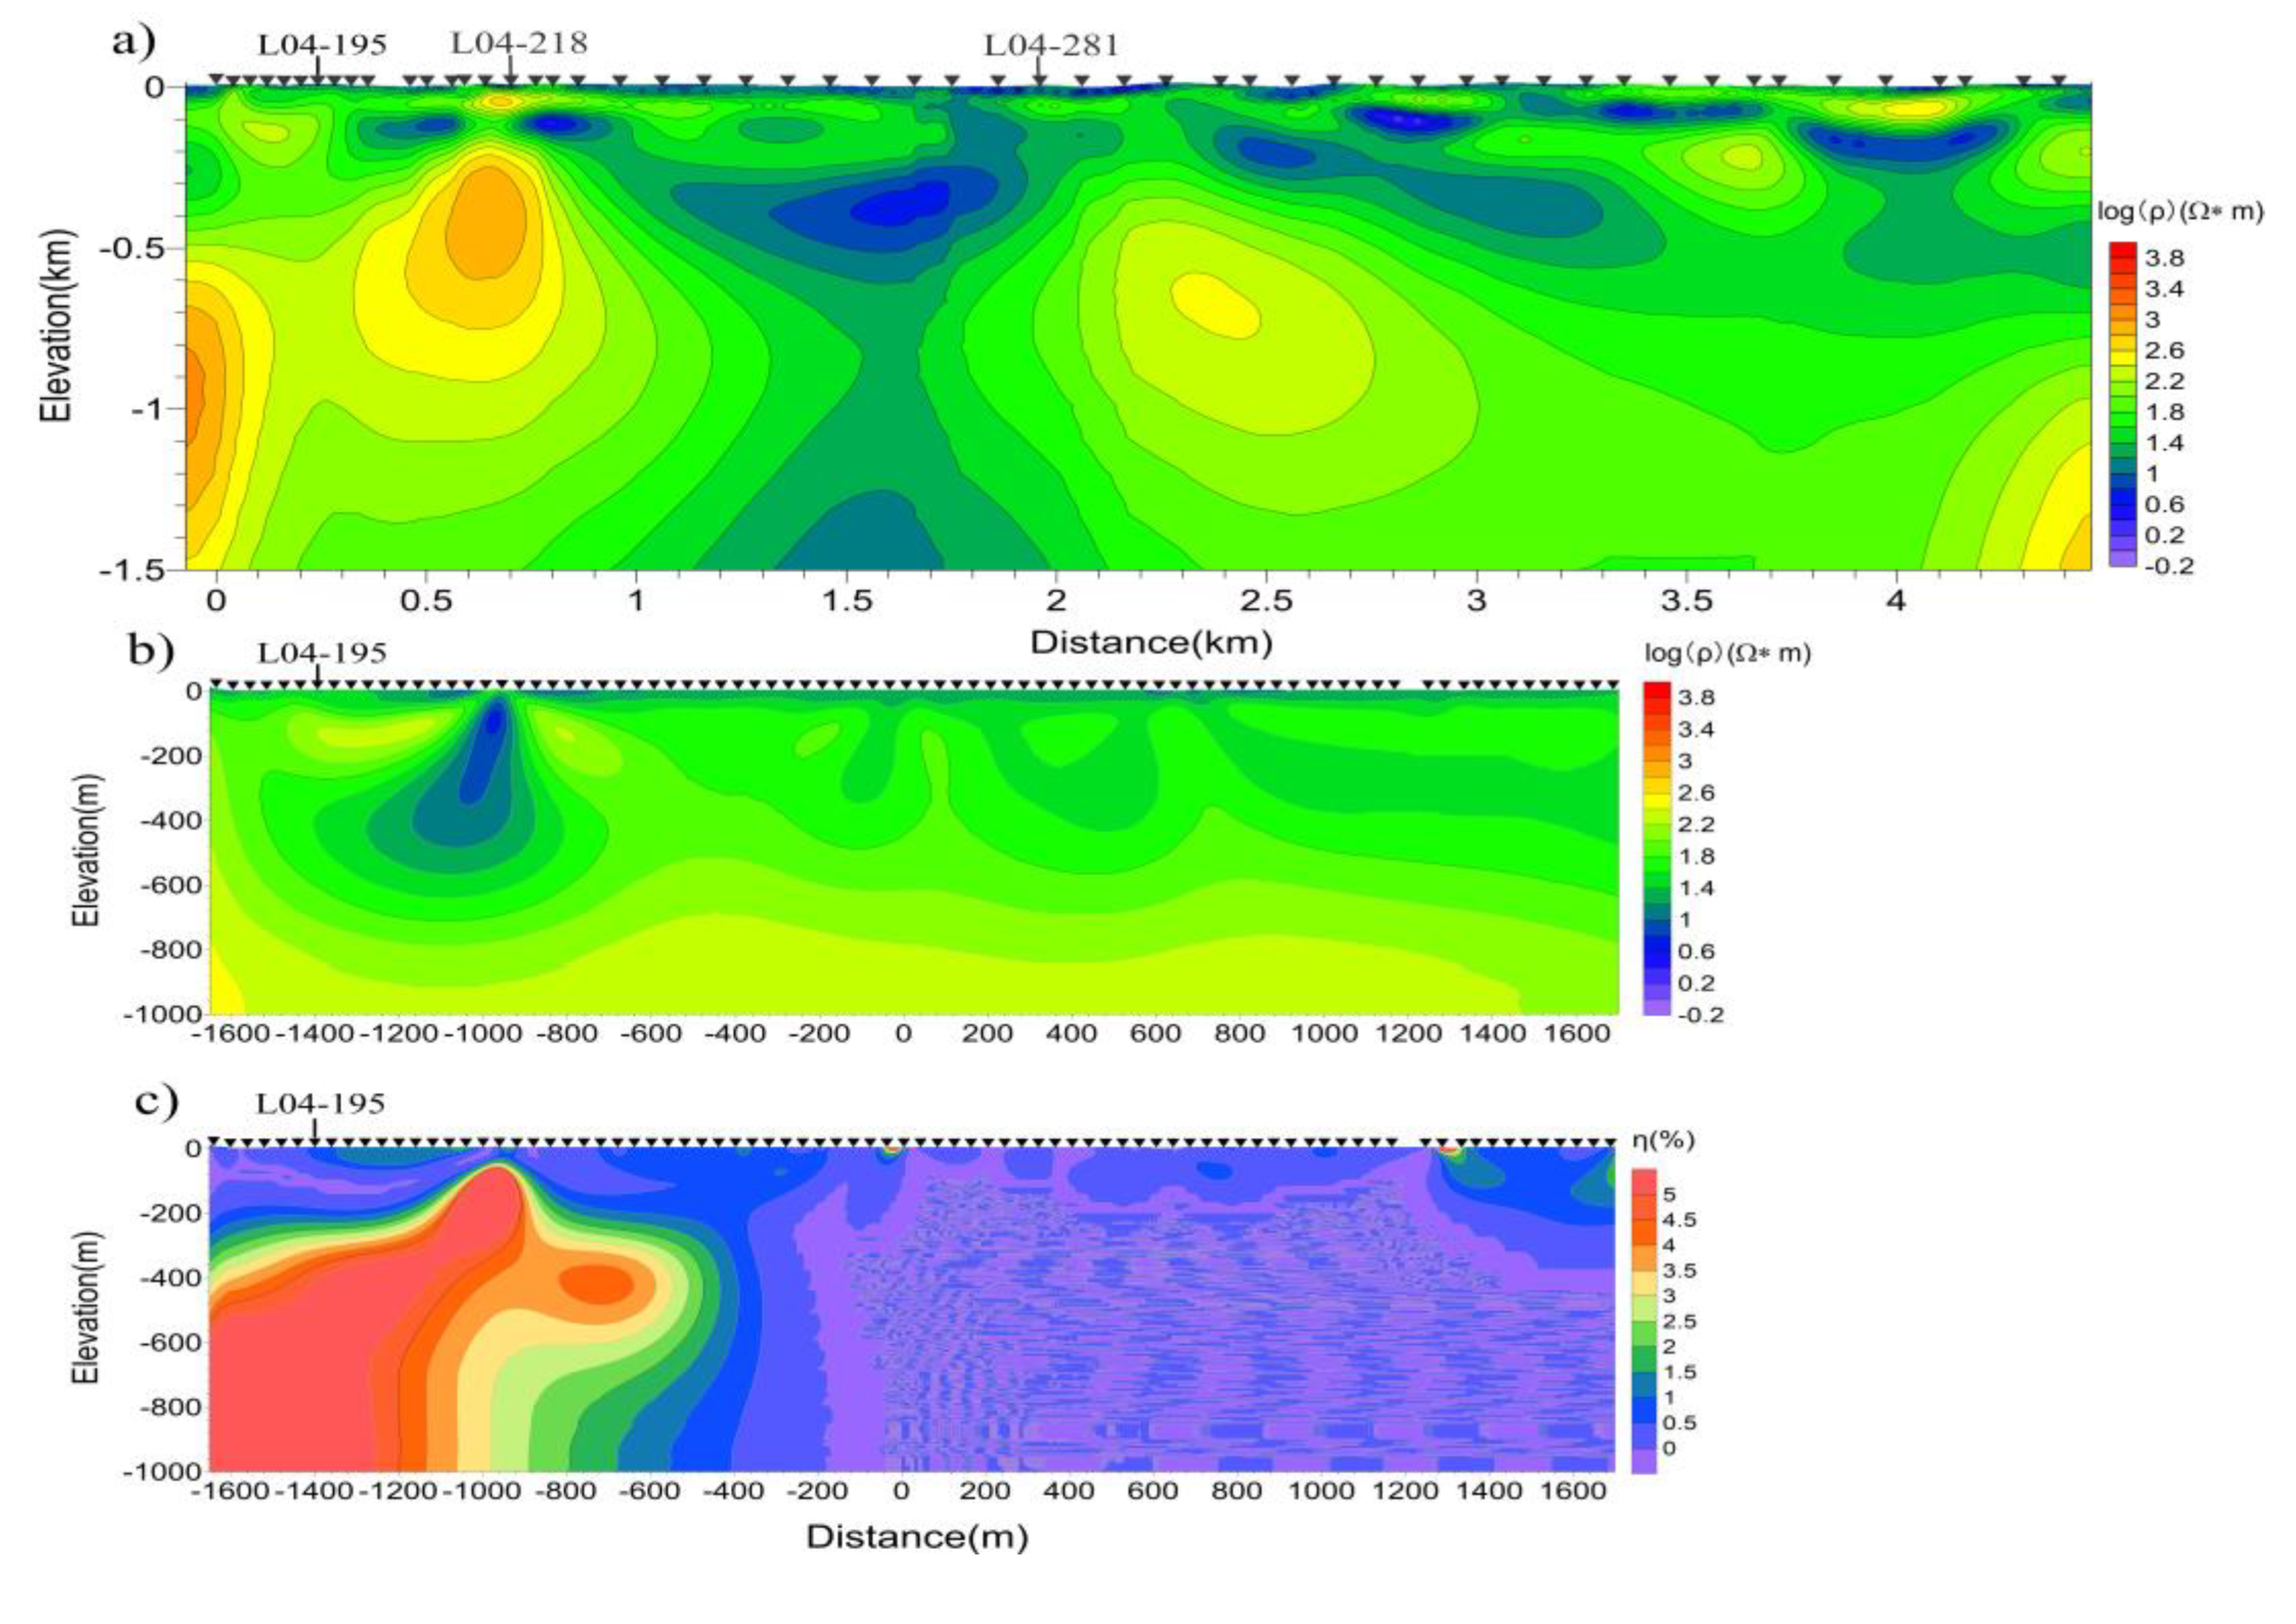
Figure 12.
Drill core samples from borehole ZK001 on line 04, A; 67.72m coarse and medium grained lithic quartz sandstone, B; 204.42m gravelly coarse-grained lithic sandstone, C; 362.18m altered rhyolite tuff, D; Massive sphalerite galena at 510m, E; Veined pyrite, sphalerite and galena at 626m, F; Vein-like pyrite sphalerite ore at 976m, G; Massive sphalerite ore at 982m, H; Massive chalcopyrite galena sphalerite ore at 1025m.
Disclaimer/Publisher’s Note: The statements, opinions and data contained in all publications are solely those of the individual author(s) and contributor(s) and not of MDPI and/or the editor(s). MDPI and/or the editor(s) disclaim responsibility for any injury to people or property resulting from any ideas, methods, instructions or products referred to in the content. |
© 2024 by the authors. Licensee MDPI, Basel, Switzerland. This article is an open access article distributed under the terms and conditions of the Creative Commons Attribution (CC BY) license (http://creativecommons.org/licenses/by/4.0/).
Copyright: This open access article is published under a Creative Commons CC BY 4.0 license, which permit the free download, distribution, and reuse, provided that the author and preprint are cited in any reuse.


