Submitted:
28 May 2024
Posted:
29 May 2024
You are already at the latest version
Abstract
Keywords:
1. Introduction
2. Lake Ice Thickness Signature in SAR Radar Echograms and Waveforms
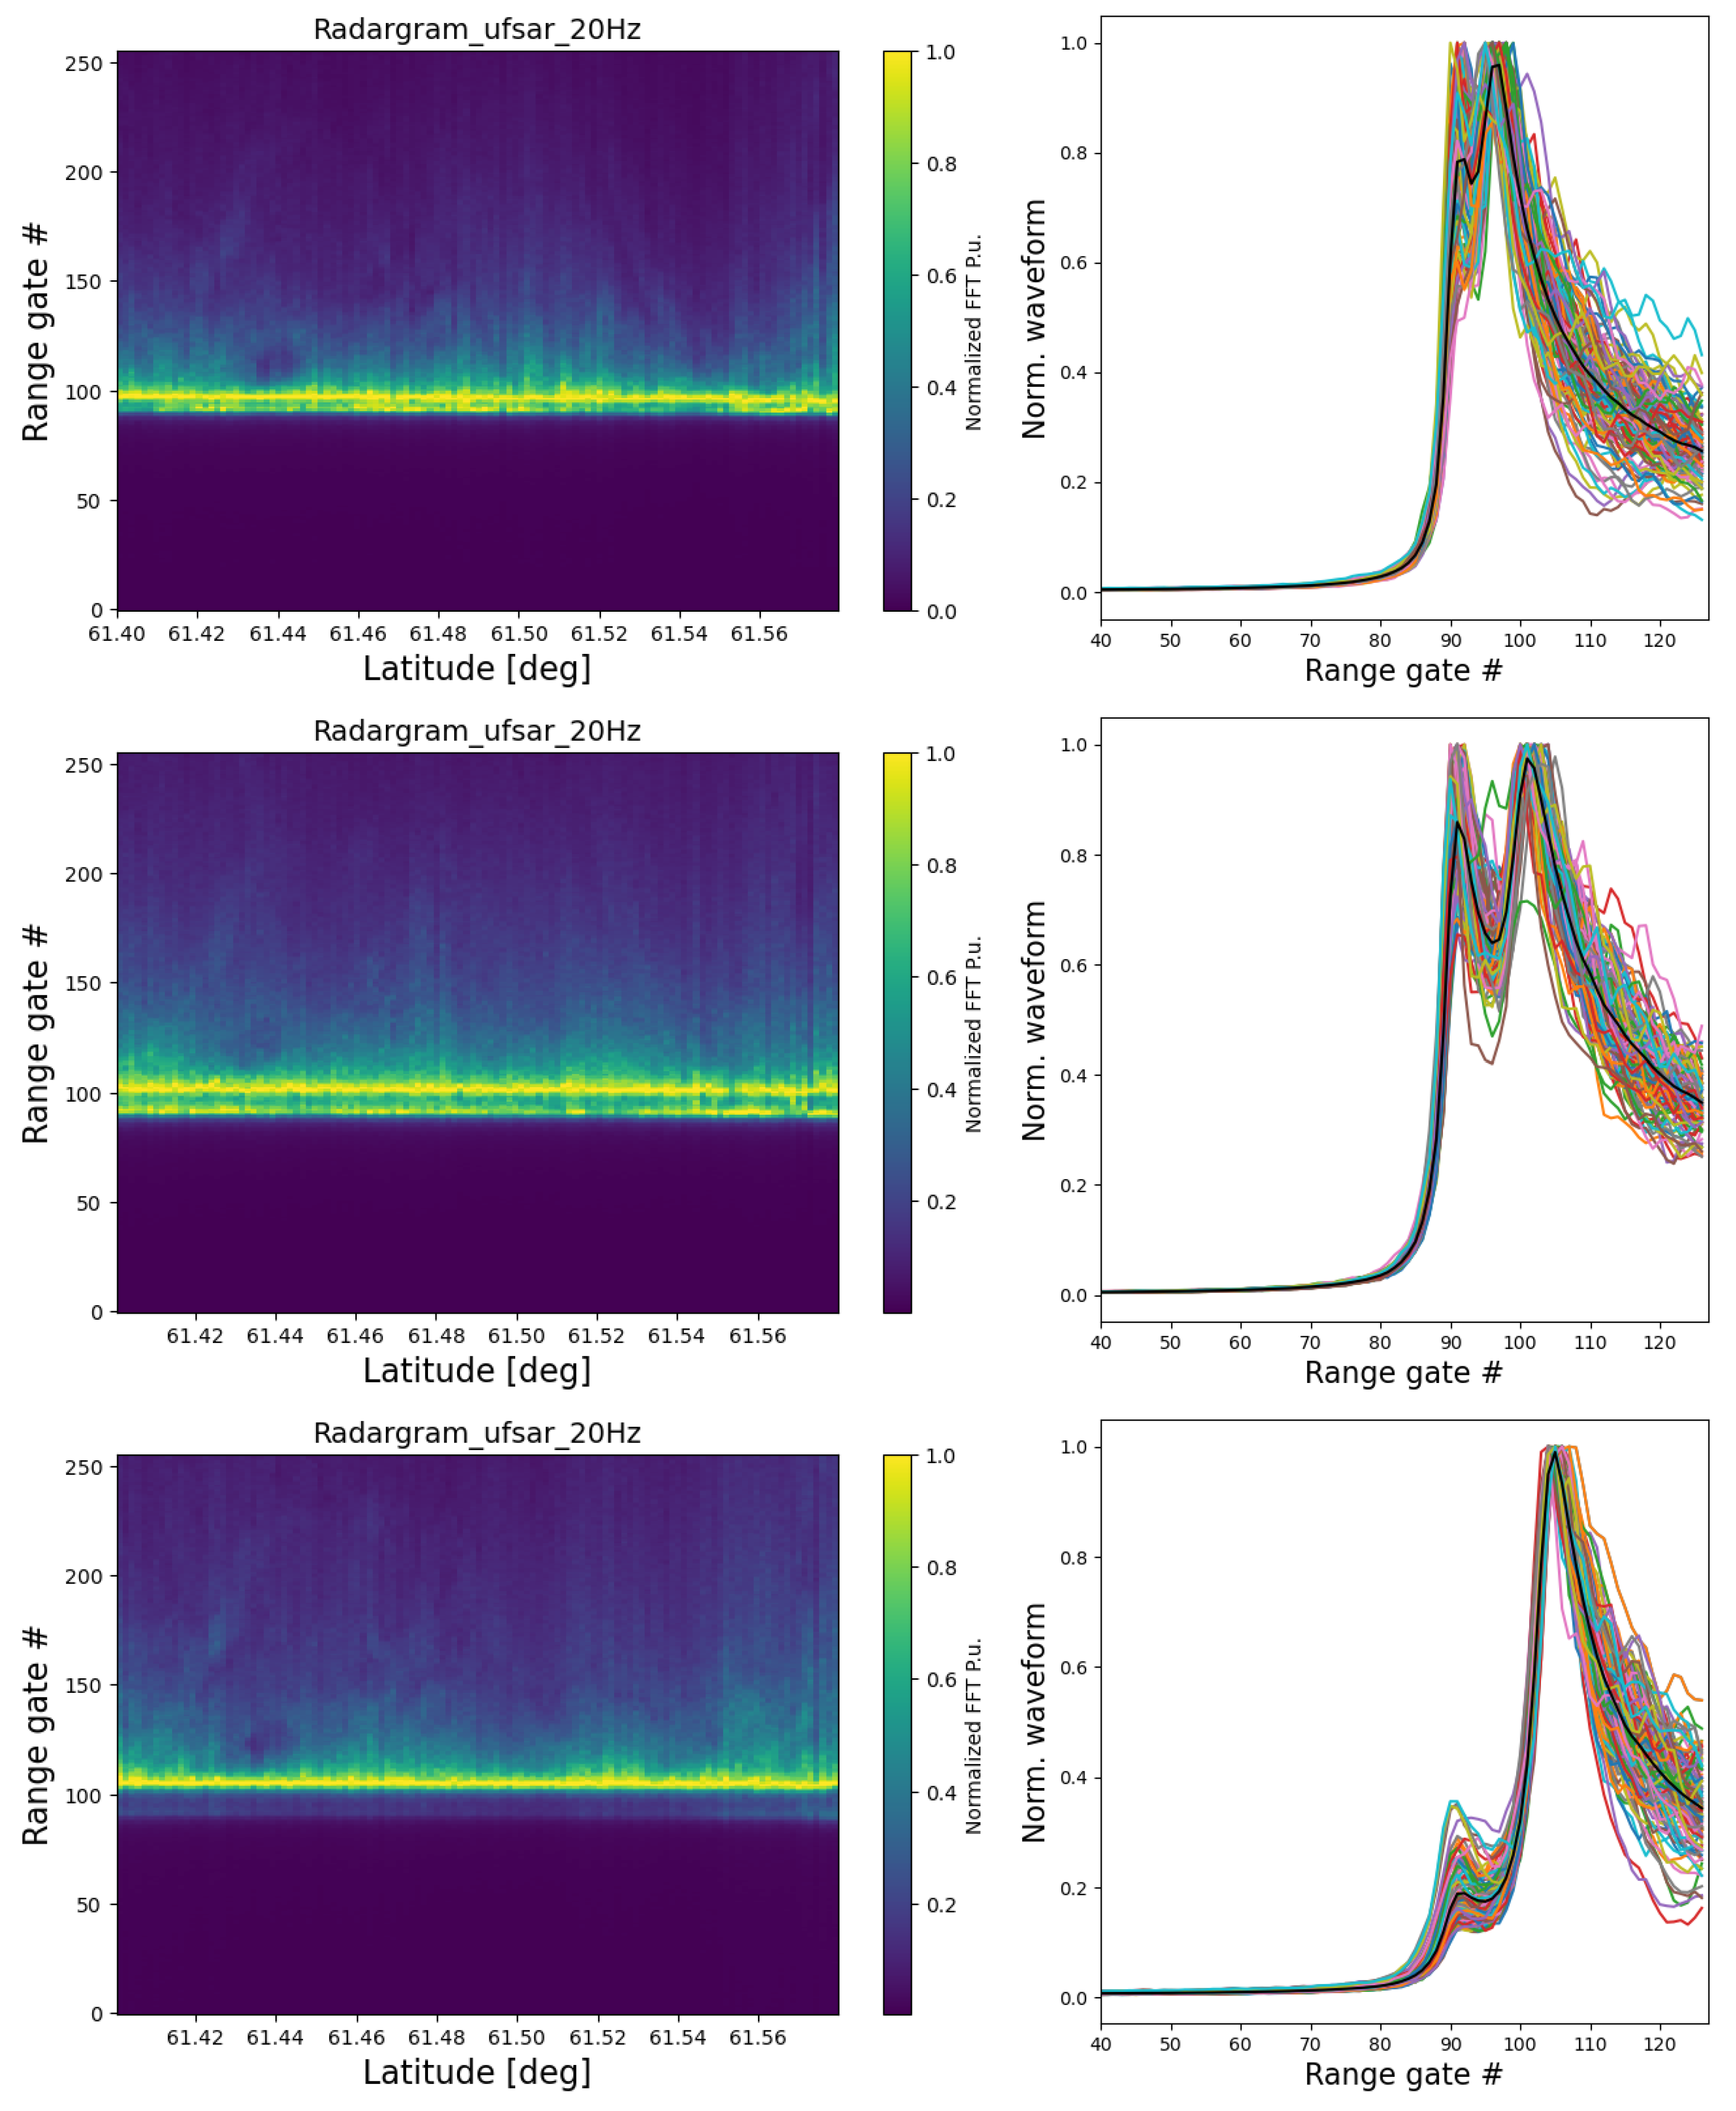

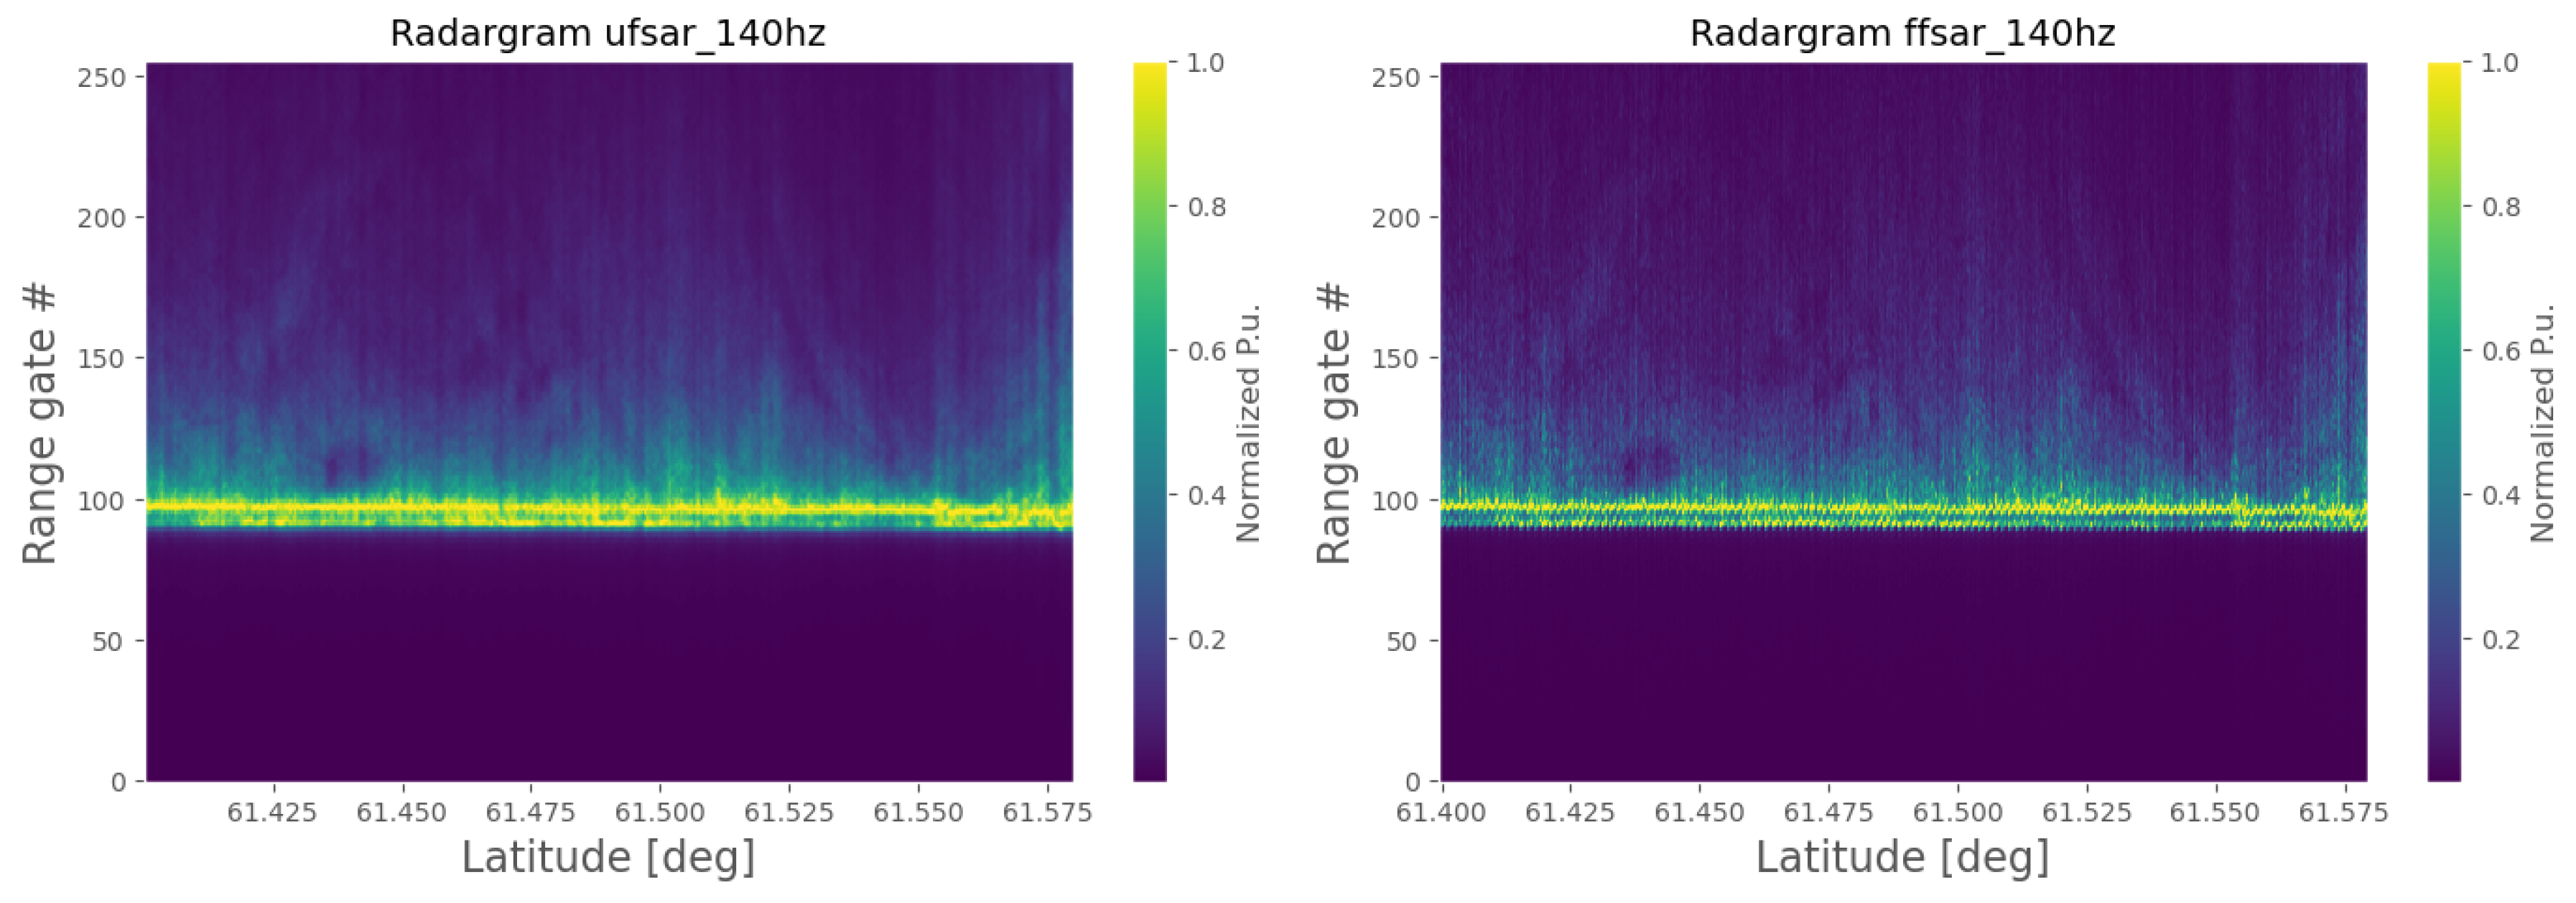
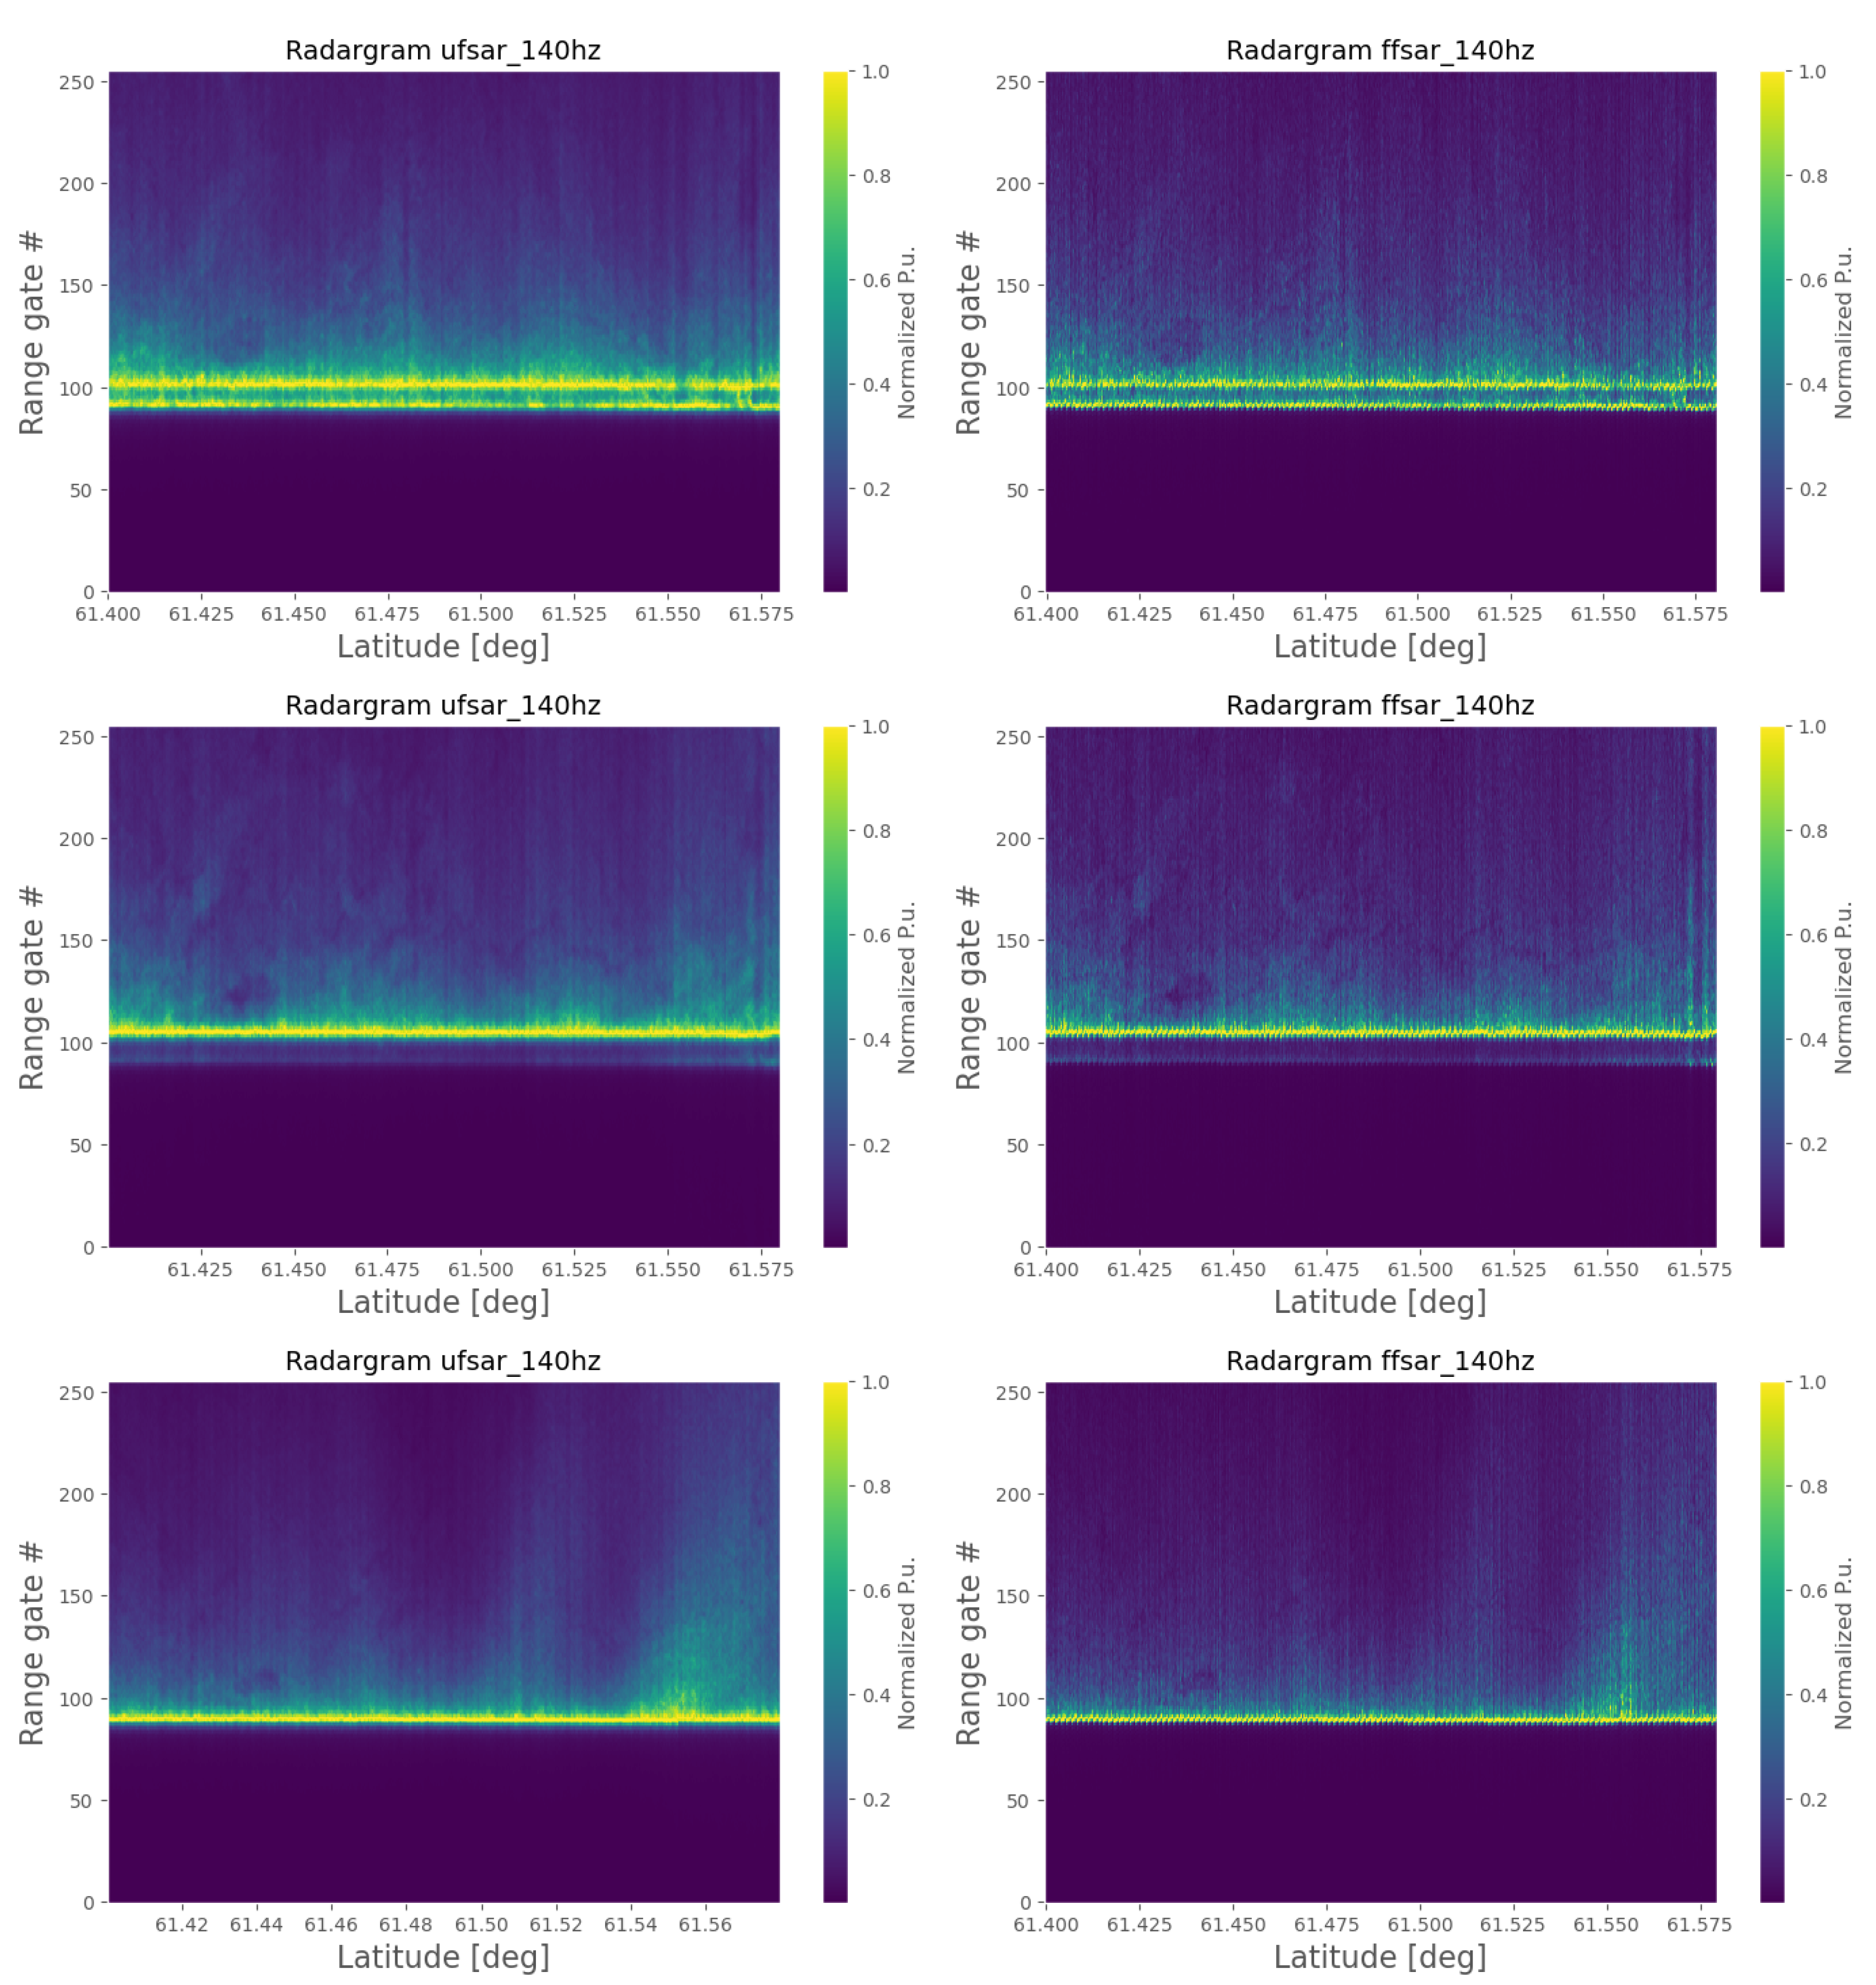
3. Analytical Retrackers for the Estimation of LIT from High Resolution SAR Data
3.1. SAR_LITWaveform Model
3.2. FFSAR_LITWaveform Model
3.3. Parameter Estimation
4. Target Lakes and Data
4.1. Target Lakes
4.2. Altimetry Data
4.2.1. High Resolution Data
4.2.2. Low Resolution Data
4.3. Lake Ice Model Simulations
5. Results and Discussion
5.1. LIT Analysis of Sentinel-6 High Resolution Data
5.2. Evaluation and Consistency
6. Conclusions and Outlook
Author Contributions
Funding
Conflicts of Interest
Appendix A. Sentinel-6 System and Sensor Parameters
| Symbol | Description | Value |
|---|---|---|
| Central frequency | 13.575 GHz | |
| PTR time width | 0.8846 | |
| h | Nominal orbit height | 1347 Km |
| Nominal satellite velocity | 6965 m/s | |
| Number of pulses per burst | 64 | |
| Pulse Repetition Frequency | 9175 Hz | |
| Half-power along track beam width | 1.33 deg | |
| Half-power across track beam width | 1.33 deg | |
| L | Total number of Doppler beams | 448 |
| B | Bandwidth | 320 MHz |
| Sampling frequency | 395 MHz |
References
- World Meteorological Organization. The 2022 GCOS ECVs Requirements 2022. GCOS-245, 244.
- Ghiasi, Y.; Duguay, C.; Murfitt, J.; van der Sanden, J.; Thompson, A.; Drouin, H.; Prévost, C. Application of GNSS interferometric reflectometry for the estimation of lake ice thickness. Remote Sensing 2020, 12, 2721. [CrossRef]
- Brown, L.C.; Duguay, C.R. The fate of lake ice in the North American Arctic. The Cryosphere Discussions 2011, 5. [CrossRef]
- Murfitt, J.; Duguay, C.R. 50 years of lake ice research from active microwave remote sensing: Progress and prospects. Remote Sensing of Environment 2021, 264, 112616. [CrossRef]
- Kang, K.K.; Duguay, C.R.; Howell, S.E.L.; Derksen, C.; Kelly, R. Sensitivity of AMSR-E brightness temperatures to the seasonal evolution of lake ice thickness. IEEE Geoscience and Remote Sensing Letters 2010, 7, 751–755. [CrossRef]
- Kang, K.K.; Duguay, C.; Lemmetyinen, J.; Gel, Y. Estimation of ice thickness on large northern lakes from AMSR-E brightness temperature measurements. Remote Sensing of Environment 2014, 150, 1–19. [CrossRef]
- Beckers, J.F.; Alec Casey, J.; Haas, C. Retrievals of lake ice thickness from Great Slave Lake and Great Bear Lake using CryoSat-2. IEEE Transactions on Geoscience and Remote Sensing 2017, 55, 3708–3720. [CrossRef]
- Ye, H.; Jin, G.; Zhang, H.; Xiong, X.; Li, J.; Wang, J. Lake ice thickness retrieval method with ICESat-2-assisted CyroSat-2 echo peak selection. Remote Sensing 2024, 16. [CrossRef]
- Shu, S.; Liu, H.; Beck, R.A.; Frappart, F.; Korhonen, J.; Xu, M.; Yang, B.; Hinkel, K.M.; Huang, Y.; Yu, B. Analysis of Sentinel-3 SAR altimetry waveform retracking algorithms for deriving temporally consistent water levels over ice-covered lakes. Remote Sensing of Environment 2020, 239, 111643. [CrossRef]
- Yang, Y.; Moore, P.; Li, Z.; Li, F. Lake level change from satellite altimetry over seasonally ice-covered lakes in the Mackenzie River Basin. IEEE Transactions on Geoscience and Remote Sensing 2021, 59, 8143–8152. [CrossRef]
- Li, X.; Long, D.; Huang, Q.; Zhao, F. The state and fate of lake ice thickness in the Northern Hemisphere. Science Bulletin 2022, 67, 537–546. [CrossRef]
- Li, X.; Long, D.; Cui, Y.; Liu, T.; Lu, J.; Hamouda, M.A.; Mohamed, M.M. Ice thickness and water level estimation for ice-covered lakes with satellite altimetry waveforms and backscattering coefficients. The Cryosphere 2023, 17, 349–369. [CrossRef]
- Mangilli, A.; Thibaut, P.; Duguay, C.R.; Murfitt, J. A New approach for the estimation of lake ice thickness from conventional radar altimetry. IEEE Transactions on Geoscience and Remote Sensing 2022, 60, 1–15. [CrossRef]
- Raney, R. The delay/Doppler radar altimeter. IEEE Transactions on Geoscience and Remote Sensing 1998, 36, 1578–1588. [CrossRef]
- Egido, A.; Smith, W.H.F. Fully focused SAR altimetry: Theory and applications. IEEE Transactions on Geoscience and Remote Sensing 2017, 55, 392–406. [CrossRef]
- Duguay, C.; Flato, G.; Jeffries, M.; Menard, P.; Morris, K.; Rouse, W. Ice cover variability on shallow lakes at high latitudes: Model simulations and observations. Hydrological Processes 2003, 17.
- Shu, S.; Liu, H.; Beck, R.A.; Frappart, F.; Korhonen, J.; Xu, M.; Yang, B.; Hinkel, K.M.; Huang, Y.; Yu, B. Analysis of Sentinel-3 SAR altimetry waveform retracking algorithms for deriving temporally consistent water levels over ice-covered lakes. Remote Sensing of Environment 2020, 239, 111643. [CrossRef]
- Gunn, G.; Duguay, C.; Brown, L.; King, J.; Atwood, D.; Kasurak, A. Freshwater lake ice thickness derived using surface-based X- and Ku-band FMCW scatterometers. Cold Regions Science and Technology 2015, 120, 115–126. [CrossRef]
- Ray, C.; Martin-Puig, C.; Clarizia, M.P.; Ruffini, G.; Dinardo, S.; Gommenginger, C.; Benveniste, J. SAR altimeter backscattered waveform model. IEEE Transactions on Geoscience and Remote Sensing 2015, 53, 911–919. [CrossRef]
- Dinardo, S. Techniques and applications for satellite SAR altimetry over water, land and ice. PhD thesis, Technische Universität, Darmstadt, 2020. [CrossRef]
- Donlon, C.; Cullen, R.; Giulicchi, L.; Fornari, M.; Vuilleumier, P. Copernicus Sentinel-6 Michael Freilich satellite mission: Overview and preliminary in orbit results. 2021 IEEE International Geoscience and Remote Sensing Symposium IGARSS, 2021, pp. 7732–7735. [CrossRef]
- Ehlers, F.; Schlembach, F.; Kleinherenbrink, M.; Slobbe, C. Validity assessment of SAMOSA retracking for fully-focused SAR altimeter waveforms. Advances in Space Research 2022. [CrossRef]
- Ménard, P.; Duguay, C.R.; Flato, G.M.; Rouse, W.R. Simulation of ice phenology on Great Slave Lake, Northwest Territories, Canada. Hydrological Processes 2002, 16, 3691–3706, [https://onlinelibrary.wiley.com/doi/ pdf/10.1002/hyp.1230]. [CrossRef]
- Rieu, P.; Amraoui, S.; Restano, M. SMAP (Standalone Multimission Altimetry Processor), 2021.
- Murfitt, J.; Duguay, C.; Picard, G.; Gunn, G. Forward modelling of synthetic aperture radar backscatter from lake ice over Canadian Subarctic Lakes. Remote Sensing of Environment 2023, 286, 113424. [CrossRef]
- Surdu, C.M.; Duguay, C.R.; Brown, L.C.; Fernández Prieto, D. Response of ice cover on shallow lakes of the North Slope of Alaska to contemporary climate conditions (1950-2011): radar remote-sensing and numerical modeling data analysis. The Cryosphere 2014, 8, 167–180. [CrossRef]
- Kheyrollah Pour, H.; Duguay, C.R.; Scott, K.A.; Kang, K.K. Improvement of lake ice thickness retrieval from MODIS satellite data using a thermodynamic model. IEEE Transactions on Geoscience and Remote Sensing 2017, 55, 5956–5965. [CrossRef]
- Antonova, S.; Duguay, C.R.; Kääb, A.; Heim, B.; Langer, M.; Westermann, S.; Boike, J. Monitoring bedfast ice and ice phenology in lakes of the Lena River Delta using TerraSAR-X backscatter and coherence time series. Remote Sensing 2016, 8, 903. [CrossRef]
- Egido, A.; Dinardo, S.; Ray, C. The case for increasing the posting rate in delay/Doppler altimeters. Advances in Space Research 2020. [CrossRef]
- Murfitt, J.; Duguay, C.R.; Picard, G.; Gunn, G.E. Investigating the effect of lake ice properties on multifrequency backscatter using the Snow Microwave Radiative Transfer Model. IEEE Transactions on Geoscience and Remote Sensing 2022, 60, 1–23. [CrossRef]
- Kern, M.; Cullen, R.; Berruti, B.; Bouffard, J.; Casal, T.; Drinkwater, M.R.; Gabriele, A.; Lecuyot, A.; Ludwig, M.; Midthassel, R.; Navas Traver, I.; Parrinello, T.; Ressler, G.; Andersson, E.; Martin-Puig, C.; Andersen, O.; Bartsch, A.; Farrell, S.; Fleury, S.; Gascoin, S.; Guillot, A.; Humbert, A.; Rinne, E.; Shepherd, A.; van den Broeke, M.R.; Yackel, J. The Copernicus Polar Ice and Snow Topography Altimeter (CRISTAL) high-priority candidate mission. The Cryosphere 2020, 14, 2235–2251. [CrossRef]
| 1 | |
| 2 | |
| 3 | Because the analysis is specific to ice covered lakes, the significant wave height (SWH) is assumed to be zero and therefore, in the following, we assume that the terms related to SWH can be neglected. |
| 4 | It can be demonstrated that in the case of a Gaussian likelihood function, a Weighted Least Square estimator with weights defined as the data (co)variance, is equivalent to a Maximum Likelihood estimator, thus providing with an optimal parameter estimation. |
| 5 | |
| 6 |
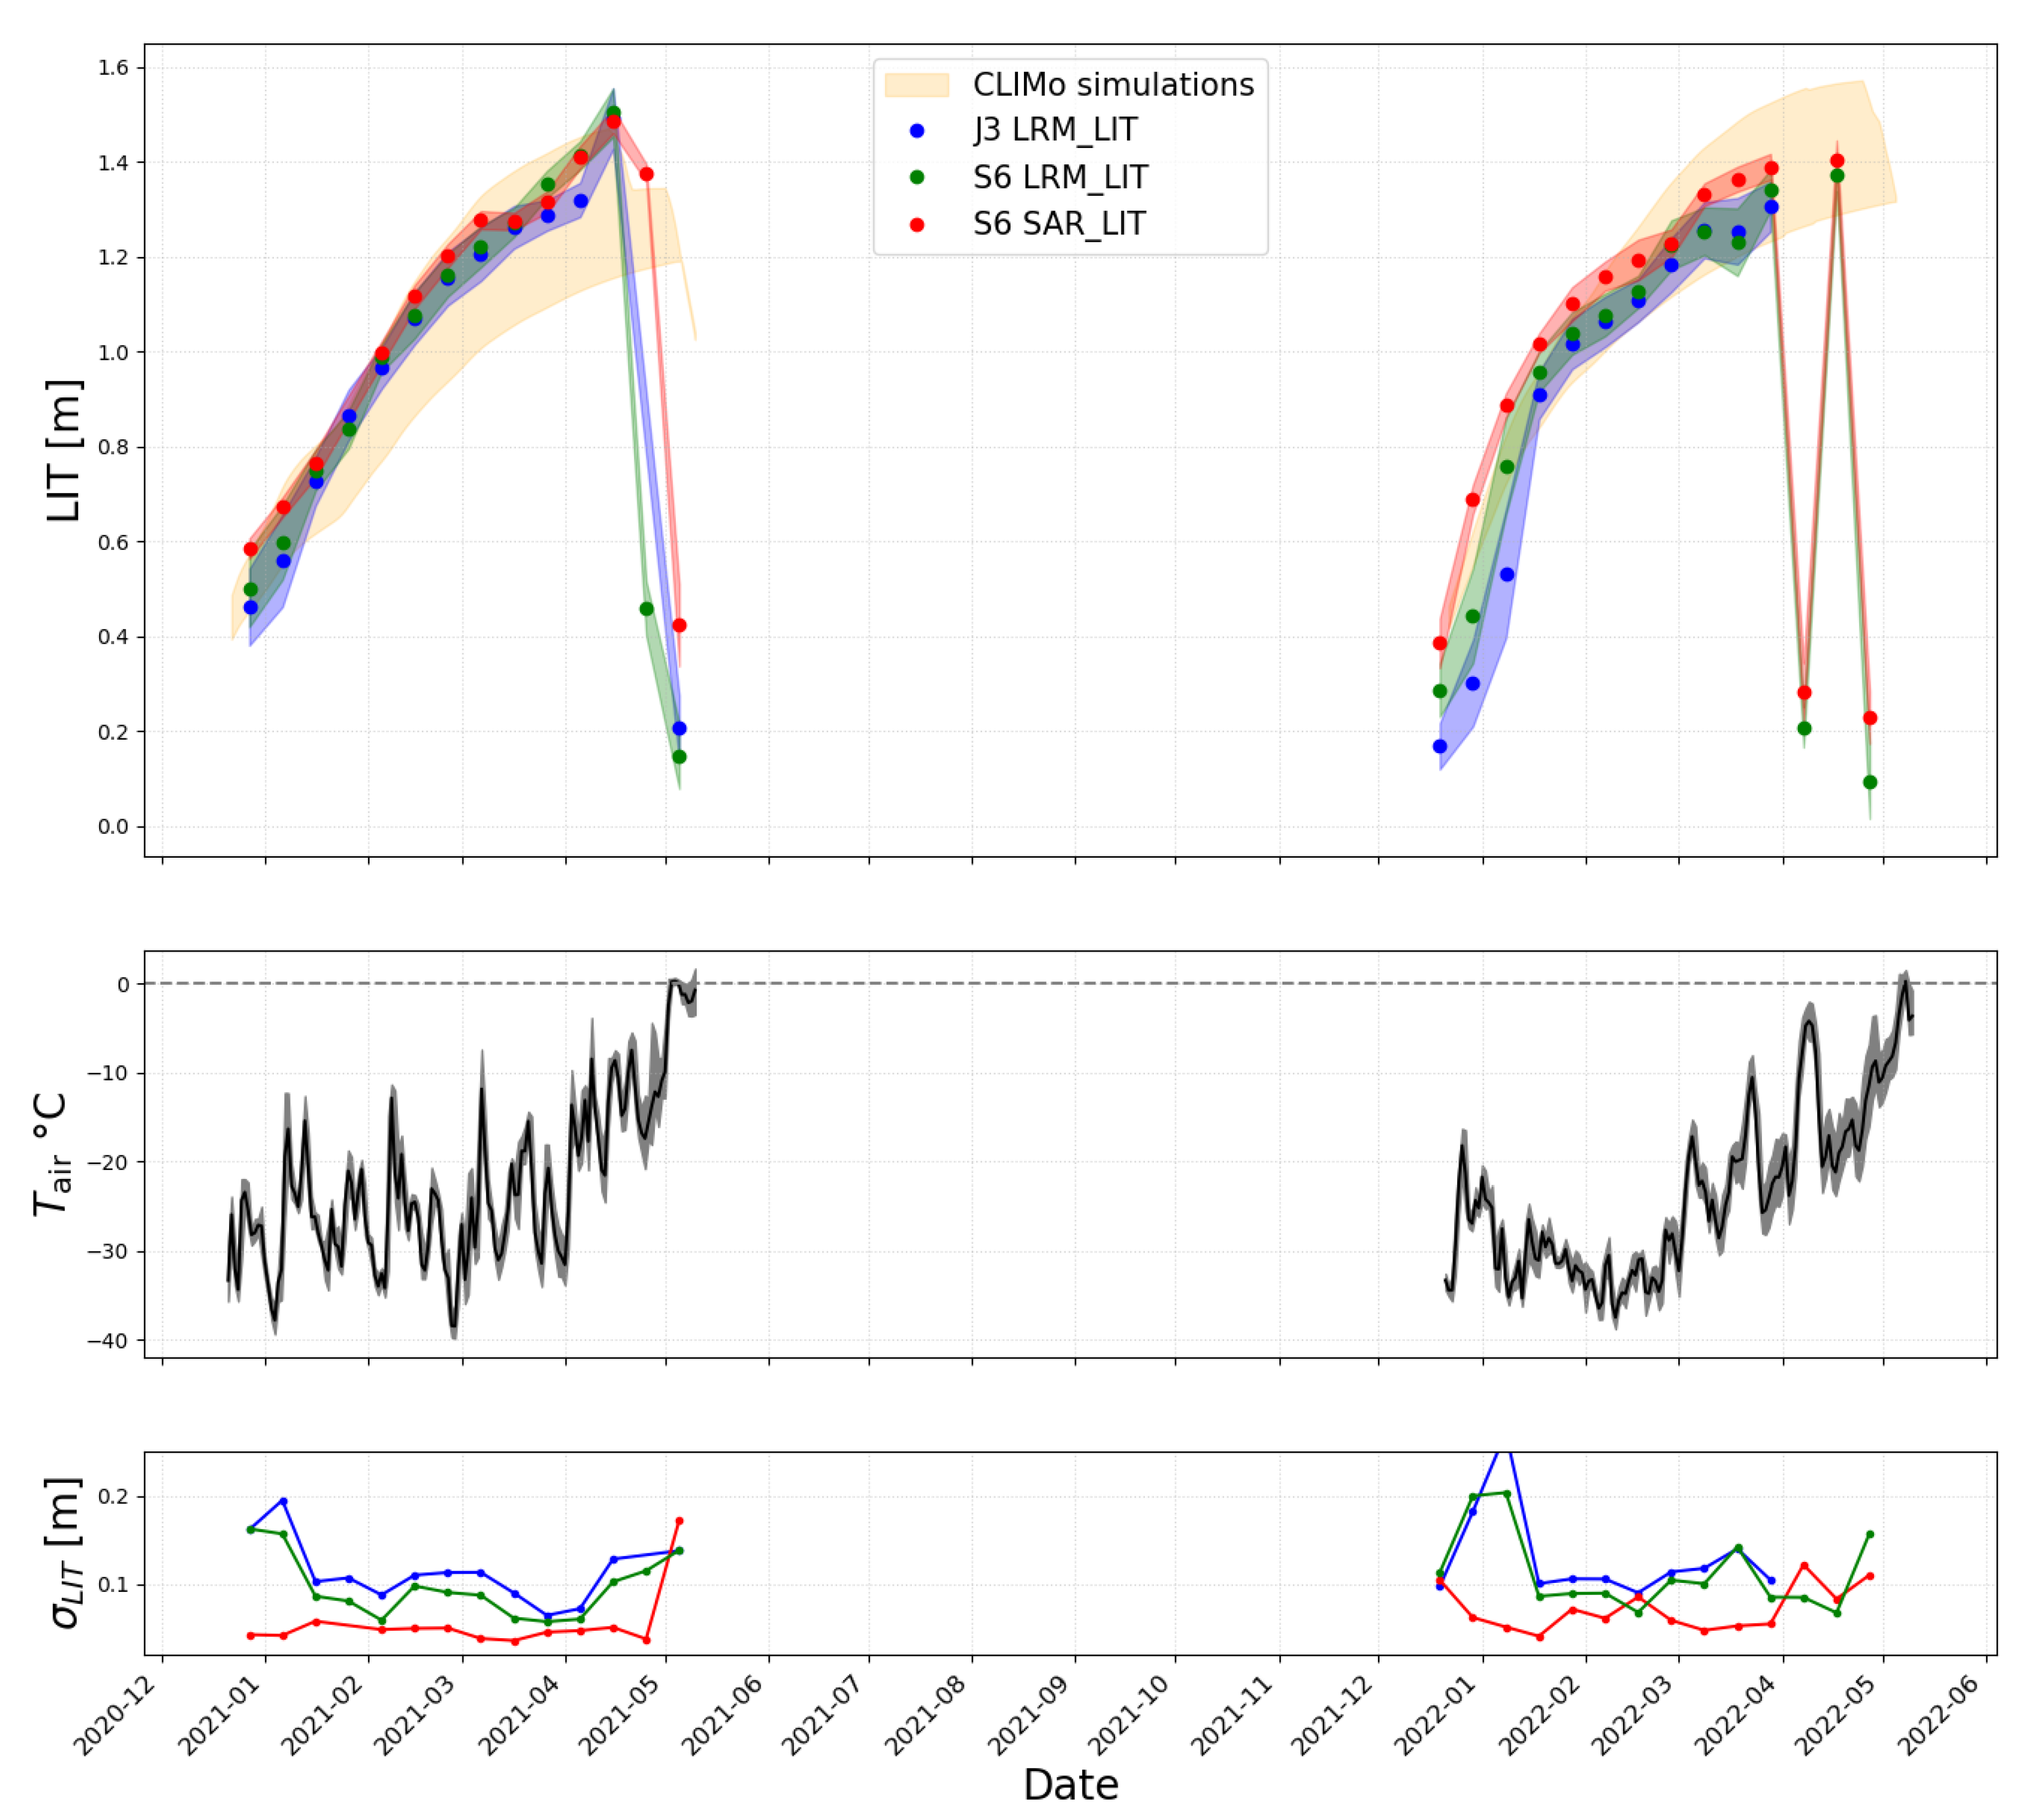
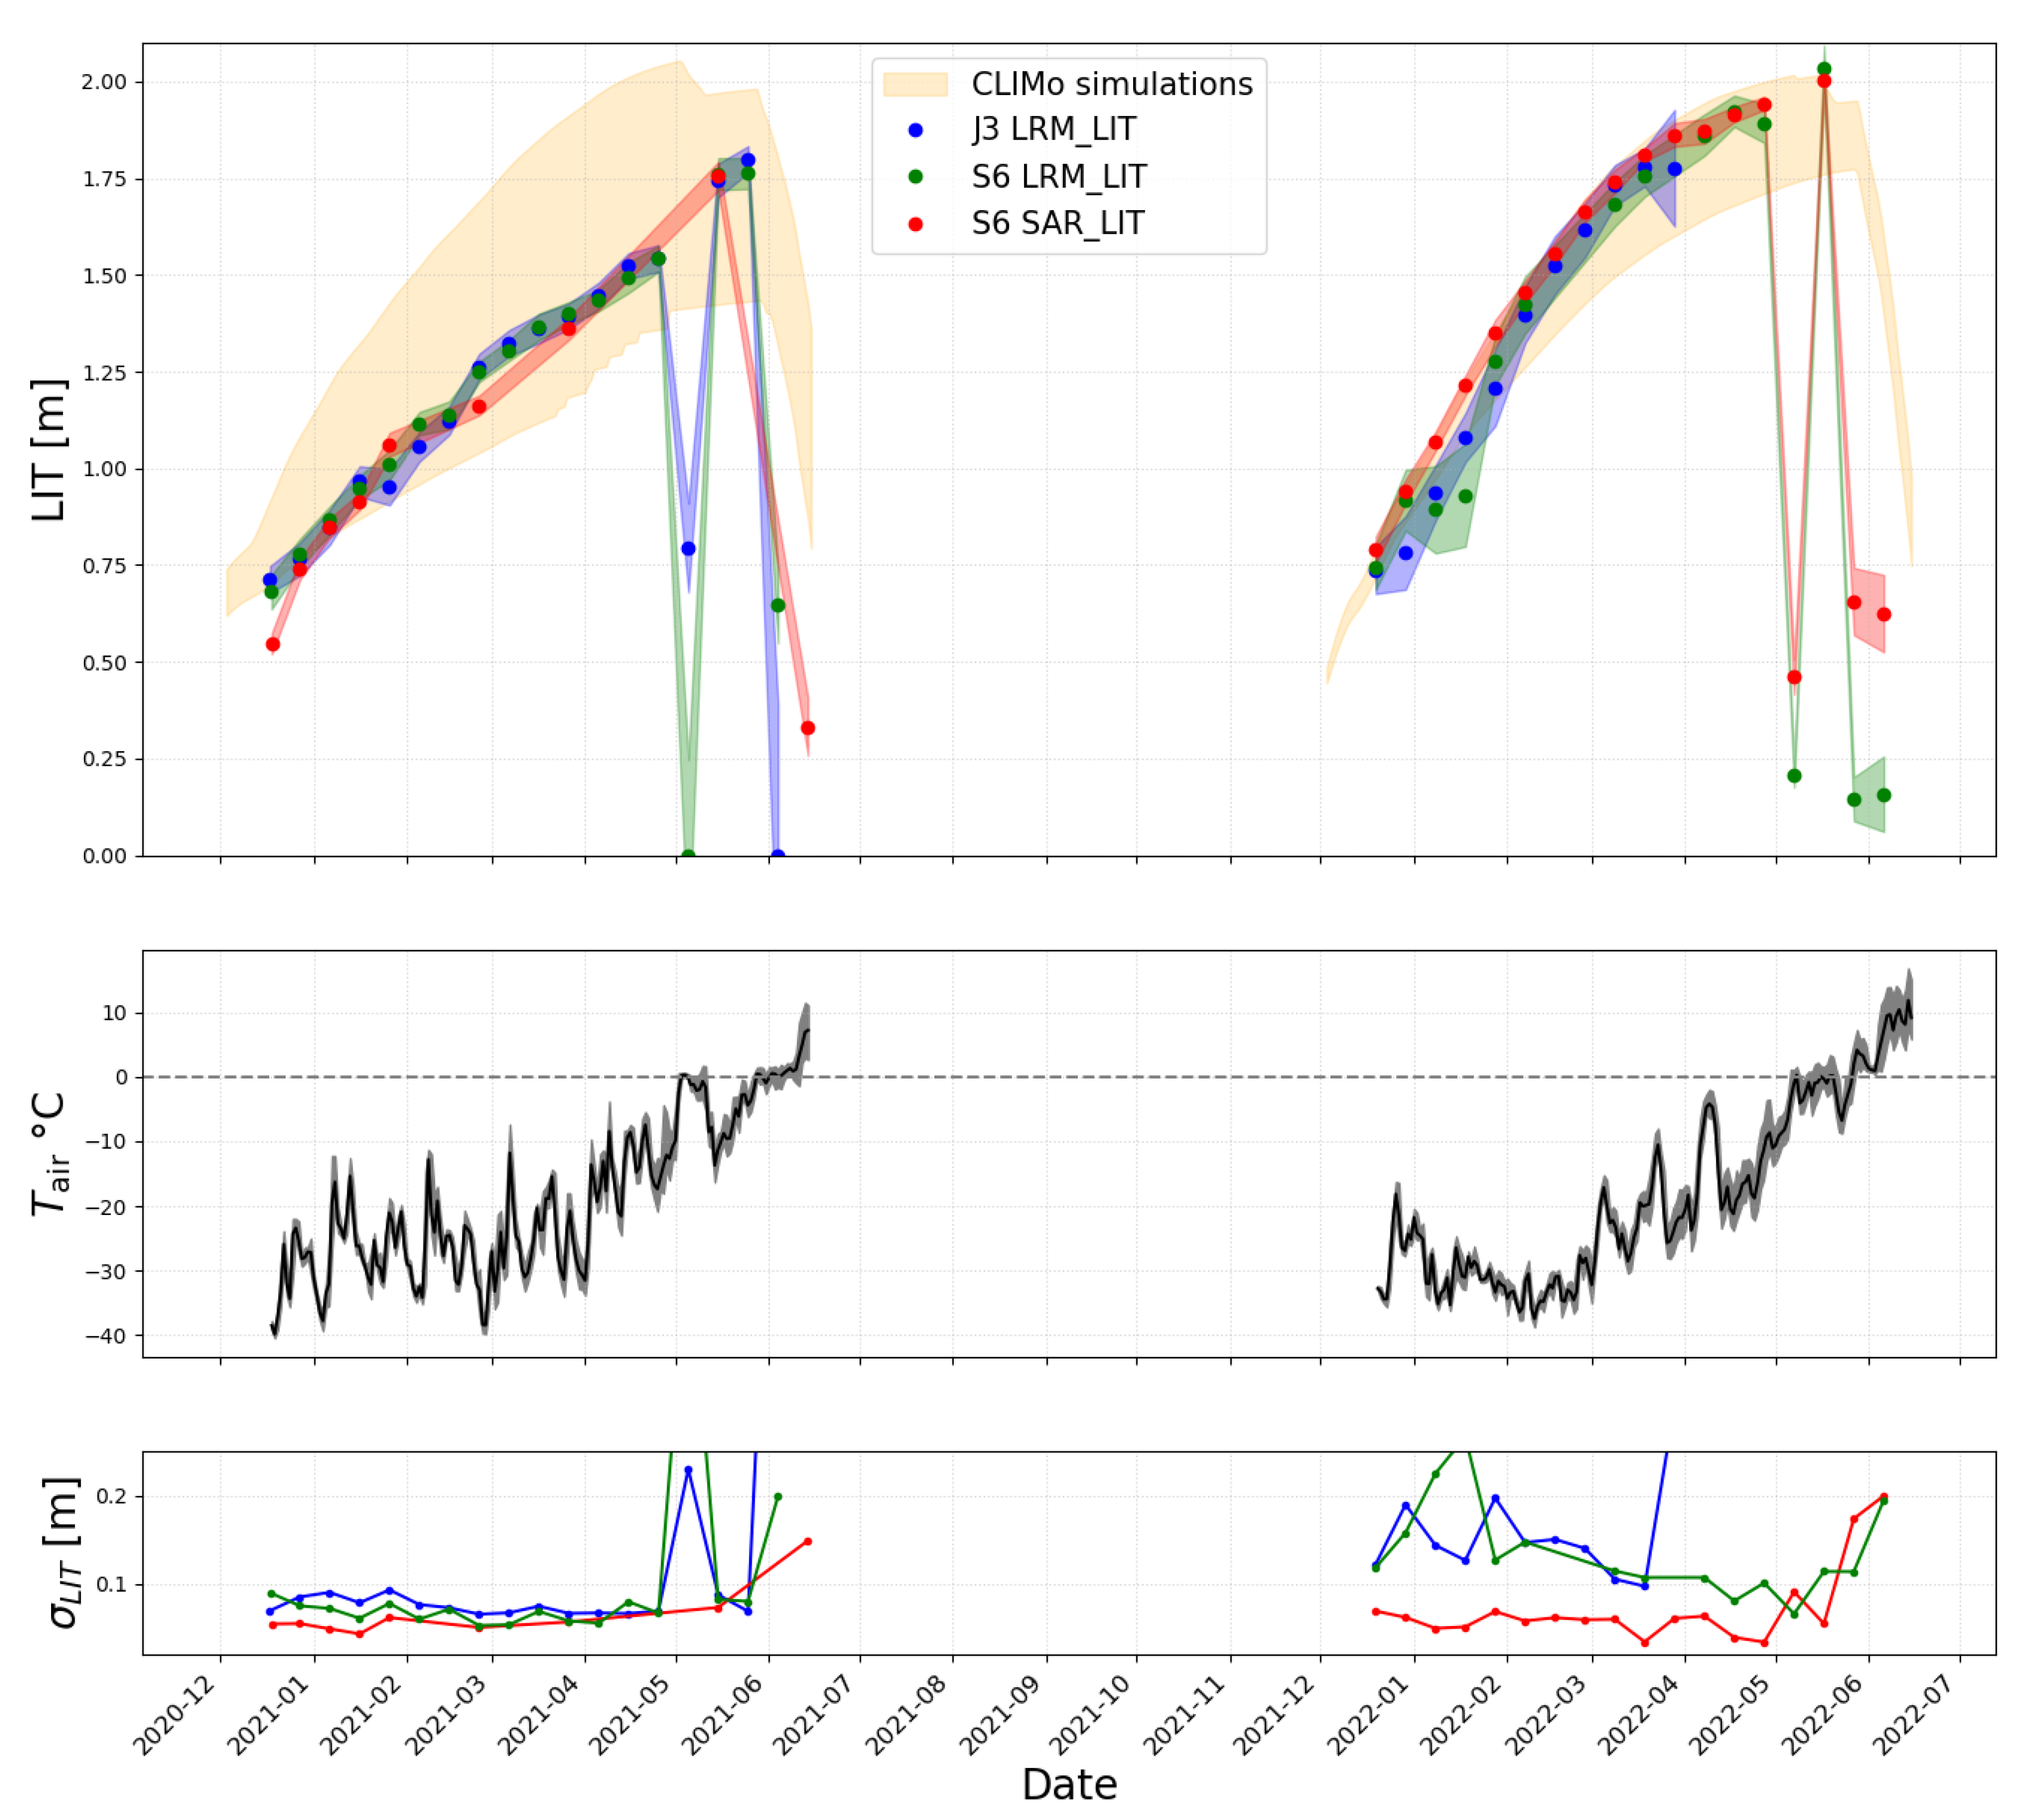
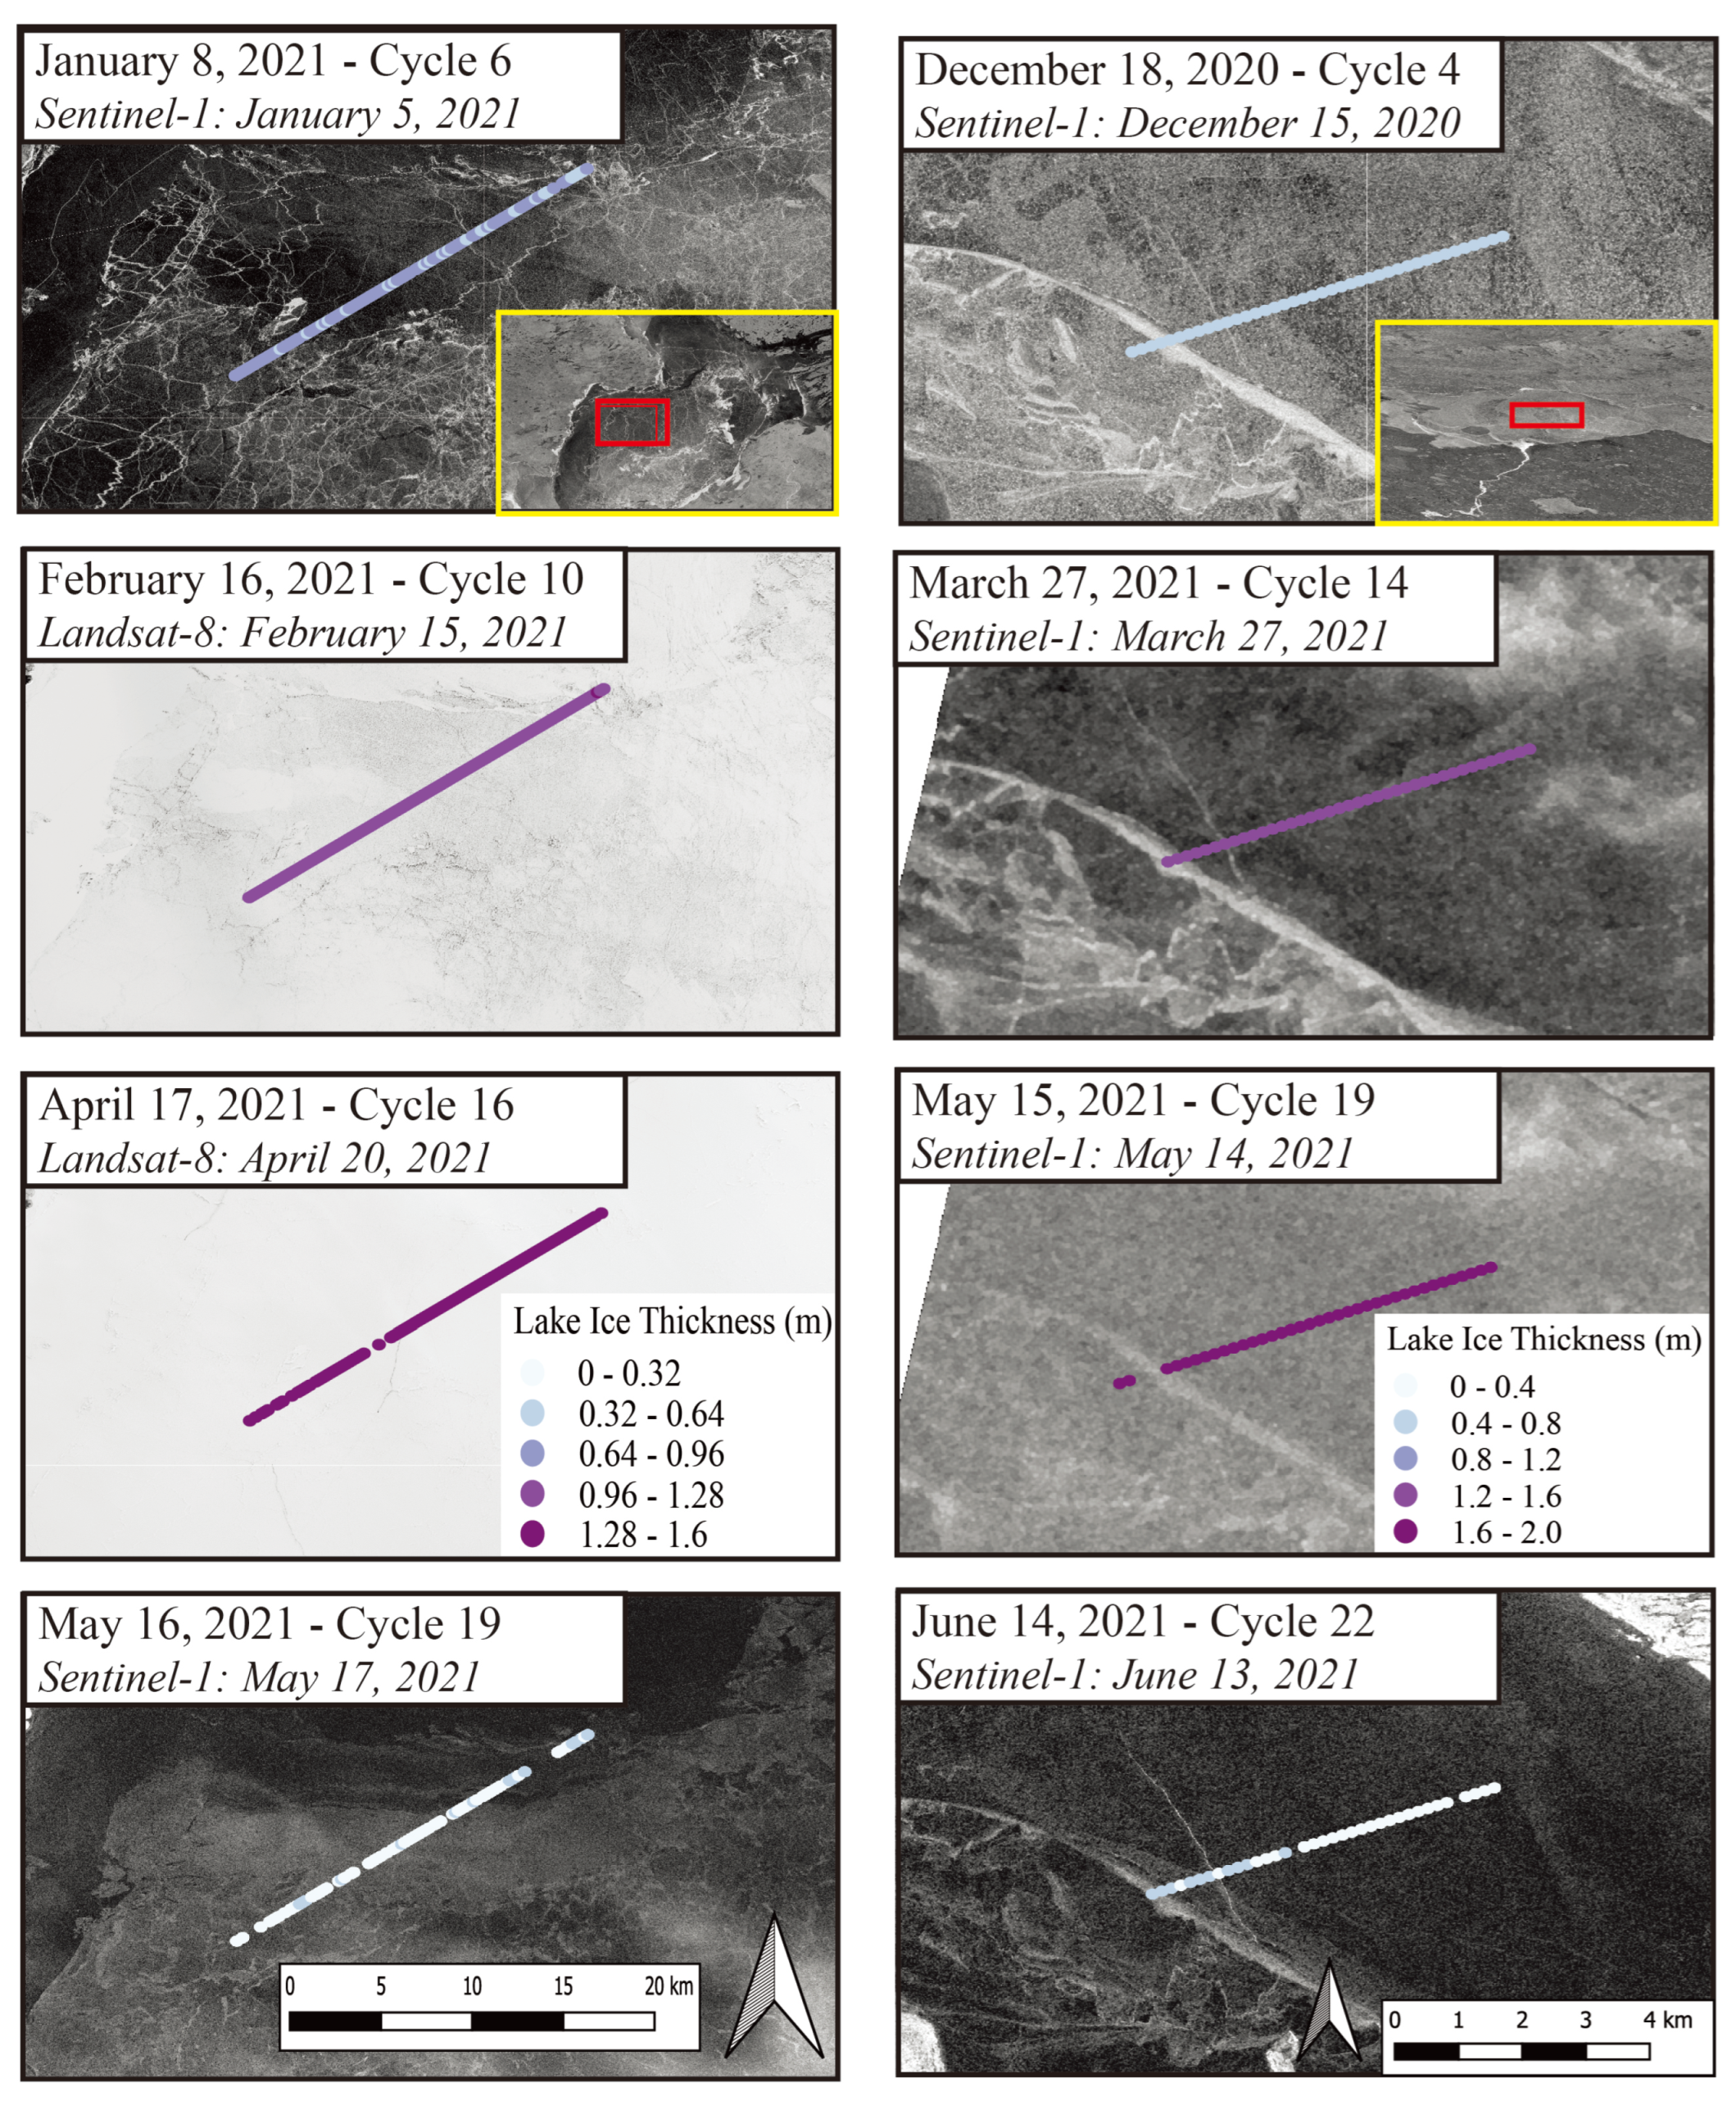
| Data | LITmax [m] | [m] | MBE [m] | RMSE [m] | ||
|---|---|---|---|---|---|---|
| Great Slave Lake | S6 SAR 20 Hz | 15-04-21 | - | - | ||
| S6 LRM 20 Hz | 15-04-21 | 0.017 | 0.033 | |||
| J3 LRM 20 Hz | 15-04-21 | 0.04 | 0.04 | |||
| CLIMo-0 | 1.47 | 14-04-21 | -0.07 | 0.08 | ||
| CLIMo-25 | 1.28 | 19-04-21 | 0.10 | 0.10 | ||
| CLIMo-50 | 1.21 | 02-05-21 | 0.20 | 0.20 | ||
| CLIMo-70 | 1.19 | 05-05-21 | 0.23 | 0.23 | ||
| Baker Lake | S6 SAR 20 Hz | 17-05-22 | - | - | ||
| S6 LRM 20 Hz | 17-05-22 | 0.023 | 0.032 | |||
| J3 LRM 20 Hz | − | - | 0.07 | 0.07 | ||
| CLIMo-0 | 2.05 | 07-05-22 | -0.03 | 0.05 | ||
| CLIMo-25 | 1.88 | 14-05-22 | 0.07 | 0.07 | ||
| CLIMo-50 | 1.82 | 27-05-22 | 0.16 | 0.16 | ||
| CLIMo-70 | 1.77 | 27-05-22 | 0.23 | 0.23 |
Disclaimer/Publisher’s Note: The statements, opinions and data contained in all publications are solely those of the individual author(s) and contributor(s) and not of MDPI and/or the editor(s). MDPI and/or the editor(s) disclaim responsibility for any injury to people or property resulting from any ideas, methods, instructions or products referred to in the content. |
© 2024 by the authors. Licensee MDPI, Basel, Switzerland. This article is an open access article distributed under the terms and conditions of the Creative Commons Attribution (CC BY) license (http://creativecommons.org/licenses/by/4.0/).


