Submitted:
30 May 2024
Posted:
30 May 2024
You are already at the latest version
Abstract
Keywords:
1. Introduction
2. Materials and Methods
2.1. Study Place and Experimental Design
2.2. Foliar Collection, Hyperespectral Data Acquisition and Quantification of Leaf Nitrogen
2.3. Model Description and Performance Analysis
3. Results
3.1. Foliar Nitrogen Content
3.2. Leaf Spectral Analysis
4. Conclusions
Author Contributions
Funding
Conflicts of Interest
References
- Antolin, L. A. S.; Heinemann, A. B.; Marin, F. R. Impact Assessment of Common Bean Availability in Brazil under Climate Change Scenarios. Agric Syst 2021, 191, 103174. [Google Scholar] [CrossRef]
- Heinemann, A. B.; Costa-Neto, G.; Fritsche-Neto, R.; da Matta, D. H.; Fernandes, I. K. Enviromic Prediction Is Useful to Define the Limits of Climate Adaptation: A Case Study of Common Bean in Brazil. Field Crops Res 2022, 286, 108628. [Google Scholar] [CrossRef]
- FAO. FAOSTAT Statistical Database. Rome: Food and Agriculture Organisation of the United Nations. 2020.
- Shumi, D. Response of Common Bean (Phaseolus Vulgaris L.) Varieties to Rates of Blended NPS Fertilizer in Adola District, Southern Ethiopia. African Journal of Plant Science 2018, 12(8), 164–179. [Google Scholar] [CrossRef]
- Araujo Robusti, E.; Godoy Androcioli, H.; Ventura, M. U.; Hata, F. T.; Soares Júnior, D.; Menezes Júnior, A. de O. Integrated Pest Management versus Conventional System in the Common Bean Crop in Brazil: Insecticide Reduction and Financial Maximization. Int J Pest Manag 2023, 1–11. [CrossRef]
- da Silva Borges, M. P.; Trezzi, M. M.; Mendes, K. F.; Fuzinatto, E.; Pilatti, G.; da Silva, A. A. Tolerance of Brazilian Bean Cultivars to S-Metolachlor and Poaceae Weed Control in Two Agricultural Soils. Agronomy 2023, 13 (12), 2919. [CrossRef]
- Xie, K.; Ren, Y.; Chen, A.; Yang, C.; Zheng, Q.; Chen, J.; Wang, D.; Li, Y.; Hu, S.; Xu, G. Plant Nitrogen Nutrition: The Roles of Arbuscular Mycorrhizal Fungi. J Plant Physiol 2022, 269, 153591. [Google Scholar] [CrossRef] [PubMed]
- Li, R.; Jia, X.; Hu, M.; Zhou, M.; Li, D.; Liu, W.; Wang, R.; Zhang, J.; Xie, C.; Liu, L.; Wang, F.; Chen, H.; Chen, T.; Hu, H. An Effective Data Augmentation Strategy for CNN-Based Pest Localization and Recognition in the Field. IEEE Access 2019, 7, 160274–160283. [Google Scholar] [CrossRef]
- Silva, B. C. da; Prado, R. de M.; Baio, F. H. R.; Campos, C. N. S.; Teodoro, L. P. R.; Teodoro, P. E.; Santana, D. C.; Fernandes, T. F. S.; Silva Junior, C. A. da; Loureiro, E. de S. New Approach for Predicting Nitrogen and Pigments in Maize from Hyperspectral Data and Machine Learning Models. Remote Sens Appl 2024, 33, 101110. [CrossRef]
- Fu, Y.; Yang, G.; Pu, R.; Li, Z.; Li, H.; Xu, X.; Song, X.; Yang, X.; Zhao, C. An Overview of Crop Nitrogen Status Assessment Using Hyperspectral Remote Sensing: Current Status and Perspectives. European Journal of Agronomy 2021, 124, 126241. [Google Scholar] [CrossRef]
- Acosta, M.; Quiñones, A.; Munera, S.; de Paz, J. M.; Blasco, J. Rapid Prediction of Nutrient Concentration in Citrus Leaves Using Vis-NIR Spectroscopy. Sensors 2023, 23(14), 6530. [Google Scholar] [CrossRef]
- Fiorio, P. R.; Silva, C. A. A. C.; Rizzo, R.; Demattê, J. A. M.; Luciano, A. C. dos S.; Silva, M. A. da. Prediction of Leaf Nitrogen in Sugarcane (Saccharum Spp.) by Vis-NIR-SWIR Spectroradiometry. Heliyon 2024, 10(5), e26819. [CrossRef]
- Sanaeifar, A.; Yang, C.; de la Guardia, M.; Zhang, W.; Li, X.; He, Y. Proximal Hyperspectral Sensing of Abiotic Stresses in Plants. Science of The Total Environment 2023, 861, 160652. [Google Scholar] [CrossRef]
- Azadnia, R.; Rajabipour, A.; Jamshidi, B.; Omid, M. New Approach for Rapid Estimation of Leaf Nitrogen, Phosphorus, and Potassium Contents in Apple-Trees Using Vis/NIR Spectroscopy Based on Wavelength Selection Coupled with Machine Learning. Comput Electron Agric 2023, 207, 107746. [Google Scholar] [CrossRef]
- Amaral, J. B. C.; Lopes, F. B.; Magalhães, A. C. M. de; Kujawa, S.; Taniguchi, C. A. K.; Teixeira, A. dos S.; Lacerda, C. F. de; Queiroz, T. R. G.; Andrade, E. M. de; Araújo, I. C. da S.; Niedbała, G. Quantifying Nutrient Content in the Leaves of Cowpea Using Remote Sensing. Applied Sciences 2022, 12(1), 458. [CrossRef]
- Ji, F.; Li, F.; Hao, D.; Shiklomanov, A. N.; Yang, X.; Townsend, P. A.; Dashti, H.; Nakaji, T.; Kovach, K. R.; Liu, H.; Luo, M.; Chen, M. Unveiling the Transferability of <scp>PLSR</Scp> Models for Leaf Trait Estimation: Lessons from a Comprehensive Analysis with a Novel Global Dataset. New Phytologist 2024. [Google Scholar] [CrossRef] [PubMed]
- Chen, B.; Lu, X.; Yu, S.; Gu, S.; Huang, G.; Guo, X.; Zhao, C. The Application of Machine Learning Models Based on Leaf Spectral Reflectance for Estimating the Nitrogen Nutrient Index in Maize. Agriculture 2022, 12(11), 1839. [Google Scholar] [CrossRef]
- Mustaqimah; Devianti; Munawar, A. A.; Sufardi, S. Capability of Short Vis-NIR Band Tandem with Machine Learning to Rapidly Predict NPK Content in Tropical Farmland: A Case Study of Aceh Province Agricultural Soil Dry Land, Indonesia. Case Studies in Chemical and Environmental Engineering 2024, 9, 100711. [CrossRef]
- Osco, L. P.; Ramos, A. P. M.; Faita Pinheiro, M. M.; Moriya, É. A. S.; Imai, N. N.; Estrabis, N.; Ianczyk, F.; Araújo, F. F. de; Liesenberg, V.; Jorge, L. A. de C.; Li, J.; Ma, L.; Gonçalves, W. N.; Marcato Junior, J.; Eduardo Creste, J. A Machine Learning Framework to Predict Nutrient Content in Valencia-Orange Leaf Hyperspectral Measurements. Remote Sens (Basel) 2020, 12(6), 906. [CrossRef]
- Barcala, V.; Rozemeijer, J.; Ouwerkerk, K.; Gerner, L.; Osté, L. Value and Limitations of Machine Learning in High-Frequency Nutrient Data for Gap-Filling, Forecasting, and Transport Process Interpretation. Environ Monit Assess 2023, 195(7), 892. [Google Scholar] [CrossRef] [PubMed]
- Li, D.; Hu, Q.; Ruan, S.; Liu, J.; Zhang, J.; Hu, C.; Liu, Y.; Dian, Y.; Zhou, J. Utilizing Hyperspectral Reflectance and Machine Learning Algorithms for Non-Destructive Estimation of Chlorophyll Content in Citrus Leaves. Remote Sens (Basel) 2023, 15(20), 4934. [CrossRef]
- Alvares, C. A.; Stape, J. L.; Sentelhas, P. C.; de Moraes Gonçalves, J. L.; Sparovek, G. Köppen’s Climate Classification Map for Brazil. Meteorologische Zeitschrift 2013, 22(6), 711–728. [Google Scholar] [CrossRef] [PubMed]
- Cantarella, H.; Quaggio, J. A.; Júnior, D. M.; Boaretto, R. M.; Raij, B. van. Boletim 100: Recomendações de Adubação e Calagem Para o Estado de São Paulo; 2022.
- Lynch, J. M.; Barbano, D. M. Kjeldahl Nitrogen Analysis as a Reference Method for Protein Determination in Dairy Products. J AOAC Int 1999, 82(6), 1389–1398. [Google Scholar] [CrossRef]
- Bakthavatchalam, K.; Karthik, B.; Thiruvengadam, V.; Muthal, S.; Jose, D.; Kotecha, K.; Varadarajan, V. IoT Framework for Measurement and Precision Agriculture: Predicting the Crop Using Machine Learning Algorithms. Technologies (Basel) 2022, 10(1), 13. [Google Scholar] [CrossRef]
- Shi, M.; Hu, W.; Li, M.; Zhang, J.; Song, X.; Sun, W. Ensemble Regression Based on Polynomial Regression-Based Decision Tree and Its Application in the in-Situ Data of Tunnel Boring Machine. Mech Syst Signal Process 2023, 188, 110022. [Google Scholar] [CrossRef]
- Azadnia, R.; Rajabipour, A.; Jamshidi, B.; Omid, M. New Approach for Rapid Estimation of Leaf Nitrogen, Phosphorus, and Potassium Contents in Apple-Trees Using Vis/NIR Spectroscopy Based on Wavelength Selection Coupled with Machine Learning. Comput Electron Agric 2023, 207, 107746. [Google Scholar] [CrossRef]
- Roopashree, S.; Anitha, J.; Mahesh, T. R.; Vinoth Kumar, V.; Viriyasitavat, W.; Kaur, A. An IoT Based Authentication System for Therapeutic Herbs Measured by Local Descriptors Using Machine Learning Approach. Measurement 2022, 200, 111484. [Google Scholar] [CrossRef]
- Wang, Y.; Ian, H. Induzindo Árvores Modelo Para Classes Contínuas. In Induzindo árvores modelo para classes contínuas; 9a Conferência Europeia sobre Aprendizado de Máquina, 1997.
- Thai, T. H.; Omari, R. A.; Barkusky, D.; Bellingrath-Kimura, S. D. Statistical Analysis versus the M5P Machine Learning Algorithm to Analyze the Yield of Winter Wheat in a Long-Term Fertilizer Experiment. Agronomy 2020, 10(11), 1779. [Google Scholar] [CrossRef]
- Afzal, S.; Ziapour, B. M.; Shokri, A.; Shakibi, H.; Sobhani, B. Building Energy Consumption Prediction Using Multilayer Perceptron Neural Network-Assisted Models; Comparison of Different Optimization Algorithms. Energy 2023, 282, 128446. [Google Scholar] [CrossRef]
- Harsányi, E.; Bashir, B.; Arshad, S.; Ocwa, A.; Vad, A.; Alsalman, A.; Bácskai, I.; Rátonyi, T.; Hijazi, O.; Széles, A.; Mohammed, S. Data Mining and Machine Learning Algorithms for Optimizing Maize Yield Forecasting in Central Europe. Agronomy 2023, 13(5), 1297. [Google Scholar] [CrossRef]
- Zovko, M.; Žibrat, U.; Knapič, M.; Kovačić, M. B.; Romić, D. Hyperspectral Remote Sensing of Grapevine Drought Stress. Precis Agric 2019, 20(2), 335–347. [Google Scholar] [CrossRef]
- Nunes, H. D.; Leal, F. T.; Mingotte, F. L. C.; Damião, V. D.; Junior, P. A. C.; Lemos, L. B. Agronomic Performance, Quality and Nitrogen Use Efficiency by Common Bean Cultivars. J Plant Nutr 2021, 44(7), 995–1009. [Google Scholar] [CrossRef]
- Falcioni, R.; Moriwaki, T.; Pattaro, M.; Herrig Furlanetto, R.; Nanni, M. R.; Camargos Antunes, W. High Resolution Leaf Spectral Signature as a Tool for Foliar Pigment Estimation Displaying Potential for Species Differentiation. J Plant Physiol 2020, 249, 153161. [Google Scholar] [CrossRef]
- Liu, L.; Zhang, S.; Zhang, B. Evaluation of Hyperspectral Indices for Retrieval of Canopy Equivalent Water Thickness and Gravimetric Water Content. Int J Remote Sens 2016, 37(14), 3384–3399. [Google Scholar] [CrossRef]
- Machado, M. L.; Pinto, F. de A. C.; Paula Junior, T. J. de; Queiroz, D. M. de; Cerqueira, O. de A. T. White Mold Detection in Common Beans through Leaf Reflectance Spectroscopy. Engenharia Agrícola 2015, 35(6), 1117–1126. [Google Scholar] [CrossRef]
- Liang, L.; Qin, Z.; Zhao, S.; Di, L.; Zhang, C.; Deng, M.; Lin, H.; Zhang, L.; Wang, L.; Liu, Z. Estimating Crop Chlorophyll Content with Hyperspectral Vegetation Indices and the Hybrid Inversion Method. Int J Remote Sens 2016, 37(13), 2923–2949. [Google Scholar] [CrossRef]
- Crusiol, L. G. T.; Sun, L.; Sun, Z.; Chen, R.; Wu, Y.; Ma, J.; Song, C. In-Season Monitoring of Maize Leaf Water Content Using Ground-Based and UAV-Based Hyperspectral Data. Sustainability 2022, 14(15), 9039. [CrossRef]
- Falcioni, R.; Antunes, W. C.; Demattê, J. A. M.; Nanni, M. R. Biophysical, Biochemical, and Photochemical Analyses Using Reflectance Hyperspectroscopy and Chlorophyll a Fluorescence Kinetics in Variegated Leaves. Biology (Basel) 2023, 12(5), 704. [Google Scholar] [CrossRef] [PubMed]
- Maimaitijiang, M.; Sagan, V.; Sidike, P.; Daloye, A. M.; Erkbol, H.; Fritschi, F. B. Crop Monitoring Using Satellite/UAV Data Fusion and Machine Learning. Remote Sens (Basel) 2020, 12(9), 1357. [Google Scholar] [CrossRef]
- Li, D.; Hu, Q.; Ruan, S.; Liu, J.; Zhang, J.; Hu, C.; Liu, Y.; Dian, Y.; Zhou, J. Utilizing Hyperspectral Reflectance and Machine Learning Algorithms for Non-Destructive Estimation of Chlorophyll Content in Citrus Leaves. Remote Sens (Basel) 2023, 15(20), 4934. [Google Scholar] [CrossRef]
- Silva, B. C. da; Prado, R. de M.; Baio, F. H. R.; Campos, C. N. S.; Teodoro, L. P. R.; Teodoro, P. E.; Santana, D. C.; Fernandes, T. F. S.; Silva Junior, C. A. da; Loureiro, E. de S. New Approach for Predicting Nitrogen and Pigments in Maize from Hyperspectral Data and Machine Learning Models. Remote Sens Appl 2024, 33, 101110. [CrossRef]
- Khan, M.; Ullah, Z.; Mašek, O.; Raza Naqvi, S.; Nouman Aslam Khan, M. Artificial Neural Networks for the Prediction of Biochar Yield: A Comparative Study of Metaheuristic Algorithms. Bioresour Technol 2022, 355, 127215. [Google Scholar] [CrossRef]
- Sreedhara, B. M.; Rao, M.; Mandal, S. Application of an Evolutionary Technique (PSO–SVM) and ANFIS in Clear-Water Scour Depth Prediction around Bridge Piers. Neural Comput Appl 2019, 31(11), 7335–7349. [Google Scholar] [CrossRef]
- Azadnia, R.; Rajabipour, A.; Jamshidi, B.; Omid, M. New Approach for Rapid Estimation of Leaf Nitrogen, Phosphorus, and Potassium Contents in Apple-Trees Using Vis/NIR Spectroscopy Based on Wavelength Selection Coupled with Machine Learning. Comput Electron Agric 2023, 207, 107746. [Google Scholar] [CrossRef]
- Narmilan, A.; Gonzalez, F.; Salgadoe, A. S. A.; Kumarasiri, U. W. L. M.; Weerasinghe, H. A. S.; Kulasekara, B. R. Predicting Canopy Chlorophyll Content in Sugarcane Crops Using Machine Learning Algorithms and Spectral Vegetation Indices Derived from UAV Multispectral Imagery. Remote Sens (Basel) 2022, 14(5), 1140. [Google Scholar] [CrossRef]
- Yoosefzadeh-Najafabadi, M.; Earl, H. J.; Tulpan, D.; Sulik, J.; Eskandari, M. Application of Machine Learning Algorithms in Plant Breeding: Predicting Yield From Hyperspectral Reflectance in Soybean. Front Plant Sci 2021, 11. [Google Scholar] [CrossRef] [PubMed]
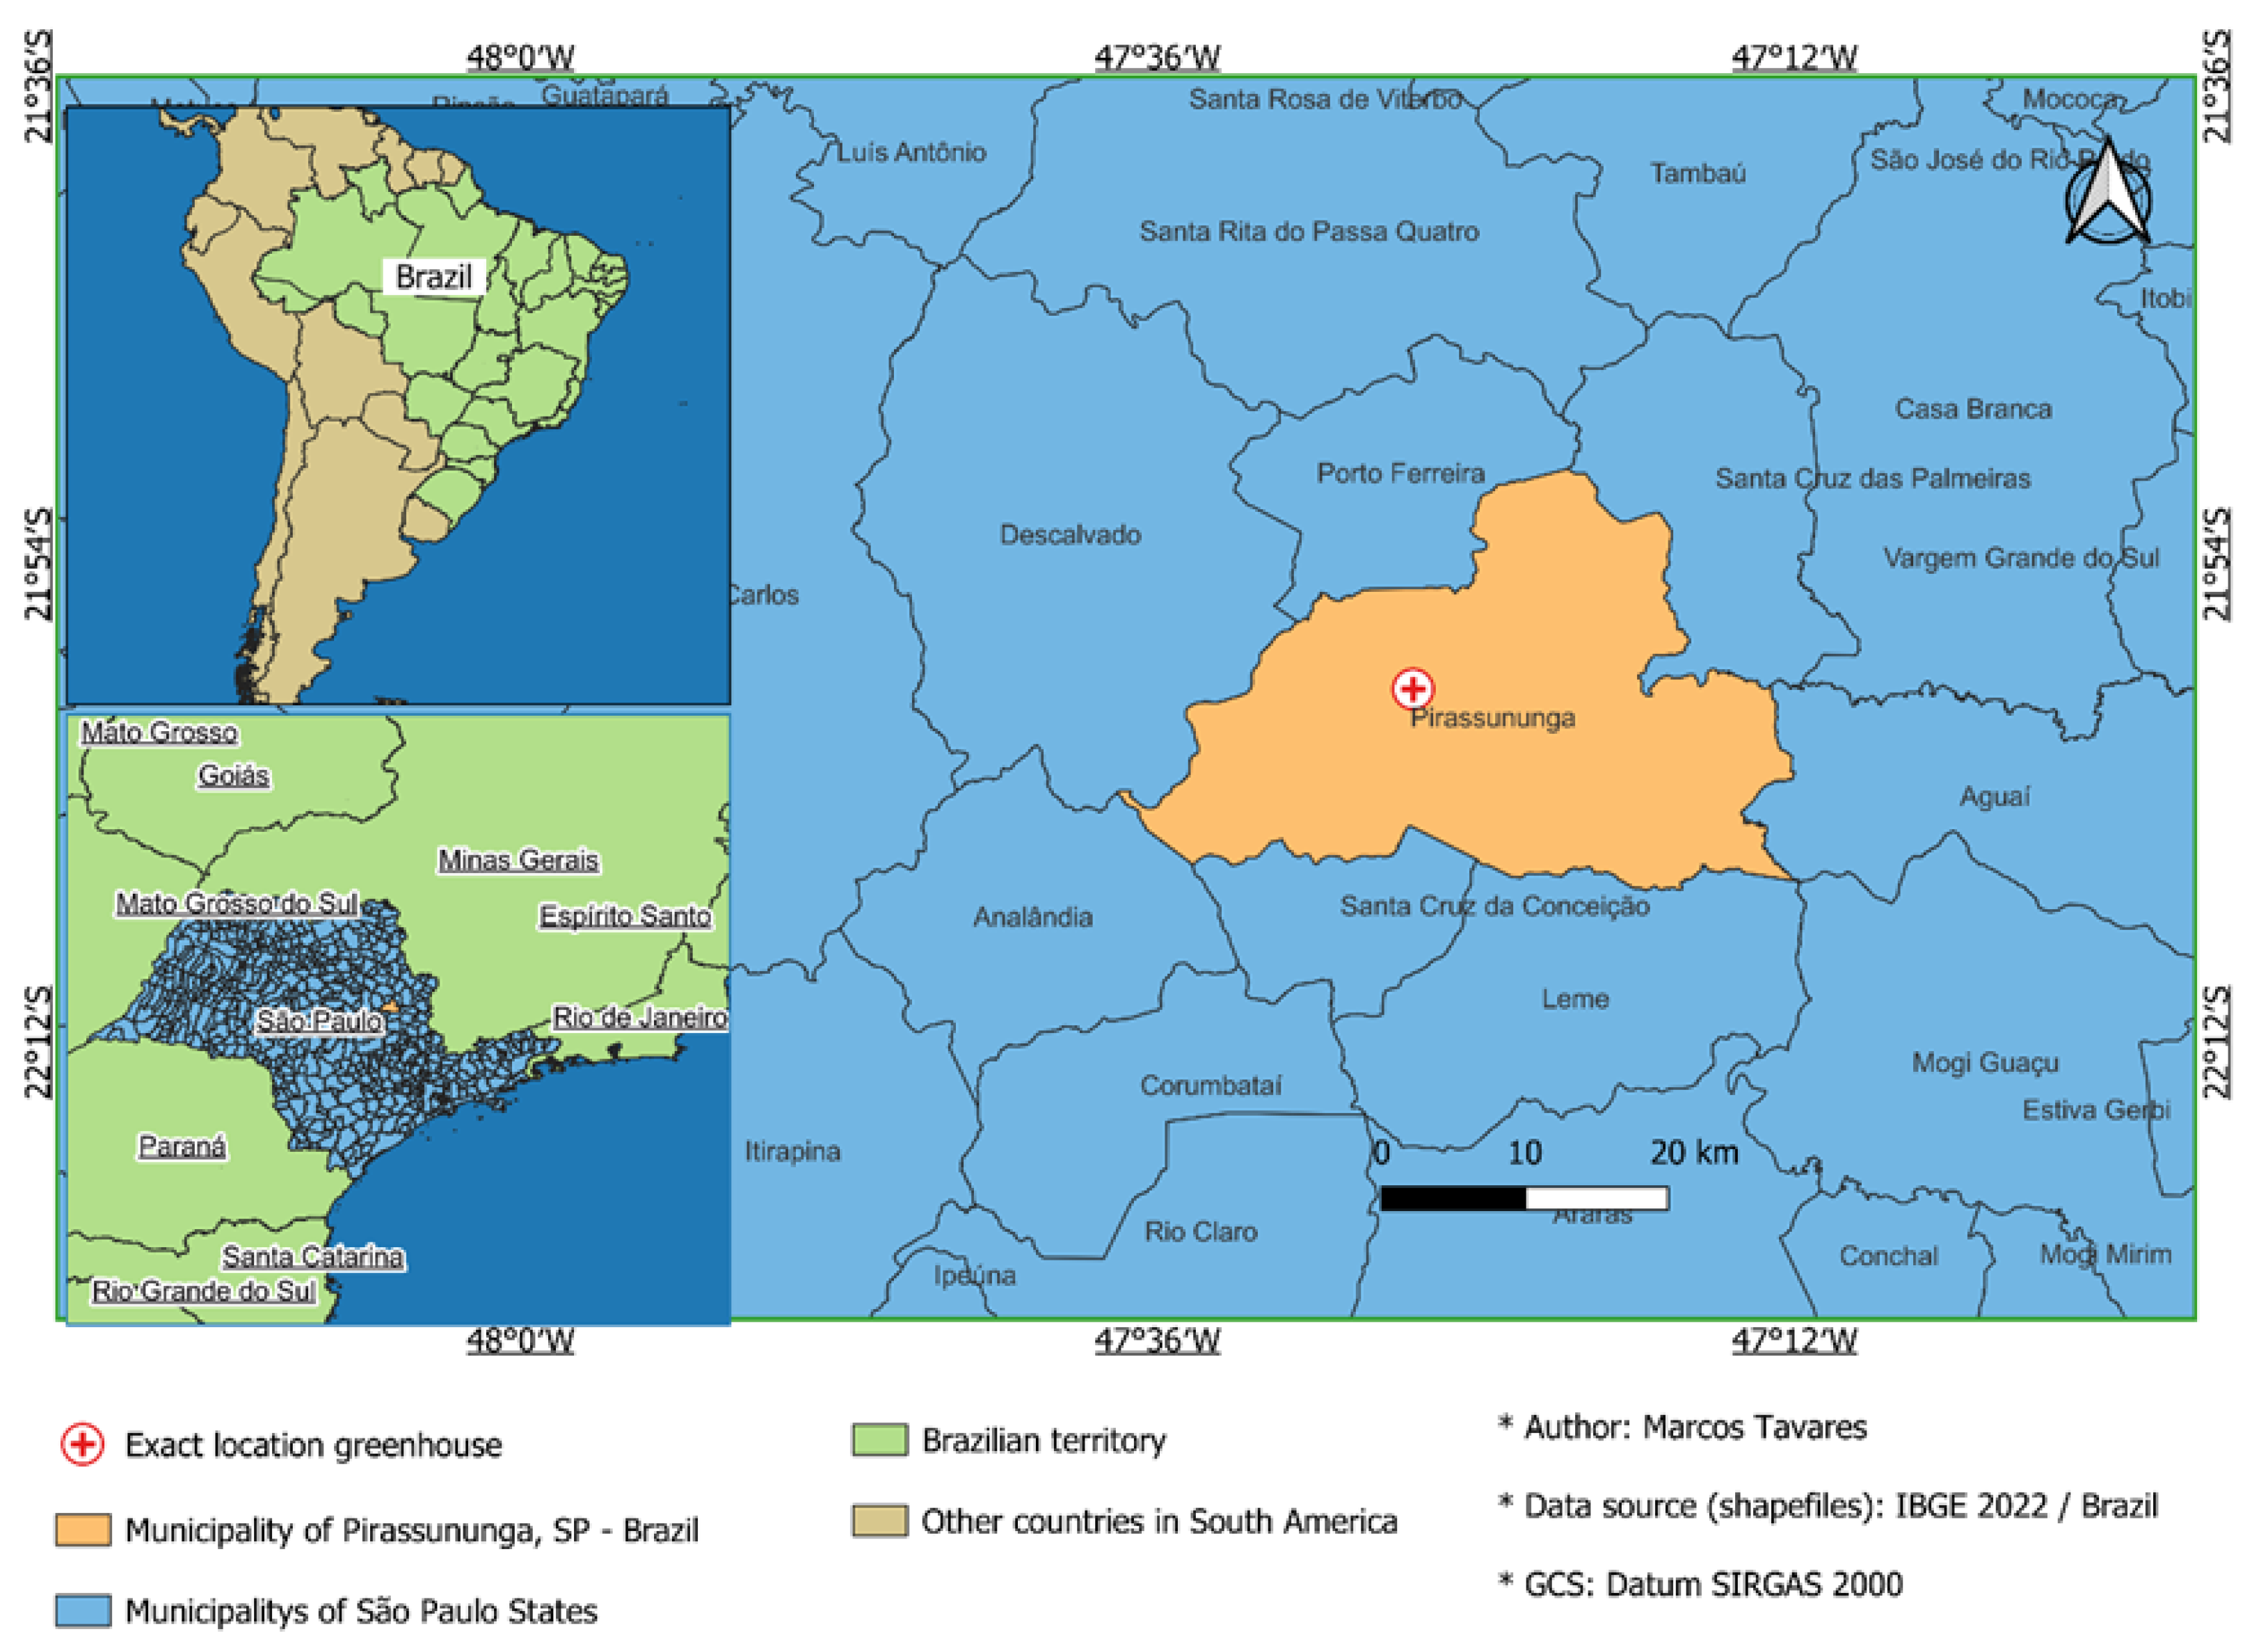
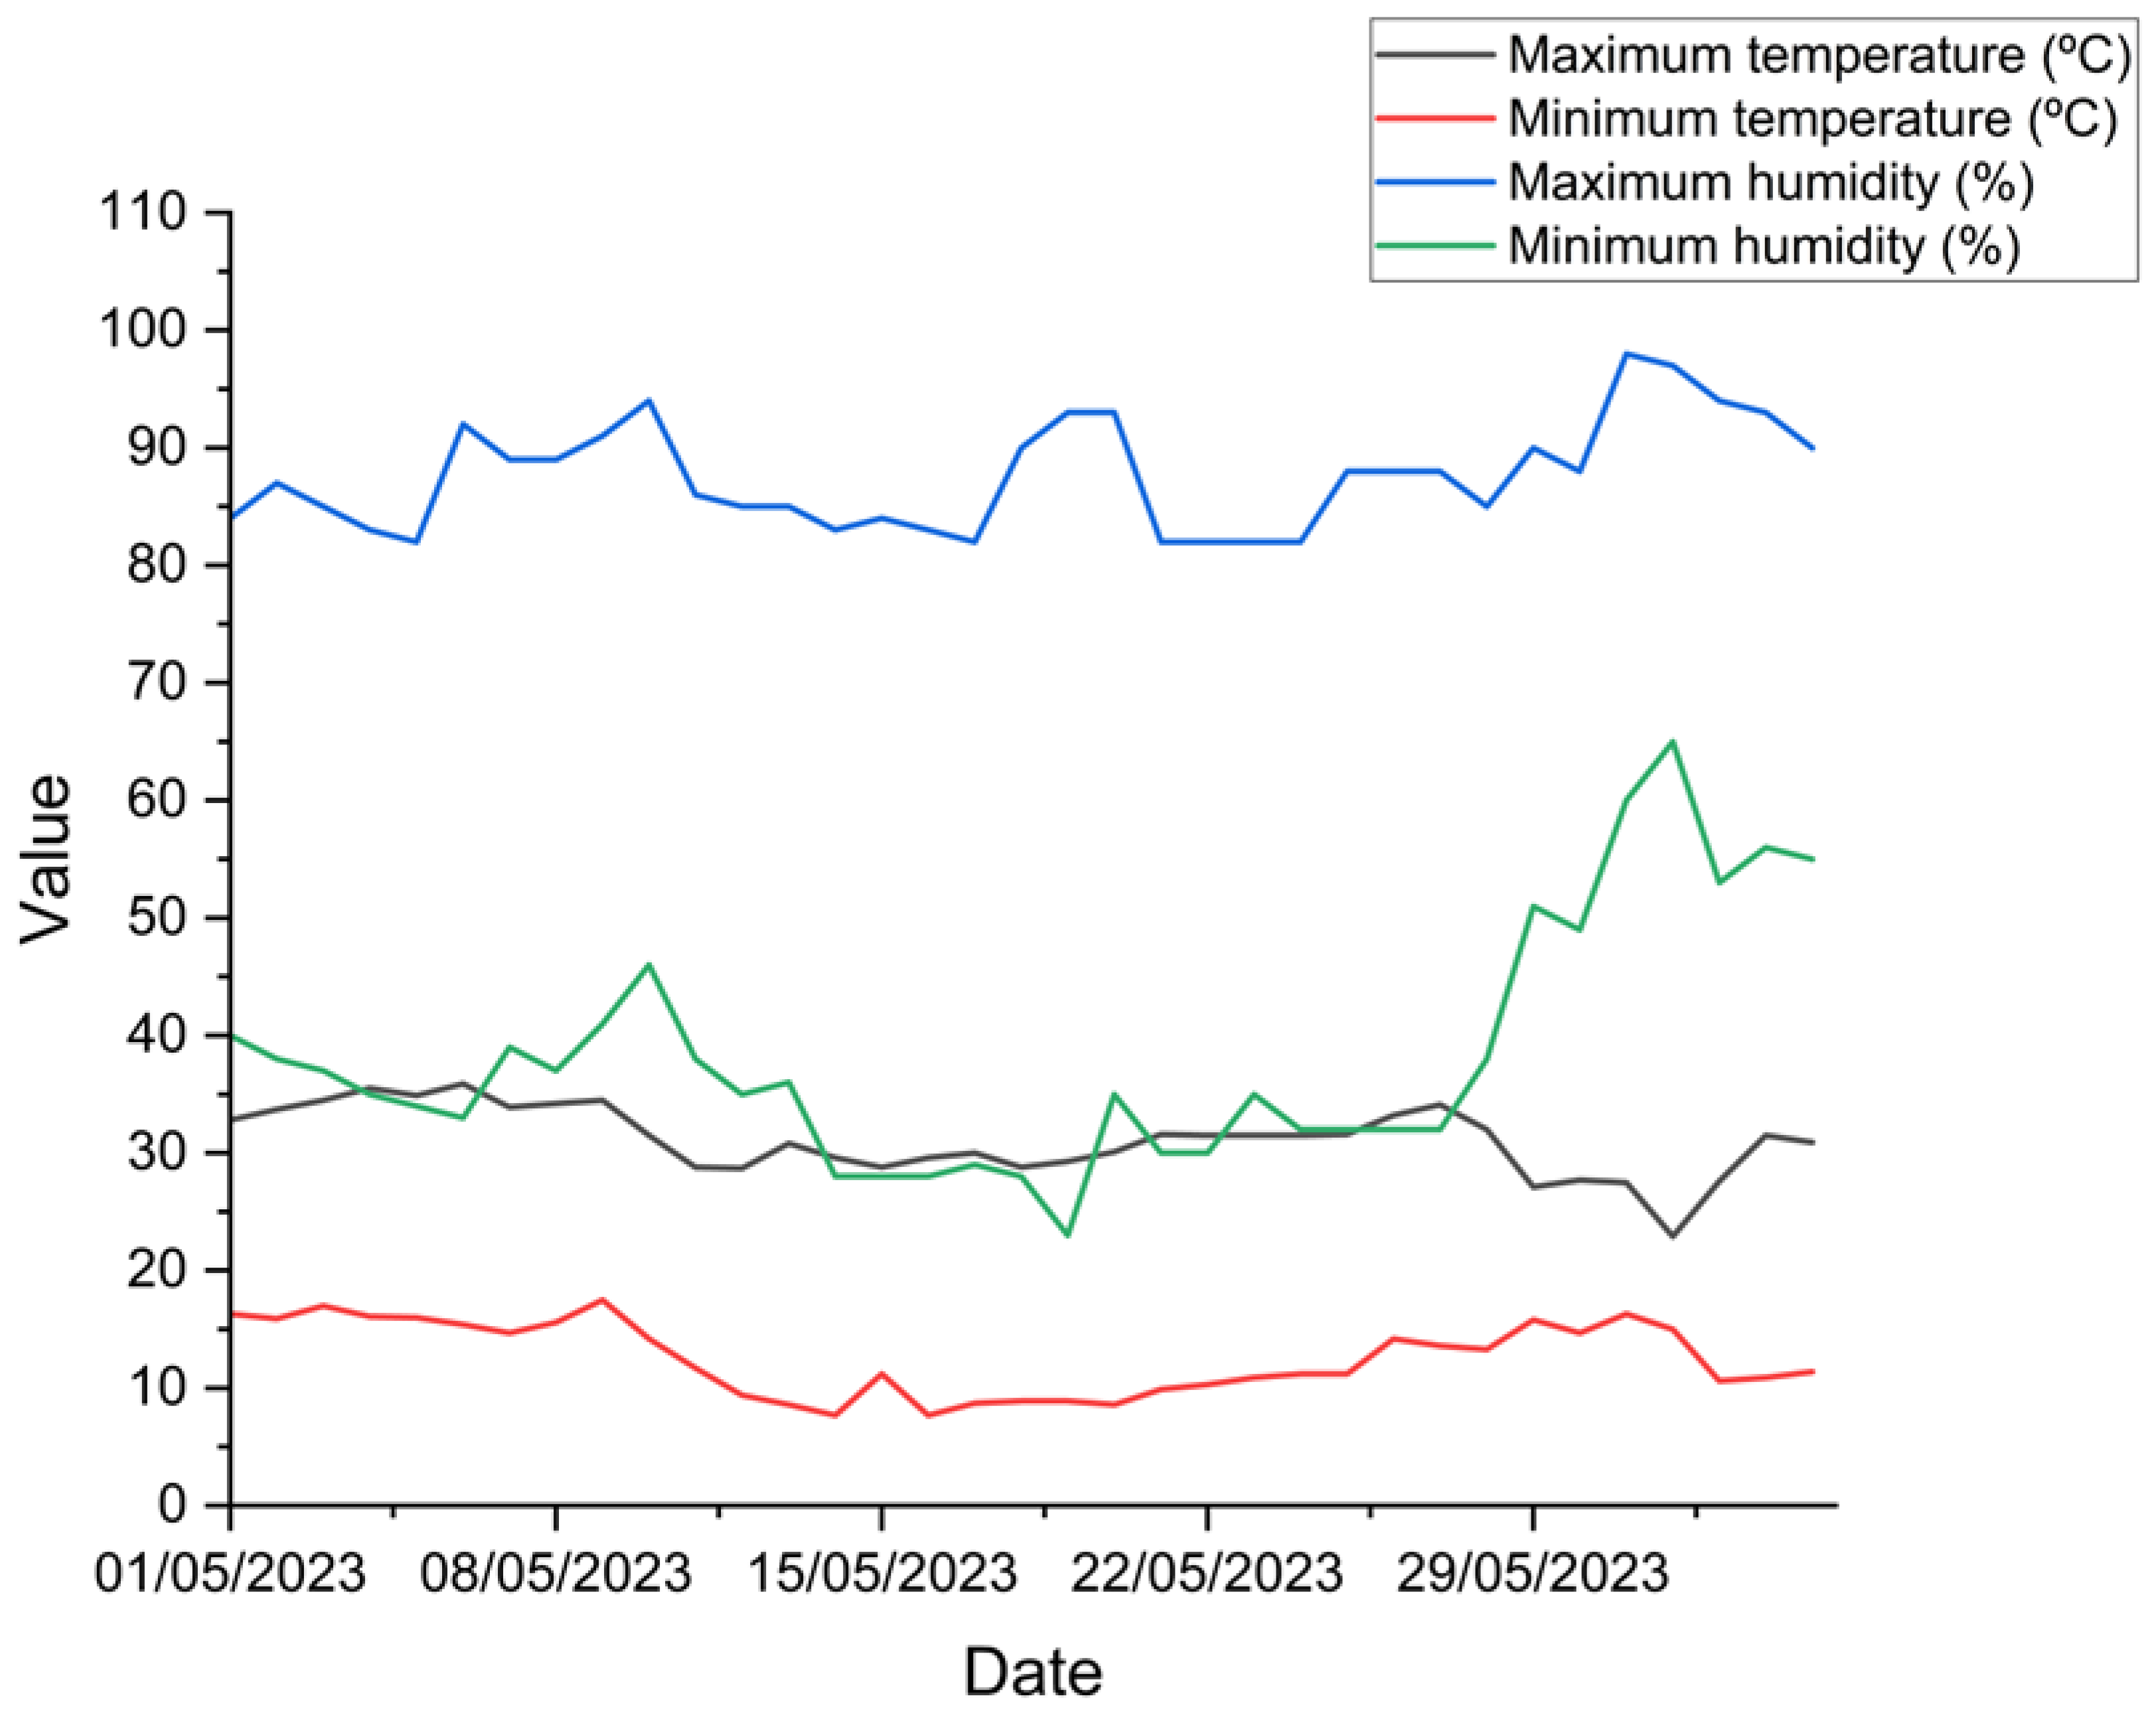
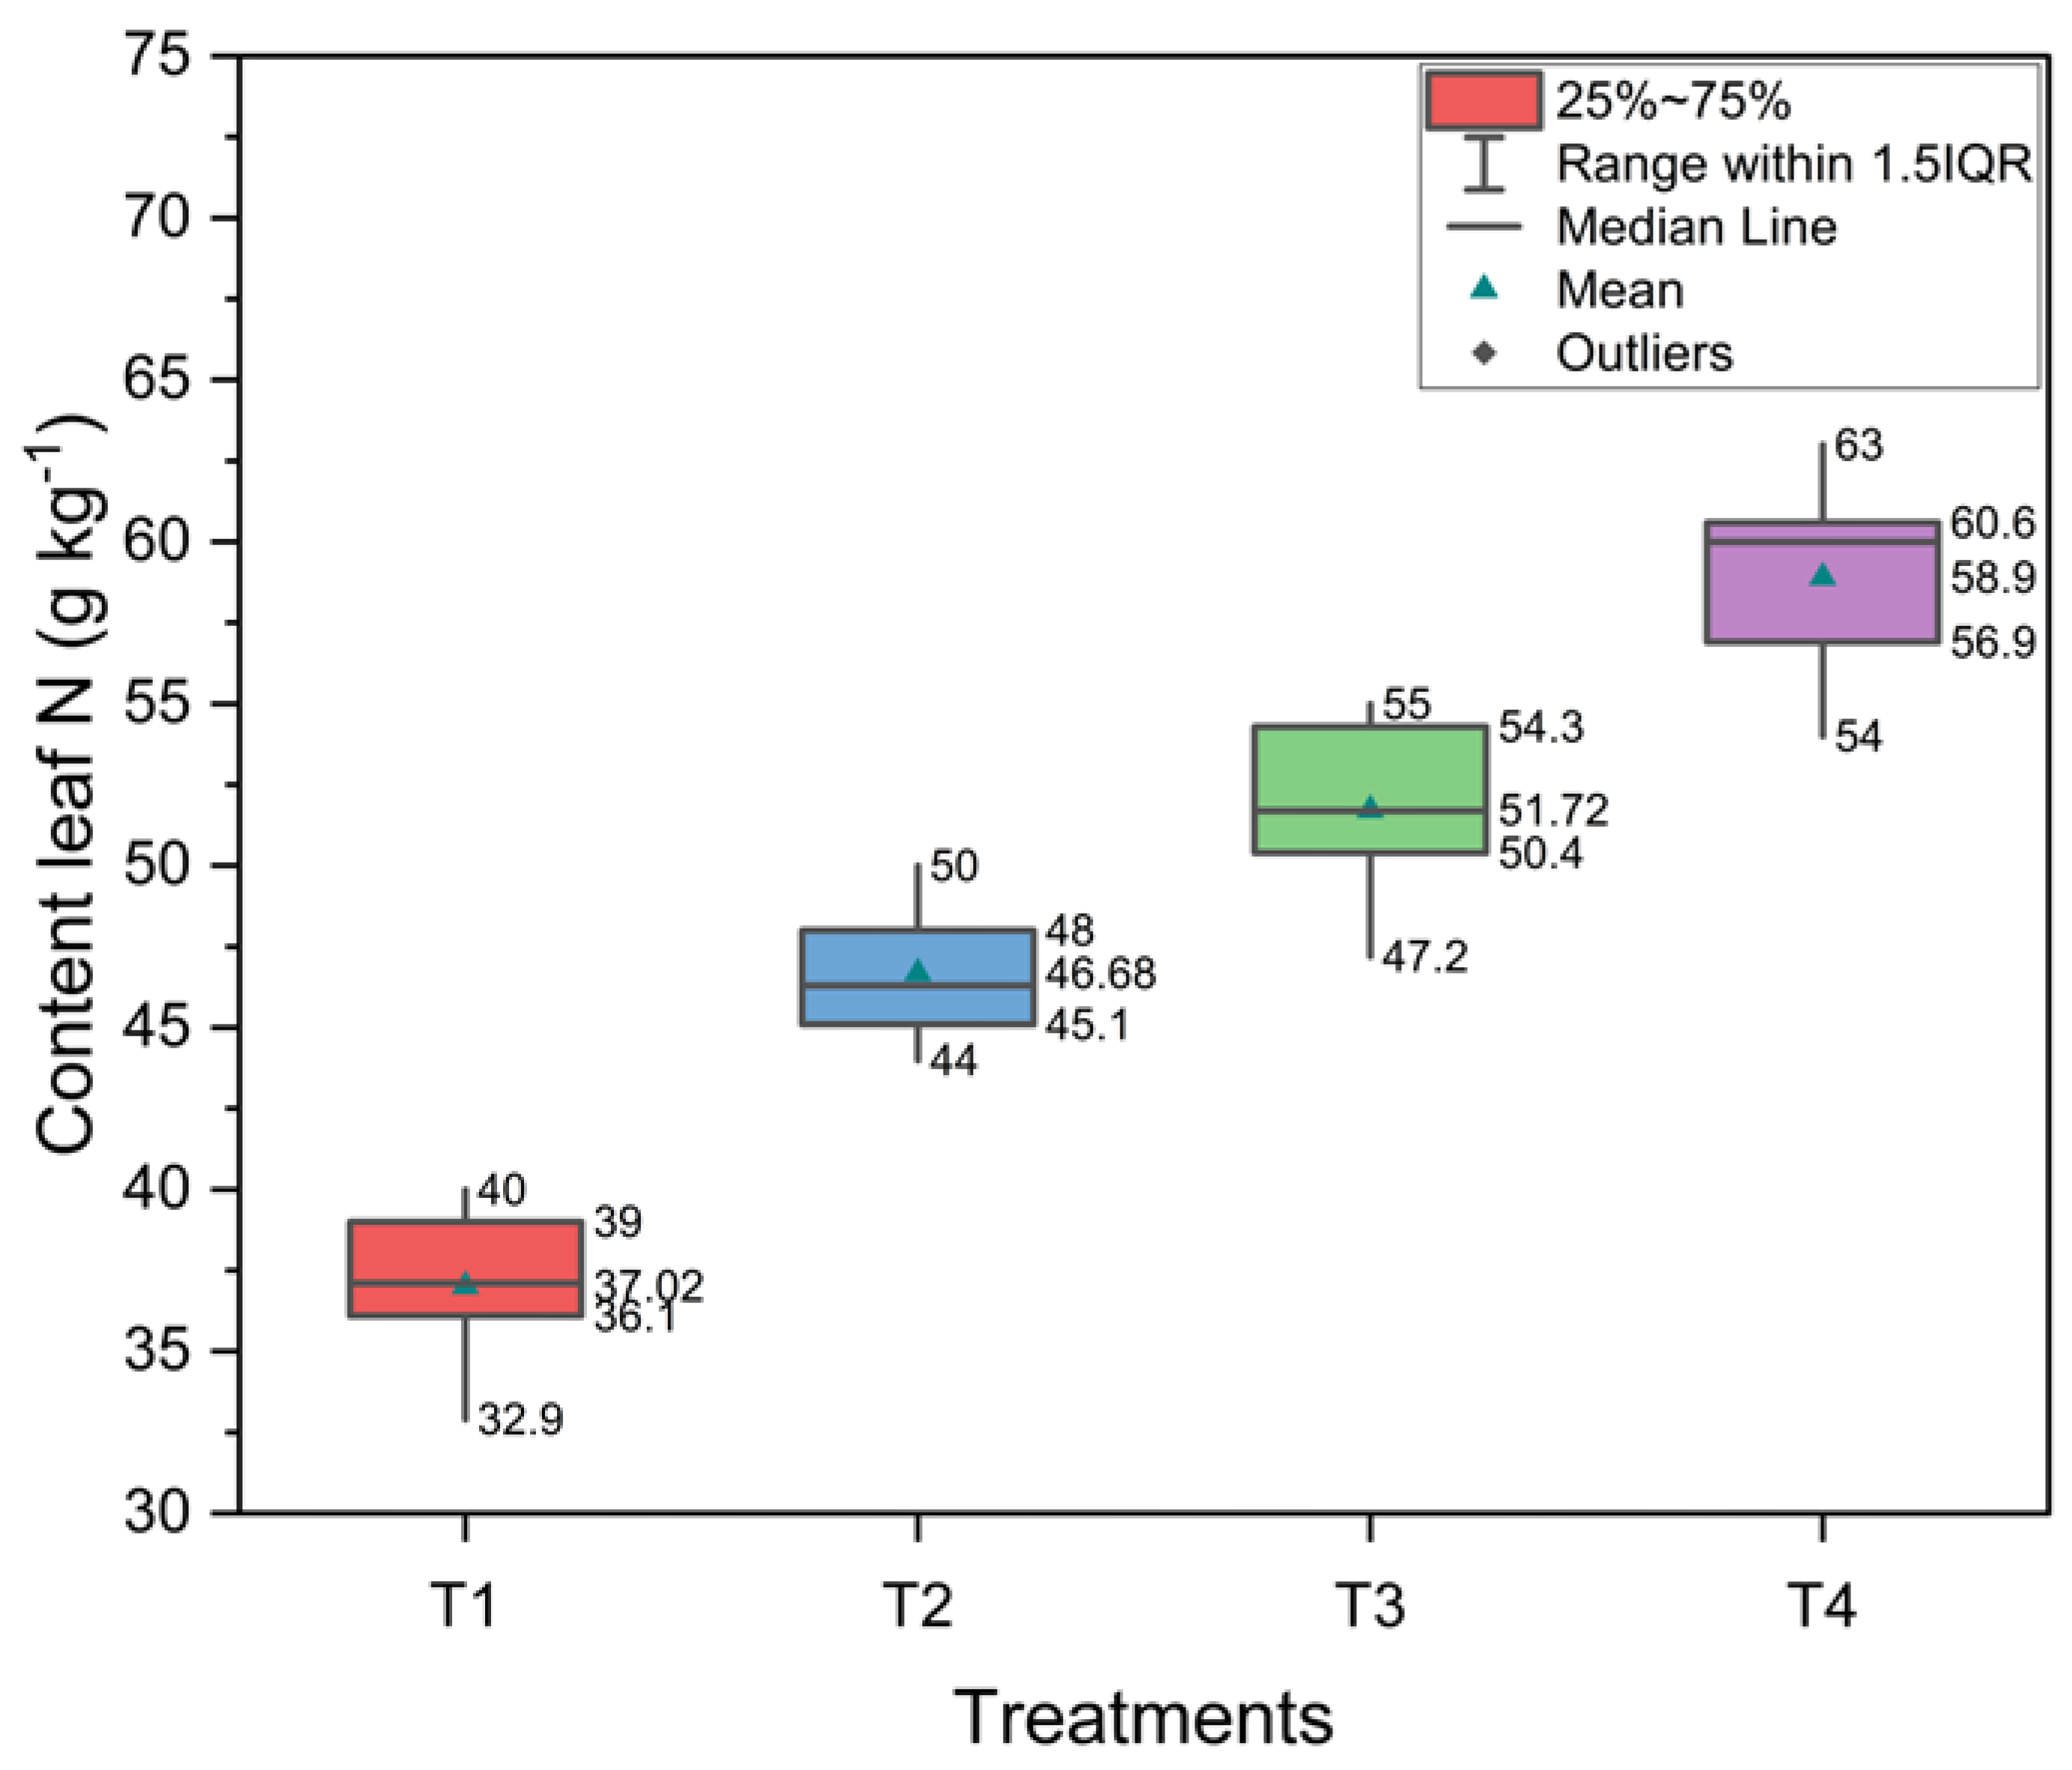
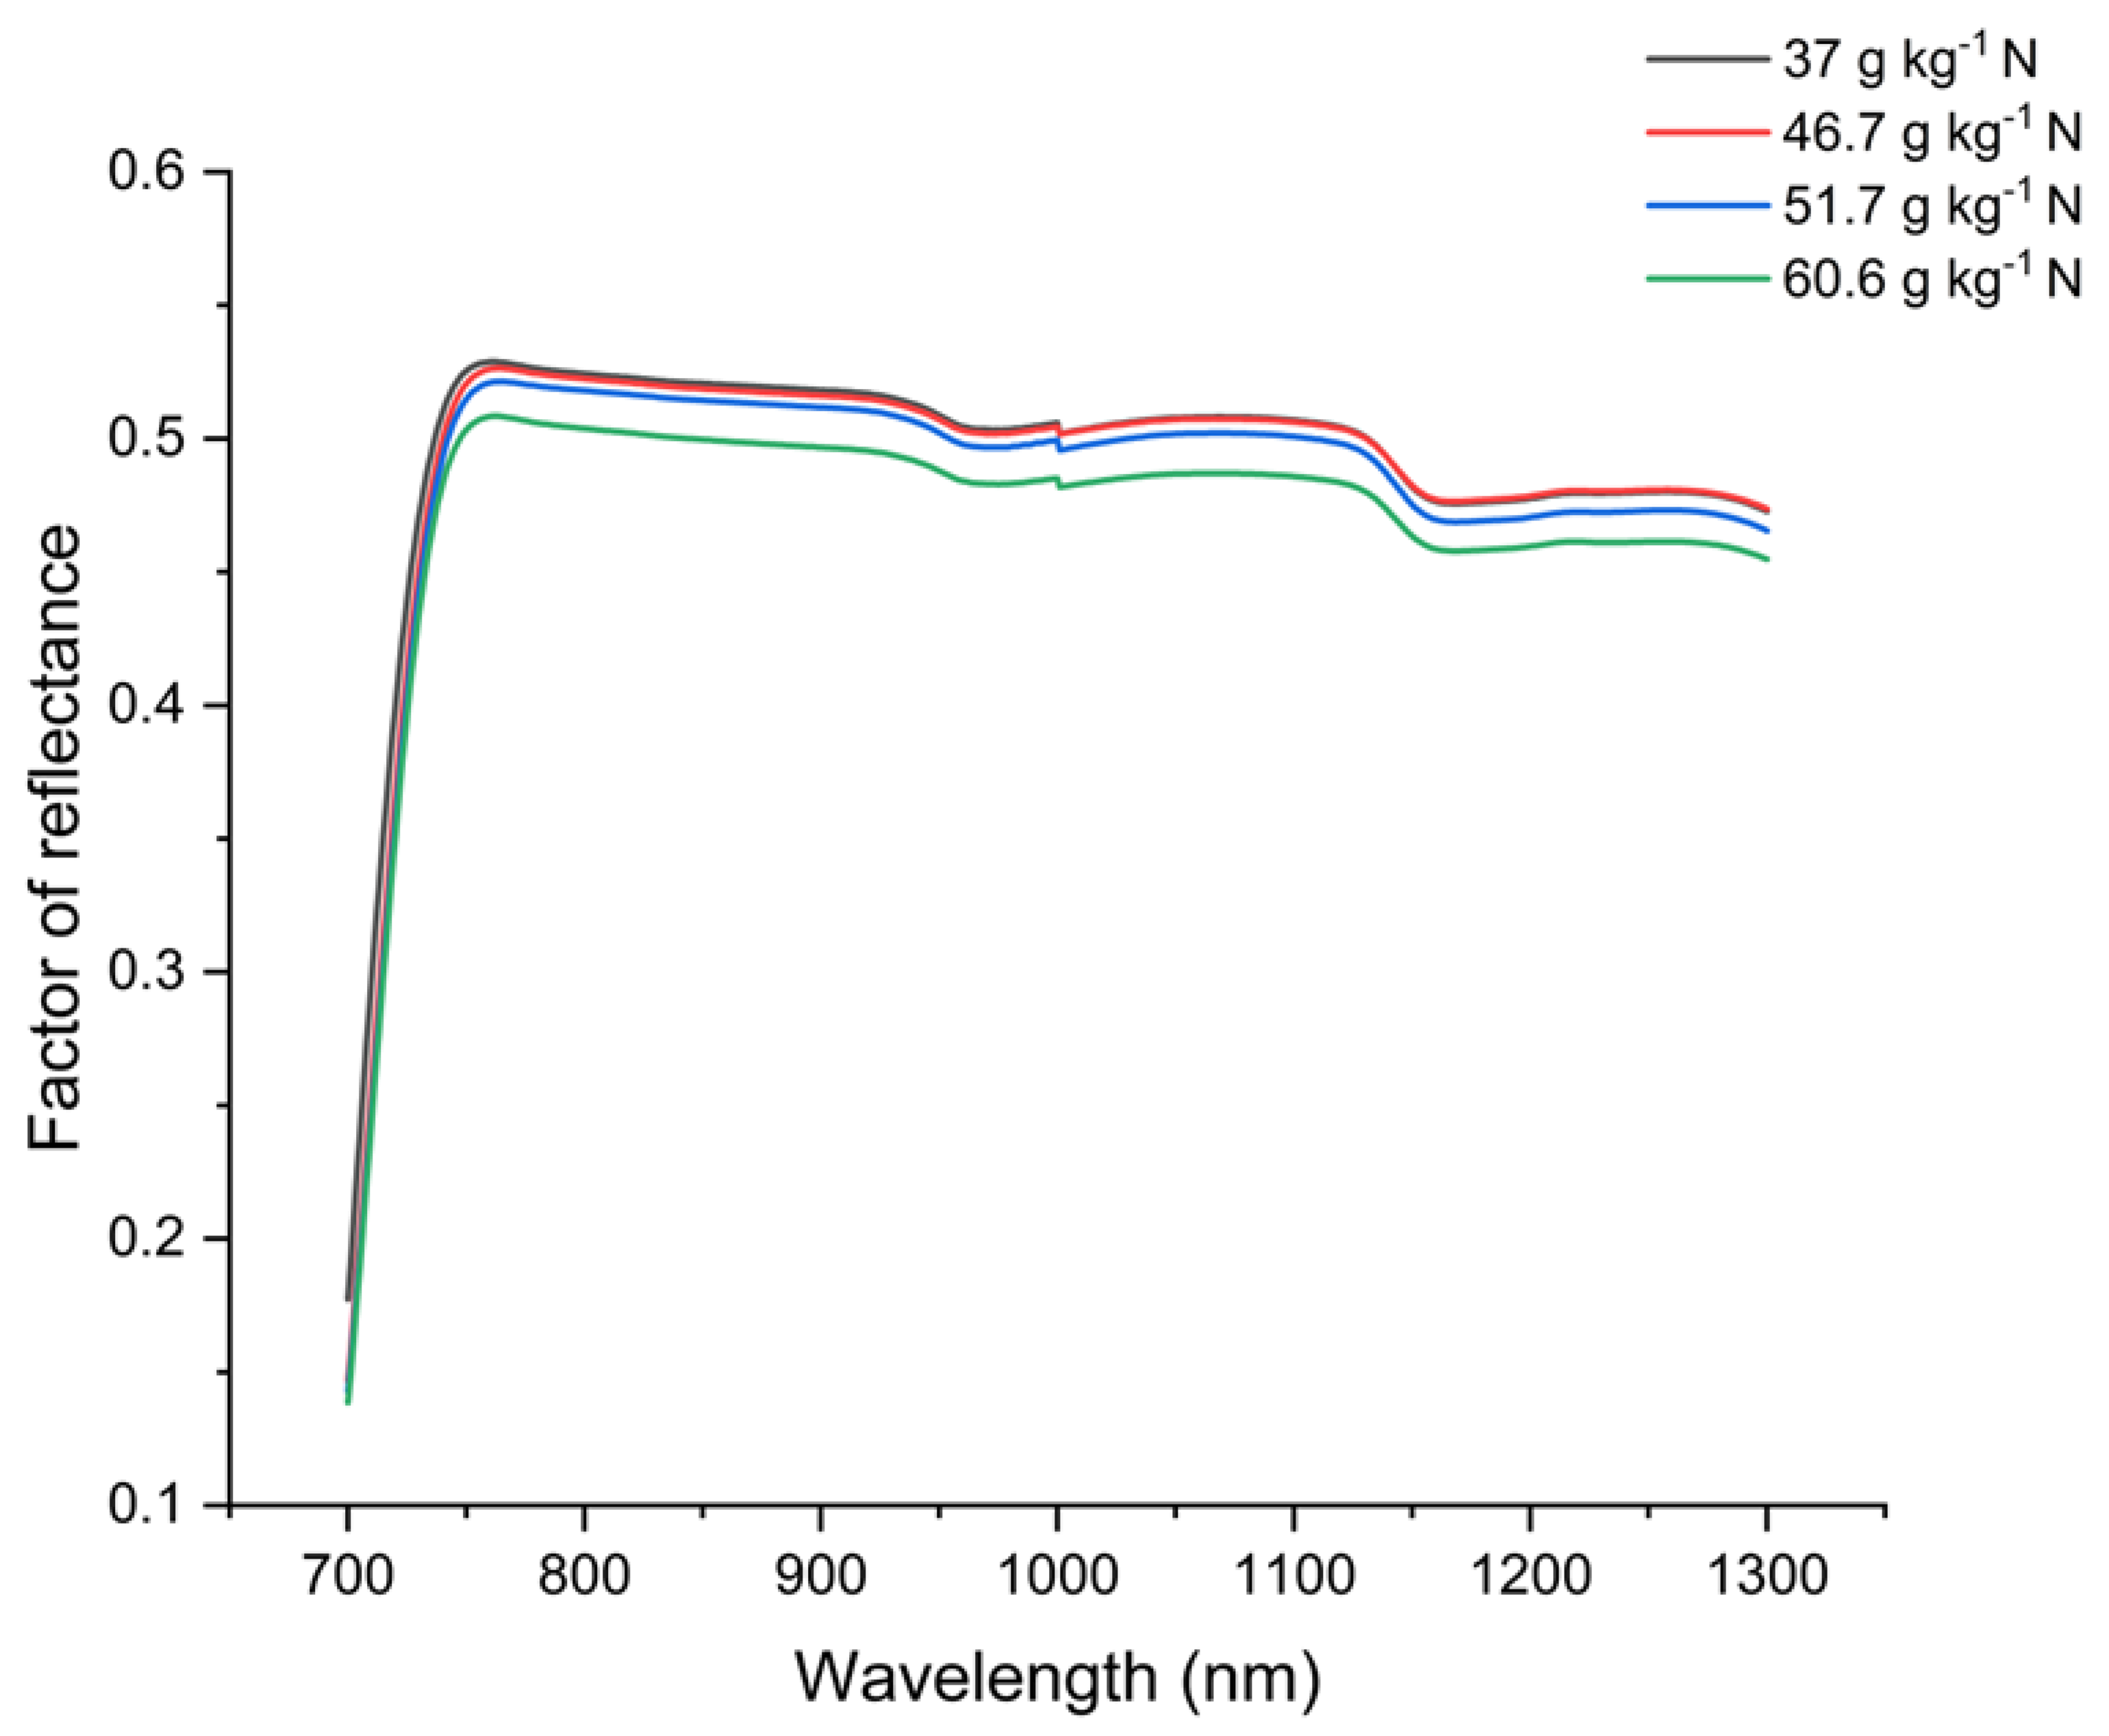
| Soil (Quartzarenic Neosol): 0-20 cm | |||||||||
| pH (CaCl2) | P (res) mg . dm-3 | S (PPM) | K (res) mmolc . dm-3 | Ca | Mg | Al | H + Al | M.O. | C.T. |
| 4,4 | 8 | 4 | 0,3 | 16 | 4 | 4,1 | 30 | 16 | 9,3 |
| Complementary Results | |||||||||
| SB | CTC | V | m | Relationships between bases (CTC) % | Relationships between bases | ||||
| mmolc . dm-3 | ------------ % ------------ | Ca/CT | Mg/CT | K/CTC | (H+Al)/CTC | Ca/Mg | Ca/K | ||
| 20 | 50 | 41 | 17 | 32 | 8 | 1 | 60 | 4 | 53,3 |
| Micronutrients | Textural Analysis | Mg/K | (Ca+Mg)/K | ||||||
| ------------------ mg . dm-3 (PPM) ------------------ | --------------- % --------------- | 13,3 | 66,7 | ||||||
| B | Cu | Fe | Mn | Zn | Sand total |
Clay | Silt | ||
| 0,12 | 1,6 | 51 | 4,6 | 2,9 | 90 | 8 | 2 | ||
| Tanned Cattle Manure | |||||||||
| pH | MS total | M.O | Gray | C total |
C org | N | P2O5 | K2O | |
| 6,6 | ----------------------------------%--------------------------------- | --------------------g/kg-------------------- | |||||||
| 63,5 | 17,6 | 80 | 10,2 | 6,8 | 10,2 | 5,9 | 3,8 | ||
| S | CaO | MgO | B | Cu | Zn | Mn | Relation C/N | ||
| ------------------g/kg---------------- | ------------------------------- mg/kg ------------------------- | 10:1 | |||||||
| 0,4 | 7,7 | 9,6 | 3,1 | 230 | 217,2 | 1100 | |||
| Crushed Sugarcane Straw | |||||||||
| pH | MS total | M.O | Gray | C total |
C org | N | P2O5 | K2O | |
| 4,9 | ---------------------------------- % ---------------------------------- | --------------------g/kg-------------------- | |||||||
| 7,6 | 50,6 | 28,4 | 29,4 | 12,8 | 9,1 | 4,8 | 2 | ||
| S | CaO | MgO | B | Cu | Zn | Mn | Relation C/N | ||
| -------------- g/kg --------------- | ------------------------------ mg/kg ----------------------------- | 32:1 | |||||||
| 0,3 | 5,9 | 6,2 | 2,1 | 77,8 | 121 | 454,5 | |||
Disclaimer/Publisher’s Note: The statements, opinions and data contained in all publications are solely those of the individual author(s) and contributor(s) and not of MDPI and/or the editor(s). MDPI and/or the editor(s) disclaim responsibility for any injury to people or property resulting from any ideas, methods, instructions or products referred to in the content. |
© 2024 by the authors. Licensee MDPI, Basel, Switzerland. This article is an open access article distributed under the terms and conditions of the Creative Commons Attribution (CC BY) license (http://creativecommons.org/licenses/by/4.0/).


