1. Introduction
According to the World Health Organization (WHO), glioblastoma (GBM) is a particularly aggressive type of cancer that accounts for 48.6% of malignant tumors in the brain and 14.5% of all central nervous system (CNS) tumors [
1]. The cellular source of this glioma, which is classified as Grade 4, is still a topic of discussion, emphasizing its significant variability and cellular hierarchies that mainly arise from stem or progenitor cells and that confer great intra- and intertumoral heterogeneity [
2].
The current treatment for GBM often involves a step-by-step process starting with surgical removal of the tumor, followed by additional treatment with radiation and chemotherapy with temozolomide (TMZ). Nonetheless, the molecular diversity inherent in GBM and the formidable barrier presented by the blood-brain barrier (BBB) pose significant challenges in achieving complete eradication of tumor cells. Adverse prognostic outcomes in GBM patients often arise from the extensive intertumoral and intratumoral heterogeneity, as well as the occurrence of postoperative relapses and development of treatment resistance, phenomena observed in approximately half of the patients undergoing TMZ therapy [
3]. Hence, there is a critical imperative to explore alternative therapeutic avenues, as conventional treatments seldom result in a cure.
Oxidative stress plays a crucial role in GBM cells, influencing both tumor progression and therapeutic response [
4]. GBM cells typically exhibit elevated levels of reactive oxygen species (ROS) due to their high metabolic activity and inherent genetic instability [
5,
6]. Oxidative stress relies in large part on a mismatch between the cellular antioxidant defense system and excess formation of ROS, including free radicals, which are molecules with unpaired electrons at the outer orbitals. This increased oxidative stress contributes to the aggressive nature of the tumor by promoting DNA damage, mutagenesis, and cellular proliferation. Additionally, the dysregulation of antioxidant defenses in GBM cells creates a vulnerability that can be therapeutically exploited [
5,
7]. While initially appearing counterintuitive due to the association of ROS with cellular damage and malignant transformation, the selective induction of oxidative stress within cancer cells holds therapeutic promise, particularly in the context of aggressive malignancies such as GBM [
4,
5]. By further increasing ROS levels through pro-oxidant therapies, it is possible to push the oxidative stress beyond the threshold that cancer cells can tolerate, leading to their selective eradication while sparing normal cells [
8]. Understanding the dynamics of oxidative stress in GBM cells is therefore essential for developing effective treatments and improving patient outcomes.
Recent trends in preclinical [
3,
9] and clinical studies [
10] of GBM have focused on the utilization of doxorubicin (DOX), one of the earliest chemotherapy agents (CTA) in cancer treatment. Doxorubicin is considered a pro-oxidant therapy due to its ability to generate ROS within cancer cells. This CTA induces oxidative stress through various mechanisms. It can undergo redox cycling in the presence of cellular reductases, resulting in the production of superoxide anions and other ROS. Additionally, it can also enhance the fenton reaction by chelating iron and interfere with the electron transport chain in the mitochondria, leading to increased ROS production [
11,
12]. Conversely, Photodynamic Therapy (PDT) has emerged as a promising alternative therapeutic modality for GBM, owing to its ability to selectively target cancerous cells while minimizing damage to surrounding healthy tissue by generating oxidative stress [
13]. Ongoing clinical trials aim to further elucidate the efficacy of PDT in GBM treatment [
14,
15]. An advantage of utilizing photosensitizers (PS) in PDT for GBM is their capacity to function as a photodiagnostic agents for evaluating the existence of any residual cells after surgery [
16]. Moreover, PDT exhibits the capability to synergize with other treatment modalities within a combination framework [
17]. These combination therapies often entail the administration of multiple anticancer agents in reduced dosages compared to individual administration, thereby enhancing efficacy, reducing toxicity, and mitigating the development of drug resistance by targeting diverse cancer pathways.
Key mutations found in GBM patients, including the amplification of the epidermal growth factor receptor (EGFR), as well as mutations in the genes encoding phosphatase and tensin homolog (PTEN) and tumor protein 53 (TP53), have been linked to the response to treatments and the accumulation of ROS, which play a significant role in gain-of-function (GOF) activities in cancer cells [
18,
19]. Accumulating evidence underscores the pivotal role of these GOF activities in promoting tumor progression and conferring resistance to various anticancer therapies, thereby underscoring the imperative to comprehend their underlying mechanisms in the context of therapeutic interventions [
20]. Moreover, there is growing evidence suggesting that cells harboring mutations such as in
TP53 may exhibit heightened susceptibility to pro-oxidant drugs compared to those with the wild-type form of this gene [
21,
22,
23,
24]. This heightened sensitivity facilitates the accumulation of deleterious ROS, ultimately leading to cellular damage and demise of cancer cells.
To evaluate the impact of pro-oxidant treatments, such as DOX chemotherapy and PDT with Me-ALA contemplating GBM heterogeneity, we propose examining their effects on various human GBM cell lines with different mutation conditions. Our study will encompass both individual treatment approaches and combined therapeutic regimens. Furthermore, an in silico study was conducted to investigate the correlation between specific gene mutations and the abnormal regulation of oxidative stress in patients with GBM. This investigation aimed to provide an explanation for the observed behavior in various cell line models.
3. Discussion
GBM cells utilize moderate amounts of ROS and reactive nitrogen species (RNS) to facilitate their proliferation and invasion [
39]. It should be mentioned that certain mutations can lead to increased production of ROS and for this reason, tumor cells consistently generate a greater amount of ROS compared to normal cells. However, the resulting oxidative stress can be counteracted by an increased overall antioxidant capacity, which is achieved through the buildup of antioxidant molecules as a result of an advanced adaptation [
40]. GBM cells rely heavily on these systems to neutralize the harmful effects of ROS generation. Therefore, overwhelming the cells with excessive ROS production could be a potential strategy to eliminate tumor cells [
8,
41].
The impact of prooxidant therapies on GBM cell lines as monotherapies was assessed through a series of assays, shedding light on their effectiveness and underlying mechanisms. These cell lines are frequently employed
in vitro models for GBM, exemplifying certain characteristics of the disease's intrinsic intratumoral and intertumoral heterogeneity [
42]. For instance, the T98G and LN229 cell lines harbor mutations in
TP53, a gene frequently dysregulated across various tumor types and prevalent in both primary and secondary GBMs (30% and 65% incidence, respectively). In contrast, the U87MG cell line expresses the wild-type functional form of
TP53. Cells with perturbations in the p53 pathway exhibit diverse capacities to mitigate oxidative stress and have been implicated in processes such as invasion, migration, proliferation, and evasion of apoptosis [
43,
44,
45]. Notably, the M237I p53 mutation, found in the T98G cell line, has been associated with the acquisition of resistance to standard CTA [
46,
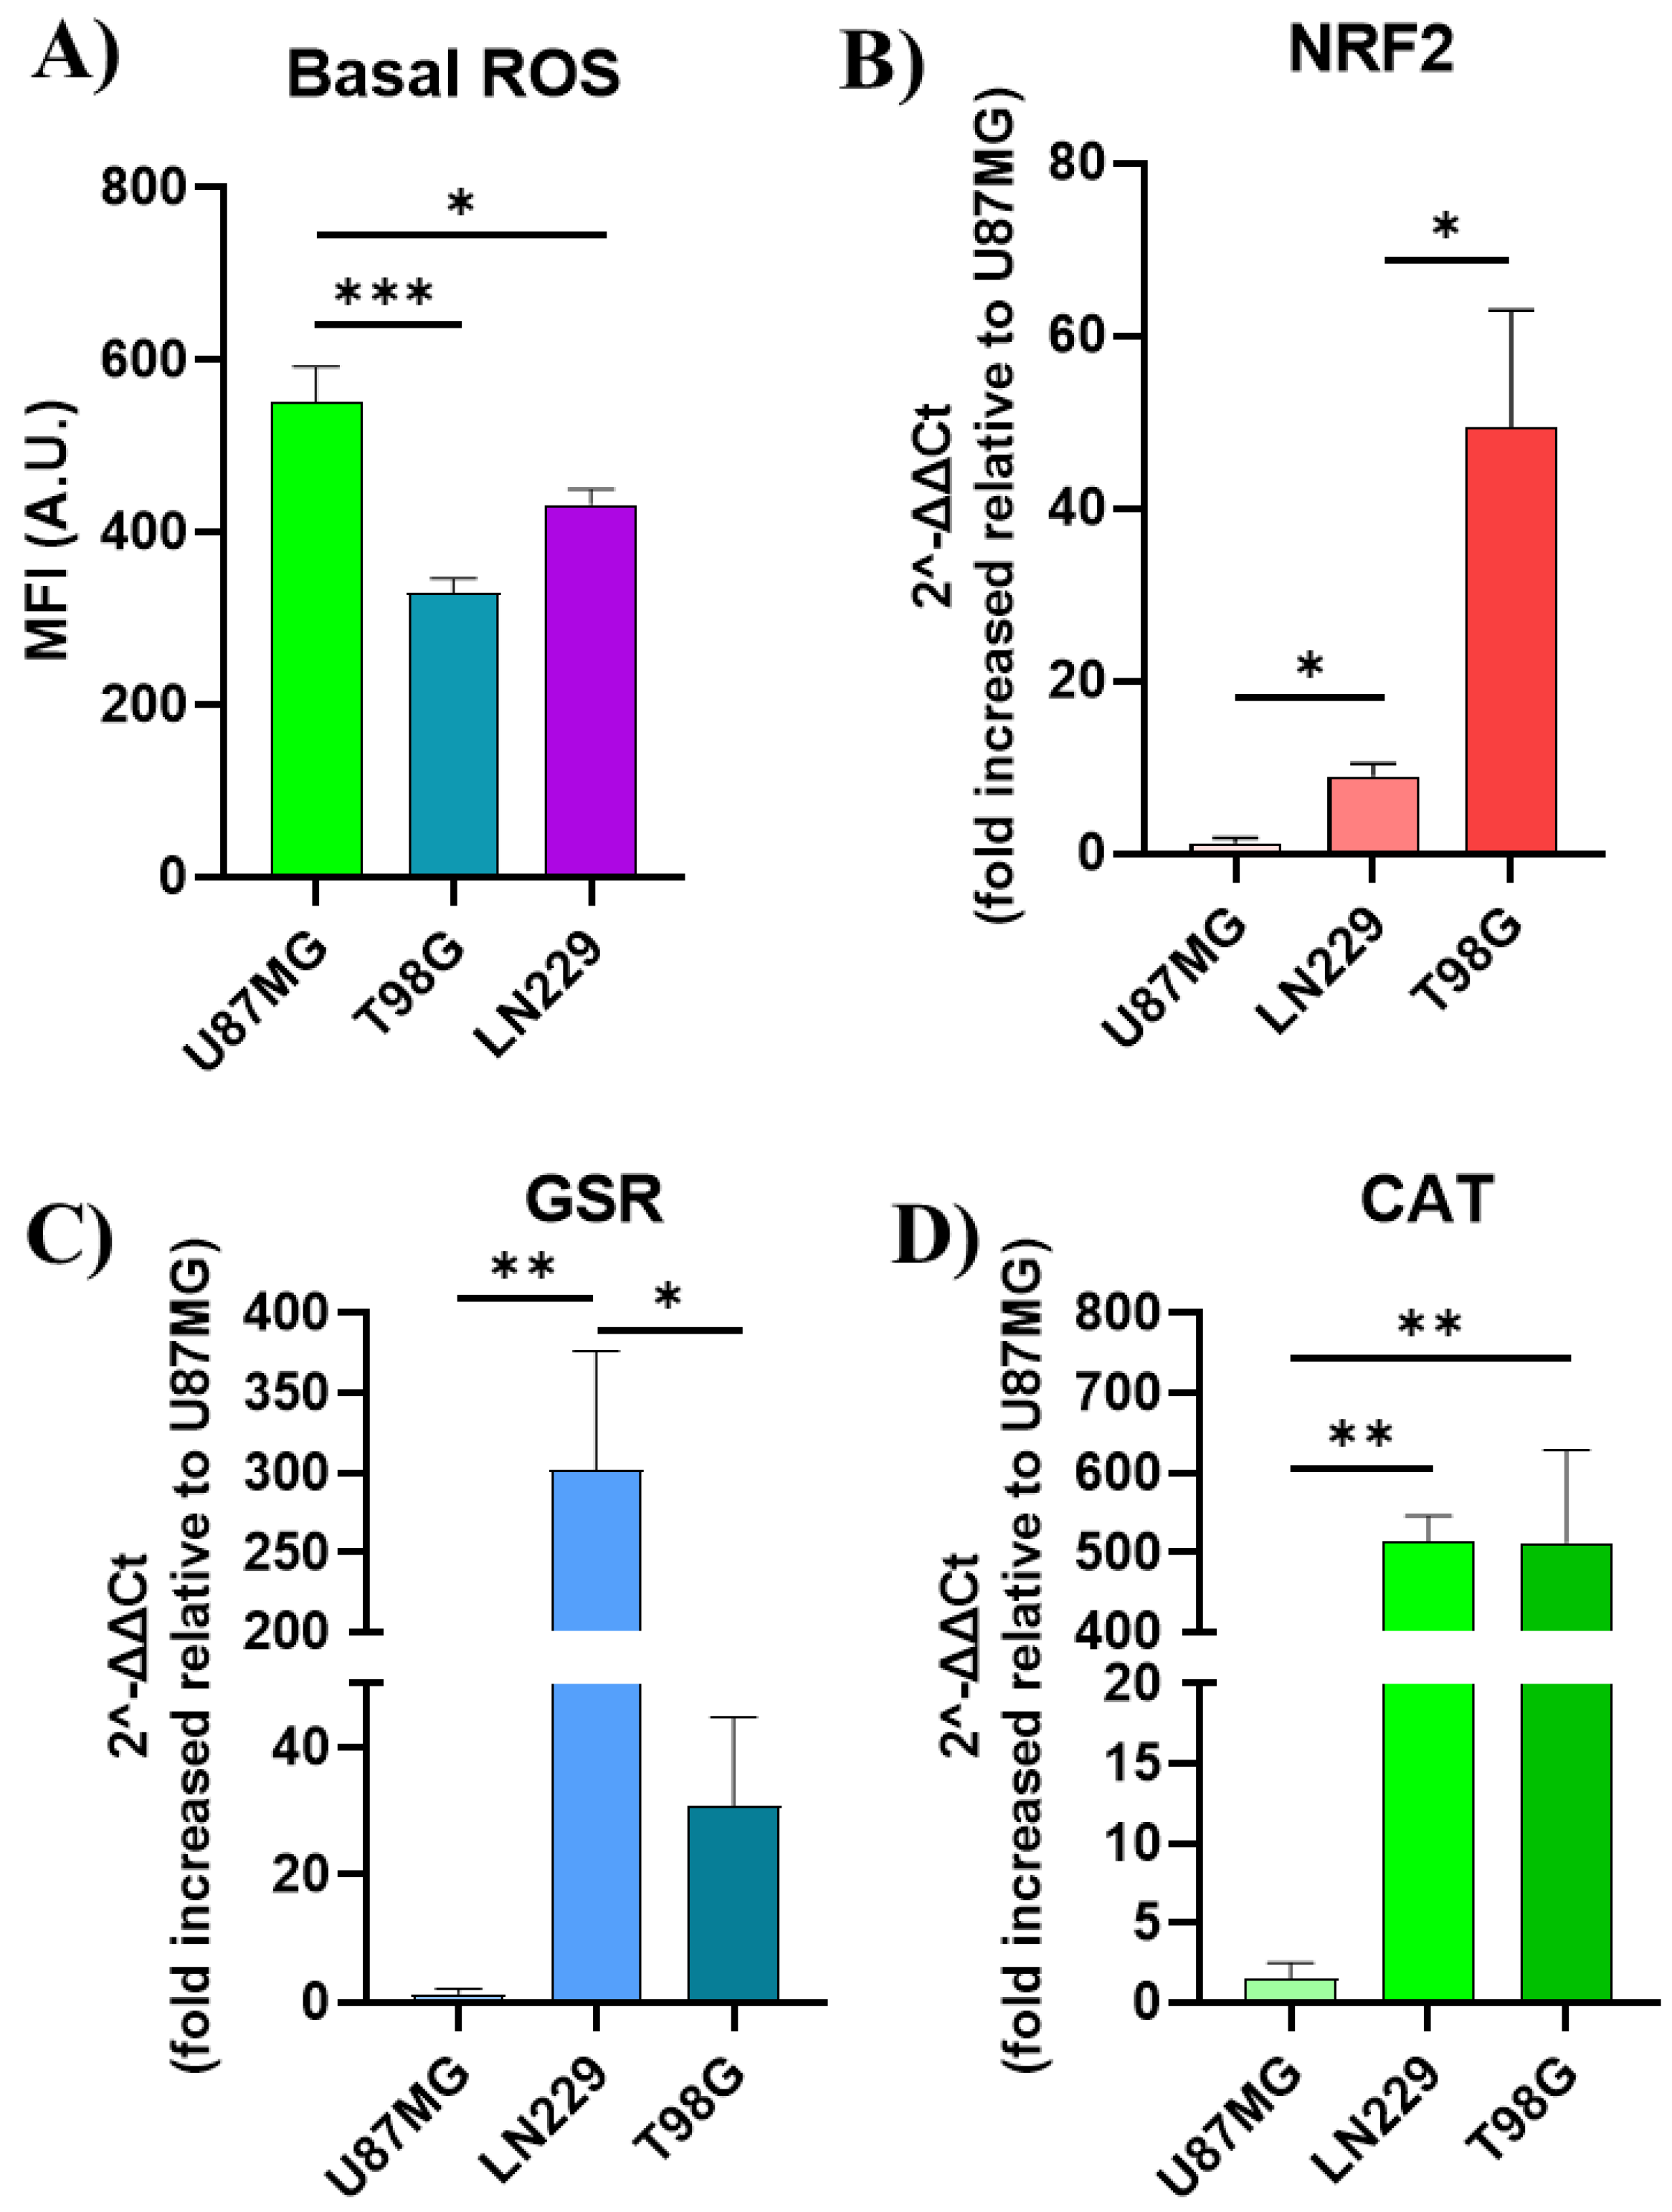
47]. It is evident that the basal oxidative stress varies among these cell lines, resulting in varied amounts of basal ROS (
Figure 7A). These varying ROS levels are associated with distinct antioxidant responses. In this study, the antioxidant response was assessed by examining the gene expression of specific molecules involved in the antioxidant response. For instance, NRF2 is the primary transcription factor that controls the antioxidative response [
36], and its expression levels differed among GBM cell lines (
Figure 7B). Currently, many treatment approaches are being examined to inhibit this biological pathway [
23,
48].
DOX monotherapy revealed varying sensitivity among GBM cell lines (LN229, U87MG, T98G), with U87MG cells displaying the highest susceptibility and LN229 cells exhibiting the greatest resistance to DOX. These observations were supported by discernible cellular morphological changes indicative of apoptotic cell death. Conversely, PDT with Me-ALA exhibited divergent efficacy among the cell lines, with LN229 cells demonstrating notable resistance and U87MG and T98G cells displaying heightened susceptibility. PDT presents itself as a compelling approach to provoke cell death in tumor cells by generating ROS and thereby causing a redox imbalance. In this study, we opted to utilize the prodrug Me-ALA, which is a methylated variant that possesses greater lipophilicity compared to ALA. ALA is one of the primary PS examined in PDT for GBM [
14,
49]. Previously, we have demonstrated greater resistance to PDT with PS based on conjugated polymer nanoparticles in T98G cells, which coincided with elevated expression levels of antioxidant enzymes and may be related to the mutational status of
TP53 [
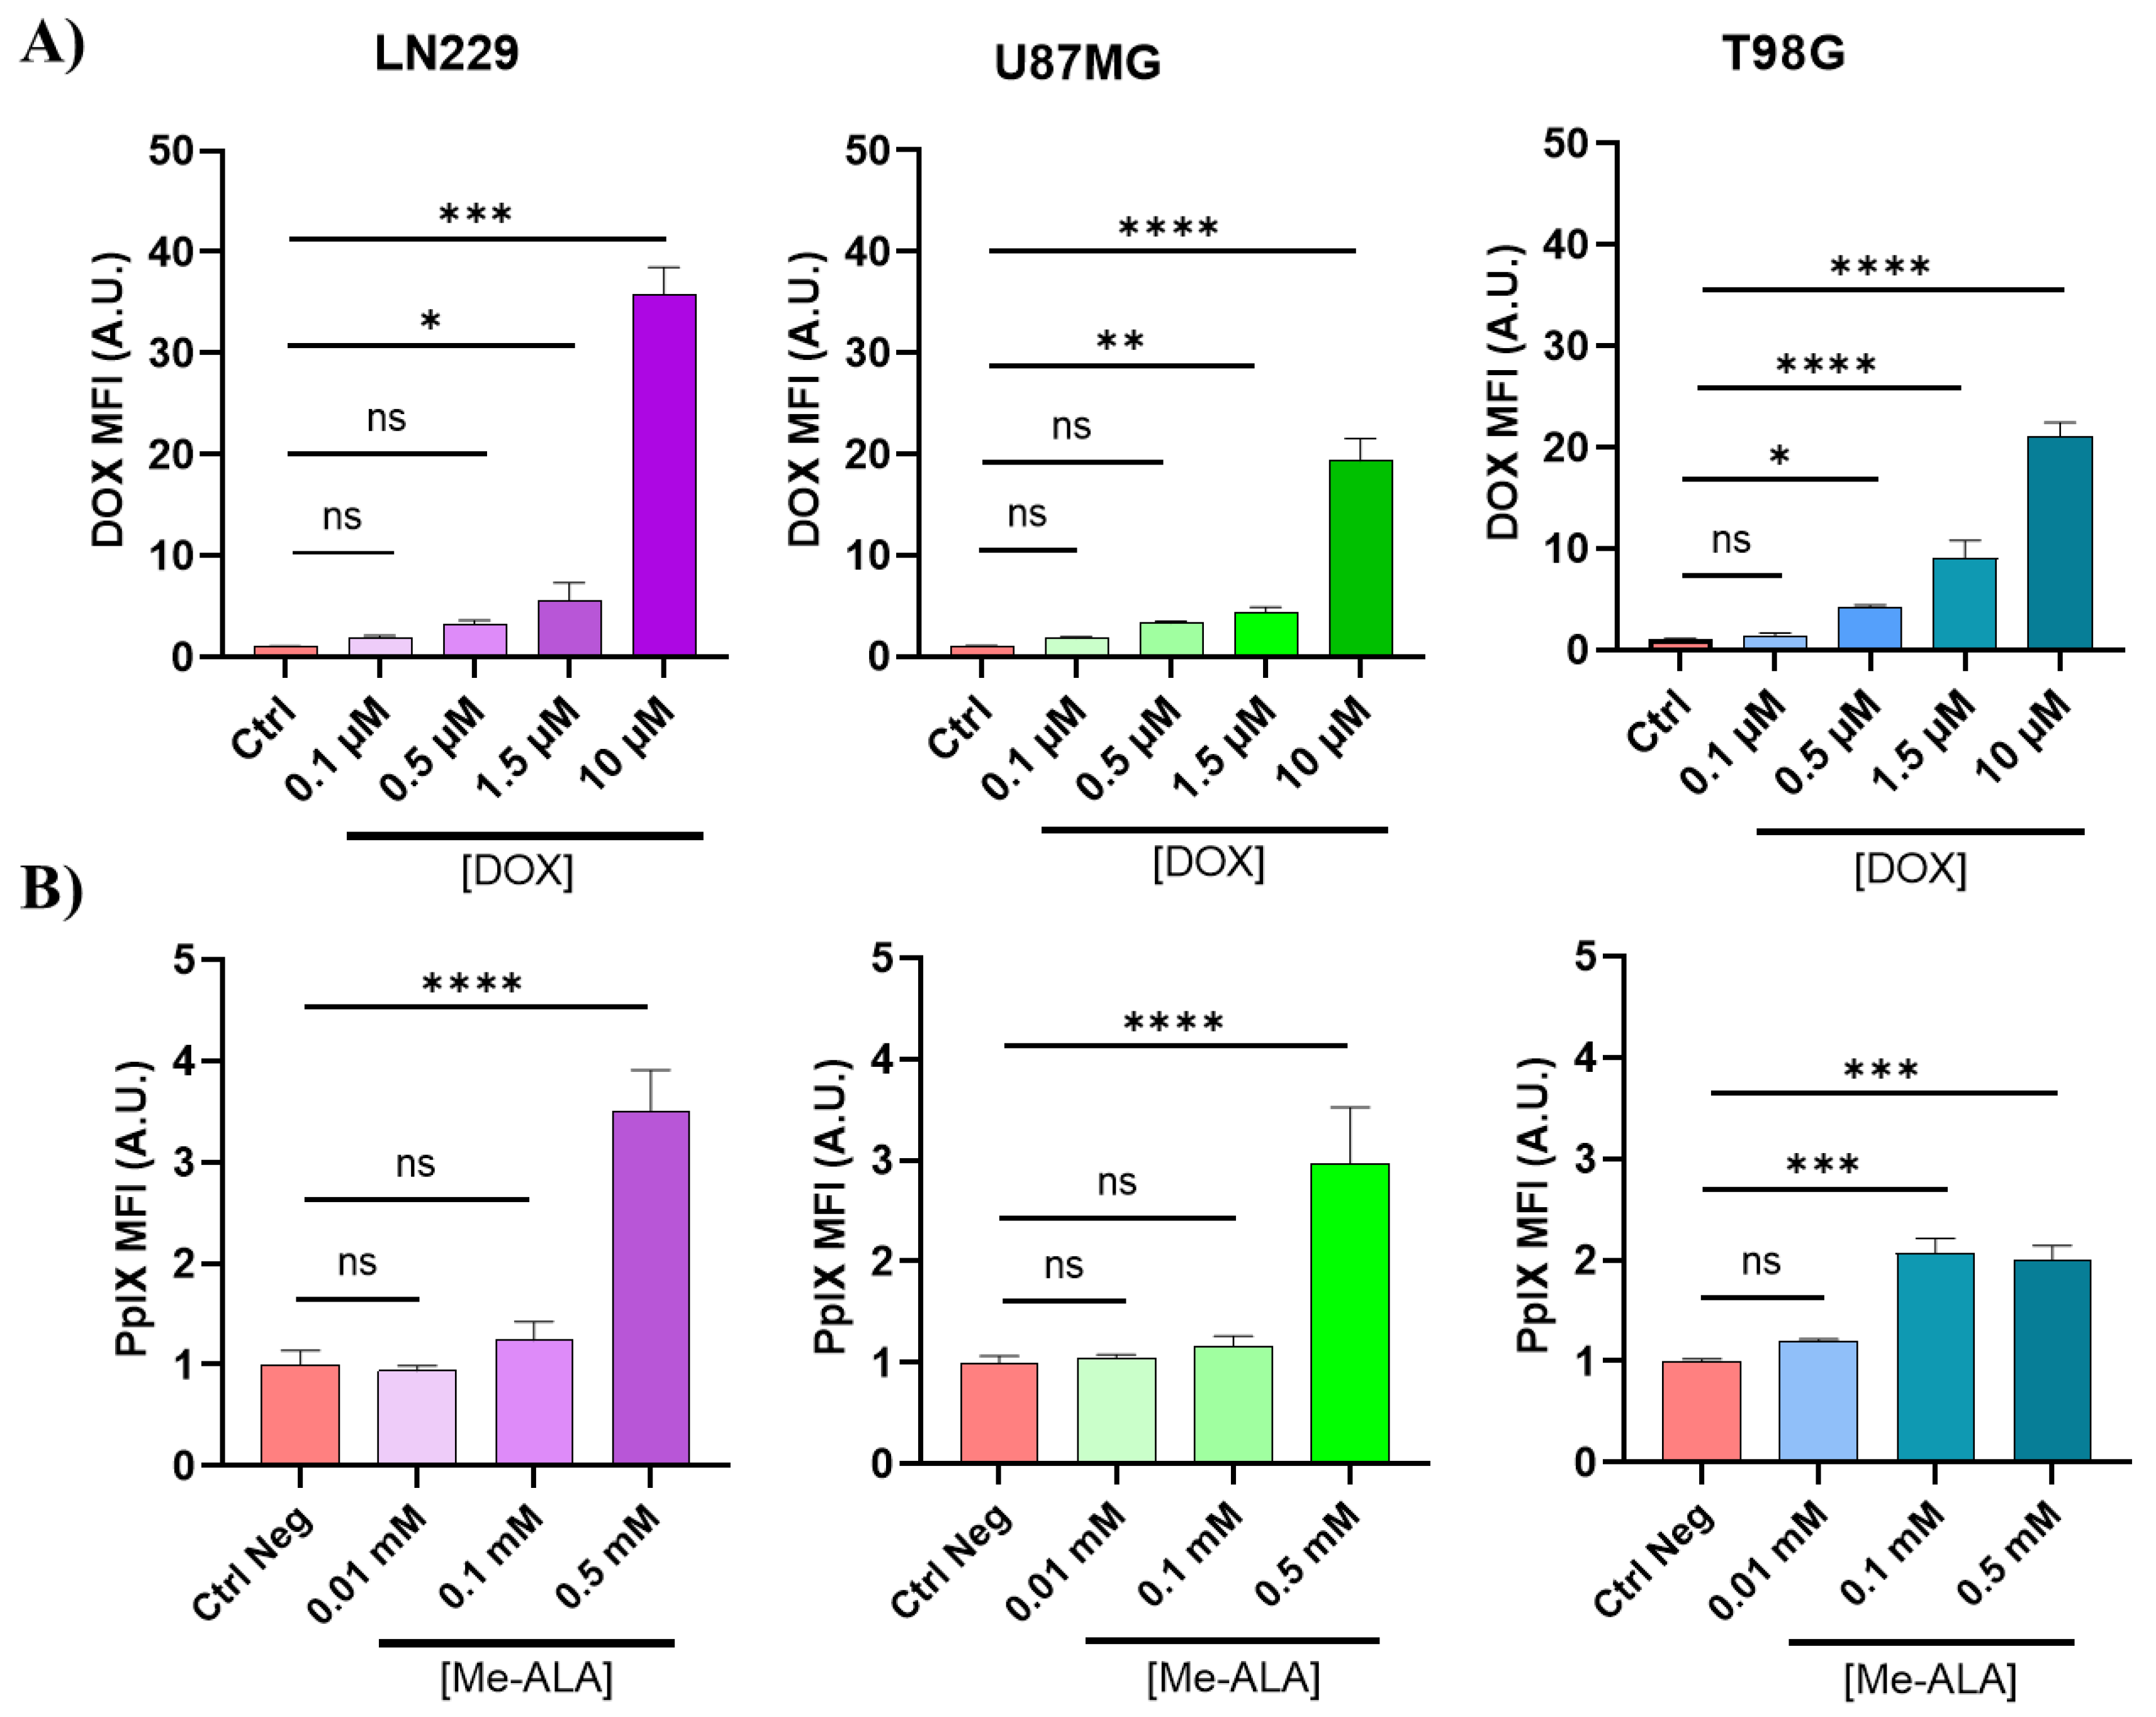
8]. In this study, PDT with Me-ALA induced effective cell death with an elevation of ROS surpassing the antioxidant levels possessed by the cell line, possibly due to the higher production of PpIX observed in these cells. Based on the outcomes of post-treatment cell viability assessments, including the generation of endogenous PS and cellular incorporation of DOX, it can be deduced that the LN229 cell line exhibits the greatest resistance to both treatments when used as monotherapies, despite having the highest level of cellular uptake.
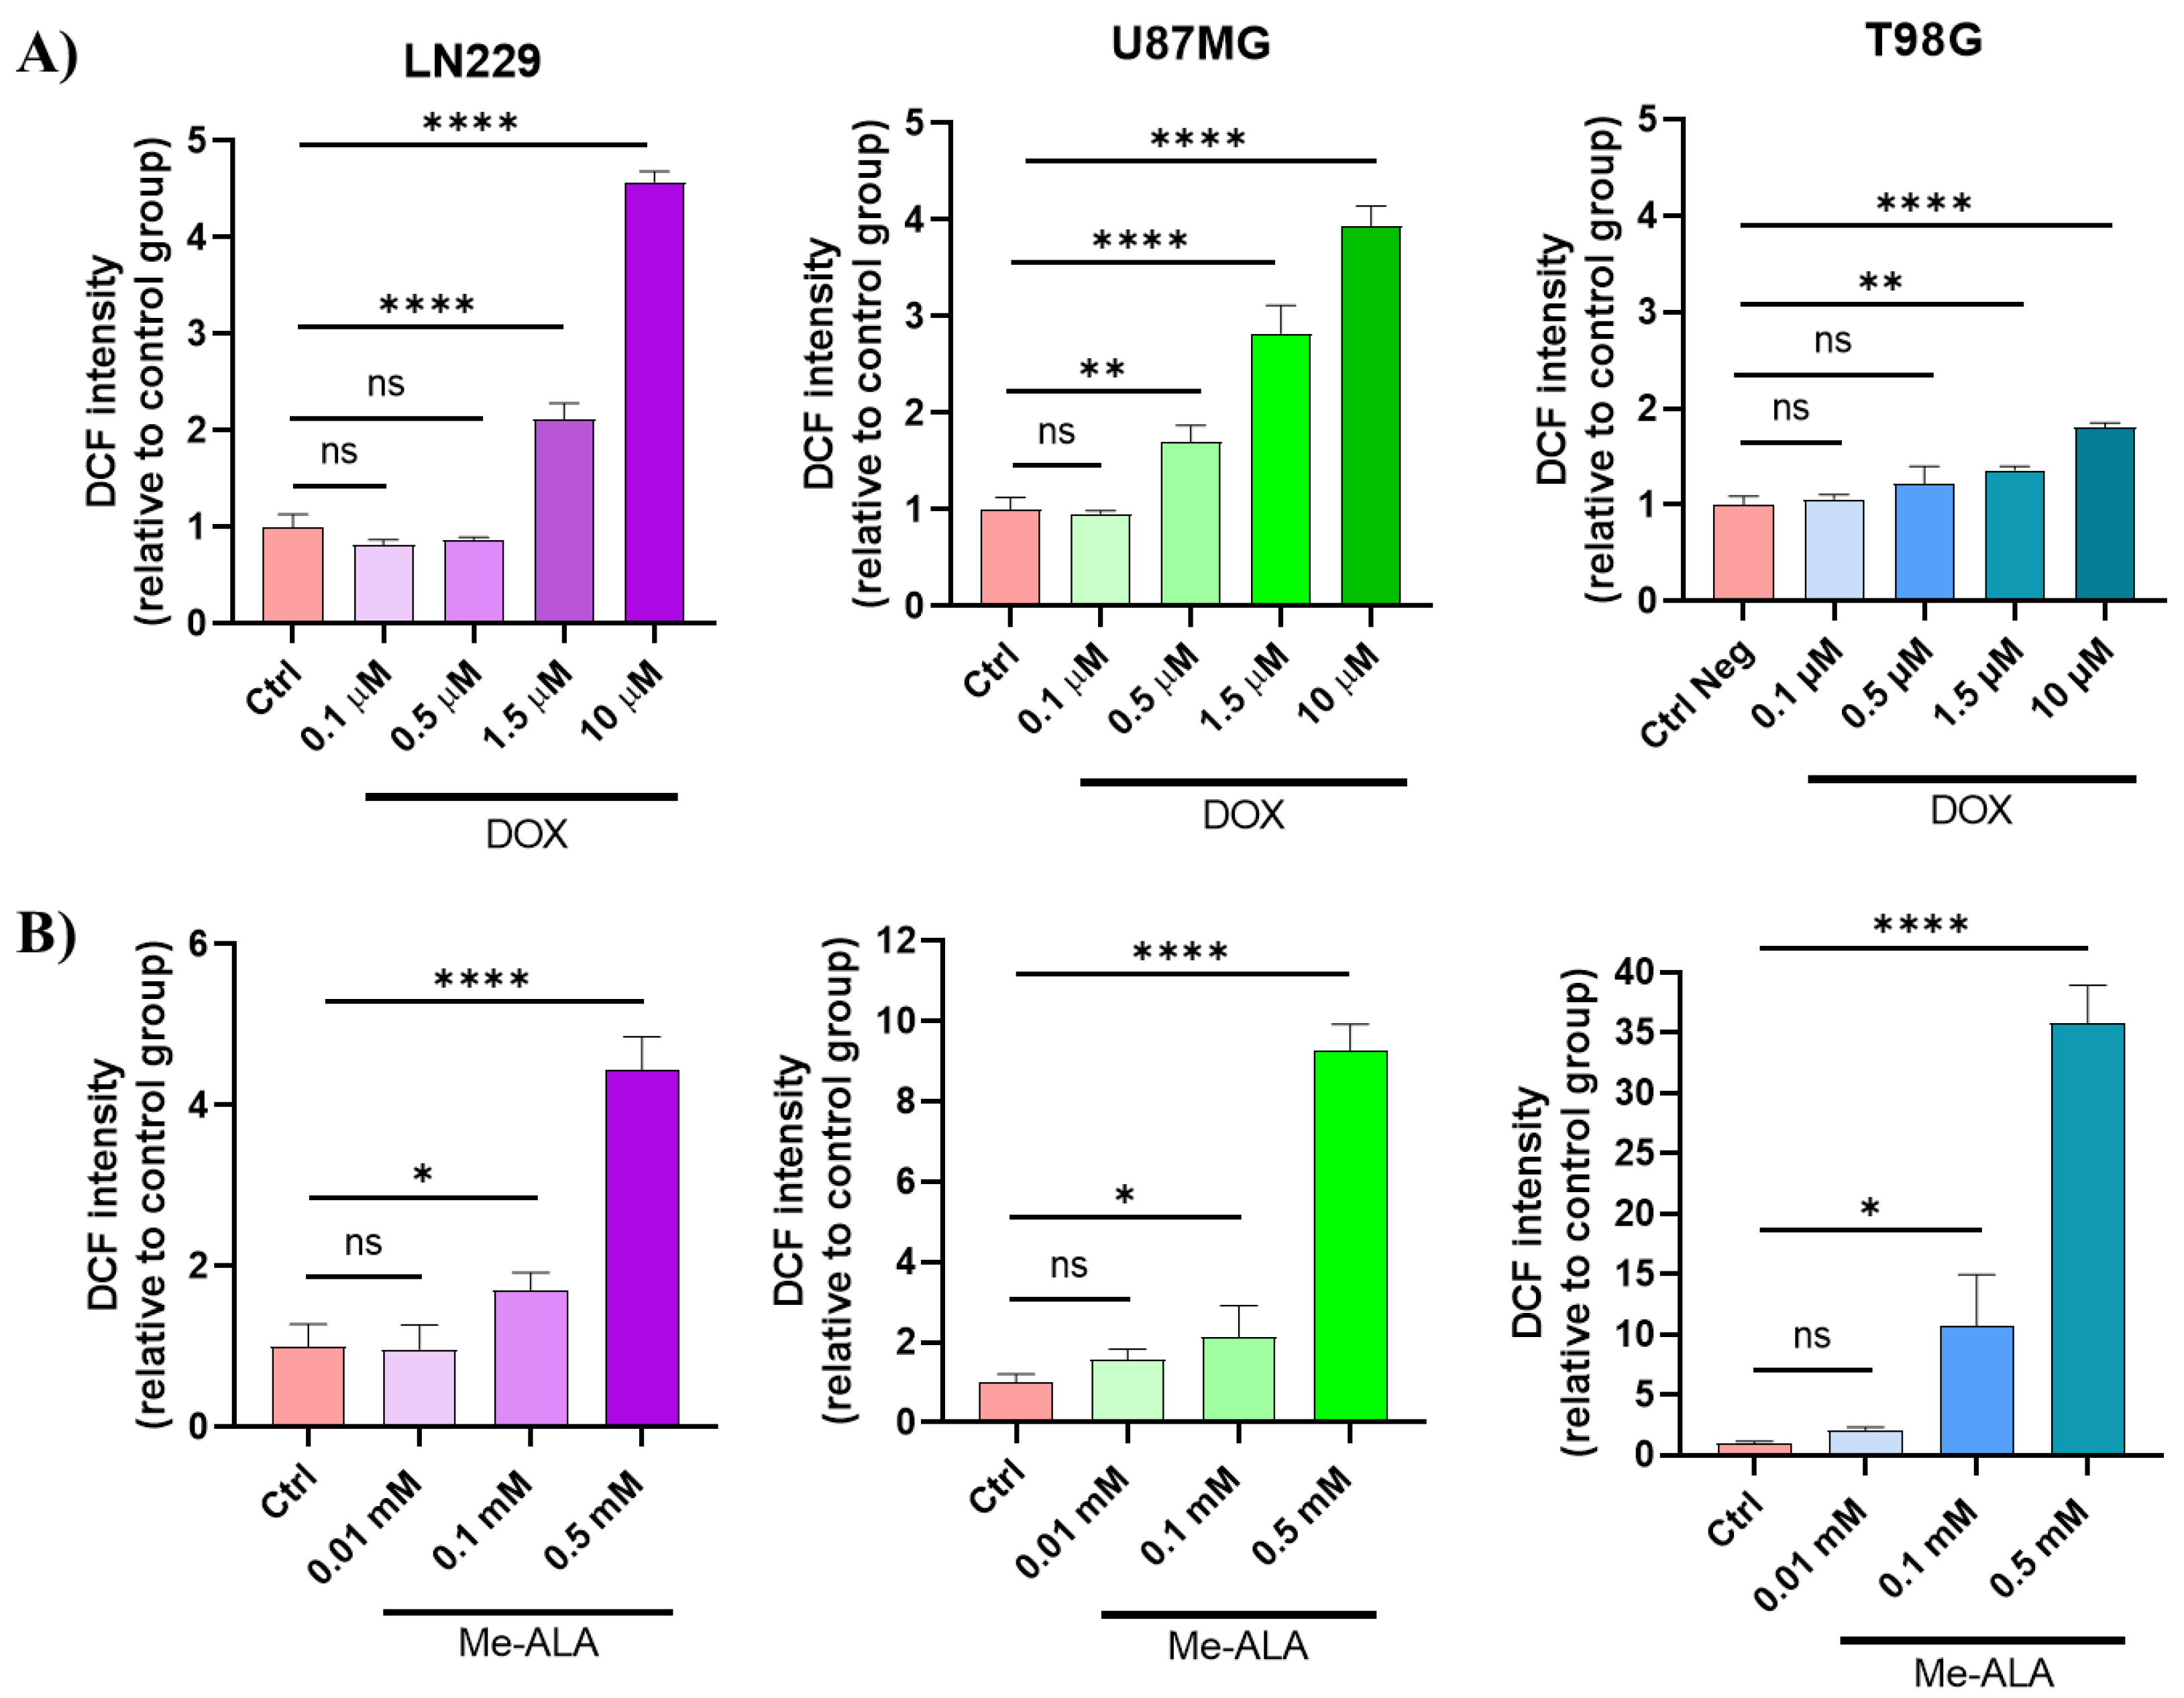
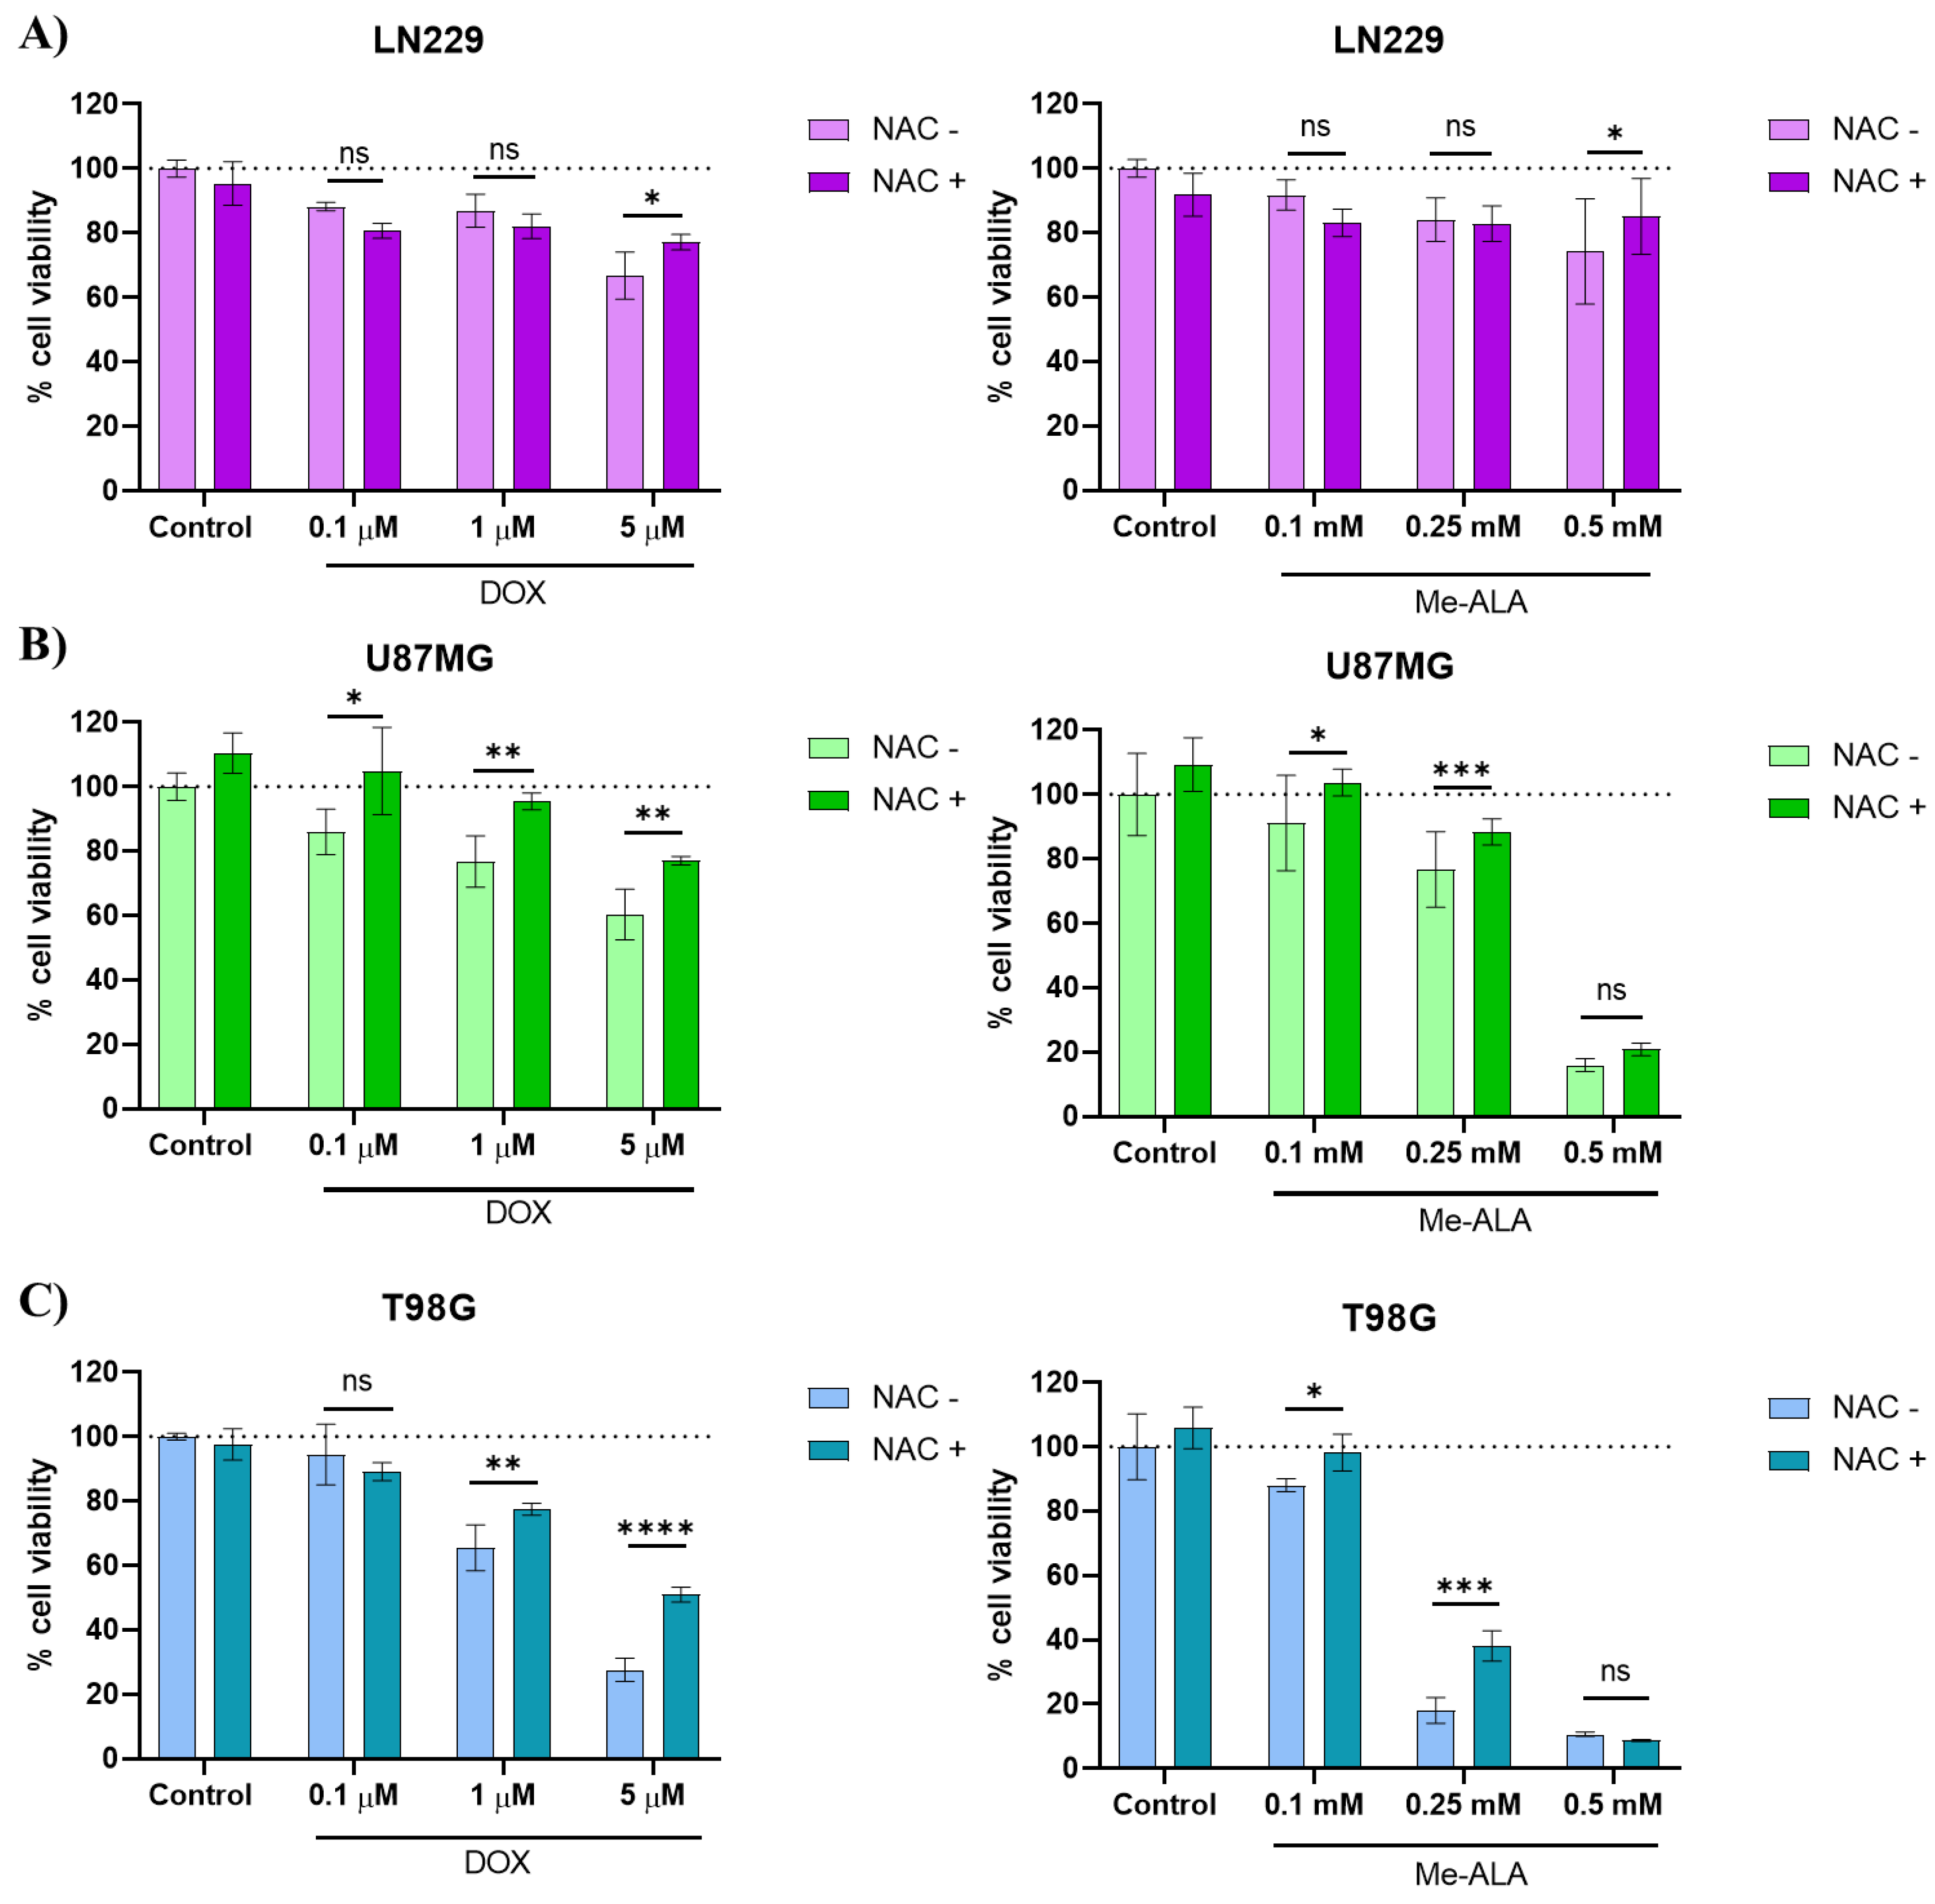
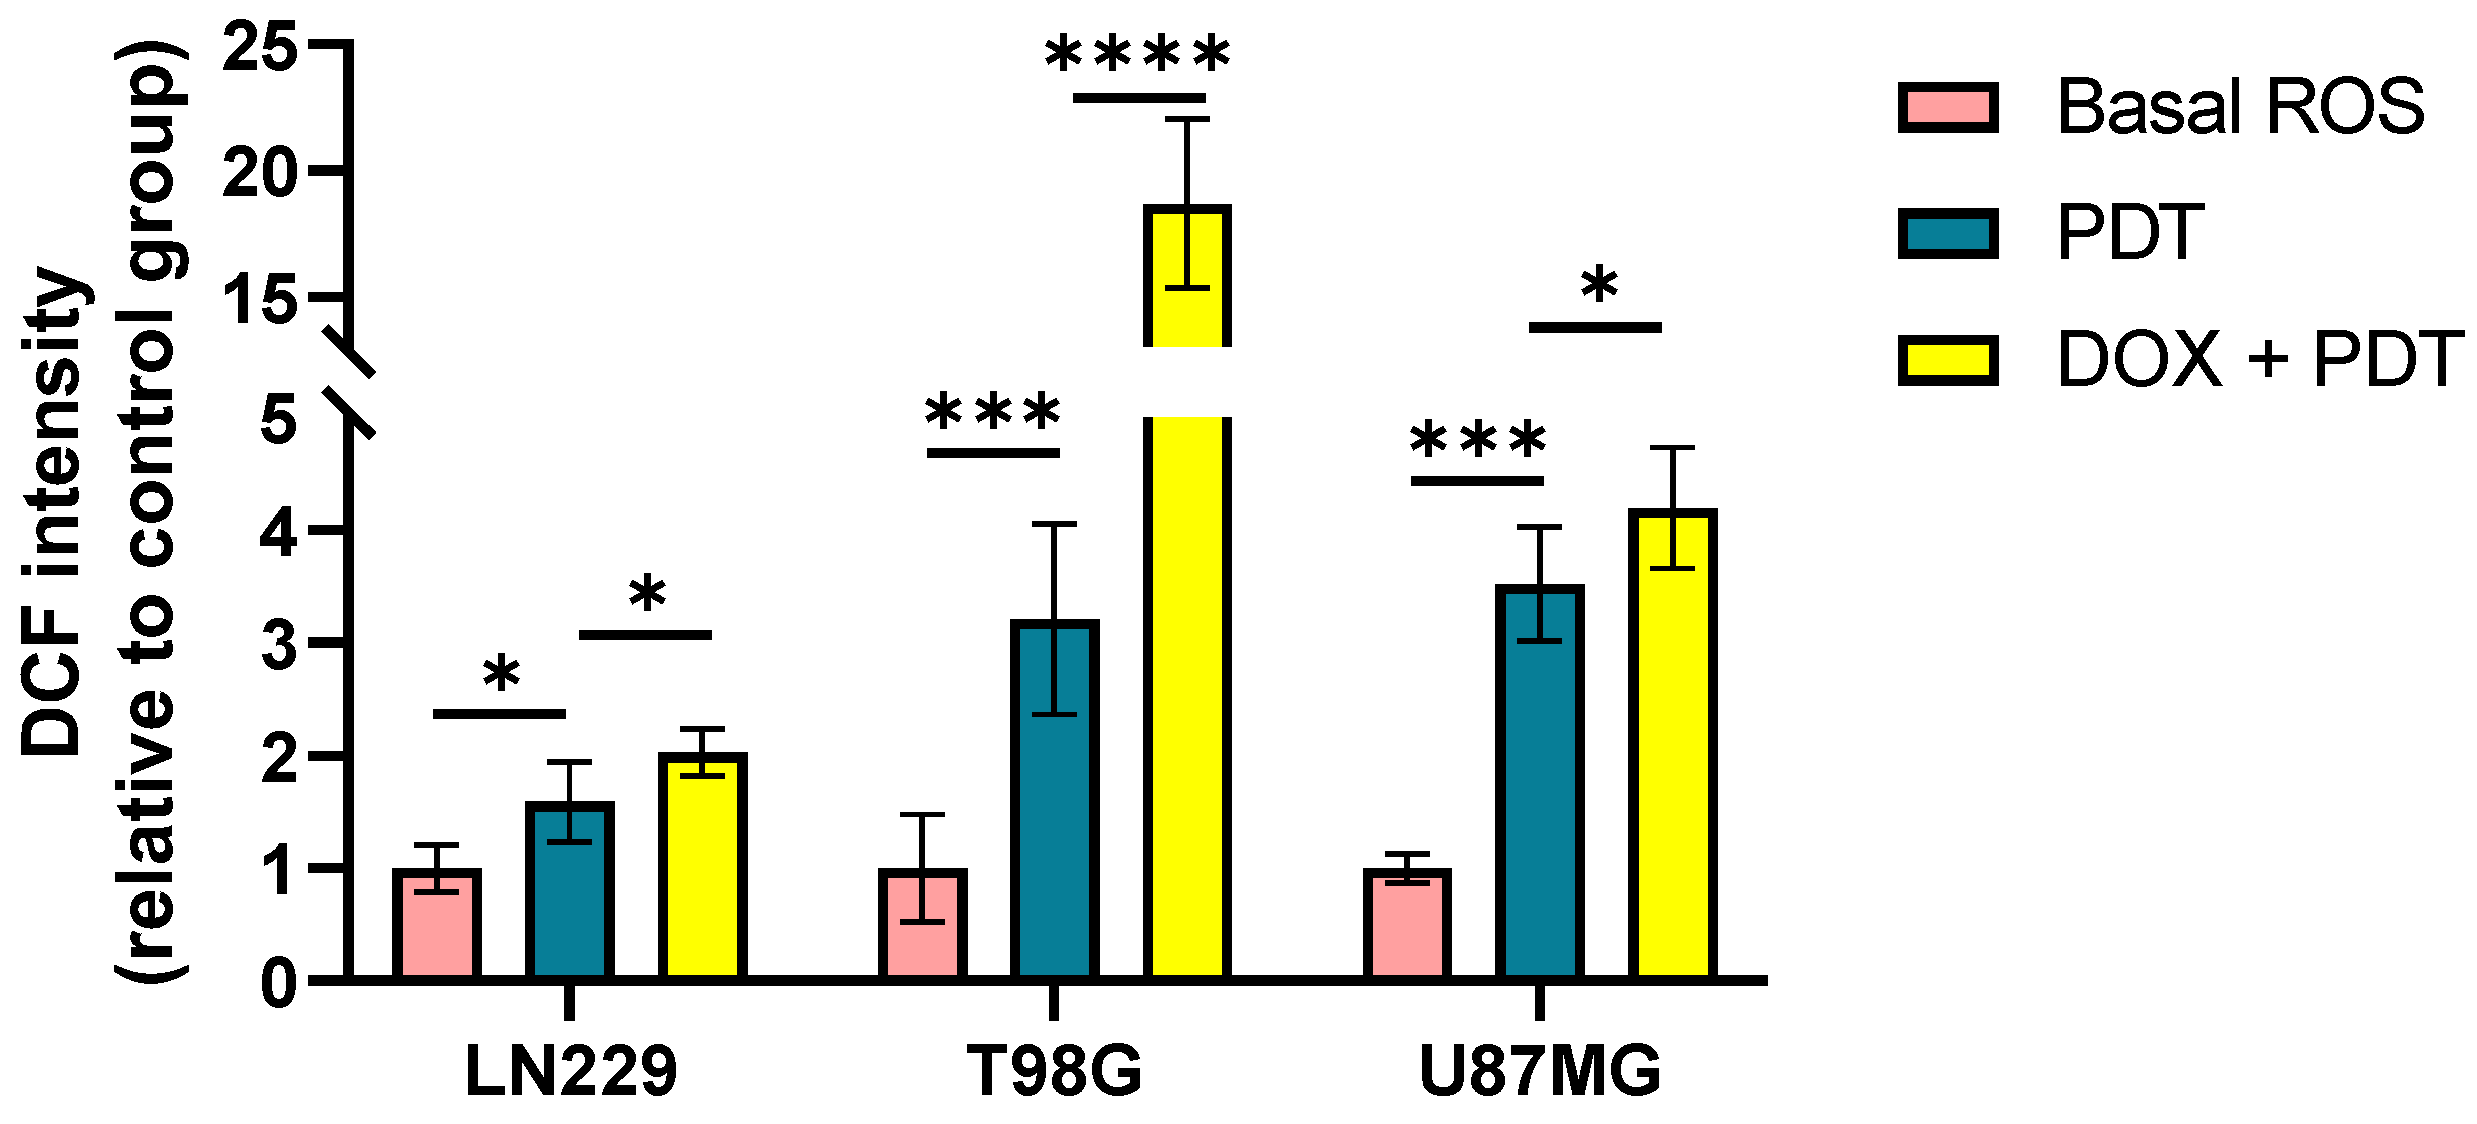
Both DOX and PDT Me-ALA treatments led to increased ROS production in GBM cells, with higher ROS levels observed with PDT compared to DOX. U87MG cells exhibited the highest ROS levels post-treatment, indicating their heightened susceptibility to oxidative stress-induced cell death. Meanwhile, LN229, although it shares a mutation of the TP53 gene, it is not the same mutation that the U87MG line has. Furthermore, the mutation status of the PTEN gene is different between both cell lines. This may suggest the differential behavior between both cell lines. Pre-treatment with NAC rescued cytotoxicity induced by DOX and PDT in U87MG cells, emphasizing the role of ROS in their cytotoxic mechanism.
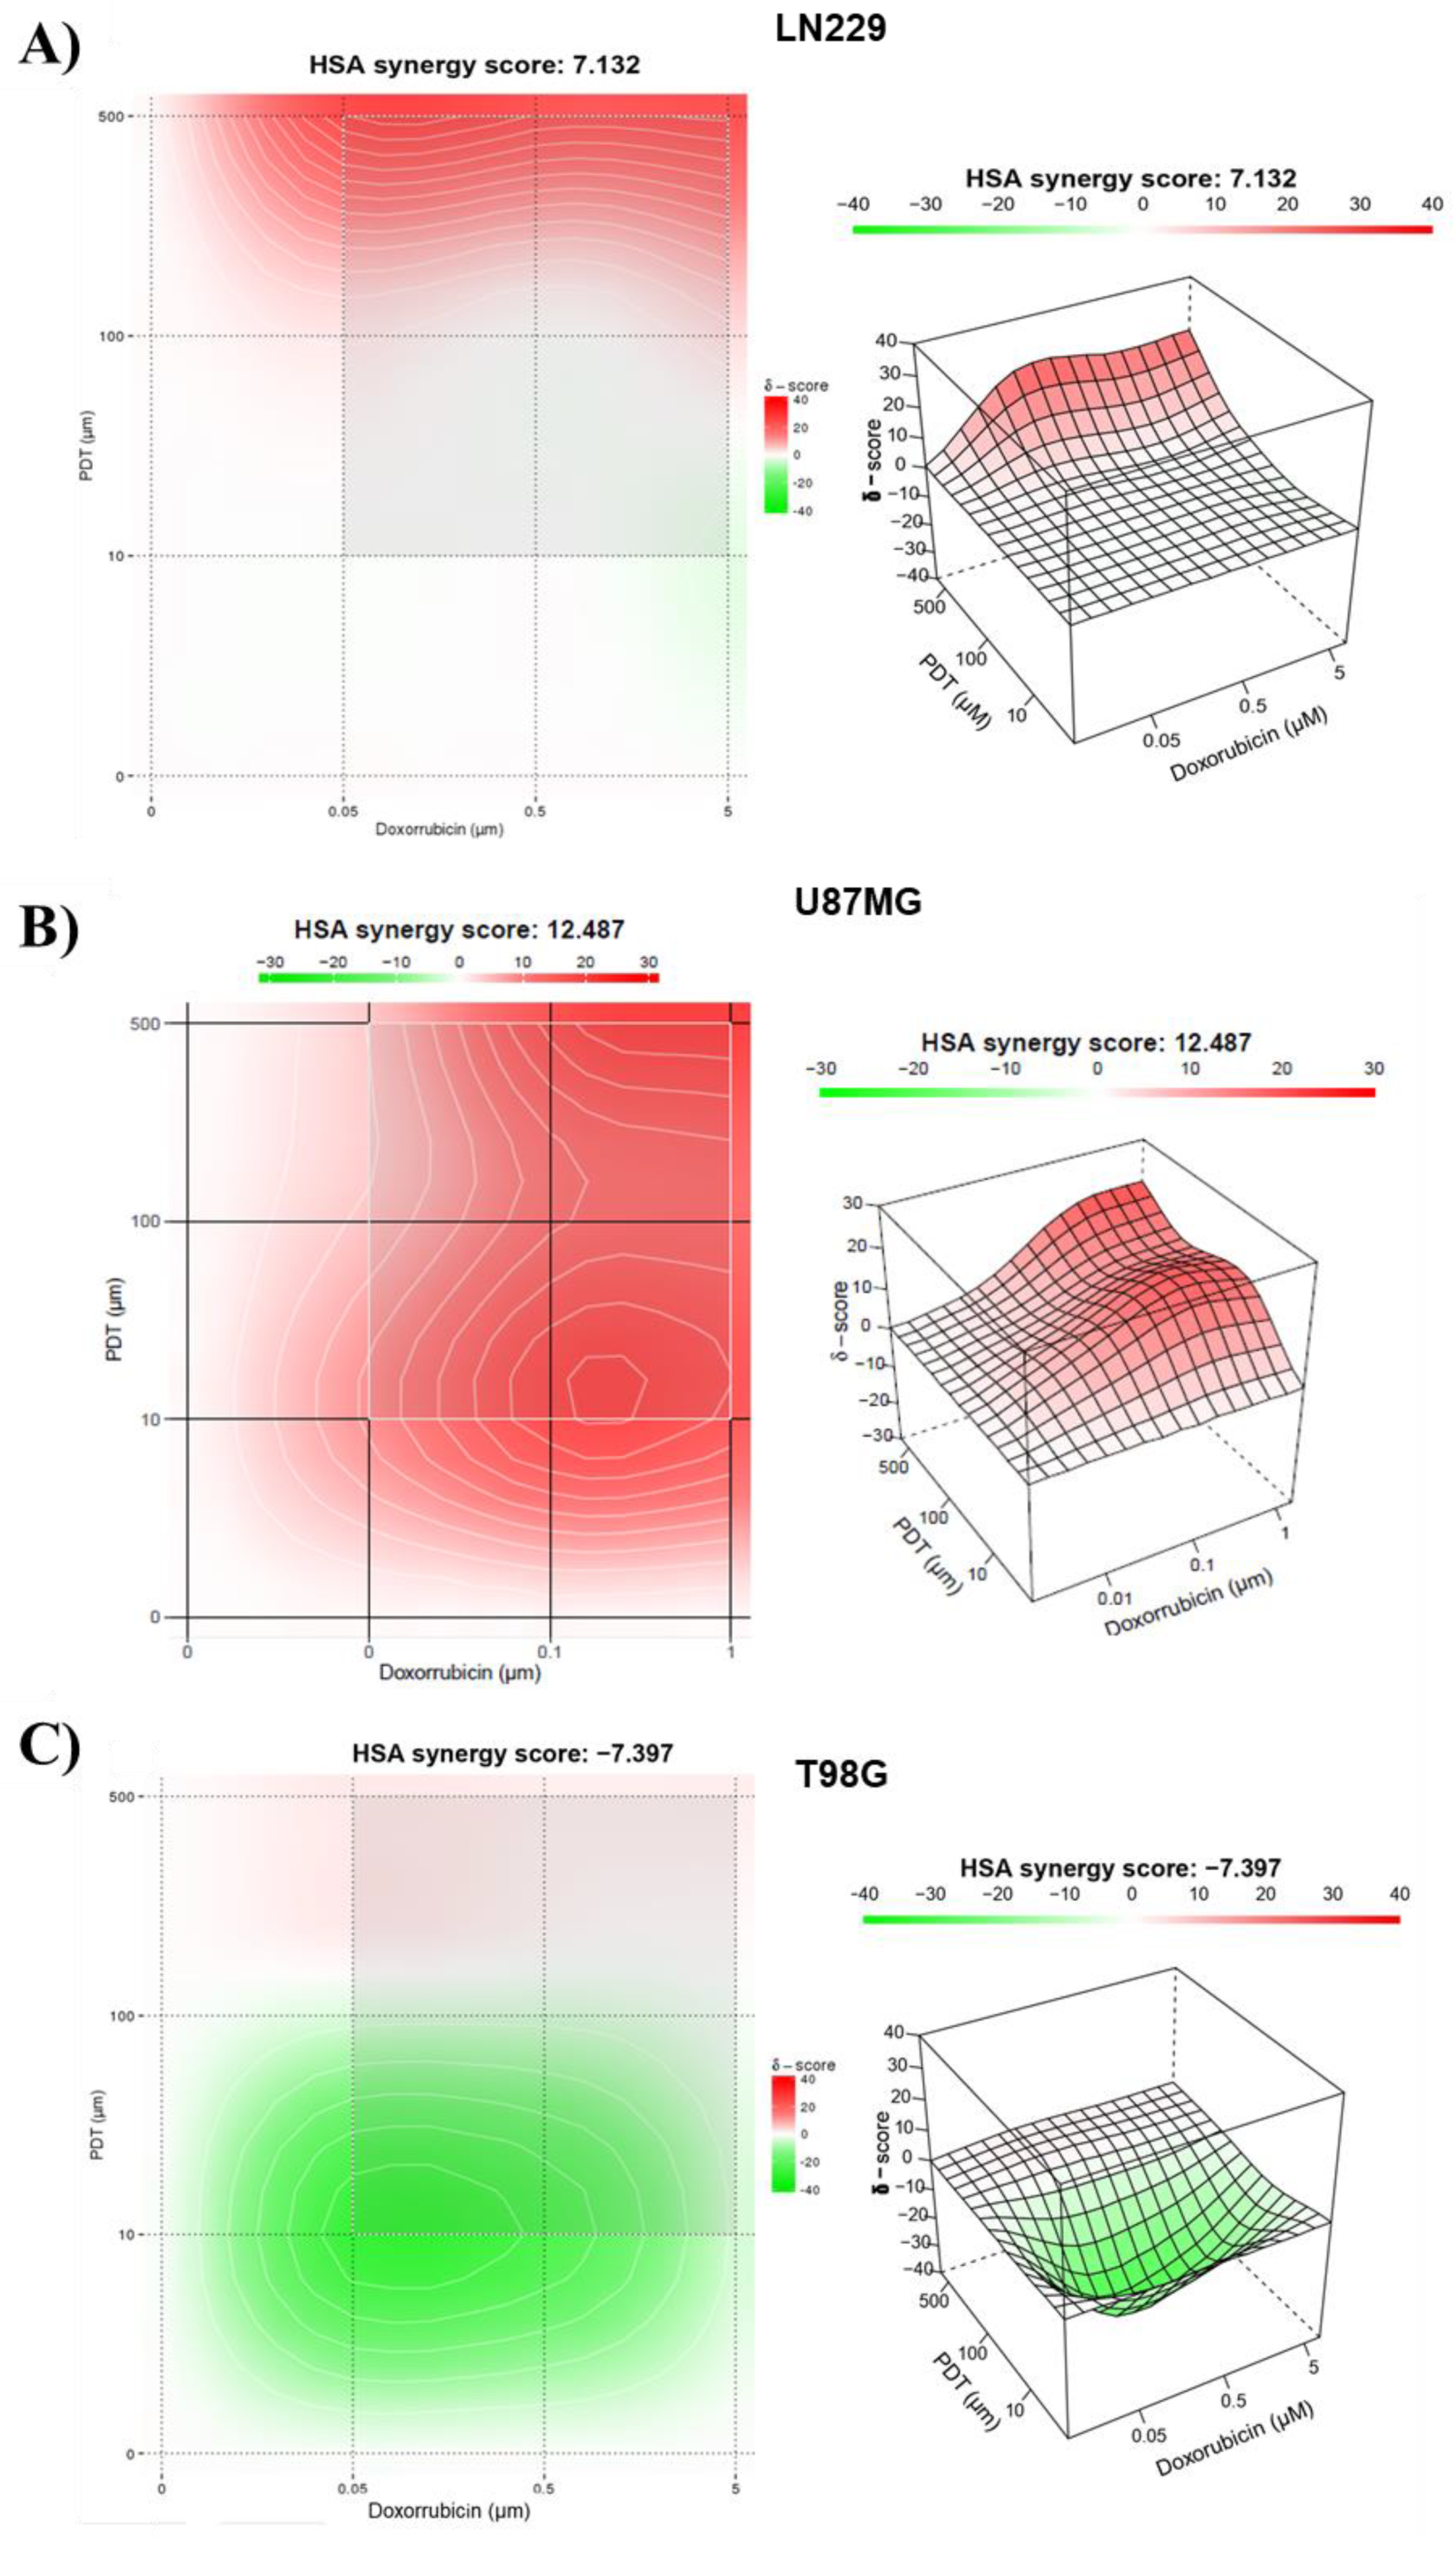
Combining PDT with DOX resulted in synergistic cytotoxic effects in GBM cell lines, with U87MG cells showing the highest sensitivity to the combined treatment. Analysis of oxidative stress levels following combination therapy revealed increased stress levels across all cell lines, particularly pronounced in U87MG and T98G cells. The level of oxidative stress within cells reflects a balance between the rate of ROS production and the activity of detoxifying systems that neutralize them [
50]. The increased basal oxidative stress in transformed cells, particularly in tumor cells harboring mutations in tumor suppressor genes such as
TP53 and
PTEN throughout the carcinogenesis process, renders them highly dependent on their antioxidant systems to counteract the harmful effects of ROS [
21]. Interestingly, this dependence could potentially be a vulnerability for cancer cells that have a mutated
TP53 gene. For instance, this vulnerability is demonstrated by the increased sensitivity of these cells to treatment with H
2O
2 [
51]. However, previous research has also demonstrated that mutated p53 enhances the synthesis of antioxidant enzymes as a defensive reaction to the oxidative circumstances induced by the GOF activities of the mutant protein [
22,
43].
Besides,
PTEN has a crucial role in cellular metabolic regulation and response to oxidative stress. The main function of this is to protect cells from cell death caused by oxidative stress by regulating the PI3K/AKT signaling pathway to limit the production of oxidative stress [
29,
52]. However, when
PTEN is lost, it disrupts the equilibrium of redox processes, leading to increased oxidative stress. This has the potential to affect the response of GBM cells to pro-oxidant treatments as well. A prior investigation has demonstrated that GBM U87MG cells harboring a mutant form of
PTEN, which leads to its loss of function, display elevated levels of oxidative stress in comparison to those identical cells in which PTEN functionality has been reinstated by overexpressing the wild-type variant [
29]. Therefore, we considered the mutational status of both
PTEN and
TP53 in the three cell lines employed in this study. U87MG and T98G presented mutations in
PTEN with loss of function of its enzymatic activity, meanwhile LN229 had the wildtype
PTEN gene.
Mutational analysis of TP53 and PTEN genes revealed distinct gene expression profiles associated with oxidative stress response. Patients with combined TP53 and PTEN mutations showed upregulation of prooxidant genes like ERO1A and TXNRD1, suggesting a prooxidant shift in these cases. TP53 mutations appeared to influence the expression of both prooxidant and antioxidant genes, with potential implications for treatment response. LN229 cells, characterized by PTEN wild-type and TP53 mutant status, exhibited resistance to prooxidant therapies, potentially due to enhanced expression of protective antioxidant systems.
These findings highlight the complex interplay between prooxidant therapies, ROS production, and genetic factors in GBM, underscoring the importance of personalized treatment strategies targeting specific molecular pathways involved in oxidative stress response. Insufficient antioxidant defenses lead to oxidative stress, resulting in cell death when the harmful effects of ROS are not reduced. Further research is warranted to validate these observations and explore their clinical implications for GBM management.
4. Materials and Methods
4.1. Cell Lines and Culture Conditions
In this study, three distinct human GBM tumor cell lines were employed. The first cell line, U87MG (ATCC® HTB-14™) with wild-type TP53 and mutant PTEN was originated from a GBM specimen obtained from an adult male patient. The second cell line, T98G (ATCC® CRL-1690™), with mutated TP53 (M237I) and PTEN genes, was derived from a GBM specimen obtained from a 61-year-old male patient. Finally, the third cell line, LN229 (ATCC® CRL-2611™), was isolated from the right frontal parieto-occipital cortex of a 60-year-old Caucasian patient diagnosed with GBM. In contrast to the first two cell lines, this cell line harbors mutant TP53 (P98L) and wild-type PTEN. All GBM cell lines were cultured in Dulbecco's Modified Eagle's Medium (DMEM, Sigma-Aldrich) supplemented with 10% fetal bovine serum (FBS, Internegocios, S.A, Buenos Aires, Argentina).
4.2. Cell Uptake Analysis of DOX and Bioproduction of PpIX
GBM cell lines were cultured in 24-well plates with 20,000 cells per well and incubated at a temperature of 37°C in a CO2 incubator for one night. Subsequently, the media was substituted with DOX at different concentrations (0.1, 0.5, 1.5, and 10 μM). The cells were then incubated for 24 hours, and the fluorescence of the CTA in the cells was assessed using flow cytometry in the red-B detector channel. On the other hand, to induce intracellular formation of PpIX, the three cell lines were seeded onto 24-well plates at a density of 20,000 cells. Subsequently, cells were exposed to media containing Me-ALA at concentrations of 0.01, 0.1, and 0.5 mM for a duration of 4 hours. In order to quantify PpIX formation, cell fluorescence was subsequently analyzed by flow cytometry in the red-B channel.
4.3. Assessment of the Efficacy of DOX as a Single Treatment in GBM Cell Lines
The cell suspensions were prepared at a concentration of 200,000 cells per milliliter and seeded onto 96-well plates at a density of 20,000 cells per well. The cells were cultured for 24 hours at a temperature of 37°C in a CO2 incubator. Subsequently, various concentrations of DOX were examined within a range of 0.1 - 102.4 μM, with a duration of exposure of 24 hours. After that time, the CTA medium was extracted from the plate. A solution of MTT in complete DMEM (0.5 mg/mL) was prepared, and 100 μL of this solution was added to each well. The plate was then incubated in darkness, under the same conditions as before, for a duration of 3 hours. Next, the medium was disposed of and 100 μL of DMSO was introduced to dissolve the formazan crystals. Ultimately, the measurement of absorption was conducted utilizing a multiplate reader (Multiskan, Thermo Scientific) at a specific wavelength of 570 nm. The absorption values of the treated groups were compared to the control group, which did not receive any treatment. The values were transformed into percentages, representing cell viability relative to the control, which was considered to have 100% viability.
4.4. Assessment of the Impact of TFD with Me-ALA on the Survival of GBM Cells
Cell viability was assessed following exposure to varying doses of Me-ALA in the three GBM cell lines. To achieve this, a 100 mM solution of the photosensitizer Me-ALA was prepared. Cell suspensions were prepared at a concentration of 200,000 cells per milliliter and seeded onto 96-well plates at a density of 20,000 cells per well. Afterwards, solutions of Me-ALA were prepared in concentrations of 0.01, 0.1, 0.5, 1, and 2 mM in serum-free DMEM. The same medium was used for the control samples. The complete DMEM that was originally in the plates was removed, and two washes were performed with PBS 1X. The prepared Me-ALA solutions were then added to the plates, and the samples were incubated in the dark for 4 hours. Following this period, irradiation was performed utilizing a multiLED system emitting light at a wavelength of 635 ± 15 nm. The light dosage applied was 1 J/cm2, with a luminous output of 21.25 mW/cm2. Subsequently, the media was replaced with DMEM containing 10% SFB and the cells were incubated for 24 hours. The following day, the feasibility of the cells was assessed using the MTT colorimetric test, as previously reported.
4.5. Reversal of Prooxidant Cytotoxic Effects in Monotherapy with DOX and PDT through N-Acetylcysteine Intervention
The three GBM cell lines were seeded in 96-well plates at a density of 10,000 cells per well. On the next day, a solution containing N-acetylcysteine (NAC) in 10% FBS DMEM (5 µM) was introduced to the specified wells and left to incubate for 24 hours. Following this period, the cells were subjected to DOX treatment at concentrations of 0.1, 1, and 5 µM for an additional 24 hours. Certain wells were administered chemotherapy exclusively, without the inclusion of NAC. In addition, GBM cell lines were subjected to pre-incubation with Me-ALA (0.1 – 0.25 - 0.5 mM) for a duration of 24 hours before being incubated with NAC as described previously. The cells were exposed to 1 J/cm2 of light after being incubated with Me-ALA for 4 hours. Cell viability was assessed 24 hours after treatments using MTT, and a comparison was made between wells that were incubated with NAC (NAC +) and those that were not (NAC -).
4.6. Citotoxicity effect of Combination of Doxorubicin and PDT with Me-ALA
We performed an experiment to evaluate the effect of combining DOX and PDT with Me-ALA on the viability of three different cell lines (U87MG, T98G, and LN229). Cells were placed at a concentration of 20,000 cells per well in 96-well plates for this experiment. After 24 hours of culturing, the cells were treated with different concentrations of DOX close to the IC50 values (0.05, 0.5, and 5 µM for T98G and LN229, and 0.01, 0.1, and 1 µM for U87MG) for 24 hours. After removing DOX, cells were treated with Me-ALA at concentrations of 0.01, 0.1, and 0.5 mM for 4 hours, then subjected to irradiation of 1 J/cm2. Cell viability in each treatment was evaluated using an MTT assay after 24 hours.
4.7. Determination of Synergy between Doxorubicin and PDT with Me-ALA
The interaction of DOX and PDT with Me-ALA was assessed using SynergyFinder, a tool available at
https://synergyfinder.fimm.fi/. The analysis was conducted on May 2024. SynergyFinder is a web-based application that assesses the synergy between a combination of medications using different reference models. In order to do this, we utilized the Highest Single Agent (HSA) model. This model measures the level of synergy by comparing it to the greatest response of a single agent. It suggests that the predicted combined impact is equal to the maximum response of a single drug at the corresponding concentrations. Summarized synergy scores represent the mean additional reaction resulting from pharmacological interactions. For example, a synergy score of 15 equates to a 15% response over the anticipated level. The acquired synergy scores were categorized as synergistic (synergy score > 10), additive (synergy score ranging from -10 to 10), or antagonistic (synergy score < -10).
4.8. Evaluation of Intracellular Oxidative Stress after Mono and Combo Treatment
GBM cell lines were seeded into 24-well plates with 500 μL of a prepared cell suspension containing 100,000 cells/mL per well, resulting in a total of 50,000 cells in each well. These plates were then incubated for 24 hours at 37°C with 5% CO2.
Following the incubation period, the medium was aspirated from all wells, and distinct concentrations of DOX (0.1, 0.5, 1.5 and 10 μM), approximating the IC50 value, were applied for 24 hours. Additionally, three concentrations of Me-ALA near the IC50 (0.01, 0.1 and 0.5 mM) were administered for 4 hours, followed by irradiation with a light dose of 1 J/cm2. Immediately after these separate treatments, the medium was aspirated, and a solution of CM-H2DCFDA in PBS at a concentration of 10 μM was introduced.
For the combined treatment, cells were seeded as previously described and incubated with DOX at 0.5 μM for 24 hours, followed by incubation with Me-ALA at 0.1 mM, and irradiation with a light dose of 1 J/cm2. DCF fluorescence was assessed immediately after PDT treatment. To serve as a positive control, certain wells were treated with a solution of hydrogen peroxide (30% v/v, diluted 1/200 in PBS) and incubated for 20 minutes at 37°C. Following a 30-minute incubation period with the oxidative stress probe, the medium was aspirated, and complete medium was added for a further incubation period of 10 minutes. Subsequently, the medium was removed, wells were rinsed with 1X PBS, and cells were detached using 1% trypsin.
The samples underwent analysis using flow cytometry (Guava easycyte 6 2L), with the green-B detector utilized to analyze the fluorescence of the DCF probe.
4.9. Gene Expression Analysis of Antioxidant Response in GBM Cell Lines
A quantitative polymerase chain reaction (qPCR) was conducted to assess the gene expression of several molecules involved in the antioxidant response of GBM cell lines. RNA was isolated from U87MG, LN229, and T98G cells cultured under growth conditions using TRIzol reagent (Invitrogen, Thermo Fisher Scientific). The extracted RNA was then reverse transcribed using M-MLV reverse transcriptase (Invitrogen, Thermo Fisher Scientific) following the manufacturer's instructions. The qPCR measurement was conducted using the SYBR Green qPCR Master Mix from Agilent Technologies, CA, USA. Each reaction contained 10 ng of cDNA and was performed on Agilent's Stratagene Mx3000PRO equipment. [
53]. ACTB gene expression was used as housekeeping gene to normalize the expression of target genes and the 2
-ΔΔCT method was used to calculate relative levels of gene expression using the Strata gene MxPro QPCR software v3.00 tool (Stratagene, Agilent Technologies). The quality of amplification was confirmed using a typical melting-curve cycle. The samples were subjected to triplicate analysis, and the experiment was replicated two times. Forward and reverse primers for the genes of interest are shown in
Table 1.
4.10. Expression Analysis of Cell Redox Homeostasis Genes in GBM Patient Samples
In silico analysis leveraged the TCGA Pan-Cancer Atlas data accessible through cBioPortal (accessed May 2024) [
54]. This analysis focused on 145 glioblastoma (GBM) patients. Mutation status of
TP53 and
PTEN genes, along with mRNA expression of relevant genes, was retrieved for diploid samples. Venn diagrams were generated using InteractiVenn [
55], while heatmaps were constructed using the online platform ClustVis [
56]. Patients were stratified into four groups based on
TP53 and
PTEN mutation status: TP53 WT - PTEN WT (n = 94): patients with wild-type (WT) TP53 and PTEN genes; TP53 WT - PTEN mut (n = 30): patients with WT TP53 and mutated (mut) PTEN genes; TP53 mut - PTEN WT (n = 31): patients with mutated TP53 and WT PTEN genes; TP53 mut - PTEN mut (n = 20): patients with mutated TP53 and PTEN genes. The analysis focused on mRNA expression of genes associated with the Gene Ontology (GO) term "cell redox homeostasis" (GO:0045454) (
https://www.ebi.ac.uk/QuickGO/term/GO:0045454) and was further supplemented by relevant literature findings on oxidative stress.
4.11. Statistical Analysis
The data collected from the cell uptake, ROS production, and cytotoxicity experiments were analyzed using Graph Prism software. One-way ANOVA was used to determine the significant differences in cell viability for cells treated with a single treatment of DOX and PDT with Me-ALA. The fluorescence intensity of DOX uptake and PpIX bioproduction was measured for each treatment group and normalized to the autofluorescence of untreated cells. The acquired data was subsequently analyzed using Graph Prism software. Two-way ANOVA was used to determine the significant difference in cell uptake and intracellular bioproduction of PpIX among various treatment groups considering different concentrations and the behavior of cell lines. The experiments were conducted with a sample size of n=6 and repeated twice.
Author Contributions
Conceptualization, L.E.I.; methodology, B.A.C., M.D.C., M.J.L. and L.E.I.; software, B.A.C.; validation, M.J.L. and L.E.I.; formal analysis, B.A.C., M.D.C., M.J.L. and L.E.I.; investigation, B.A.C., M.D.C., M.J.L. and L.E.I.; resources, M.J.L. and L.E.I.; data curation, B.A.C., M.D.C., M.J.L. and L.E.I.; writing—original draft preparation, B.A.C., M.J.L. and L.E.I.; writing—review and editing, M.J.L. and L.E.I.; visualization, L.E.I.; supervision, L.E.I.; project administration, L.E.I.; funding acquisition, L.E.I. All authors have read and agreed to the published version of the manuscript.”
Figure 1.
Cell viability after DOX and PDT treatments as monotherapies. Quantification of cell viability by MTT assay 24 h after DOX (A) or PDT (B) treatments for U87MG, T98G and LN229 cell lines as a function of DOX concentration and Me-ALA concentration and light dose of 1 J/cm2 respectively. Cell viability percentages were normalized to control cells not exposed to treatments. Statistical analysis was performed using one-way ANOVA with Tukey's post-hoc test. Significance levels are denoted by asterisks ** p < 0.01, *** p < 0.001 and ns: no statistically significant differences.
Figure 2.
DOX incorporation and PpIX bioproduction. A) DOX uptake evaluation by flow cytometry in GBM cell lines after 24 hours of incubation with different DOX concentration. B) PpIX bioproduction evaluation by flow cytometry in GBM cell lines after 4 hours of incubation time. Both DOX uptake and PpIX intracellular levels were represented by fluorescence intensity fold increment (MFI, arbitrary units A.U. compared with control cells) in the red channel of FC. Statistical analysis was performed using one-way ANOVA with Tukey's post-hoc test. Significance levels are denoted by asterisks * p < 0.05, ** p < 0.01, *** p < 0.001 and **** p < 0.0001, ns: no statistically significant differences.
Figure 3.
ROS production evaluation after monotherapies. Geometric mean fluorescence intensity quantification relative to autofluorescence of control group for LN229, U87MG and T98G after DOX treatment (A) and PDT with Me-ALA (B). ROS levels were determined immediately after each treatment with DCFDA assay using flow cytometry. Statistical analysis was performed using two-way ANOVA with Tukey's post-hoc test. Significance levels are denoted by asterisks * p < 0.05, ** p < 0.01, *** p < 0.001 and **** p < 0.0001, ns: no statistically significant differences.
Figure 4.
Evaluation of cytoprotective effects of NAC pretreatment against prooxidant treatments. Effect of protective effect of NAC against prooxidant-induced cell death in LN229 (A), U87MG (B) and T98G (C) GBM cell lines. Cells were incubated with 5 µM NAC for 24 hours before exposure to DOX or PDT with Me-ALA. Cytotoxicity was determined with the MTT-based assay. Statistical analysis was performed using two-way ANOVA with Tukey's post-hoc test. Significance levels are denoted by asterisks * p < 0.05, ** p < 0.01, *** p < 0.001 and **** p < 0.0001, ns: no statistically significant differences.
Figure 5.
Evaluation of the synergistic combination of PDT and DOX treatments. 3D images showing synergy between the combination of DOX and PDT with Me-ALA based on HSA score for different GBM cell lines; LN229 (A), U87MG (B) and T98G (C). The graph was generated using synergy finder, an online-based tool to determine synergy.
Figure 6.
ROS production evaluation after combination therapy. Geometric mean fluorescence intensity quantification relative to autofluorescence of control group for LN229, U87MG and T98G after DOX and PDT treatments. ROS levels were determined immediately after PDT treatment with DCFDA assay using flow cytometry. Statistical analysis was performed using one-way ANOVA with Tukey's post-hoc test. Significance levels are denoted by asterisks * p < 0.05, *** p < 0.001 and **** p < 0.0001.
Figure 7.
Basal redox homeostasis in GBM cell lines. A) Geometric mean DCF fluorescence intensity quantification in GBM cell lines under basal growth conditions. Relative quantification of NRF2 (B), glutathione superoxide reductase (GSR) (C) and catalase (D) gene expression. Relative expressions across all cell lines were normalized by ACTB and relativized to the gene expression in U87MG. Statistical analysis was performed using one-way ANOVA with Tukey's post-hoc test. Significance levels are denoted by asterisks * p < 0.05, ** p < 0.01 and *** p < 0.001.
Figure 8.
In silico analysis of oxidative stress-related genes in GBM. A) Venn diagram, created using InteractiVenn, illustrates the distribution of patients across groups based on their TP53 and PTEN mutation status. The overlapping areas depict the number of patients harboring mutations in both genes or only one of them. This figure provides a visual representation of the patient stratification used in the subsequent analyses. B) Heatmap depicts the expression patterns of oxidative stress-related genes across GBM patient groups classified based on TP53 and PTEN mutation status. The analysis was performed using ClustVis. The color intensity represents the relative expression level of each gene across samples. Red indicates high expression, while blue represents low expression. C-H) Dot plots showing statistically significant differences in mRNA expression levels of oxidative stress-related genes across patient groups categorized based on TP53 and PTEN mutation status. The groups include: TP53 WT - PTEN WT (n = 94 patients): Patients with wild-type (WT) TP53 and PTEN genes; TP53 WT - PTEN mut (n = 30 patients): Patients with WT TP53 and mutated (mut) PTEN genes; TP53 mut - PTEN WT (n = 31 patients): Patients with mutated TP53 and WT PTEN genes; TP53 mut - PTEN mut (n = 20 patients): Patients with mutated TP53 and PTEN genes. Statistical analysis was performed using one-way ANOVA with Tukey's post-hoc test. Significance levels are denoted by asterisks: p < 0.001 (**) and p < 0.05 (*).
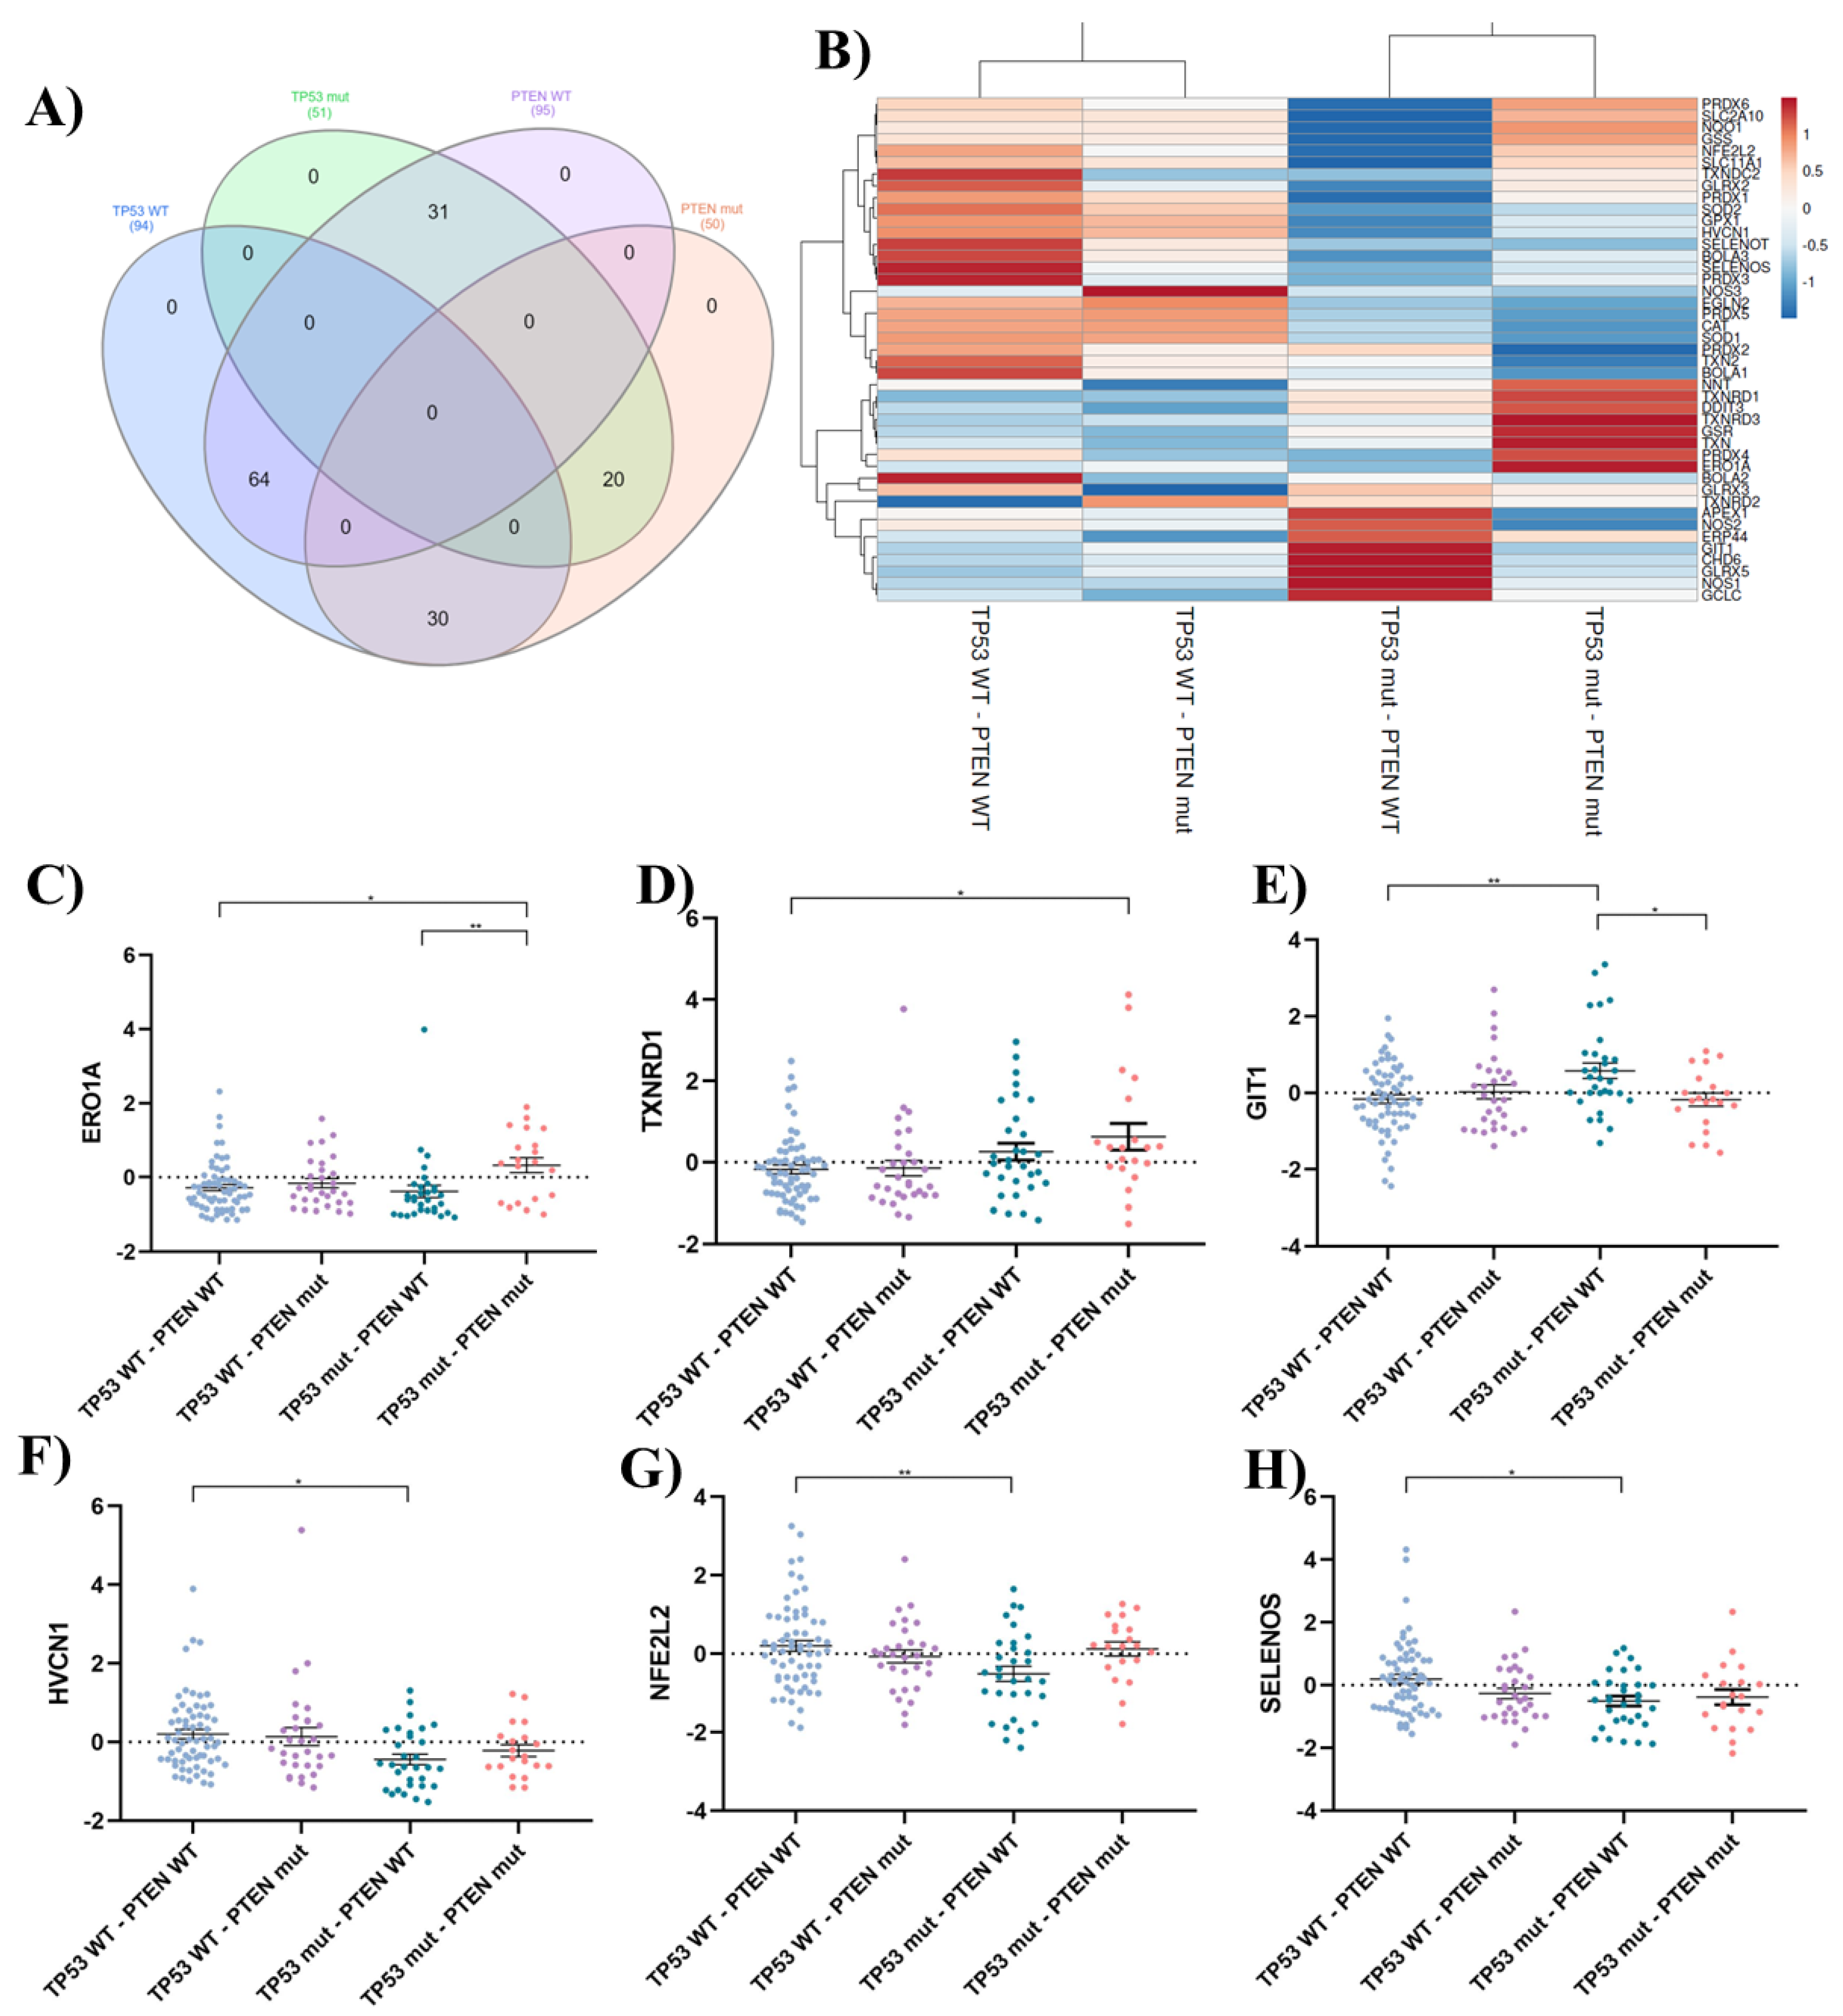
Table 1.
qPCR primers designed on Primer-BLAST and verified on BLAST-N (NCBI).
Table 1.
qPCR primers designed on Primer-BLAST and verified on BLAST-N (NCBI).
| Gene |
Forward 5´- 3´ |
Reverse 3´- 5´ |
Product length (bp) |
NM |
| ACTB |
ATTGCCGACAGGATGCAGAA |
GCTGATCCACATCTGCTGGAA |
150 |
NM_001101.5 |
| GSR |
TGGCACTTGCGTGAATGTTG |
CACATAGGCATCCCGCTTTTC |
157 |
NM_001195102.3 |
| NFE2L2 |
TCAGCGACGGAAAGAGTATGA |
CCACTGGTTTCTGACTGGATGT |
174 |
NM_006164.5 |
| CAT |
GGCGAGGCAGCTTGAGTTAA |
CACCGCCTCGGCTTGTC |
331 |
NM_001752.4 |


