Preprint
Article

West Nile Virus-Induced Expression of Senescent Gene Lgals3bp Regulates Microglial Phenotype within Cerebral Cortex

Altmetrics

Downloads

173

Views

123

Comments

0

A peer-reviewed article of this preprint also exists.

Submitted:

29 May 2024

Posted:

31 May 2024

You are already at the latest version

Alerts
Abstract
Microglia, the resident macrophages of the central nervous system, exhibit altered gene expression in response to various neurological conditions. This study investigates the relationship between West Nile Virus infection, and microglial senescence, focusing on the role of LGALS3BP, a protein implicated in both antiviral responses and aging. Us-ing spatial transcriptomics, RNA sequencing and flow cytometry, we characterized changes in microglial gene signatures in adult and aged mice following recovery from WNV encephalitis. Additionally, we analyzed Lgals3bp expression and generated Lgals3bp-deficient mice to assess the impact on neuroinflammation and microglial phe-notypes. Our results show that WNV-activated microglia share transcriptional signa-tures with aged microglia, including upregulation of genes involved in interferon re-sponse and inflammation. Lgals3bp was broadly expressed in the CNS and robustly up-regulated during WNV infection and aging. Lgals3bp-deficient mice exhibited reduced neuroinflammation, increased homeostatic microglial numbers, and altered T cell popu-lations without differences in virologic control or survival. This data indicates that LGALS3BP has a role in regulating neuroinflammation and microglial activation and suggest that targeting LGALS3BP might provide a potential route for mitigating neu-roinflammation-related cognitive decline in aging and post-viral infections.
Keywords: 
Subject: Biology and Life Sciences  -   Neuroscience and Neurology

1. Introduction

Microglia, the yolk sac progenitor-derived resident macrophages of the central nervous system, exhibit altered transcriptomic signatures in a broad spectrum of neurological conditions, ranging from viral infections to aging and neurodegenerative diseases. Changes in gene expression of microglia indicate a shift in their functions from homeostatic maintenance of neural networks to induction of inflammation or repair, depending on the disease. Although aging is a normal process, studies of senescent markers within microglia reveal an overlap between genes characteristic of aged microglia and those involved in interferon (IFN) signaling pathways [1], specifically Ifitm3, Ifi204, Cxcl16, Gas6 and others. IFN responses are essential for virologic control, and infections with neurotropic viruses have been linked to neurodegeneration. However, the links between virus-mediated inflammation and microglial senescence are poorly understood.
West Nile virus (WNV) is a mosquito-borne arbovirus belonging to the Flaviviridae family of viruses, which also includes other human disease-causing viruses such as Japanese Encephalitis, Zika, Tick-borne Encephalitis, Dengue and Yellow Fever viruses. WNV infection in humans can progress to West Nile Encephalitis, which presents with severe neurological symptoms including meningitis, encephalitis, paralysis, progressing, in some cases, to coma, with an overall mortality of 10% [2]. Long-term cognitive and memory impairment occurs in the majority of survivors, which resolve in months or persist and worsen indefinitely [3]. Using WNV-NS5-E218A, a strain of WNV containing a single point mutation in the gene encoding 2’-O-methyltransferase that enables clearance by Type 1 interferon responses [4], our lab has previously published data characterizing microglial transcriptomic changes during recovery from WNV. These changes include, but are not limited to, increased expression of genes involved in interferon response, including Ifitm3, Ifi204, Itm2b, Cxcl16, and Lgals3bp. Importantly, we found that almost all microglia become activated in the forebrain of WNV-recovered mice, suggesting loss of their homeostatic functions [5,6,7]. In addition, studies of T cell function during WNV recovery demonstrate that resident memory CD8 T cells maintain microglia activation via Type 2 interferon signaling [7,8].
LGALS3BP, a heavily glycosylated protein, is a known binding partner for Galectin 3 (LGALS3), which is expressed by a wide array of cells and present in most biological fluids including serum, cerebrospinal fluid, saliva, and others. Early studies of LGALS3BP focused on its roles during HIV infection, where it was shown to be a serum marker for progression to AIDS. LGALS3BP expression is also elevated carcinogenesis, including lung, breast [9], glioblastoma multiforme (GBM) [10] and others. Exact molecular mechanisms of LGALS3BP action, as well as the downstream effects of its interaction with LGALS3, are unknown, but there is evidence for Lgals3bp being involved, paradoxically, in both IFN- [11] and TGFβ [12]-mediated immune response pathways. Lgals3bp deficiency has previously been shown to promote increased severity and mortality from Influenza type A, and higher viral loads of Zika, Herpes Simplex and Vesicular Stomatitis Viruses in mice [11]. More recently, increased LGALS3BP levels in cerebrospinal fluid were shown to be significantly correlated with advanced age in humans [13]. In addition, patients with point mutations in LGALS3BP have altered cortical gyrification and thickness, sulcal depth and surface area, suggesting potential roles for LGALS3BP in the regulation of neural progenitor positioning [14].
Given these roles for LGALS3BP at the intersection of antiviral response and aging, we hypothesized that neuroinflammation caused by WNV infection might drive expression of senescence-related genes within microglia that differentially regulate neuroinflammation. Here, we used spatial imaging and RNA sequencing to characterize virus-mediated alterations in microglial gene signatures in both adult and aged mice after recovery from WNV encephalitis. We found that while activated microglia in the WNV recovered forebrain share transcriptional signatures with aged/senescent microglia, many of these gene alterations may be infection- and aging-dependent. Among these genes, Lgals3bp, which we found to be broadly expressed in the CNS by microglia, astrocytes, and neurons, regulates microglial phenotype and numbers of infiltrated T cells in the forebrain of WNV-recovered animals.

2. Materials and Methods

2.1. Ethics Statement

All experiments were performed in compliance with the recommendations in the Guide for the Care and Use of Laboratory Animals of the National Institutes of Health and according to the international Guiding Principles for Biomedical Research Involving Animals. The protocol was approved by the Washington University School of Medicine in St Louis Animal Safety Committee (#21-0091).

2.2. Viruses and Infection Procedures

WNV-NS5-E218A strain used in this study contains a single point mutation in the gene encoding 2’-O-methyltransferase and was constructed previously [15,16] from WNV 3356 strain and passaged once in Vero cells [4]. Mice were deeply anesthetized with a cocktail of ketamine/xylazine/acepromazine and intracranially administered 104 plaque-forming units (p.f.u.) of WNV-NS5-E218A. Virus was diluted in 10 μl of 0.5% fetal bovine serum (FBS) in Hank’s balanced salt solution (HBBS). Virus or diluent (mock) was injected into the third ventricle of the brain with a guided 29-guage needle, as previously described.

2.3. Animals

All mouse experiments adhered to the guidelines approved by the Washington University in St. Louis Institutional Animal Care and Use Committee under IACUC protocol number 21-0019. All experiments were approved by the institutional biological and chemical safety committee at Washington University in St Louis. All mice used in these experiments were male or female C57BL6/J inbred mice obtained commercially (The Jackson Laboratory) at specified ages and housed in pathogen-free facilities at the Washington University School of Medicine.

2.4. Viral Burden Measurements

Mice were infected with WNV and euthanized at specific days post-infection, as indicated. For tissue collection, mice were deeply anesthetized with ketamine/xylazine/acepromazine and perfused with 20 mL of sterile, ice-cold Dulbecco’s phosphate-buffered saline (dPBS; Gibco). Tissues were snap frozen on dry ice, weighed, and then homogenized in 500 μl sterile dPBS. Viral titers were quantified by standard plaque assay with BHK21 cells, as described [17].

2.5. Leukocyte Isolation and Flow Cytometry

For flow cytometry experiments, leukocytes were isolated as described previously [18]. Mice were deeply anesthetized with ketamine/xylazine/acepromazine cocktail, then transcardially perfused with 20 ml dPBS and the brain was removed. Brain tissue was minced and digested in Hank’s Balanced Salt Solution (HBSS; Gibco) containing 0.05% collagenase D (Sigma), 0.1 μg/ml TLCK trypsin inhibitor (Sigma), 10 μg/ml DNase I (Sigma), and 10 mM Hepes pH 7.4 (Gibco) for 1 h at 37 °C with shaking. Tissue was then pushed through a 70-μm strainer and centrifuged at 500 x g for 10 min. Brain cell pellets were resuspended in 37% isotonic Percoll (GE healthcare) and centrifuged at 1200 x g for 30 min to remove myelin debris, and the pellet was resuspended in dPBS. For ex vivo restimulation, isolated cells were then treated with 1 μg/ml ionomycin and 5 ng/ml phorbol myristate acetate to stimulate cytokine expression and 5 μg/ml Brefeldin A to block cytokine exocytosis for 4 hrs at 37 °C, 5% CO2. Prior to immunostaining, all cells were blocked with 1:50 TruStain FcX anti-mouse CD16/32 (Clone 93, Biolegend, Cat 101320) for 5 min. Cells were stained with Live/Dead Fixable Blue at 1:1000 following dissolution in 40 μl DMSO (Invitrogen, L34962) and extracellular antibodies, as indicated, for 15 min at 22 °C, then washed twice with dPBS, fixed and permeabilized with Foxp3/Transcription Factor Staining Kit (eBioscience, 00-5523-00). Intracellular markers were detected with antibodies, as indicated for 15 mins, then cells were washed twice with permeabilization buffer and twice with dPBS, then fixed with 2% paraformaldehyde (PFA). Data were collected with a BD LSR Fortessa X-20 flow cytometer and analyzed with FlowJo software.

2.6. Flow Cytometry Antibodies and Tetramers

All antibodies used at 1:200: CD11b (Clone M1/70, Biolegend, Cat 10137), CD45 (Clone 30-F11, eBioscience, Cat 56-0451-82), MHCII (Clone M5/114.15.2, Biolegend, Cat 107626), CD80 (Clone 16-10A1, Biolegend, Cat 104706), CD103 (Clone 2E7, eBioscience, Cat 48-1031-80), CD8a (Clone 53-6.7, Biolegend, Cat 100712), CD4 (Clone RM4-5, BD Biosciences, Cat 550954), CD44 (Clone IM7, Biolegend Cat 103011), P2RY12 (Clone S16007D, Biolegend Cat 848006), IFNγ (Clone XMG1.2, Biolegend Cat 505826), CD68 (Clone FA-11, Biolegend Cat 137017). WNV-specific CD8+ T cells were identified with fluorescent-labeled immunodominant Db-restricted NS4B peptide.

2.7. RNA Isolation and qRT-PCR

Following transcardiac perfusion, tissues were collected in 500 μl TRI Reagent (ThermoFisher Cat AM9738) and homogenized with zirconia beads using a MagNA Lyser instrument (Roche Life Science). RNA was subsequently isolated using Direct-zol RNA miniprep kit (Zymo Research Cat R2052) according to manufacturer’s instructions. After RNA concentration was measured using Nanodrop 2000 instrument (ThermoFisher), iScript Reverse Transcription Supermix kit (BioRad Cat 1708841) was used to generate cDNA. qPCR was carried out using SsoAdvanced Universal SYBR Green reagents (BioRad Cat 1725271) with target-specific primers on a BioRad CFX384 instrument according to manufacturer recommendations.

2.8. RNA Sequencing

For bulk RNA-sequencing, leukocytes were isolated as described above, with an additional step of CD11b+ cell enrichment by using CD11b (Microglia) magnetic microbeads (Myltenyi Biotec Cat 130-093-636). RNA was subsequently isolated from these cells using QIAgen RNeasy Micro kit (QIAGEN Cat 74134). Samples were prepared according to library kit manufacturer’s protocol, indexed, pooled, and sequenced on an Illumina NovaSeq 6000. Basecalls and demultiplexing were performed with Illumina’s bcl2fastq2 software. RNA-seq reads were then aligned and quantitated to the Ensembl release 101 primary assembly with an Illumina DRAGEN Bio-IT on-premise server running version 3.9.3-8 software. Gene counts were then analyzed in Partek Flow software suite using standard pipeline for bulk RNA-sequencing analysis to generate a list of differentially expressed genes (DEGs).

2.9. Multiplexed Error-Robust In Situ Hybridization (MERFISH): Sample Preparation and Imaging

Mice were deeply anesthetized with a ketamine/xylazine/acepromazine cocktail and transcardially perfused with ice cold HBSS. Brains were extracted and immediately transferred into cold OCT. Embedded brains were frozen and stored at -80°C. Vizgen’s fresh frozen tissue sample preparation protocol was followed. Briefly, brains sections were sectioned at 10 μm. Tissue slices were mounted on Vizgen’s bead-coated functionalized coverslip. Once adhered to the coverslip, the samples were fixed (4% PFA in 1× PBS, 15 min, room temperature) and washed (3x, 5 min, 1X PBS). Then samples were incubated overnight in 70% EtOH to permeabilize the tissue. Following permeabilization samples were incubated for 30 min in Formamide Wash Buffer (30% deionized formamide (Sigma, S4117) in 2× SSC (Thermo Fisher, AM9765)) followed by the addition of the gene library mix for the hybridization step (48h, 37°C). Samples were then washed twice with Formamide Wash Buffer (2x, 30 min, 47°C), the tissue was embedded in a gel embedding solution (0.5% of 10% w/v ammonium persulfate, 0.05% TEMED, 4% 19:1 acrylamide/bis-acrylamide solution, 0.3M NaCl, 0.06M Tris PH8) followed by overnight incubation with tissue clearing solution (2X SSC, 2% SDS, 0.5% v/v Triton X-100, and proteinase K 1:100) at 37°C. Finally, tissue was washed, incubated with DAPI and polyT solution (15 min RT), and washed with formamide wash buffer (10 min RT). After sample preparation, the MERSCOPE 500 gene imaging kit was activated by adding 250 μl of Imaging Buffer Activator (VIZGEN, #203000015) and 100 μl of RNAse Inhibitor (New England BioLabs, M0314L). 15 ml of mineral oil was overlaid on top of the imaging buffer through the activation port and the instrument was primed and the imaging chamber was assembled as per MERSCOPE user guide. A 10x low resolution mosaic of the sample was then acquired, the imaging area was selected, and the sample was imaged.

2.10. MERFISH: Post-Imaging Data Processing and Analysis

Following image acquisition, the resulting data were decoded using Vizgen’s analyzing pipeline incorporated in the MERSCOPE. Vizgen’s postprocessing tool (Vizgen, Cambridge, MA) was then applied to obtain the cell segmentation based on the DAPI staining by using the CellPose algorithm. Segmentation was performed on the middle Z plane (3rd out of 7) and cell borders were propagated to z-planes above and below. MERFISH processed data were analyzed in RStudio using Seurat 4.1.3, R 4.2.2 and custom-made scripts. Cell filtering was applied to the dataset to remove cells <100 µm3 and <10 unique transcripts and <40 transcript counts. Cell gene expression per cell was then normalized to each cell’s volume and the mean RNA per sample. To perform cell clustering we followed a modified Seurat pipeline. We performed principal component analysis (PCA) with 400 genes as the variable features followed by dimensionality analysis with a resolution of 1.6 and 22 dimensions. Dimensionality reduction was performed with Uniform Manifold Approximation and Projection (UMAP). Cell clusters were manually annotated according to the expression of widely used cell-type specific gene markers as well as spatial distribution.

2.11. Gene Module Score Calculation

The module score for the senescent cells was calculated with the AddModuleScore Seurat function with 5 control features from the same bin per analyzed feature. Cells were considered senescent if the score was higher than 3 times the standard deviation + mean of the 16 wk mock group.

2.12. Generation of Lgals3bp-/- C57BL6/J Mice

All animal experiments were approved by institutional IACUC protocols. C57BL/6J mice at 3-4 weeks of age (JAX Laboratories) were superovulated by intraperitoneal injection of 5 IU pregnant mare serum gonadotropin, followed 47h later by intraperitoneal injection of 5 IU human chorionic gonadotropin (PMS from SIGMA, HGC from Millipore USA). Mouse zygotes were obtained by mating C57BL/6J stud males with superovulated C57BL/6J females at a 1:1 ratio. One-cell fertilized embryos were electroporated with an RNP containing 12 μg of Cas9 protein, 2 μg of each gRNA, and 100 pmol (~ 5 μg) of each ssODN complex. Electroporations and mouse transgenesis experiments were performed as described previously [19,20,21].

2.13. Lgals3bp-/- Mice Genotyping

The target region is PCR amplified by tailed primers (gene-specific primer sequences below) appended with 5′-CACTCTTTCCCTACACGACGCTCTTCCGATCT-3′ for forward and 5′-GTGACTGGAGTTCAGACGTGTGCTCTTCCGATCT-3′ for reverse to genomic-specific primer sequences (PCR1), which allows unique indexes and Illumina P5/P7 adapter sequences to be added in a second round PCR. PCR amplifications were performed with SuperFi II 2x Platinum Green master mix (ThermoFisher) according to the manufacturer protocol. Indexing of the PCR1 product was performed by using 0.1X volume from PCR1 with indexing primers (0.1 μM final concentration for each) and melting at 98 °C for 2 min, followed by five cycles of 98 °C for 15 s, 60°C for 15 s, and 72 °C for 40 s. We generated 2 × 250 reads with the Illumina MiSeq platform at the Center for Genome Sciences and Systems Biology (Washington University). The extracted FASTQ files are analyzed by using a Python-based alignment script.
gRNA:
XCD628c.m.Lgals3bp.sp30: CAGGGCCCGGCAGACGACGT
Primers:
XCD628c.m.Lgals3bp.F: TGGGGAGTGAACATCAAACCA
XCD628c.m.Lgals3bp.R CCAGCATGATCGGTCCCTTT

2.14. Statistical Analysis

Statistical analyses were performed using Prism 10.0 (GraphPad Software). All data were analyzed using an unpaired t test or two-way ANOVA with Sidak’s post-test to correct for multiple comparisons, as indicated in corresponding figure legends. A P value < 0.05 was considered significant.

3. Results

3.1. Microglia Activated by WNV Share Transcriptional Signatures with Aged/Senescent Microglia

We previously published a murine model of recovery after intracranial infection with WNV-NS5-E218A, which has a single amino acid mutation in a 2’O methyltransferase that normally prevents viral RNA recognition by interferon-induced protein with tetratricopeptide repeats (IFIT1) [4]. Intracranial inoculation of WNV-NS5-E218A (WNV) leads to uniform infection across CNS regions, which is cleared by 15 days post-infection (dpi), with a survival rate and memory impairments similar to human survival after neuroinvasive WNV infection, and persistent microglial activation [5,6]. While the overlap between inflammation and aging has been explored, it is unknown whether a viral stimulus can trigger senescent phenotypes in the CNS, particularly in microglia. To address this, we compared previously published genes characteristic of activated or homeostatic microglia in our WNV recovery model [7] to published datasets of transcriptomic signatures of young (6 months) and aged (23 months) microglia [22]. This comparison revealed broad similarities in gene expression between WNV-activated and aged microglia (Table 1). Of note, expression of genes defining homeostatic microglia remain mostly unchanged during aging, while many of these genes are down-regulated during viral infection [23,24]. To build on these initial findings, we performed a bulk RNA-sequencing analysis of CD11b+ cells isolated from the forebrains of WNV-infected 16- or 85-week-old animals at 30 DPI. At this time-point, infiltrating monocytes are no longer present, leaving only homeostatic and activated microglia within the myeloid niche [5,7]. This analysis confirmed what we’ve observed in the published dataset of aged microglia: homeostatic genes P2ry12, Selenop and Hexb were unchanged between uninfected 85 week and 16-week animals, while a number of genes characteristic of microglial activation, such as microglialOasl2, Ifitm3 and Ifi204, were increased in aged microglia (Figure 1A). WNV infection, in accordance with our previous data, resulted in robust upregulation of activated microglial genes in both 16- and 85-week-old animals. Most of these genes were similar in expression between infected 16- and 85-week-old animals, however some genes, including Ifitm3, Apoe and Fth1, were expressed at significantly higher levels in aged infected microglia versus those derived from younger adult animals. We validated these results in separate cohorts via qRT-PCR for representative homeostatic and activated genes, P2ry12 and Lgals3bp, respectively (Figure 1B). Lgals3bp mRNA was significantly increased in the cortex and cerebellum in response to aging or after WNV infection. Notably, WNV infection also induced Lgals3bp mRNA in the hippocampus. P2ry12 mRNA remained stable in response to these stimuli (Figure 1 B).

3.2. Spatial Imaging Reveals Infection and Aging-Dependent Transcriptomic Changes in Mouse Brain

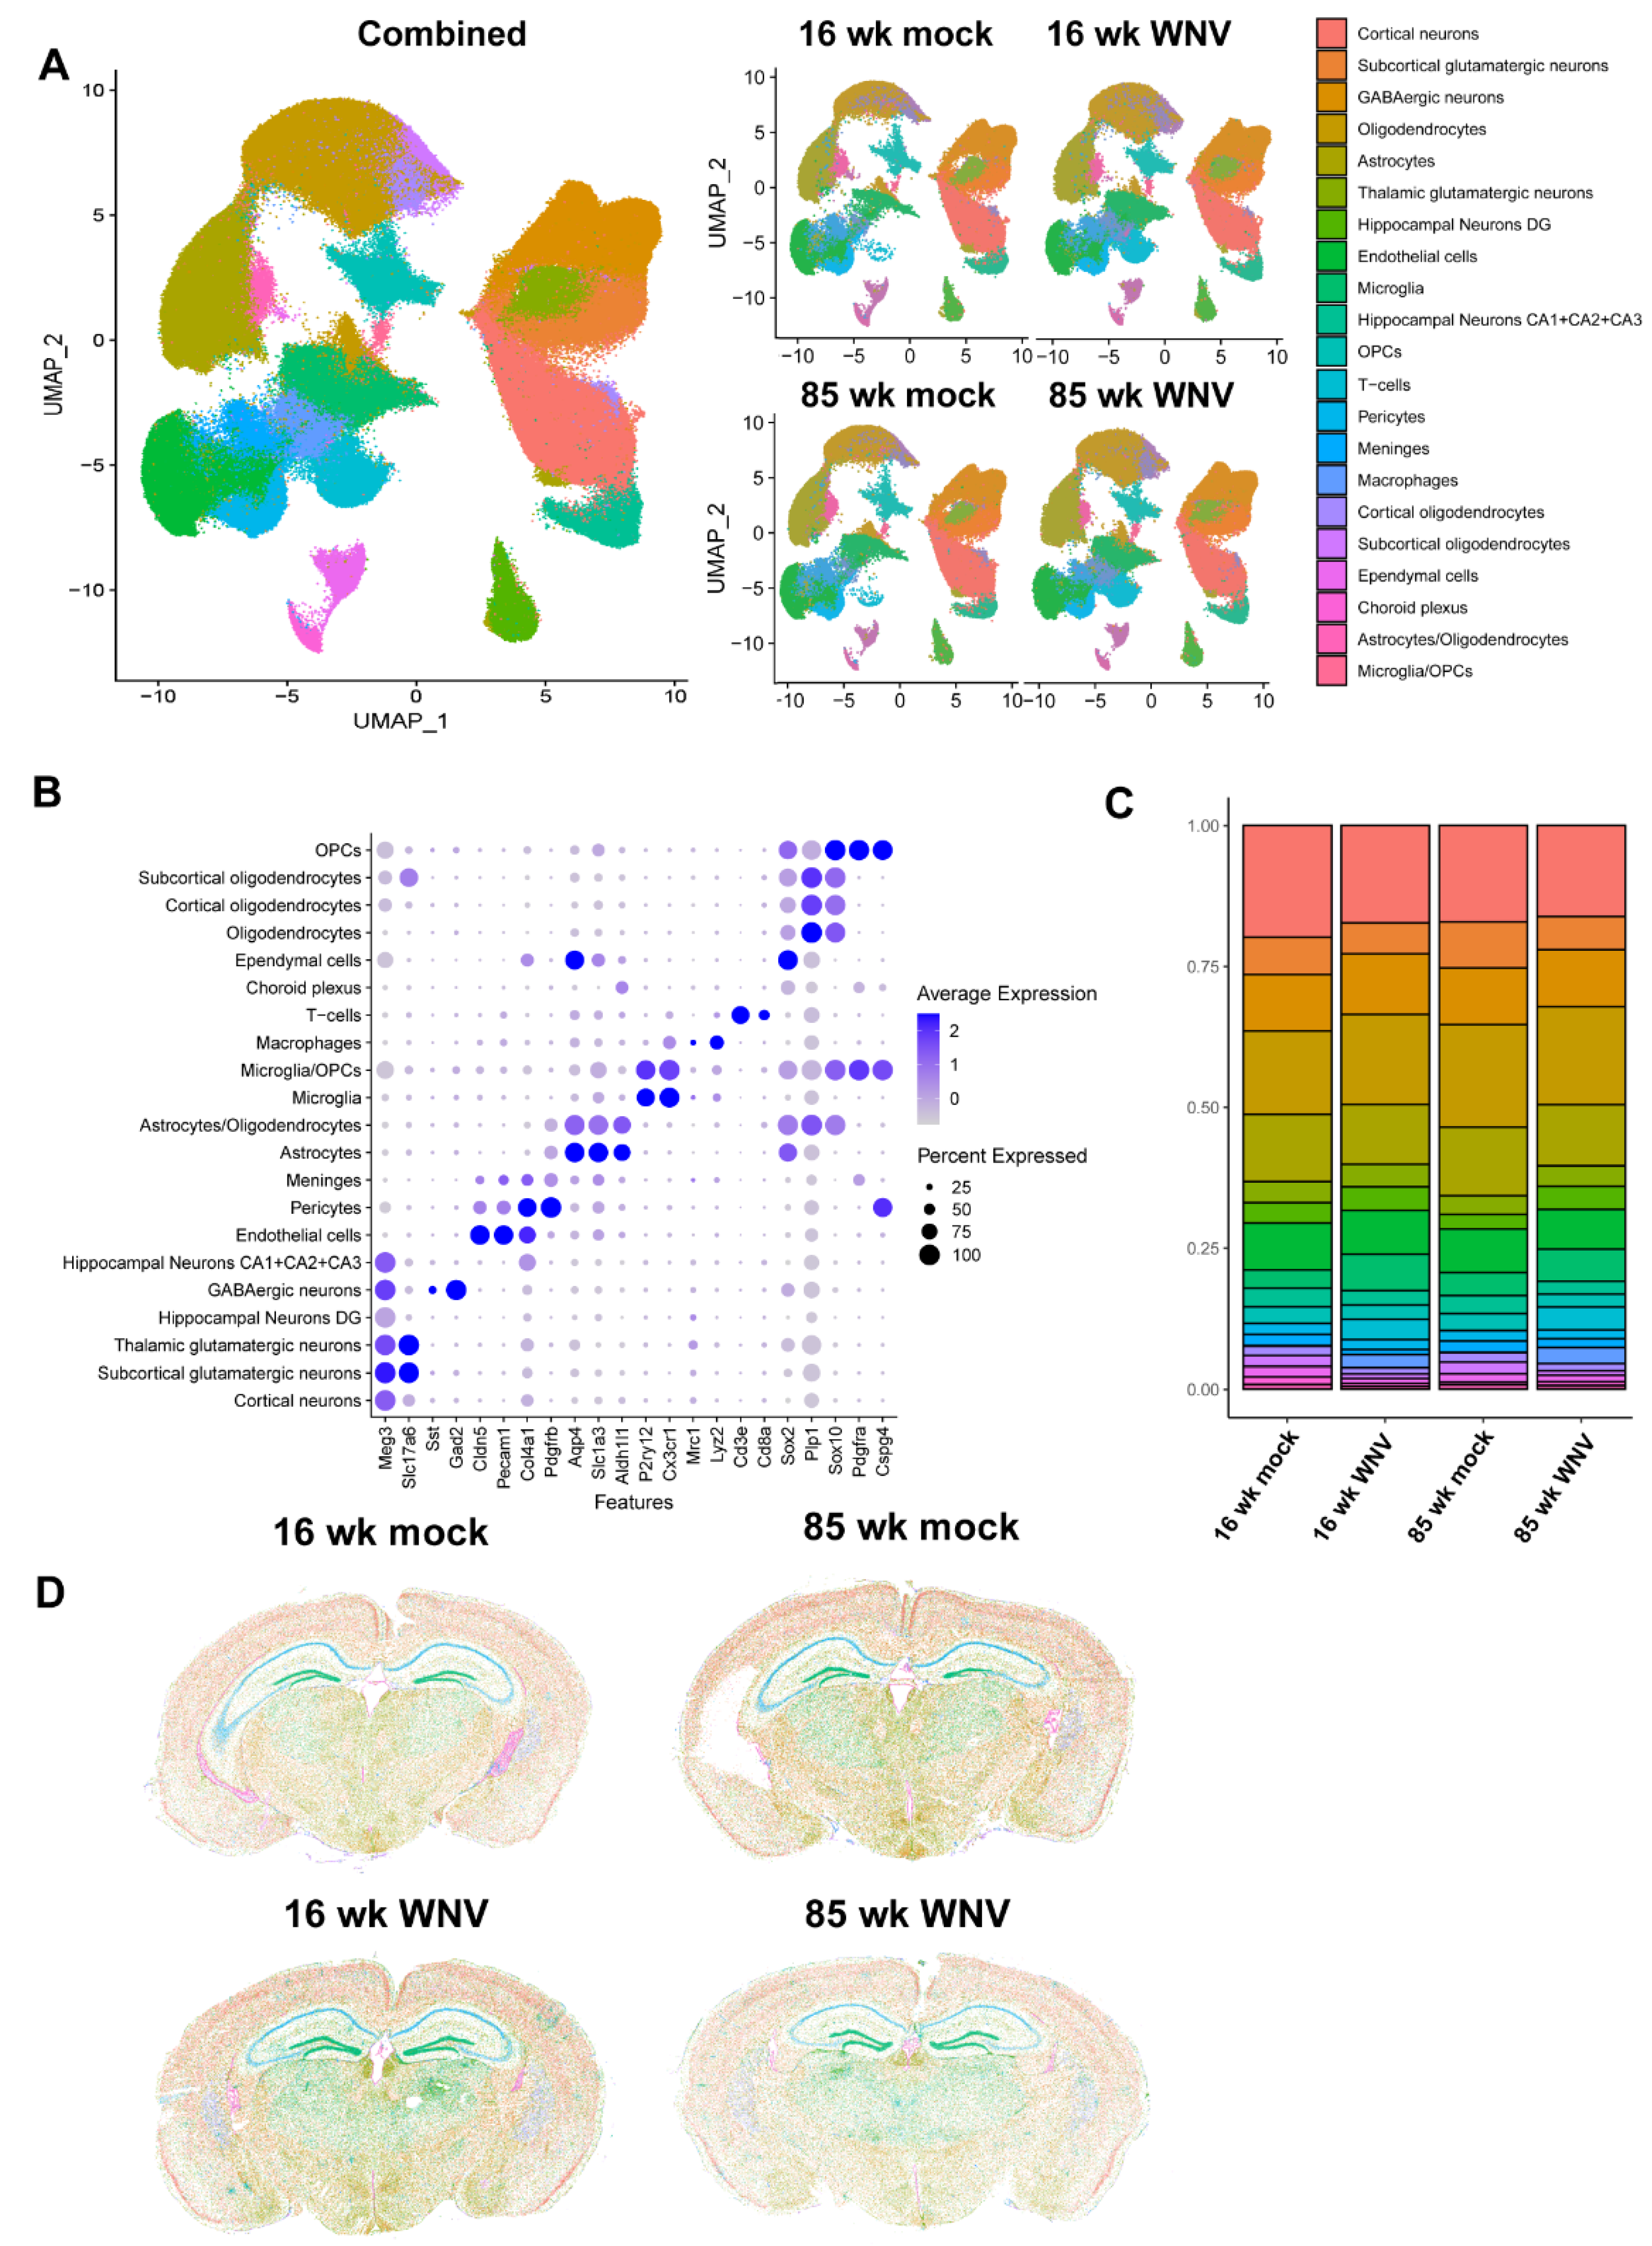
To deeper profile infection- and age-dependent changes in mouse brain, we used spatial transcriptomics and a custom designed panel consisting of 426 mouse genes involved in inflammatory response, aging, and senescence, in conjunction with established markers for identifying specific cell types in the mouse CNS. Specifically, the panel included 50 senescent markers of the SenMayo gene set [25], as well as a number of interferon-stimulated genes (ISGs) such as Ifi204, Ifitm2, Ifitm3, Ifit1 and others. Analyses of forebrains obtained from WNV- or mock infected, 16- or 85-week animals isolated at 30 DPI identified 20 cell clusters in coronal sections (Figure 2A) using a custom panel of markers for each cell type (Figure 2B). Identified frequency of each cell type (Figure 2C) and UMAP clustering analysis (Figure 2D) revealed expansion of microglia and oligodendrocytes in aged mice, as previously reported [26,27]. WNV infection resulted in expanded microglial populations and CD8+ T cell infiltration. We then used SenMayo gene module score to identify senescent cells in all 4 groups of samples (Supplementary Figure S1). This analysis revealed an increase in the fractions of senescent microglia and astrocytes in aged and infected samples, with aged infected samples having the highest fraction of senescent cells. Overall, these data suggest that a neuroinflammatory stimulus can promote accelerated acquisition of senescent phenotypes in glial cells, with astrocytes, microglia, and oligodendrocyte precursor cells (OPCs) being most affected.

3.3. Lgals3bp mRNA Is Broadly Expressed in the CNS by Microglia, Astrocytes, Neurons and, Most Prominently, by Ependymal Cells and the Choroid Plexus

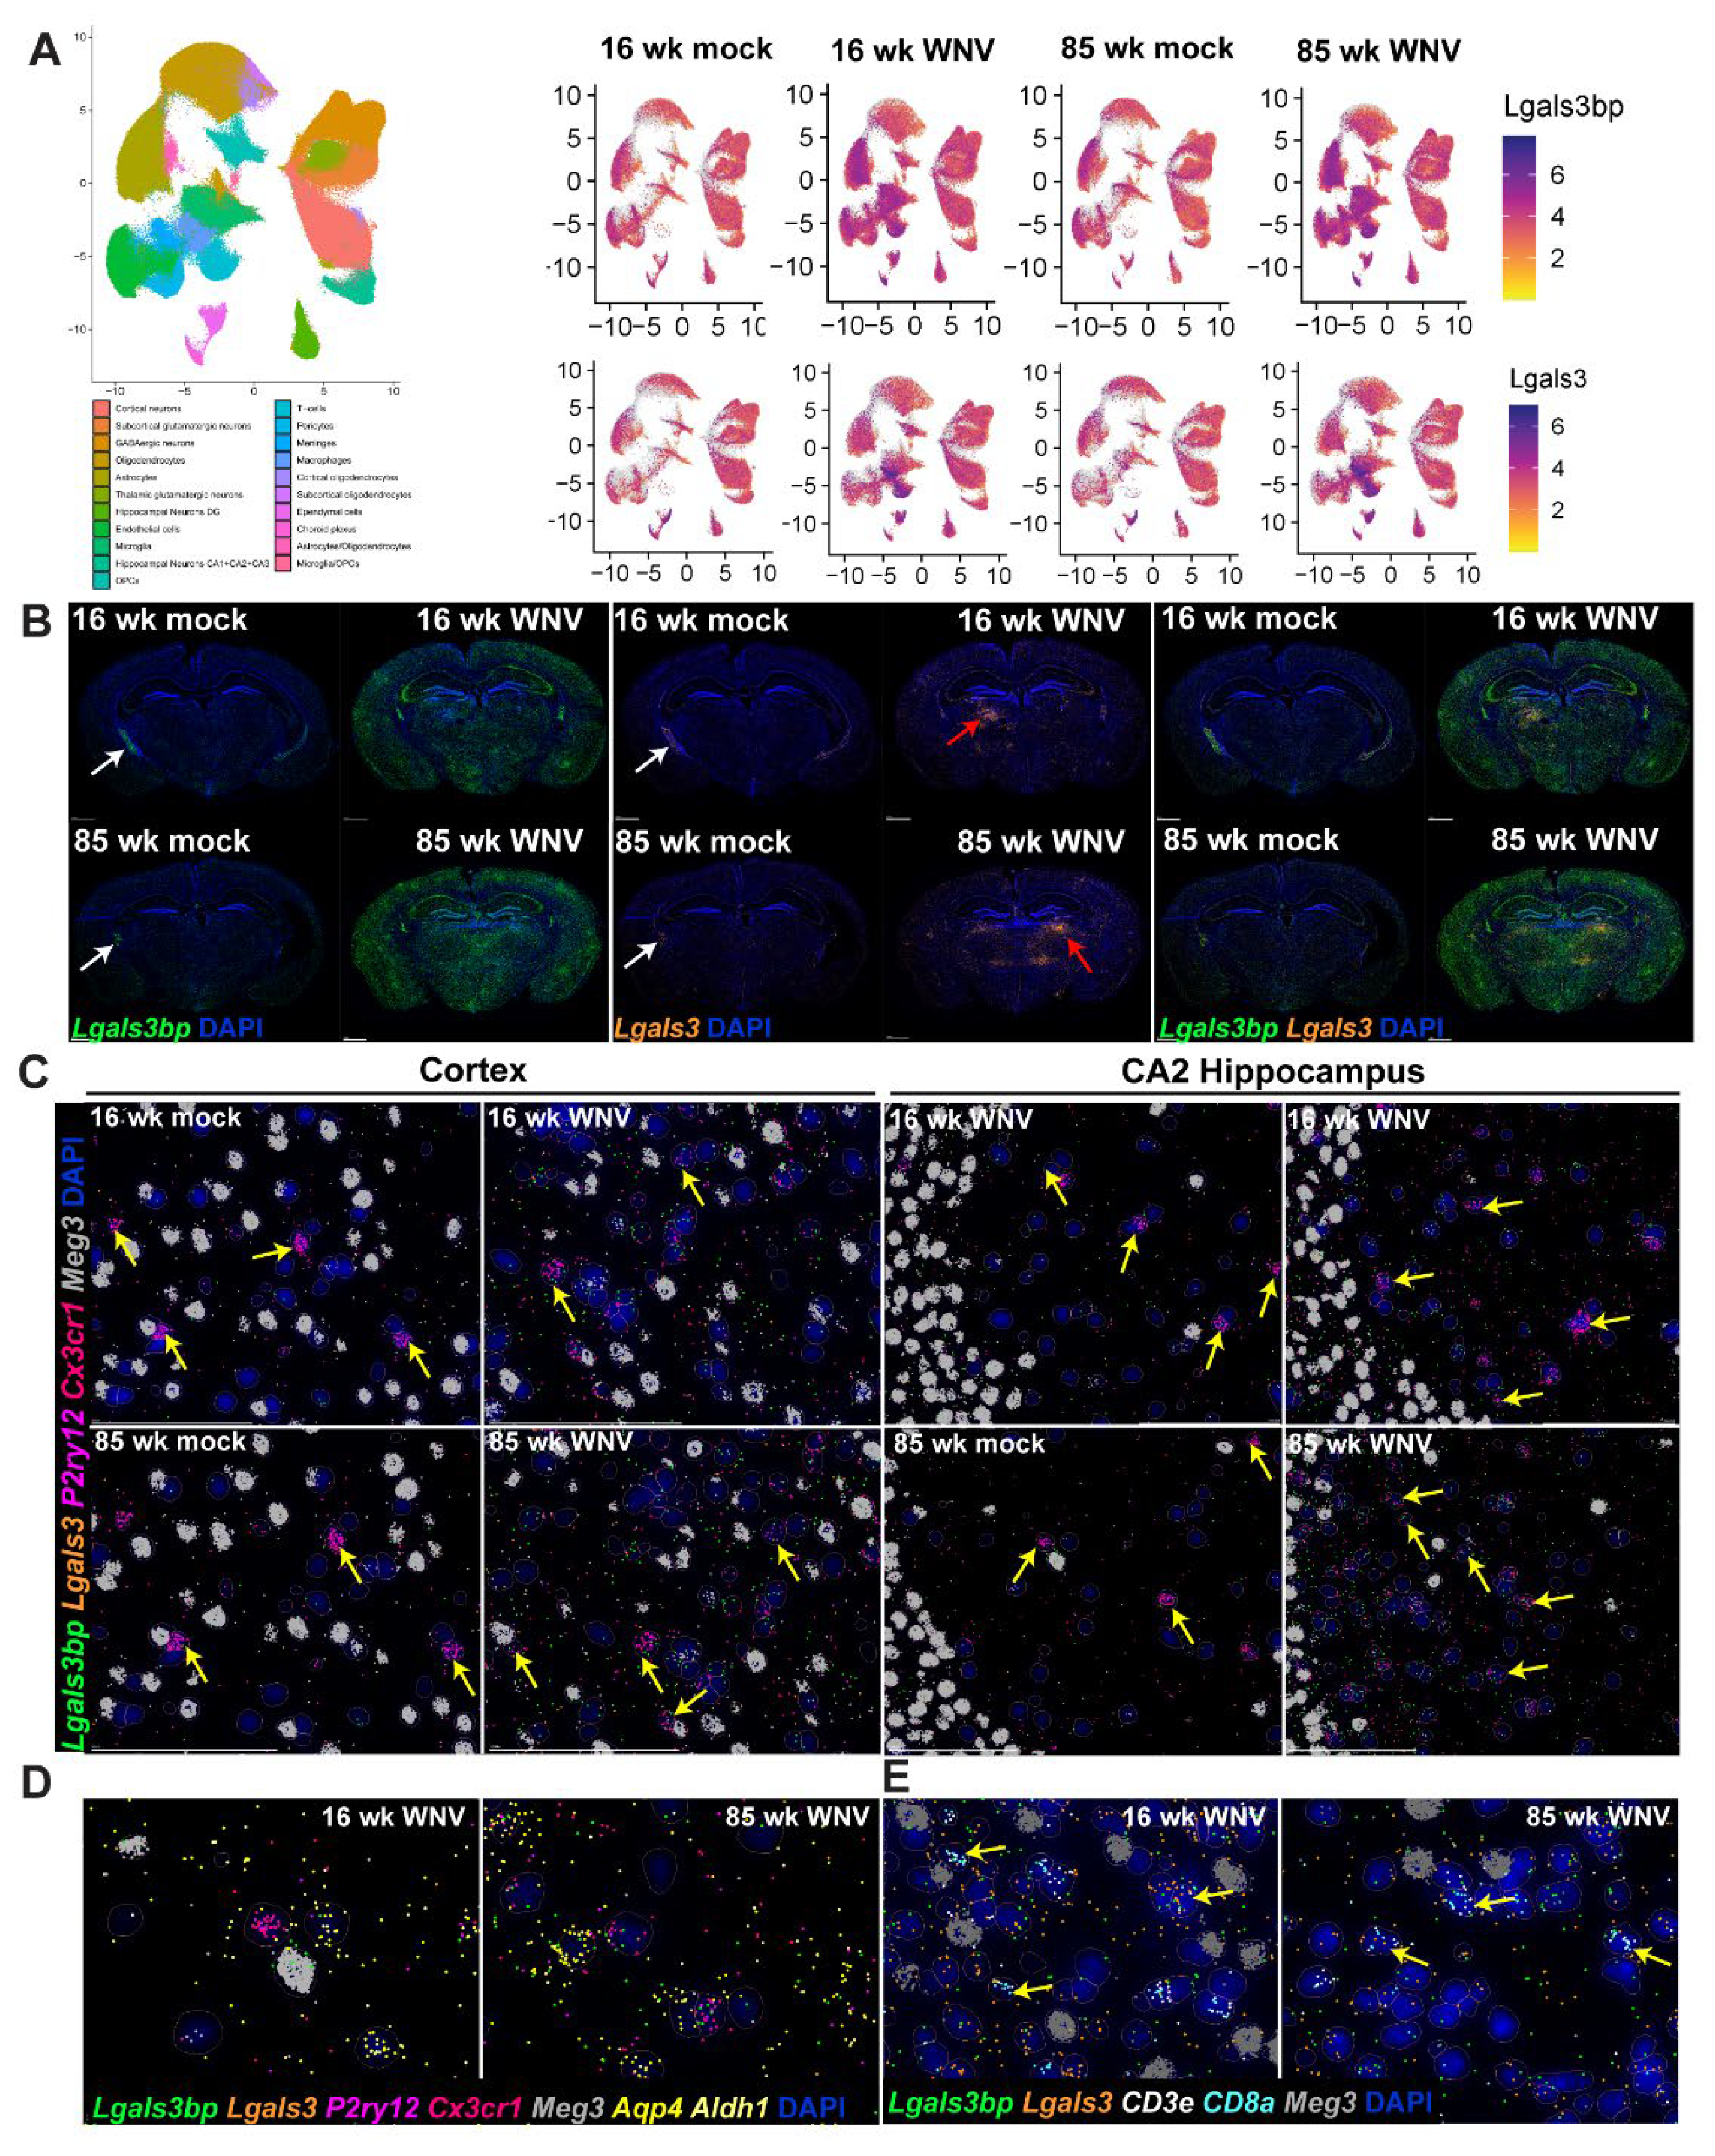
Using spatial imaging data, we next established the pattern of Lgals3bp expression in brains of 16- and 85-week-old mock- or WNV-infected animals. UMAP scatterplots (Figure 3A) combined with visualization of spatial imaging data (Figure 3B) demonstrate that Lgals3bp mRNA is expressed in the CNS by microglia, astrocytes, and neurons. Highest expression levels of Lgals3bp in the absence of WNV-infection were found in the ependymal cells and the choroid plexus (white arrows, Figure 3B, left panel). At 30 days post WNV infection, Lgals3bp expression is significantly increased throughout the brain, with cortex, hippocampus (specifically the CA2 region), and the subcortical white matter all expressing higher levels than uninfected controls (Figure 3B, left panel). Steady state expression of Lgals3 (Galectin 3) mRNA, to which LGALS3BP is a binding partner, is considerably more restricted, with ependymal cells and the choroid plexus expressing the highest amounts (Figure 3C, middle panel). WNV infection also results in increased Lgals3 expression, but compared to Lgals3bp, the pattern of expression is less diffuse and more concentrated near local foci of inflammation (Figure 3B, middle panel, red arrows). Homeostatic microglia, identified by markers Cx3cr1 and P2ry12, in the cerebral cortex (Figure 3C, left panel) expressed limited, but detectable amount of Lgals3bp. WNV infection results in a visibly higher fraction of Lgals3bp-expressing microglia (Figure 3C, yellow arrowheads), especially in aged 85-week animals. Similar findings were observed in the CA2 region of the hippocampus of mock-infected and WNV-infected animals. Neurons, identified by expression of Meg3 mRNA, also expressed Lgals3bp and Lgals3 (Figure 3D). Aldh1+Aqp4+ astrocytes were also notable for relatively higher levels of Lgals3bp expression, especially in WNV-infected samples, and were often found in close proximity to neurons or Lgals3bp-expressing microglia. Upon closer examination of persistent inflammatory foci, notable for a significant increase in Lgals3 expression (see Figure 3B, middle panel), we detected numerous infiltrating CD8 T cells, identified by expression of CD8a and CD3e markers (Figure 3E). These infiltrating T cells often expressed both Lgals3bp and Lgals3, and were proximal to neurons, which also expressed both of these molecules. Overall, these findings establish a pattern of Lgals3bp expression in the CNS at baseline, as well as after WNV infection, and indicate roles for Lgals3bp in recovery from WNV encephalitis.

3.4. WNV Infection of Lgals3bp-/- C57BL6/J Mice Exhibit Increased Severity of Infection without Differences in Virologic Control or Survival

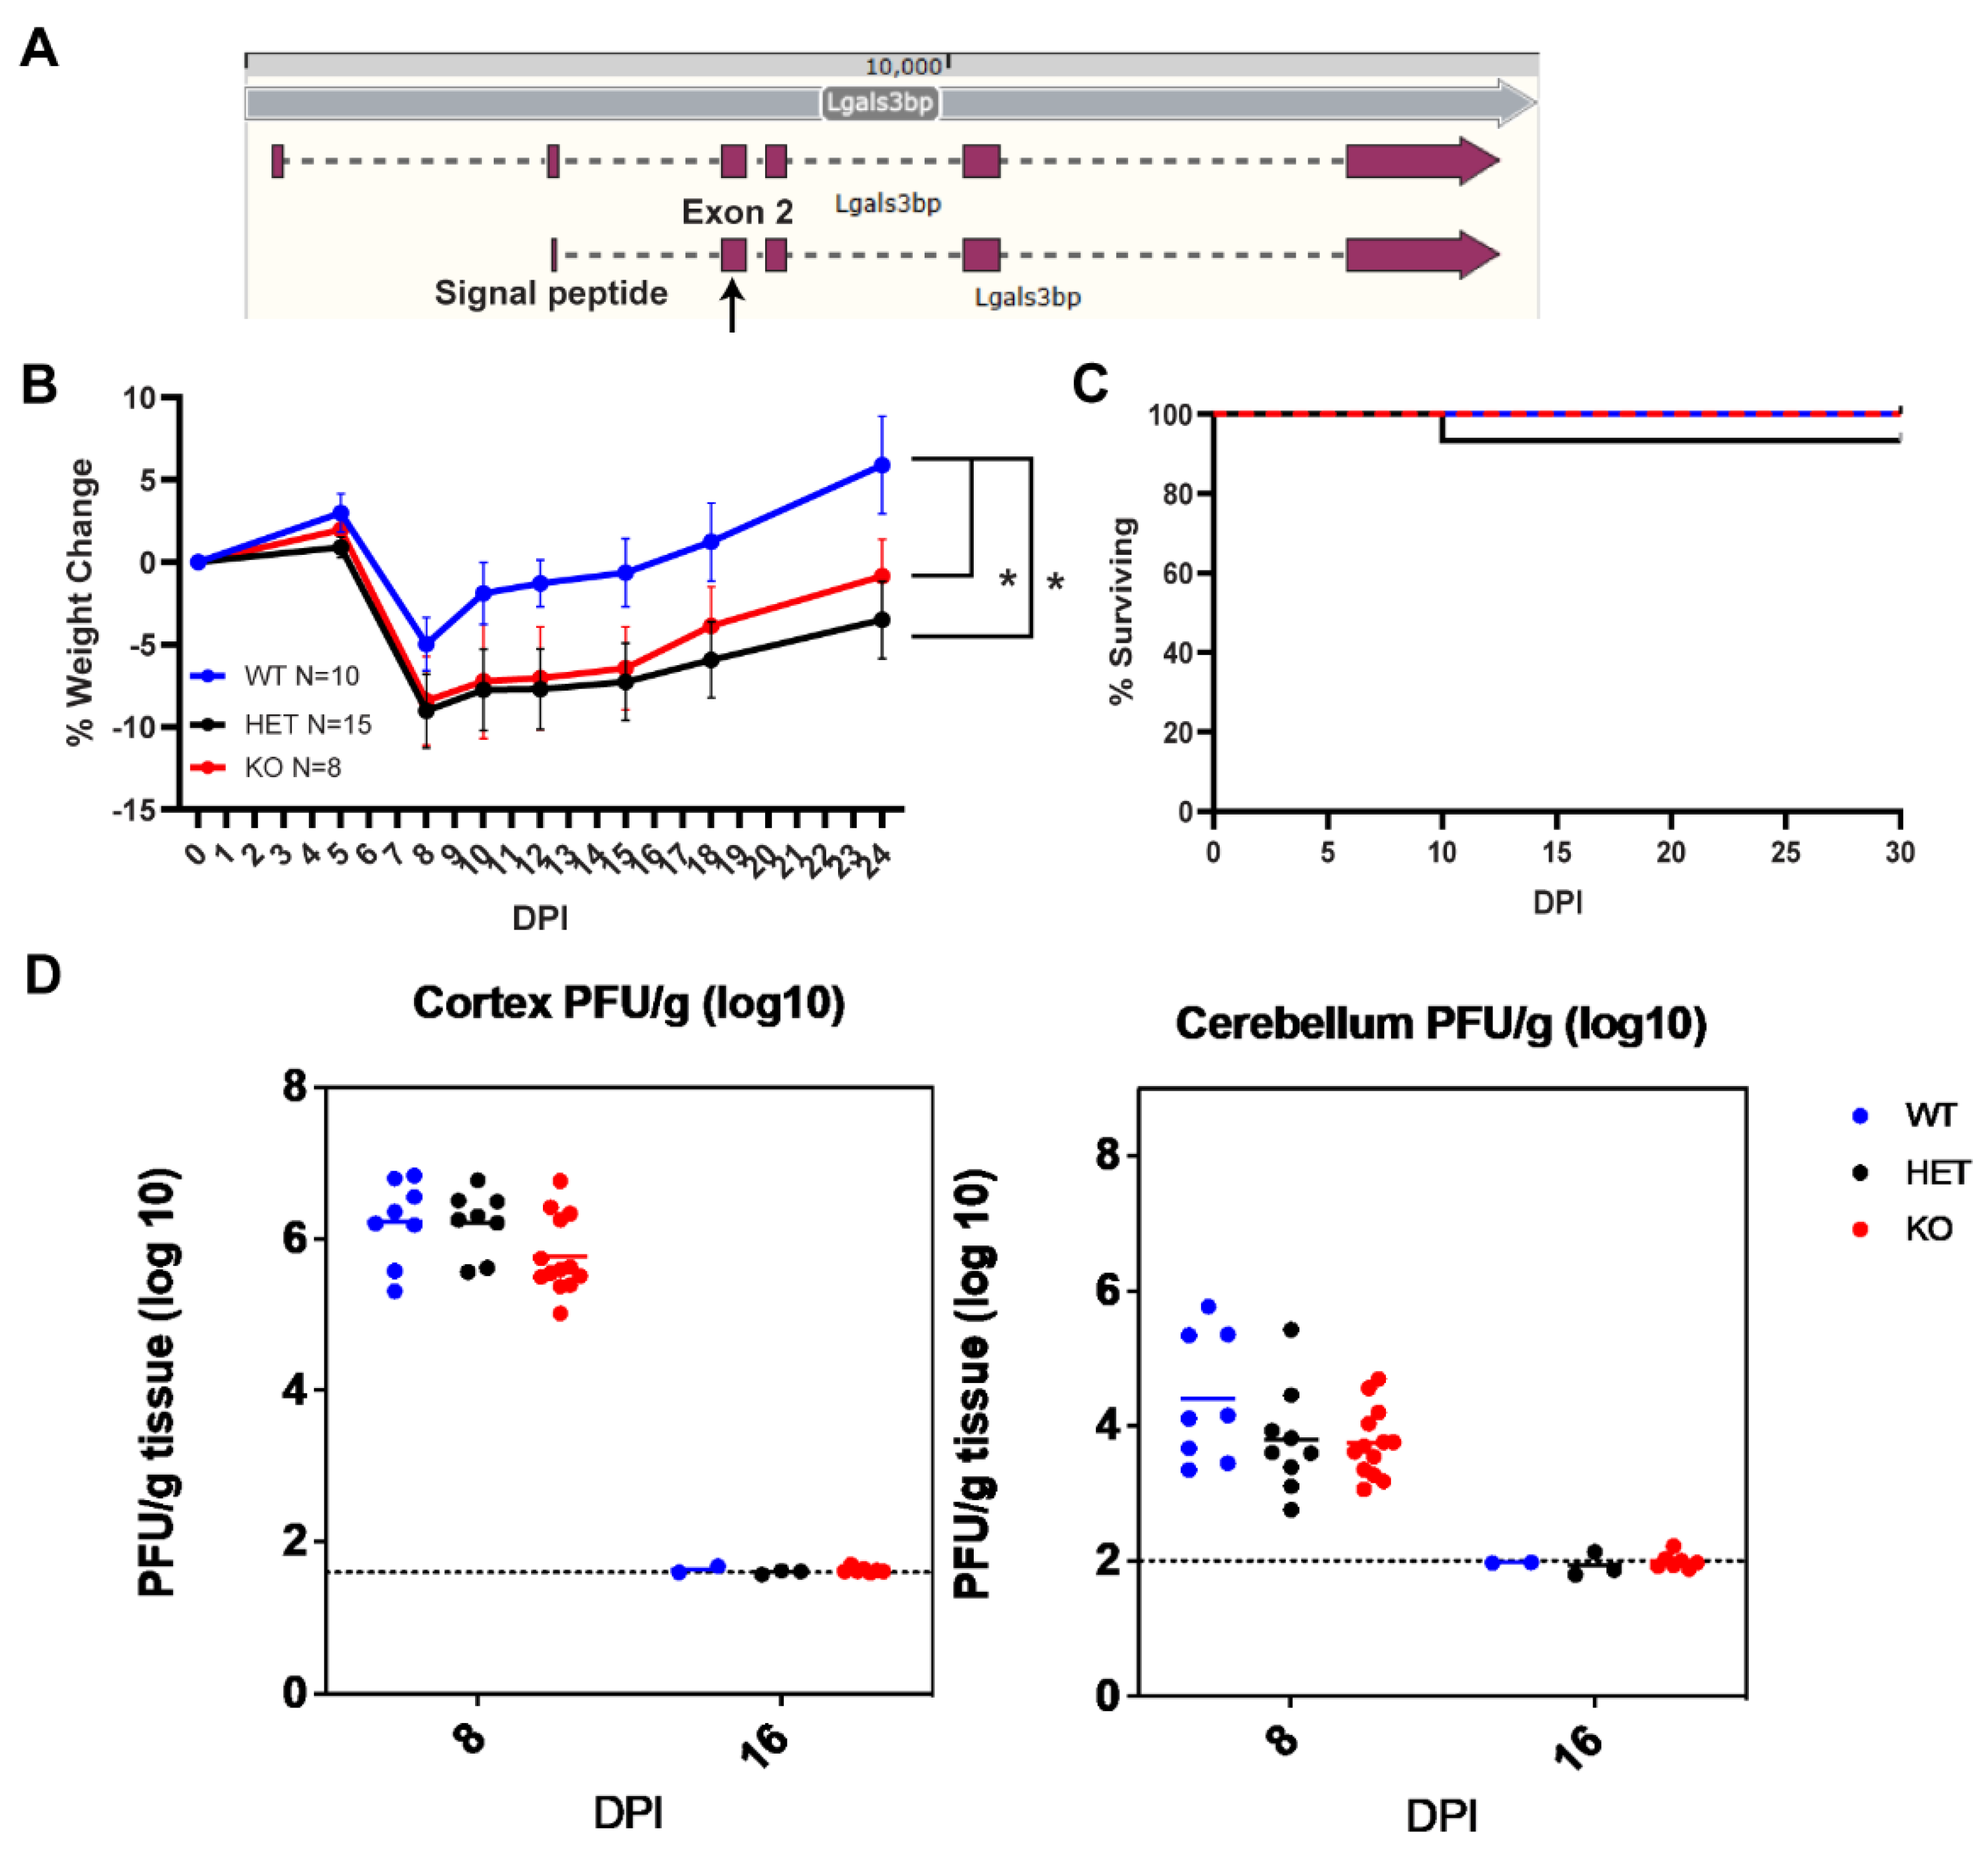
To determine whether Lgals3bp impacts acute infection with WNV, we generated Lgals3bp-/- on the C57BL6/J background by targeting exon 2 of Lgals3bp gene using CRISPR-Cas9 to induce a frameshifting mutation (Figure 4A). Selected founder animals were backcrossed to wild type C57BL6/J animals to address any potential mosaicism, with each generation genotyped via next generation sequencing to identify homozygous mutations in the Lgals3bp gene. In addition, qRT-PCR of RNA obtained from brains of these mice confirmed more than a 90% decrease in Lgals3bp mRNA (Supplemental Figure S2). These Lgals3bp-/-, Lgals3bp+/- and wild-type (WT) C57BL6/J mice were infected with WNV at 8 weeks old and evaluated for survival and weight loss. This analysis revealed that, although Lgals3bp-/- and Lgals3bp+/- mice lost significantly more weight compared to their WT littermates (Figure 3B), there were no differences in survival, CNS viral titers, and time to clearance between the genotypes (Figure 3C, D).

3.5. Lgals3bp-/- C57BL6/J Mice Exhibit More Homeostatic Microglia and Reduced Neuroinflammation during WNV Infection

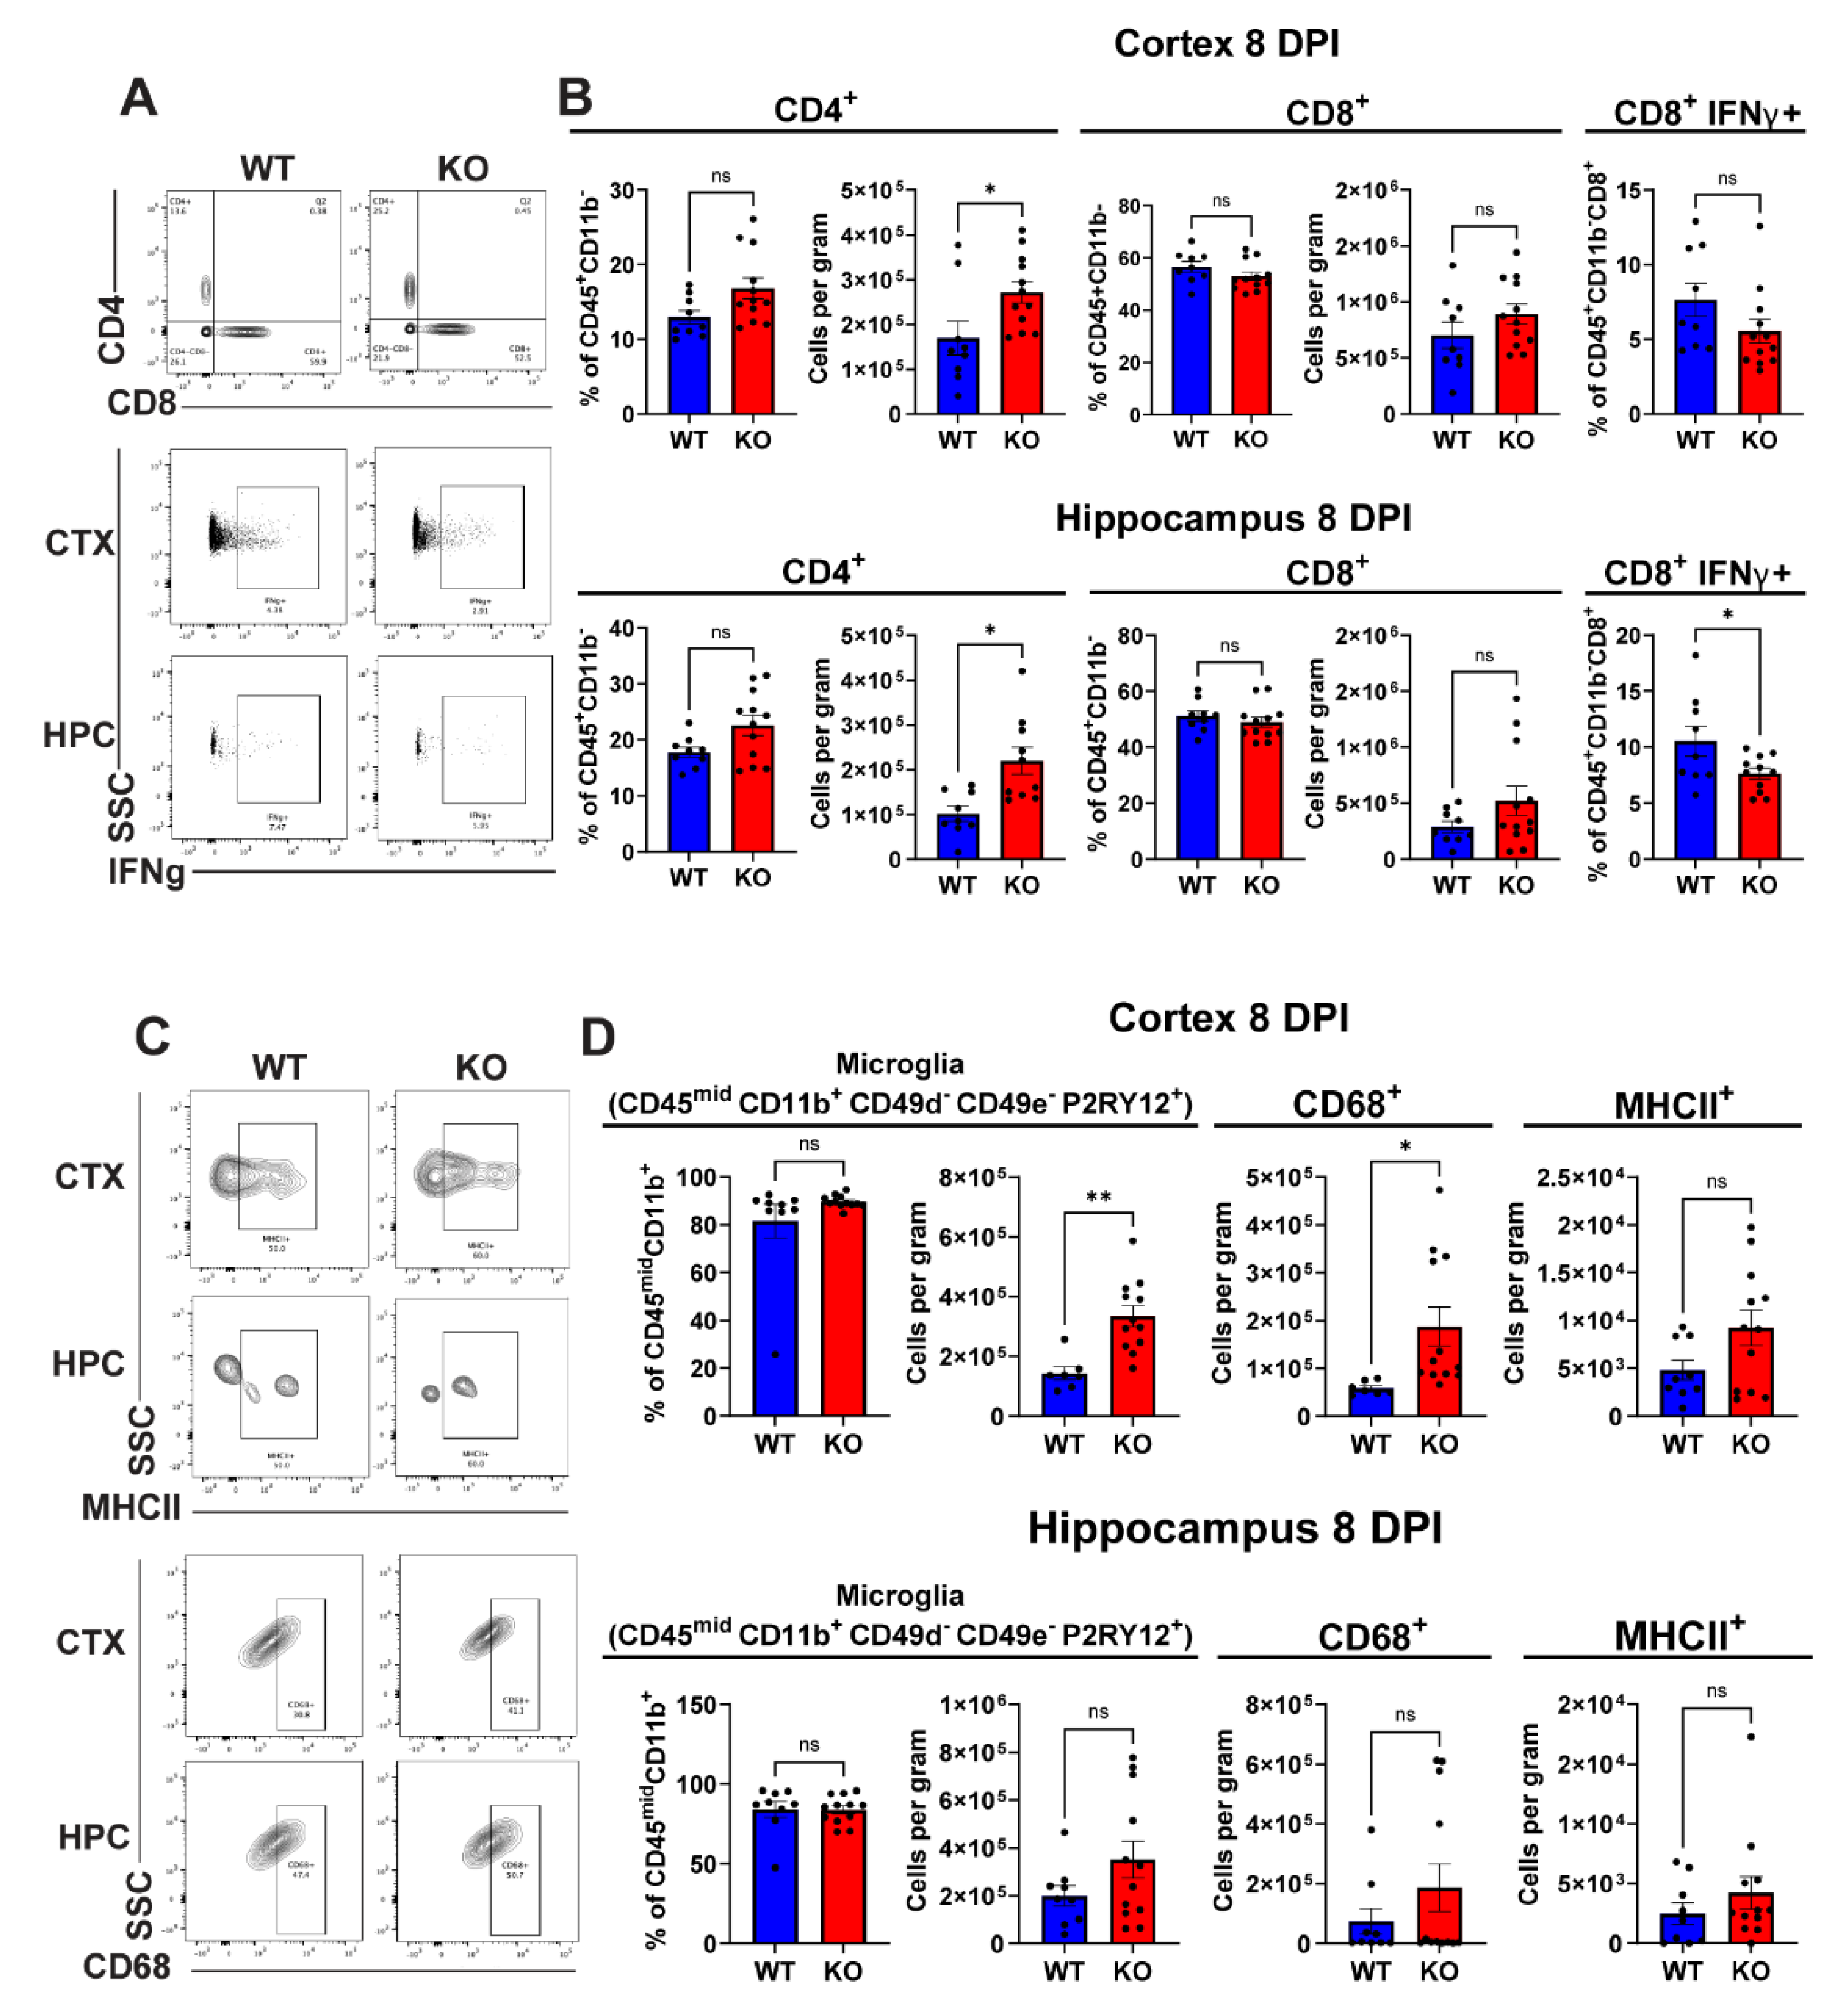
Because severity of illness during viral encephalitis can be due to the extent of CNS inflammation, we analyzed mononuclear cell infiltration and microglial phenotype within the forebrains of WNV-infected 8-week-old Lgals3bp-/- versus WT mice at 8 DPI. Analysis of lymphoid cells (Figure 5A-B) revealed a significant increase in total number, but not in the fraction of CD4+ T cells in both cortex and hippocampus of Lgals3bp-/- mice compared to similarly infected WT littermates. We also detected a significant reduction of IFNγ+CD8+ T cells in the hippocampi of Lgals3bp-/- mice compared with WT animals. A similar trend was observed in the cortex, but the results were not statistically significant. Overall numbers of CD8 T cells were not significantly reduced, and neither were numbers of TNF+ or WNV-specific T cells, or numbers of natural killer cells (Supplementary Figure S3). Significant increases in CD45midCD11b+ CD49d- CD49e-P2ry12+ microglia were detected within the cerebral cortices, but not the hippocampi, of Lgals3bp-/- mice compared with WT animals (Figure 5C-D). These microglia were also notable for higher expression of CD68, a marker of microglia phagocytic activity, but not MHC-II. Overall, these data indicate that Lgals3bp deficiency results in reduced inflammation, as well as leads to an increased number of homeostatic microglia with a potentially higher phagocytic capacity.

4. Discussion

Aging is a complex biological process often accompanied by chronic low-grade inflammation, a phenomenon that has been referred to as “inflammaging” [28]. While most of the existing research aims at trying to better understand the inflammatory phenotypes that occur with aging, little is known about the capacity of an inflammatory stimulus to induce, or accelerate, acquisition of an aged or senescent phenotype. Some recent studies, however, have made significant progress: for example, Breen et al. examined epigenetic changes during HIV infection, and found that HIV infection leads to an approximately 2-5 years’ worth of accelerated senescence measured by alterations in the epigenome [29].
Accelerated epigenetic aging was also reported for those living in areas where leprosy is endemic [30] and, more recently, in patients after SARS-CoV-2 infection [31]. In this study, we used spatial imaging, flow cytometry and RNA sequencing to evaluate neuroinflammatory changes that occur following infection with WNV and to compare them to those that occur with aging. We focused on LGALS3BP, a potential novel marker at the intersection of senescence and inflammation and found that Lgals3bp levels are elevated during aging and WNV-induced neuroinflammation. We then genetically ablated Lgals3bp in mice, which lead to an increase in the number of homeostatic microglia and CD4+ T cells in the brain combined with a decrease in IFNγ+ CD8+ T cells in the hippocampus, an area of the brain important for memory and neurogenesis, and particularly affected by WNV infection [6,32].
We began by comparing the dataset generated by single cell RNA-sequencing of WNV-activated microglia [7] to a published dataset of RNA-sequencing performed on aged microglia [22], which revealed broad similarities between WNV- and aging-induced transcriptomic changes in microglia: genes induced by microglial activation in the context of WNV infection were also induced by aging, while homeostatic microglial genes maintained consistent expression levels between the two conditions. Microglial activation has been previously reported during aging and recovery from WNV in mice [1,5,7,33,34,35], with a number of inflammation-induced genes being implicated in both of these conditions.
Next, we used spatial transcriptomics to profile WNV- and aging-induced changes in the mouse brain using a custom panel of 426 genes that included markers for CNS cell types, inflammatory molecules, and senescence genes, the latter with a particular focus on genes included in the SenMayo dataset [22]. This technology has recently been used to analyze changes in the mouse brain during aging [36], and it has been observed that during the course of aging, non-neuronal cell types, especially astrocytes and microglia, undergo more pronounced changes in gene expression and spatial organization compared to neurons. When mice in this study were systemically administered lipopolysaccharide injection (LPS) to induce a severe inflammatory response, the authors noted both similarities and differences in cell-activation patterns produced by inflammation and aging. We also observed expansion of microglia and astrocytes with aging, and computing a SenMayo gene score for all cell types revealed an increase in senescent astrocytes and microglia, with mock uninfected samples having fewest senescent cells, while aged infected samples had the highest fraction of senescent cells. These results, if confirmed by further studies, show that a neuroinflammatory stimulus can promote accelerated senescence in certain CNS cell types. Care needs to be taken, however, when interpreting this data, as the number of samples is low and whether this aged phenotyped is sustained long-term is unknown.
To address the function of Lgals3bp, we genetically ablated Lgals3bp in the C57BL6/J mouse strain. Another mouse with global gene deletion of Lgals3bp had been previously generated [37,38], but was unavailable. The previously published Lgals3bp-/- was generated by targeting exon 3 of the Lgals3bp gene in a C57BL6/N mouse, while our mouse was produced by targeting exon 2 and was on the C57BL6/J background. C57BL6/J and C57BL6/N substrains are quite similar, but not identical, so care needs to be taken when comparing results obtained using different murine substrains. We chose the C57BL6/J to be consistent when comparing any new data to data obtained in our laboratory using our WNV infection and recovery model. WNV infection resulted in higher weight loss in Lgals3bp-/- and Lgals3bp-/+ animals than wild-type littermates and displayed a similar amount of weight loss to each other. but no increase in lethality or CNS viral titers. Previously generated Lgals3bp-/- animals were noted for increased susceptibility to infections [11], however, an attenuated WNV strain was used in our study, which can potentially explain the lack of increased lethality or higher viral titers. This can potentially be addressed in the future experiments by using another WNV strain, such as New York 1999, which we have previously used to show that aged mice are more susceptible to WNV infection [39].
Further analysis of neuroinflammation in WNV-infected Lgals3bp-/- mice revealed higher numbers of CD4+ T cells in both cortex and hippocampus compared with wild-type animals. However, a significant reduction of IFNγ+CD8+ T cells in the hippocampi of Lgals3bp-/- mice compared with WT animals was observed, as was an increase in numbers of homeostatic microglia, which reached significance in the cortex. We, and other, previously demonstrated that IFNγ+CD8+ T cells that persist in the forebrain after recovery from RNA viral infections maintain microglial activation, synapse elimination and impairments in spatial learning and memory [8]. Thus, the decrease in neuroinflammation in the context of Lgals3bp deletion suggests a possible target for preventing post-infectious cognitive effects that are similar to those induced by aging. Future studies examining neural correlates of learning and memory are needed to determine whether Lgals3bp decelerates microglial activation phenotypes and their consequences during aging or after viral infections.

Supplementary Materials

The following supporting information can be downloaded at the website of this paper posted on Preprints.org. Figure S1: title; Table S1: title; Video S1: title.

Author Contributions

Conceptualization: AA and RSK; software: VDL, LF, RM and DPS; validation: AA, SA, VDL, LF and RM; formal analysis: AA, SA, VDL, LF and RM; investigation: AA, SA, VDL, LF and RM, resources: RSK and DPS; data curation, X.X.; writing—original draft preparation: AA and RSK. Writing—review and editing: AA and RSK; visualization: AA, SA, VDL, LF and RM; supervision: RSK, DPS; funding acquisition: RSK. All authors have read and agreed to the published version of the manuscript.

Funding

This research was funded by NINDS, grant number R35NS122310 (to R.S.K.).

Acknowledgments

We thank the Genome Engineering & Stem Cell Center (GESC@MGI) at the Washington University in St. Louis for the service of creating mouse KO.

References

  1. Li, X.; Li, Y.; Jin, Y.; Zhang, Y.; Wu, J.; Xu, Z.; Huang, Y.; Cai, L.; Gao, S.; Liu, T.; et al. Transcriptional and Epigenetic Decoding of the Microglial Aging Process. Nat Aging 2023, 3, 1288–1311. [Google Scholar] [CrossRef] [PubMed]
  2. Hart, J.; Tillman, G.; Kraut, M.A.; Chiang, H.-S.; Strain, J.F.; Li, Y.; Agrawal, A.G.; Jester, P.; Gnann, J.W.; Whitley, R.J.; et al. West Nile Virus Neuroinvasive Disease: Neurological Manifestations and Prospective Longitudinal Outcomes. BMC Infectious Diseases 2014, 14, 248. [Google Scholar] [CrossRef] [PubMed]
  3. Patel, H.; Sander, B.; Nelder, M.P. Long-Term Sequelae of West Nile Virus-Related Illness: A Systematic Review. Lancet Infect Dis 2015, 15, 951–959. [Google Scholar] [CrossRef]
  4. Szretter, K.J.; Daniels, B.P.; Cho, H.; Gainey, M.D.; Yokoyama, W.M.; Jr, M.G.; Virgin, H.W.; Klein, R.S.; Sen, G.C.; Diamond, M.S. 2′-O Methylation of the Viral mRNA Cap by West Nile Virus Evades Ifit1-Dependent and -Independent Mechanisms of Host Restriction In Vivo. PLOS Pathogens 2012, 8, e1002698. [Google Scholar] [CrossRef] [PubMed]
  5. Vasek, M.J.; Garber, C.; Dorsey, D.; Durrant, D.M.; Bollman, B.; Soung, A.; Yu, J.; Perez-Torres, C.; Frouin, A.; Wilton, D.K.; et al. A Complement–Microglial Axis Drives Synapse Loss during Virus-Induced Memory Impairment. Nature 2016, 534, 538–543. [Google Scholar] [CrossRef] [PubMed]
  6. Garber, C.; Vasek, M.J.; Vollmer, L.L.; Sun, T.; Jiang, X.; Klein, R.S. Astrocytes Decrease Adult Neurogenesis during Virus-Induced Memory Dysfunction via Interleukin-1. Nat Immunol 2018, 19, 151–161. [Google Scholar] [CrossRef] [PubMed]
  7. Rosen, S.F.; Soung, A.L.; Yang, W.; Ai, S.; Kanmogne, M.; Davé, V.A.; Artyomov, M.; Magee, J.A.; Klein, R.S. Single-Cell RNA Transcriptome Analysis of CNS Immune Cells Reveals CXCL16/CXCR6 as Maintenance Factors for Tissue-Resident T Cells That Drive Synapse Elimination. Genome Medicine 2022, 14, 108. [Google Scholar] [CrossRef] [PubMed]
  8. Garber, C.; Soung, A.; Vollmer, L.L.; Kanmogne, M.; Last, A.; Brown, J.; Klein, R.S. T Cells Promote Microglia-Mediated Synaptic Elimination and Cognitive Dysfunction during Recovery from Neuropathogenic Flaviviruses. Nat Neurosci 2019, 22, 1276–1288. [Google Scholar] [CrossRef] [PubMed]
  9. Capone, E.; Iacobelli, S.; Sala, G. Role of Galectin 3 Binding Protein in Cancer Progression: A Potential Novel Therapeutic Target. J Transl Med 2021, 19, 405. [Google Scholar] [CrossRef]
  10. Dufrusine, B.; Capone, E.; Ponziani, S.; Lattanzio, R.; Lanuti, P.; Giansanti, F.; De Laurenzi, V.; Iacobelli, S.; Ippoliti, R.; Mangiola, A.; et al. Extracellular LGALS3BP: A Potential Disease Marker and Actionable Target for Antibody–Drug Conjugate Therapy in Glioblastoma. Mol Oncol 2023, 17, 1460–1473. [Google Scholar] [CrossRef]
  11. Xu, G.; Xia, Z.; Deng, F.; Liu, L.; Wang, Q.; Yu, Y.; Wang, F.; Zhu, C.; Liu, W.; Cheng, Z.; et al. Inducible LGALS3BP/90K Activates Antiviral Innate Immune Responses by Targeting TRAF6 and TRAF3 Complex. PLoS Pathog 2019, 15, e1008002. [Google Scholar] [CrossRef]
  12. Grassadonia, A.; Graziano, V.; Pagotto, S.; Veronese, A.; Giuliani, C.; Marchisio, M.; Lanuti, P.; De Tursi, M.; D’Egidio, M.; Di Marino, P.; et al. Tgf-Β1 Transcriptionally Promotes 90K Expression: Possible Implications for Cancer Progression. Cell Death Discov. 2021, 7, 1–13. [Google Scholar] [CrossRef] [PubMed]
  13. Costa, J.; Pronto-Laborinho, A.; Pinto, S.; Gromicho, M.; Bonucci, S.; Tranfield, E.; Correia, C.; Alexandre, B.M.; de Carvalho, M. Investigating LGALS3BP/90 K Glycoprotein in the Cerebrospinal Fluid of Patients with Neurological Diseases. Sci Rep 2020, 10, 5649. [Google Scholar] [CrossRef]
  14. Kyrousi, C.; O’Neill, A.C.; Brazovskaja, A.; He, Z.; Kielkowski, P.; Coquand, L.; Di Giaimo, R.; D’ Andrea, P.; Belka, A.; Forero Echeverry, A.; et al. Extracellular LGALS3BP Regulates Neural Progenitor Position and Relates to Human Cortical Complexity. Nat Commun 2021, 12, 6298. [Google Scholar] [CrossRef] [PubMed]
  15. Shi, P.-Y.; Tilgner, M.; Lo, M.K.; Kent, K.A.; Bernard, K.A. Infectious cDNA Clone of the Epidemic West Nile Virus from New York City. Journal of Virology 2002, 76, 5847–5856. [Google Scholar] [CrossRef]
  16. Zhou, Y.; Ray, D.; Zhao, Y.; Dong, H.; Ren, S.; Li, Z.; Guo, Y.; Bernard, K.A.; Shi, P.-Y.; Li, H. Structure and Function of Flavivirus NS5 Methyltransferase. Journal of Virology 2007, 81, 3891–3903. [Google Scholar] [CrossRef] [PubMed]
  17. Brien, J.D.; Lazear, H.M.; Diamond, M.S. Propagation, Quantification, Detection, and Storage of West Nile Virus. Curr Protoc Microbiol 2013, 31, 15D.3.1–15D.3.18. [Google Scholar] [CrossRef]
  18. Funk, K.E.; Klein, R.S. CSF1R Antagonism Limits Local Restimulation of Antiviral CD8+ T Cells during Viral Encephalitis. J Neuroinflammation 2019, 16, 22. [Google Scholar] [CrossRef]
  19. Sentmanat, M.F.; White, J.M.; Kouranova, E.; Cui, X. Highly Reliable Creation of Floxed Alleles by Electroporating Single-Cell Embryos. BMC Biol 2022, 20, 31. [Google Scholar] [CrossRef]
  20. Advanced Protocols for Animal Transgenesis: An ISTT Manual; Pease, S., Saunders, T.L., Eds.; Springer Protocols Handbooks; Springer: Berlin, Heidelberg, 2011. ISBN 978-3-642-20791-4.
  21. Manipulating the Mouse Embryo : A Laboratory Manual - NLM Catalog - NCBI Available online:. Available online: https://www.ncbi.nlm.nih.gov/nlmcatalog/101622901 (accessed on 22 May 2024).
  22. Keane, L.; Antignano, I.; Riechers, S.-P.; Zollinger, R.; Dumas, A.A.; Offermann, N.; Bernis, M.E.; Russ, J.; Graelmann, F.; McCormick, P.N.; et al. mTOR-Dependent Translation Amplifies Microglia Priming in Aging Mice. J Clin Invest 2021, 131, 132727. [Google Scholar] [CrossRef]
  23. Arutyunov, A.; Klein, R.S. Microglia at the Scene of the Crime: What Their Transcriptomics Reveal about Brain Health. Curr Opin Neurol 2023, 36, 207–213. [Google Scholar] [CrossRef]
  24. Gómez Morillas, A.; Besson, V.C.; Lerouet, D. Microglia and Neuroinflammation: What Place for P2RY12? Int J Mol Sci 2021, 22, 1636. [Google Scholar] [CrossRef] [PubMed]
  25. Saul, D.; Kosinsky, R.L.; Atkinson, E.J.; Doolittle, M.L.; Zhang, X.; LeBrasseur, N.K.; Pignolo, R.J.; Robbins, P.D.; Niedernhofer, L.J.; Ikeno, Y.; et al. A New Gene Set Identifies Senescent Cells and Predicts Senescence-Associated Pathways across Tissues. Nat Commun 2022, 13, 4827. [Google Scholar] [CrossRef] [PubMed]
  26. Antignano, I.; Liu, Y.; Offermann, N.; Capasso, M. Aging Microglia. Cell Mol Life Sci 2023, 80, 126. [Google Scholar] [CrossRef] [PubMed]
  27. Sams, E.C. Oligodendrocytes in the Aging Brain. Neuronal Signal 2021, 5, NS20210008. [Google Scholar] [CrossRef] [PubMed]
  28. Franceschi, C.; Garagnani, P.; Parini, P.; Giuliani, C.; Santoro, A. Inflammaging: A New Immune–Metabolic Viewpoint for Age-Related Diseases. Nat Rev Endocrinol 2018, 14, 576–590. [Google Scholar] [CrossRef] [PubMed]
  29. Breen, E.C.; Sehl, M.E.; Shih, R.; Langfelder, P.; Wang, R.; Horvath, S.; Bream, J.H.; Duggal, P.; Martinson, J.; Wolinsky, S.M.; et al. Accelerated Aging with HIV Occurs at the Time of Initial HIV Infection. iScience 2022, 25. [Google Scholar] [CrossRef] [PubMed]
  30. Durso, D.F.; Silveira-Nunes, G.; Coelho, M.M.; Camatta, G.C.; Ventura, L.H.; Nascimento, L.S.; Caixeta, F.; Cunha, E.H.M.; Castelo-Branco, A.; Fonseca, D.M.; et al. Living in Endemic Area for Infectious Diseases Accelerates Epigenetic Age. Mechanisms of Ageing and Development 2022, 207, 111713. [Google Scholar] [CrossRef] [PubMed]
  31. Cao, X.; Li, W.; Wang, T.; Ran, D.; Davalos, V.; Planas-Serra, L.; Pujol, A.; Esteller, M.; Wang, X.; Yu, H. Accelerated Biological Aging in COVID-19 Patients. Nat Commun 2022, 13, 2135. [Google Scholar] [CrossRef]
  32. Jarrard, L.E. On the Role of the Hippocampus in Learning and Memory in the Rat. Behav Neural Biol 1993, 60, 9–26. [Google Scholar] [CrossRef]
  33. Yoo, H.-J.; Kwon, M.-S. Aged Microglia in Neurodegenerative Diseases: Microglia Lifespan and Culture Methods. Front. Aging Neurosci. 2022, 13. [Google Scholar] [CrossRef] [PubMed]
  34. Malvaso, A.; Gatti, A.; Negro, G.; Calatozzolo, C.; Medici, V.; Poloni, T.E. Microglial Senescence and Activation in Healthy Aging and Alzheimer’s Disease: Systematic Review and Neuropathological Scoring. Cells 2023, 12, 2824. [Google Scholar] [CrossRef] [PubMed]
  35. Soung, A.L.; Davé, V.A.; Garber, C.; Tycksen, E.D.; Vollmer, L.L.; Klein, R.S. IL-1 Reprogramming of Adult Neural Stem Cells Limits Neurocognitive Recovery after Viral Encephalitis by Maintaining a Proinflammatory State. Brain Behav Immun 2022, 99, 383–396. [Google Scholar] [CrossRef] [PubMed]
  36. Allen, W.E.; Blosser, T.R.; Sullivan, Z.A.; Dulac, C.; Zhuang, X. Molecular and Spatial Signatures of Mouse Brain Aging at Single-Cell Resolution. Cell 2023, 186, 194–208.e18. [Google Scholar] [CrossRef] [PubMed]
  37. Hong, C.-S.; Park, M.-R.; Sun, E.-G.; Choi, W.; Hwang, J.-E.; Bae, W.-K.; Rhee, J.H.; Cho, S.-H.; Chung, I.-J. Gal-3BP Negatively Regulates NF-κB Signaling by Inhibiting the Activation of TAK1. Front Immunol 2019, 10, 1760. [Google Scholar] [CrossRef] [PubMed]
  38. Cho, S.-H.; Shim, H.-J.; Park, M.-R.; Choi, J.-N.; Akanda, M.R.; Hwang, J.-E.; Bae, W.-K.; Lee, K.-H.; Sun, E.-G.; Chung, I.-J. Lgals3bp Suppresses Colon Inflammation and Tumorigenesis through the Downregulation of TAK1-NF-κB Signaling. Cell Death Discov. 2021, 7, 1–13. [Google Scholar] [CrossRef]
  39. Funk, K.E.; Arutyunov, A.D.; Desai, P.; White, J.P.; Soung, A.L.; Rosen, S.F.; Diamond, M.S.; Klein, R.S. Decreased Antiviral Immune Response within the Central Nervous System of Aged Mice Is Associated with Increased Lethality of West Nile Virus Encephalitis. Aging Cell 2021, 20, e13412. [Google Scholar] [CrossRef]
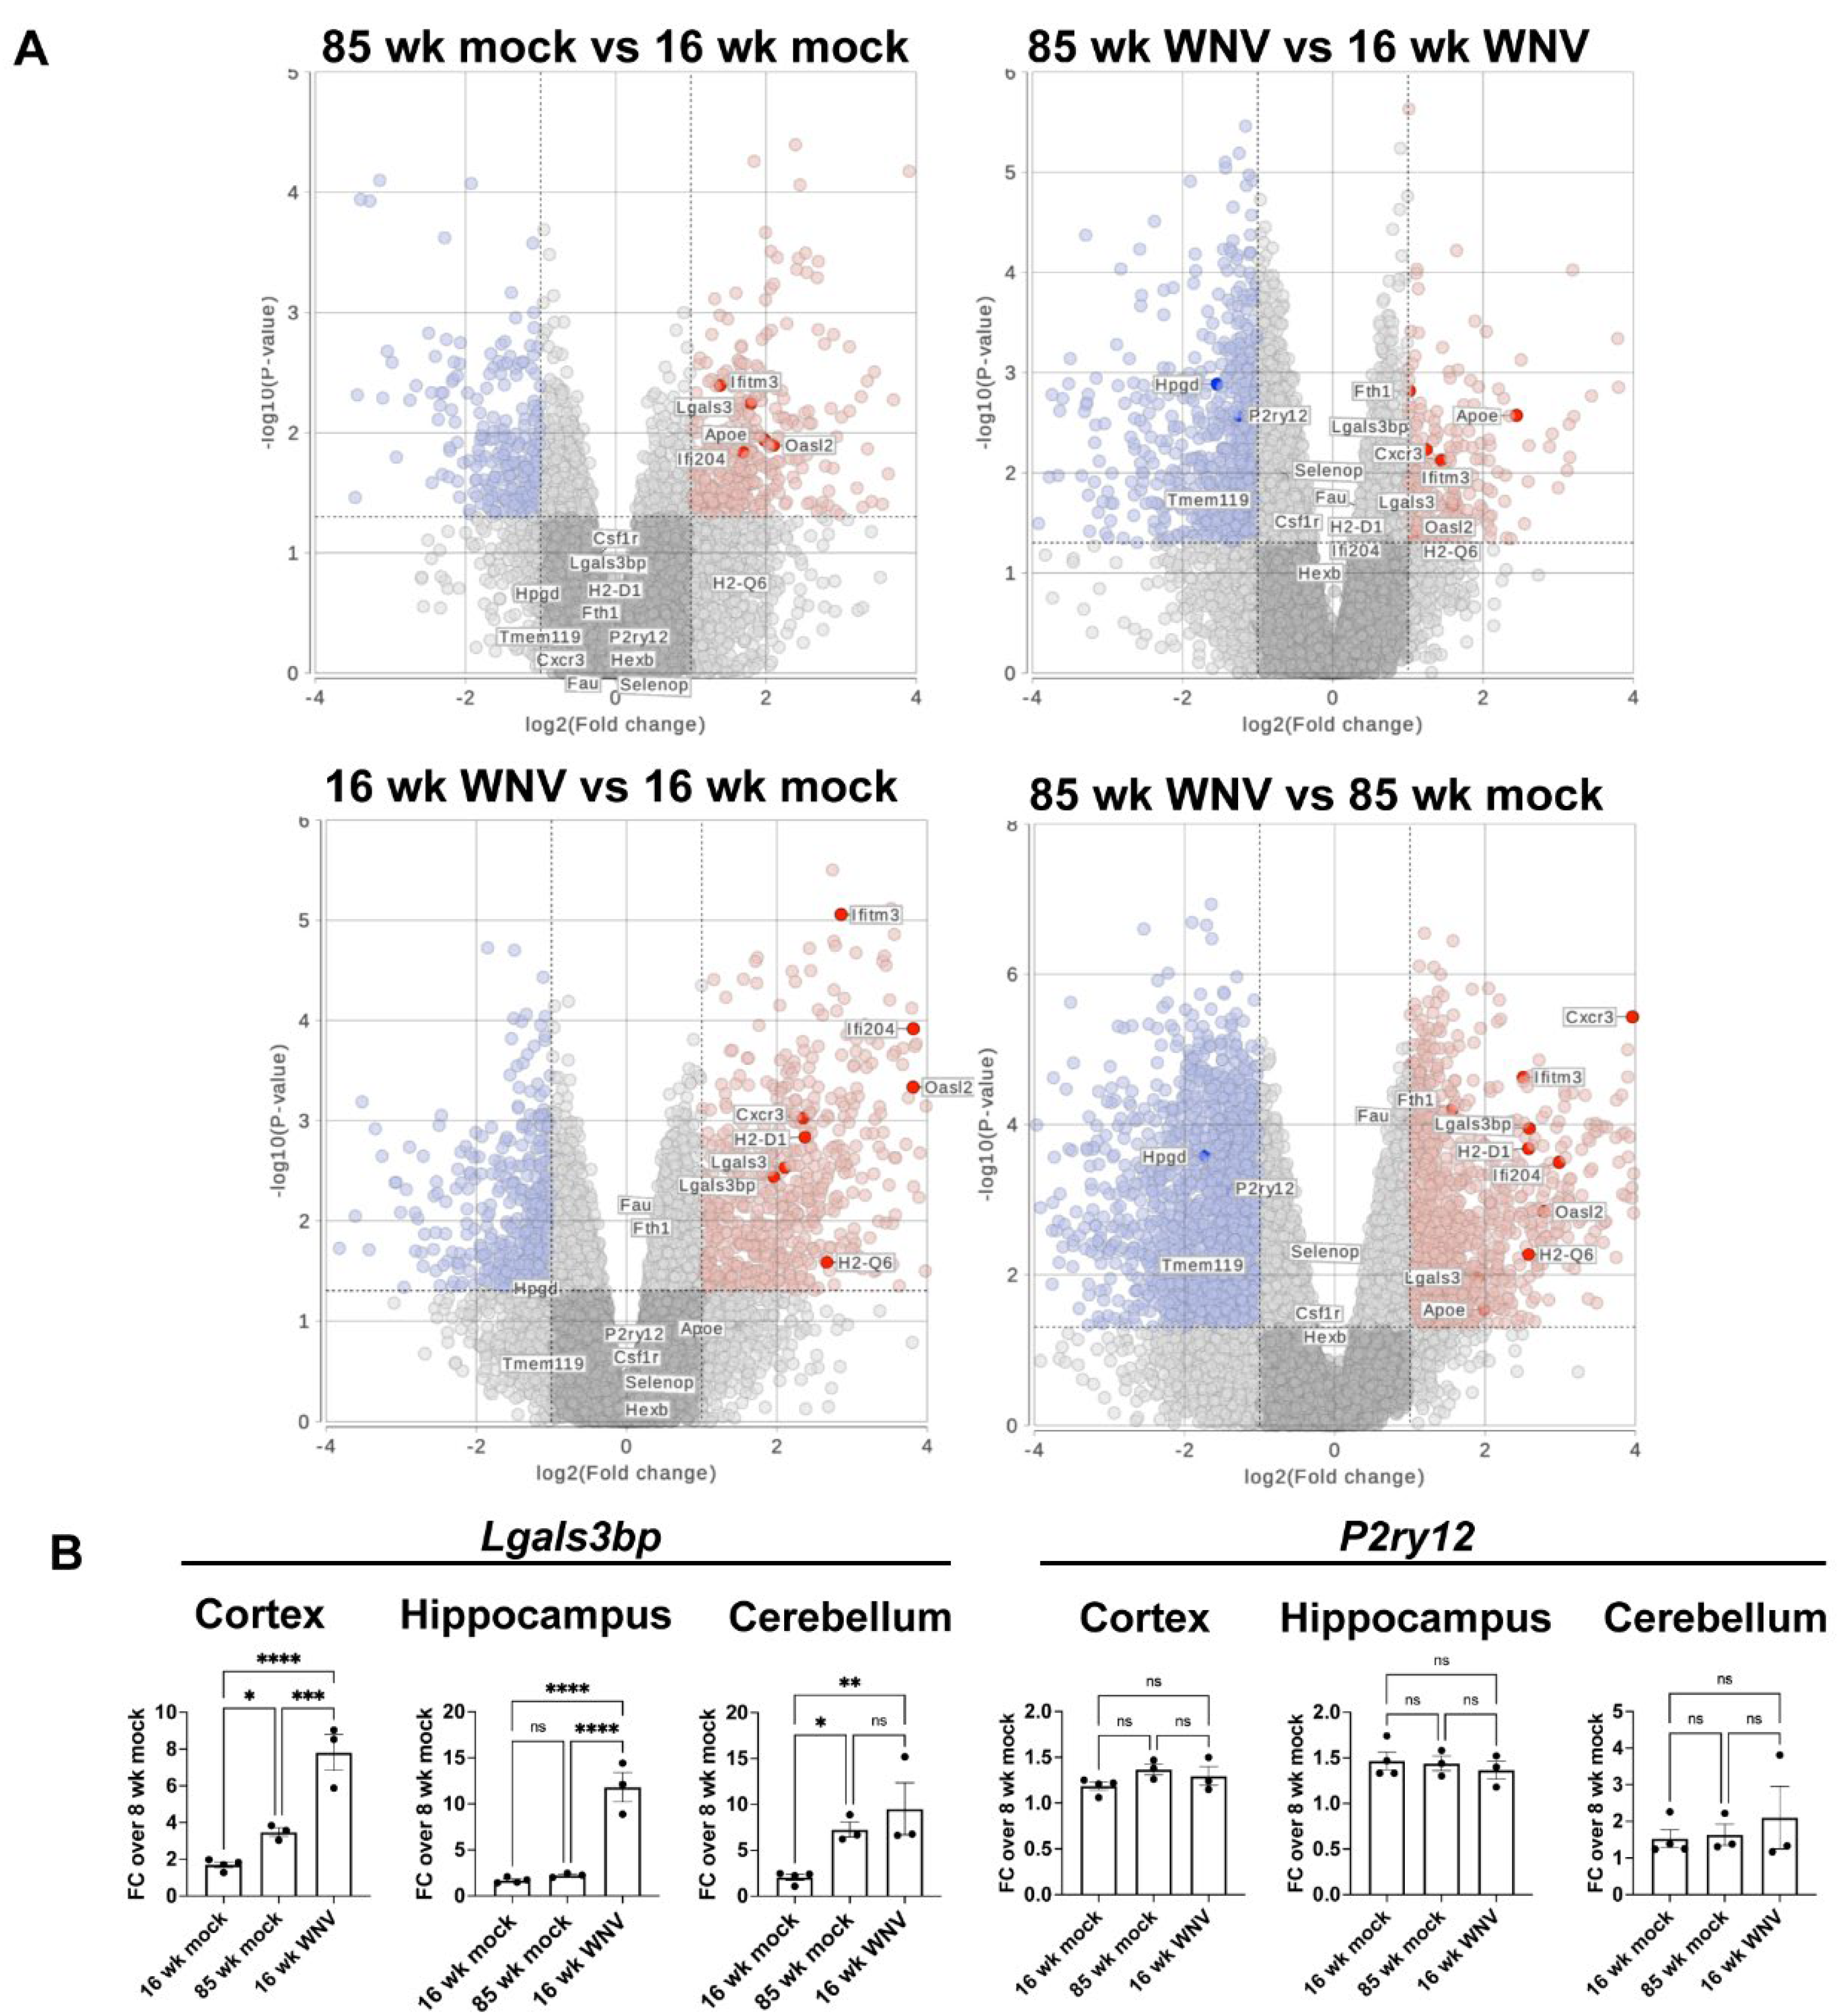
Figure 1. Microglia activated by WNV share transcriptional signatures with aged microglia. (A) Volcano plots showing pairwise comparisons of microglial gene expression in CD11b+ cells from brains of mock or WNV-infected 16- and 85-week-old mice analyzed by bulk RNA sequencing at 30 DPI. (B) qRT-PCR validation of Lgals3bp and P2ry12 expression in brain lysates obtained from 16 or 85 wk old mice. Statistical significance was calculated using one way ANOVA with pairwise comparisons and Tukey’s correction test.
Preprints 107836 g001
Figure 2. MERFISH analysis of WNV- and mock-infected mouse brains. (A) UMAP scatter plot showing clustering of identified cell types, combined, or split per sample type. (B) Dotplot of expression levels for gene markers used to identify cell types. (C) Frequency plot of identified cell types in each group. (D). Representative sections from mouse brains demonstrating identified cell types in 16- and 85-week-old mouse brains 30 days post infection with WNV or mock control.
Preprints 107836 g002
Figure 3. Lgals3bp expression in mouse brain visualized using MERFISH. (A) Lgals3bp and Lgals3 expression scatter plot in identified cell types. (B) Spatial imaging of Lgals3bp (green) and Lgals3bp (orange) in coronal section of mouse brains from 16- or 85-week animals infected with mock or WNV, visualized at 30 DPI. Arrowheads point at persistent inflammatory foci observed in infected samples. (C) Lgals3bp (green), Lgals3 (orange), P2ry12 (magenta), Cxcr1 (coral), Meg3 (gray) expression in mouse cortex (left panel) or CA2 region of the hippocampus (right panel). Arrowheads indicate microglial cells. (D) Lgals3bp (green), Lgals3 (orange), P2ry12 (magenta), Cx3cr1 (coral), Meg3 (gray), Aqp4 (yellow), Aldh1 (light yellow) expression in the CA2 region of the hippocampus of WNV-infected mice. (E) Lgals3bp (green), Lgals3 (orange), CD3e (white), CD8a (cyan) and Meg3 (gray) expression visualized in inflammatory foci observed in the brain of WNV infected animals at 30 DPI.
Preprints 107836 g003
Figure 4. Lgals3bp KO C57BL6/J mice infected with WNV-NS5-E218A suffer increased severity of infection without a difference in survival or CNS viral titers. (A) Schematic demonstrating targeting sites of gRNA in exon 2 of C57BL6/J mouse Lgals3bp gene used to generate Lgals3bp-/- animals. Weight loss (B) and survival (C) of WNV-infected Lgals3bp-/-, Lgals3bp+/- and WT animals. (D) CNS viral titers of WNV measured in the cortex and cerebellum via plaque assay.
Preprints 107836 g004
Figure 5. Flow cytometric analysis of lymphoid cells and microglia isolated from WNV-infected Lgals3bp-/-, and WT animals at 8 DPI. (A-B) Proportion and cells count of CD4+ and CD8+ T-cells isolated from cortices and hippocampi of Lgals3bp-/-, and WT mice at 8 DPI. Fraction of cells positive for IFNγ expression is shown in the right panel. (C-D) Proportion and cell count of microglia isolated from cortices and hippocampi of Lgals3bp-/-, and WT mice at 8 DPI. Counts of microglia expressing CD68 or MHCII are shown in the lower panel.
Preprints 107836 g005
Table 1. Transcriptional changes of cluster-defining genes of WNV-activated microglia during aging.
Gene Activated microglia cluster [7] Fold Change (Old/Young) [22] P value
Apoe A1 and A2 3.56 5.8E-18
H2-D1 A1 3.29 1.8E-20
Fth1 A1 and A2 2.74 3.0E-18
Lgals3bp A1 2.24 5.7E-23
H2-Q6 A1 2.23 1.1E-10
Oasl2 A1 1.89 1.9E-05
Ifi204 A1 1.79 1.0E-04
Fcgr4 A1 1.75 2.6E-04
C1qa A2 1.75 4.5E-06
Ifitm3 A1 1.72 4.0E-13
ltm2b A1 and A2 1.63 6.4E-05
Ftl1 A2 1.51 0.022
Tyrobp A2 1.50 0.002
Ctsb A1 and A2 1.47 1.8E-04
Rps29 A2 1.39 0.212
C1qb A2 1.37 0.026
Fau A2 1.36 0.213
Fcer1g A2 1.35 0.010
H2-Ab1 A1 and A2 1.34 0.002
Ctss A1 and A2 1.32 0.002
Ly6e A1 1.26 0.005
H2-Eb1 A1 and A2 1.25 0.014
H2-Aa A1 and A2 1.15 0.326
CD74 A1 and A2 1.14 0.404
Cxcl9 A2 1.12 0.722
Psap A2 0.93 0.846
Selplg Homeostatic 1.11 0.652
Fscn1 Homeostatic 1.04 0.917
Hexb Homeostatic 1.00 0.986
Cst3 Homeostatic 0.99 0.964
Hpgd Homeostatic 0.88 0.326
Pmp22 Homeostatic 0.86 0.149
Selenop Homeostatic 0.85 0.242
Csf1r Homeostatic 0.84 0.241
Sparc Homeostatic 0.82 0.237
Rnase4 Homeostatic 0.80 0.007
Golm1 Homeostatic 0.74 0.091
Siglech Homeostatic 0.73 0.002
Cx3cr1 Homeostatic 0.73 0.157
Note: A1 and A2 are previously published activated microglial clusters [7].
Disclaimer/Publisher’s Note: The statements, opinions and data contained in all publications are solely those of the individual author(s) and contributor(s) and not of MDPI and/or the editor(s). MDPI and/or the editor(s) disclaim responsibility for any injury to people or property resulting from any ideas, methods, instructions or products referred to in the content.
Copyright: This open access article is published under a Creative Commons CC BY 4.0 license, which permit the free download, distribution, and reuse, provided that the author and preprint are cited in any reuse.
Prerpints.org logo

Preprints.org is a free preprint server supported by MDPI in Basel, Switzerland.

Subscribe

© 2024 MDPI (Basel, Switzerland) unless otherwise stated