Preprint
Article

Resolving Relationships of Bolbitis sinensis Species Complex Using RAD Sequencing

This version is not peer-reviewed.

Submitted:

01 June 2024

Posted:

03 June 2024

You are already at the latest version

A peer-reviewed article of this preprint also exists.

Abstract
Species identification and phylogenetic relationships clarification are fundamental goals in species delimitation. Yet these tasks pose challenges when based on morphologies, geographic distribution, and genomic data. Previously, two new species of fern genus Bolbitis, B. × multipinna and B. longiaurita, were described based on morphological traits, are phylogenetically intertwined with B. sinensis and fail to form monophyletic groups. To address the unclear phylogenetic relationships within the B. sinensis species complex, RAD sequencing was performed on 65 individuals from five populations. Our integrated analysis of phylogenetic tree, neighbor net, and genetic structure, indicate that the B. sinensis species complex should not be considered as separate species. Moreover, our findings reveal differences in the degree of genetic differentiation among five populations, ranged from low to moderate, which might be influenced by geographical distance and gene flow. The Fst values also confirmed that genetic differentiation intensifies with increasing geographic distance. Collectively, this study clarifies the complex phylogenetic relationships within the B. sinensis species complex, elucidates the genetic diversity and differentiation across the studied populations, and offers valuable genetic insights that contribute to the broader study of evolutionary relationships and population genetics within the Bolbitis species.
Keywords: 
Subject: 
Biology and Life Sciences  -   Ecology, Evolution, Behavior and Systematics

1. Introduction

The identification, delimitation, and description of species have long been subjects of intense debate in the fields of systematic and evolutionary biology [1,2]. Species delimitation involves determining which groups of individual organisms represent distinct populations within a single species and which represent separate species [3]. Historically, taxonomists described new species based on morphological characteristics. However, the variation of certain morphologies in response to environmental factors or evolutionary process has often led to confusion in classification [2,4]. In recent decades, a proliferation of methods utilizing molecular data has emerged to propose species hypotheses [5]. These advances have provided evidence of natural hybridization, reticulate evolution, adaptive radiation, and extensive gene flow after speciation, revealing a complex and often intricate history of species. Concurrently, these advances have also necessitated a reconsideration of the concept of “species” [6,7].
Bolbitis is a pantropical fern genus within the Dryopteridaceae family, comprising approximately 80 species primarily found in tropical Asia [8,9]. Species of Bolbitis are typically terrestrial, lithophytic, or occasionally epiphytic on tree trunks, featuring creeping or shortly erect rhizomes, and are commonly found in damp forest (Figure 1). Bolbitis is characterized by its often strongly dimorphic fronds and proliferous buds adaxially on the apex of terminal segments [10]. Bolbitis × multipinna is endemic to China and is solely distributed in Yunnan Province [11,12]. Due to its irregular venation pattern, with one to more anastomosing veinlets arising from lateral veins, B. × multipinna has been described as an inter-specific hybrid of B. angustipinna × B. sinensis [13,14]. Another new species identified in 2006, Bolbitis longiaurita bears similarities to B. sinensis, but differs in having an unwinged rhachis, as well as the base of the two lowermost sterile pinnae being asymmetrical, with the basiscopic 2 or 3 lobes undeveloped and the other lobes longer than the acroscopic ones [15]. However, according to field surveys, we found that B. × multipinna, B. longiaurita do not exhibit independent geographical distributions and are consistently found sympatrically with B. sinensis. Another noteworthy observation is the lack, or instability, of morphological characteristics that clearly distinguish these three species (Figure 1). The only characters that differ B. sinensis and B. × multipinna, was one to multiple anastomosing veinlets and found to be plastic. Similarly, B. longiaurita displayed only one unstable pinnae character when compared to B. sinensis (i.e. basally elongated lobes). The latest phylogeny, based on three chloroplast sequences, resolved Bolbitis into four clades: the Malagasy/Mascarene clade, the African clade, the American clade and the Asian clade. B. sinensis, B. × multipinna and B. longiaurita formed a well-supported group in the Asian clade. The most recent common ancestor (MRCA) of the B. sinensis species complex likely originated in subtropical to tropical Asia and diverged around 3.84 Mya [16]. However, the species within the B. sinensis complex are nested within each other, and the species diversity remains uncertain. Therefore, more extensive sampling is required to elucidate the reticulate relationships within the B. sinensis species complex.
Genomic data contains extensive information about the degree of genetic isolation among species, as well as ancient and recent introgression events. Consequently, genomic data can play an important role in species delimitation across various species concepts [3,17]. High-throughput techniques based on restriction site-associated DNA sequencing (RAD-seq) are enabling the low-cost discovery and genotyping of thousands of genetic markers for species, especially for non-model and non-genome species [17,18,19,20]. It has been widely used to study genomic evolution, especially at intergeneric, interspecific and intraspecific taxonomic levels, such as Amazonian bryophytes [21], global oak [22,23], Arundinarieae of Poaceae [24,25], grape genus [26], Cunninghamia lanceolata in the Cupressacaes family [27], allopolyploid tree fern Gymnosphaera metteniana [28].
In this study, we performed RAD sequencing on 65 individuals from five populations of B. sinensis species complex, which includes B. sinensis, B. × multipinna and B. longiaurita. The population-based data were used to: (1) reconstruct the phylogenetic relationships within the B. sinensis species complex based on genomic variations, and (2) identify genetic diversity and genetic differentiation within the species complex. Our findings indicate that the species within B. sinensis species complex should not be considered separate species. Instead, they likely represent variants of a single species or subspecies. Furthermore, the analysis revealed discernible genetic differentiation among populations, which might have influenced by geographical distance and gene flow, suggesting ongoing evolutionary process within the species complex.

2. Results

2.1. Sampling Collection and SNP Calling

For investigating the B. sinensis species complex, we collected related species from Yunnan, China. A total of 65 individuals representing five populations of B. sinensis complex were collected (Table 1), including 26 B. sinensis, 31 B. × multipinna, and 4 B. longiaurita. Additionally, four individuals could not be identified to species and were designated as B. sp. All samples underwent RAD sequencing. After quality filtering, a total of 840 Gb clean data were obtained from 65 individuals by sequencing RAD libraries, with an average of 13.67 Gb pair-end clean data per individual (Table S2). The retained reads were finally assembled into an average of 182,965 RAD stacks per individual using ustacks, with a mean coverage depth of 25.41x (Table S3). A catalog of 8,485,326 putative loci was constructed using cstacks, and an average of 110,868 putative loci per individual was matched to the catalog using sstacks. A total of 92% read pairs were identified as putative PCR duplicates and removed by gstacks. Finally, 8,392,168 loci were genotyped, with effective per-sample mean coverage of 1.7x. In the population analysis, we applied five -p and seven -r parameters to filter SNPs and obtained 35 SNPs datasets, retaining variant sites ranging from 89 in p5-r0.90 dataset to 30,654 in p1-r0.30 dataset (Table S4).

2.2. Phylogenetic Trees and Neighbor Net

The application of 35 SNP datasets generated phylogenetic trees with similar topology (Figure S1). The three species within B. sinensis complex did not form monophyletic branches or clades, but displayed consistent geographical differentiation. To compare the topologies among trees obtained from different SNPs datasets, a principal coordinates analysis (PCoA) was conducted on the Robinson-Foulds (RF) distance matrices. The PCoA yielded two principal components, PCo1 and PCo2, which explained 12.37% and 9.81% of the total variance, respectively (Figure S2, Table S6). Two groups were primarily separated by PCo1. Datasets with a high missing rate (r ≤0.6) shifted to the left along PCo1, while those with a lower missing rate (r > 0.6) shifted to the right along PCo1.
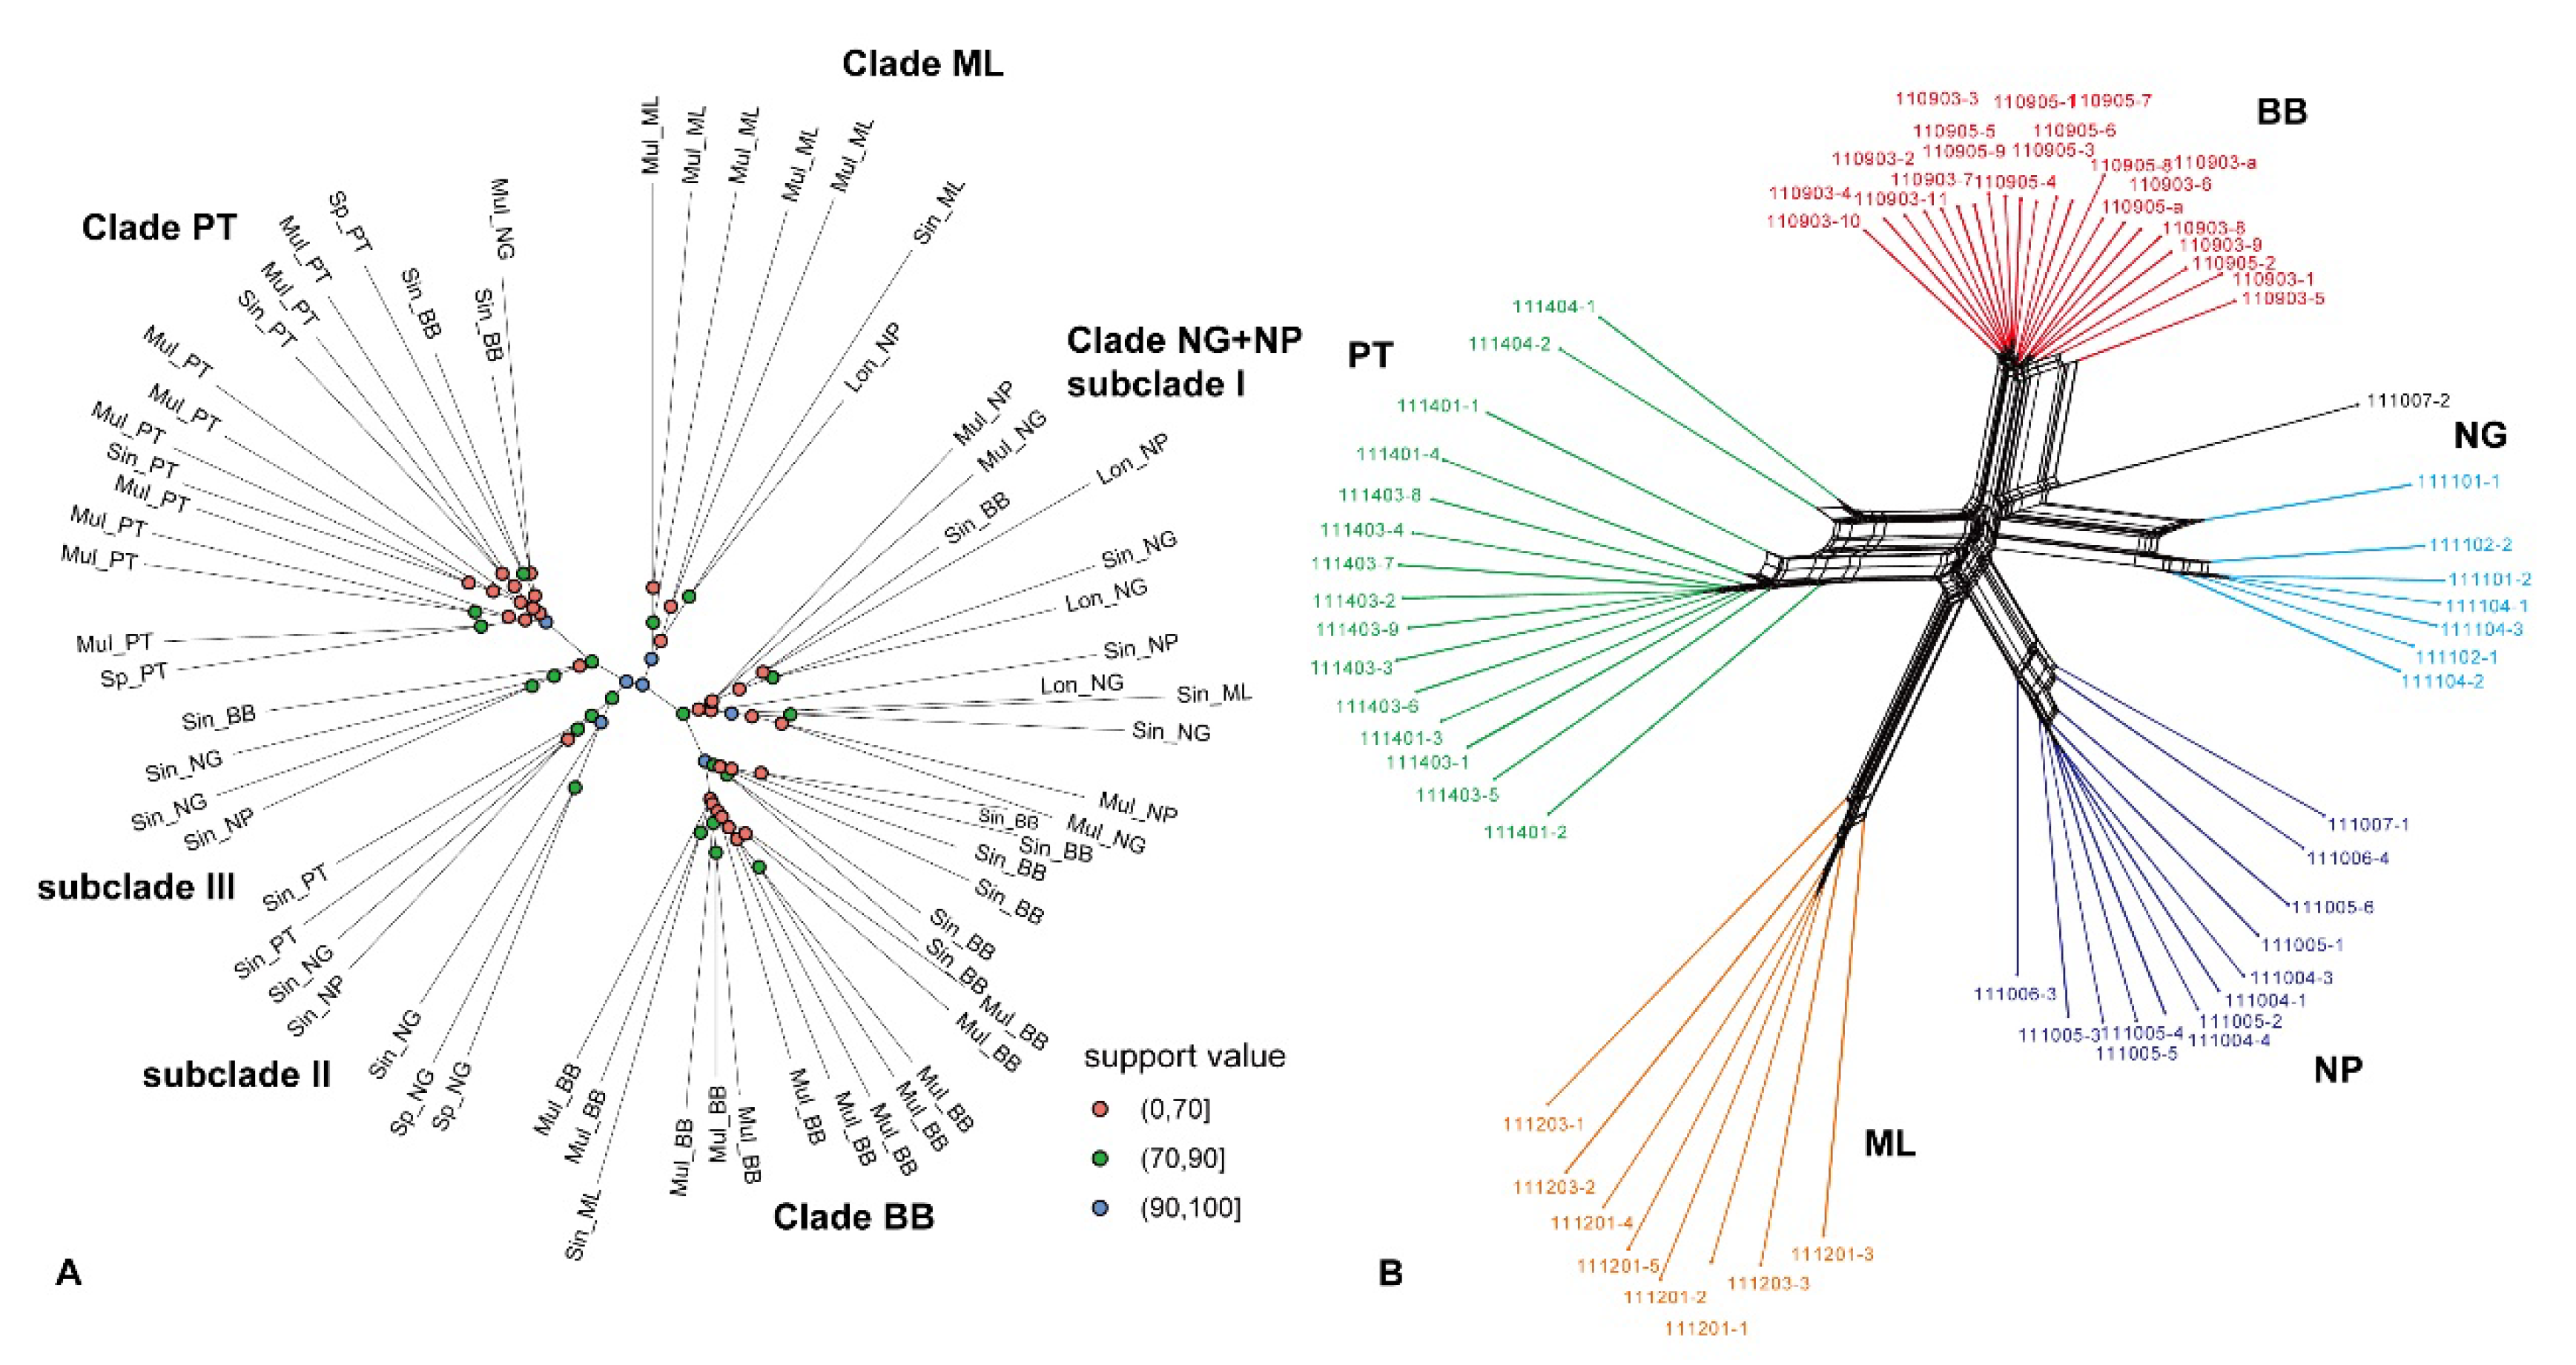
The best supported maximum likelihood tree was obtained from p1-r0.60 dataset with 9,467 high quality SNPs (Figure 2A). Four clades were identified in the ML tree: Clade BB, Clade ML, Clade NG+NP (subclade I – III), and Clade PT, with ultrafast bootstrap (UFBoot) values displayed at the node. Clade BB comprises 18 individuals of B. sinensis and B. × multipinna from Bubeng, Yunnan, China (MLBS=98%). Similarly, Clade ML included 6 individuals of B. sinensis and B. × multipinna from Menglun, Yunnan, China (MLBS=98%), along with one B. longiaurita sample from the NP population. Clade PT contained 16 individuals of B. sinensis, B. × multipinna and B. sp from Puteng, Yunnan, China (MLBS=100%), along with two additional B. sinensis individuals from the BB population and one B. × multipinna from the NG population. However, individuals from the NP and NG populations largely intermixed and further divided into three subclades (I – III), with MLBS values of 84%, 98%, 86%, respectively, showing a genetic distance in between Clade BB and Clade PT.
Based on p1-r0.60 dataset, we also generated a phylogenetic network in SplitsTree4 to visualize the relationships between populations (Figure 2B). The neighbor-net splits graphs showed a topology similar to that of the ML tree and resolved the B. sinensis species complex into five branches as well, which corresponded largely to the five populations. In addition, some conflicts were displayed as box-like structures, such as the BB population. Overall, both the ML tree and split networks clearly suggested that B. sinensis, B. × multipinna, and B. longiaurita do not form monophyletic clades.

2.3. Genetic Structure Among B. sinensis Species Complex

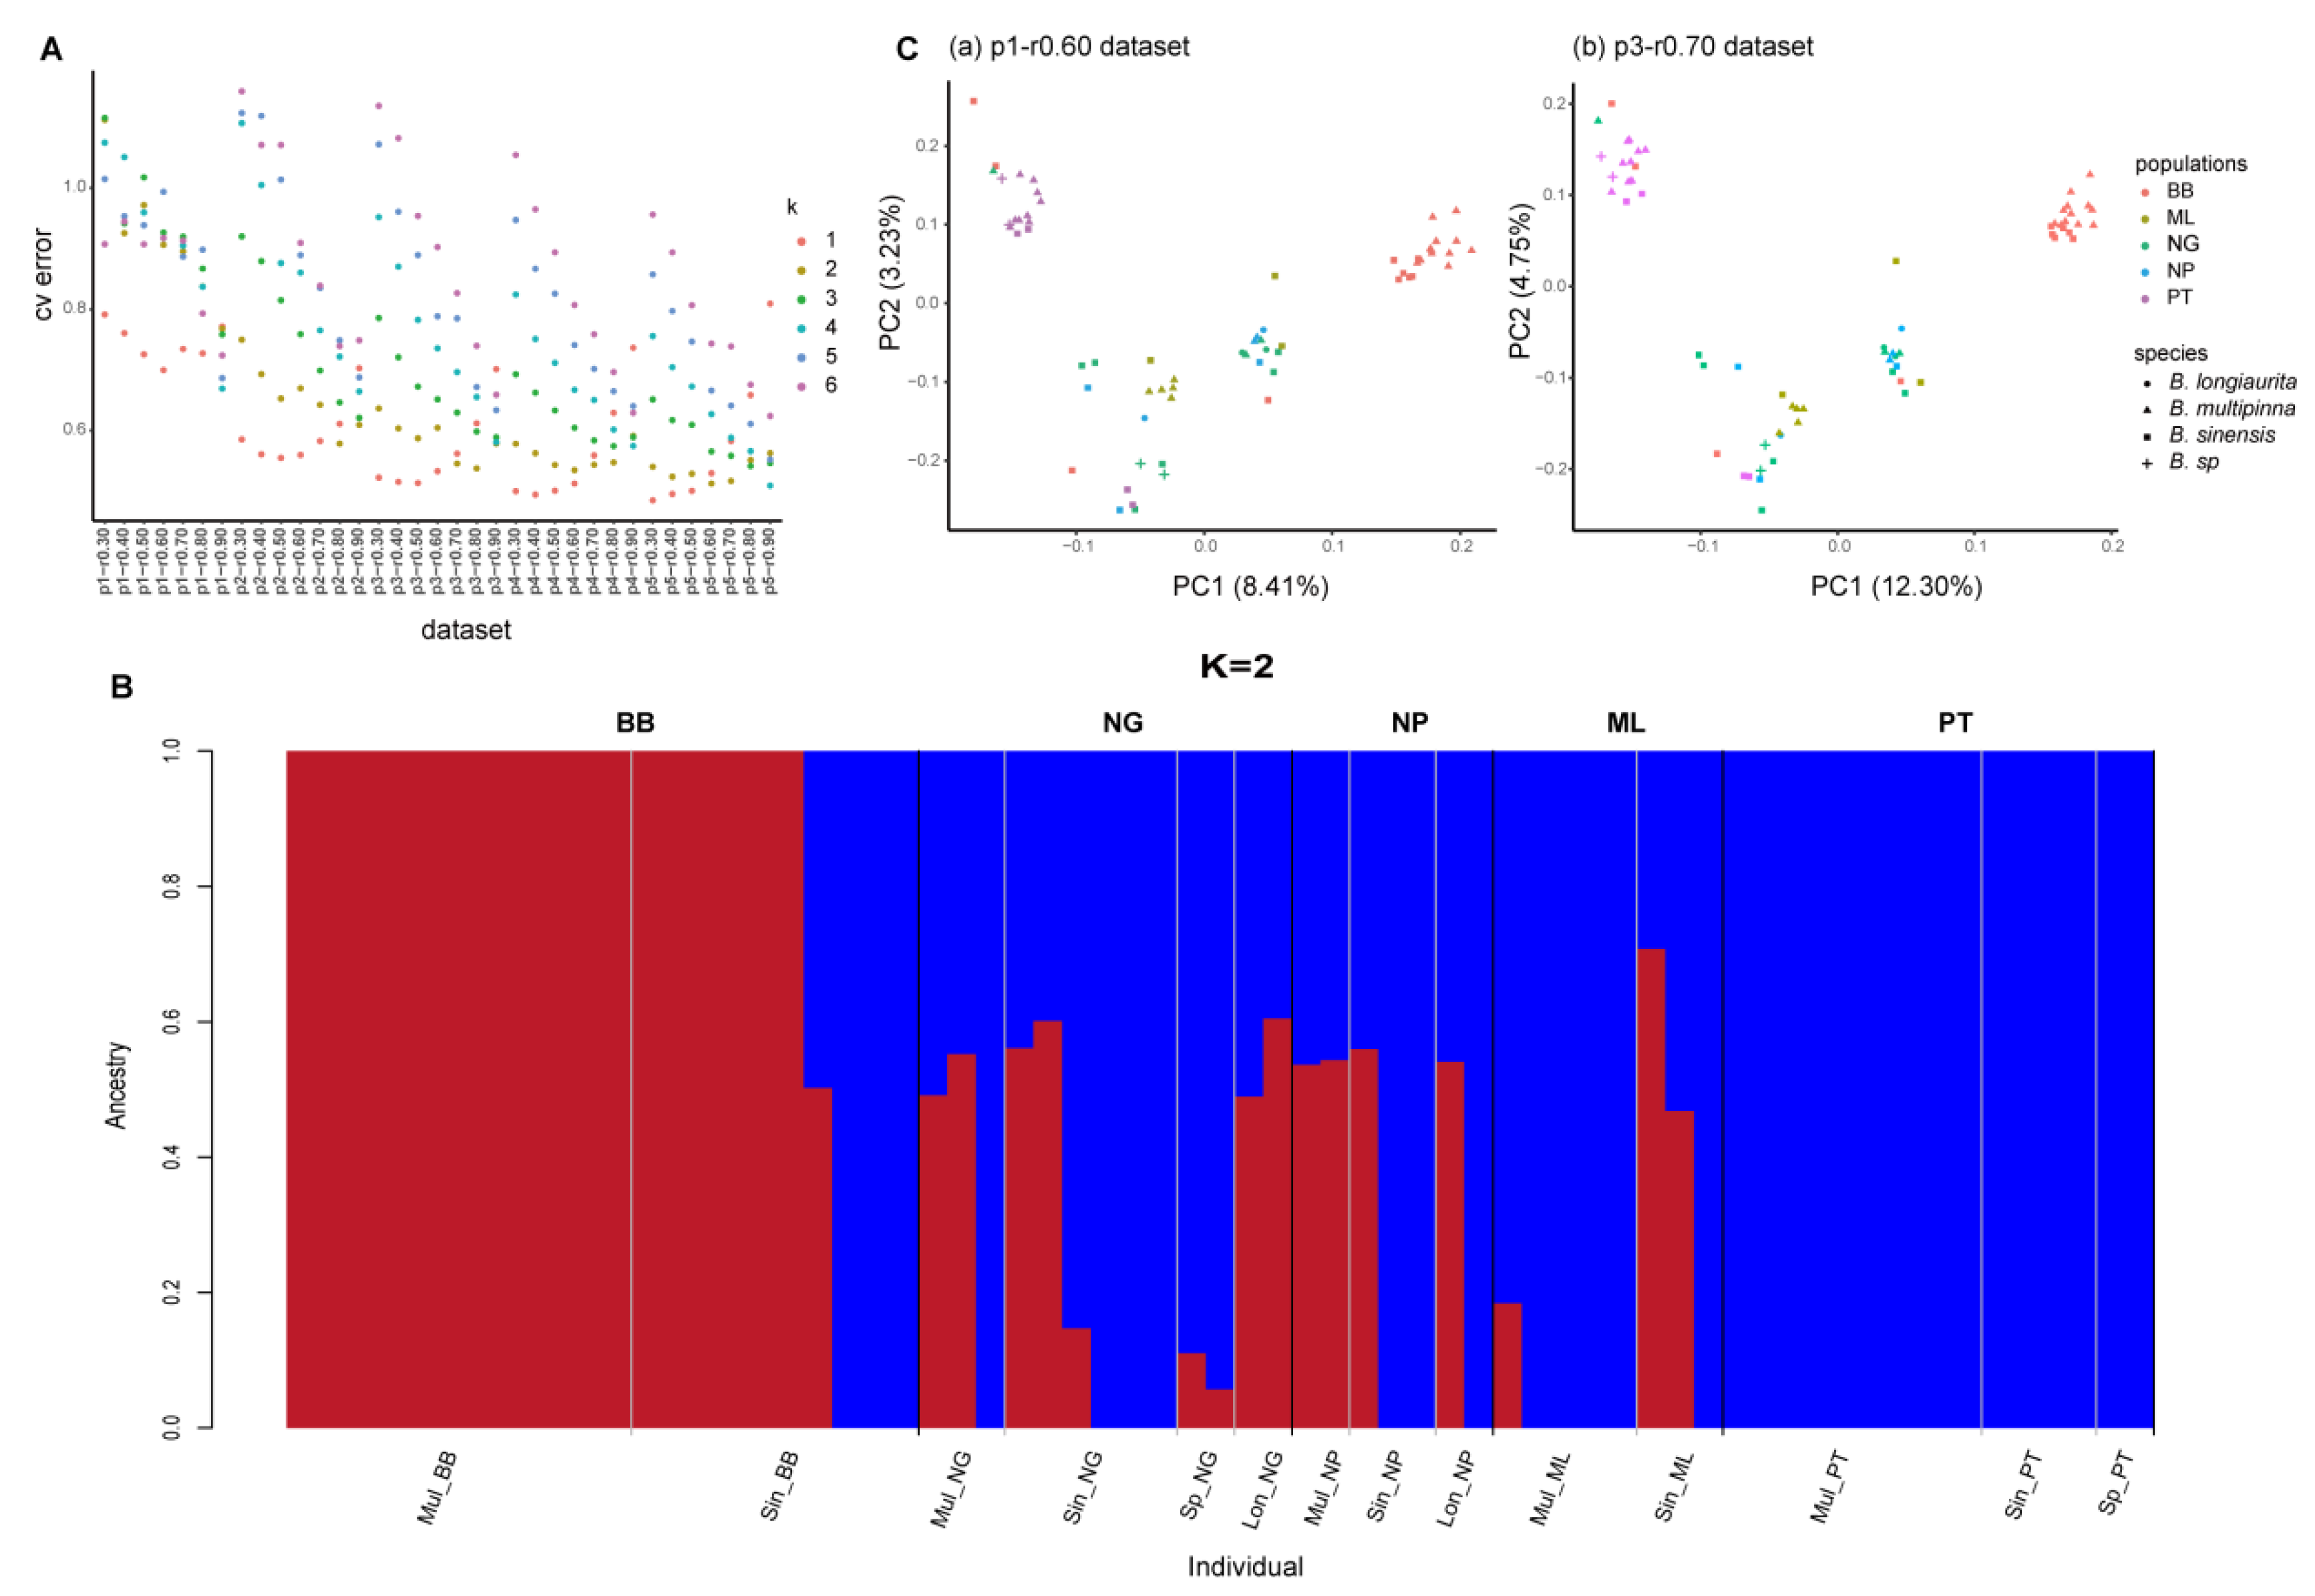
Further, all 35 SNP datasets were used for structure analysis. A total of 22 datasets including the p1-r0.60 dataset used for constructing the ML tree and network analysis above, supported one genetic group (K = 1) as optimal for the B. sinensis species complex (Fig. 3A, Table S7). In addition, 9 datasets containing a small number of core SNPs with a low missing rate across all populations indicated that K = 2 was the optimal value. The remaining four datasets supported K values of 3 or 4. Among the K = 2 datasets, the p3-r0.70 dataset (1,031 SNPs with a low missing rate) with the highest ML tree support values was selected for comparison (Figure 3B). This analysis showed that the vast majority of individuals shared genetic components with either the BB population or the PT population. Two mixed patterns were observed in the NG, NP and ML populations: one with the same genetic component as PT individuals and the other with polymorphic components originating from both the BB and PT populations. Within the BB population, individuals 110905-6, 110905-7, 110905-8 showed the same genetic component as the PT population (Table S8), which was largely consistent with the results of the ML tree (110905-7 and 110905-8 in Clade PT, 110905-6 in Clade NG+NP).
The two SNP datasets used above, p1-r0.60 and p1-r0.70, represented two different SNP strategies: a large number of SNPs with a high missing rate, and a small number of SNPs with a low missing value, respectively. Both datasets were applied to PCA analysis (Figure 3C). The first two components of p1-r0.60 dataset explaining 8.41% and 3.23% of the total variance, while the p3-r0.70 dataset explained 12.30% and 4.75% of the total variance. Both analyses clearly divided the five populations of the B. sinensis species complex into three clusters: BB and PT were relatively independent and distant, while NG, NP and ML formed a mixed cluster between BB and PT.

2.4. Genetic Diversity and Differentiation Among Five Populations

To determine the genetic diversity among the five populations, genetic diversity indices for each population were calculated based on the p1-r0.60 SNP dataset (Table 2, Table S9). All populations exhibited private alleles, with the PT population showing the highest number of private alleles, followed by the NG population. The NP population had the lowest number of private alleles. In terms of nucleotide diversity parameter (Pi), the ML population displayed the highest nucleotide diversity (Pi = 0.200), followed by PT (Pi = 0.158), NP (Pi = 0.156), and NG (Pi = 0.155). The BB population had the lowest nucleotide diversity (Pi = 0.115). Observed and expected heterozygosity of the five populations ranged from Obs_Het = 0.117 to 0.222 and Exp_Het = 0.112 to 0.183, respectively. The population in BB has lowest observed and expected heterozygosity (Obs_Het = 0.116 and Exp_Het = 0.112). Mean heterozygosities of the NG population (Obs_Het = 0.160 and Exp_Het = 0.147) were similar to those of the NP population (Obs_Het = 0.163 and Exp_Het = 0.142) and the PT population (Obs_Het = 0.169 and Exp_Het = 0.150). Regarding the inbreeding coefficient (Fis), the p1-r0.60 dataset generated Fis values ranging from −0.015 to 0.03708. The genetic differentiation index (Fst) was also computed to evaluate the degree of differentiation among the five populations (Table 2). The highest Fst was observed between the BB and PT populations (Fst  = 0.1574). The lowest Fst values were found between the NG and NP populations (Fst ≈ 0), followed by NP and ML (Fst = 0.0198) and NG and ML (Fst = 0.0258). These results indicated different degrees of genetic differentiation between geographically distinct populations. The high relative genetic diversity and low genetic differentiation suggested the existence of gene flow among specific populations.

2.5. Potential Gene Flow Among Five Populations

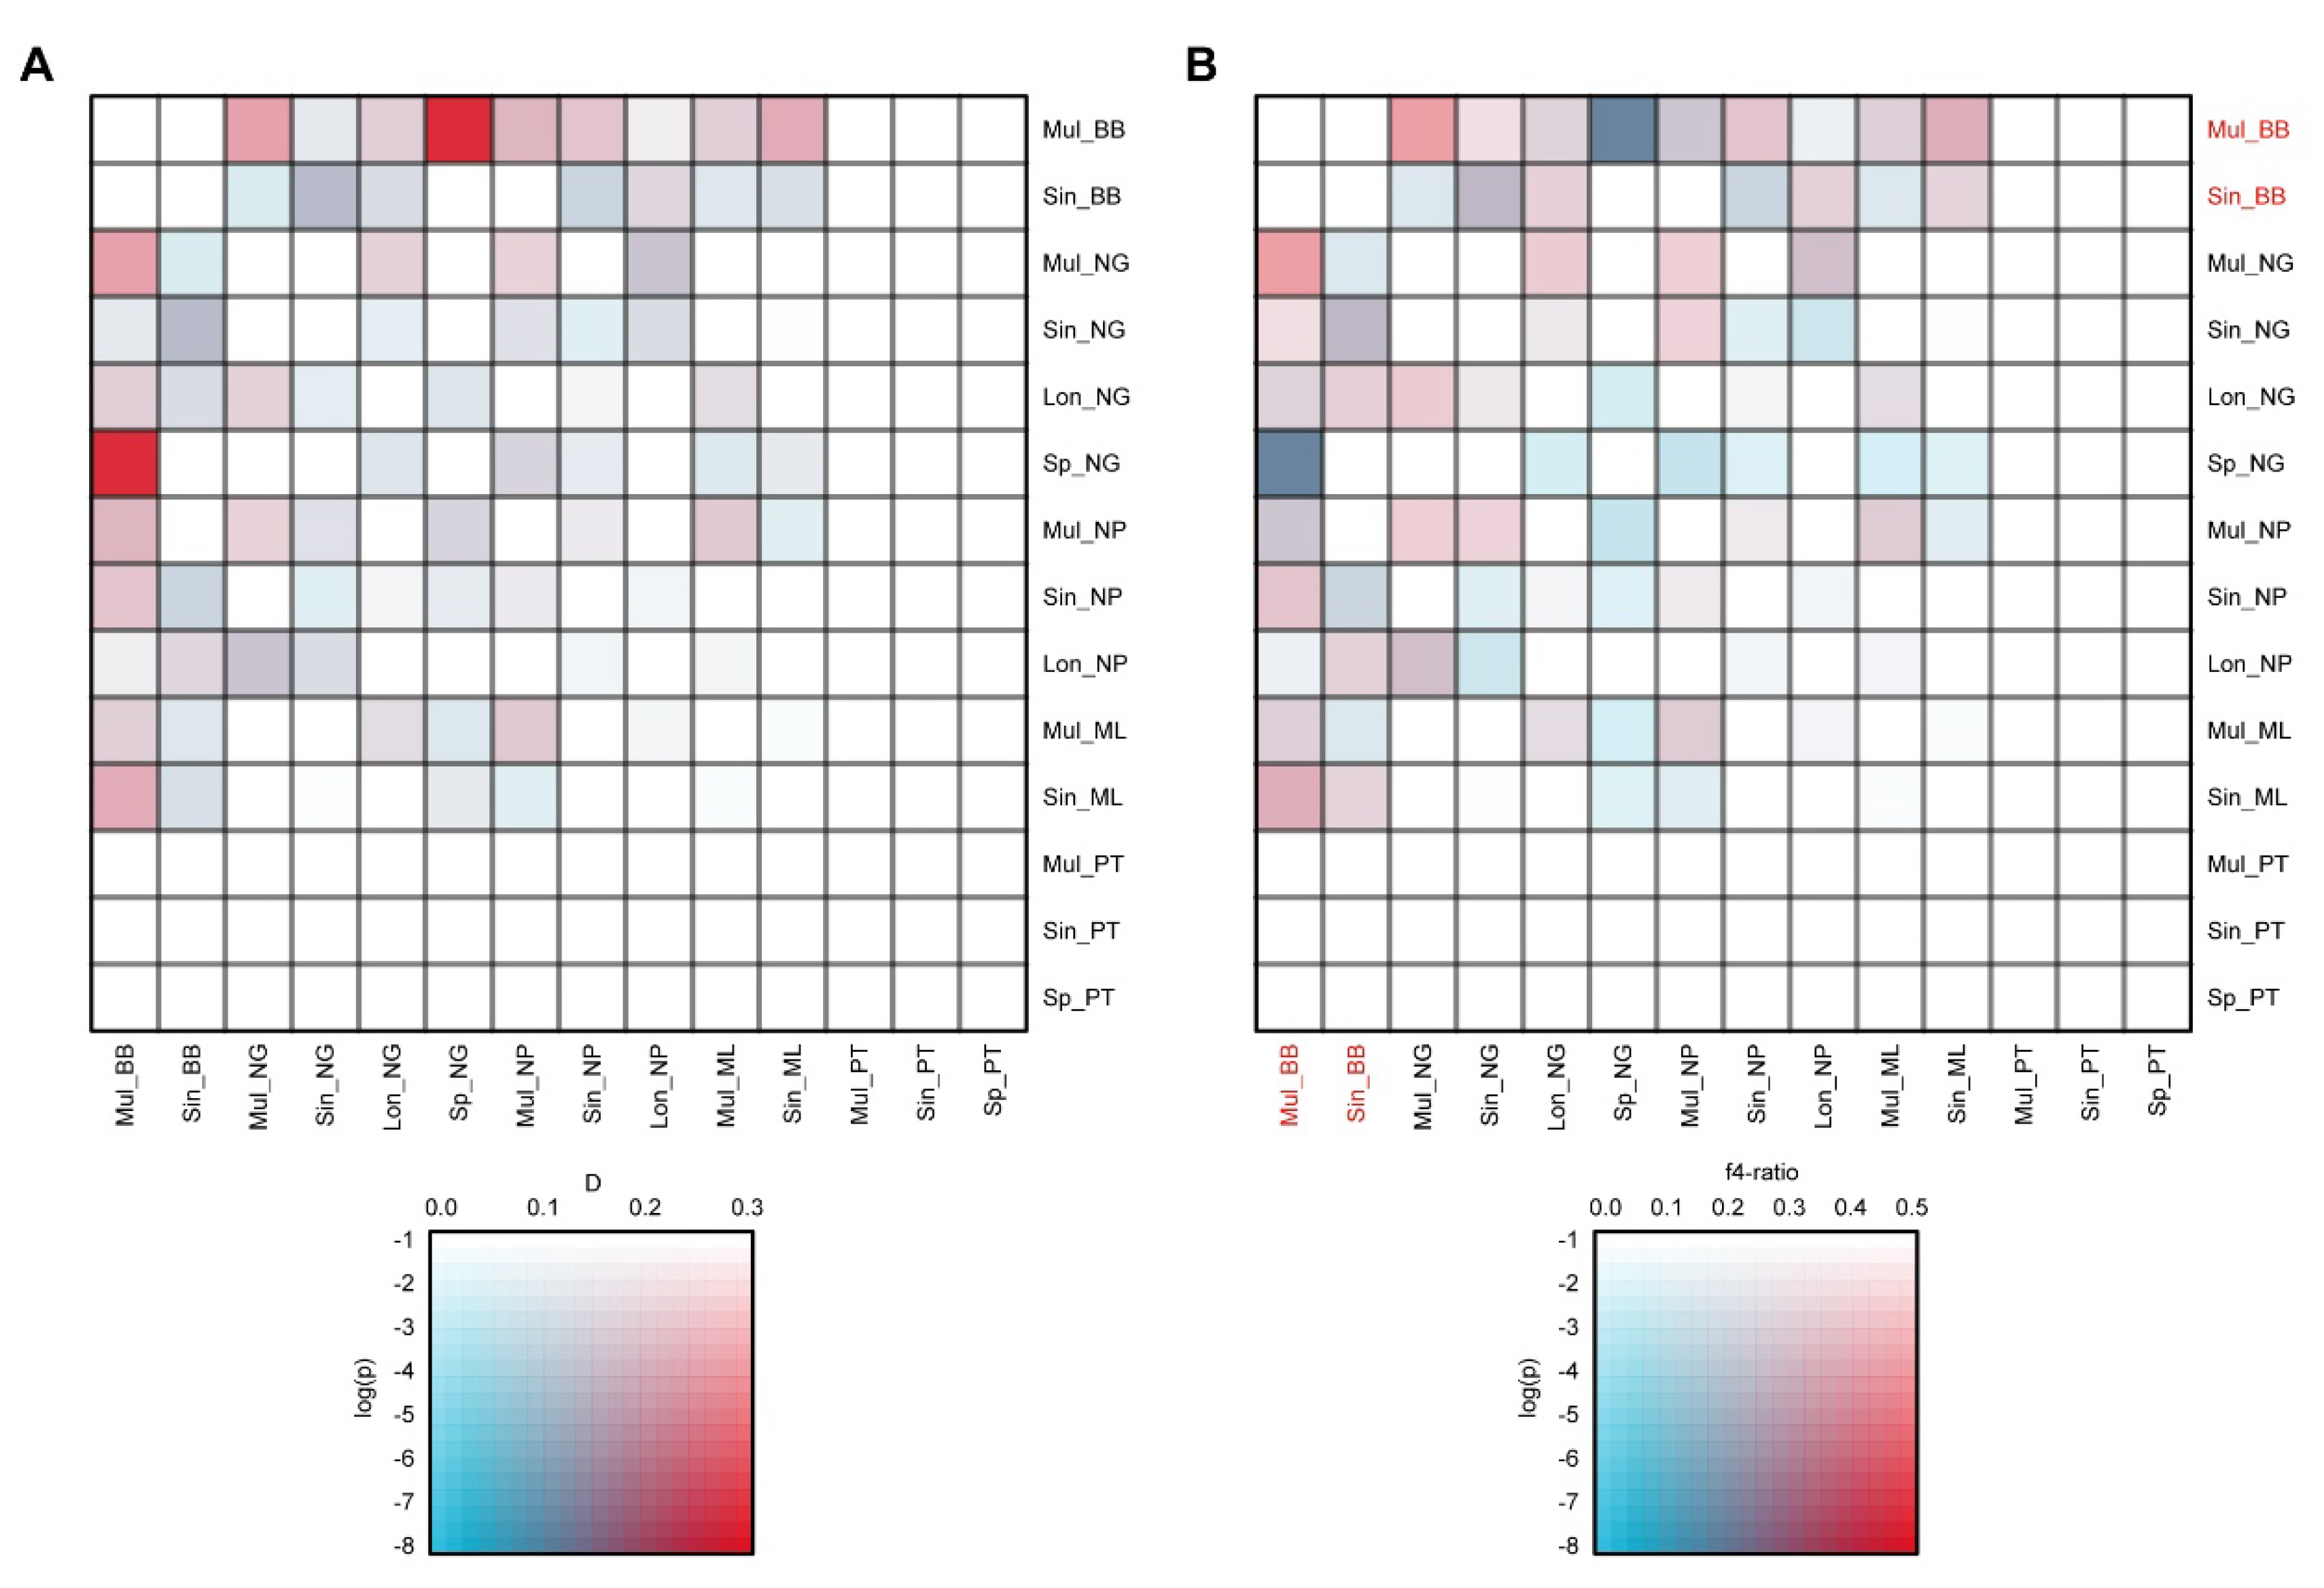
To investigate whether tree discordances and reticulate networks are due to past introgression events, we calculated D statistics for all possible trios of populations using PT—which has the most independent genetic component—as outgroup. Among all trios, 49 trios (out of 165 tested) showed significant D-statistic values exceeding 0.1 after correcting for multiple testing (Table S10 and Figure S3, Figure 4). These significant trios were mostly between subpopulations within the Mul_BB and the remaining subpopulations. Additionally, we calculated f4-ratios to estimate the amount of ancestry in an admixed population that comes from potential donor populations. We found that only 19 trios exhibited significant excess allele sharing and ancestry proportions (f4-ratio) over 0.3. Consistently, most of these significant trios were found between Mul_BB and the remaining subpopulations.

3. Discussion

3.1. Reclassification of Bolbitis sinensis Species Complex

Identifying species and clarifying their phylogenetic relationships are fundamental goals of species delimitation, but this process is often challenging and controversial [2]. Previously, two new species, B. × multipinna and B. longiaurita, were published primarily based on their morphological characters [11,12,15]. Additionally, B. × multipinna was thought to be a hybrid species in earlier research [13]. However, we found that the key taxonomic traits appear to be unstable, such as venation pattern, which is considered a critical trait of Bolbitis [13,14,15]. In previous phylogenetic study, the B. sinensis species complex formed a well-supported group within the Heteroclitae subclade. The MRCA of the B. sinensis species complex likely originated in subtropical to tropical Asia and diverged around 3.84 Mya [16]. Notably, within the Heteroclitae subclade, the B. sinensis species complex and another two species (B. major and B. tonkinensis) with free venation in common are not resolved as monophyletic, whereas other species with anastomosing veins are monophyletic [16]. Hence, this raises several questions: Do the variable individuals in the B. sinensis species complex belong to one species or to different species? Do the intermediate phenotypes truly suggested a reticulate evolution or a hybridization origin in Bolbitis. These questions highlight the complexity and need for further investigation into the species boundaries and evolutionary history within this group.
According to the phylogenetic tree, neighbor net, and genetic structure analysis, our results supported that the B. sinensis species complex cannot be regarded as separated species. There is notable genetic differentiation and gene exchange among specific populations. Combining these findings with previous studies, there is no clear evidence suggesting a hybrid origin for B. × multipinna. Regarding the morphological variation observed in the B. sinensis species complex, besides the stochastic nature of the trait itself, we speculate that gene flow between the B. sinensis species complex and other species may contribute to this variation.
Another possible reason for morphological variation lies in the mode of reproduction. Notably, one of the distinguishing features of Bolbitis is its ability to reproduce asexually via buds on leaves, which allows for rapid and efficient population expansion. However, for species with large and complex genomes, maintaining DNA replication fidelity through asexual reproduction can be challenging. Several studies have proposed that asexual populations have weaker responses to natural selection, leading to the accumulation of more deleterious mutations over generations [29,30,31]. The relatively high frequencies of asexual reproduction without ploidy cycling in ferns might be a consequence of frequent polyploidization, which allows for the buffering of recessive deleterious mutations over long time periods [31]. However, this remains a hypothesis, and more studies are needed to verify these observations and better understand the genetic and evolutionary dynamics within the B. sinensis species complex.

3.2. Genetic Diversity and Differentiation Among Five Populations

The distribution of the genetic diversity across populations is strongly determined by dispersal and gene flow patterns[32]. Two main patterns of gene flow are reported to be associated with population divergence: isolation-by-distance (IBD) and isolation-by-environment (IBE)[33,34,35]. In this study, different degree of genetic diversity and differentiation were identified among five populations. Higher genetic diversity was identified among the NP, NG, ML and PT populations (Pi = 0.15601–0.2000), whereas the BB population exhibited the lowest nucleotide diversity (Pi = 0.11527). Given that the geographical distance between the BB population and the other populations, from near to far, is NP, NG, ML and PT. Three populations (NP, NG and ML) are very close to each other geographically. Consistently, the Fst value between the BB and NP populations was the lowest (Fst = 0.0689), followed by the BB-NG and BB-ML pairs (Fst = 0.0710 and 0.0834, respectively). In contrast, the BB-PT had the highest Fst value (Fst = 0.1574). The lowest Fst values were found between NG and NP (Fst ~ 0), followed by NP and ML (Fst = 0.0198) and NG and ML (Fst = 0.0258). According to previous established criteria[36], five populations of B. sinensis species complex low to moderate differentiated from each other (FST <0.05 indicate low genetic differentiation, 0.05 < FST < 0.15 indicate moderate genetic differentiation). Moreover, it also suggested that genetic differentiation between B. sinensis species complex populations increases with geographical distance. Previously, a large number of studies have proposed a positive correlation between genetic and geographic distances in plants, such as Mimulus guttatus, Paeonia decomposita, and Tertiary relict species Emmenopterys henryi [37,38,39]. Even for a cosmopolitan marine planktonic diatom, a strong isolation by distance pattern was also identified at large geographical scale [40]. For short distance dispersal, Ledent et al. [21] reported significant isolation-by-distance (IBD) patterns in Amazonian bryophytes, where spatial genetic structure diminishes beyond the limits of short-distance dispersal. Similar to bryophytes, populations with intermediate phenotypes within the B. sinensis species complex have a very restricted geographic distribution. This suggests that limited dispersal due to geographic distance may be a crucial factor in the genetic differentiation between BB and PT populations.
In addition, direct gene flow might also have influence on population structure and as result the variation of genetic diversity. The low genetic differentiation and high genetic diversity within the NP/NG/ML population suggest ongoing gene flow among these populations. Our gene flow analysis identified significant signals of gene flow between the three sympatric populations and the BB population. For instance, the Patterson’s D statistic (D = 0.238821) and the f4-ratio (f4-ratio = 0.379994) in the (Lon_NG, Mul_BB), Sin_ML), PT) test suggest that the Mul_BB and Sin_ML may share more derived alleles than the Lon_NG and Mul_BB populations. More trios with gene flow signals were detected in the BB population, indicating asymmetric gene flow from BB to other populations. We speculated that it may be related to asymmetrical migration and high migration rates from BB to NP/NG/ML populations. Previous studies have found evidence of asymmetric gene flow, but mainly at inter-specific level, such as asymmetrical genomic contributions of two parent species to homoploid hybrid Ostryopsis species [41,42]. Such asymmetries in hybridization might related to mating system/s of the species pair and other evolutionary forces [43]. Asymmetric gene flow between populations has progressively become the focus in landscape genetics [44]. A recent prospective study found proposed that genetic differentiation, asymmetric gene flow, and genetic diversity in many tree species were shaped by global wind pattern [44]. Recently, Chang et al.[45] inferred four genetic clusters in wild barley (Hordeum vulgare L. ssp. spontaneum) populations of the Southern Levant using genotyping by sequencing (GBS) data. They have also detected similar asymmetric gene flows among populations, which found trends of gene flow in opposite directions in eastern and western regions. However, the evidence to support the asymmetric gene flow was not sufficient in this study. The results may also be influenced by the sampling size in each population. To clearly elucidate the gene flow events within the B. sinensis species complex, larger sample sizes, more population groups, and further experimental studies are needed in the future.

4. Materials and Methods

4.1. Taxon Sampling

In this study, we collected a total of 65 individuals representing 5 populations of B. sinensis complex (Table 1). Species identification followed the criteria established by Dong and Zhang [14]. Specifically, 26 individuals were identified as B. sinensis, 31 individuals were identified as B. × multipinna, and 4 individuals as B. longiaurita. Additionally, 4 individuals could not be identified to species and were designated as B. sp. Plant material was collected from living specimens in the field and stored in silica gel. The samples were carefully identified based on the descriptions in Flora of China, all specimens were deposited in the South China Botanical Garden (Guangzhou, China), and voucher number were given in Supplementary Table 1.

4.2. RAD-seq Libraries Preparation and Sequencing

High-quality genomic DNA was extracted from leaf tissues using a modified CTAB procedure [46]. Genomic DNA was individually barcoded and processed into a reduced complexity library on the basis of the traditional single-digest RAD protocol described in the study of Ali, et al. [47], with the following process: (1) digesting genomic DNA from each accession with tEcoRI restriction enzyme, (2) ligating the digested product to a Solexa P1 adapter containing 6 bp unique barcode, (3) pooling adapter-ligated fragments, (4) ligating a Solexa P2 adapter onto the ends of DNA fragments, (5) size selecting 200 – 400 bp fragments on agarose gels, (6) constructing individual libraries for each accession, and (7) enriching libraries with high-fidelity PCR amplification. Subsequently, paired-end sequencing was performed on an Illumina Hi-Seq X-Ten platform at Novogene Bioinformatics Institute (Beijing, China).

4.3. Data Processing

Raw data were trimmed for adapters and quality filtered before SNPs calling. The quality of sequencing data was checked with FASTQC v0.11.9 (https://www.bioinformatics.babraham.ac.uk/projects/fastqc/), visualized with MultiQC v1.13 (https://github.com/ewels/MultiQC). Raw reads were filtered using Trimmomatic v0.39 with parameter HEADCROP:15 and AVGQUAL:30 [48]. Then STACKS de novo pipeline [49,50](available at http://catchenlab.life.illinois.edu/stacks/) was used to construct putative loci from short-read sequences and perform SNP calling. For each sample, ustacks was executed to assemble identical sequences into putative alleles (primary stacks). The minimum sequences depth parameter m was set to five (m = 5), and all sequences have a nuclear distance less than or equal to the chosen value of the M parameter (M = 2). The complete catalog of loci from all individuals was created using cstacks with a maximum between-individual distance parameter of two (n = 2). Following by the cstacks catalog building, the sstacks program was used to identify the matching catalog locus for each of the de novo locus in each individual. Considering that a large percentage of duplicate sequences exist in RAD-sequencing data, we use --rm-pcr-duplicates in gstacks to minimize the effect of duplicate sequences in gsatcks. Finally, populations were implemented to identify SNPs with following parameter settings: (a) minimum number of populations a locus must be present in to process a locus: -p=1, 2, 3, 4, 5; (b) minimum percentage of individuals in a population required to process a locus for that population: -r=0.30, 0.40, 0.50, 0.60, 0.70, 0.80, 0.90; (c) a minimum minor allele frequency required to process a nucleotide site at a locus: --min-maf=0.05. A total of 35 data matrices were constructed to evaluate the effects of different missing data sets on phylogenetic construction.

4.4. Phylogenetic Inference

Based on 35 SNP datasets, VCF file was converted to phylip alignment format using the python script vcf2phylip.py [51]. It should be noted that when there are many gaps or ambiguity sites in the data set, -r or --resolve-IUPAC option is needed to resolve heterozygous genotypes to avoid IUPAC ambiguities in the matrices. Then ModelFinder [52] was implemented to choose best-fitted nucleotide substitution model for each dataset based on BIC (Bayesian Information Criterion) values. Then, maximum-likelihood phylogenetic trees were constructed using IQtree v2.0.3 with 1000 ultra-fast bootstraps and the -bnni option [53,54,55]. The total number of highly supported clades were used as a performance proxy for each independent analysis. To compare topologies among trees obtained from different SNPs datasets, we computed the Robinson-Foulds (RF) distances between a set of trees using the multiRF() function in R package phytools [56,57]. A principal coordinate analysis (PCoA) was then conducted on RF distance matrices using the cmdscale() function in R.

4.5. Genetic Diversity and Structure Analysis

Based on representative SNP dataset, population genetic statistics, including observed and expected heterozygosity (Obs_Het, Exp_Het), observed and expected homozygosity (Obs_Hom, Exp_Hom), nucleotide diversity (Pi), and inbreeding coefficient (FIS) were assessed using the "populations" program in STACKS [49,50]. The SNP-specific Weir and Cockerham weighted Fst estimator between two populations was calculated using --weir-fst-pop in VCFtools 0.1.16 [58]. Principal component analysis (PCA) were performed using the option --pca in PLINK v1.9 [59]. Furthermore, admixture analysis was performed to detect population structure by using ADMIXTURE (version: 1.3.0) [60].

4.6. Introgression Analyses

To analyze possible conflicting evolutionary signals, the SplitsTree4 software was used for computing an unrooted phylogenetic network for representative dataset [61]. Splits were created from Hamming distances and visualized as a neighbor net within with each end node representing an individual. To further explore whether tree discordances are due to past introgression, we quantified the Patterson’s D-statistic for all population quartets [62,63]. Calculations were performed using Dsuite Dtrios [64]. In each analysis, the most independent genetic component to the rest among B. sinensis species complex was used as the outgroup. For each test, the standard deviation of D was measured from 1000 bootstrap replicates. And then the observed D was converted to a Z-score measuring the number of standard deviations it deviates from zero. To account for multiple testing, we corrected P-values with Benjamini-Hochberg false discovery rate (FDR) [65]. To visualize species/population pairwise comparisons of D-statistic scores and f4-ratio, two heatmaps were generated using the Ruby script plot_d.rb and plot_f4ratio.rb from https://github.com/millanek/tutorials/.

5. Conclusions

In this study, by generating RAD sequencing data, we investigated the phylogenetic relationship and population genetic structure of B. sinensis species complex. Our findings indicate that taxa within B. sinensis species complex are indistinguishable phylogenetically and should not be considered as distinct species. In addition, population analysis confirmed that there is a difference in the degree of genetic differentiation between populations. Genetic diversity and differentiation might have been influenced by gene flow. The data generated in this study provides a resource to determine the phylogenetic relationships of ferns and future genetic diversity-related studies.

Supplementary Materials

The following supporting information can be downloaded at the website of this paper posted on Preprints.org. Figure S1: Maximum likelihood tree of all datasets; Figure S2: PCoA plot based on pairwise Robinson-Foulds distance (RF) between trees; Figure S3: Distribution of D-statistic, f4-ration and corrected p-values of all tested trios; Table S1: Detailed sample information of the geographical origins and venation pattern of Bolbitis sinensis species complex; Table S2: RAD-seq clean data information after filtering; Table S3: Detailed summary statistics of each program in STACKS pipeline; Table S4: Detailed information of datasets, including number of variant sites remained by population program, sites remained after data conversion using vcf2phylip scripts, number of parsimony-informative sites, singleton sites, constant sites identified by iqtree, and only informative sites used for final phylogeny for each data matrix; Table S5: the Robinson-Foulds (RF) distances between a set of trees using the multiRF() function in R package phytools; Table S6: Results of Principal Component Analysis (PCoA); Table S7: The cross validation (CV) error of Structure analysis; Table S8: Genetic component propotion of Structure analysis with p3-r0.70 dataset; Table S9: SNP statistics of p1-r0.60 dataset; Table S10: all combinations in ABBA-BABA test of p1-r0.60 dataset.

Author Contributions

Conceptualization, L.N. and F.W.; methodology, L.N., Z.W., Y.Y., and F.W.; software, L.N. and Z.X.; validation, L.N. and Y.F.; formal analysis, L.N. and Y.F.; investigation, L.N., X.W. and F.W.; resources, L.N., X.W. and F.W.; data curation, L.N.; writing—original draft preparation, L.N., Y.F. and F.W.; writing-review and editing, L.N., Y.F., Z.X., X.W., Z.W., Y.Y. and F.W.; visualization, L.N. and F.W.; Funding acquisition, Y.F. and F.W. All authors have read and agreed to the published version of the manuscript.

Funding

This research was funded by the National Natural Science Foundation of China (no. 31870188 to FG Wang, no. 32370243 to YH Fang).

Conflicts of Interest

The authors declare that they have no known competing financial interests or personal relationships that could have appeared to influence the work reported in this paper..

References

  1. Pinheiro, F.; Dantas-Queiroz, M.V.; Palma-Silva, C. Plant Species Complexes as Models to Understand Speciation and Evolution: A Review of South American Studies. Critical Reviews in Plant Sciences 2018, 37, 54–80. [Google Scholar] [CrossRef]
  2. Reydon, T.A.; Kunz, W. Species as natural entities, instrumental units and ranked taxa: new perspectives on the grouping and ranking problems. Biological Journal of the Linnean Society 2019, 126, 623–636. [Google Scholar] [CrossRef]
  3. Rannala, B.; Yang, Z. Species delimitation. In Phylogenetics in the Genomic Era, Scornavacca, C., Delsuc, F., and Galtier, N., Eds.; Self Published: 2020, pp. 1–18.
  4. Gage, J.L.; Jarquin, D.; Romay, C.; Lorenz, A.; Buckler, E.S.; Kaeppler, S.; Alkhalifah, N.; Bohn, M.; Campbell, D.A.; Edwards, J.; et al. The effect of artificial selection on phenotypic plasticity in maize. Nature Communications 2017, 8, 1348. [Google Scholar] [CrossRef] [PubMed]
  5. Abdelkrim, J.; Aznar-Cormano, L.; Buge, B.; Fedosov, A.; Kantor, Y.; Zaharias, P.; Puillandre, N. Delimiting species of marine gastropods (Turridae, Conoidea) using RAD sequencing in an integrative taxonomy framework. Molecular Ecology 2018, 27, 4591–4611. [Google Scholar] [CrossRef] [PubMed]
  6. Ru, D.; Sun, Y.; Wang, D.; Chen, Y.; Wang, T.; Hu, Q.; Abbott, R.J.; Liu, J. Population genomic analysis reveals that homoploid hybrid speciation can be a lengthy process. Molecular Ecology 2018, 27, 4875–4887. [Google Scholar] [CrossRef] [PubMed]
  7. Aguillon, S.M.; Dodge, T.O.; Preising, G.A.; Schumer, M. Introgression. Current Biology 2022, 32, R865–R868. [Google Scholar] [CrossRef] [PubMed]
  8. Moran, Robbin C. ; Labiak, Paulo H.; Sundue, M. Phylogeny and Character Evolution of the Bolbitidoid Ferns (Dryopteridaceae). International Journal of Plant Sciences 2010, 171, 547–559. [Google Scholar] [CrossRef]
  9. Zhang, X.; Wei, R.; Liu, H.; He, L.; Wang, L.; Zhang, G. Phylogeny and Classification of the Extant Lycophytes and Ferns from China. Chinese Bulletin of Botany 2013, 48, 119–137. [Google Scholar] [CrossRef]
  10. Wu, Z.H.a.W., Z.H. In Flora reipublicae popularis sinicae; Beijing, 1999; Volume 6, pp. 104–105.
  11. Ching, R.-C.; Wang, C.-H. Materiae ad floram filicum Sinensium. Journal of Systematics and Evolution 1983, 21, 211. [Google Scholar]
  12. Wang, F.; Kunio, I.; Xing, F. A new name of Bolbitis from China. American Fern Journal 2008, 98, 96–97. [Google Scholar]
  13. Hennipman, E. A monograph of the fern genus Bolbitis (Lomariopsidaceae). Leiden Botanical Series 1977, 2, 1–329. [Google Scholar]
  14. Dong, S.Y.; Zhang, X.C. A taxonomic revision of the fern genus Bolbitis (Bolbitidaceae) from China. Journal of Systematics and Evolution 2005, 43, 97. [Google Scholar] [CrossRef]
  15. Wang, F.; Xing, F. A new name in Chinese Bolbitidaceae. Novon: A Journal for Botanical Nomenclature 2006, 16, 434–435. [Google Scholar]
  16. Nie, L.Y.; Zhang, L.; Liang, Z.L.; Pollawatn, R.; Yan, Y.H.; Thi Lu, N.; Knapp, R.; Wan, X.; Cicuzza, D.; Cheng, X.X.; et al. Phylogeny, character evolution, and biogeography of the fern genus Bolbitis (Dryopteridaceae). Molecular Phylogenetics and Evolution 2023, 178, 107633. [Google Scholar] [CrossRef]
  17. Yu, X.; Yang, D.; Guo, C.; Gao, L. Plant phylogenomics based on genome-partitioning strategies: Progress and prospects. Plant Diversity 2018, 40, 158–164. [Google Scholar] [CrossRef] [PubMed]
  18. Miller, M.R.; Dunham, J.P.; Amores, A.; Cresko, W.A.; Johnson, E.A. Rapid and cost-effective polymorphism identification and genotyping using restriction site associated DNA (RAD) markers. Genome research 2007, 17, 240–248. [Google Scholar] [CrossRef] [PubMed]
  19. Baird, N.A.; Etter, P.D.; Atwood, T.S.; Currey, M.C.; Shiver, A.L.; Lewis, Z.A.; Selker, E.U.; Cresko, W.A.; Johnson, E.A. Rapid SNP Discovery and Genetic Mapping Using Sequenced RAD Markers. Plos One 2008, 3. [Google Scholar] [CrossRef] [PubMed]
  20. Andrews, K.R.; Good, J.M.; Miller, M.R.; Luikart, G.; Hohenlohe, P.A. Harnessing the power of RADseq for ecological and evolutionary genomics. Nature Reviews Genetics 2016, 17, 81–92. [Google Scholar] [CrossRef] [PubMed]
  21. Ledent, A.; Gauthier, J.; Pereira, M.; Overson, R.; Laenen, B.; Mardulyn, P.; Gradstein, S.R.; de Haan, M.; Ballings, P.; Van der Beeten, I.; et al. What do tropical cryptogams reveal? Strong genetic structure in Amazonian bryophytes. New Phytologist 2020, 228, 640–650. [Google Scholar] [CrossRef]
  22. Hipp, A.L.; Manos, P.S.; Hahn, M.; Avishai, M.; Bodenes, C.; Cavender-Bares, J.; Crowl, A.A.; Deng, M.; Denk, T.; Fitz-Gibbon, S.; et al. Genomic landscape of the global oak phylogeny. New Phytologist 2020, 226, 1198–1212. [Google Scholar] [CrossRef]
  23. Hipp, A.L.; Manos, P.S.; Gonzalez-Rodriguez, A.; Hahn, M.; Kaproth, M.; McVay, J.D.; Avalos, S.V.; Cavender-Bares, J. Sympatric parallel diversification of major oak clades in the Americas and the origins of Mexican species diversity. New Phytologist 2018, 217, 439–452. [Google Scholar] [CrossRef] [PubMed]
  24. Wang, X.; Ye, X.; Zhao, L.; Li, D.; Guo, Z.; Zhuang, H. Genome-wide RAD sequencing data provide unprecedented resolution of the phylogeny of temperate bamboos (Poaceae: Bambusoideae). Scientific Reports 2017, 7. [Google Scholar] [CrossRef]
  25. Zhang, Y.-X.; Guo, C.; Li, D.-Z. A new subtribal classification of Arundinarieae (Poaceae, Bambusoideae) with the description of a new genus. Plant Diversity 2020, 42, 127–134. [Google Scholar] [CrossRef] [PubMed]
  26. Ma, Z.Y.; Wen, J.; Tian, J.P.; Gui, L.L.; Liu, X.Q. Testing morphological trait evolution and assessing species delimitations in the grape genus using a phylogenomic framework. Molecular Phylogenetics and Evolution 2020, 148, 106809. [Google Scholar] [CrossRef] [PubMed]
  27. Jing, Y.; Bian, L.; Zhang, X.; Zhao, B.; Zheng, R.; Su, S.; Ye, D.; Zheng, X.; El-Kassaby, Y.A.; Shi, J. Genetic diversity and structure of the 4(th) cycle breeding population of Chinese fir (Cunninghamia lanceolata (lamb.) hook). Frontiers in Plant Science 2023, 14, 1106615. [Google Scholar] [CrossRef] [PubMed]
  28. Wang, J.; Dong, S.; Yang, L.; Harris, A.; Schneider, H.; Kang, M. Allopolyploid Speciation Accompanied by Gene Flow in a Tree Fern. Molecular Biology and Evolution 2020, 37, 2487–2502. [Google Scholar] [CrossRef] [PubMed]
  29. Lovell, J.T.; Williamson, R.J.; Wright, S.I.; McKay, J.K.; Sharbel, T.F. Mutation Accumulation in an Asexual Relative of Arabidopsis. PLoS Genetics 2017, 13, e1006550. [Google Scholar] [CrossRef] [PubMed]
  30. Hojsgaard, D.; Horandl, E. A little bit of sex matters for genome evolution in asexual plants. Frontiers in Plant Science 2015, 6, 82. [Google Scholar] [CrossRef] [PubMed]
  31. Horandl, E. Apomixis and the paradox of sex in plants. Annals of Botany 2024, mcae044. [Google Scholar] [CrossRef]
  32. Rodriguez-Gonzalez, P.M.; Garcia, C.; Albuquerque, A.; Monteiro-Henriques, T.; Faria, C.; Guimaraes, J.B.; Mendonca, D.; Simoes, F.; Ferreira, M.T.; Mendes, A.; et al. A spatial stream-network approach assists in managing the remnant genetic diversity of riparian forests. Scientific Reports 2019, 9, 6741. [Google Scholar] [CrossRef]
  33. Sexton, J.P.; Hangartner, S.B.; Hoffmann, A.A. Genetic isolation by environment or distance: which pattern of gene flow is most common? Evolution 2014, 68, 1–15. [Google Scholar] [CrossRef]
  34. Wang, I.J.; Glor, R.E.; Losos, J.B. Quantifying the roles of ecology and geography in spatial genetic divergence. Ecology letters 2013, 16, 175–182. [Google Scholar] [CrossRef]
  35. Garot, E.; Joet, T.; Combes, M.C.; Lashermes, P. Genetic diversity and population divergences of an indigenous tree (Coffea mauritiana) in Reunion Island: role of climatic and geographical factors. Heredity 2019, 122, 833–847. [Google Scholar] [CrossRef] [PubMed]
  36. Govindaraju, D.R. Variation in gene flow levels among predominantly self-pollinated plants. Journal of Evolutionary Biology 1989, 2, 173–181. [Google Scholar] [CrossRef]
  37. Twyford, A.D.; Wong, E.L.Y.; Friedman, J. Multi-level patterns of genetic structure and isolation by distance in the widespread plant Mimulus guttatus. Heredity 2020, 125, 227–239. [Google Scholar] [CrossRef]
  38. Wang, S.Q. Genetic diversity and population structure of the endangered species Paeonia decomposita endemic to China and implications for its conservation. BMC Plant Biology 2020, 20, 510. [Google Scholar] [CrossRef]
  39. Zhang, Y.H.; Wang, I.J.; Comes, H.P.; Peng, H.; Qiu, Y.X. Contributions of historical and contemporary geographic and environmental factors to phylogeographic structure in a Tertiary relict species, Emmenopterys henryi (Rubiaceae). Scientific Reports 2016, 6, 24041. [Google Scholar] [CrossRef]
  40. Casteleyn, G.; Leliaert, F.; Backeljau, T.; Debeer, A.E.; Kotaki, Y.; Rhodes, L.; Lundholm, N.; Sabbe, K.; Vyverman, W. Limits to gene flow in a cosmopolitan marine planktonic diatom. Proceedings of the National Academy of Sciences 2010, 107, 12952–12957. [Google Scholar] [CrossRef] [PubMed]
  41. Abdelaziz, M.; Munoz-Pajares, A.J.; Berbel, M.; Garcia-Munoz, A.; Gomez, J.M.; Perfectti, F. Asymmetric Reproductive Barriers and Gene Flow Promote the Rise of a Stable Hybrid Zone in the Mediterranean High Mountain. Frontiers in Plant Science 2021, 12, 687094. [Google Scholar] [CrossRef]
  42. Wang, Z.; Jiang, Y.; Bi, H.; Lu, Z.; Ma, Y.; Yang, X.; Chen, N.; Tian, B.; Liu, B.; Mao, X.; et al. Hybrid speciation via inheritance of alternate alleles of parental isolating genes. Molecular Plant 2021, 14, 208–222. [Google Scholar] [CrossRef]
  43. Pickup, M.; Brandvain, Y.; Fraisse, C.; Yakimowski, S.; Barton, N.H.; Dixit, T.; Lexer, C.; Cereghetti, E.; Field, D.L. Mating system variation in hybrid zones: facilitation, barriers and asymmetries to gene flow. New Phytologist 2019, 224, 1035–1047. [Google Scholar] [CrossRef] [PubMed]
  44. Kling, M.M.; Ackerly, D.D. Global wind patterns shape genetic differentiation, asymmetric gene flow, and genetic diversity in trees. Proceedings of the National Academy of Sciences 2021, 118. [Google Scholar] [CrossRef] [PubMed]
  45. Chang, C.W.; Fridman, E.; Mascher, M.; Himmelbach, A.; Schmid, K. Physical geography, isolation by distance and environmental variables shape genomic variation of wild barley (Hordeum vulgare L. ssp. spontaneum) in the Southern Levant. Heredity 2022, 128, 107–119. [Google Scholar] [CrossRef] [PubMed]
  46. Doyle, J. DNA protocols for plants. In Molecular techniques in taxonomy; Springer, 1991; pp. 283–293. [Google Scholar]
  47. Ali, O.A.; O’Rourke, S.M.; Amish, S.J.; Meek, M.H.; Luikart, G.; Jeffres, C.; Miller, M.R. RAD capture (Rapture): flexible and efficient sequence-based genotyping. Genetics 2016, 202, 389–400. [Google Scholar] [CrossRef] [PubMed]
  48. Bolger, A.M.; Lohse, M.; Usadel, B. Trimmomatic: a flexible trimmer for Illumina sequence data. Bioinformatics 2014, 30, 2114–2120. [Google Scholar] [CrossRef] [PubMed]
  49. Rochette, N.C.; Catchen, J.M. Deriving genotypes from RAD-seq short-read data using Stacks. Nature Protocols 2017, 12, 2640–2659. [Google Scholar] [CrossRef] [PubMed]
  50. Rochette, N.C.; Rivera-Colon, A.G.; Catchen, J.M. Stacks 2: Analytical methods for paired-end sequencing improve RADseq-based population genomics. Molecular Ecology 2019, 28, 4737–4754. [Google Scholar] [CrossRef] [PubMed]
  51. Ortiz, E.M. vcf2phylip v2. 0: convert a VCF matrix into several matrix formats for phylogenetic analysis. URL https://doi org/105281/zenodo 2019, 2540861. [Google Scholar]
  52. Kalyaanamoorthy, S.; Bui Quang, M.; Wong, T.K.F.; von Haeseler, A.; Jermiin, L.S. ModelFinder: fast model selection for accurate phylogenetic estimates. Nature Methods 2017, 14, 587. [Google Scholar] [CrossRef]
  53. Hoang, D.T.; Chernomor, O.; von Haeseler, A.; Minh, B.Q.; Vinh, L.S. UFBoot2: Improving the Ultrafast Bootstrap Approximation. Molecular Biology and Evolution 2018, 35, 518–522. [Google Scholar] [CrossRef]
  54. Stamatakis, A.; Hoover, P.; Rougemont, J. A Rapid Bootstrap Algorithm for the RAxML Web Servers. Systematic Biology 2008, 57, 758–771. [Google Scholar] [CrossRef] [PubMed]
  55. Nguyen, L.-T.; Schmidt, H.A.; von Haeseler, A.; Minh, B.Q. IQ-TREE: a fast and effective stochastic algorithm for estimating maximum-likelihood phylogenies. Molecular Biology and Evolution 2015, 32, 268–274. [Google Scholar] [CrossRef] [PubMed]
  56. Revell, L.J. phytools: an R package for phylogenetic comparative biology (and other things). Methods in Ecology and Evolution 2012, 3, 217–223. [Google Scholar] [CrossRef]
  57. Robinson, D.F.; Foulds, L.R. Comparison of phylogenetic trees. Mathematical Biosciences 1981, 53, 131–147. [Google Scholar] [CrossRef]
  58. Danecek, P.; Auton, A.; Abecasis, G.; Albers, C.A.; Banks, E.; DePristo, M.A.; Handsaker, R.E.; Lunter, G.; Marth, G.T.; Sherry, S.T.; et al. The variant call format and VCFtools. Bioinformatics 2011, 27, 2156–2158. [Google Scholar] [CrossRef] [PubMed]
  59. Purcell, S.; Neale, B.; Todd-Brown, K.; Thomas, L.; Ferreira, M.A.R.; Bender, D.; Maller, J.; Sklar, P.; de Bakker, P.I.W.; Daly, M.J.; et al. PLINK: A tool set for whole-genome association and population-based linkage analyses. American Journal of Human Genetics 2007, 81, 559–575. [Google Scholar] [CrossRef]
  60. Alexander, D.H.; Novembre, J.; Lange, K. Fast model-based estimation of ancestry in unrelated individuals. Genome research 2009, 19, 1655–1664. [Google Scholar] [CrossRef] [PubMed]
  61. Huson, D.H.; Bryant, D. Application of phylogenetic networks in evolutionary studies. Molecular Biology and Evolution 2006, 23, 254–267. [Google Scholar] [CrossRef] [PubMed]
  62. Patterson, N.; Moorjani, P.; Luo, Y.; Mallick, S.; Rohland, N.; Zhan, Y.; Genschoreck, T.; Webster, T.; Reich, D. Ancient Admixture in Human History. Genetics 2012, 192, 1065. [Google Scholar] [CrossRef]
  63. Green, R.E.; Krause, J.; Briggs, A.W.; Maricic, T.; Stenzel, U.; Kircher, M.; Patterson, N.; Li, H.; Zhai, W.; Fritz, M.H.; et al. A draft sequence of the Neandertal genome. Science 2010, 328, 710–722. [Google Scholar] [CrossRef]
  64. Malinsky, M.; Matschiner, M.; Svardal, H. Dsuite-Fast D-statistics and related admixture evidence from VCF files. Molecular Ecology Resources 2021, 21, 584–595. [Google Scholar] [CrossRef] [PubMed]
  65. Benjamini, Y.; Hochberg, Y. A direct approach to false discovery rates. Journal of the Royal Statistical Society Series B: Statistical Methodology 1995, 57, 289–300. [Google Scholar] [CrossRef]
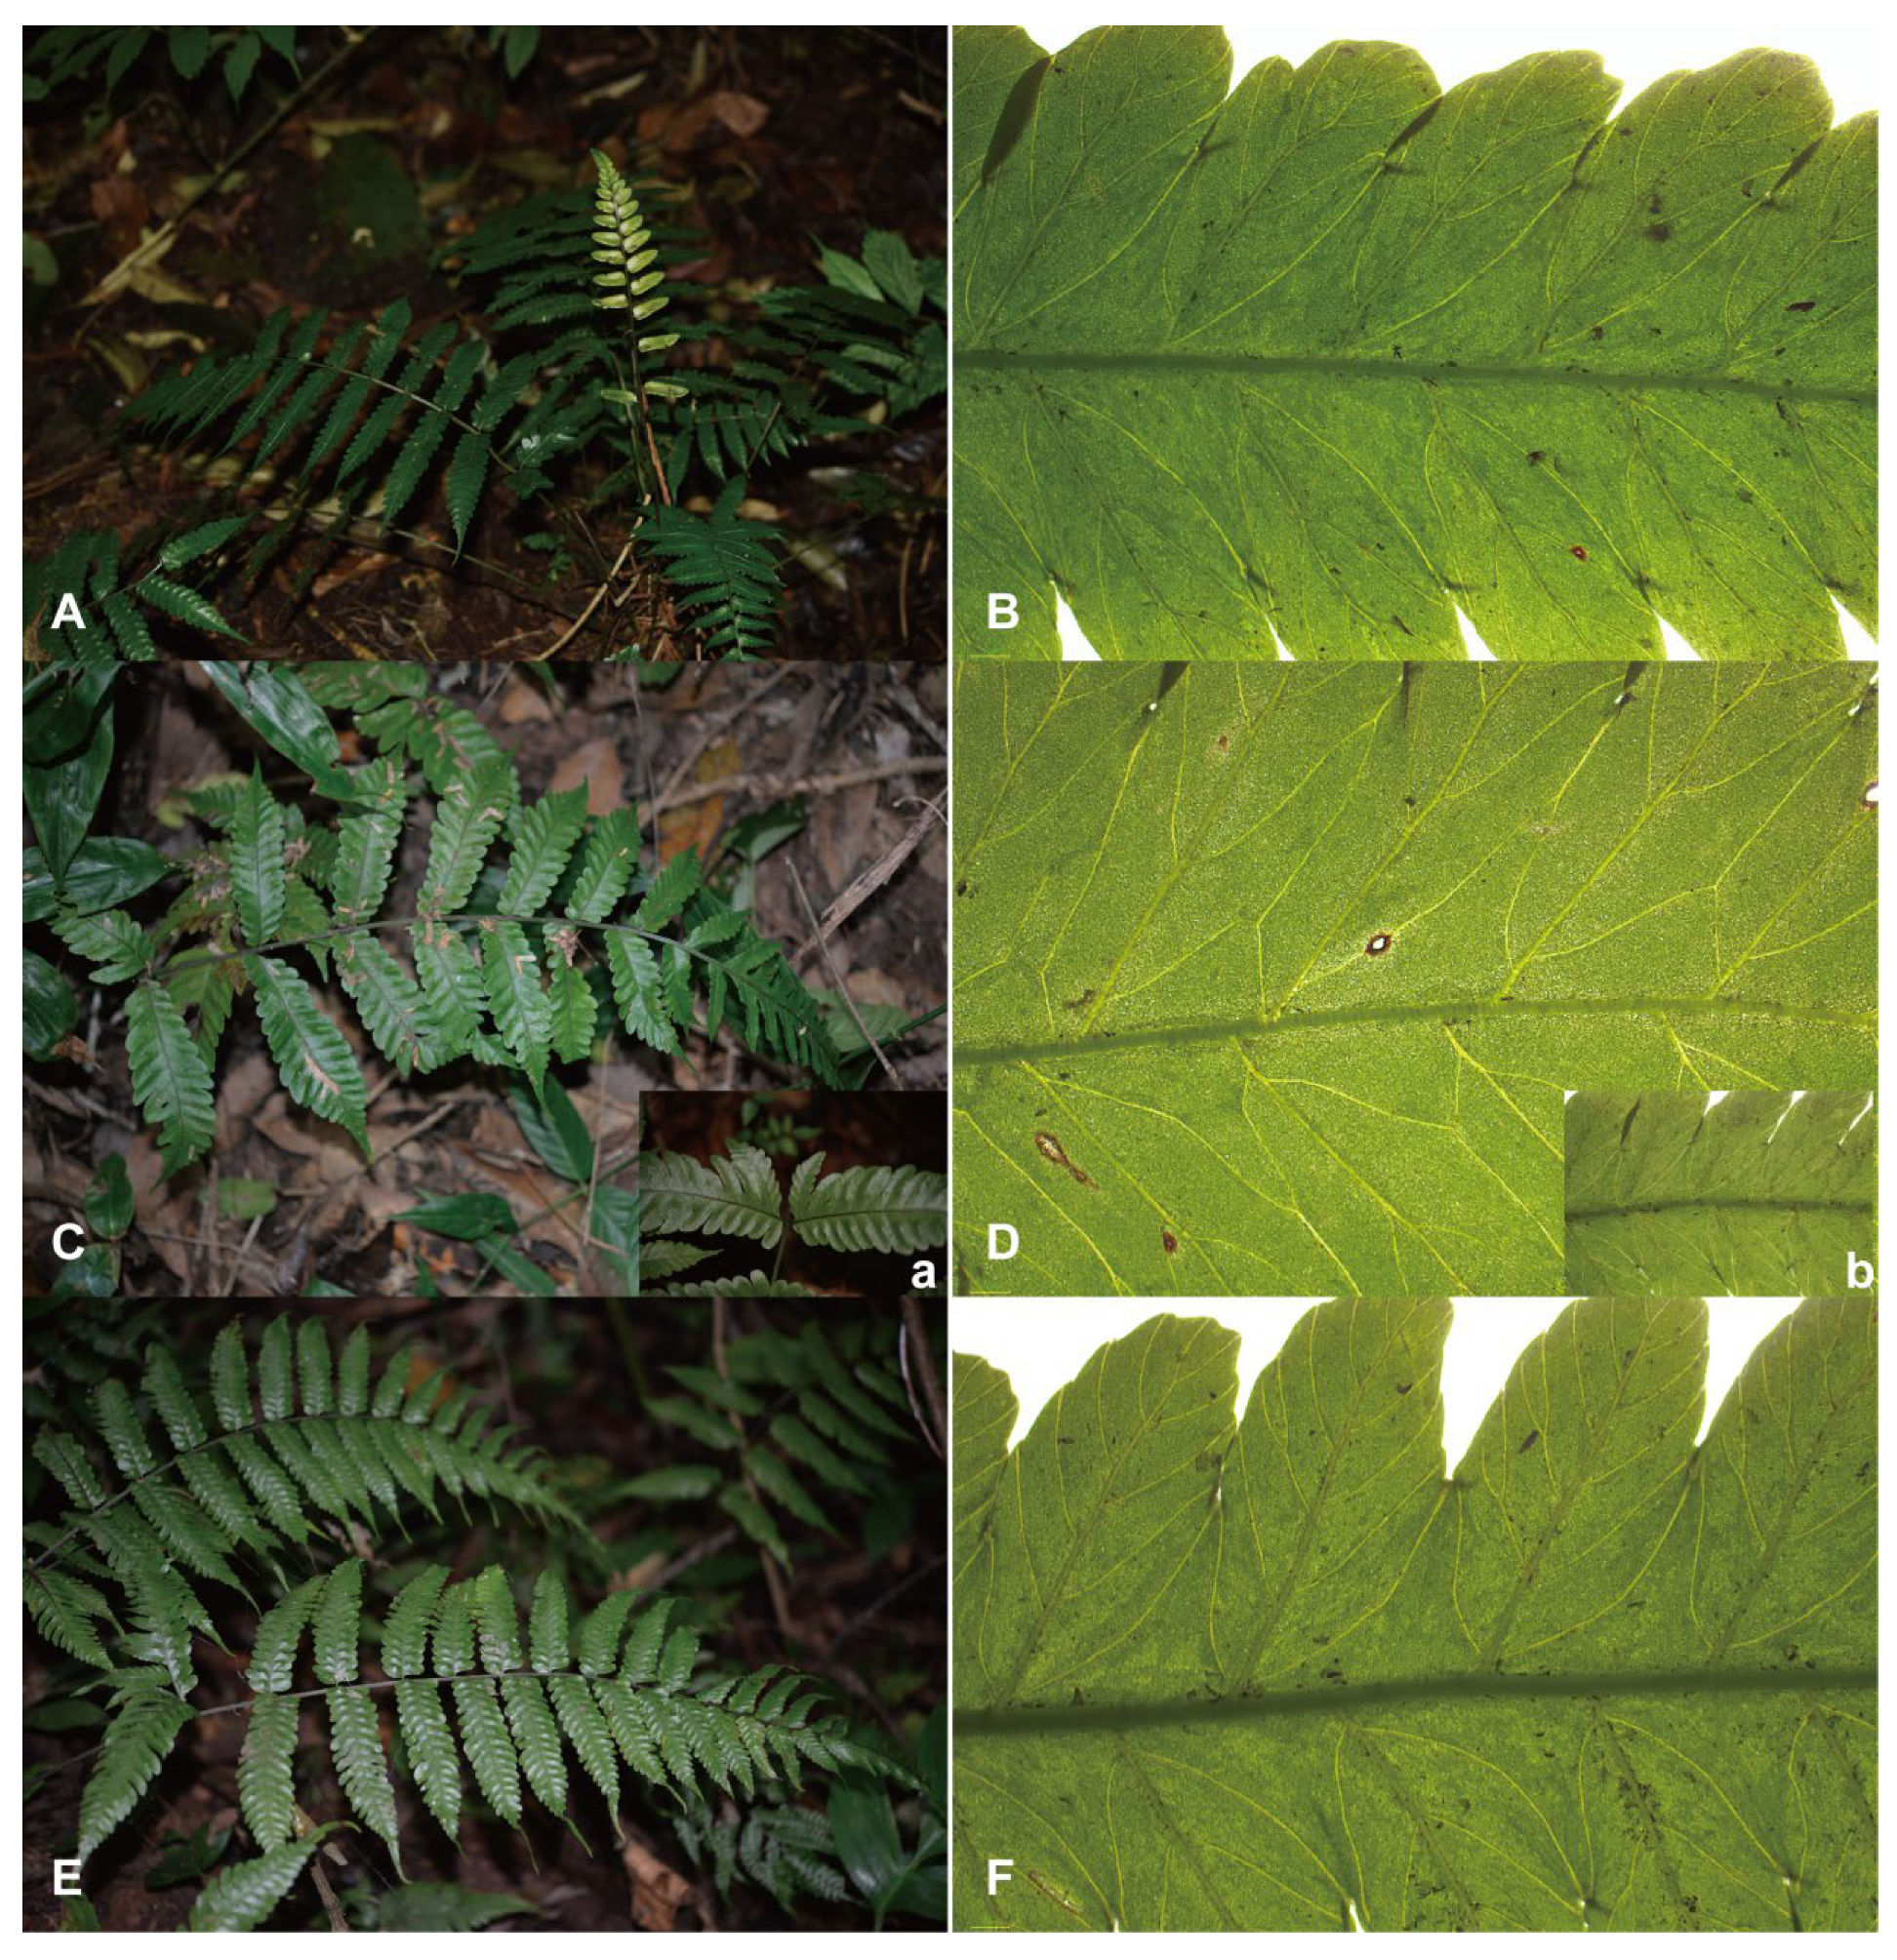
Figure 1. Morphology of Bolbitis sinensis species complex in the wild and variation in venation pattern. (A – B) B. sinensis and its free-anastomosing veinlets; (C – D) B. × multipinna and anastomosing veinlets; (E – F) B. longiaurita with the basiscopic 2 or 3 lobes undeveloped and free-anastomosing veinlets; (a – b) showing the undeveloped lobes at base and free veinlets observed in B. × multipinna.
Preprints 108118 g001
Figure 2. Phylogenetic tree and network analysis of B. sinensis species complex. (A) Representative maximum likelihood tree with p1-r0.60 dataset (9,467 SNPs) of 65 individuals, numbers above branches are bootstrap values based on 1000 replicates; (B) Neighbor-net splits network with p1-r0.60 dataset based on Hamming distances. Branch lengths are proportional to absolute distances calculated from the SNP matrix.
Preprints 108118 g002
Figure 3. Estimated population structure of B. sinensis species complex. (A) The distribution of K for 35 SNP datasets in structure analysis; (B) STRUCTURE plot for dataset p3-r0.70 (1,031 SNPs) when K=2. (C) Plot of the first two components of PCA for dataset p1-r0.60 (9,467 SNPs) and p3-r0.70 (1,031 SNPs). Values in parenthesis indicate the percentage of the variance explained.
Preprints 108118 g003
Figure 4. Gene flow is extensive between B. sinensis species complex. (A) D-statistic values shown between species with significant, excess allele sharing. (B) Admixture proportions (f4-ratio) between species with evidence of significant excess allele sharing.
Preprints 108118 g004
Table 1. sample collected among B. sinensis species complex.
Taxon Population code Locality Population size
B. sinensis Sin_BB Bubeng, Mengla, Yunnan, China 10
Sin_NG Nangongshan, Mengla, Yunnan, China 6
Sin_NP Nanping, Mengla, Yunnan, China 3
Sin_ML Menglun, Mengla, Yunnan, China 3
Sin_PT Puwen, Jinghong, Yunnan, China 4
B. × multipinna Mul_BB Bubeng, Mengla, Yunnan, China 12
Mul_NG Nangongshan, Mengla, Yunnan, China 3
Mul_NP Nanping, Mengla, Yunnan, China 2
Mul_ML Menglun, Mengla, Yunnan, China 5
Mul_PT Puwen, Jinghong, Yunnan, China 9
B. longiaurita Lon_NG Nangongshan, Mengla, Yunnan, China 2
Lon_NP Nanping, Mengla, Yunnan, China 2
B. sp Sp_NG Nangongshan, Mengla, Yunnan, China 2
B. sp Sp_PT Puwen, Jinghong, Yunnan, China 2
Table 2. Genetic diversity analysis of B. sinensis species complex.
Pop ID Private Num_Indv Obs_Het Obs_Hom Exp_Het Exp_Hom Pi Fis
BB 381 17.17512 0.1168 0.8832 0.11173 0.88827 0.11527 0.03708
NG 573 9.8632 0.15594 0.84406 0.14675 0.85325 0.15519 0.03164
NP 221 5.71069 0.16309 0.83691 0.14162 0.85838 0.15601 0.00498
ML 390 6.13749 0.22184 0.77816 0.18258 0.81742 0.20043 -0.01523
PT 616 11.23925 0.16946 0.83054 0.15015 0.84985 0.15775 0.01291
Note: Pop ID, Population ID as defined in the text; Private, Number of private alleles in this population; Num_Indv, Mean number of individuals per locus in this population; Obs_Hom, Mean expected homozygosity in this population; Exp_Hom: Mean expected homozygosity; Obs_Het: Mean obsered heterozygosity; Exp_Het: Mean expected heterozygosity; Pi: Nucleotide diversity; Fis: inbreeding coefficient.
Table 3. Comparison of Fst between different populations.
weighted Fst BB NG NP ML PT
BB /
NG 0.0689 /
NP 0.071 -0.0033 /
ML 0.0834 0.0258 0.0198 /
PT 0.1574 0.0678 0.078 0.0817 /
Disclaimer/Publisher’s Note: The statements, opinions and data contained in all publications are solely those of the individual author(s) and contributor(s) and not of MDPI and/or the editor(s). MDPI and/or the editor(s) disclaim responsibility for any injury to people or property resulting from any ideas, methods, instructions or products referred to in the content.
Copyright: This open access article is published under a Creative Commons CC BY 4.0 license, which permit the free download, distribution, and reuse, provided that the author and preprint are cited in any reuse.
Alerts
Prerpints.org logo

Preprints.org is a free preprint server supported by MDPI in Basel, Switzerland.

Subscribe

© 2025 MDPI (Basel, Switzerland) unless otherwise stated