Submitted:
03 June 2024
Posted:
03 June 2024
You are already at the latest version
Abstract
Keywords:
1. Introduction
2. Materials
2.1. Materials
2.2. Formulation of Epoxy Sample
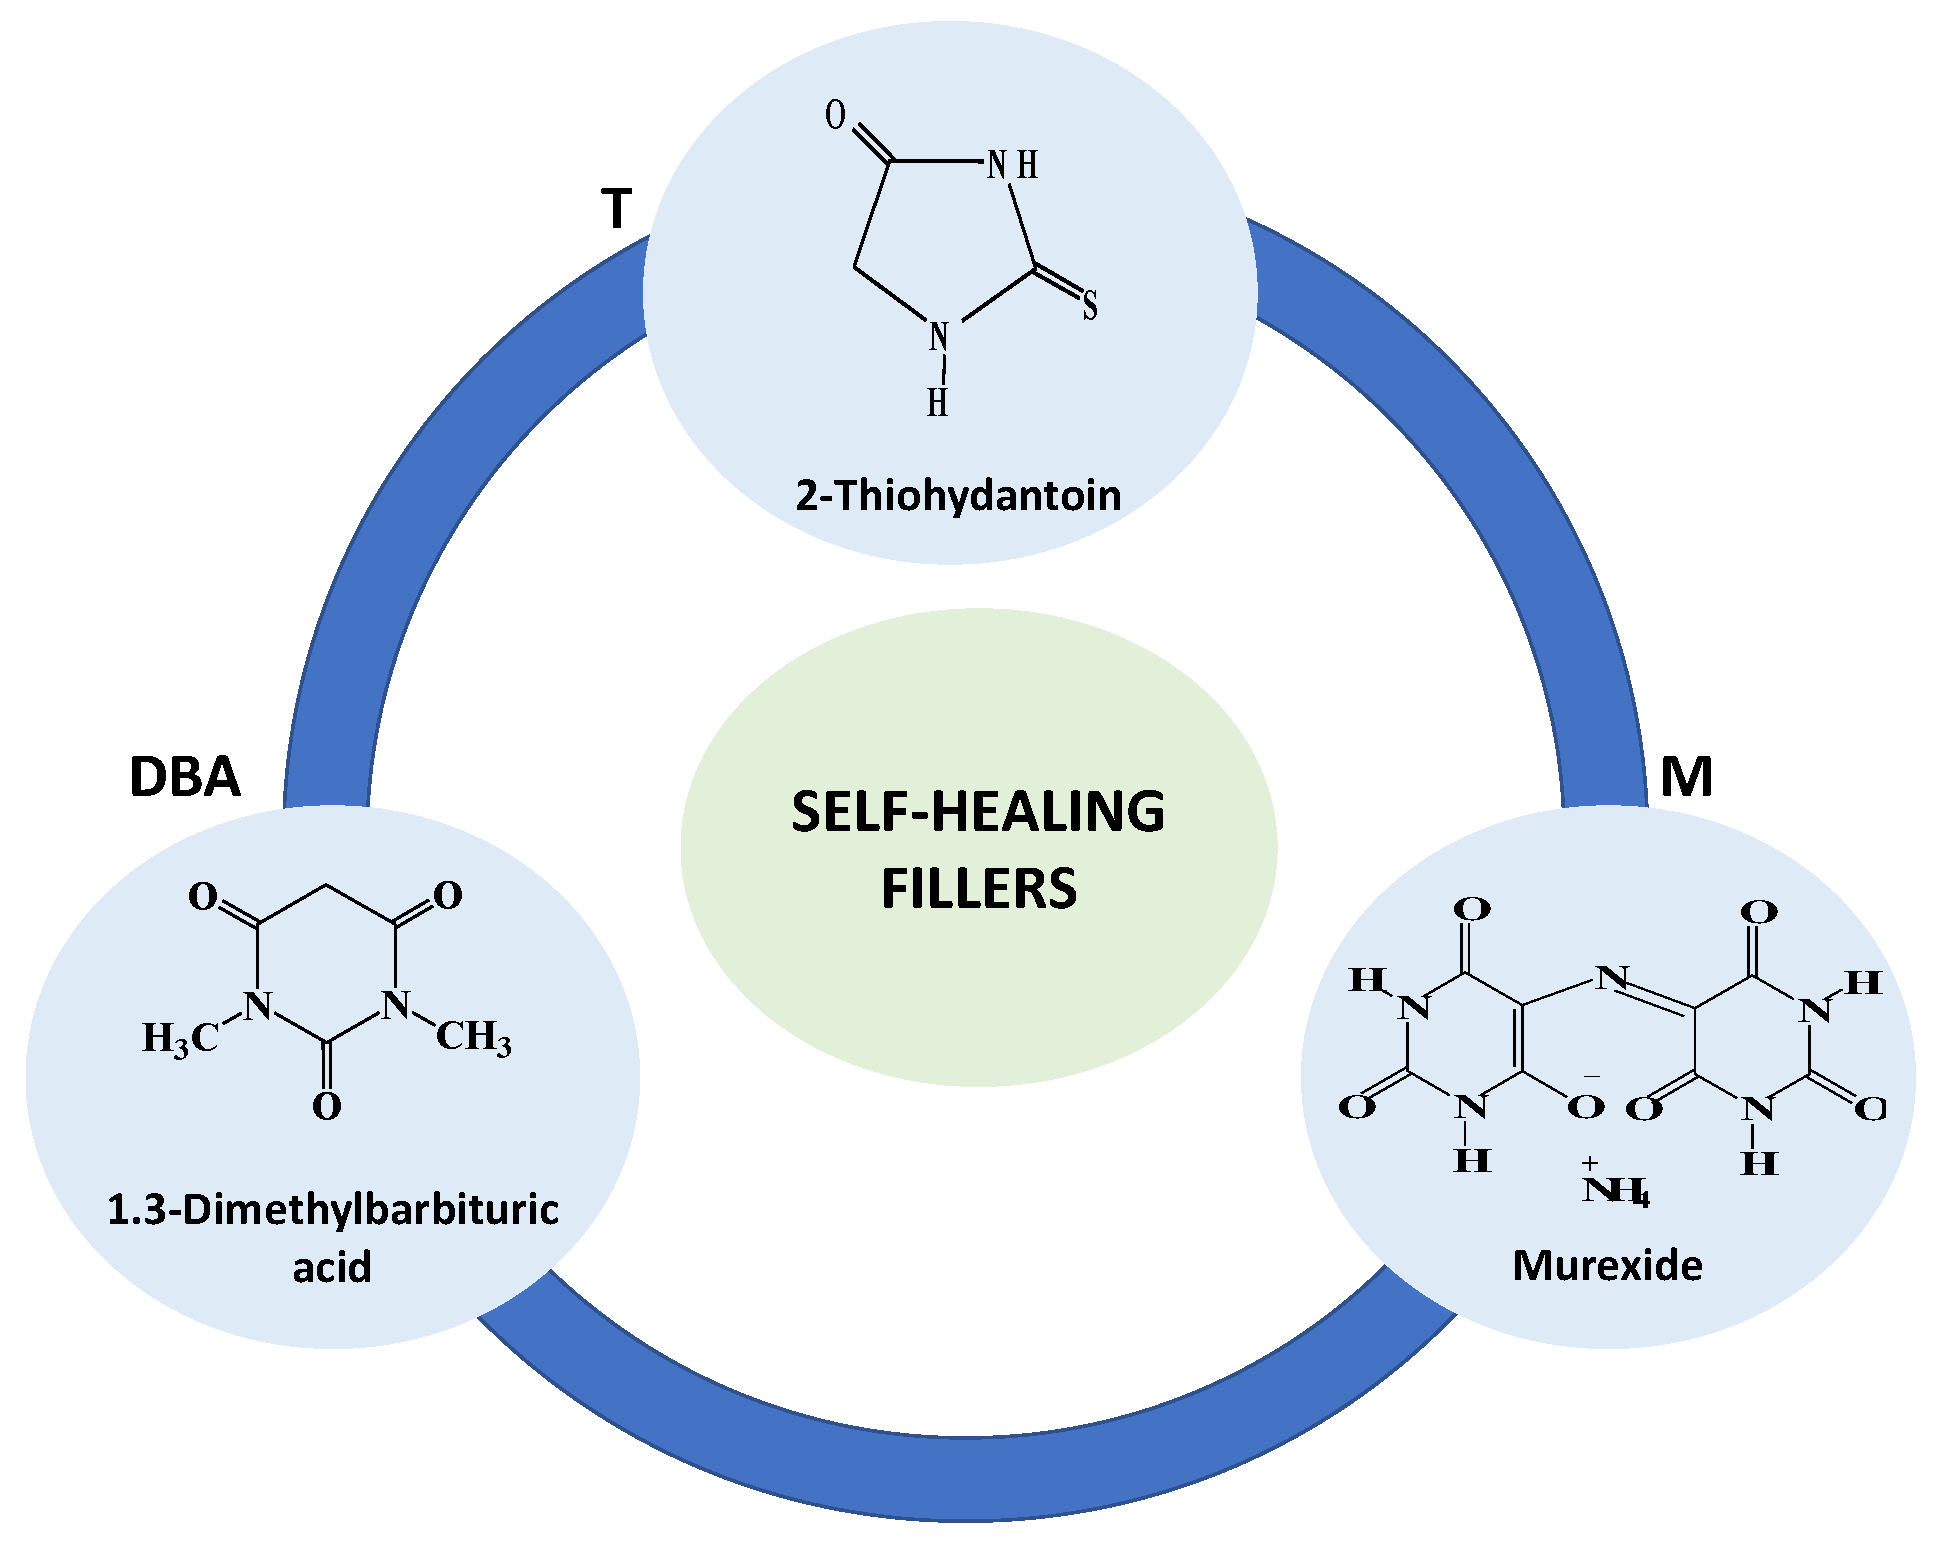
2.1.1. Functionalized Epoxy Precursor
2.1.2. Functionalized Epoxy Samples
2.3. Morphological Analysis by Scanning Electron Microscope (SEM)
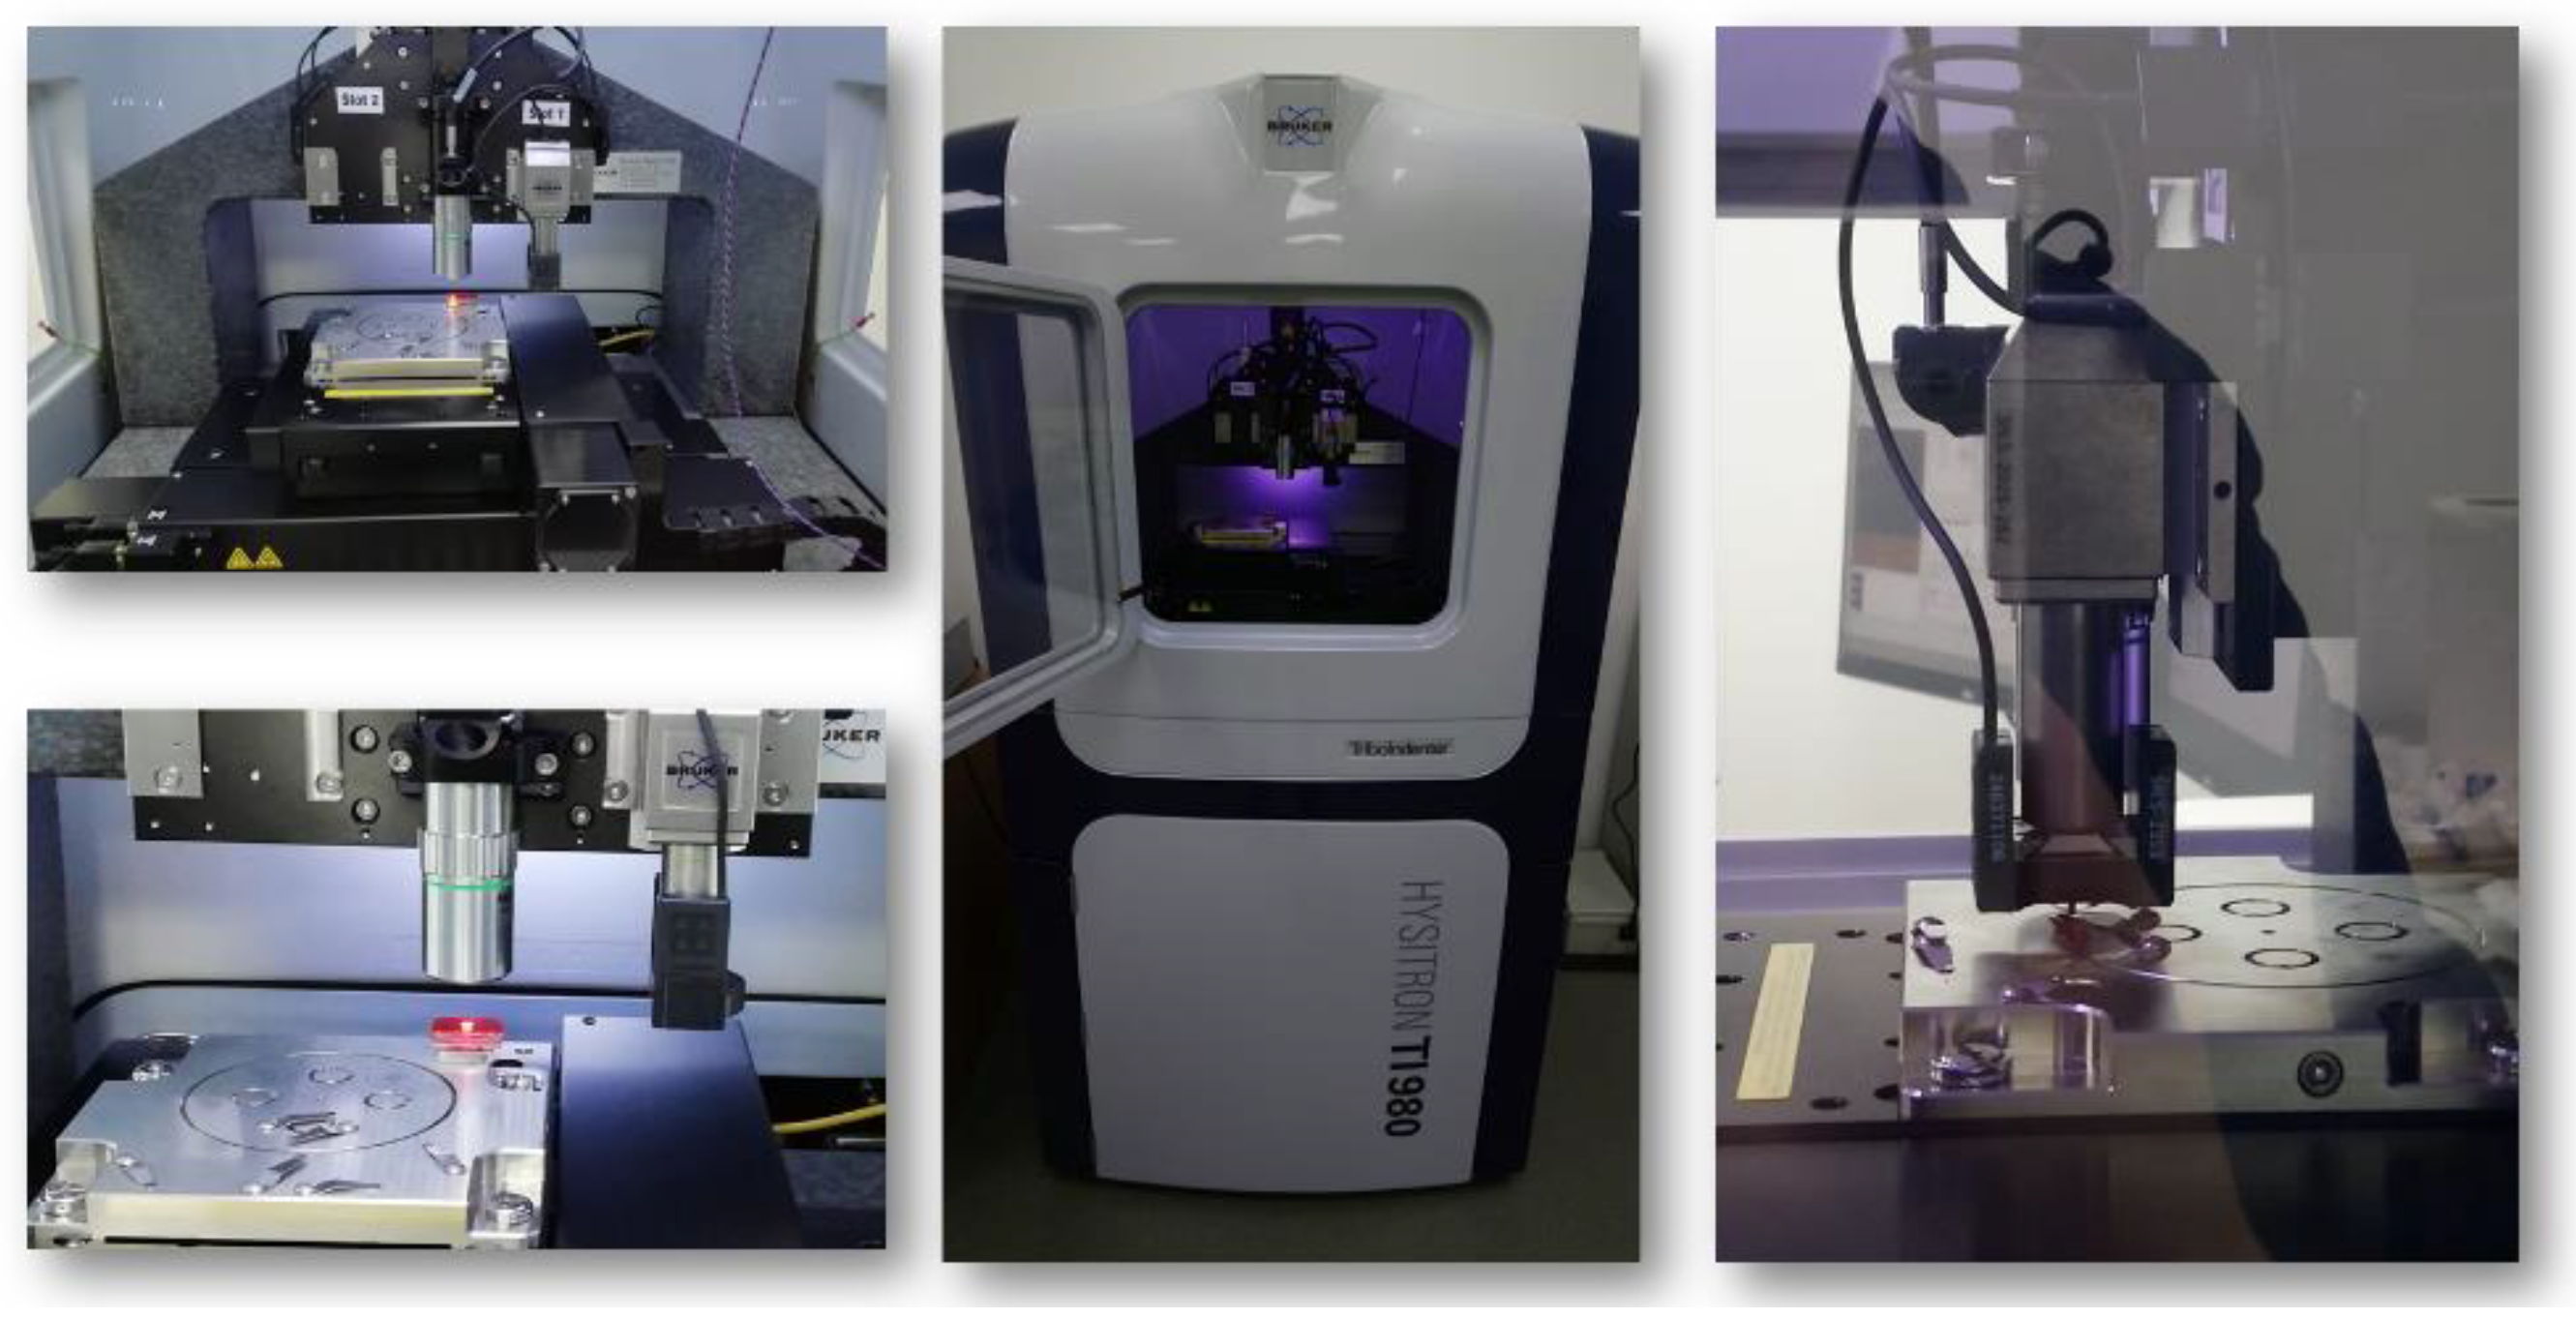
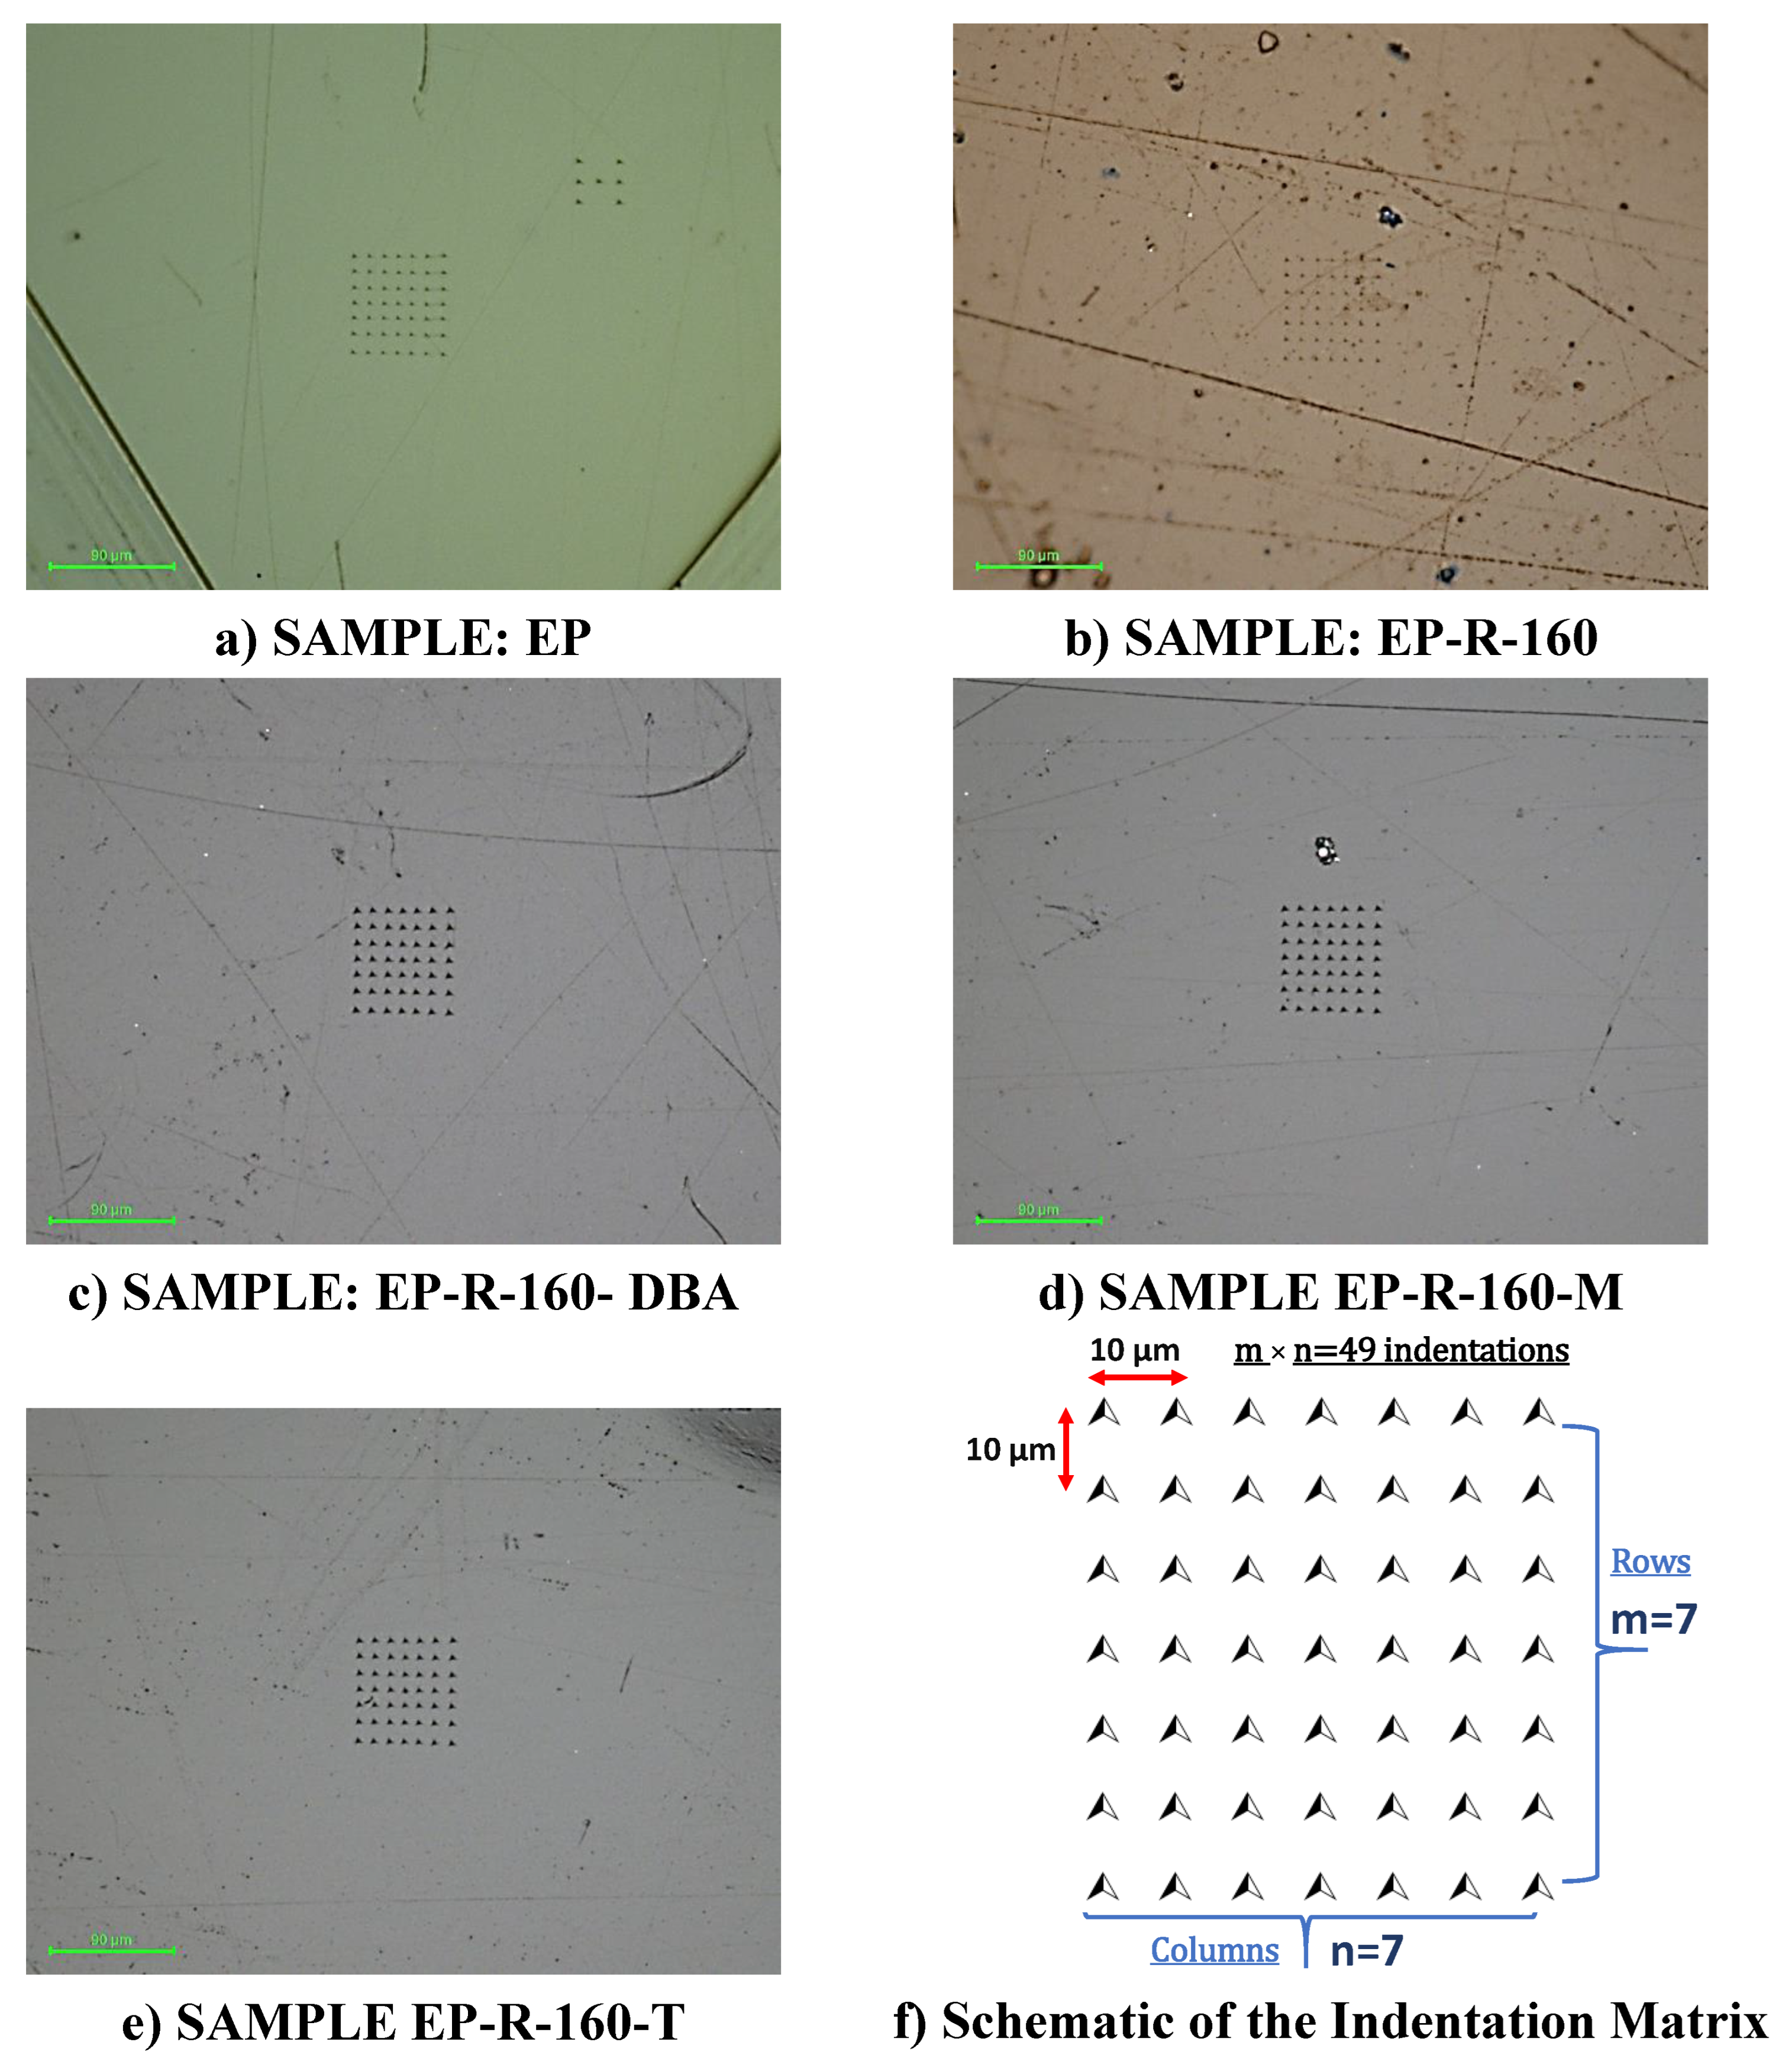
2.4. Nano-Indentation Tests
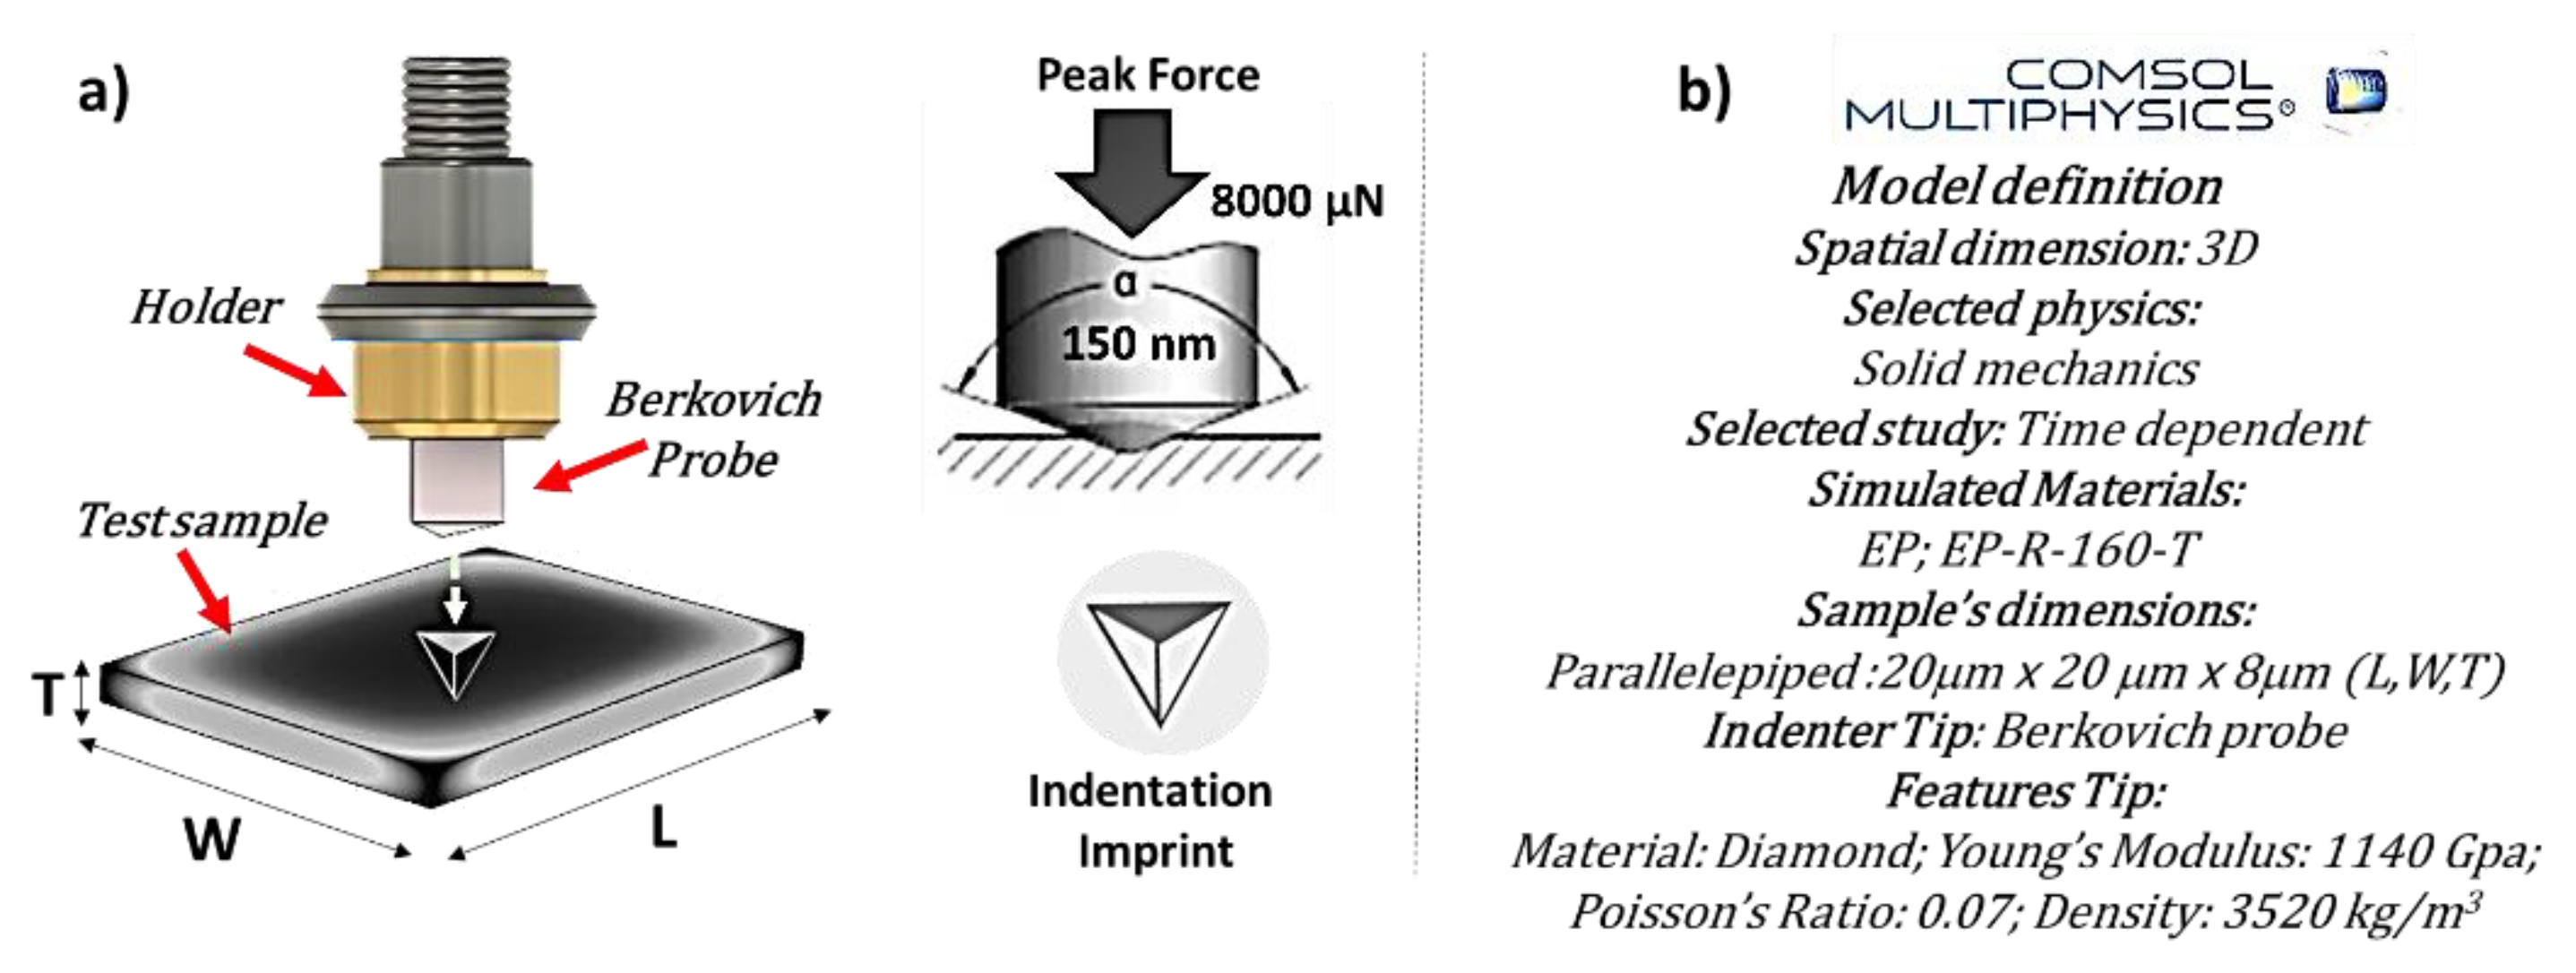
2.5. Multiphisic Simulation Study of Naomechanical Properties
3. Results
3.1. Morphological Investigation
3.2. Quasi-Static Nano-Indentation
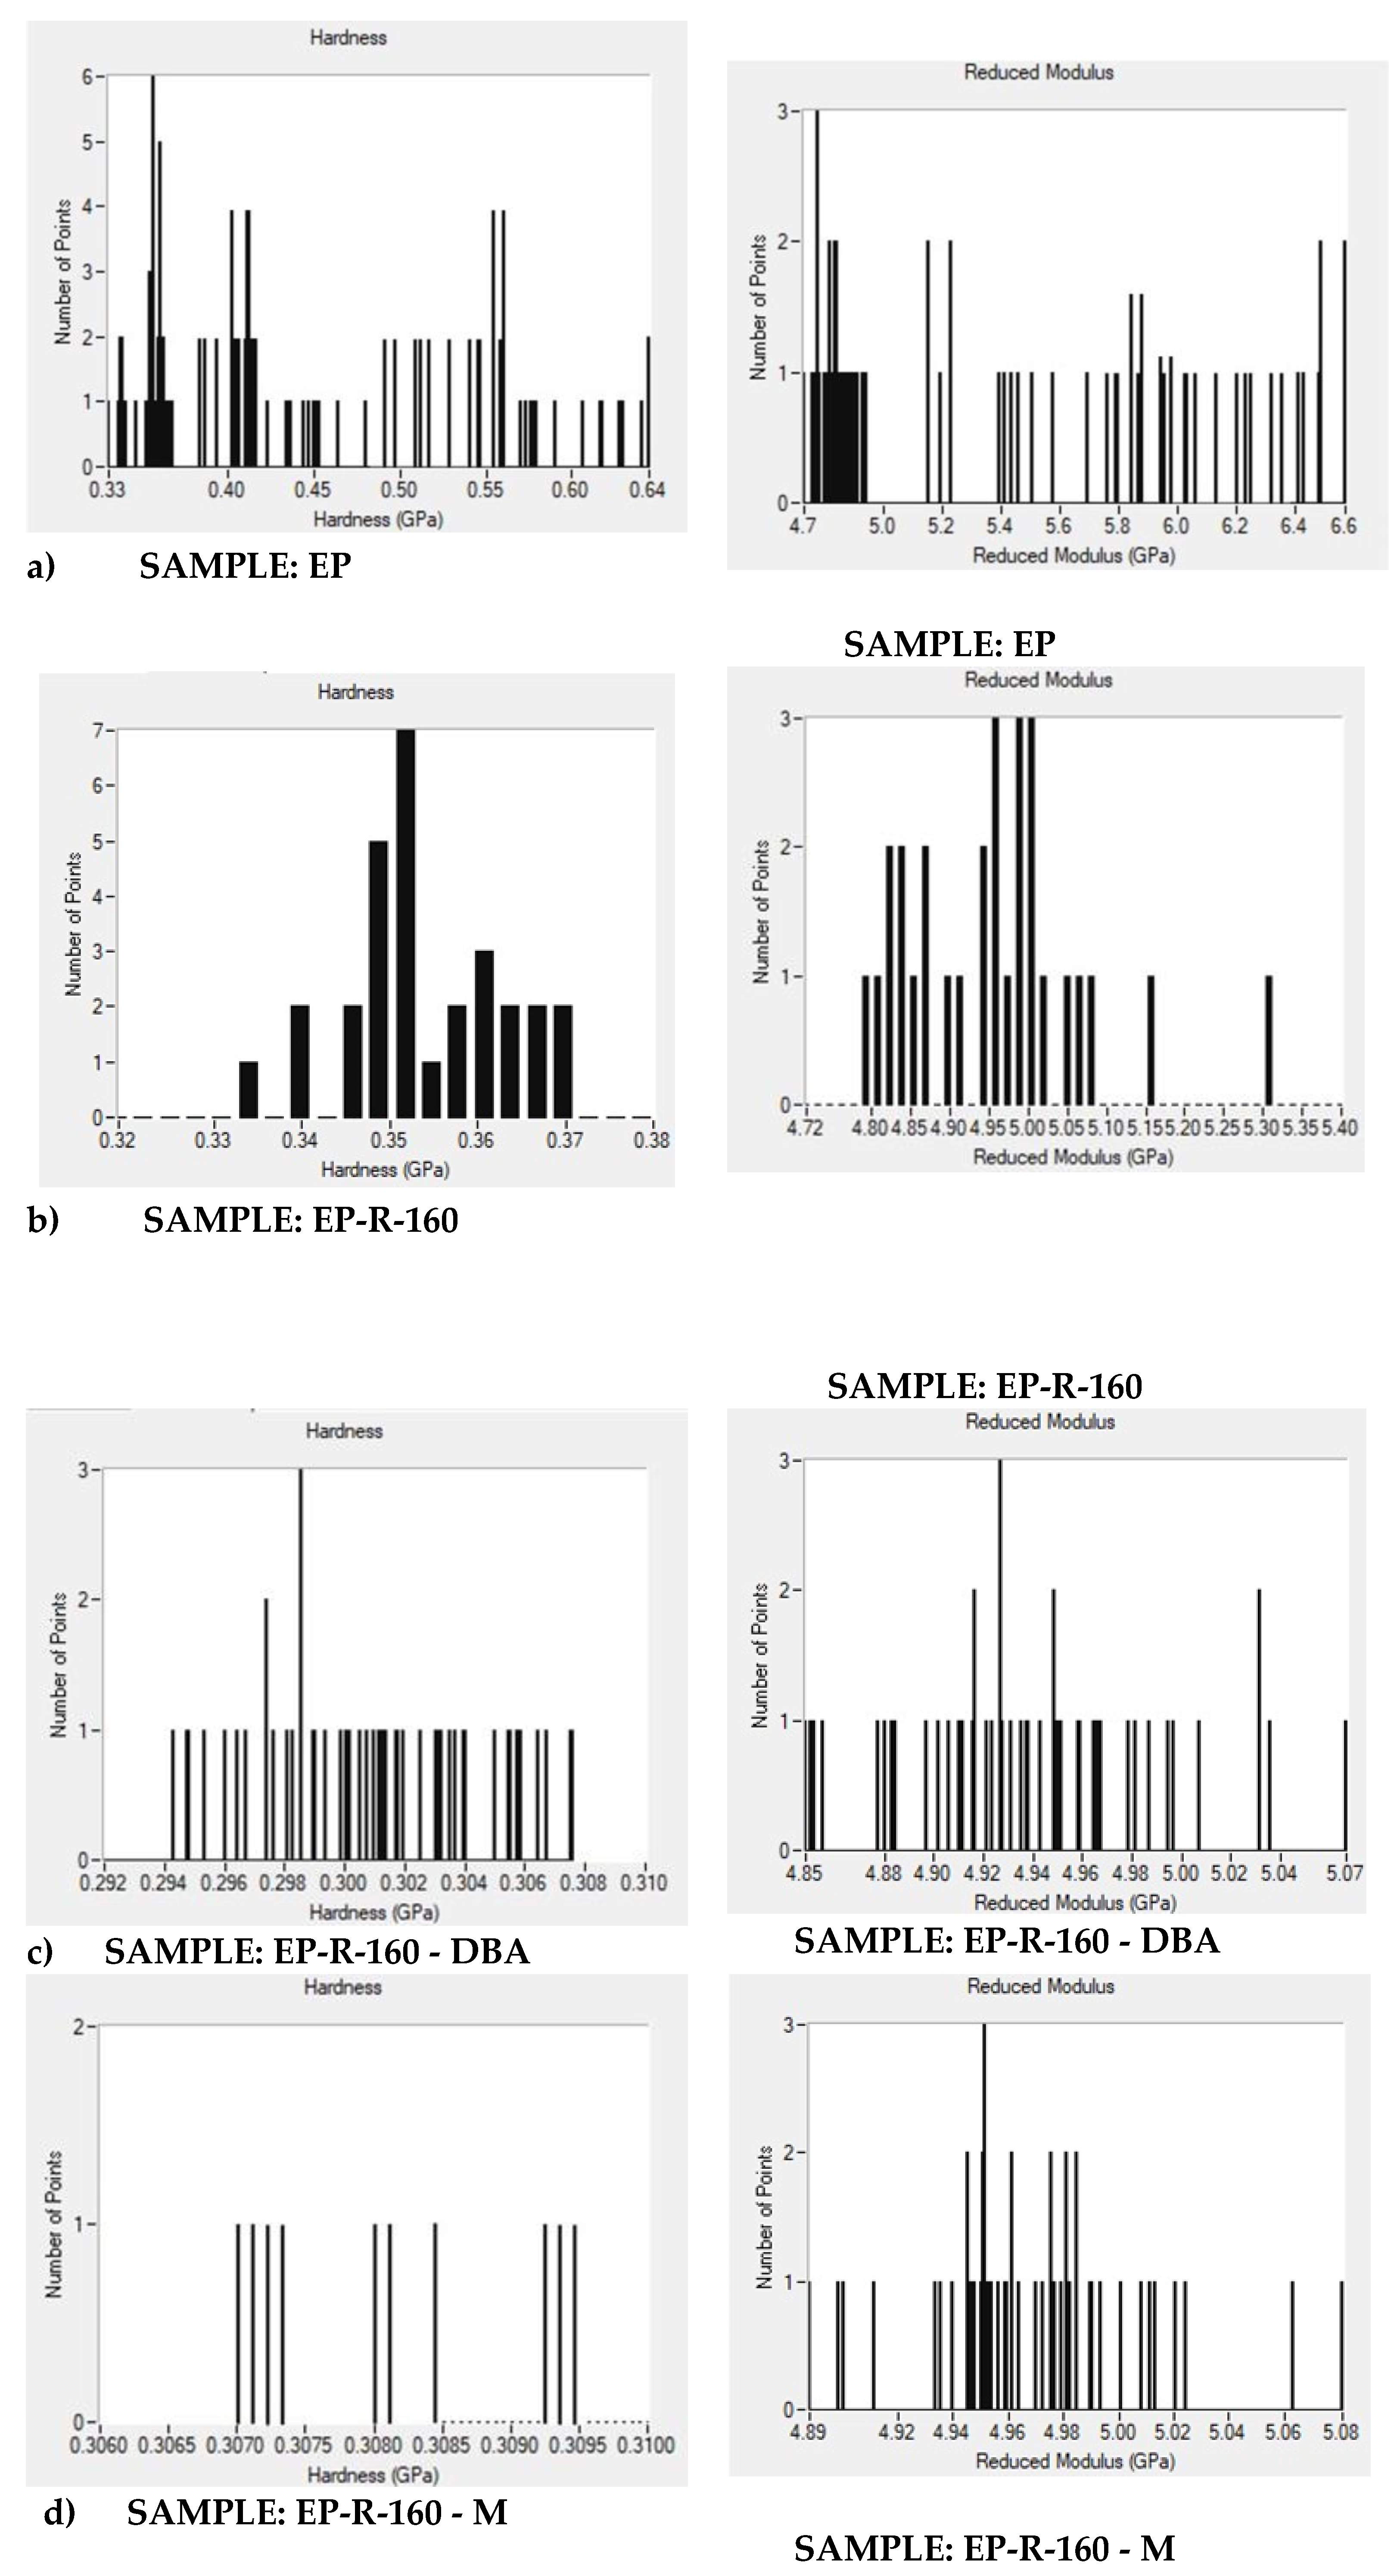
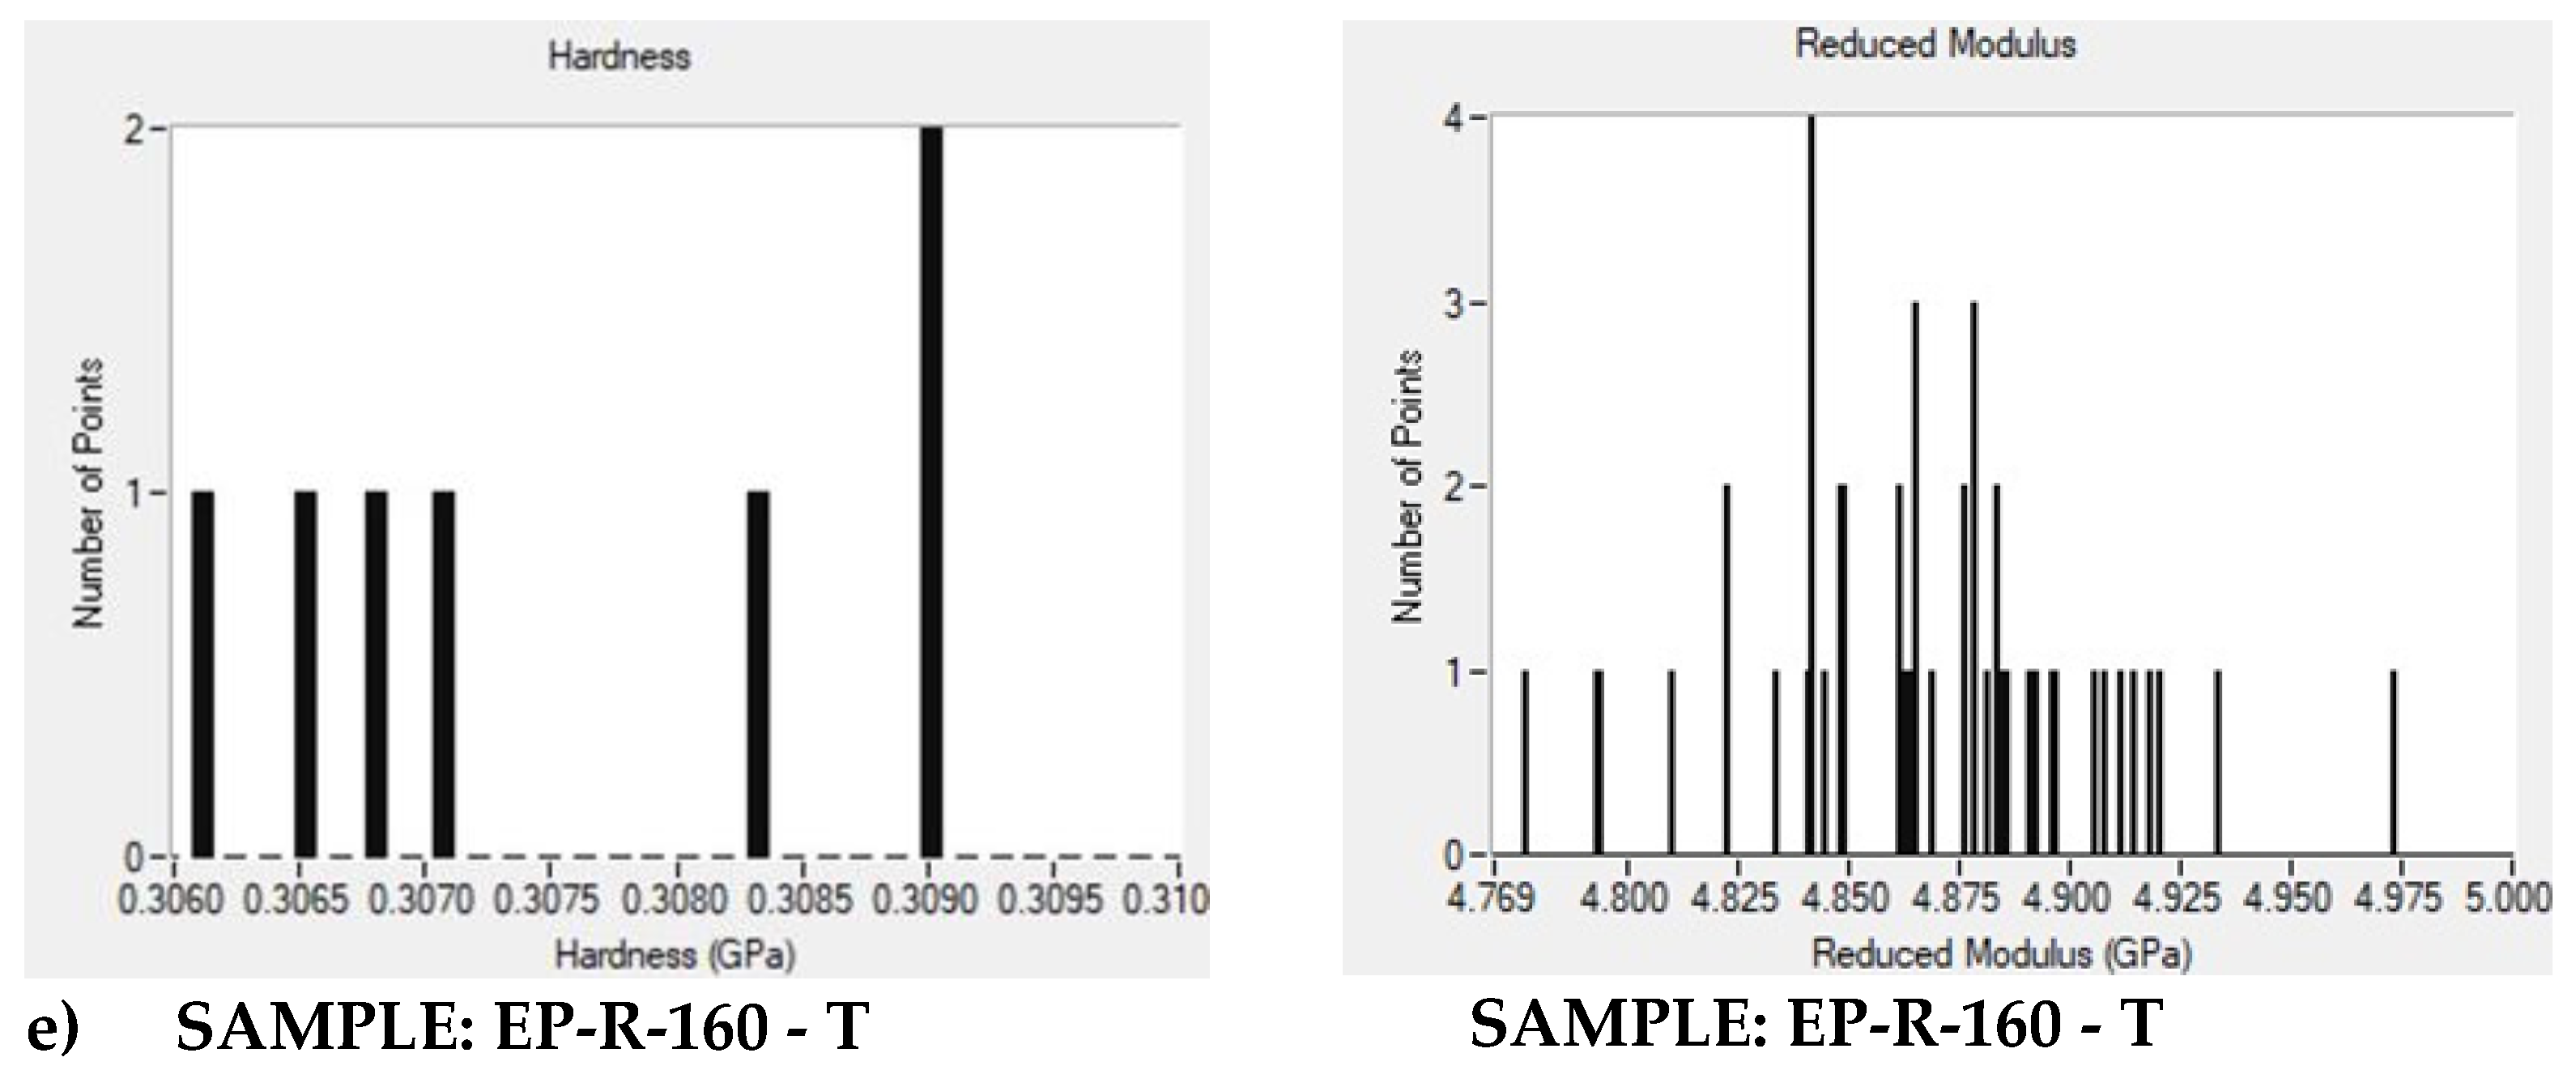
3.3. Accelerated Property Mapping (XPM) Investigation
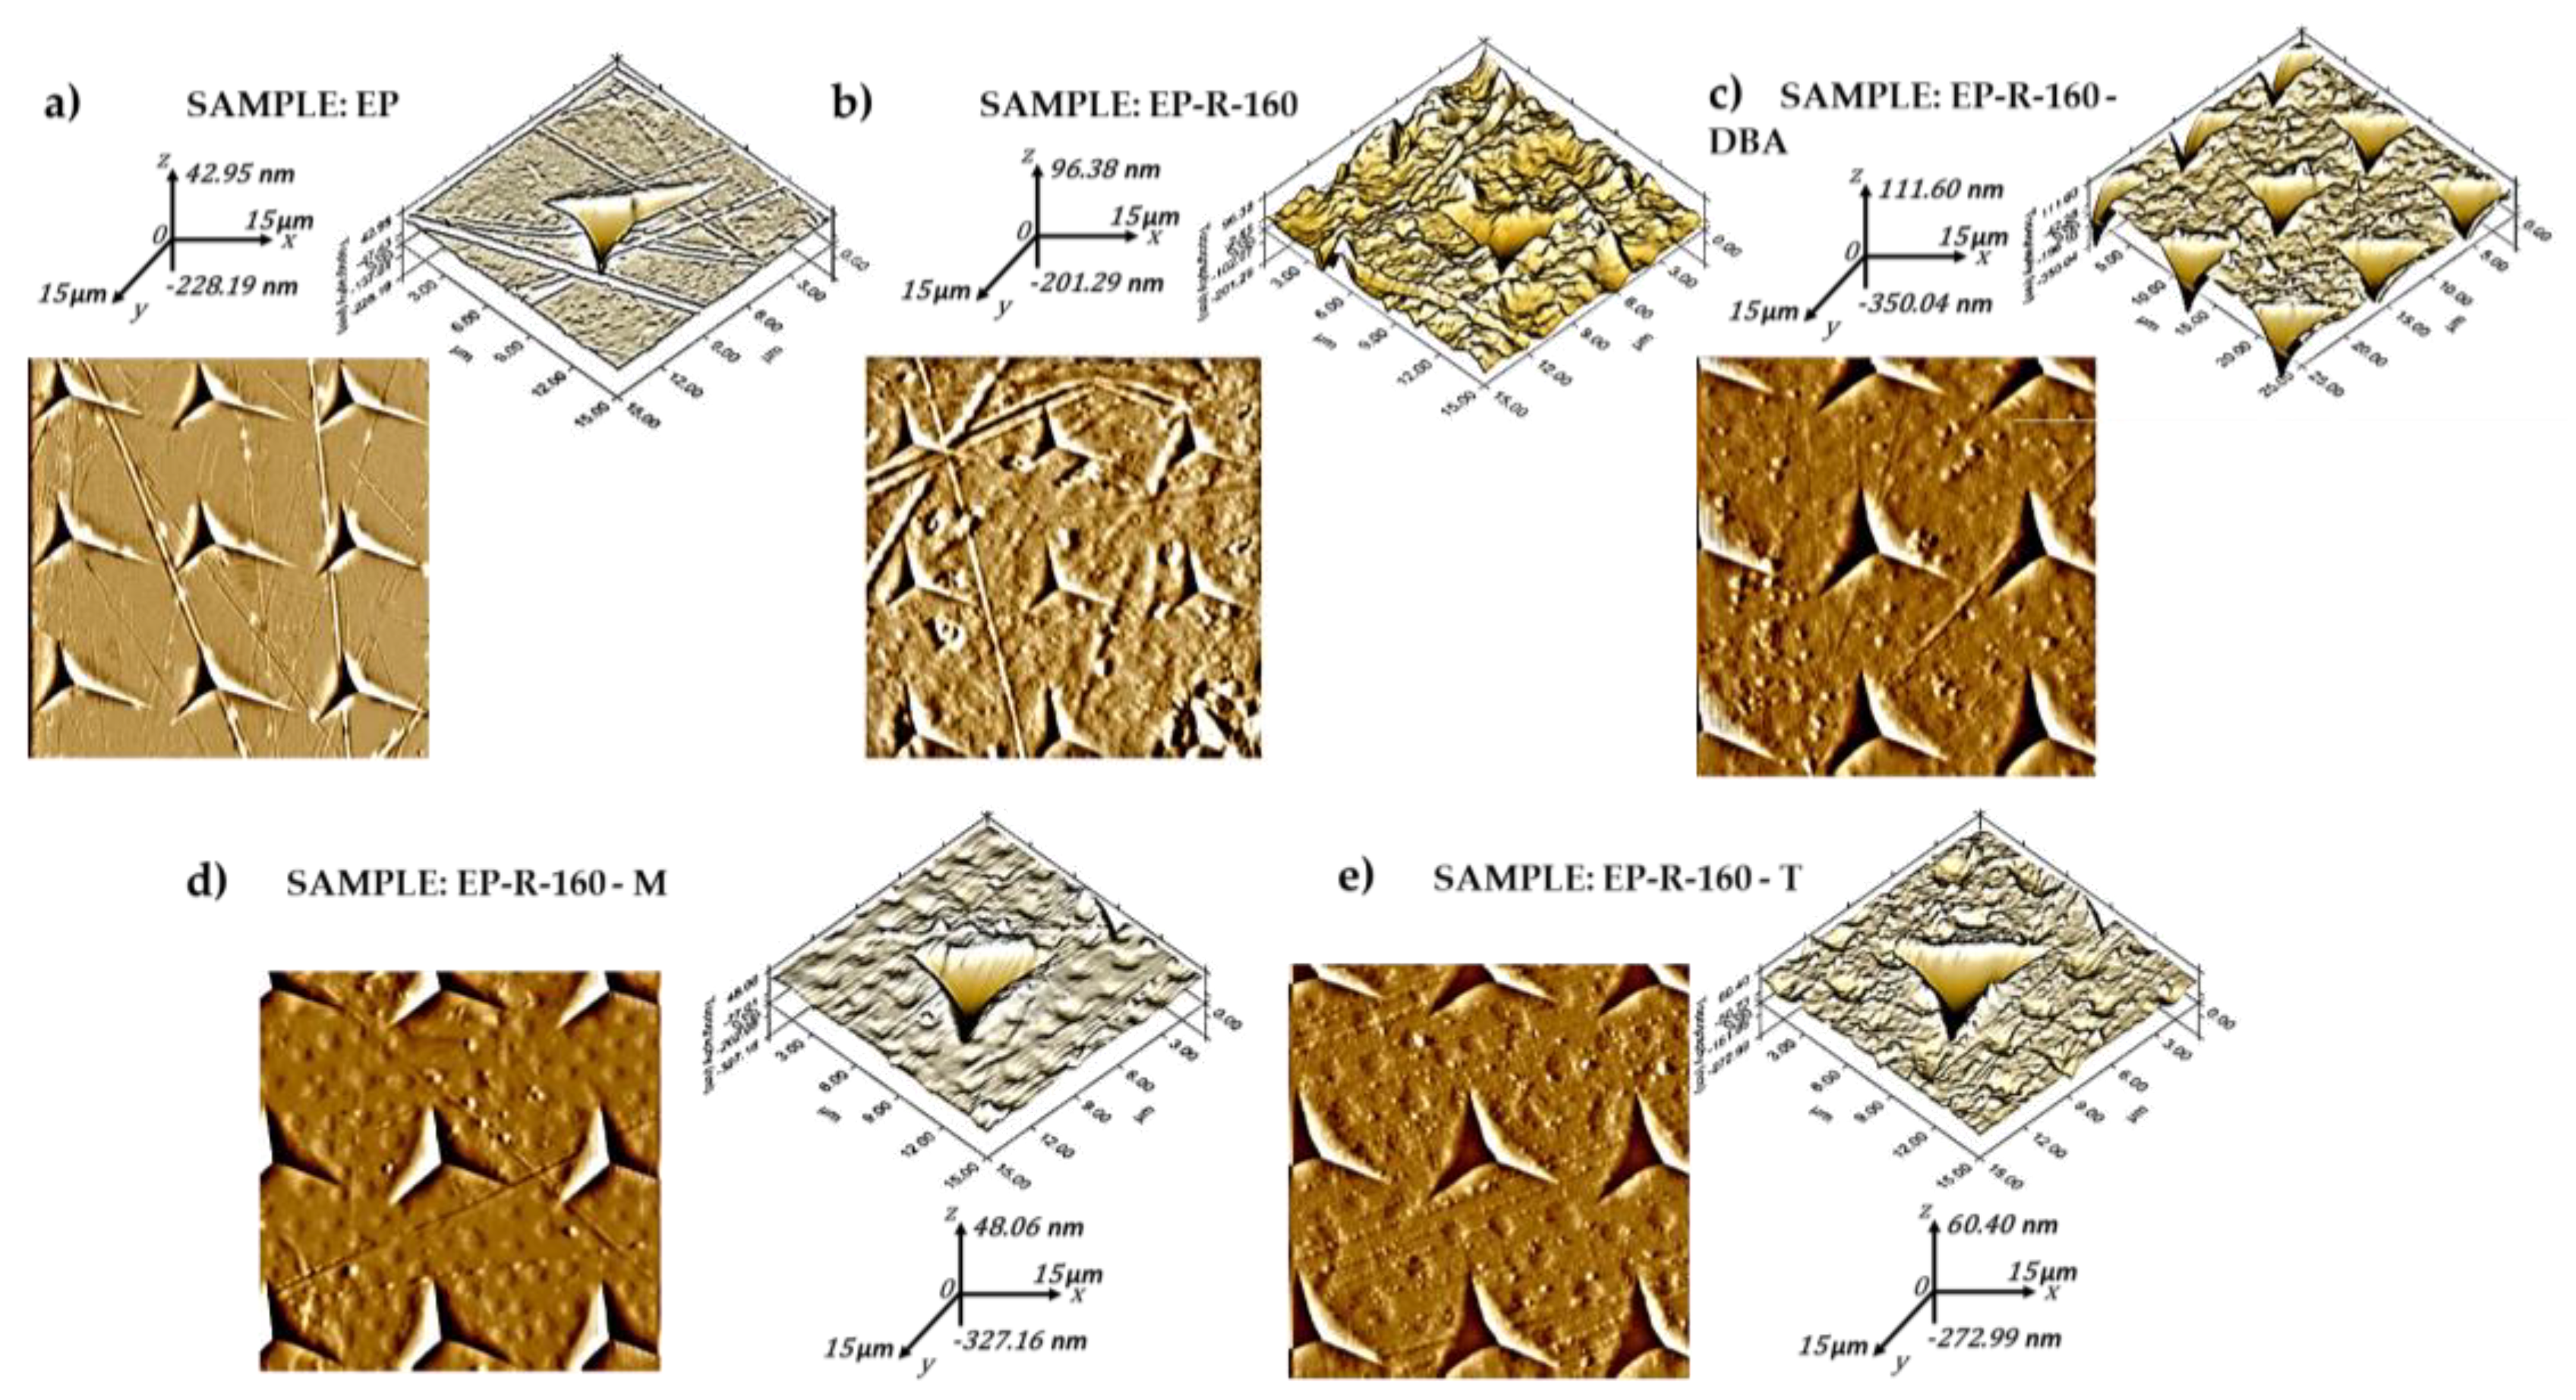
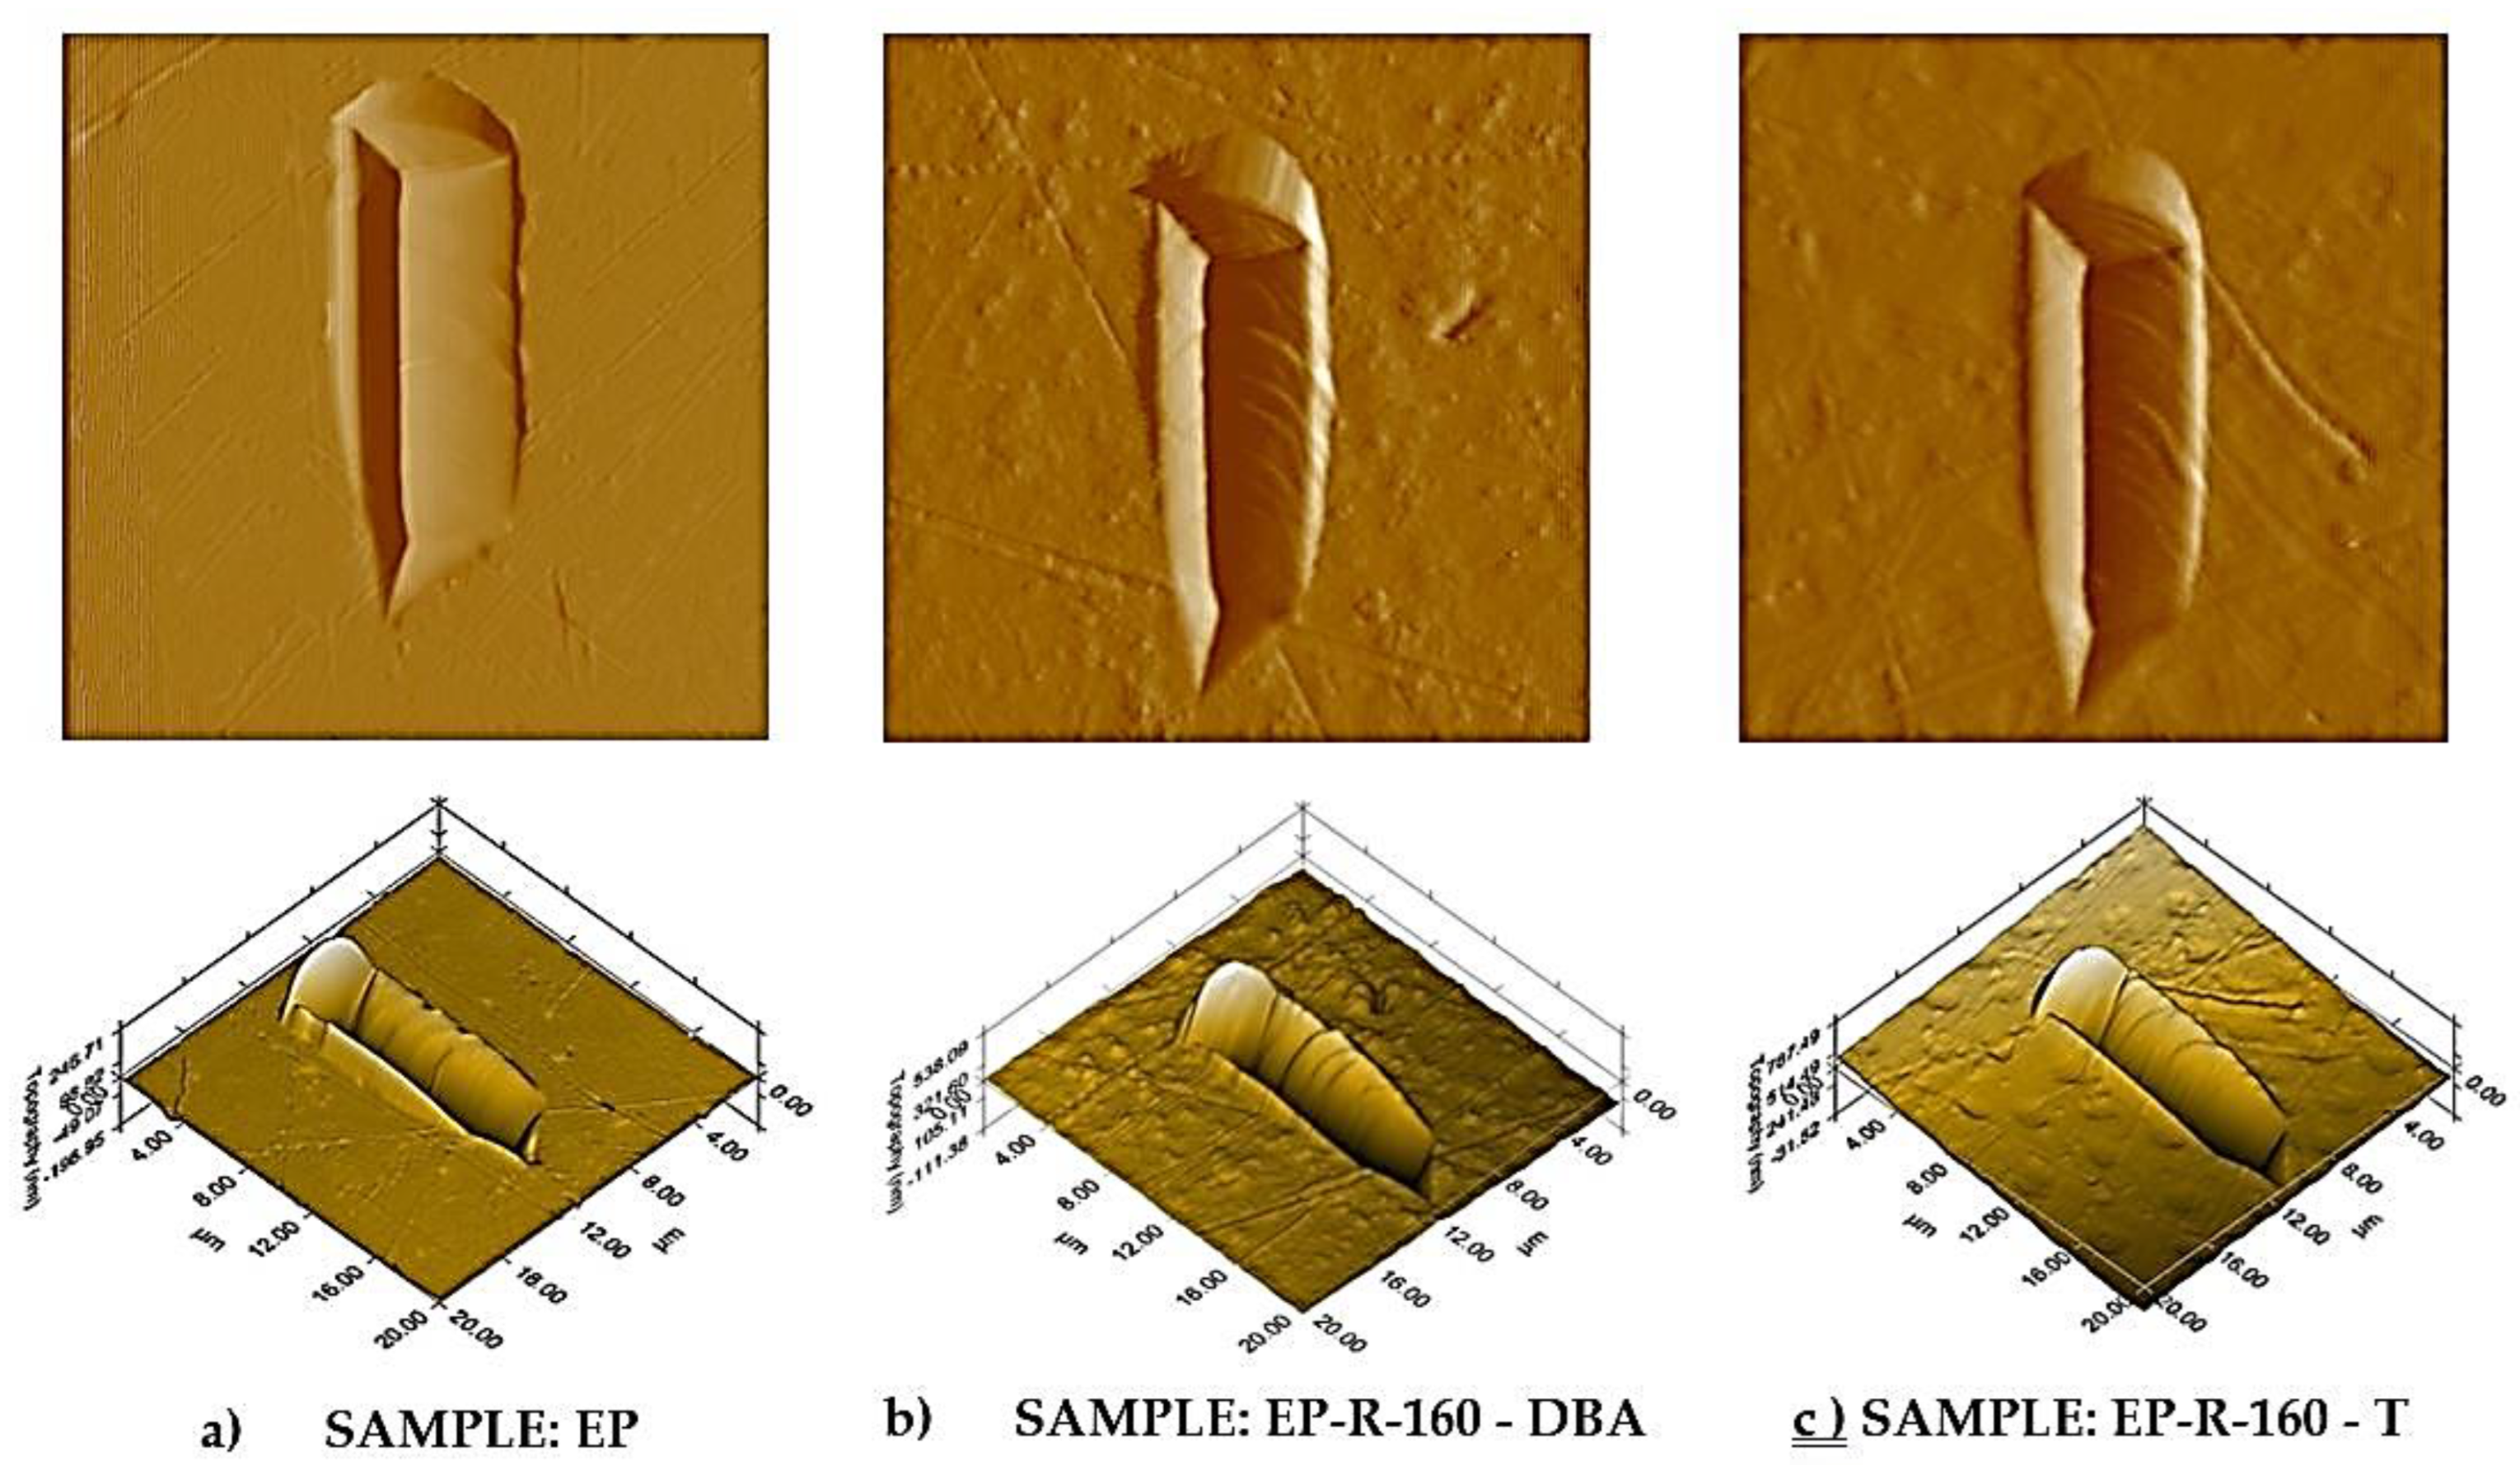
3.4. In-Situ Scanning Probe Microscopy (SPM) Inspection
3.5. Multhyphisics Simulation Study: Results
4. Discussions
5. Conclusions
Supplementary Materials
Author Contributions
Funding
Institutional Review Board Statement
Data Availability Statement
Conflicts of Interest
References
- Branda, F.; Parida, D.; Pauer, R.; Durante, M.; Gaan, S.; Malucelli, G.; Bifulco, A. Effect of the Coupling Agent (3-Aminopropyl) Triethoxysilane on the Structure and Fire Behavior of Solvent-Free One-Pot Synthesized Silica-Epoxy Nanocomposites. Polymers (Basel) 2022, 14, 3853. [Google Scholar] [CrossRef] [PubMed]
- Bifulco, A.; Marotta, A.; Passaro, J.; Costantini, A.; Cerruti, P.; Gentile, G.; Ambrogi, V.; Malucelli, G.; Branda, F. Thermal and Fire Behavior of a Bio-Based Epoxy/Silica Hybrid Cured with Methyl Nadic Anhydride. Polymers 2020, 12, 1661. [Google Scholar] [CrossRef] [PubMed]
- Passaro, J.; Bifulco, A.; Calabrese, E.; Imparato, C.; Raimondo, M.; Pantani, R.; Aronne, A.; Guadagno, L. Hybrid Hemp Particles as Functional Fillers for the Manufacturing of Hydrophobic and Anti-Icing Epoxy Composite Coatings. ACS Omega 2023, 8, 23596–23606. [Google Scholar] [CrossRef] [PubMed]
- Righi, C.; Barbieri, F.; Sgarbi, E.; Maistrello, L.; Bertacchini, A.; Andreola, F.N.; D’angelo, A.; Catauro, M.; Barbieri, L. Suitability of Porous Inorganic Materials from Industrial Residues and Bioproducts for Use in Horticulture: A Multidisciplinary Approach. Applied Sciences 2022, 12, 5437. [Google Scholar] [CrossRef]
- Vertuccio, L.; Guadagno, L.; D’Angelo, A.; Viola, V.; Raimondo, M.; Catauro, M. Sol-Gel Synthesis of Caffeic Acid Entrapped in Silica/Polyethylene Glycol Based Organic-Inorganic Hybrids: Drug Delivery and Biological Properties. Applied Sciences 2023, 13, 2164. [Google Scholar] [CrossRef]
- Guadagno, L.; Longo, R.; Aliberti, F.; Lamberti, P.; Tucci, V.; Pantani, R.; Spinelli, G.; Catauro, M.; Vertuccio, L. Role of MWCNTs Loading in Designing Self-Sensing and Self-Heating Structural Elements. Nanomaterials 2023, 13, 495. [Google Scholar] [CrossRef] [PubMed]
- Bohra, B.S.; Singh, P.; Rana, A.; Sharma, H.; Arya, T.; Pathak, M.; Chaurasia, A.; Rana, S.; Sahoo, N.G. Specific Functionalized Graphene Oxide-Based Vitrimer Epoxy Nanocomposites for Self-Healing Applications. Compos Sci Technol 2023, 241, 110143. [Google Scholar] [CrossRef]
- Rana, S.; Solanki, M.; Sahoo, N.G.; Krishnakumar, B. Bio-Vitrimers for Sustainable Circular Bio-Economy. Polymers (Basel) 2022, 14. [Google Scholar] [CrossRef] [PubMed]
- Kanu, N.J.; Gupta, E.; Vates, U.K.; Singh, G.K. Self-Healing Composites: A State-of-the-Art Review. Compos Part A Appl Sci Manuf 2019, 121, 474–486. [Google Scholar] [CrossRef]
- Islam, S.; Bhat, G. Progress and Challenges in Self-Healing Composite Materials. Mater Adv 2021, 2, 1896–1926. [Google Scholar] [CrossRef]
- Thakur, V.K.; Kessler, M.R. Self-Healing Polymer Nanocomposite Materials: A Review. Polymer (Guildf) 2015, 69, 369–383. [Google Scholar] [CrossRef]
- Blaiszik, B.J.; Kramer, S.L.B.; Olugebefola, S.C.; Moore, J.S.; Sottos, N.R.; White, S.R. Self-Healing Polymers and Composites. Annu. Rev. Mater. Res 2010, 40, 179–211. [Google Scholar] [CrossRef]
- Li, B.; Cao, P.F.; Saito, T.; Sokolov, A.P. Intrinsically Self-Healing Polymers: From Mechanistic Insight to Current Challenges. Chem Rev 2023, 123, 701–735. [Google Scholar] [CrossRef]
- Namazi, H. Polymers in Our Daily Life. Bioimpacts 2017, 7, 73–74. [Google Scholar] [CrossRef]
- Mark, J.; Ngai, K.; Graesslev, W.; Mandelkern, L.; Samulski, E.; Wignall, G.; Koenig, J. Physical Properties of Polymers, 3d ed.; Cambridge University Press: New York, 2004. [Google Scholar]
- Campanella, A.; Döhler, D.; Binder, W.H.; Campanella, A.; Döhler, D.; Binder, H. Self-Healing in Supramolecular Polymers Self-Healing Materials. Macromol Rapid Commun 2018, 39, 1700739. [Google Scholar] [CrossRef]
- Utrera-Barrios, S.; Verdejo, R.; López-Manchado, M.A.; Hernández Santana, M. Evolution of Self-Healing Elastomers, from Extrinsic to Combined Intrinsic Mechanisms: A Review. Mater Horiz 2020, 7, 2882–2902. [Google Scholar] [CrossRef]
- White, S.R.; Sottos, N.R.; Geubelle, P.H.; Moore, J.S.; Kessler, M.R.; Sriram, S.R.; Brown, E.N.; Viswanathan, S. Autonomic Healing of Polymer Composites. Nature 2001, 409, 794–797. [Google Scholar] [CrossRef] [PubMed]
- Jin, H.; Miller, G.M.; Pety, S.J.; Griffin, A.S.; Stradley, D.S.; Roach, D.; Sottos, N.R.; White, S.R. Fracture Behavior of a Self-Healing, Toughened Epoxy Adhesive. Int J Adhes Adhes 2013, 44, 157–165. [Google Scholar] [CrossRef]
- Goyal, M.; Agarwal, S.N.; Bhatnagar, N. A Review on Self-Healing Polymers for Applications in Spacecraft and Construction of Roads. J Appl Polym Sci 2022, 139, e52816. [Google Scholar] [CrossRef]
- Guadagno, L.; Longo, P.; Raimondo, M.; Naddeo, C.; Mariconda, A.; Sorrentino, A.; Vittoria, V.; Iannuzzo, G.; Russo, S. Cure Behavior and Mechanical Properties of Structural Self-Healing Epoxy Resins. J Polym Sci Part B: Polym Phys 2010, 48, 2413–2423. [Google Scholar] [CrossRef]
- Outwater, J.O.; Gerry, D.J. On the Fracture Energy, Rehealing Velocity and Refracture Energy of Cast Epoxy Resin. J Adhes 1969, 1, 290–298. [Google Scholar] [CrossRef]
- Rahmathullah, M.A.M.; Palmese, G.R. Crack-Healing Behavior of Epoxy-Amine Thermosets. J Appl Polym Sci 2009, 113, 2191–2201. [Google Scholar] [CrossRef]
- Luo, X.; Mather, P.T. Shape Memory Assisted Self-Healing Coating. ACS Macro Lett 2024, 152–156. [Google Scholar] [CrossRef] [PubMed]
- Nelson, B.A.; King, W.P.; Gall, K. Shape Recovery of Nanoscale Imprints in a Thermoset “Shape Memory” Polymer. Appl Phys Lett 2005, 86, 1–3. [Google Scholar] [CrossRef]
- Cho, S.H.; White, S.R.; Braun, P. V; Braun, P. V; Institute, B.; Cho, S.H. Self-Healing Polymer Coatings. Advanced Materials 2009, 21, 645–649. [Google Scholar] [CrossRef]
- Guadagno, L.; Raimondo, M.; Naddeo, C.; Vertuccio, L.; Russo, S.; Iannuzzo, G.; Calabrese, E. Rheological, Thermal and Mechanical Characterization of Toughened Self-Healing Supramolecular Resins, Based on Hydrogen Bonding. Nanomaterials 2022, 12, 4322. [Google Scholar] [CrossRef] [PubMed]
- Guadagno, L.; Vertuccio, L.; Naddeo, C.; Calabrese, E.; Barra, G.; Raimondo, M.; Sorrentino, A.; Binder, W.H.; Michael, P.; Rana, S. Reversible Self-Healing Carbon-Based Nanocomposites for Structural Applications. Polymers (Basel) 2019, 11. [Google Scholar] [CrossRef] [PubMed]
- Vertuccio, L.; Calabrese, E.; Raimondo, M.; Catauro, M.; Sorrentino, A.; Naddeo, C.; Longo, R.; Guadagno, L. Effect of Temperature on the Functionalization Process of Structural Self-Healing Epoxy Resin. Aerospace 2023, 10, 476. [Google Scholar] [CrossRef]
- Gibson, R.F. A Review of Recent Research on Nanoindentation of Polymer Composites and Their Constituents. Compos Sci Technol 2014, 105, 51–65. [Google Scholar] [CrossRef]
- Yan, C.; Bor, B.; Plunkett, A.; Domènech, B.; Maier-Kiener, V.; Giuntini, D. Nanoindentation Creep of Supercrystalline Nanocomposites. Mater Des 2023, 231, 112000. [Google Scholar] [CrossRef]
- Lam, C.K.; Lau, K.T. Localized Elastic Modulus Distribution of Nanoclay/Epoxy Composites by Using Nanoindentation. Compos Struct 2006, 75, 553–558. [Google Scholar] [CrossRef]
- Karimzadeh, A.; R. Koloor, S.S.; Ayatollahi, M.R.; Bushroa, A.R.; Yahya, M.Y. Assessment of Nano-Indentation Method in Mechanical Characterization of Heterogeneous Nanocomposite Materials Using Experimental and Computational Approaches. Sci Rep 2019, 9. [Google Scholar] [CrossRef] [PubMed]
- Arora, G.; Pathak, H. Nanoindentation Characterization of Polymer Nanocomposites for Elastic and Viscoelastic Properties: Experimental and Mathematical Approach. Composites Part C: Open Access 2021, 4. [Google Scholar] [CrossRef]
- Ramos, V.D.; Da Costa, H.M.; Soares, V.L.P.; Nascimento, R.S.V. Modification of Epoxy Resin: A Comparison of Different Types of Elastomer. Polym Test 2005, 24, 387–394. [Google Scholar] [CrossRef]
- Spinelli, G.; Lamberti, P.; Tucci, V.; Kotsilkova, R.; Ivanov, E.; Menseidov, D.; Naddeo, C.; Romano, V.; Guadagno, L.; Adami, R.; et al. Nanocarbon/Poly(Lactic) Acid for 3D Printing: Effect of Fillers Content on Electromagnetic and Thermal Properties. Materials 2019, 12, 2369. [Google Scholar] [CrossRef] [PubMed]
- Guadagno, L.; Aliberti, F.; Longo, R.; Raimondo, M.; Pantani, R.; Sorrentino, A.; Catauro, M.; Vertuccio, L. Electrical Anisotropy Controlled Heating of Acrylonitrile Butadiene Styrene 3D Printed Parts. Mater Des 2023, 225, 111507. [Google Scholar] [CrossRef]
- Čech, J.; Haušild, P.; Kovářík, O.; Materna, A. Examination of Berkovich Indenter Tip Bluntness. Mater Des 2016, 109, 347–353. [Google Scholar] [CrossRef]
- Khelifa, M.; Fierro, V.; Celzard, A. Finite Element Simulation of Nanoindentation Tests Using a Macroscopic Computational Model. Journal of Mechanical Science and Technology 2014, 28, 3209–3217. [Google Scholar] [CrossRef]
- Troyon, M.; Huang, L. Correction Factor for Contact Area in Nanoindentation Measurements. J Mater Res 2005, 20, 610–617. [Google Scholar] [CrossRef]
- Lee, J.H.; Lee, H.; Kim, D.H. A Numerical Approach to Evaluation of Elastic Modulus Using Conical Indenter with Finite Tip Radius. J Mater Res 2008, 23, 2528–2537. [Google Scholar] [CrossRef]
- Doerner, M.F.; Nix, W.D. A Method for Interpreting the Data from Depth-Sensing Indentation Instruments. J Mater Res 1986, 1, 601–609. [Google Scholar] [CrossRef]
- Oliver, W.C.; Pharr, G.M. Measurement of Hardness and Elastic Modulus by Instrumented Indentation: Advances in Understanding and Refinements to Methodology. J Mater Res 2004, 19, 3–20. [Google Scholar] [CrossRef]
- Guadagno, L.; Raimondo, M.; Vertuccio, L.; Lamparelli, E.P.; Ciardulli, M.C.; Longo, P.; Mariconda, A.; Della Porta, G.; Longo, R. Electrospun Membranes Designed for Burst Release of New Gold-Complexes Inducing Apoptosis of Melanoma Cells. International Journal of Molecular Sciences 2022, 23, 7147. [Google Scholar] [CrossRef] [PubMed]
- Sneddon, I.N. The Relation between Load and Penetration in the Axisymmetric Boussinesq Problem for a Punch of Arbitrary Profile. Int J Eng Sci 1965, 3, 47–57. [Google Scholar] [CrossRef]
- Němeček, J.; Němeček, J.; Lukeš, J. High-Speed Mechanical Mapping of Blended Cement Pastes and Its Comparison with Standard Modes of Nanoindentation. Mater Today Commun 2020, 23. [Google Scholar] [CrossRef]

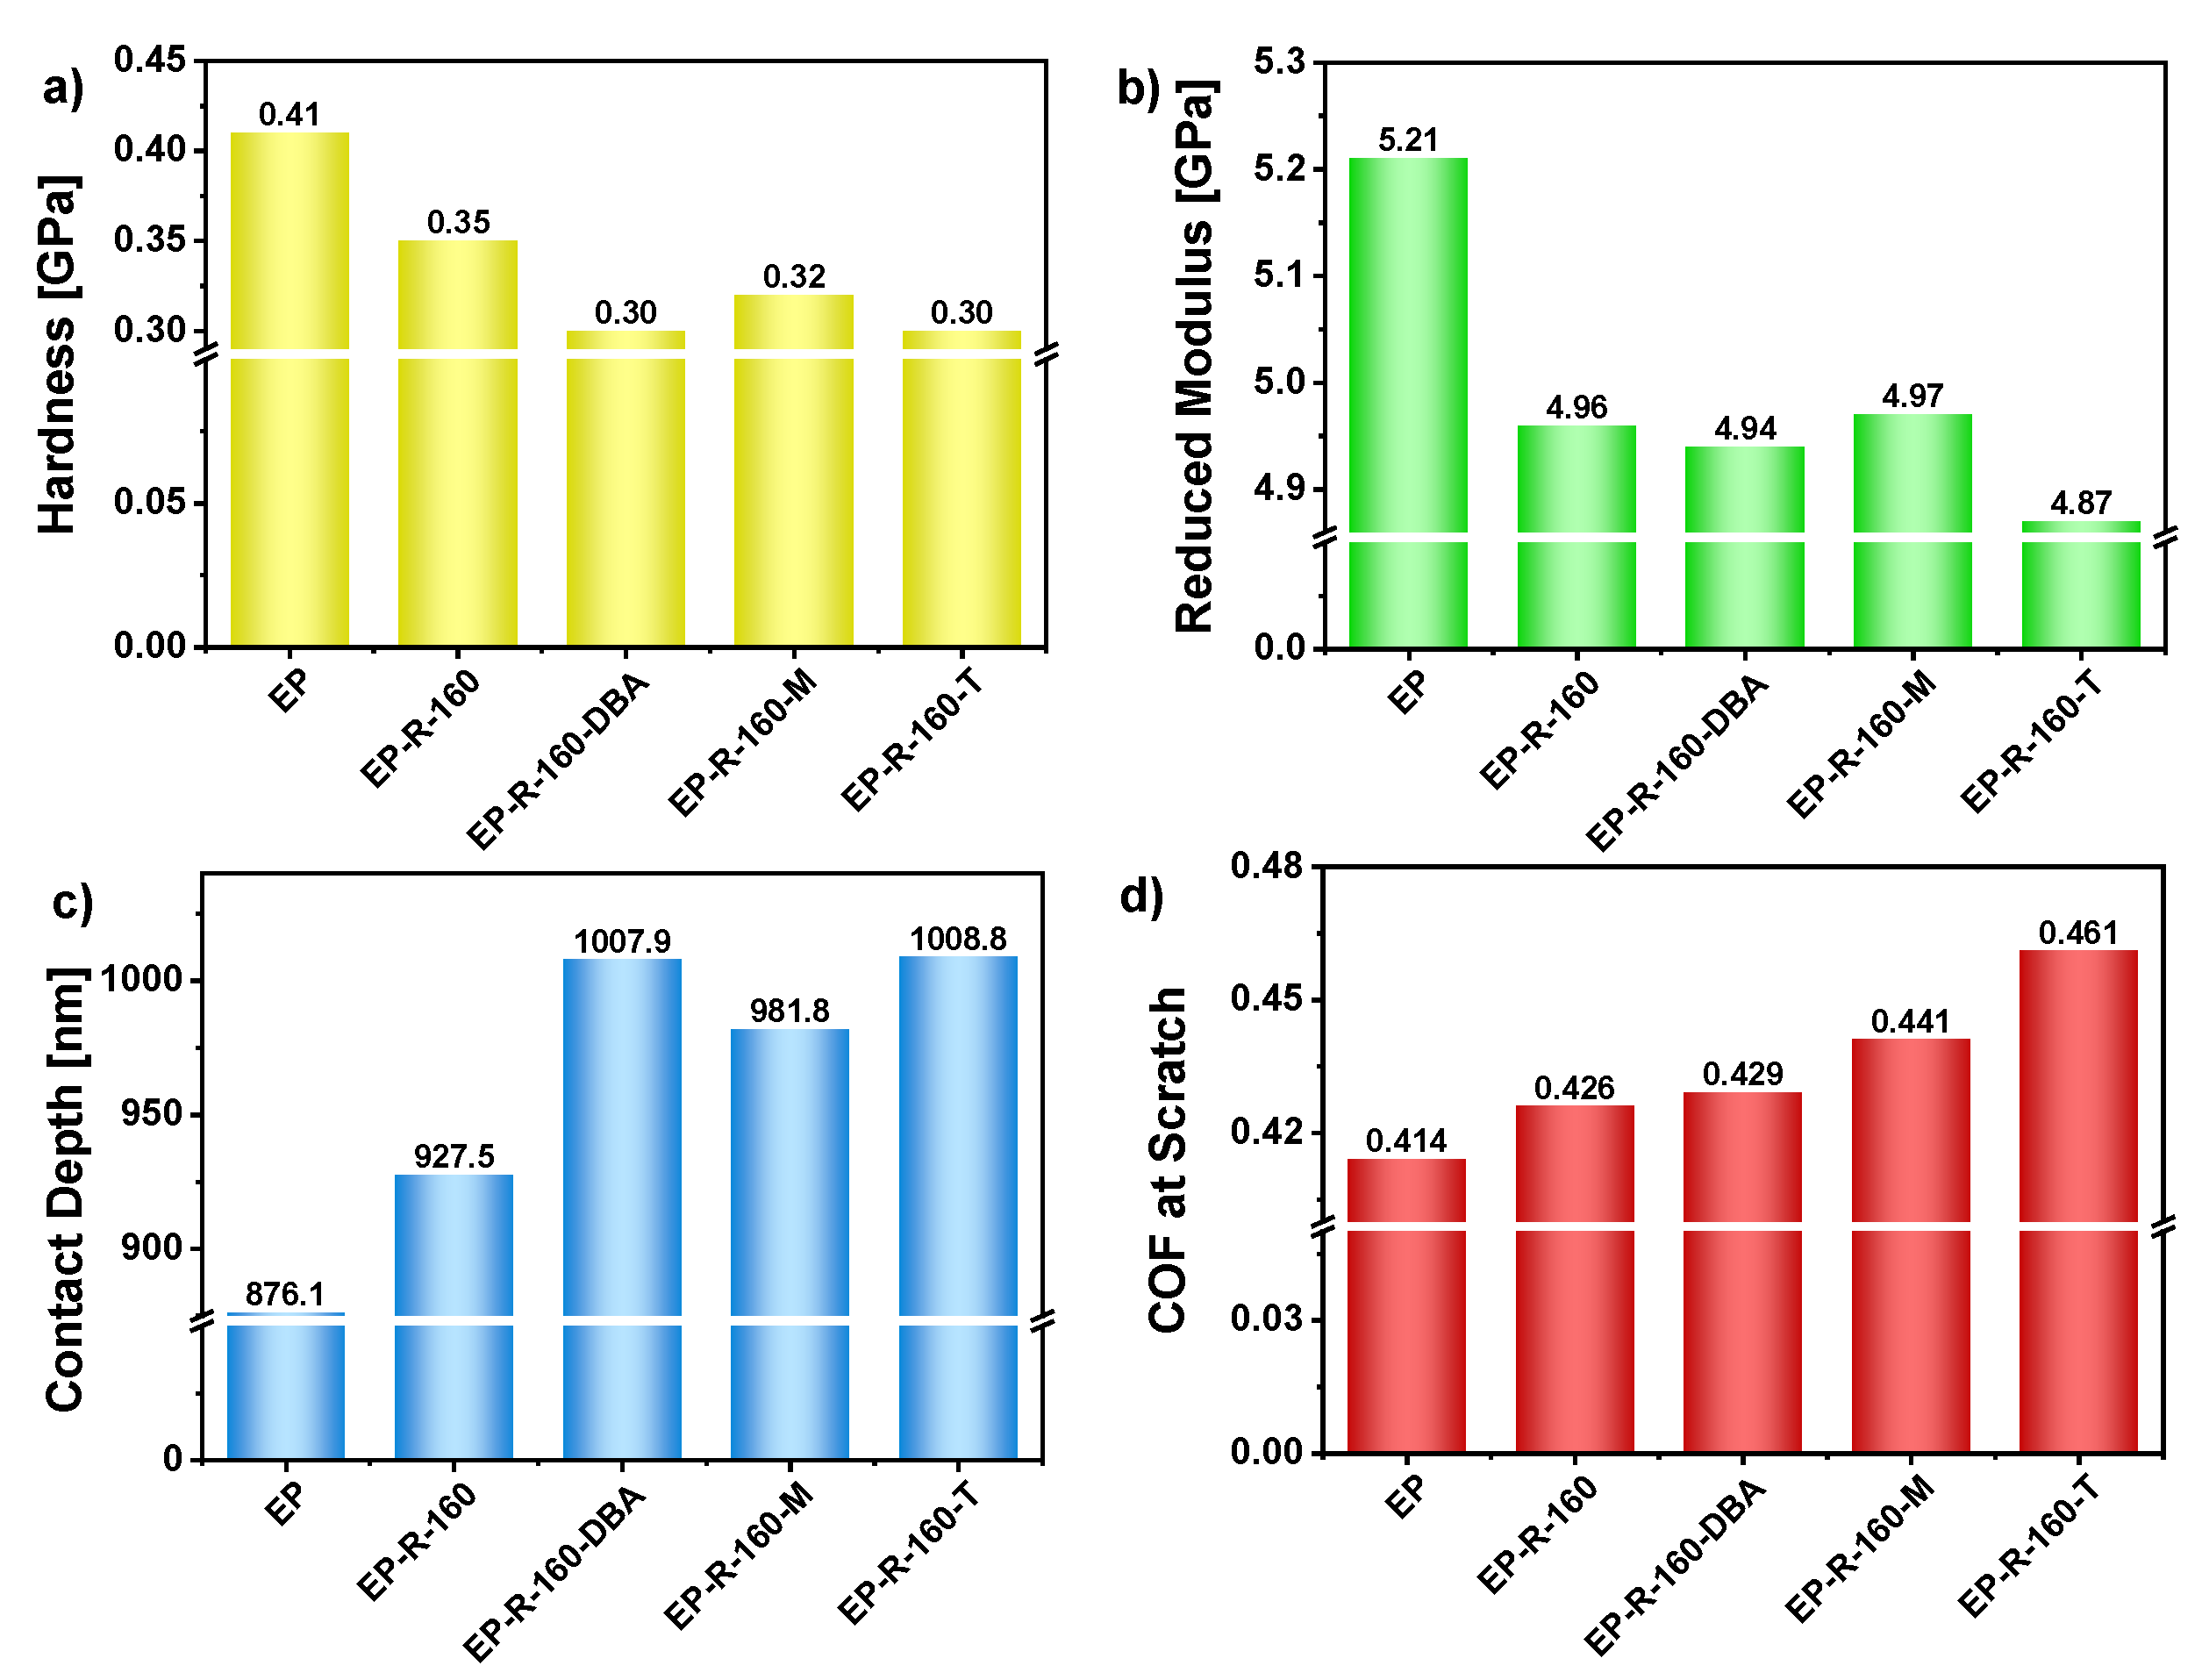
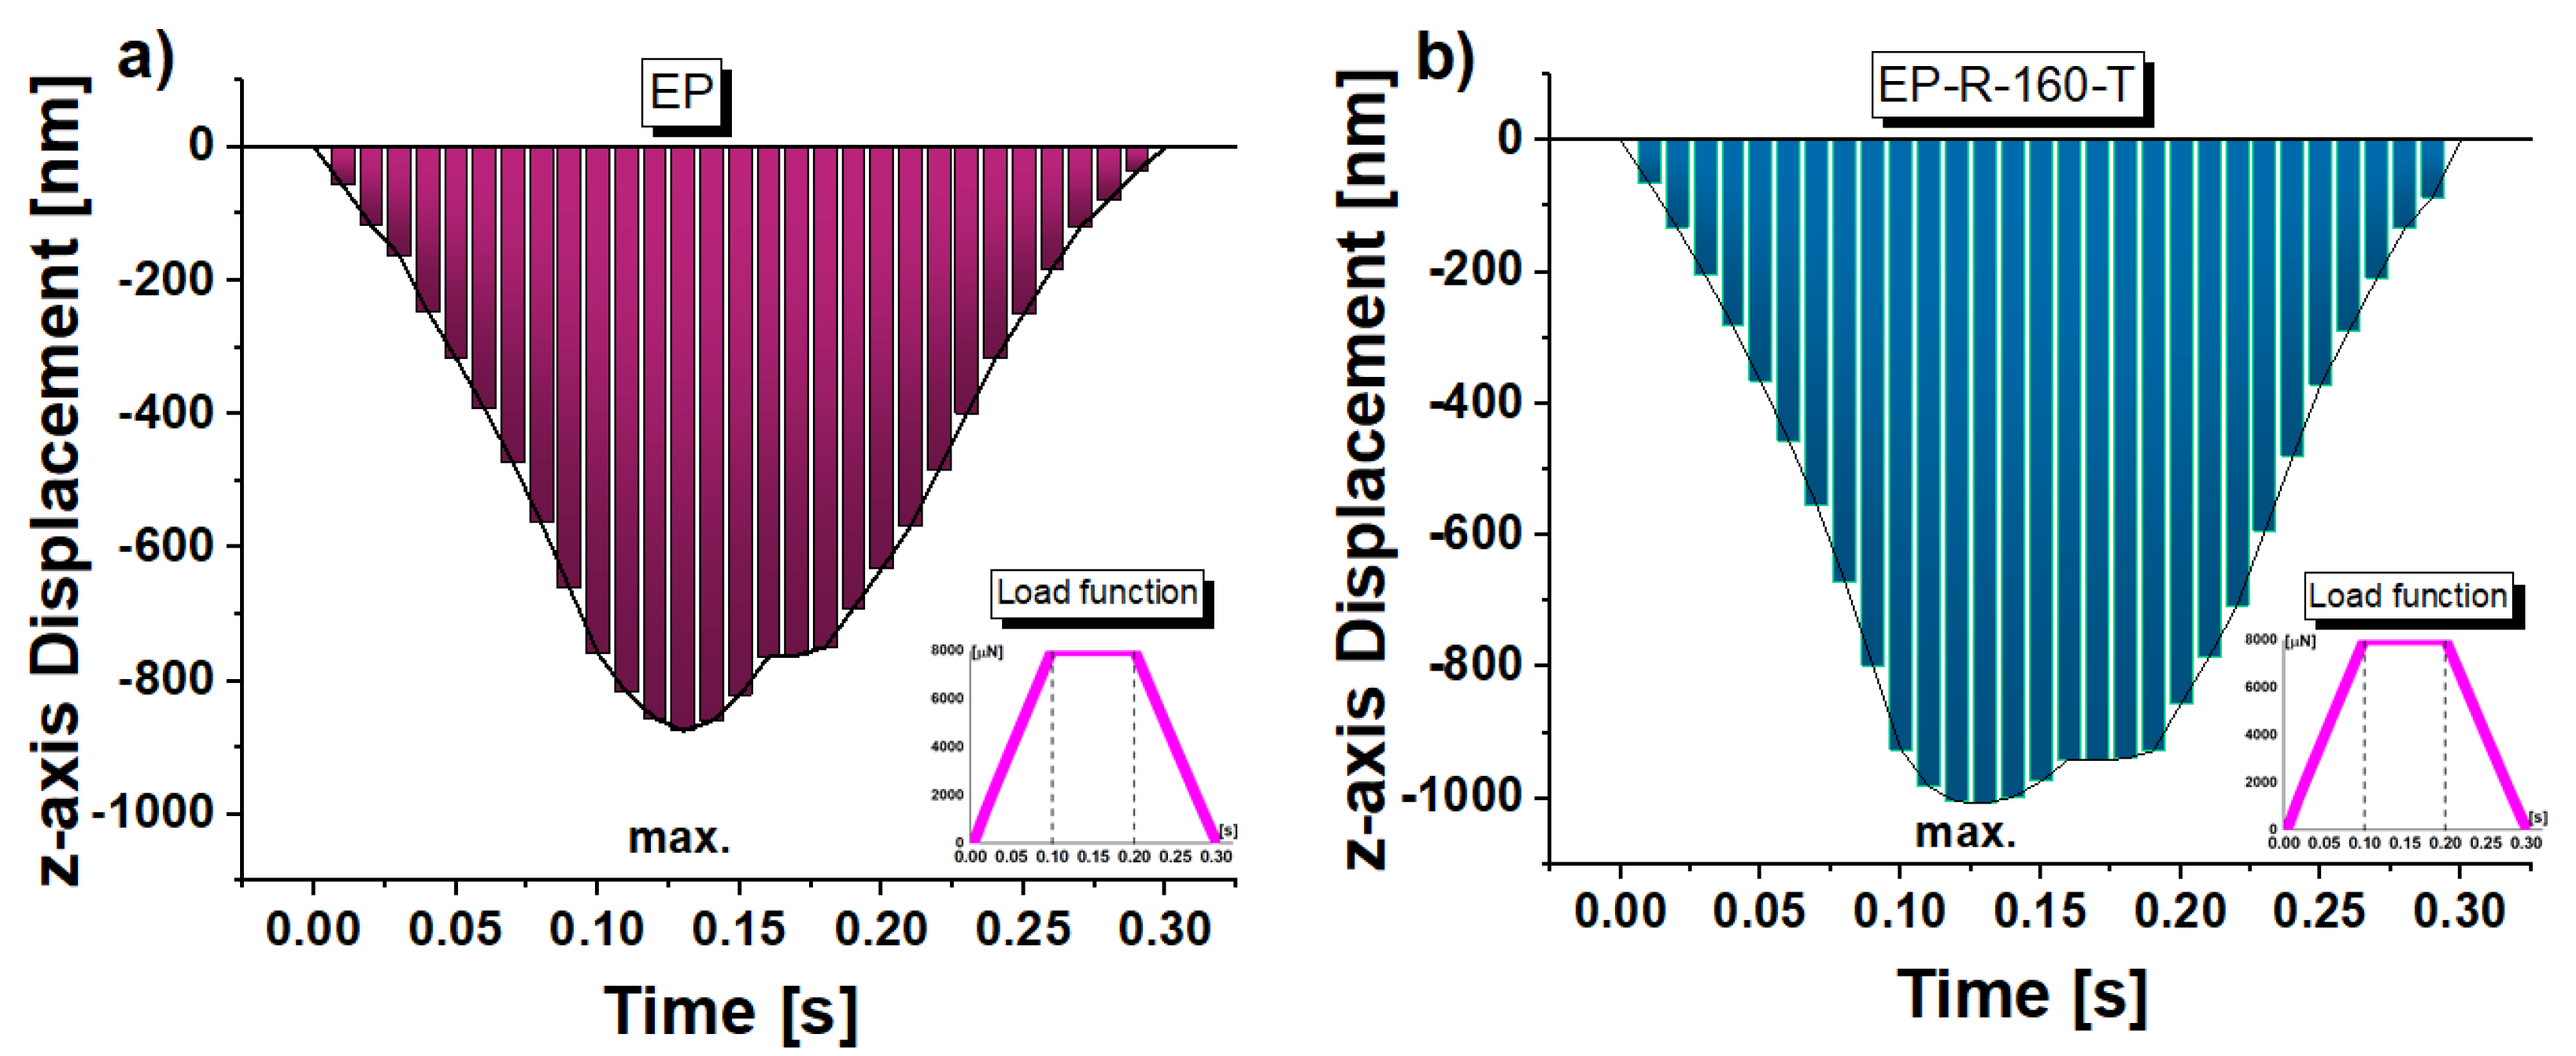
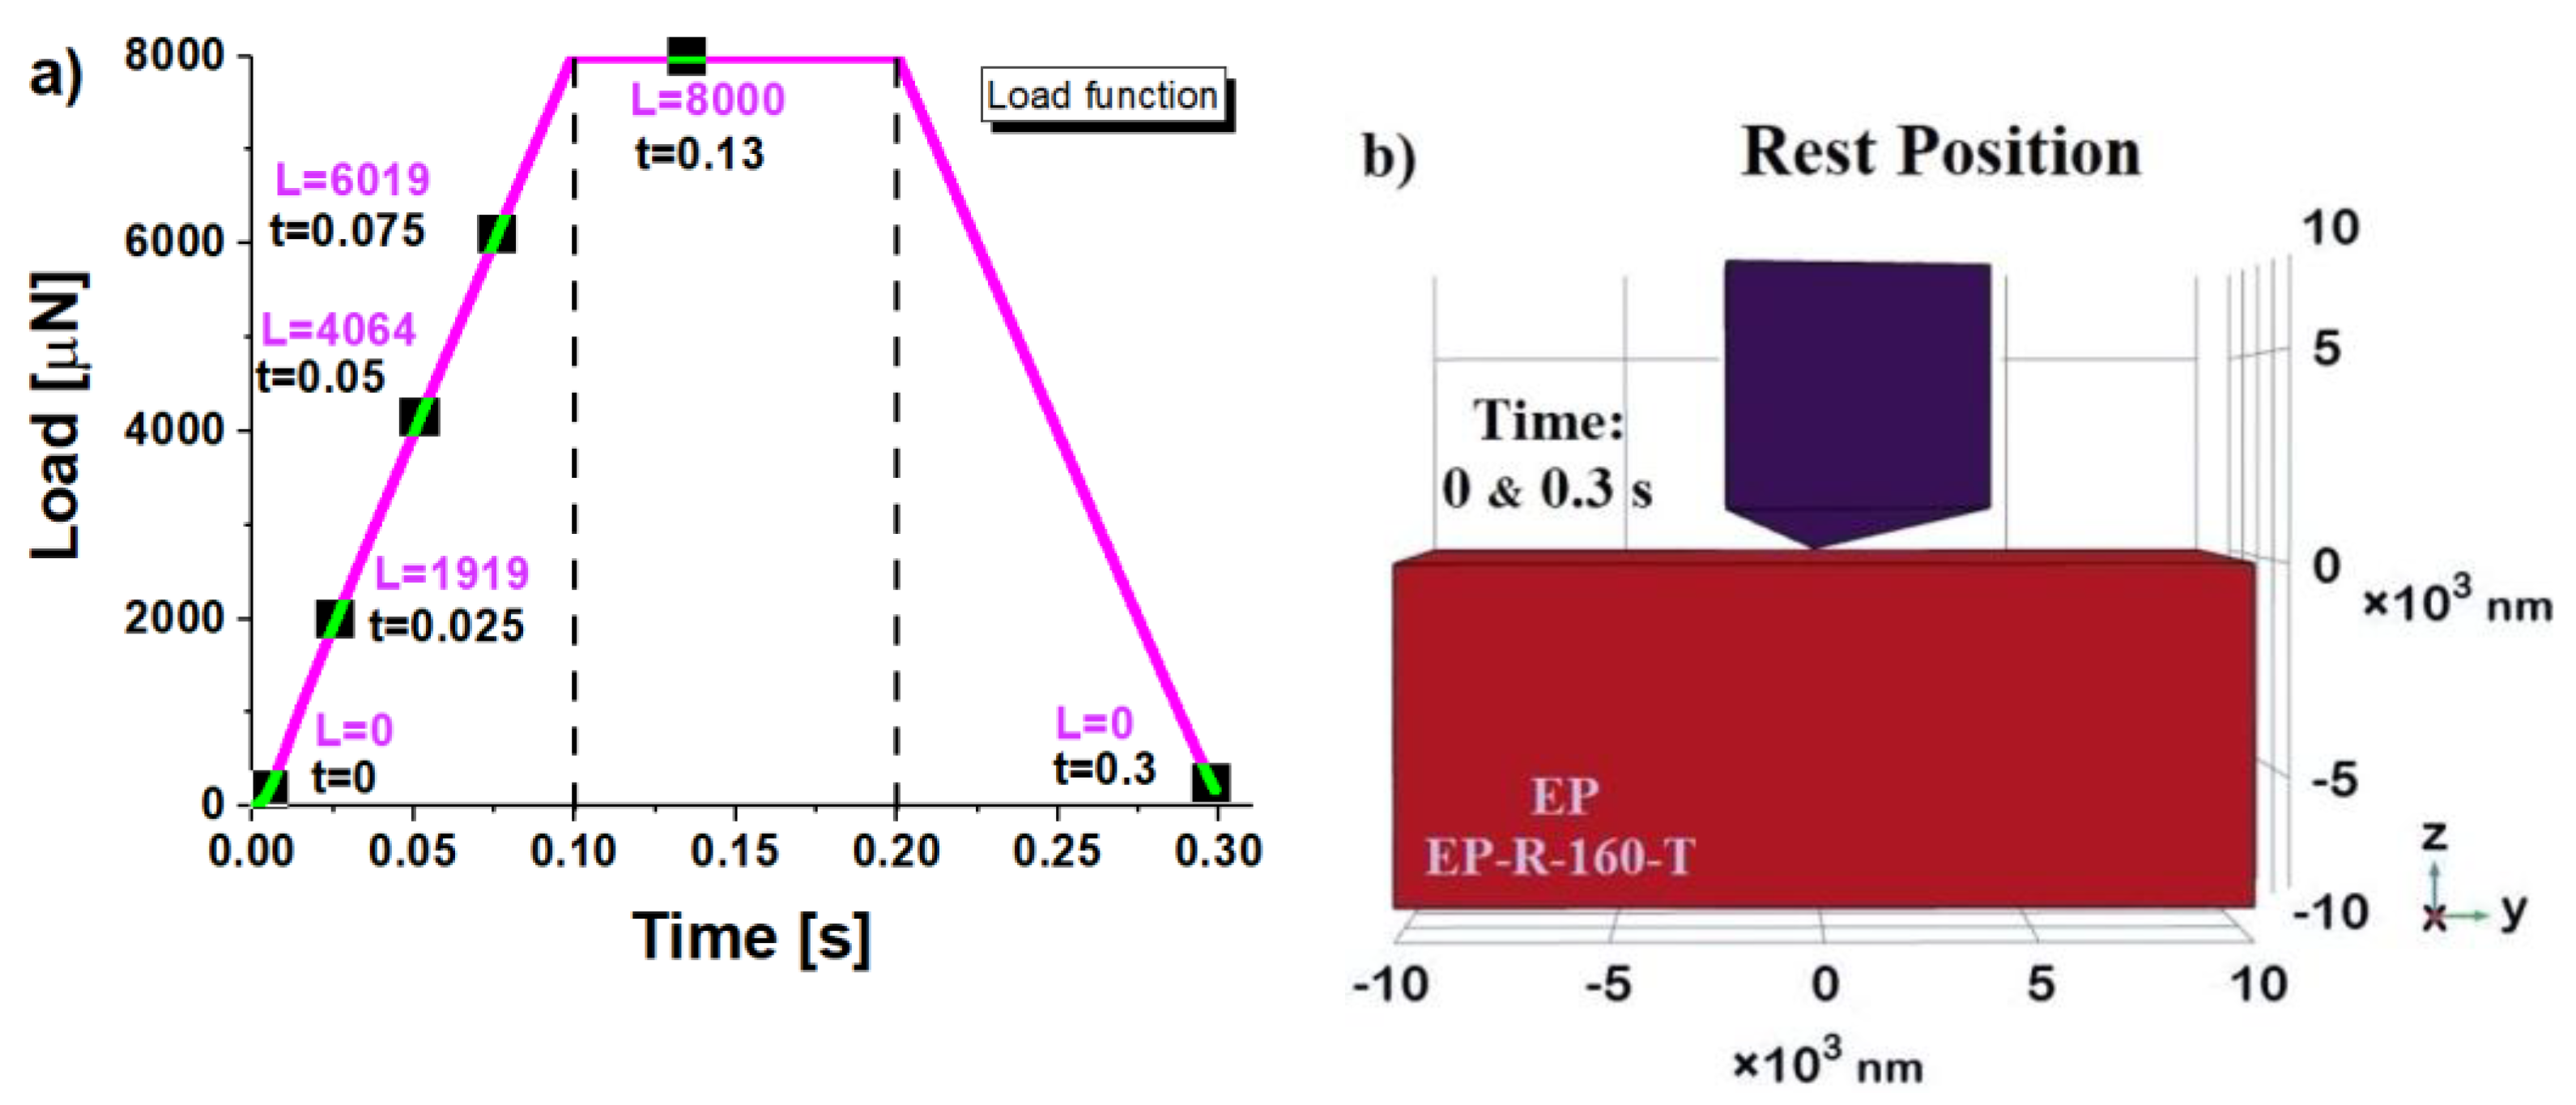
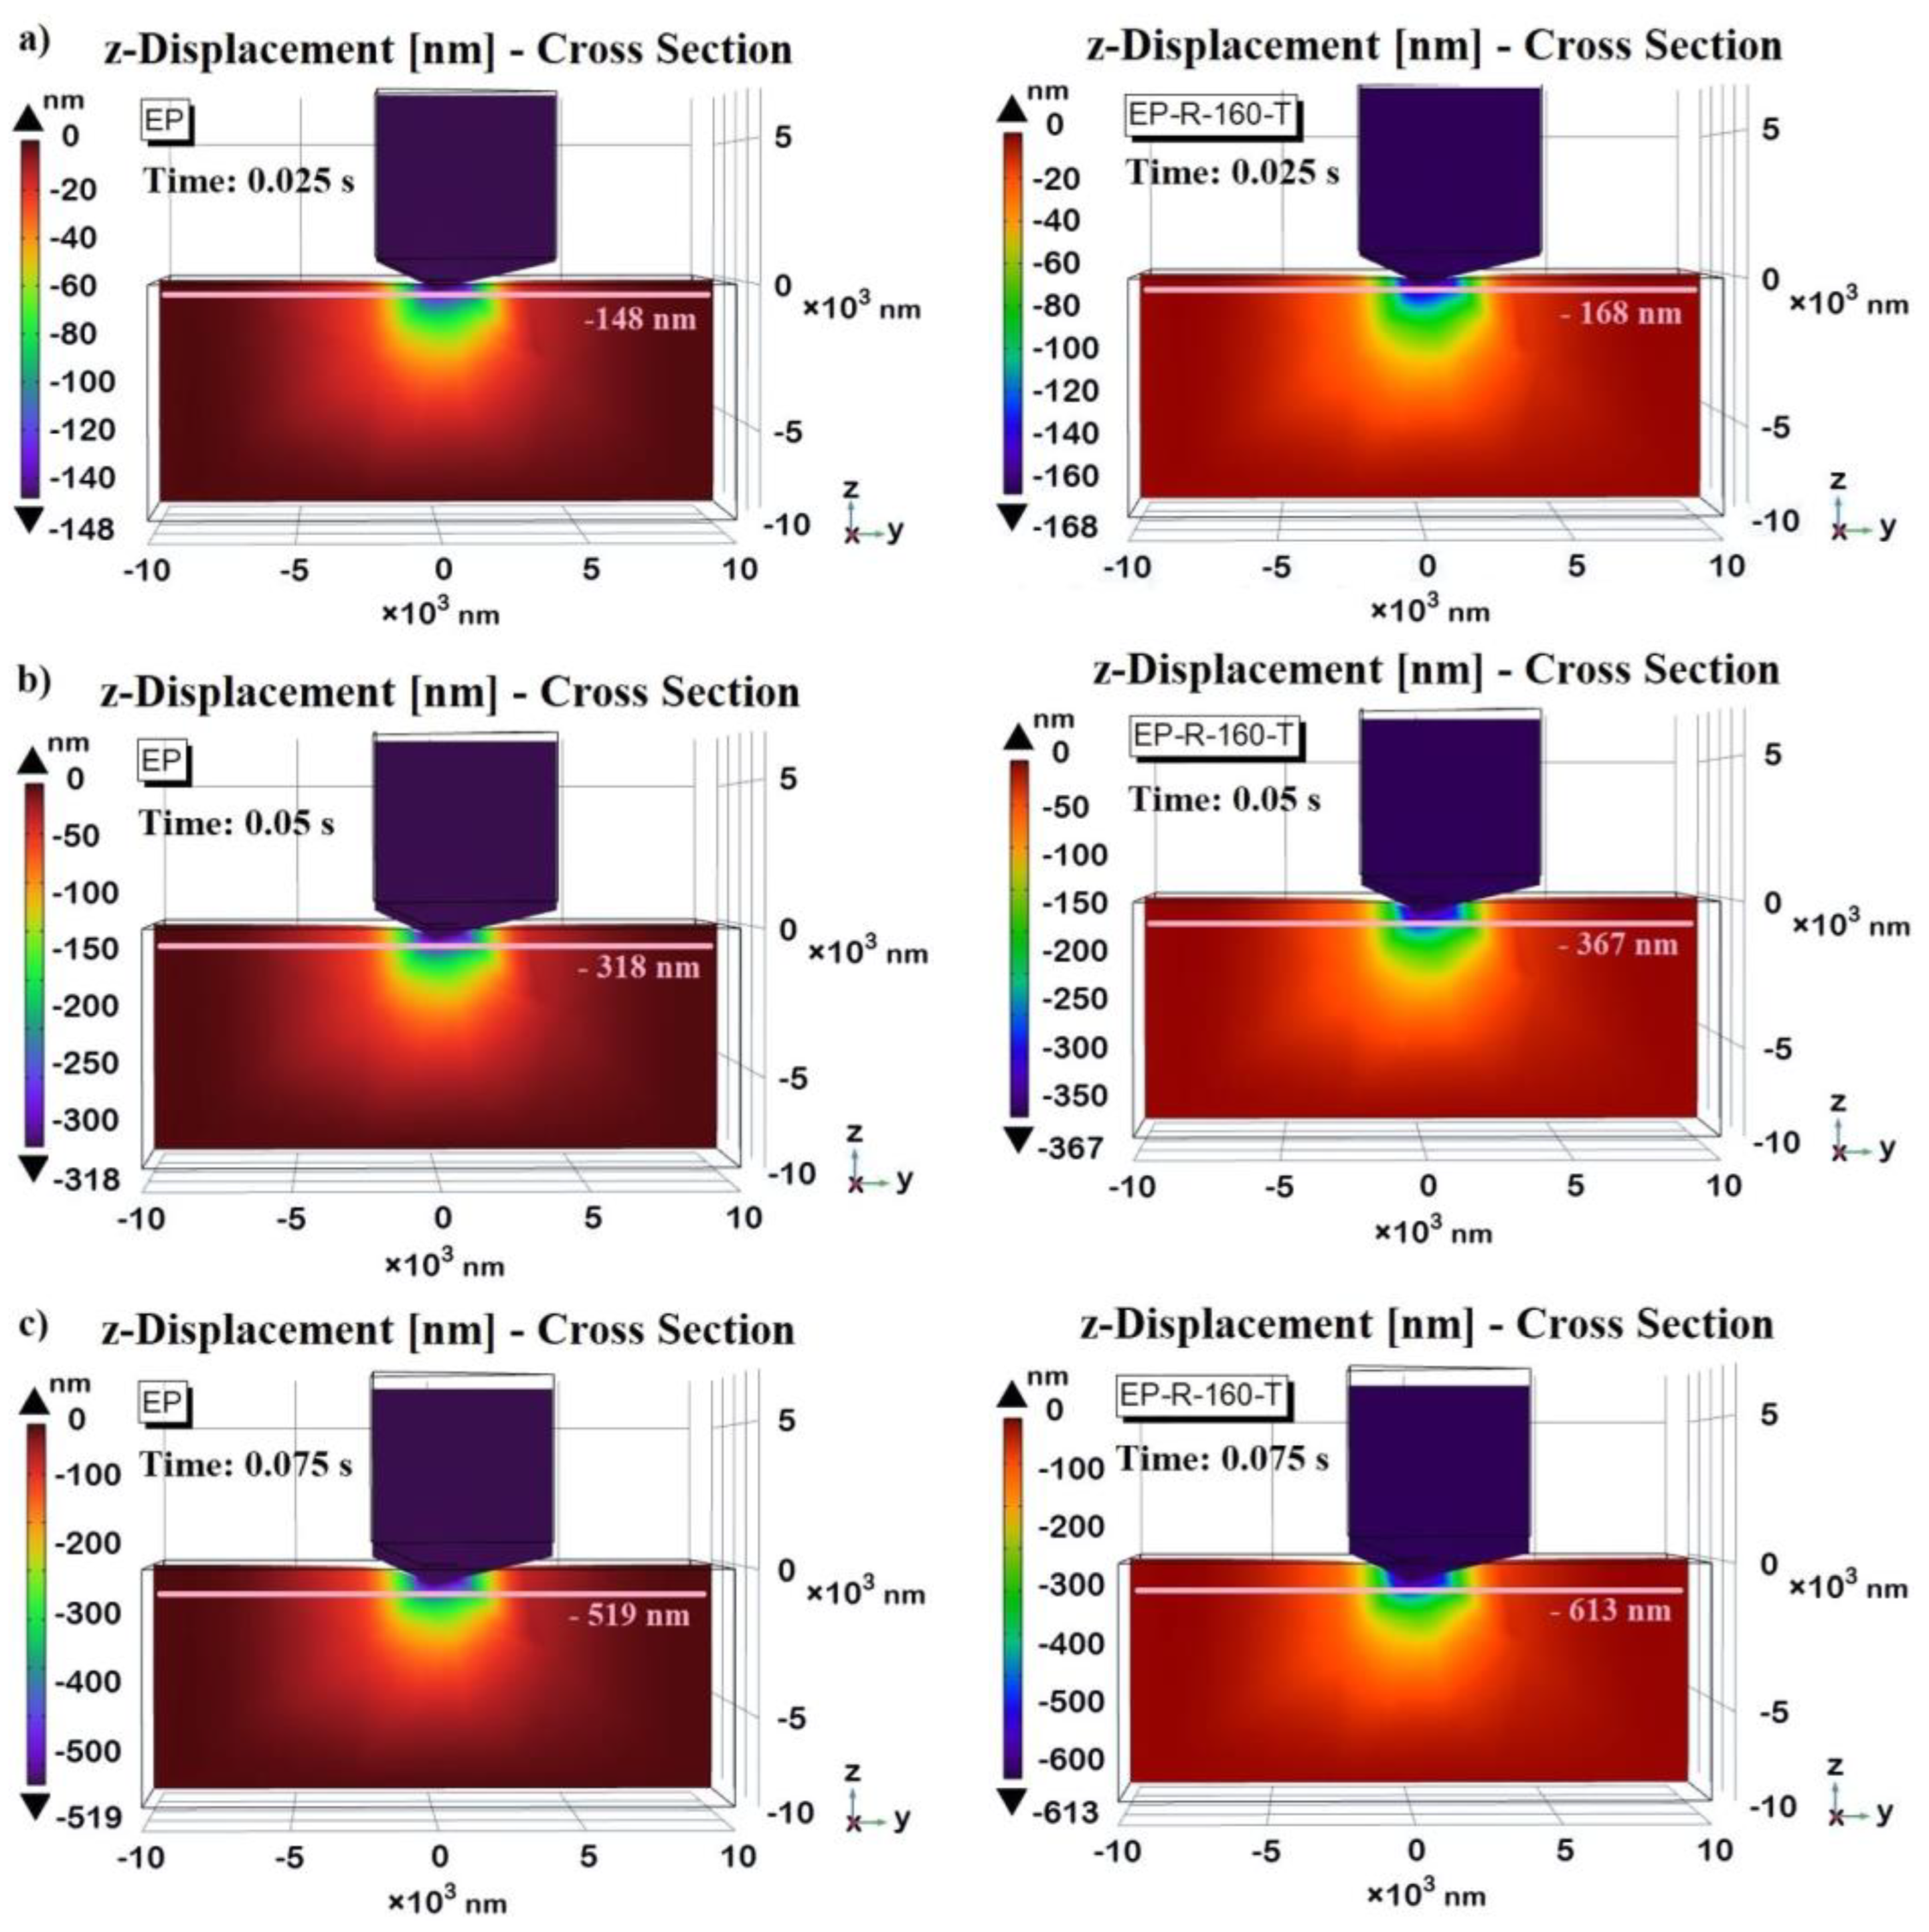

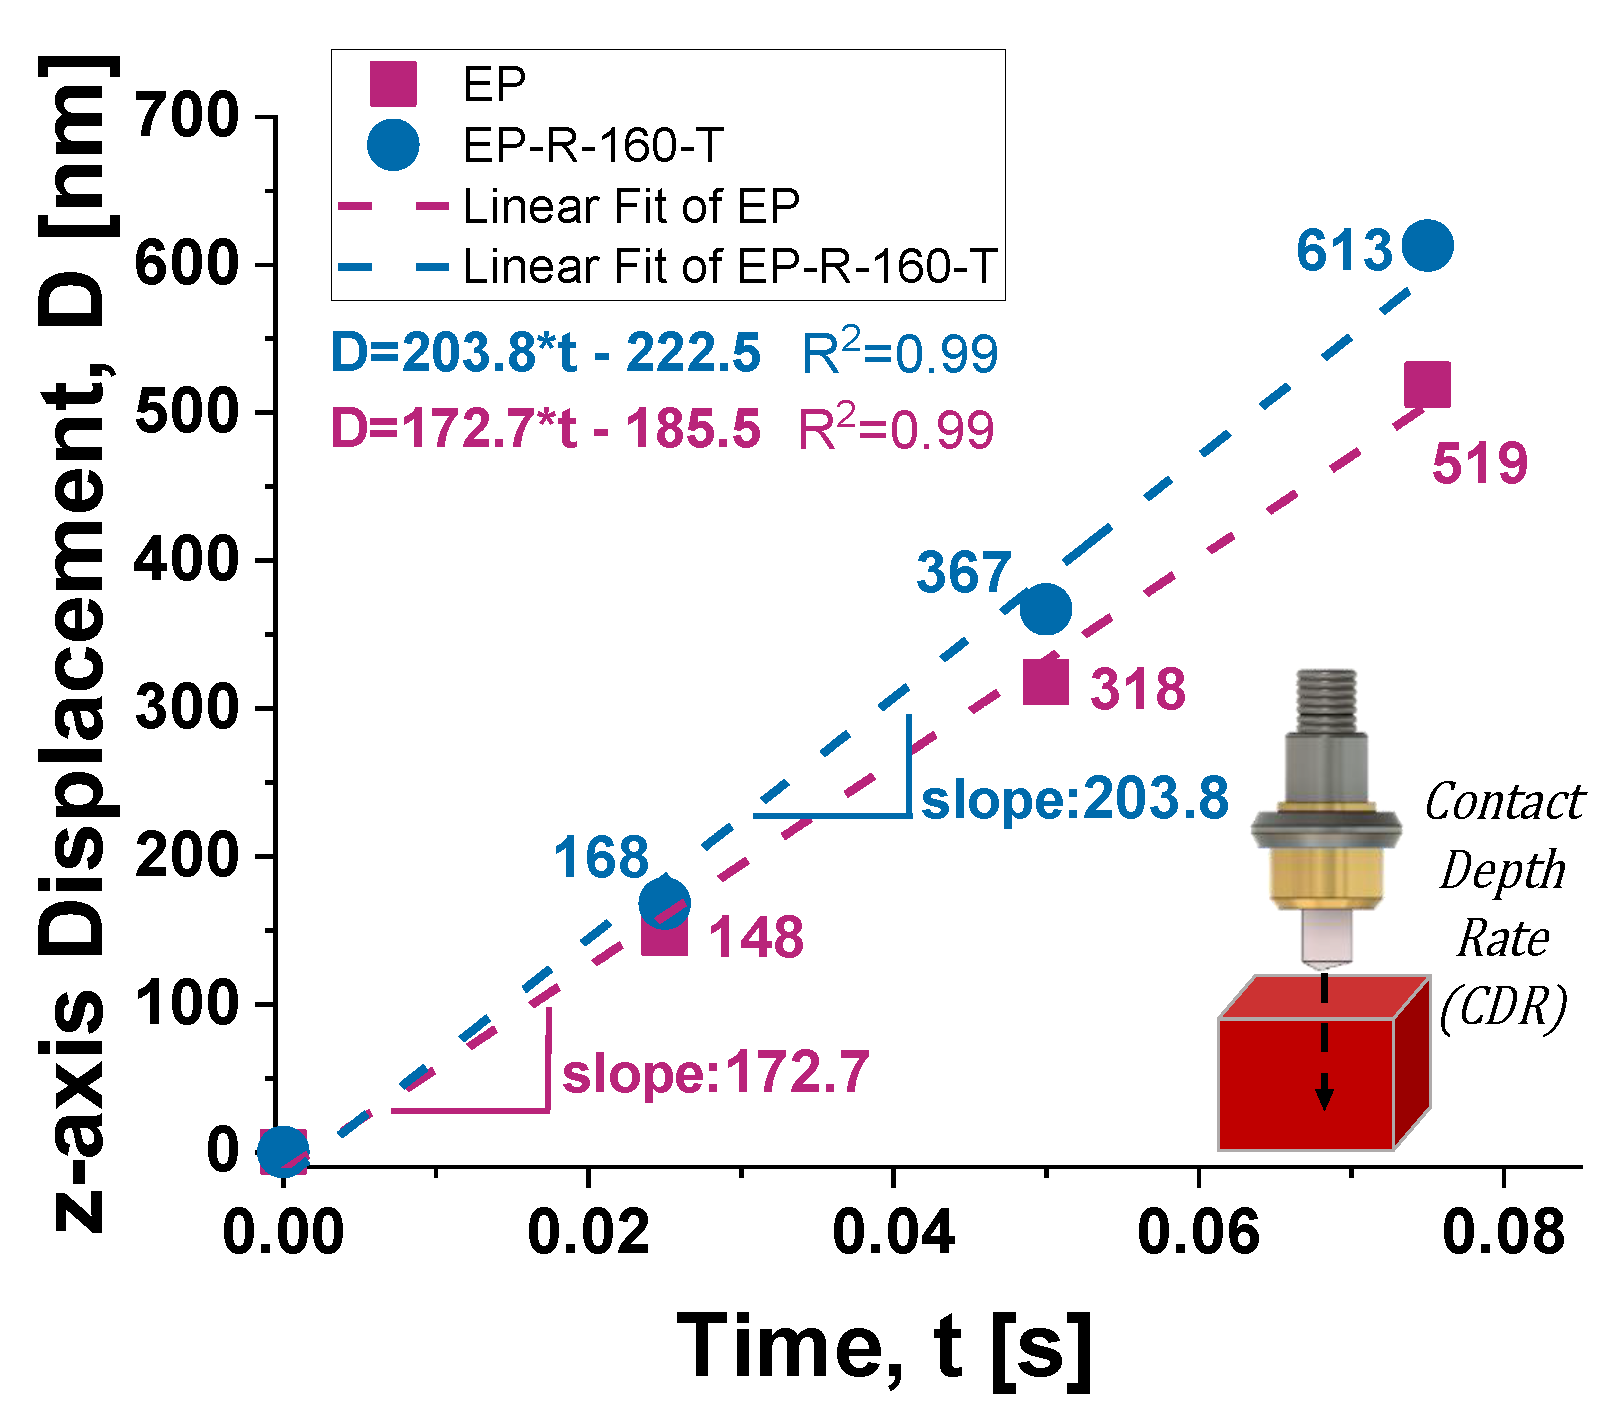
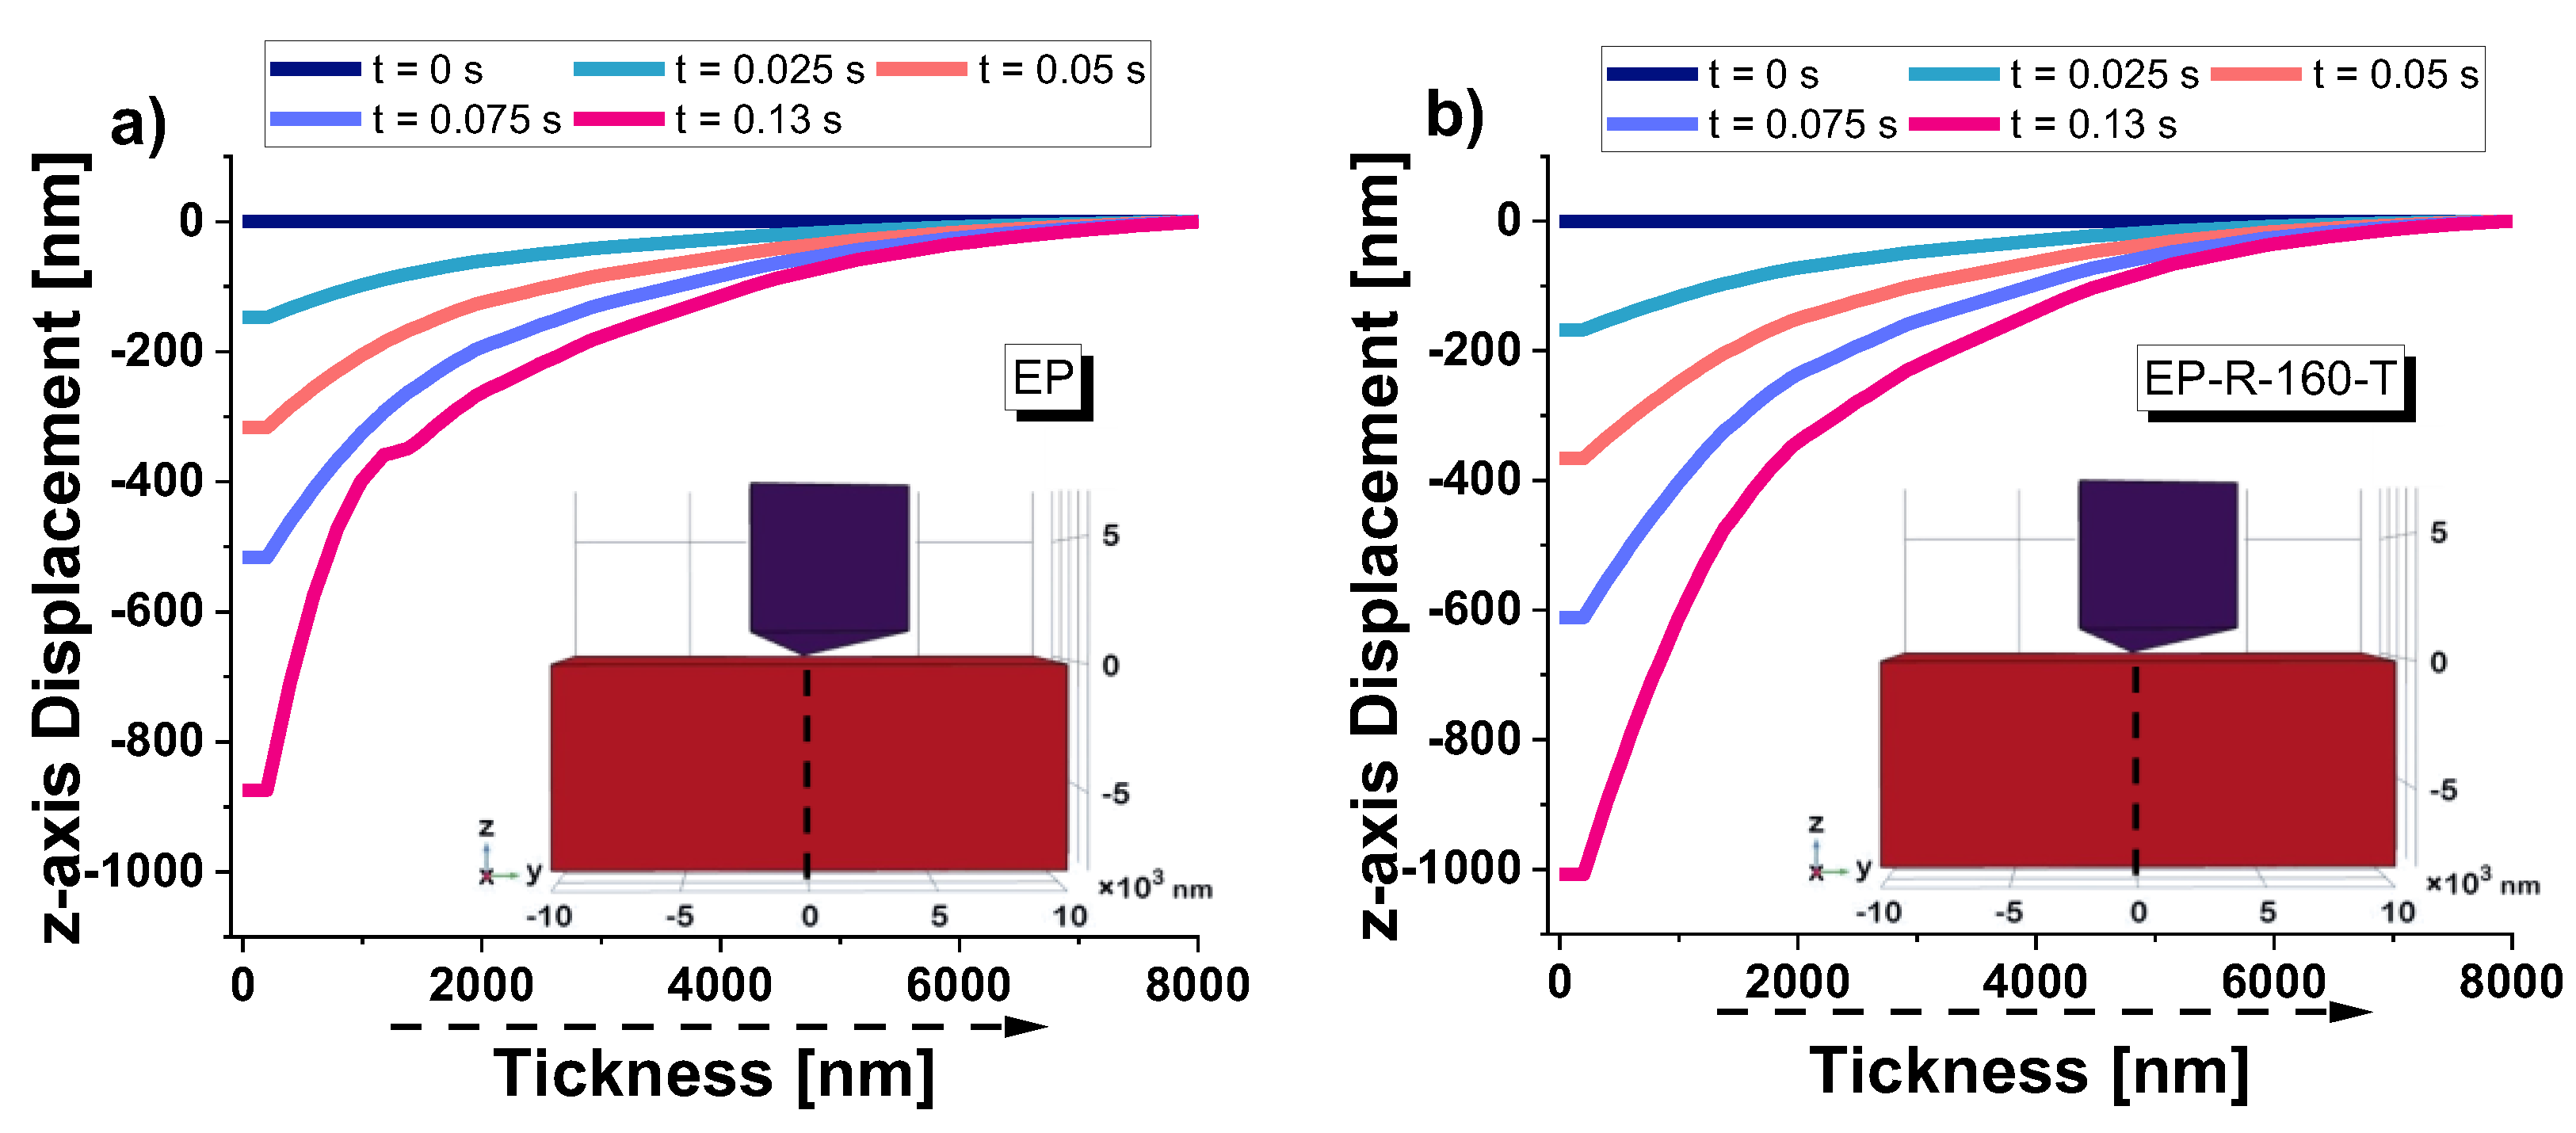
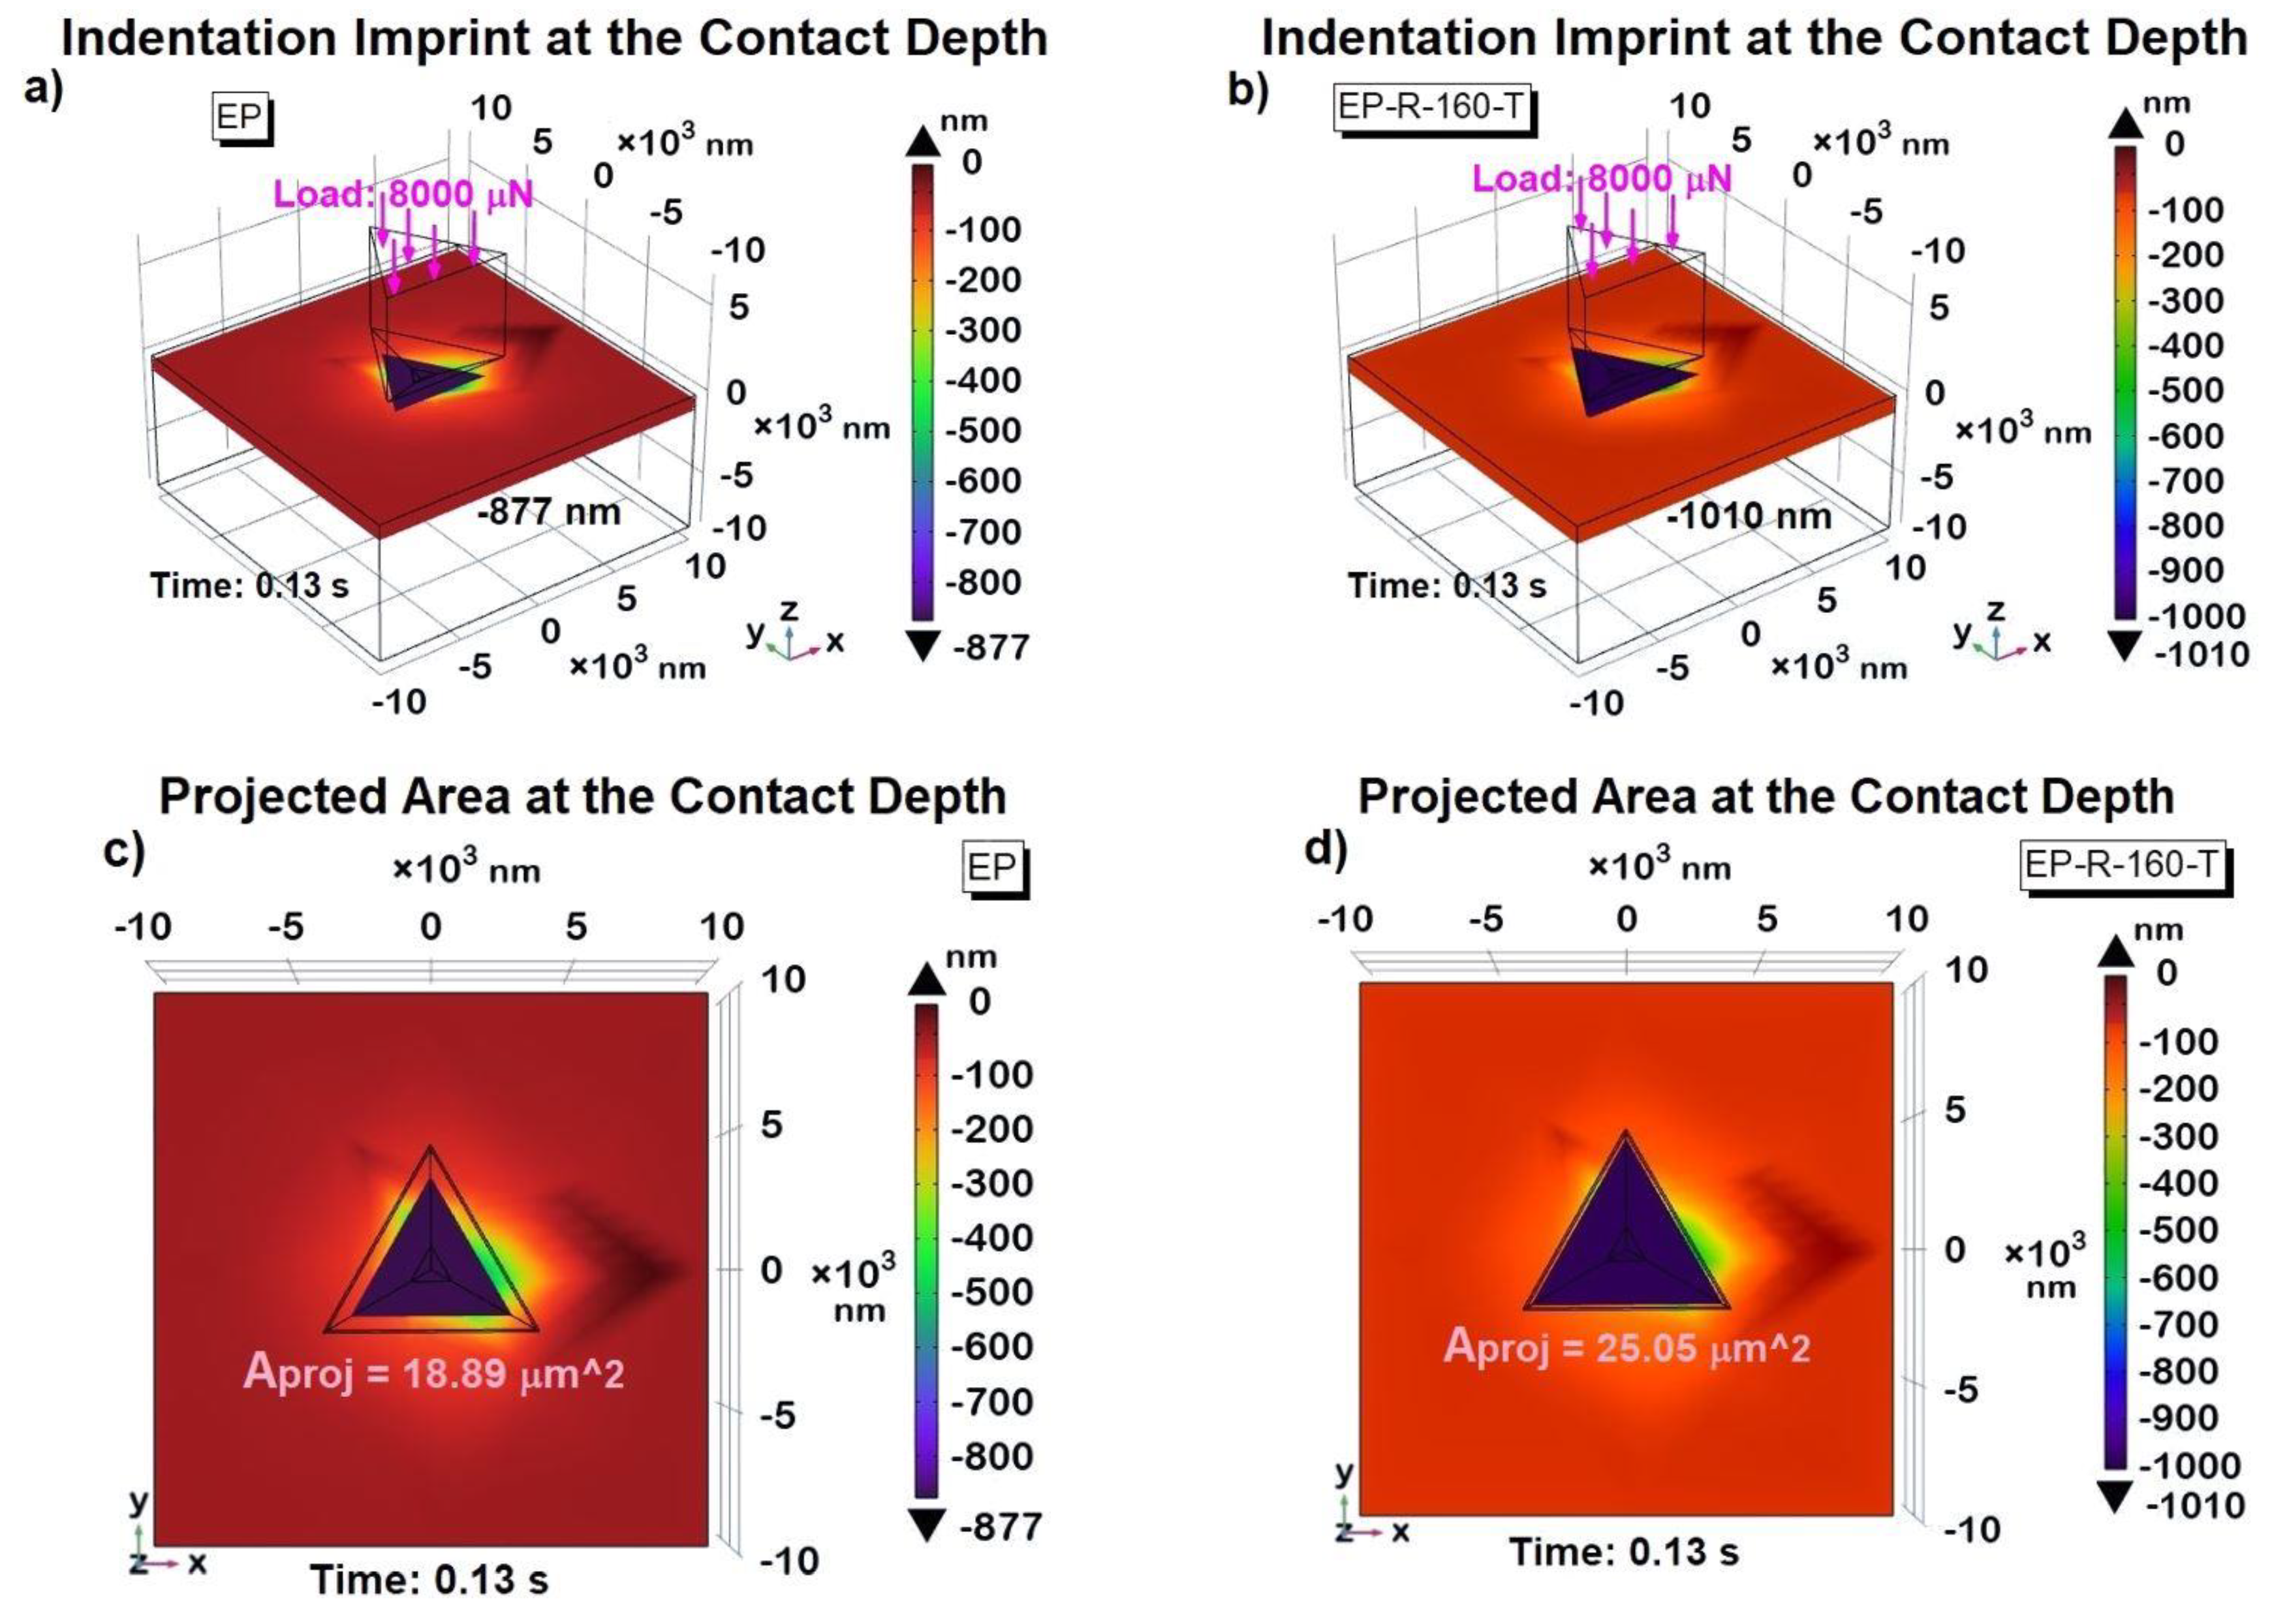
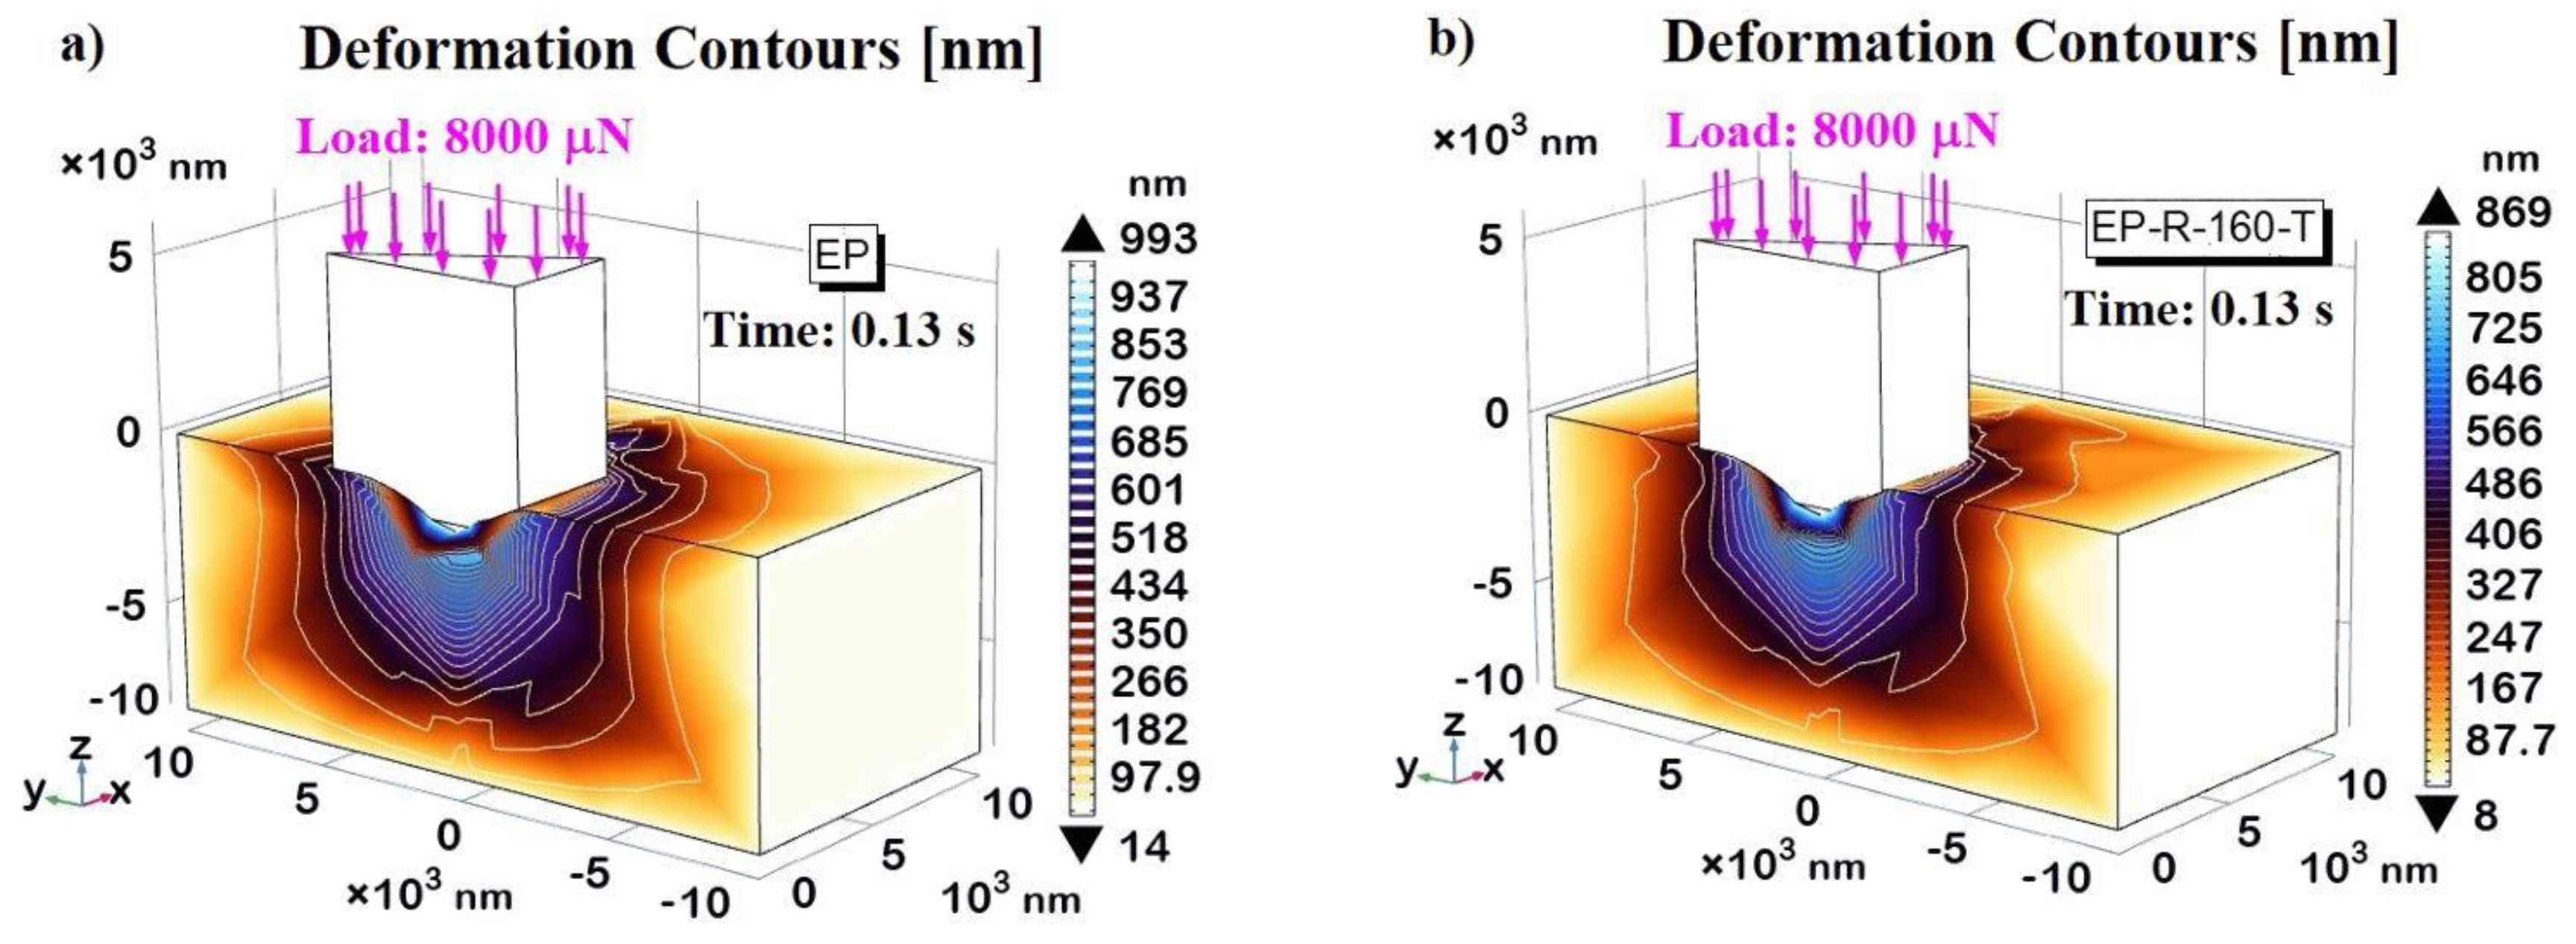

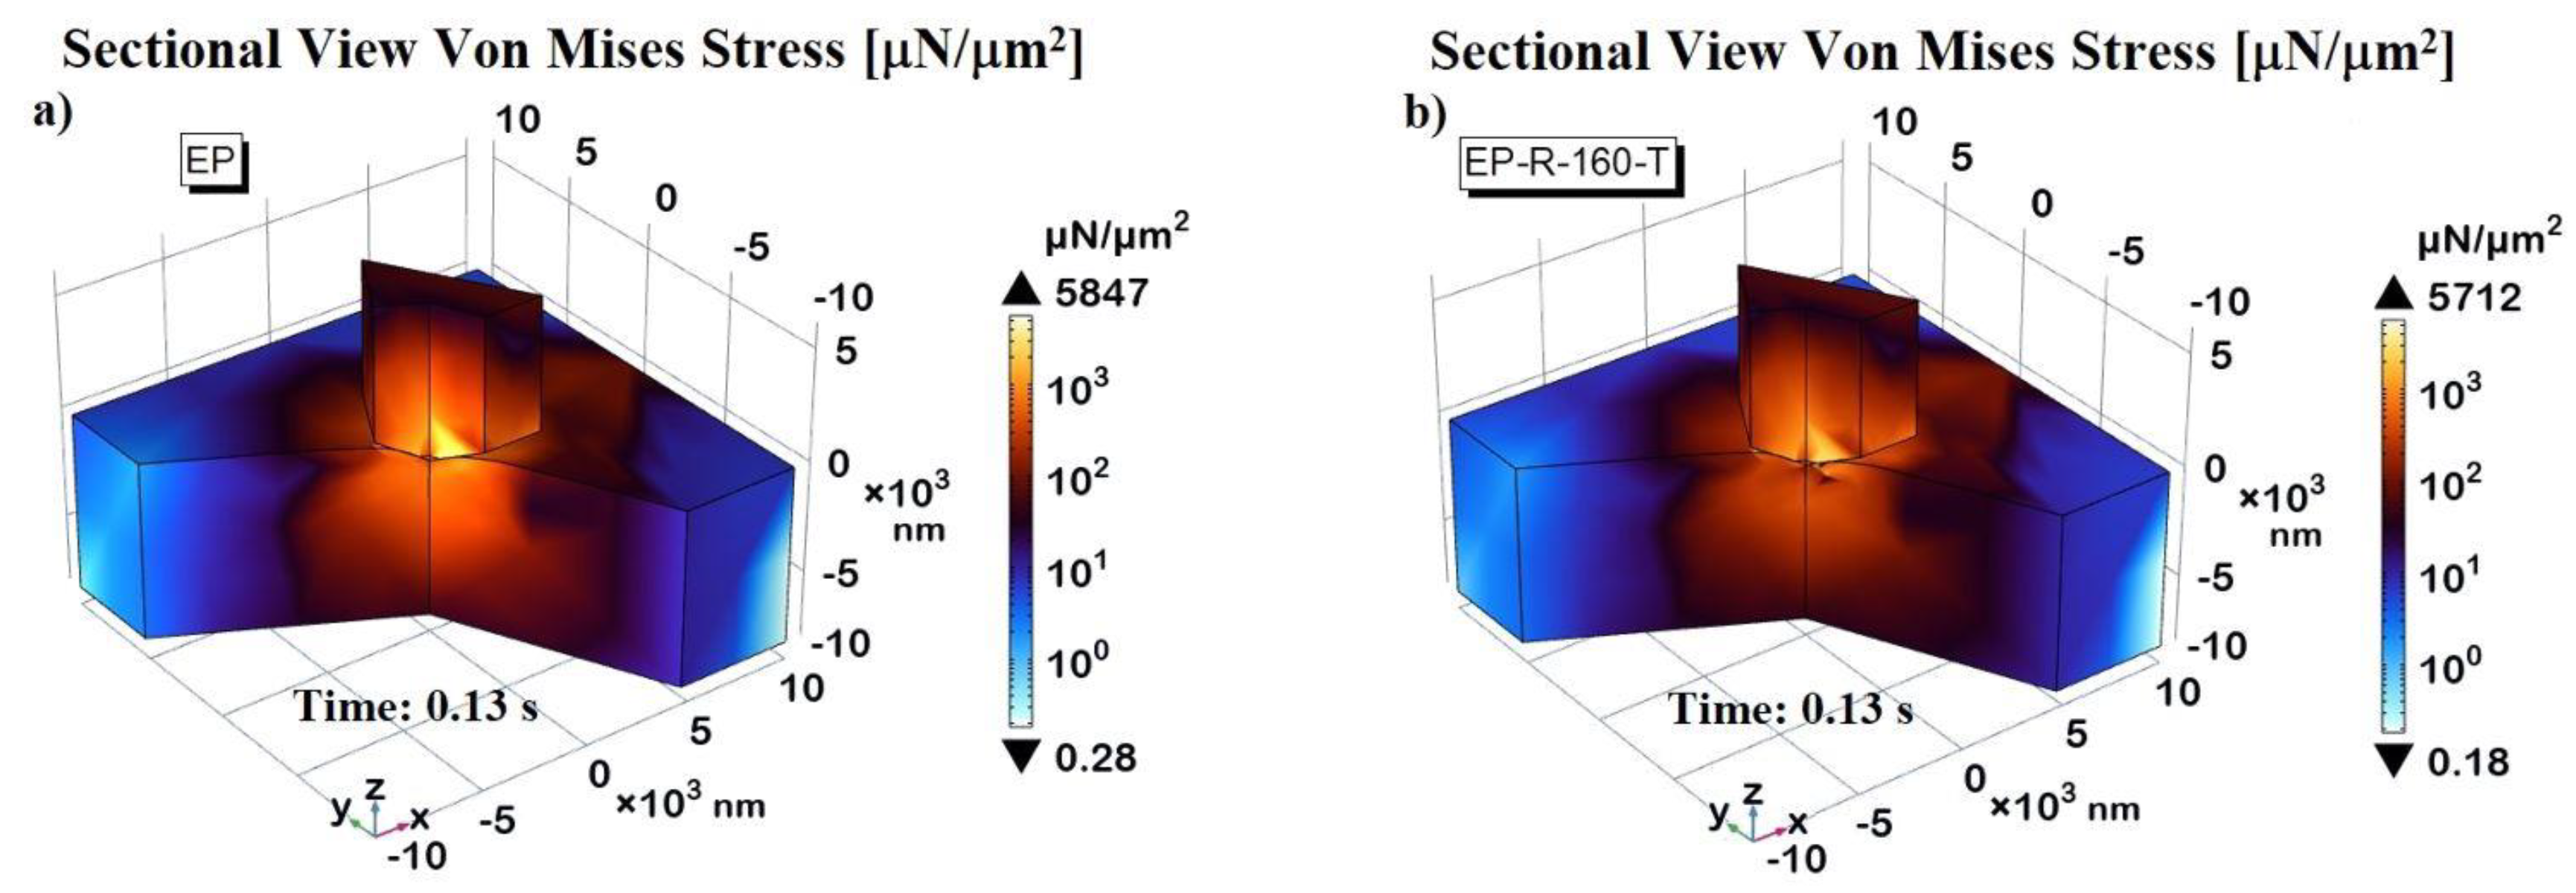
| SAMPLE: | Contact Depth Exp. |
Contact Depth Simul. |
Percent Change |
Hardness Exp. | Hardness Simul. | Percent Change |
|---|---|---|---|---|---|---|
| EP | 876.1 [nm] | 877 [nm] | 0.103 | 0.41 [GPa] | 0.42[GPa] | 2.439 |
| EP-R-160-T | 1008.8 [nm] | 1010 [nm] | 0.119 | 0.30 [GPa] | 0.32 [GPa] | 6.667 |
Disclaimer/Publisher’s Note: The statements, opinions and data contained in all publications are solely those of the individual author(s) and contributor(s) and not of MDPI and/or the editor(s). MDPI and/or the editor(s) disclaim responsibility for any injury to people or property resulting from any ideas, methods, instructions or products referred to in the content. |
© 2024 by the authors. Licensee MDPI, Basel, Switzerland. This article is an open access article distributed under the terms and conditions of the Creative Commons Attribution (CC BY) license (http://creativecommons.org/licenses/by/4.0/).


