1. Introduction
In the context of the mining sector and the increasing demand for mineral resources in China, it is crucial to carry out thorough exploration and development in various mining locations [
1]. Copper molybdenum ore is an important industrial and strategic mineral resource in China [
2]. Although there are many proven reserves of copper molybdenum ore in China, its grade is significantly lower compared to the main molybdenum resource countries in the world, such as the United States and Chile, and most of them belong to low-grade deposits [
3]. Henan is the province and city with the most abundant molybdenum mineral resources in China, with molybdenum reserves accounting for 30.1% of the total reserves in the country [
4]. The Qiushuwan Cu-Mo deposit is situated inside the East Qinling molybdenum belt and is classified as a moderately sized molybdenum mining zone [
5]. Given the status of exploration and development, it is crucial to promptly study the deep and peripheral areas in order to discover more mineral reserves. Exploratory efforts have been conducted at the Qiushuwan Copper Molybdenum Mine in Zhenping County, Henan Province, since the 1970s [
6]. Regarding tectonic background, ore-forming parent rocks, and ore-forming belts, it has significant characteristics with big to ultra-large deposits such as Jinduicheng, Nannihu, Sandaozhuang, and Leimengou in the East Qinling Copper Molybdenum Mine Belt, which were produced concurrently [
7]. To accelerate the exploration process in the Qiushuwan area and we utilize the application of SSIP geophysical exploration technology in copper molybdenum ore exploration.
2. Regional Geology
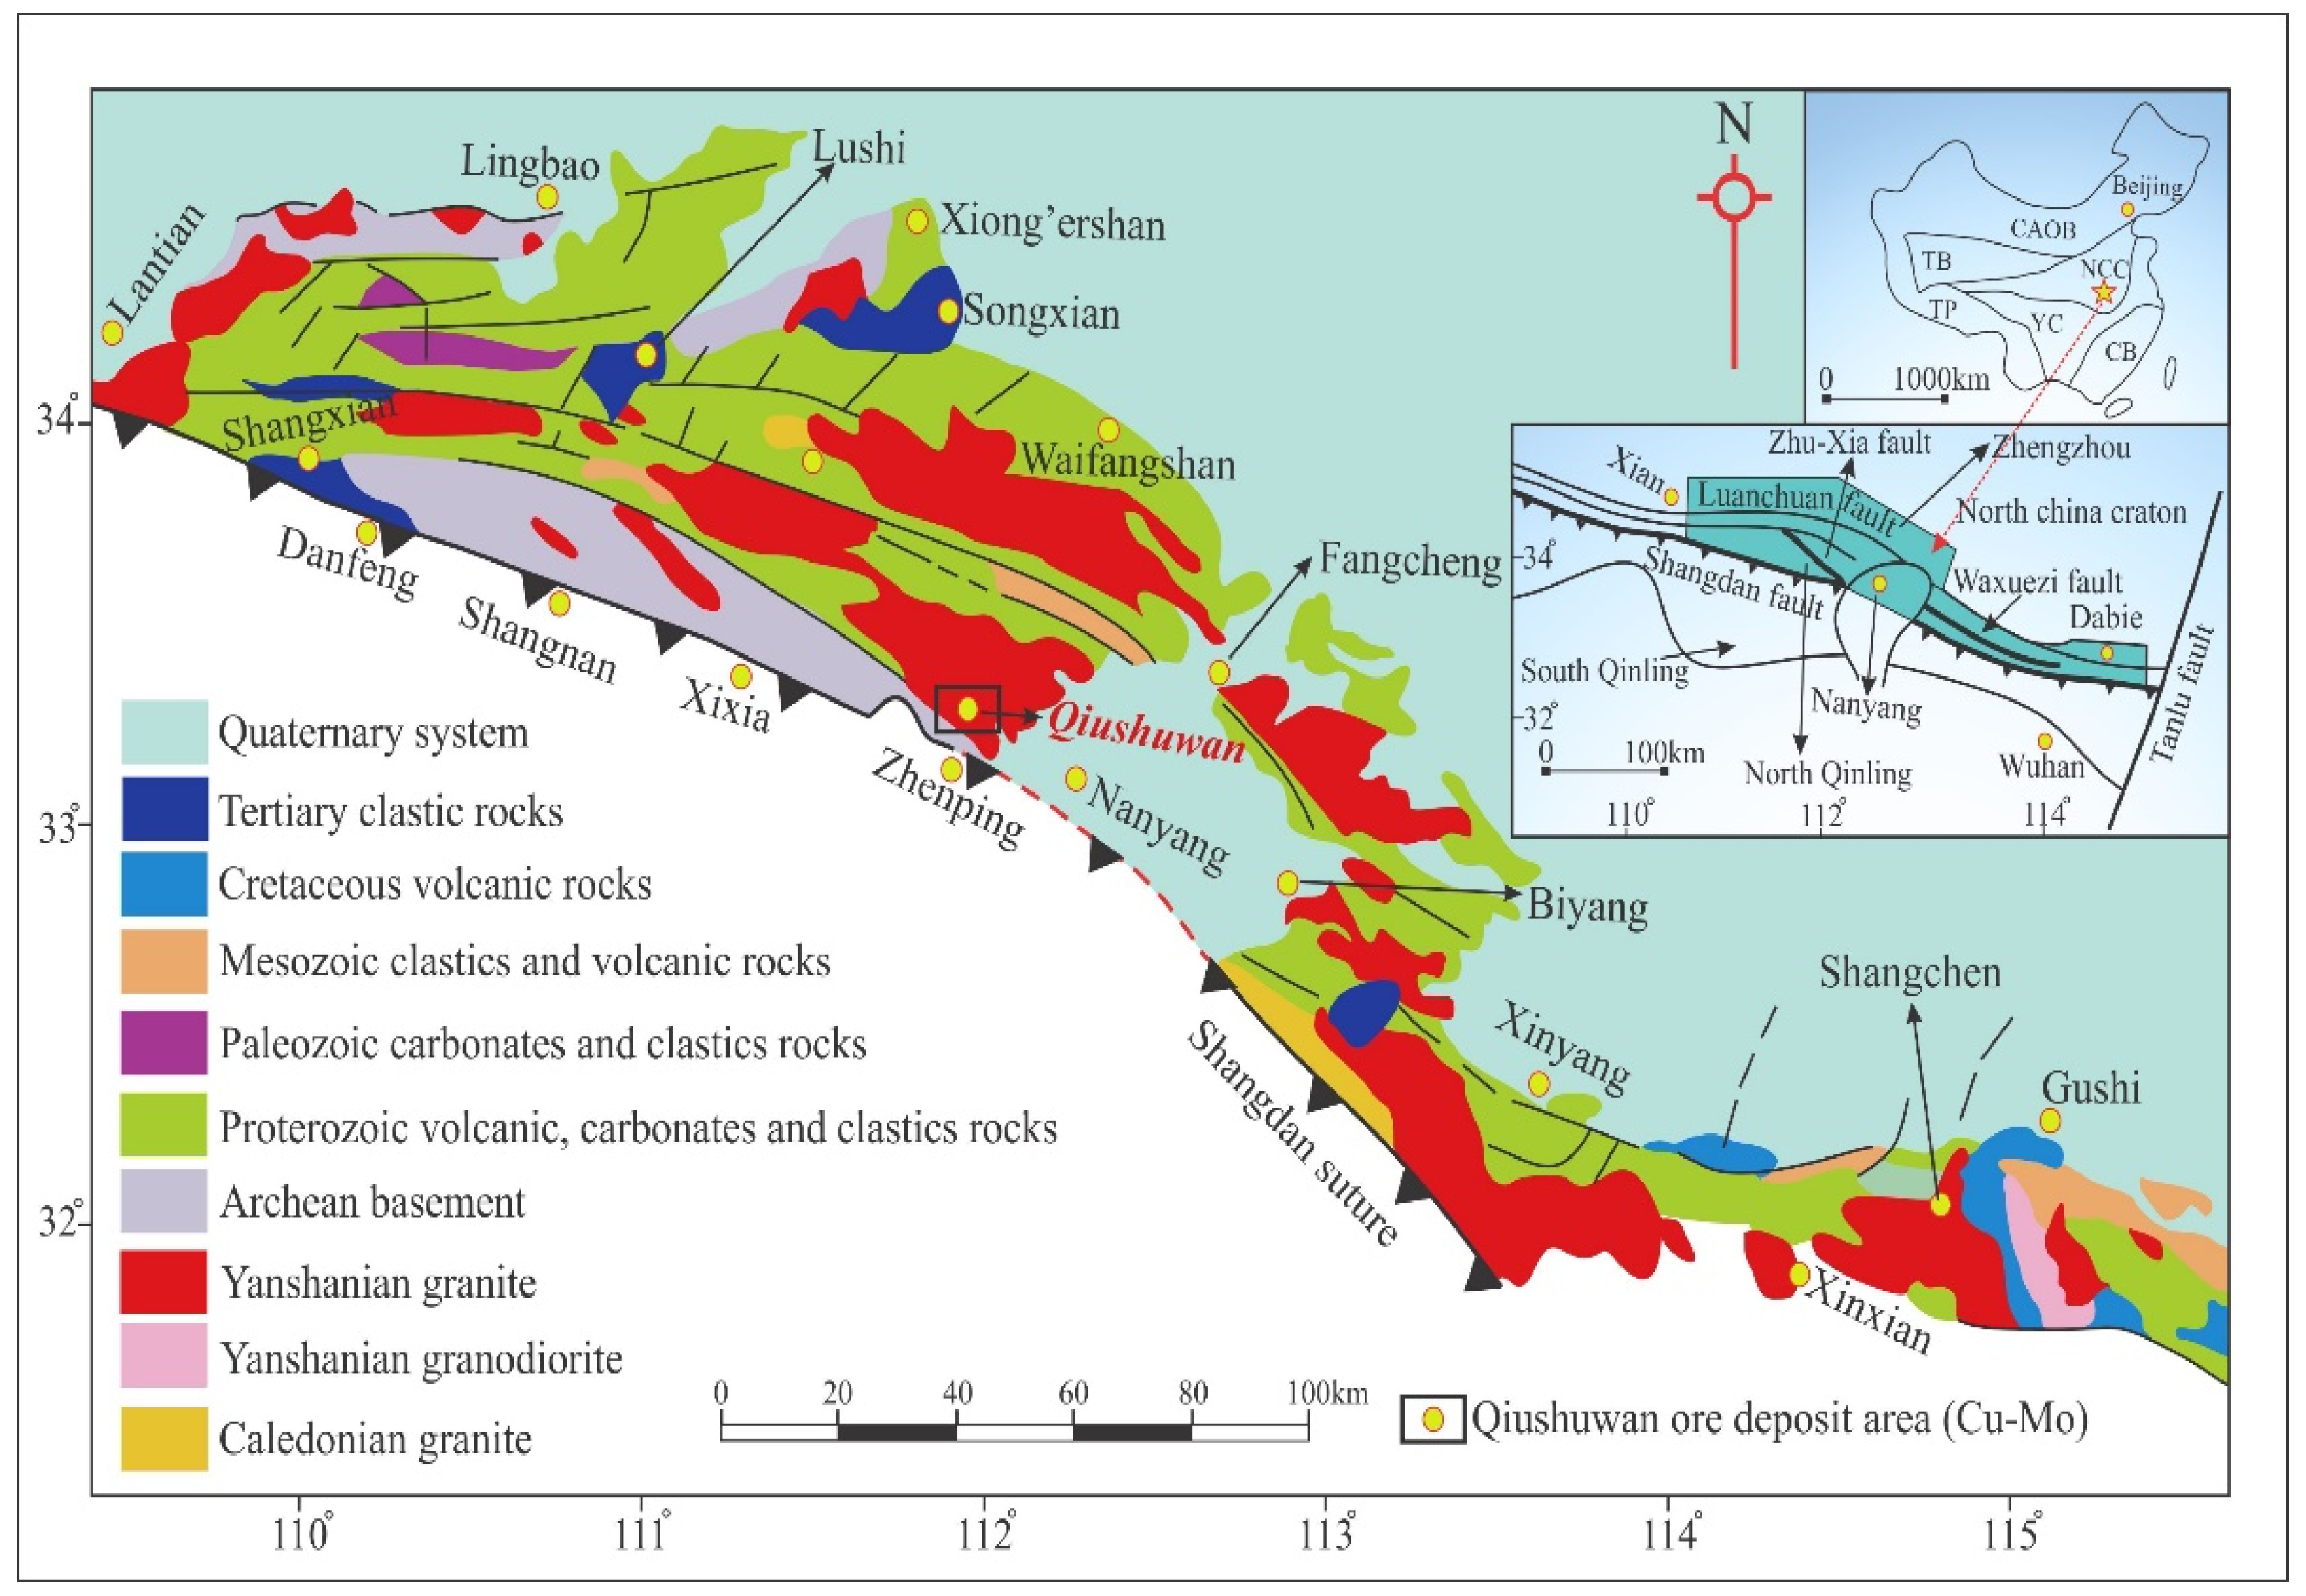
The Qinling–Dabie Orogenic Belt, located in the eastern part of the Central China, which is one of the economically significant collisional orogens in eastern Asia this orogenic belt marks the suture zone between the North China Craton (NCC) and the Yangtze Craton (YC) and is broadly subdivided into two units the North Qinling and the South Qinling, which are separated from each other by the Shangdan Suture Zone Fig 1. The NCC and the YC are separated by the Paleo-Tethys Ocean in the Early Paleozoic the middle Paleozoic collision along the Shangdan Suture Zone accreted the South Qinling terrane to the southern part of the North China Craton (i.e., North Qinling terrane) and the middle to late Paleozoic rifting and subsequent drifting separated the South Qinling terrane from the YC [
8]. The Triassic collision of the YC with the South Qinling terrane led to the final integration of the orogenic belt The Early Mesozoic continent–continent collision between the YC and NCC resulted in an over-thickened continental crust followed by an uplift and extensional tectonic collapse in the Middle Jurassic to the Early Cretaceous Rock units in the Qinling–Dabie Orogenic Belt have complicated lithologic associations. The North Qinling terrane is dominantly composed of middle Paleozoic medium-grade metasedimentary and metavolcanic rocks The basement of this terrane mainly consists of the Mesoproterozoic Qinling Group biotite plagioclase gneiss, granulite, amphibolite, dolomitic and graphitic marbles and the Neoproterozoic Kuanping Group consists of meta-basalts, clastic and carbonate rocks In difference, the South Qinling terrane consists of meta-volcanic rocks and meta-sedimentary rocks (Neoarchean Yudongzi Group), amphibolite, leptite, migmatite, the Douling gneiss–amphibolite–marble) and Neoproterozoic volcanic rocks as well as an overlying Cambrian to Triassic sedimentary rocks In accumulation, late Mesozoic (Late Jurassic to Middle Cretaceous, the so-called “Yanshanian” in Chinese literature) granitoids are also widespread in the Qinling–Dabie orogenic belt, and commonly intruded the Archean to Neoproterozoic metamorphic rocks in the orogenic belt
Figure 1. The porphyry and skarn Mo deposits are spatially and temporally associated with the granitic rocks that mainly outcrop across the Launchman fault in the orogeny.
3. Deposit Geology
The Cu-Mo deposit of Qiushuwan is situated in the northern region of the Shangdan Suture Zone, precisely within the North Qinling terrane [
10]. The region is distinguished by a structural framework that comprises structures oriented in a NWW and NW direction, which are in accordance with the tectonic lineaments of the area [
9]. The Early Proterozoic Qinling Group is the primary rock formation in the region, characterized by the presence of schist, marble, and granitic gneiss [
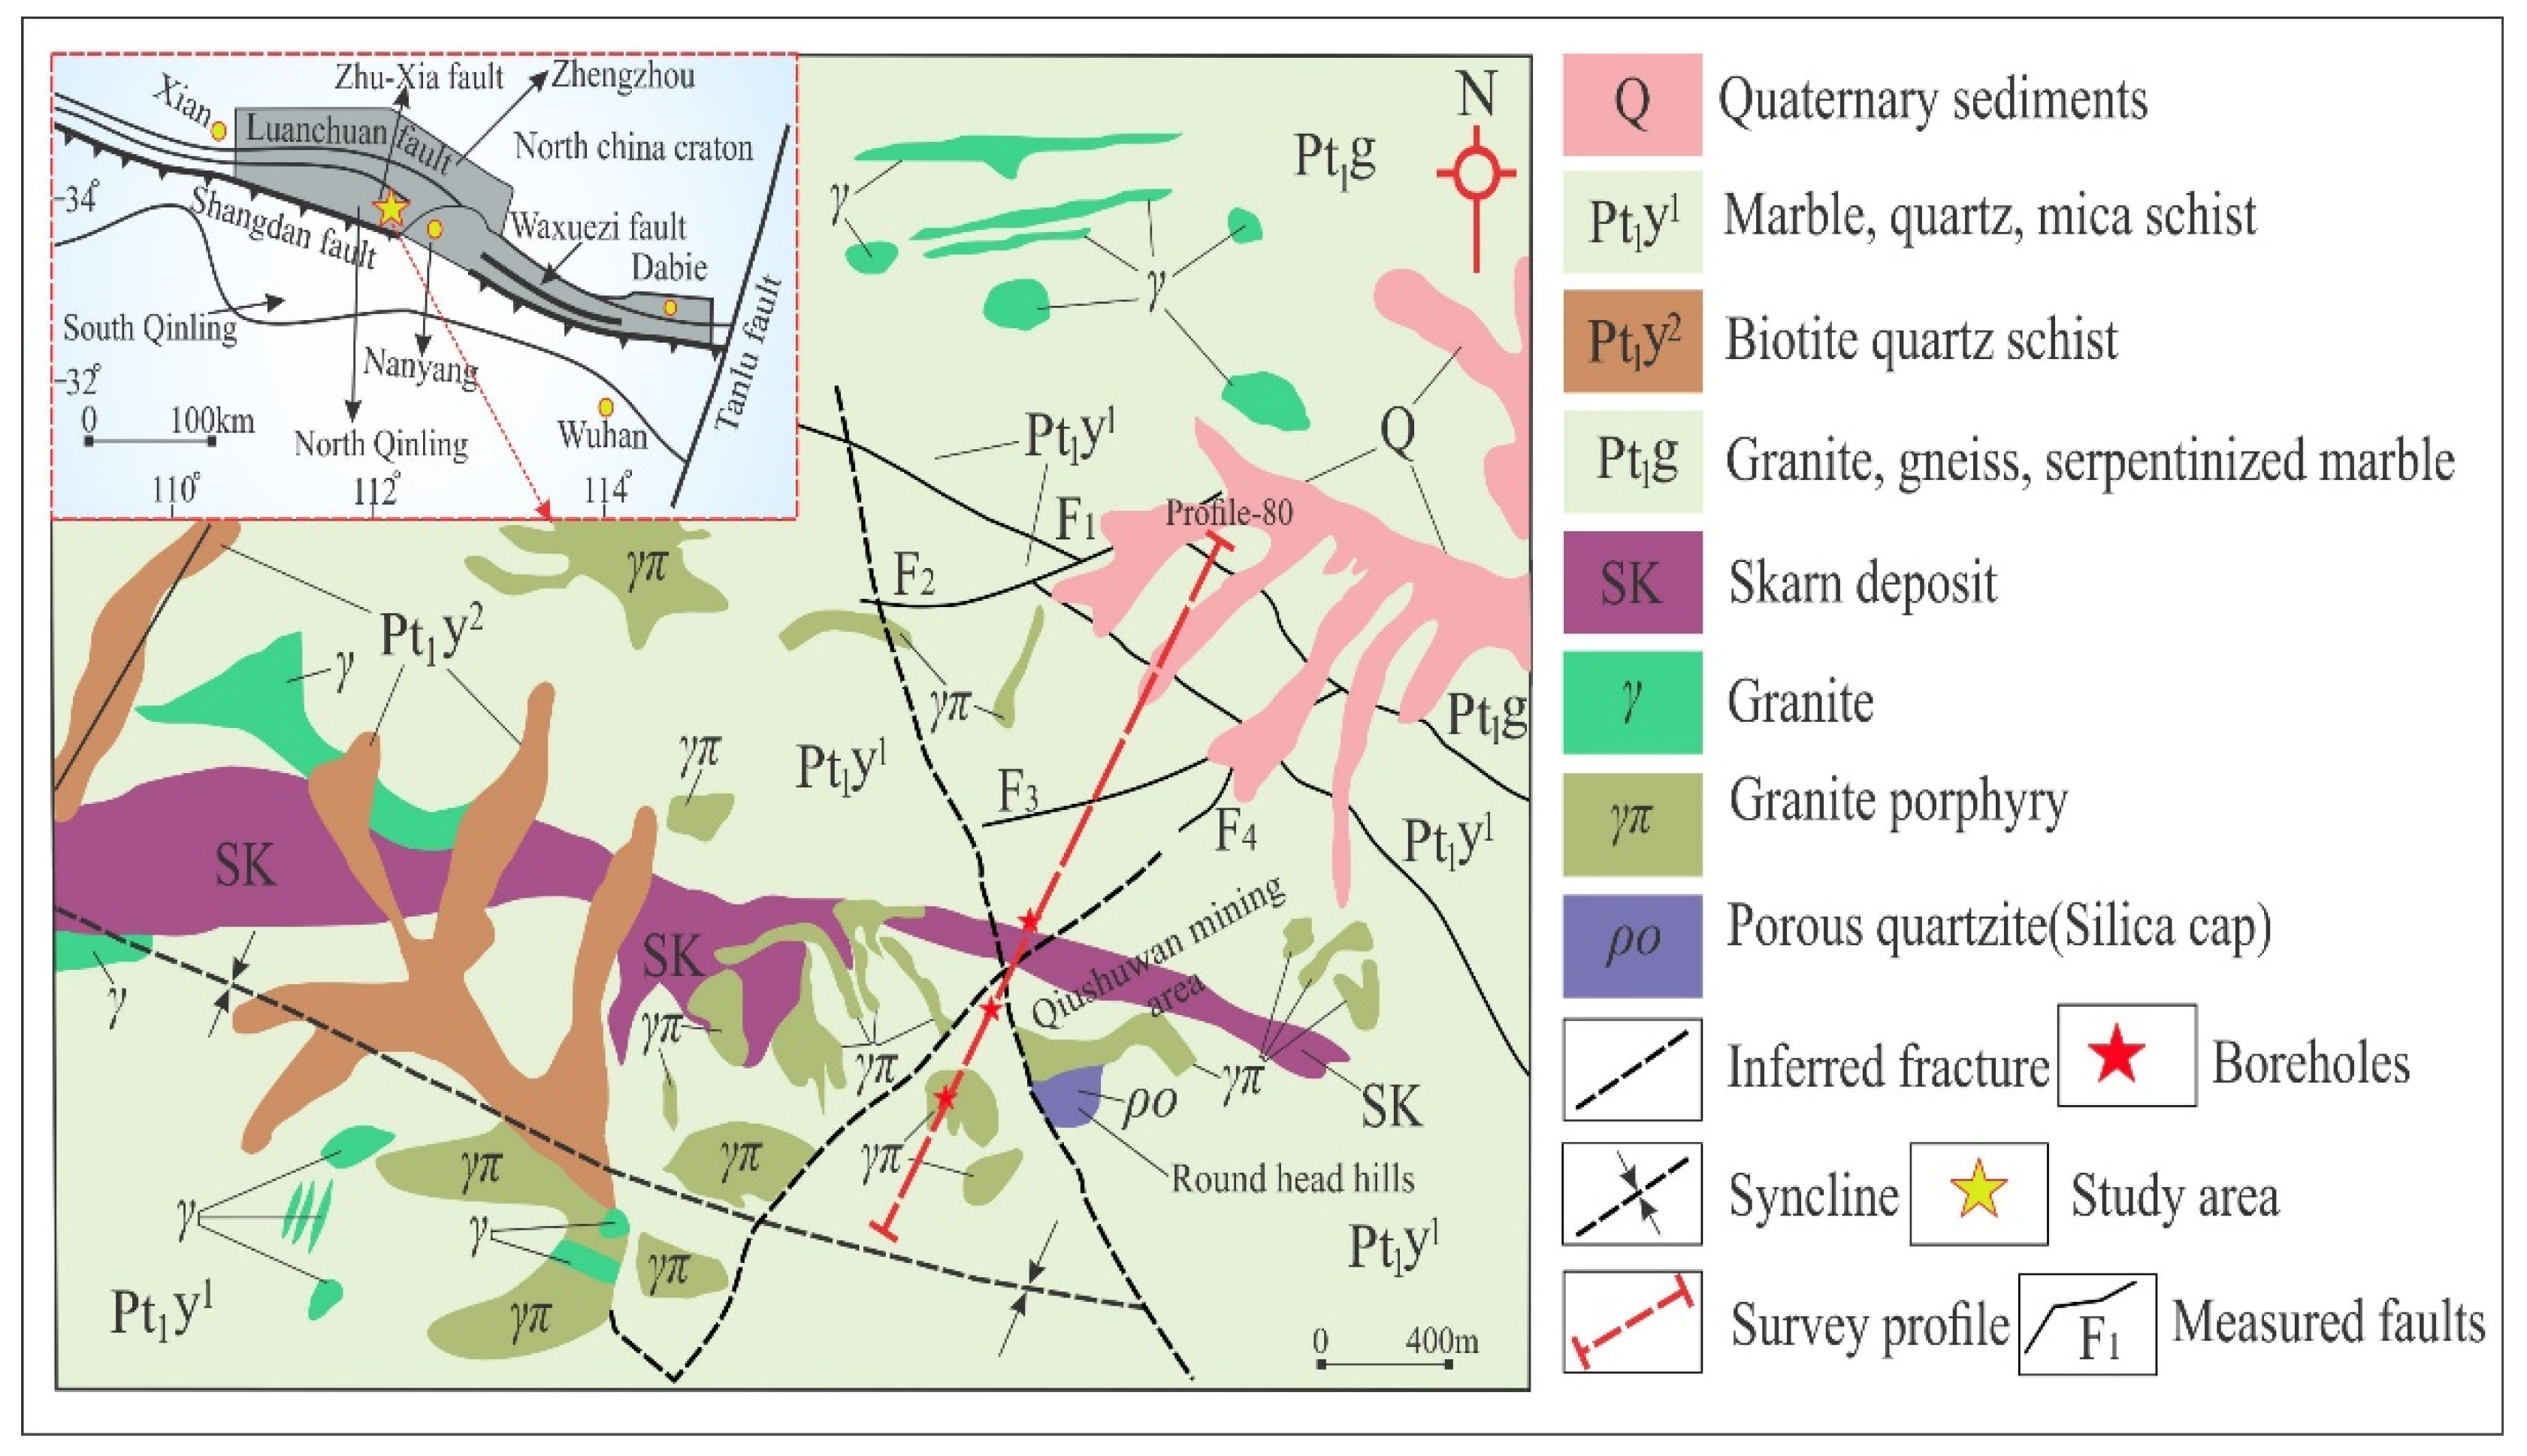
11]. The sedimentary accumulation is linked to Mesozoic quartz porphyries and porphyritic granodiorites, which constitute the majority of the granitoids Fig 2. Quartz porphyries are observed to penetrate the Early Proterozoic Qinling Group through faults that trend in either a northeastern or westerly direction. These porphyries manifest as irregular-shaped stocks or dikes on the surface [
12]. The formation of NWW-trending bodies within a synclinal core is intimately associated with porphyritic granodiorite, which is directly tied to Cu-Mo mineralization [
13]. The region where the porphyritic granodiorites come into contact with the adjacent wall rock displays significant alterations, such as skarnization, silicification, potassic alteration, sericitization, and pyritization [
14]. In the Qiushuwan porphyry-skarn Mo deposit, the predominant ore minerals consist of molybdenite and chalcopyrite. Chalcopyrite is found in the form of dispersed crystals and locally polymerized forms [
15]. The location of the area is in the northern region of Zhenping County, Henan Province. It is situated inside the eastern portion of the North Qinling tectonic subzone, which is part of the broader Qinling orogenic belt [
16]. The rock formations that are visible in the area are classified as part of the Qinling Group. There is a structural connection between the Yanlinggou Formation, which is primarily composed of carbonate, and the Guozhuang Formation, which is primarily composed of granite gneiss [
17]. The major orientation of the area fault system is northwest-southeast, which corresponds to the Zhuxia Fault that traverses the Qinling Group strata,
Figure 2 [
18]. The deposit is comprised of two primary constituents: the northern section, which is distinguished by a copper-molybdenum deposit of breccia type found within the explosive breccia, and the southern section, which is characterized by a molybdenum deposit of porphyry-skarn type within the Qiushuwan granodiorite porphyry and its adjacent contact zone [
19]. The mineralization displays clear zoning patterns, wherein molybdenum mineralization is predominantly found in the southwestern zone, while copper mineralization is more commonly observed in the northeastern section. The observed zoning pattern indicates the presence of molybdenum mineralization superimposed upon pre-existing copper mineralization [
20].
4. Electrical Parameters and Data Analysis
Geological Samples were collected from the Qiushuwan mining area in Henan Province, of which some samples were tested for effective rock and ore electrical characteristics parameters (
Table 1). The lithology includes marble, granodiorite, plagioclase hornblende, chlorite siliceous rock, garnet siliceous rock, quartzite, explosive breccia, and ore bearing quartz veins. The main types of mineralization include pyrite mineralization, molybdenization, and brass mineralization, with the main alterations occurring being carbonatization, chloritization, epidotization, skarnization, and Qingpanitization. According to the statistical data of electrical parameters of Qiushuwan rock (ore) in
Table 1,
it can be seen that the electrical resistivity of the collected samples shows resistivity (ρs) and polarizability (η) variations epidote and chloritized skarn shows low resistance and high polarization anomalies compared to other lithology and rock electrical characteristics; According to the observations, it can be concluded that the mineralization of pyrite, chalcopyrite, and molybdenite in this mining area is closely related to chlorite and epidotized skarn, indicating that strong mineralization of pyrite, and molybdenite can be observed in the rock (ore) of this lithology. In accumulation, the resistivity and polarizability values of garnet and garnet skarn vary significantly. Among them, garnet that has not undergone mineralization or is relatively weakly mineralized often contains silicification alteration, resulting in a higher resistivity ranging from 1037.23 to 19823.96 Ω. m., while garnet skarn that has undergone mineralization has a relatively lower resistivity, with an average resistivity of 3074.12 Ω. m. and an average polarizability of 2.16%, However, due to the lower mineralization intensity compared to chlorite and epidote skarn, the electrical anomaly is not significant Fig 5 b). At the same time, marble, granodiorite, and quartzite (veins) all exhibit high resistivity and low polarization anomalies, and metal minerals are mostly sparsely disseminated, with weak mineralization intensity. The biotite plagioclase hornblende and plagioclase hornblende all undergo varying degrees of chloritization, and some contain explosive breccia (mineralization). Their resistivity and polarization are between rocks with strong low resistance mineralization, such as chlorite, epidote skarn, and high resistance marble.
4. Methodology
Spread spectrum induced polarization (SSIP) method is new frequency domain induced polarization (FDIP) method. The method uses spread spectrum communication for geophysical instruments [
21]. This system has the characteristics of large depth, high precision, anti-interference, low cost, and high efficiency. It is currently widely used and has produced significant social and economic benefits. The main difference between FDIP and SSIP method is the type of signal used for the injected (primary) current. The SSIP system sends M-sequence pseudo random spread spectrum signals through the transmitter as the primary source current. In traditional FDIP the type of signal used for the injected (primary) current are rectangular current waves with boxes of constant durations [
22].
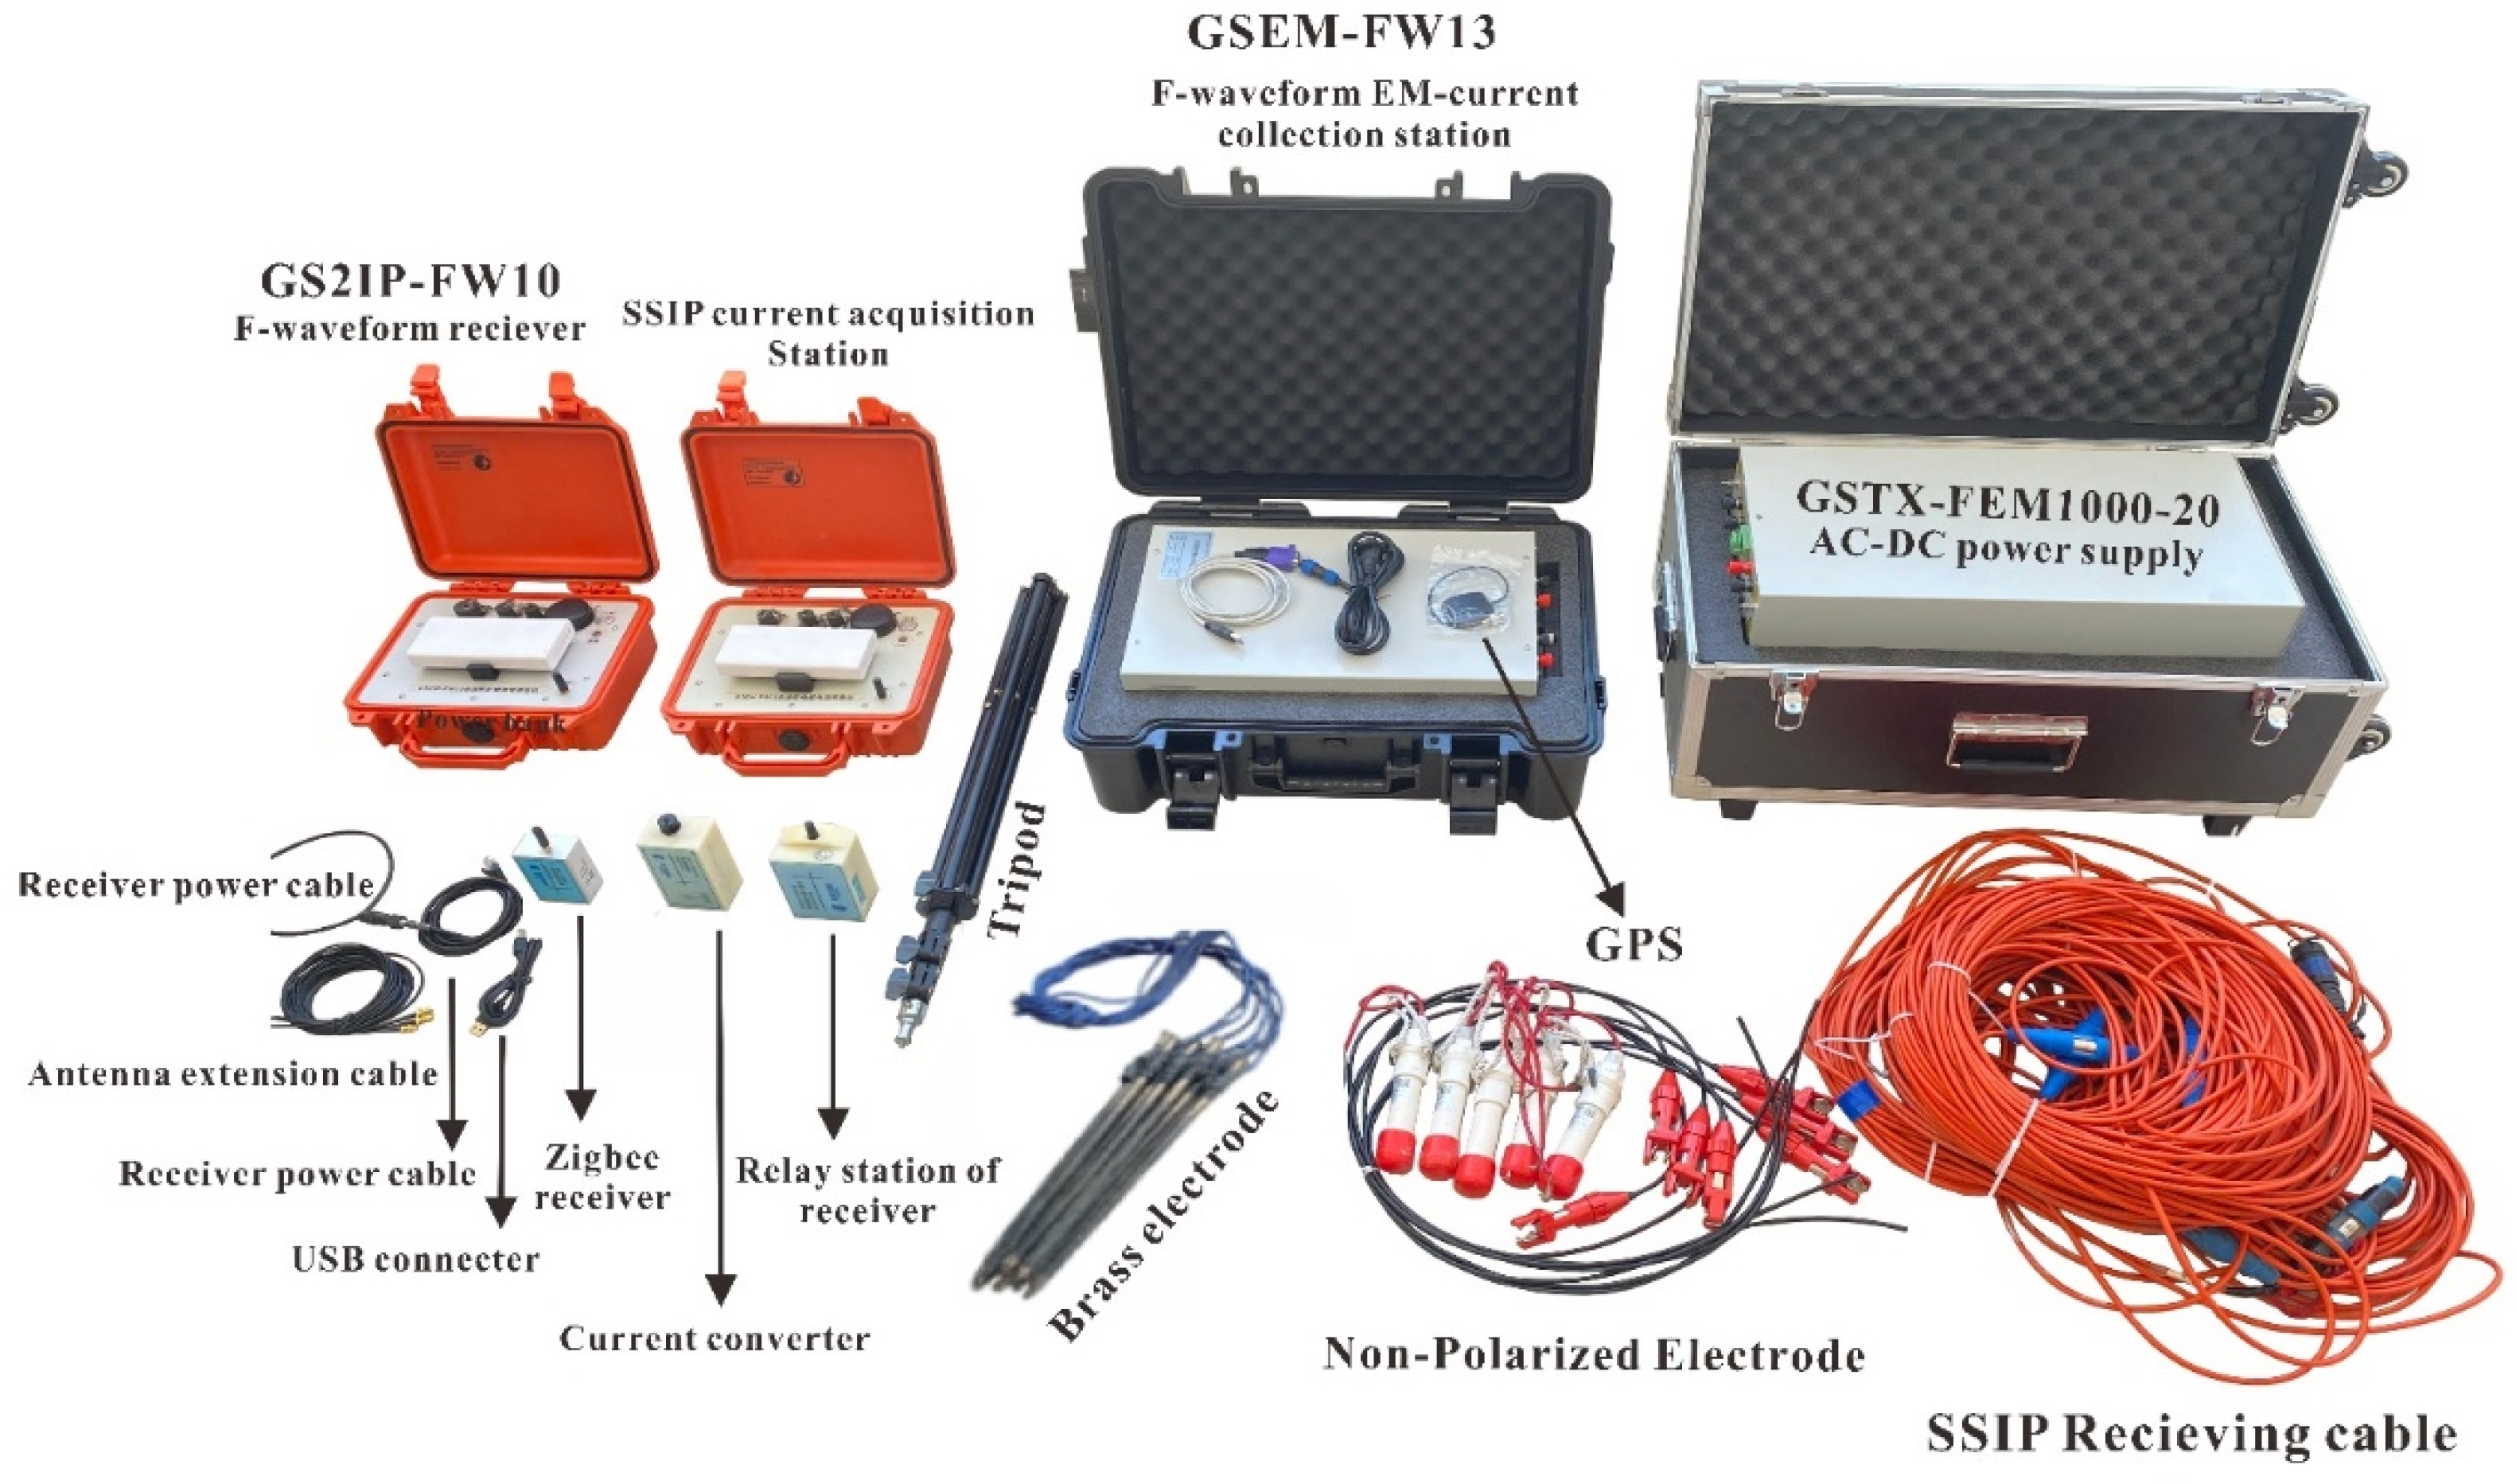
Figure 3.
Set of equipments used during SSIP exploration survey. .
Figure 3.
Set of equipments used during SSIP exploration survey. .
In SSIP survey comparison is made between the voltage signals measured on the potential electrodes with the signals transmitted through the current electrodes over several frequencies (i.e., a spectrum of frequency). The frequency band of SSIP acquisition is 1/16 –1 Hz and the amplitude of primary injected current depend on the strength of EM interferences in the area under survey. That is, in areas with strong EM interferences caused by cultural activity such as mining operations and drilling activities, large primary current amplitudes are transmitted. The apparent complex resistivity for a set of frequencies can be obtained in a way like the traditional FDIP approaches:
where
⍴ (f),
U (f) denotes the frequency spectrum of the potential difference data, I (f) is the frequency spectrum of synchronous primary current data, and K corresponds to the geometric factor of the array.
Here A and B are current electrodes, M and N are potential electrode. AM, BM, AN, BN are electrode spaces.
4.1. Data Acquisition
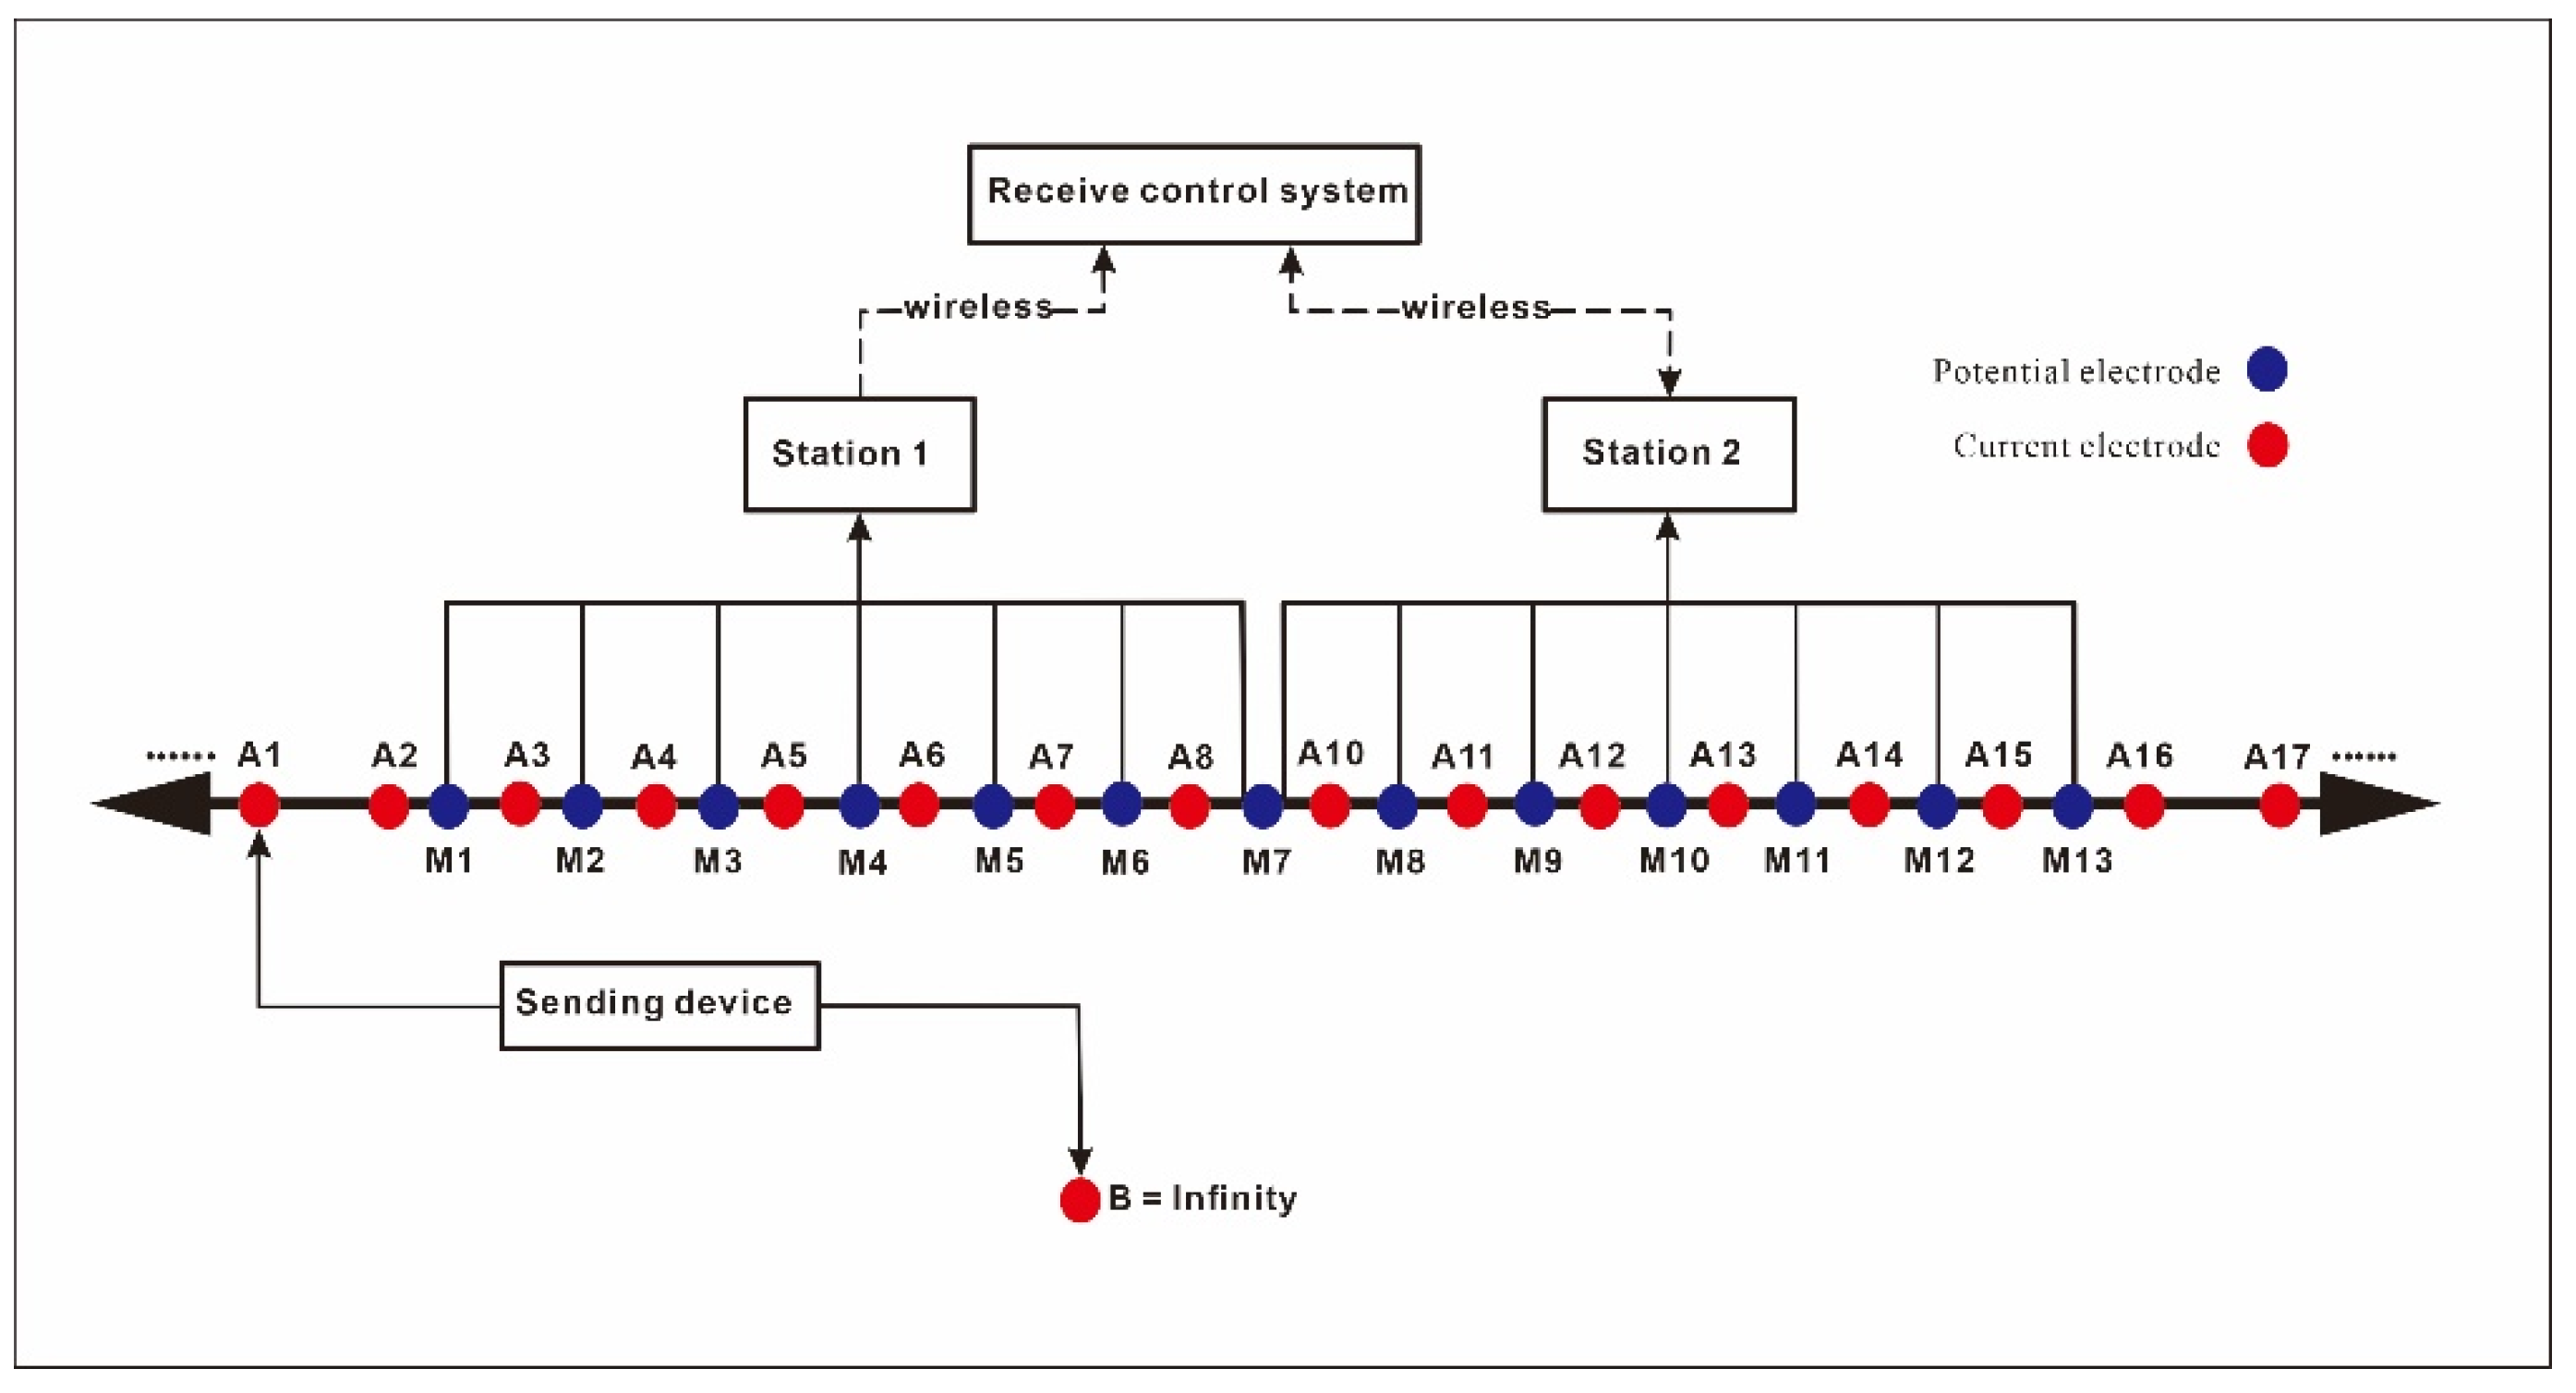
The SSIP approach operates by employing multi-channel equipment for observing arrays in parallel. By utilizing GPS synchronization technology between transmitter and receiver, this method reorganizes the electrode arrangement process of the electrical sounding profile and enables simultaneous multiple measurements. This reduces the need for repeated transmission of the power supply electrode, resulting in increased measure speed. In regions characterized by dry and high resistance, the reduced mobility of the power supply extreme facilitates the enhancement of grounding conditions, hence enabling the expansion of power supply current and the enhancement of observation accuracy. In industrial settings characterized by significant electrical interference, such as mines, it is advisable to prioritize the placement of electrodes and cables. We conducted a 2km SSIP survey profile near the Qiushuwan mining region, situated between the Yanlinggou and Guozhuang formations, with a SW-NE direction Fig 2. The whole-dimension profile receiving electrodes were successfully installed in a single operation. The construction approach employed for this project involved measuring the depth of pole diploe using spread spectrum-induced polarization, as depicted in Fig 3. The determination of the number of measurement points is depending upon the dimensions of the profile, precisely its length and distance. Then, the measurement electrodes and collecting stations are implemented at the same time across the entirety of the profile. Then, electricity is distributed in a consecutive manner based on the predetermined current injection sites. All channels are monitored simultaneously during each current injection. Upon the completion of all designated power supply sites, the comprehensive profile measurement is finally concluded.
Figure 3.
Pole-dipole sounding array of spread spectrum induced polarization.
Figure 3.
Pole-dipole sounding array of spread spectrum induced polarization.
5. Results and Discussion
5.1. Inversion Parameters
The precision of our SSIP results was dominant; therefore, we applied thoroughness in choosing key parameters and implementing complex procedures. The selection of these metrics was deliberate to guarantee the precision and dependability of our findings. The first layer is established with a thickness of 5m in inversion setup, and the model parameters are systematically changed in subsequent iterations using an incremental factor of 1.10%. The inversion process consists of a total of 32 layers, with a maximum depth of 1005m. Besides, we performed standard model constraints by establishing a range of resistivity values within the model, spanning from 1.0 Ωm to 10,000 Ωm, with a minimum and maximum limit. The resistivity data exhibits a fitting error of 5.0%, while the relative phase data (polarizability data) validates a fitting error of 2.5%.
5.2. Inversion Results
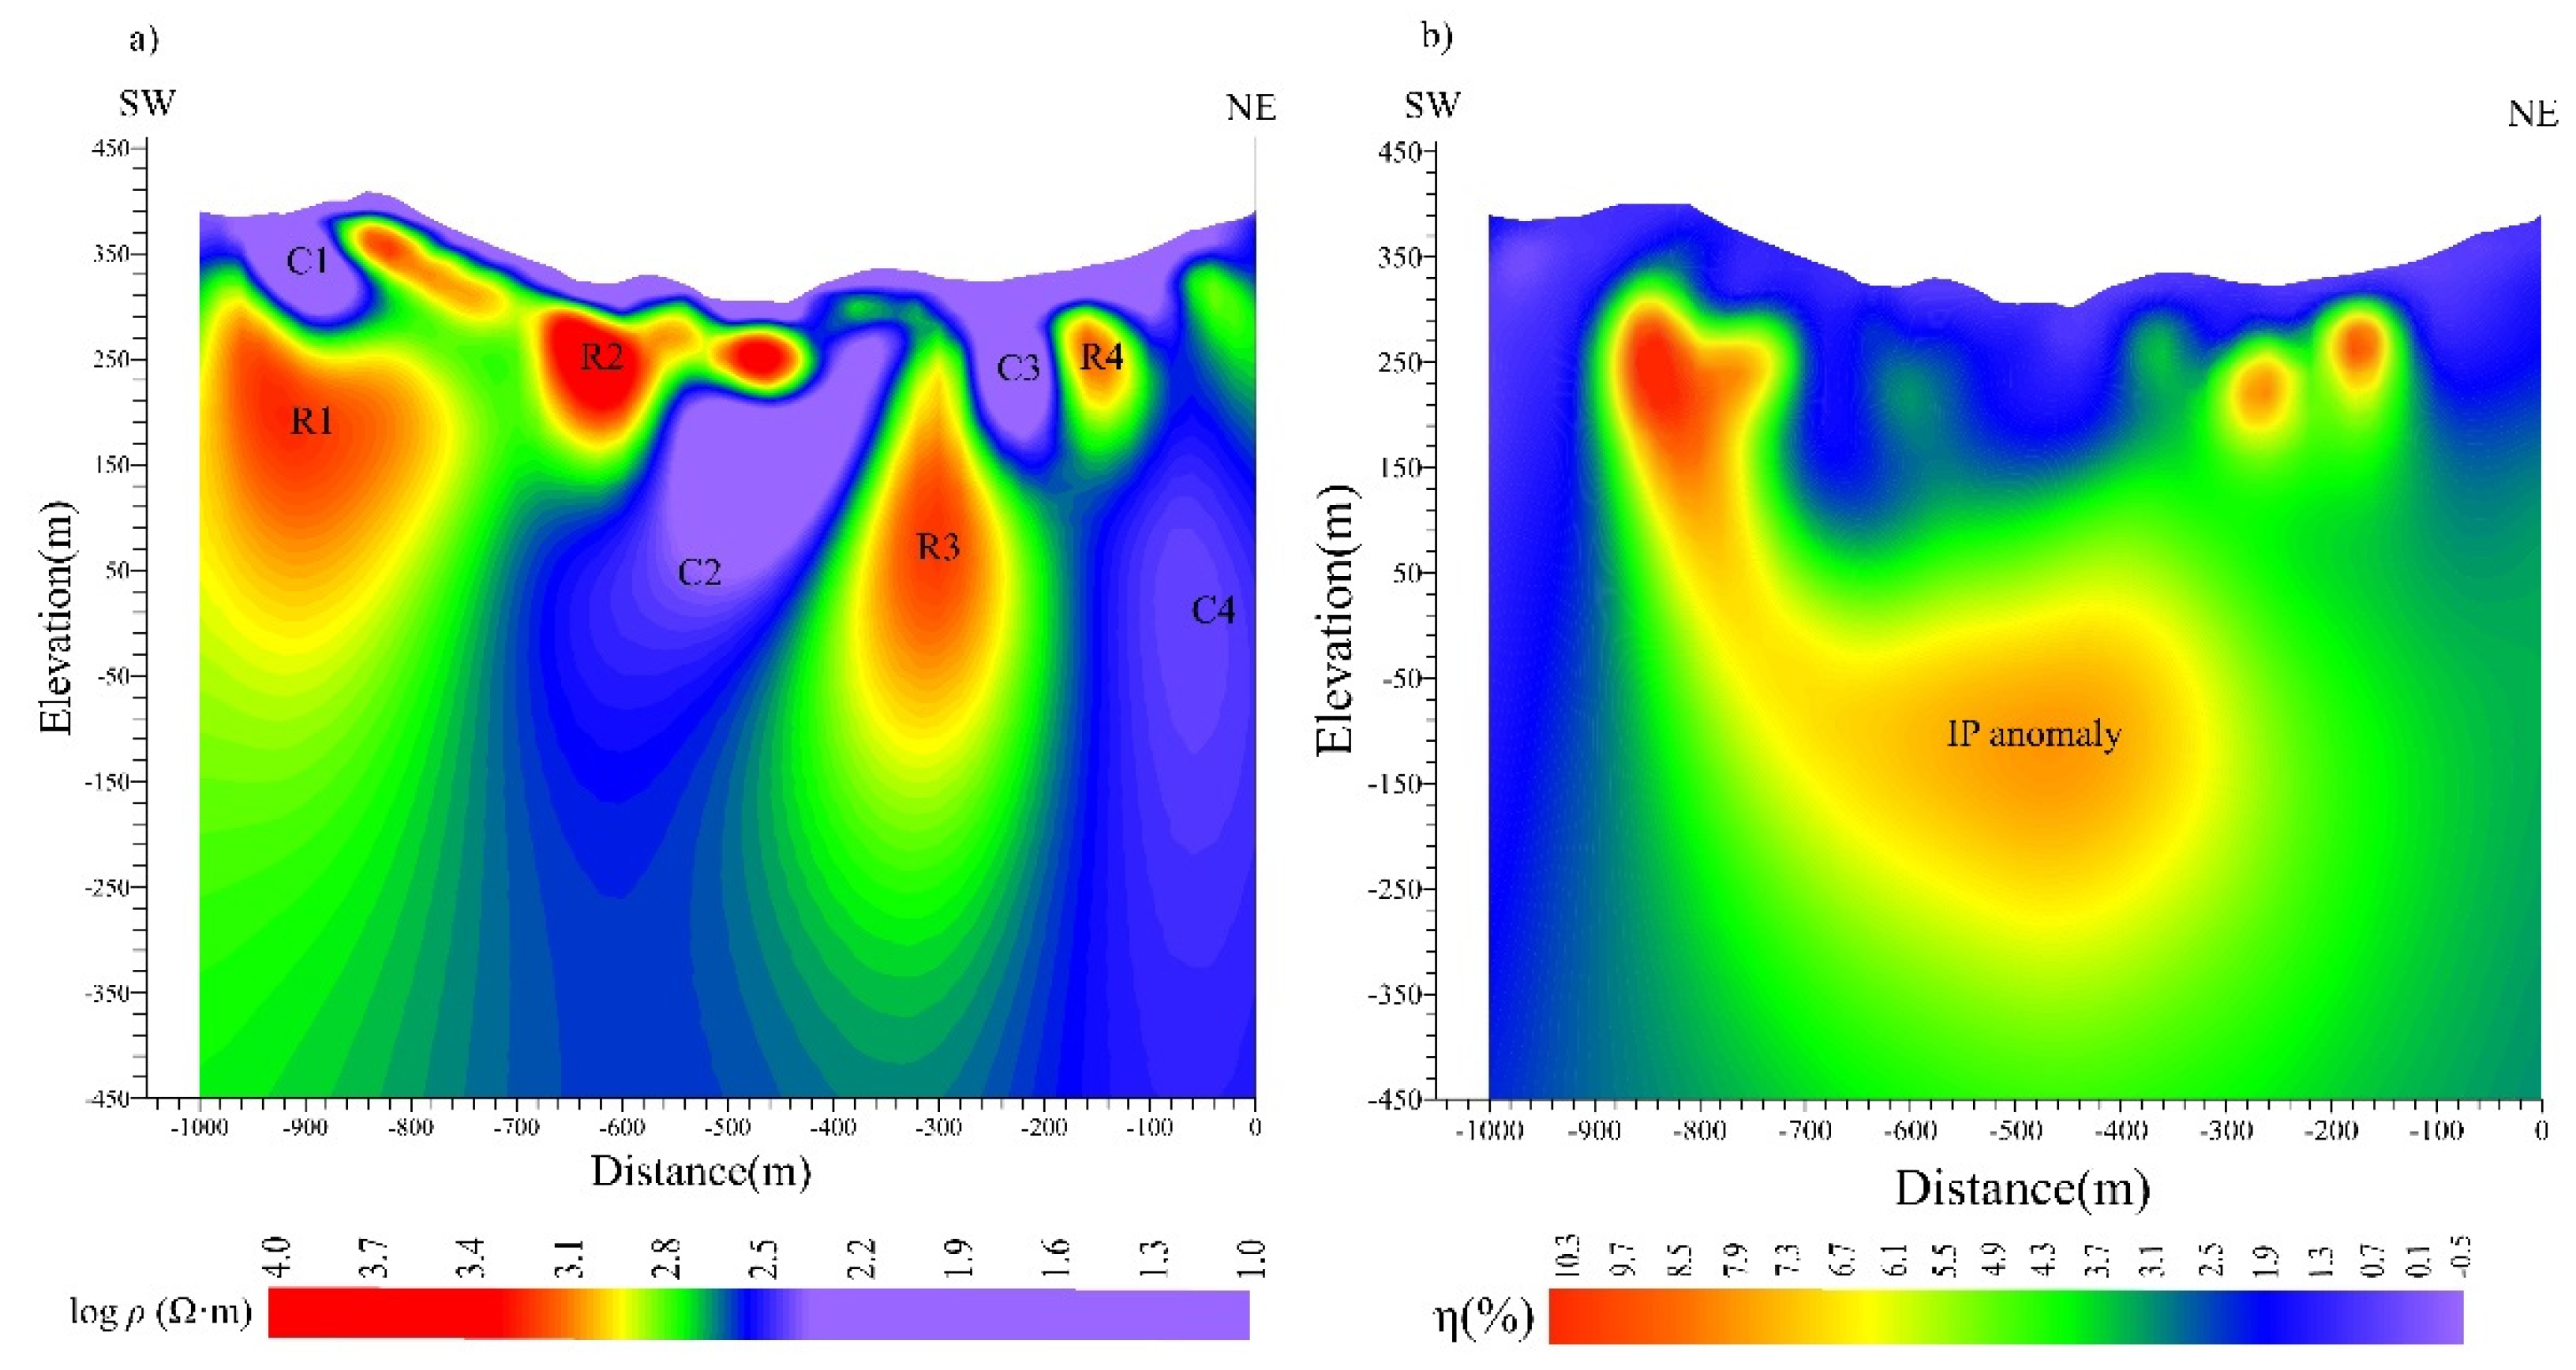
The profile-80 (NE-SW) is in the eastern part of the exploration area Fig 2. The inversion results of one km of the original data are shown in Fig 4. The resistivity models derived from the SSIP frequencies are not significantly different, taking F2 the best frequency results as an example. The data of profile-80 collected over the Qiushuwan Co-Mu deposit displays prominent characteristics considered by spatial variations in electrical resistivity. The resistivity model, as illustrated in
Figure 4 defines four conductive regions displaying moderate to high conductivity, denoted as C1, C2, C3 and C4, along with four regions showing moderate to high resistivity, labelled as R1, R2, R3 and R4. The conductive zones are characterized by a resistivity of less than 1800 Ω.m. The resistivity variation in SW is high to the NE is low as shown in Fig 4 (a). The value of resistivity in the SW is ranging from 2800-3000 Ω·m, and the vertical anomaly features high in the shallow and low in the deep. In SW shallow depth we encounter the C1 conductive body (surficial material) from the surface to the depth of 290m at horizontal distance of -1000 to -900 and one notable feature R1(marble, quartz, mica, schist) is a horizontally extensive high resistivity anomaly between depths of -880 and -1000. This anomaly exhibits a maximum value exceeding 3500 Ω·m and is centered on an elevation of approximately 370m. In the middle of the resistivity model R2 (same lithology as of R1) is found at the shallow depth of 290 - 190m and confined at the horizontal distance of -700 to -600m. In the central section of the inversion model, another distinct anomaly is observed C2 (granite porphyry with molybdenum veins) between depths of -830 and -570, displaying a moderate to high resistivity anomaly with a maximum value greater than 3000 Ω·m. This anomaly shows a longitudinal extension trend and development. The NE shows variation in resistivity values from high to low and furthermore, a moderate resistivity anomaly is identified R3 (granite, gneiss, and quartz) between depths of -160 and -370, with a maximum value less than 3000 Ω·m. This anomaly demonstrates a downward continuation pattern. The C3 (conductive body) and R4 (resistive body) is located close to each other at the surficial depth. The large conductive body C4 (skarn deposits) found at the elevation of -50m to the depth of exploration area and restricted to the horizontal distance of -150 to around 0m.
Figure 4 (b) shows the inversion model of IP in which IP anomaly is at the center of the model and extended towards the northeast.
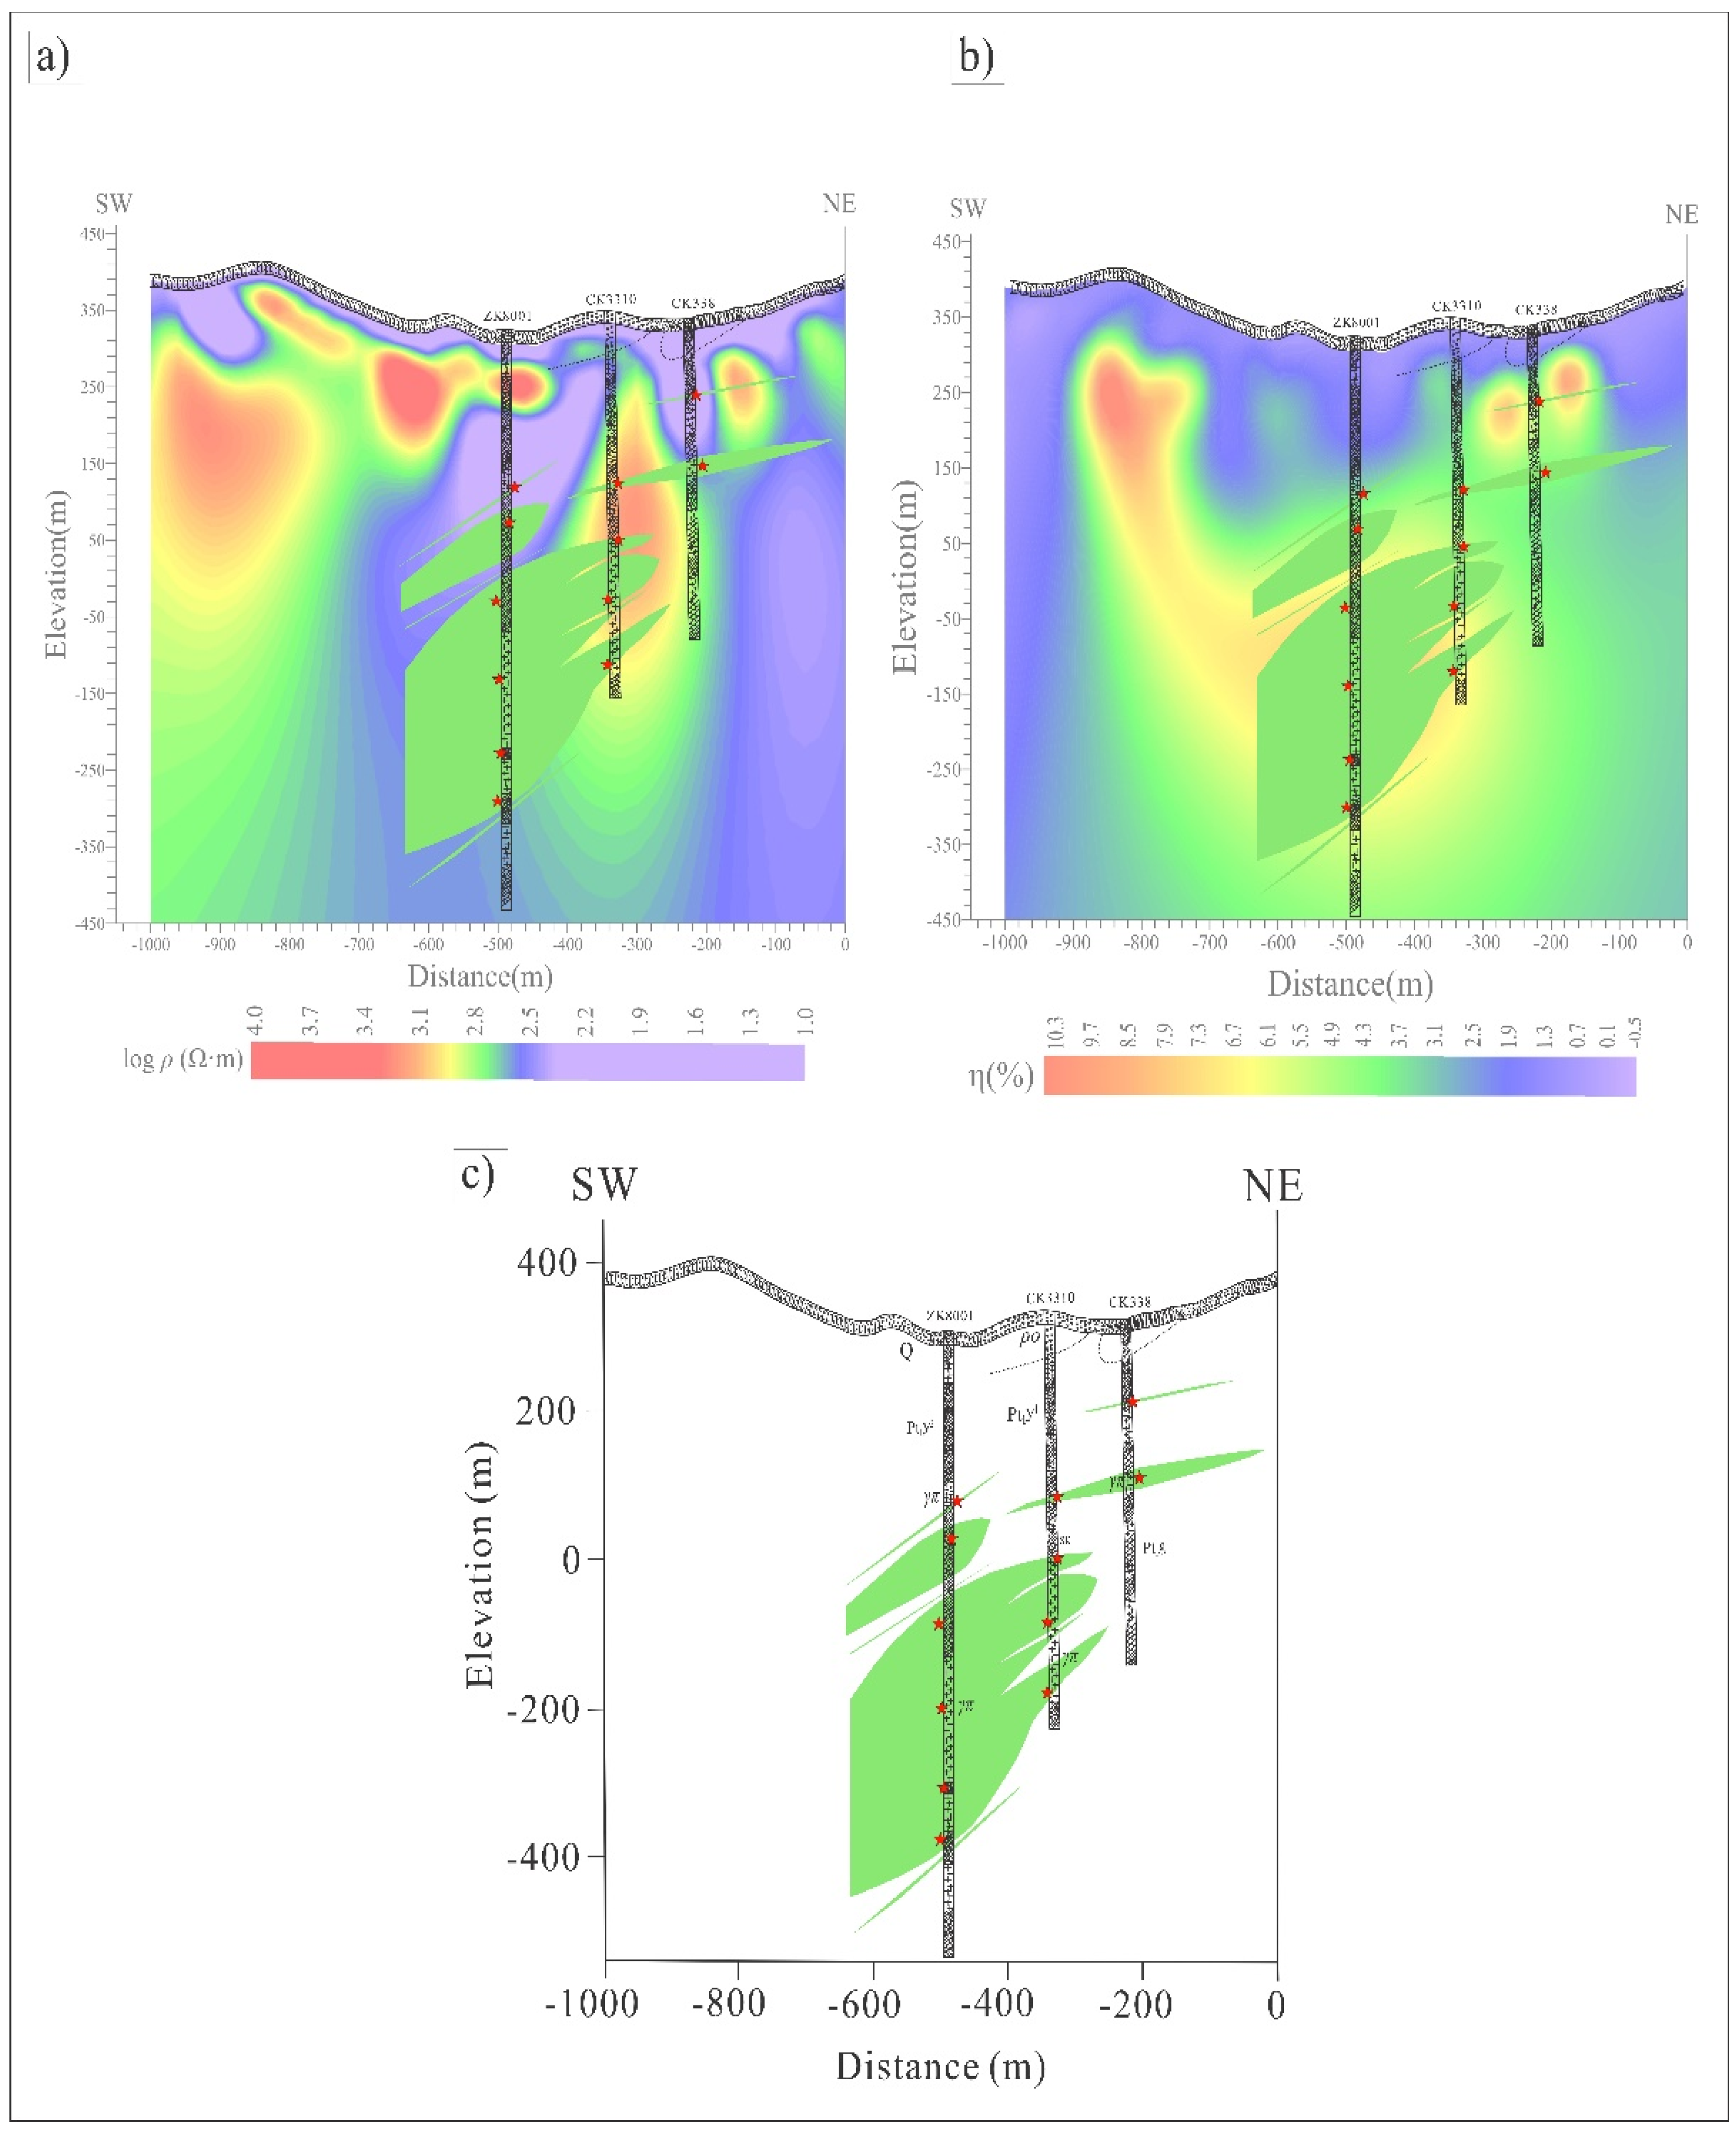
Utilizing the suitable F2 frequency, the analysis of SSIP data, together with the geological information of the research region, offers a significant understanding of the properties of conducting bodies C2 and C4. An analysis is conducted on the electrical properties of rock and ore specimens, specifically focusing on resistivity values (Table-1). This analysis also includes the examination of geological section, 2D resistivity models, and IP inversion models.
The inversion results indicated the existence of two primary conducting entities, C2 and C4, inside the designated region. By analyzing the data, it was concluded that conductive body C2 is linked to granite porphyry, which serves as a host for molybdenum veins (Figure-6). The resistivity values derived from the rock and ore samples inside this formation correspond to the conductive pattern found in the SSIP data. The connection suggests that the presence of molybdenum veins affects the conductivity of the granite porphyry. Conversely, conducting body C4 is linked to a skarn deposit that includes breccia tuff. Inside this skarn deposit, there is a copper ore body. The fact that the geological section meets the 2D resistivity model and the IP inversion model shows that there is a conducting body C2, C4 in this area. The existence of breccia tuff provides further evidence for the connection between conducting body C4 and the skarn deposit. The copper body present in the skarn deposit is a very desirable target for possible mining operations.
There is low resistance in the ore body, but there are no ore bodies in multiple low resistance areas and the shallow induced polarization weakens, and the induced polarization anomaly caused by the porphyry type ore body is greatly enhanced. The range of the anomaly is basically consistent with the range of the ore body. In the medium frequency induced polarization response, the induced polarization anomalies of porphyry type ore bodies are greatly enhanced, while the induced polarization anomalies caused by pyrite halos and skarn type ore bodies are greatly weakened. Discovering induced polarization anomalies caused by deep porphyry copper molybdenum deposits.
6. Mineralization and Alteration
The detailed petrography of the drilled core samples revealed a variety of minerals including ores and some alteration minerals
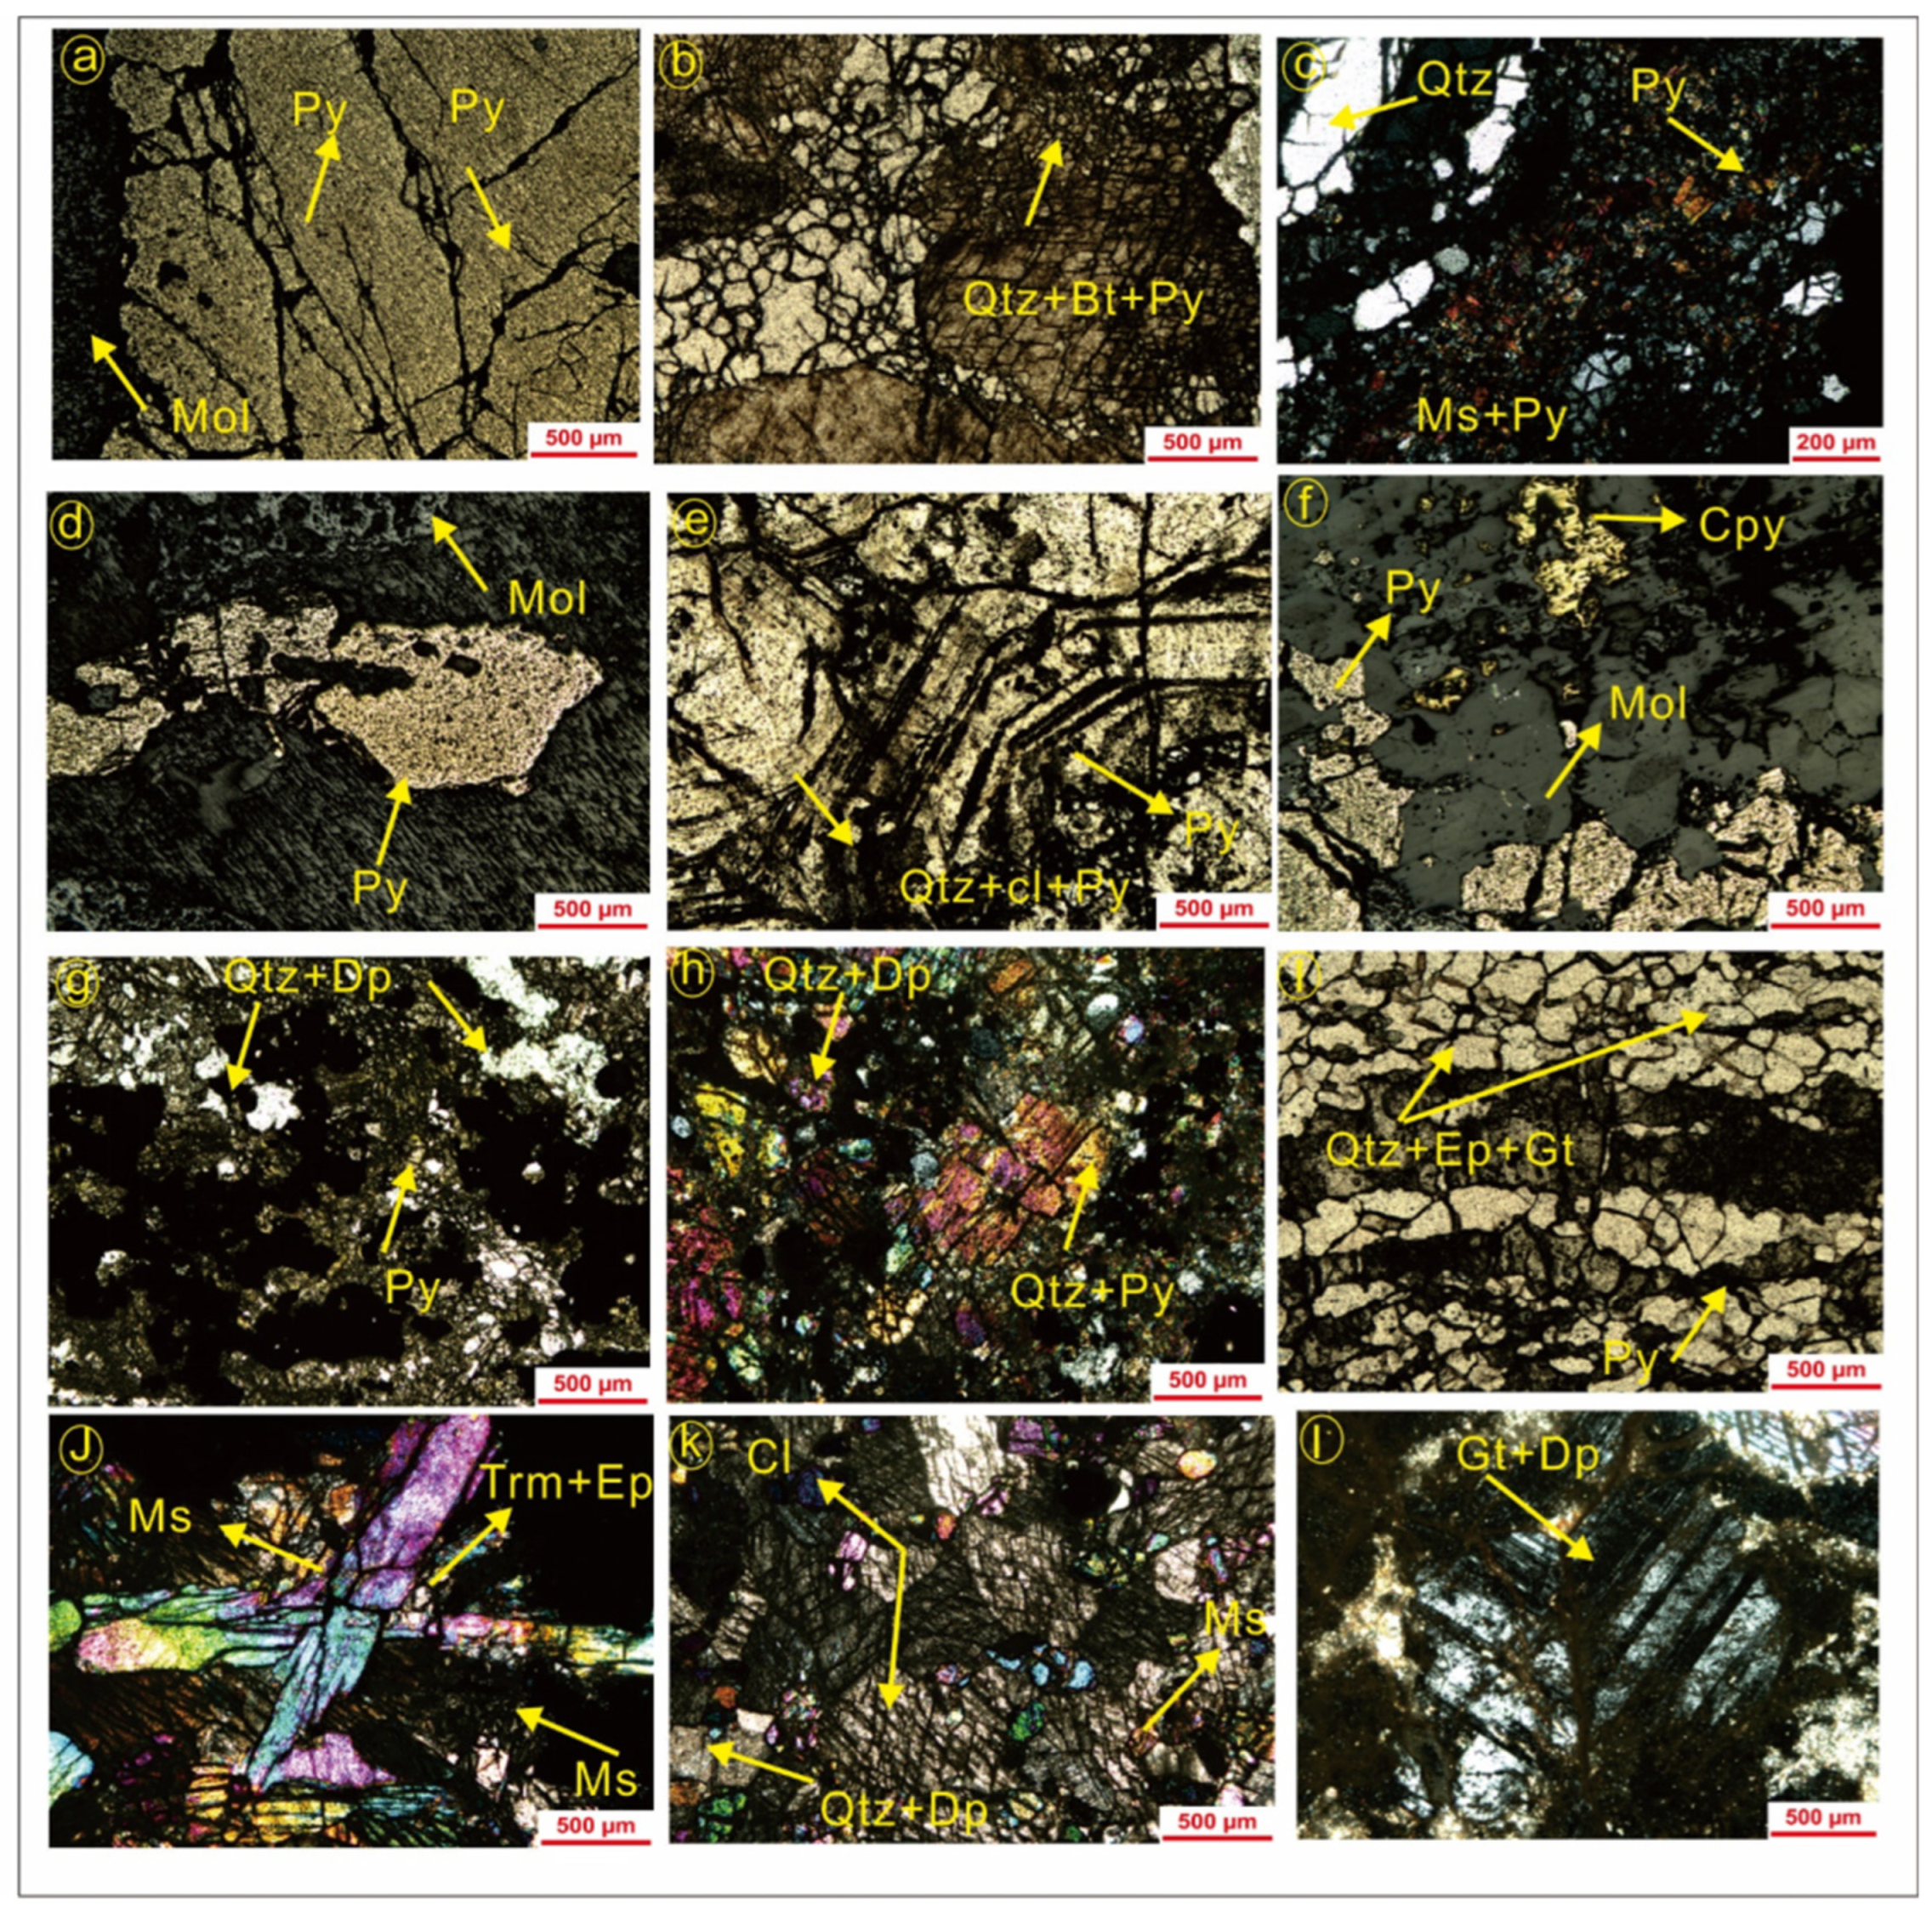
Table 2. A total of nine different rock sample are observed under the microscope Fig 6. Pyrite normally occurs with molybdenite in most of the samples. Chalcopyrite, epidote, Calcite and Garnet are sparse accessory minerals.
Figure 6 shows the details of all the minerals and their possible alteration. Sample no (04-2) containing entirely of massive pyrite (Py) and molybdenite (Mol) associated with skarns. Sample (05-1) displaying two association of Pyrite (Py) which is sparsely disseminated in skarn with a small amount of biotite (Bt) and quartz (Qtz) generated along the cracks. It also contains muscovite (Ms) and biotite (Bt) in quartz and feldspars with Pyrite (Py). Similarly, the Sample (05-18) series containing Pyrite (Py) and molybdenite (Mol) associated visible quartz (Qtz), diopside (Dp), calcite (Cl) with disseminated pyrite (Py). In addition to that, the sample (07-4) contains Pyrite (Py), chalcopyrite (Cpy) with disseminated possibly galena, sphalerite, or molybdenite (Mol) association. Likewise, the Sample (07-13) continued visible disseminated mineralization includes quartz (Qtz), diopside (Dp) and Pyrite (Py). The Sample 5-21 series contains mainly Quartz (Qtz) and epidote (Ep) skarn interbedded, containing garnet (Gt), with extremely weak mineralization. While the Sample (05-6) contains minerals tremolite (Trm), muscovite (Ms), Epidote (Ep) and Garnet (Gt). Moreover, the sample series 01-7 contains muscovite, chlorite, diopside, and calcite and the samples series (02-15) Calcium iron garnet, with visible ringed twin crystals, containing granular diopside.
7. Conclusion
The research encompassed the implementation of a survey along a certain profile, denoted as profile-80. The profile served as the basis for acquiring the most optimal frequency of spread spectrum-induced polarization (SSIP) data. An intensive inquiry was done in a complex research location, employing spread spectrum induced polarization (SSIP) data interpretation, geological analysis, and electrical parameter analysis of rock and ore samples obtained from the Qiushuwan mining area. This enabled us to acquire valuable insights into the characteristics of conducting bodies C2, specifically Molybdenum, and C4, specifically low-grade Cu and Mo seen in skarn mineralization. Through the examination of electrical properties and intricate geological characteristics, we successfully conducted an analysis of the SSIP data, enabling us to identify and provide descriptions for these entities. Our work yielded resistivity models that played a crucial role in the identification of conductive things. The models effectively depicted the spatial distribution of conductivity variations within the examined region. The correctness of these models was validated by cross-referencing them with finished drilling data and overlaying geological sections onto both the resistivity and IP models. The alignment seen between the drilling data and the conductive objects in the resistivity models aided in authenticating and enhancing our assurance in the precision of the interpretations. The inclusion of geological sections in conjunction with resistivity and IP models facilitated the examination of potential correlations between geological characteristics and the observed conductivity issues within the models. The comparison served to bolster our interpretations and augment the value of our findings. The IP anomaly significantly influenced our research. By comparing IP anomalies with resistivity models and geological data, we successfully determined the presence of metallic minerals or places where mineral composition had undergone changes. By conducting a meticulous examination of these irregularities, we have obtained substantial knowledge regarding the potential existence of mineral deposits and alterations in the composition of the study region. Resistivity models have been verified through the utilization of drilling data and geological sections, as depicted in
Figure 4. The recovered core samples show a diverse range of minerals, containing both ores and altered minerals. Pyrite constantly appears with molybdenite in most samples. The findings of this study contribute to our understanding of the mineral potential and geological attributes of the Qiushuwan Beishan copper-molybdenum deposit and the Qiushuwan Nanshan skarn belt. The provided knowledge serves as a robust foundation for forthcoming exploratory endeavors and the promotion of sustainable resource development within the region. This will facilitate further research endeavors and contribute to informed decision-making about the governance of natural resources.
Author Contributions
J.A. conceptualized and designed the study, collected, and analyzed the data, and wrote the manuscript. R.C. contributed to the study design and data analysis and critically revised the manuscript for important intellectual content and provided technical support and expertise in the data analysis and contributed to the interpretation of the results. I.A., M.Y., S.F., O.A.R., F.U., S.A.S and L.R. contributed to the data collection process. All authors have read and agreed to the published version of the manuscript.
Data Availability Statement
Data are contained within the article.
Acknowledgements
We would like to thank the Third Geological Brigade of Henan Nonferrous Geological Exploration Bureau for their help during the exploration process and for providing the final drilling verification results. This research was funded by Basic Science Center Project of National Natural Science Foundation of China, grant number 72088101. his research received no external funding.
Conflicts of Interest
The authors declare no conflicts of interest.
References
- Haldar, S.K. Mineral exploration: Principles and applications. Elsevier, 2018.
- Kang, J.X.; Li, X.K. Thoughts on the development of molybdenum beneficiation technology. Presented at IOP Conference Series: Earth and Environmental Science, 2021. IOP Publishing, 647, 012001.
- Long, J.; Zhang, S.; Luo, K. Discovery of anomalous molybdenum enrichment in ordovician and silurian stone coal: Relevance, origin and recommendations. Chemosphere 2023, 320, 137975. [Google Scholar] [CrossRef] [PubMed]
- Michaux, S.P. The mining of minerals and the limits to growth. Geological Survey of Finland: Espoo, Finland, 2021. [Google Scholar]
- Yang, Y.; Yang, Y.; Wu, G.; Li, J.; Chen, Y. Porphyry–skarn mo systems. Geology and Geochemistry of Molybdenum Deposits in the Qinling Orogen, PR China, 2022; 363–516. [Google Scholar]
- Zan, P.; Chen, S.; Chen, J.; Li, S. Early paleozoic adakitic granitoids from the xingshuping gold deposit of east qinling, china: Petrogenesis and tectonic significance. Minerals 2021, 11, 1032. [Google Scholar] [CrossRef]
- He, J.; Xu, X.; Fu, Z.; An, Y.; Chen, T.; Xie, Q.; Chen, F. Decoupling of sr-nd isotopic composition induced by potassic alteration in the shapinggou porphyry mo deposit of the qinling–dabie orogenic belt, china. Minerals 2021, 11, 910. [Google Scholar] [CrossRef]
- Gilder, S.; Courtillot, V. Timing of the north-south china collision from new middle to late mesozoic paleomagnetic data from the north china block. Journal of Geophysical Research: Solid Earth 1997, 102, 17713–17727. [Google Scholar] [CrossRef]
- Liu, Q.; Li, H.; Shao, Y.; Girei, M.B.; Jiang, W.; Yuan, H.; Zhang, X. Age, genesis, and tectonic setting of the qiushuwan cu–mo deposit in east qinling (central china): Constraints from sr–nd–hf isotopes, zircon u–pb and molybdenite re–os dating. Ore Geology Reviews 2021, 132, 103998. [Google Scholar] [CrossRef]
- Yan, D.-P.; Zhou, Y.; Qiu, L.; Wells, M.L.; Mu, H.; Xu, C.-G. The longmenshan tectonic complex and adjacent tectonic units in the eastern margin of the tibetan plateau: A review. Journal of Asian Earth Sciences 2018, 164, 33–57. [Google Scholar] [CrossRef]
- Baojian, G.; Zhang, Z.; Zhen, Q. Geological characteristics and metallogeny of qiushuwan porphyry type cu-mo deposit in east qinling. Acta Geologica Sinica-English Edition 2014, 2, 1239–1240. [Google Scholar]
- Xinxiang, L.; Zaiping, Y.; Youli, F.; Yitian, W.; Weifen, M.; Haifeng, C. Mineralization and tectonic setting of deep-hypabyssal granites in east qinling mountain. MINERAL DEPOSITS-BEIJING- 2002, 21, 168–178. [Google Scholar]
- Bao, Z.; Sun, W.; Zartman, R.E.; Yao, J.; Gao, X. Recycling of subducted upper continental crust: Constraints on the extensive molybdenum mineralization in the qinling–dabie orogen. Ore Geology Reviews 2017, 81, 451–465. [Google Scholar] [CrossRef]
- Mao, J.; Xie, G.; Bierlein, F.; Qü, W.; Du, A.; Ye, H.; Pirajno, F.; Li, H.M.; Guo, B.; Li, Y. Tectonic implications from re–os dating of mesozoic molybdenum deposits in the east qinling–dabie orogenic belt. Geochimica et Cosmochimica Acta 2008, 72, 4607–4626. [Google Scholar] [CrossRef]
- Bao, Z.; Xiong, M.; Li, Q. Petrogenesis of late mesozoic high-ba–sr granites in the qiushuwan cumo orefield: Implications for the distribution of porphyry mo mineralization in the east qinling area of central china. Lithos 2019, 348, 105172. [Google Scholar] [CrossRef]
- Sun, H.; Li, H.; Danišík, M.; Xia, Q.; Jiang, C.; Wu, P.; Yang, H.; Fan, Q.; Zhu, D. U–pb and re–os geochronology and geochemistry of the donggebi mo deposit, eastern tianshan, nw china: Insights into mineralization and tectonic setting. Ore Geology Reviews 2017, 86, 584–599. [Google Scholar] [CrossRef]
- Xie, Z.-J.; Xia, Y.; Cline, J.S.; Yan, B.-W.; Wang, Z.-P.; Tan, Q.-P.; Wei, D.-T. Comparison of the native antimony-bearing paiting gold deposit, guizhou province, china, with carlin-type gold deposits, nevada, USA. Mineralium Deposita 2017, 52, 69–84. [Google Scholar] [CrossRef]
- Zhang, Z.; Yang, X.; Dong, Y.; Zhu, B.; Chen, D. Molybdenum deposits in the eastern qinling, central china: Constraints on the geodynamics. International Geology Review 2011, 53, 261–290. [Google Scholar] [CrossRef]
- Mao, J.; Xie, G.; Pirajno, F.; Ye, H.; Wang, Y.; Li, Y.; Xiang, J.; Zhao, H. Late jurassic–early cretaceous granitoid magmatism in eastern qinling, central-eastern china: Shrimp zircon u–pb ages and tectonic implications. Australian Journal of Earth Sciences 2010, 57, 51–78. [Google Scholar] [CrossRef]
- Luo, B.; Zhang, H.; Zhang, L.; Zhang, C.; Shen, L.; Xiao, Z.; Pan, F.; Yang, H.; Li, Z.; Xu, W. The magma plumbing system of mesozoic shanyang porphyry groups, south qinling and implications for porphyry copper mineralization. Earth and Planetary Science Letters 2020, 543, 116346. [Google Scholar] [CrossRef]
- Liu, W.; Chen, R.; Cai, H.; Luo, W.; Revil, A. Correlation analysis for spread-spectrum induced-polarization signal processing in electromagnetically noisy environments. Geophysics 2017, 82, E243–E56. [Google Scholar] [CrossRef]
- Liu, W.; Chen, R.; Cai, H.; Luo, W. Robust statistical methods for impulse noise suppressing of spread spectrum induced polarization data, with application to a mine site, gansu province, china. Journal of Applied Geophysics 2016, 135, 397–407. [Google Scholar] [CrossRef]
|
Disclaimer/Publisher’s Note: The statements, opinions and data contained in all publications are solely those of the individual author(s) and contributor(s) and not of MDPI and/or the editor(s). MDPI and/or the editor(s) disclaim responsibility for any injury to people or property resulting from any ideas, methods, instructions or products referred to in the content. |
© 2024 by the authors. Licensee MDPI, Basel, Switzerland. This article is an open access article distributed under the terms and conditions of the Creative Commons Attribution (CC BY) license (http://creativecommons.org/licenses/by/4.0/).
