1. Introduction
Concrete has long been one of the most widely used construction materials due to its superior economic efficiency, excellent mechanical properties, and durability compared to other construction materials [
1]. High-performance concrete (HPC) exhibits improved workability, strength, and durability compared to normal concrete. Recently, research on HPC has been actively conducted and widely applied in the field due to the increasing demand for large-scale, high-rise, long-span, and specialized structures [
2].
Ultra-high performance concrete (UHPC) was developed in France in the 1990s. UHPC is characterized by its high strength, with a compressive strength of 180 MPa or more, achieved by significantly reducing the required unit quantity and water-to-binder ratio (W/B) through the optimal particle size composition of materials. Furthermore, UHPC is formulated by incorporating large amounts of admixture materials such as silica fume, fly ash, and blast furnace slag. This results in a very dense concrete structure, making it highly resistant to deteriorating factors, watertight, and durable. Additionally, UHPC maintains fluidity even at very low W/B ratios by using high-performance water-reducing agents, and it possesses self-compacting properties, which contribute to its high workability [3-4].
Concrete exhibits brittle fracture and relatively low tensile strength. To address these issues, UHPC is reinforced with steel fibers. When cracks form within the concrete, the steel fibers enhance the tensile strength by bridging the cracks. This phenomenon, known as the fiber bridging effect, involves the interaction between the fibers and the matrix. It suppresses the initiation and propagation of cracks and distributes the formation of cracks to prevent concentration in a single location. Furthermore, the presence of steel fibers helps manage concrete damage by redistributing and dispersing stress around the cracks [5-7].
Research on UHPC spans from materials development to structural applications, yet studies on experimental methods tailored to the unique characteristics of UHPC, distinct from those of conventional concrete, remain insufficient. Notably, there is a lack of standardized regulations regarding creep, a critical long-term characteristic of UHPC, both domestically and internationally. Creep is the gradual deformation of concrete under a sustained load over time, and it is a crucial factor in predicting and designing long-term concrete structures. Currently, there are no global standard test methods specifically for UHPC creep. Instead, standard test methods for conventional concrete, such as ASTM C512 [
7] and KS F 2453 [
8], are being used to test UHPC creep. Although the ASTM C1856 [
9] standard, which includes specific guidelines for UHPC test specimen manufacturing and test methods, stipulates the evaluation of UHPC creep properties, the basis for this standard is insufficient and may lead to misunderstandings.
Due to the unique characteristics of UHPC, there are several issues with applying existing compressive creep test methods designed for normal concrete. In KS F 2453 [
9] and ASTM C512 [
8], a cylindrical test specimen with dimensions ϕ150 × 300 mm is used as the standard specimen. The sustained load is specified to be 40% or less of the compressive strength measured on the day of loading (
Table 1). For UHPC, which typically has a specified strength of 120 MPa or higher, a compressive creep test machine with a capacity of at least 850 kN is required to perform tests according to existing standards. If the actual compressive strength is 180 MPa, a test machine with a capacity of at least 1,270 kN is needed. Considering that the loading capacity of a typical compressive creep test machine used in the past was approximately 300 kN, a machine with a capacity 4 to 5 times higher must be manufactured. Additionally, if a creep test is conducted based on the compressive strength measured on the day of creep loading, significant deviations between specified and actual compressive strength may occur. It is also unclear to what extent a load of less than 40% of the actual compressive strength is acceptable, which may lead to confusion in preparation of the test.
ASTM C1856 [
10], which proposed improvements to the compressive creep test method of ASTM C512 [
7] to accommodate the characteristics of UHPC, specifies a specimen size of at least 75 mm in diameter and 150 mm in height to address the capacity limitations of compressive creep test machines (
Table 1). Reducing the specimen size in this manner allows UHPC creep tests to be conducted with existing 300 kN capacity test machines. However, this reduction may introduce errors in the experimental results due to the specimen size effect and changes in fiber orientation caused by using smaller specimens relative to the fiber length. Additionally, ASTM C1856 [
10] specifies applying a load of 40% of the specified compressive strength, differing from the other standard that requires applying a load of 40% or less of the measured strength.
To solve the difficulties in applying the compressive creep test method for normal concrete to UHPC and to verify the validity of the ASTM C 1856 [
10] test method, this study performed compressive creep tests with variables of specimen size, sustained load intensity, fiber length, and strain measuring method. The creep behavior results from the test results were compared and analyzed to propose a compressive creep test method suitable for UHPC.
2. Experiments
2.1. Test Variables
The variables applied to the UHPC compressive creep test included strain measurement method, sustained load intensity, specimen size, and fiber length. The standard specimen size, as specified in KS F 2453 [
9] and ASTM C512 [
8], is a cylindrical specimen with dimensions of ϕ150 × 300 mm. However, reflecting the recent high-strength trend of concrete, two additional types of cylindrical specimens were used: ϕ100 × 200 mm, commonly used in compressive strength and creep tests, and ϕ75 × 150 mm, allowed by ASTM C1856 [
10].
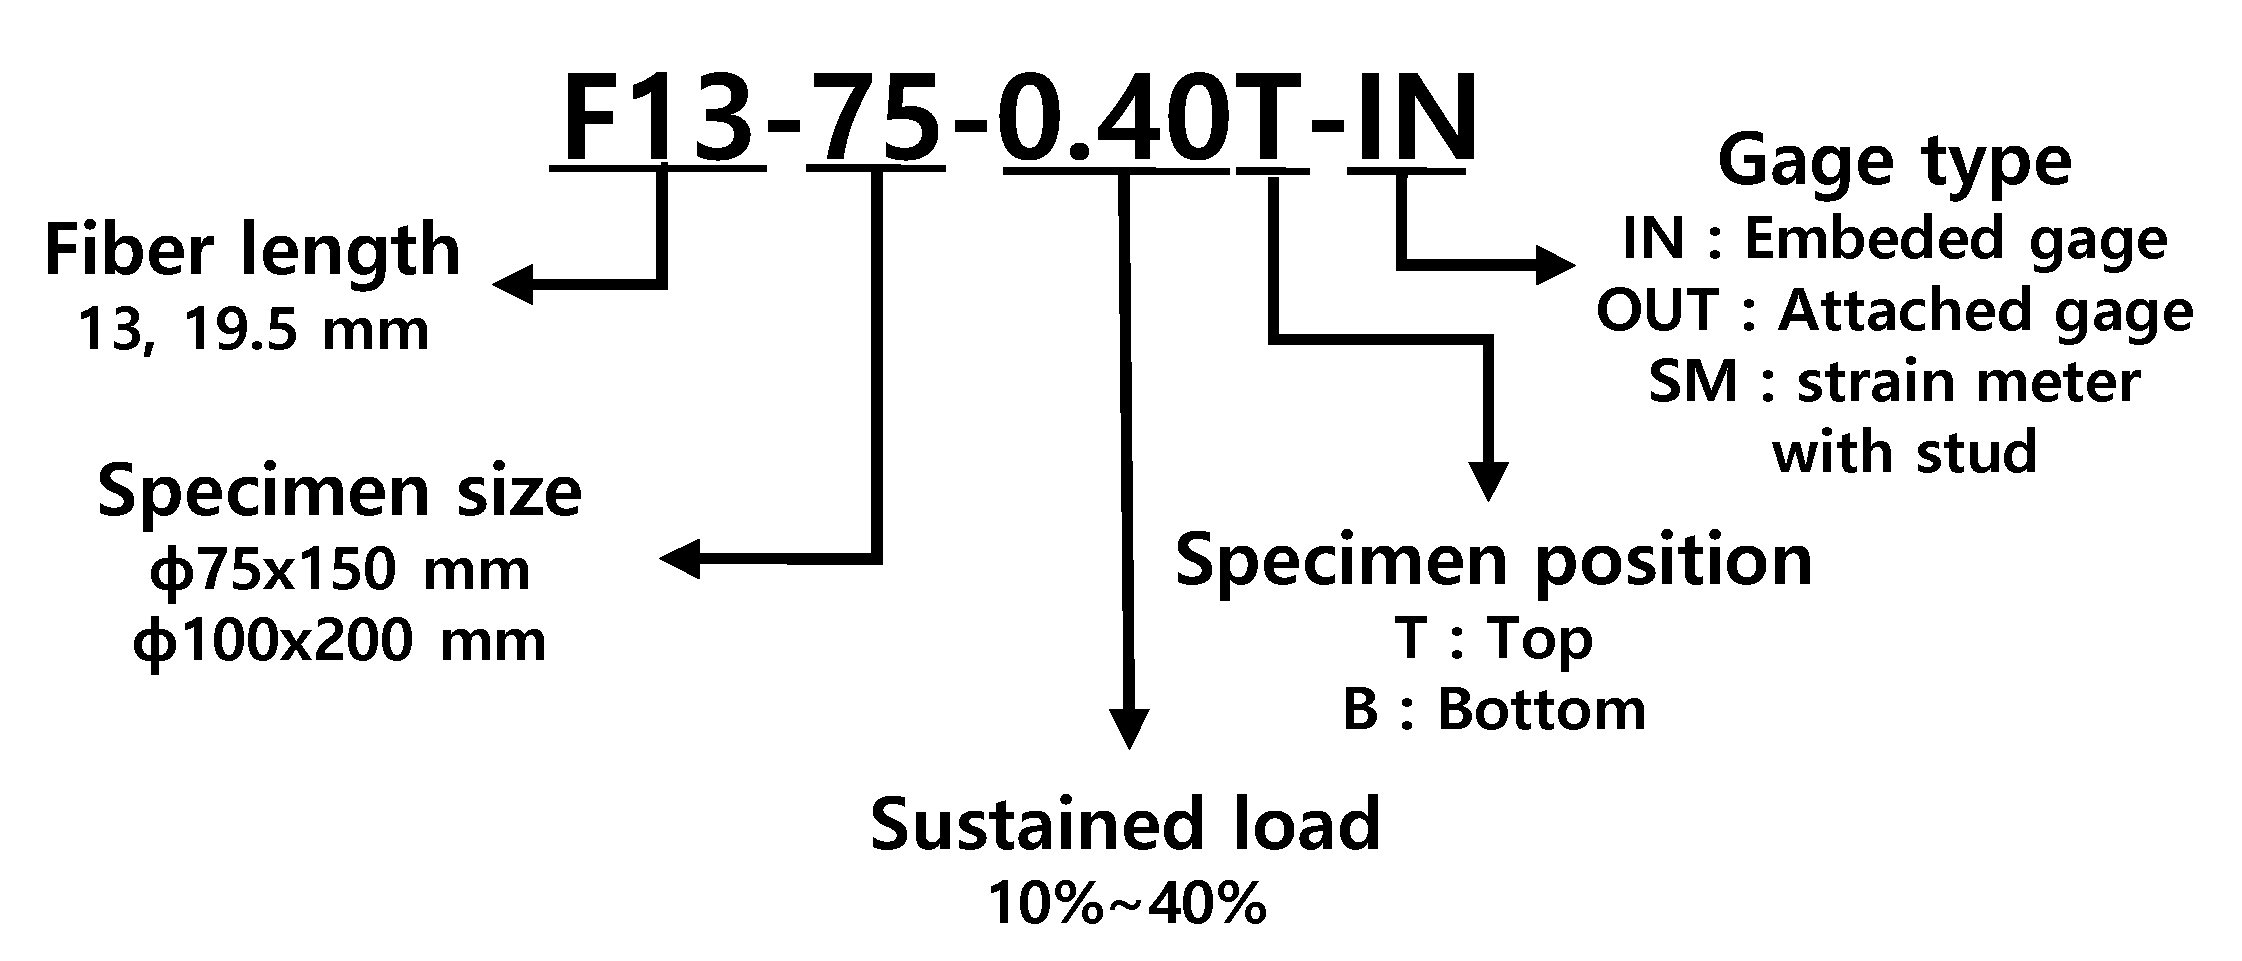
Since the measured compressive strength varies depending on the production of UHPC, the sustained load intensity was based on the specified compressive strength, with 10% to 40% of the specified compressive strength set as the sustained load level variable. Two steel fiber lengths, 13 mm and 19.5 mm, which are commonly used in current UHPC production, were selected. Three methods were used for measuring strain: embedded strain gauge (IN), attached strain gauge (OUT), and strain meter with stud (SM). The naming conventions for the test specimens according to each variable are shown in Fig. 1.
The compressive creep test was conducted in two stages due to limitations in the number of available creep test machines. The details of the test specimens for each stage are shown in
Table 2.
Figure 1.
Naming of specimens.
Figure 1.
Naming of specimens.
2.2. Materials
The UHPC mix was designed with a specified compressive strength of 150 MPa, and the mix details are shown in
Table 3. The water-binder ratio (W/B) was 21%, and ordinary portland cement and silica fume with a specific surface area of 100,000 cm
2/g were used. The aggregate did not include coarse aggregates, and Australian silica sand with a diameter of 0.5 mm or less and a SiO
2 content of 90% or more was used. A filler with a SiO
2 content of 90% or more and a density of 2.60 g/cm
3 was used, and a dark brown, high-performance polycarboxylic acid-based air-entraining water-reducing agent with a density of 1.01 g/cm
3 was used to secure the fluidity of the mix.
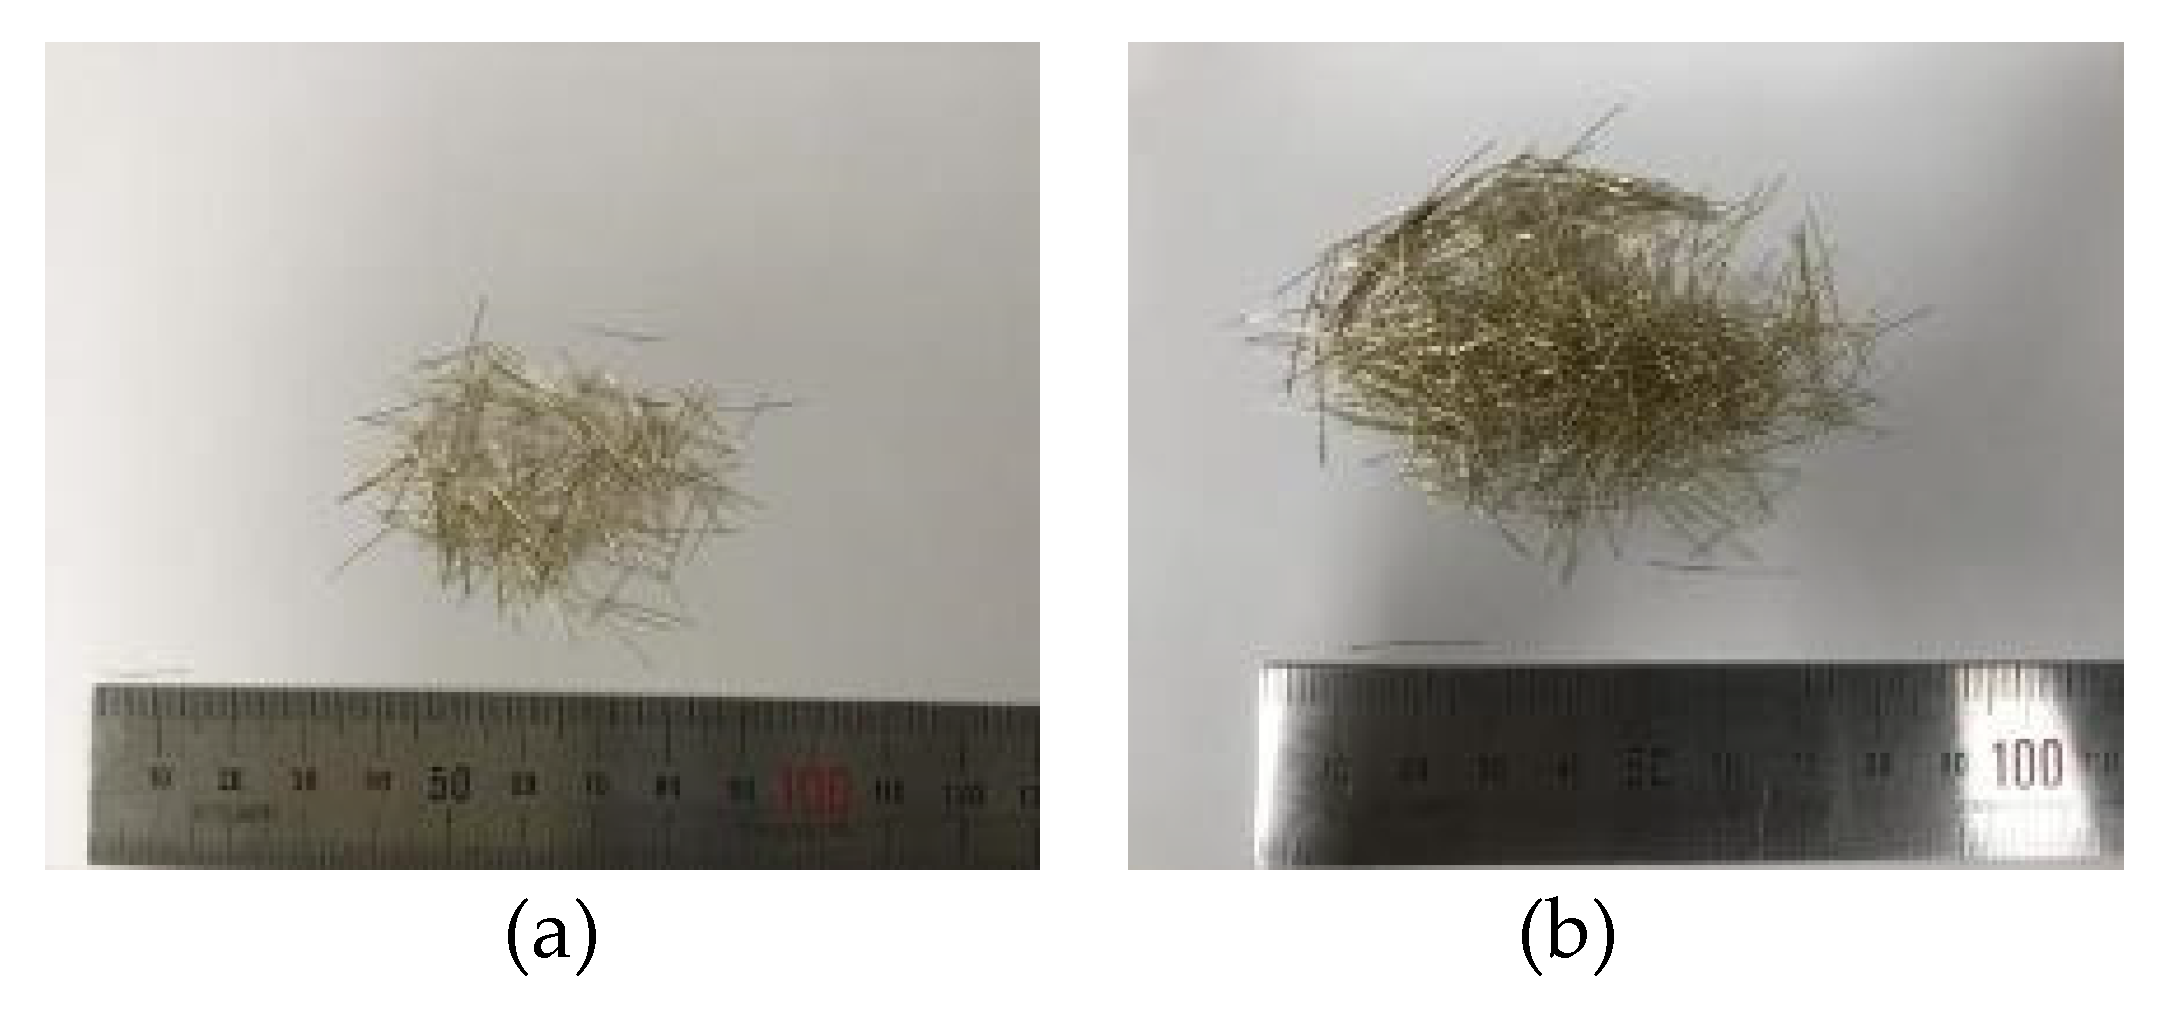
The steel fiber was a straight single fiber manufactured using brass-coated high-carbon steel wire. The steel fiber diameter provided by the steel fiber manufacturer is 0.2 mm, the length is 13.0 mm and 19.5 mm, and the minimum tensile strength is 2,650 MPa. The shape and mechanical properties of the steel fiber used are presented in Fig. 2 and
Table 4, respectively. The steel fiber was mixed with a volume fraction,
Vf, of 2% to produce UHPC.
Figure 2.
Steel fibers: (a) 13 mm, (b) 19.5 mm.
Figure 2.
Steel fibers: (a) 13 mm, (b) 19.5 mm.
The UHPC test specimen was produced based on the KCI-UC101 [
11] standard. Since UHPC has self-compacting properties, it was produced without using a tamping rod. A rubber mallet was used lightly to remove trapped air bubbles inside the matrix, and care was taken not to affect the fiber settlement and orientation.
The impact flow test method based on ASTM C 1437 [
12] was used to evaluate the properties of the unhardened concrete, and the average slump flow value was 210 mm when measured twice. In addition, the air content was measured using the ASTM C 231 [
13] test method, and the air content was confirmed to be 4.5% in two measurements.
After casting the UHPC mixed in the cylindrical mold, an anti-rust lubricant was applied to the concrete surface to prevent moisture evaporation, and the concrete was cured in the air by being covered with vinyl for 1 day. After that, the mold was removed and steam cured for 72 hours, and then cured in a constant temperature water bath for 24 days.
The UHPC test specimens were produced in two stages: the first and second, and the compressive strength was measured at 28 days for each. The results of the compressive strength measurement are shown in
Table 5, and the compressive strengths at 28 days all exceeded the specified compressive strength of 150 MPa.
2.3. Testing Instruments and Devices
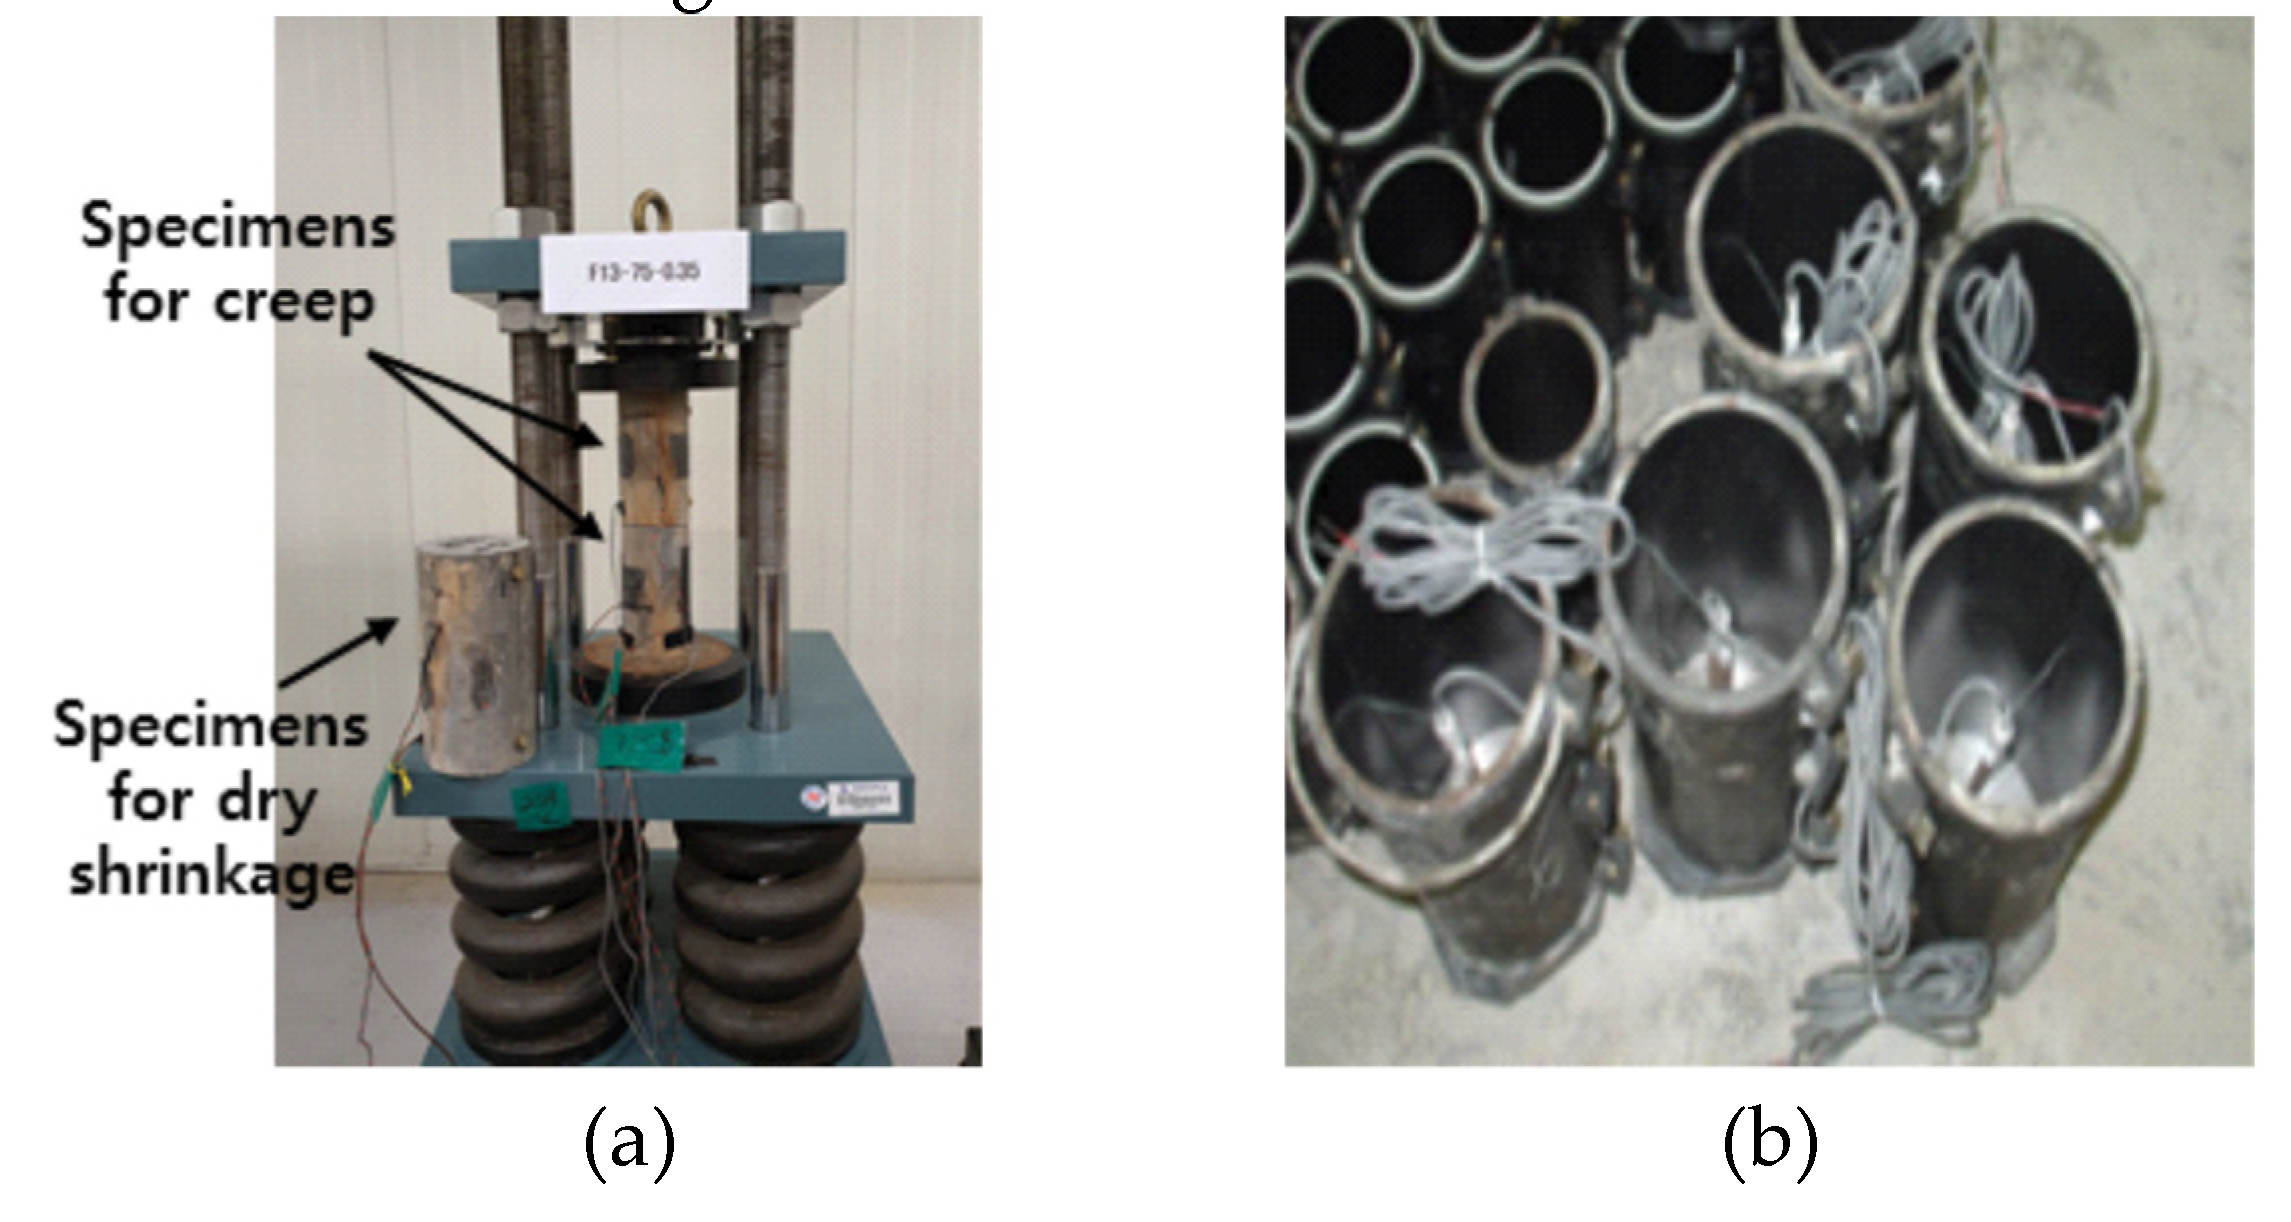
The compressive creep test machine used four 300 kN capacity test machines and two 1,000 kN capacity test machines, at the Intelligent Construction System Core-Support Center, Keimyung University, Republic of Korea. All test machines are of the type that maintains a continuous load by spring reaction force. Two test specimens (Top, Bottom) were tested in one test machine at the same time (Fig. 3(a)).
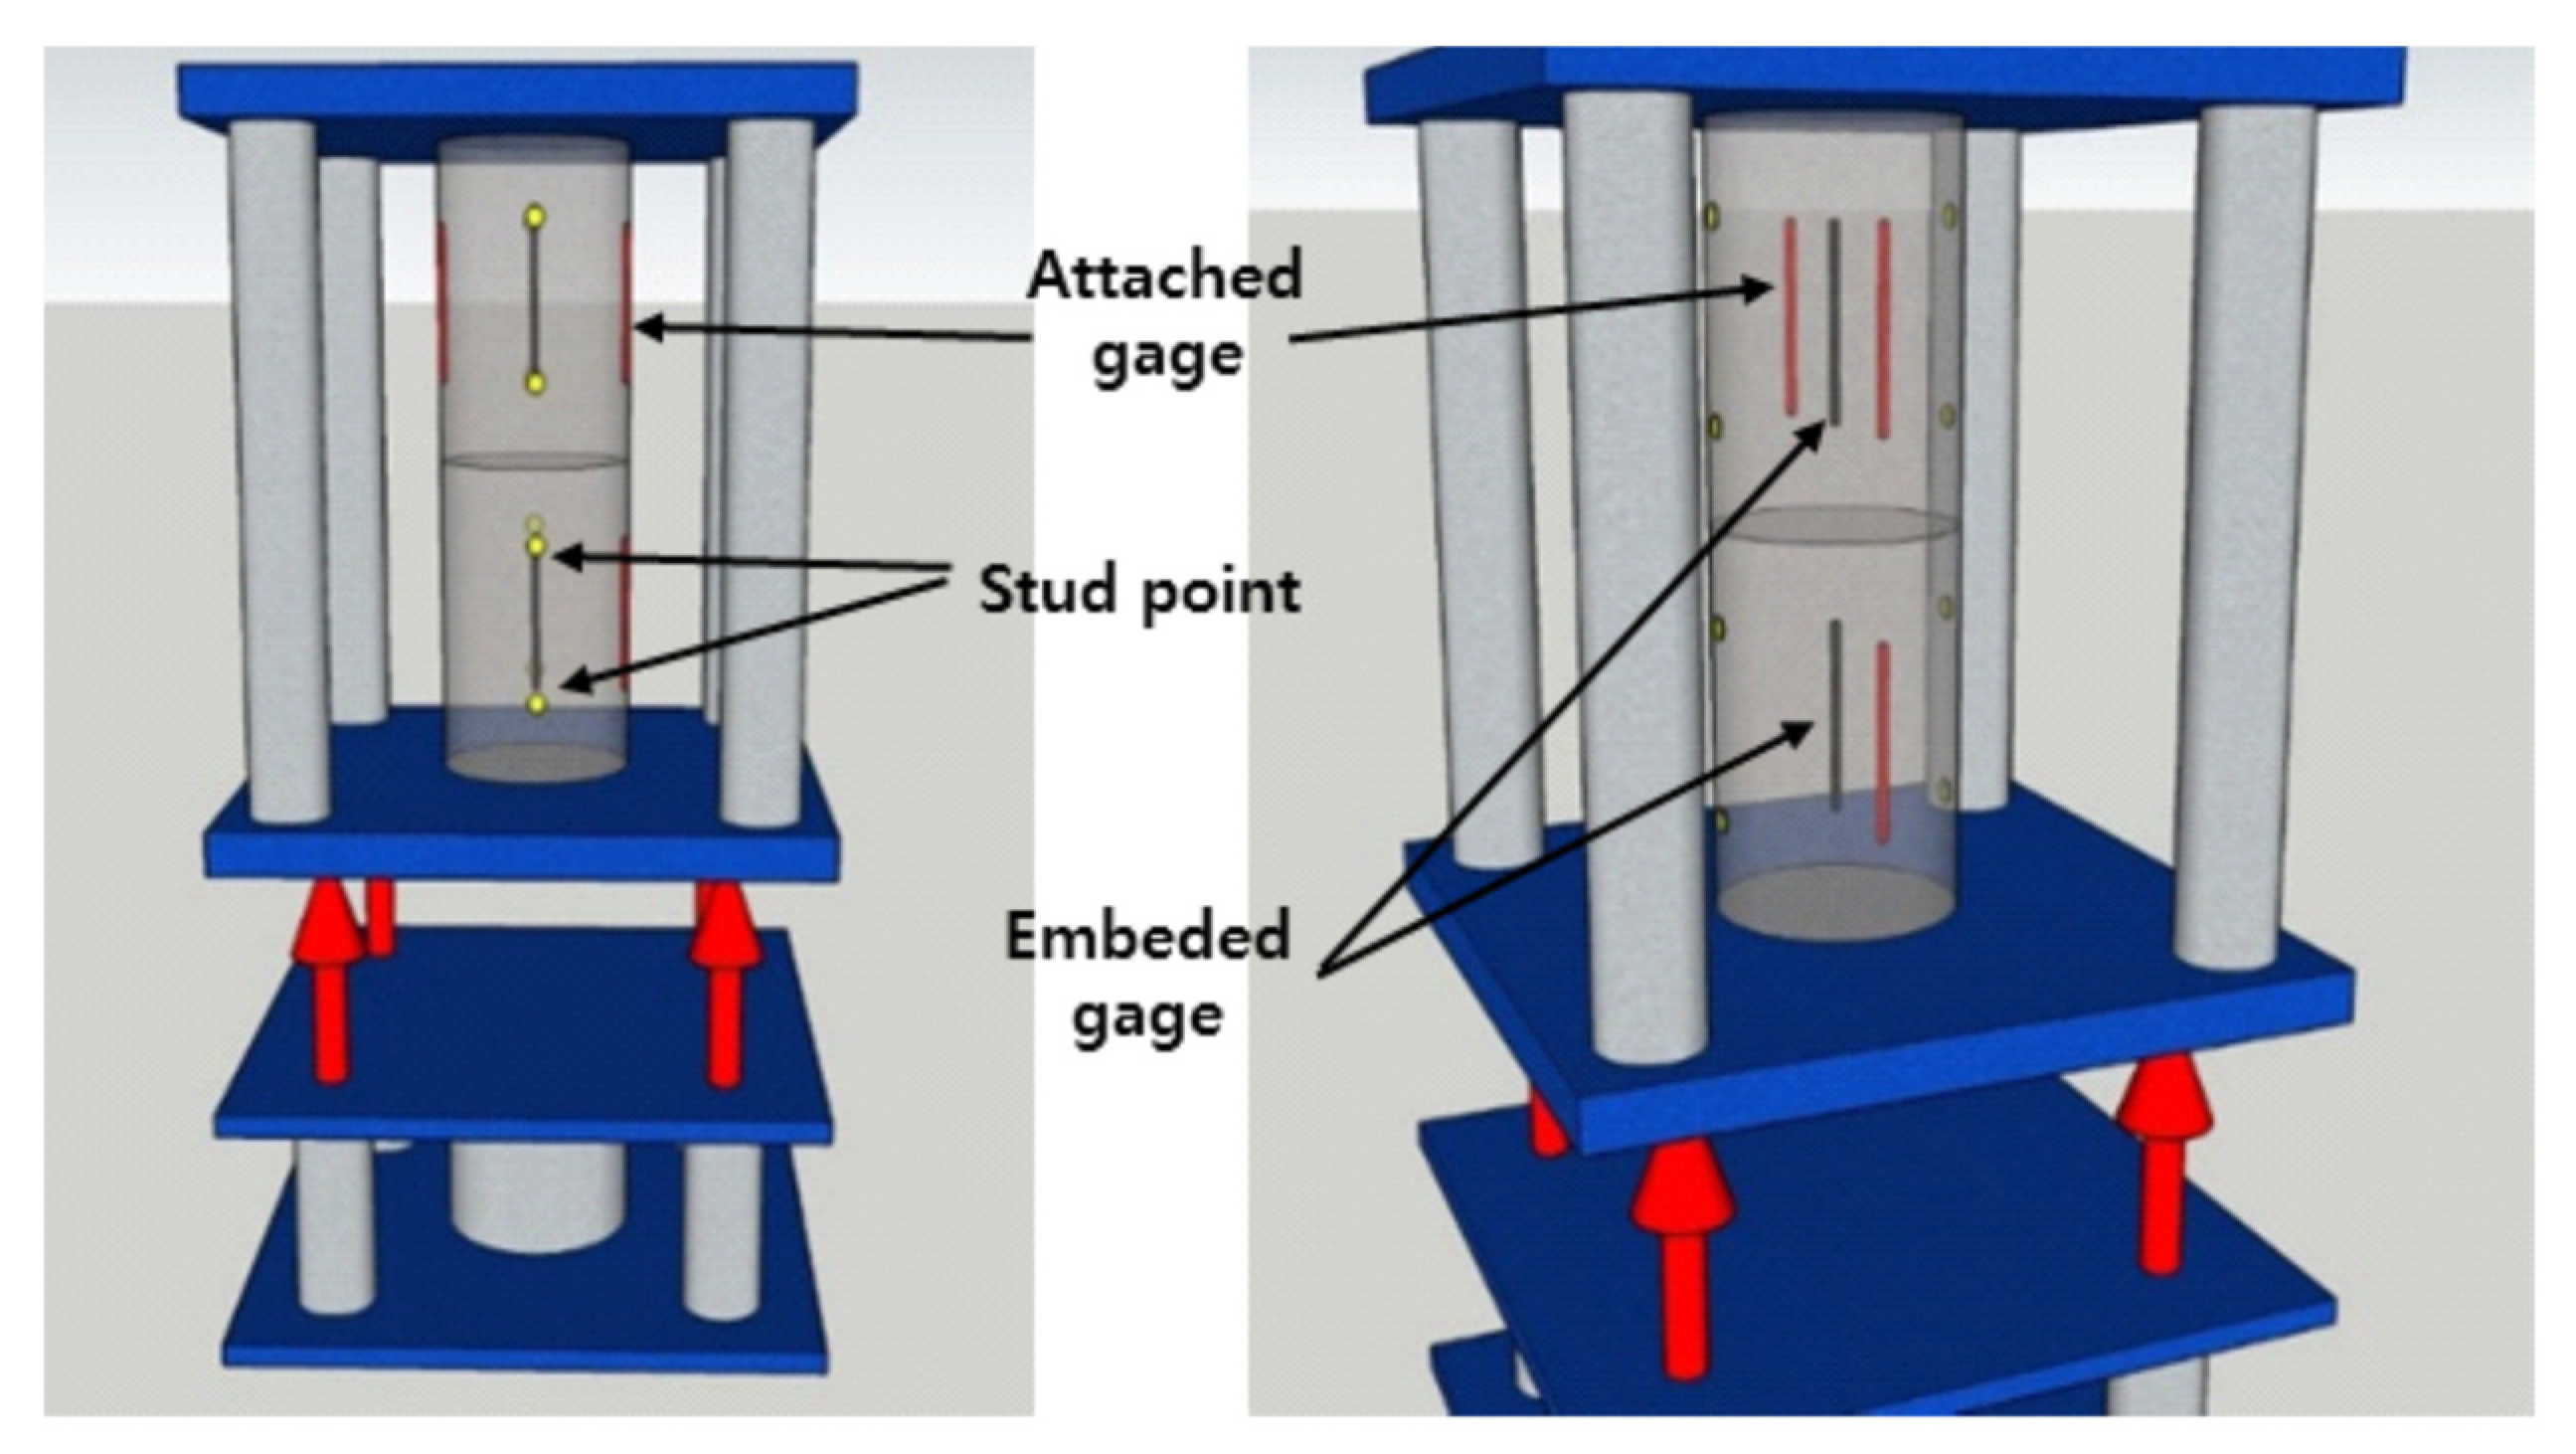
The strain was measured using embedded strain gauges, attached strain gauges, and a strain meter with studs. In the case of the embedded strain gauge, it was installed vertically in the center of the mold before casting UHPC into the specimen mold, and the verticality of the embedded strain gauge was paid attention to when casting UHPC (Fig. 3(b)). In the case of the attached strain gauge, it was attached vertically to the surface of the cylindrical test specimen with a gauge length of 60 mm, and it was installed symmetrically on both sides considering the eccentric loading. The strain was calculated as the average of the readings of the two attached strain gauges on both sides. Both the embedded strain gauge and the attached strain gauge were products that could measure strain up to 10-6. When a strain meter was used, studs were attached to the surface of the cylindrical specimen, and a portable strain meter with a minimum resolution of 0.001 mm was used to measure the change in length between the two studs and calculate the strain. The studs were attached symmetrically to both sides of the cylindrical specimen, and the studs were attached at a 100 mm distance for the ϕ75 × 150 mm specimen and at a 150 mm distance for the ϕ100 × 200 mm specimen. The locations of the three strain measuring devices are shown in Fig. 4.
Figure 3.
Instruments and devices for creep test: (a) Specimen setting, (b) Mold and embeded strain gauge.
Figure 3.
Instruments and devices for creep test: (a) Specimen setting, (b) Mold and embeded strain gauge.
Figure 4.
Position of strain measurement device.
Figure 4.
Position of strain measurement device.
2.4. Testing Method
The compressive creep test was conducted in a chamber with a constant temperature of 20±2℃ and a constant relative humidity of 50±4%. Before applying the sustained load, the initial strain was measured using a data logger and then the zero point was set. Then, the load for each variable was applied using a hydraulic jack, and the strain was continuously measured using a data logger. The strain measurement continued for approximately 80 days for both the first and second stage tests. When measuring the strain using a strain meter, the strain was calculated by measuring the displacement with a strain meter verified by a standard bar, and the strain was measured every hour for 12 hours after loading, every 24 hours for the next month, and once every 7 days for the next month.
Both compressive creep and drying shrinkage are time-dependent deformation phenomena, and the two deformations occur together during the creep test. Therefore, to measure pure compressive creep strain excluding drying shrinkage strain, drying shrinkage was simultaneously measured using the same test specimen without loading in the same temperature and humidity chamber where creep was in progress (Fig. 3(a)). The compressive creep strain was calculated by subtracting the measured drying shrinkage strain from the measured creep strain.
3. Test result and Discussion
3.1. Effect of Strain Measuring Method
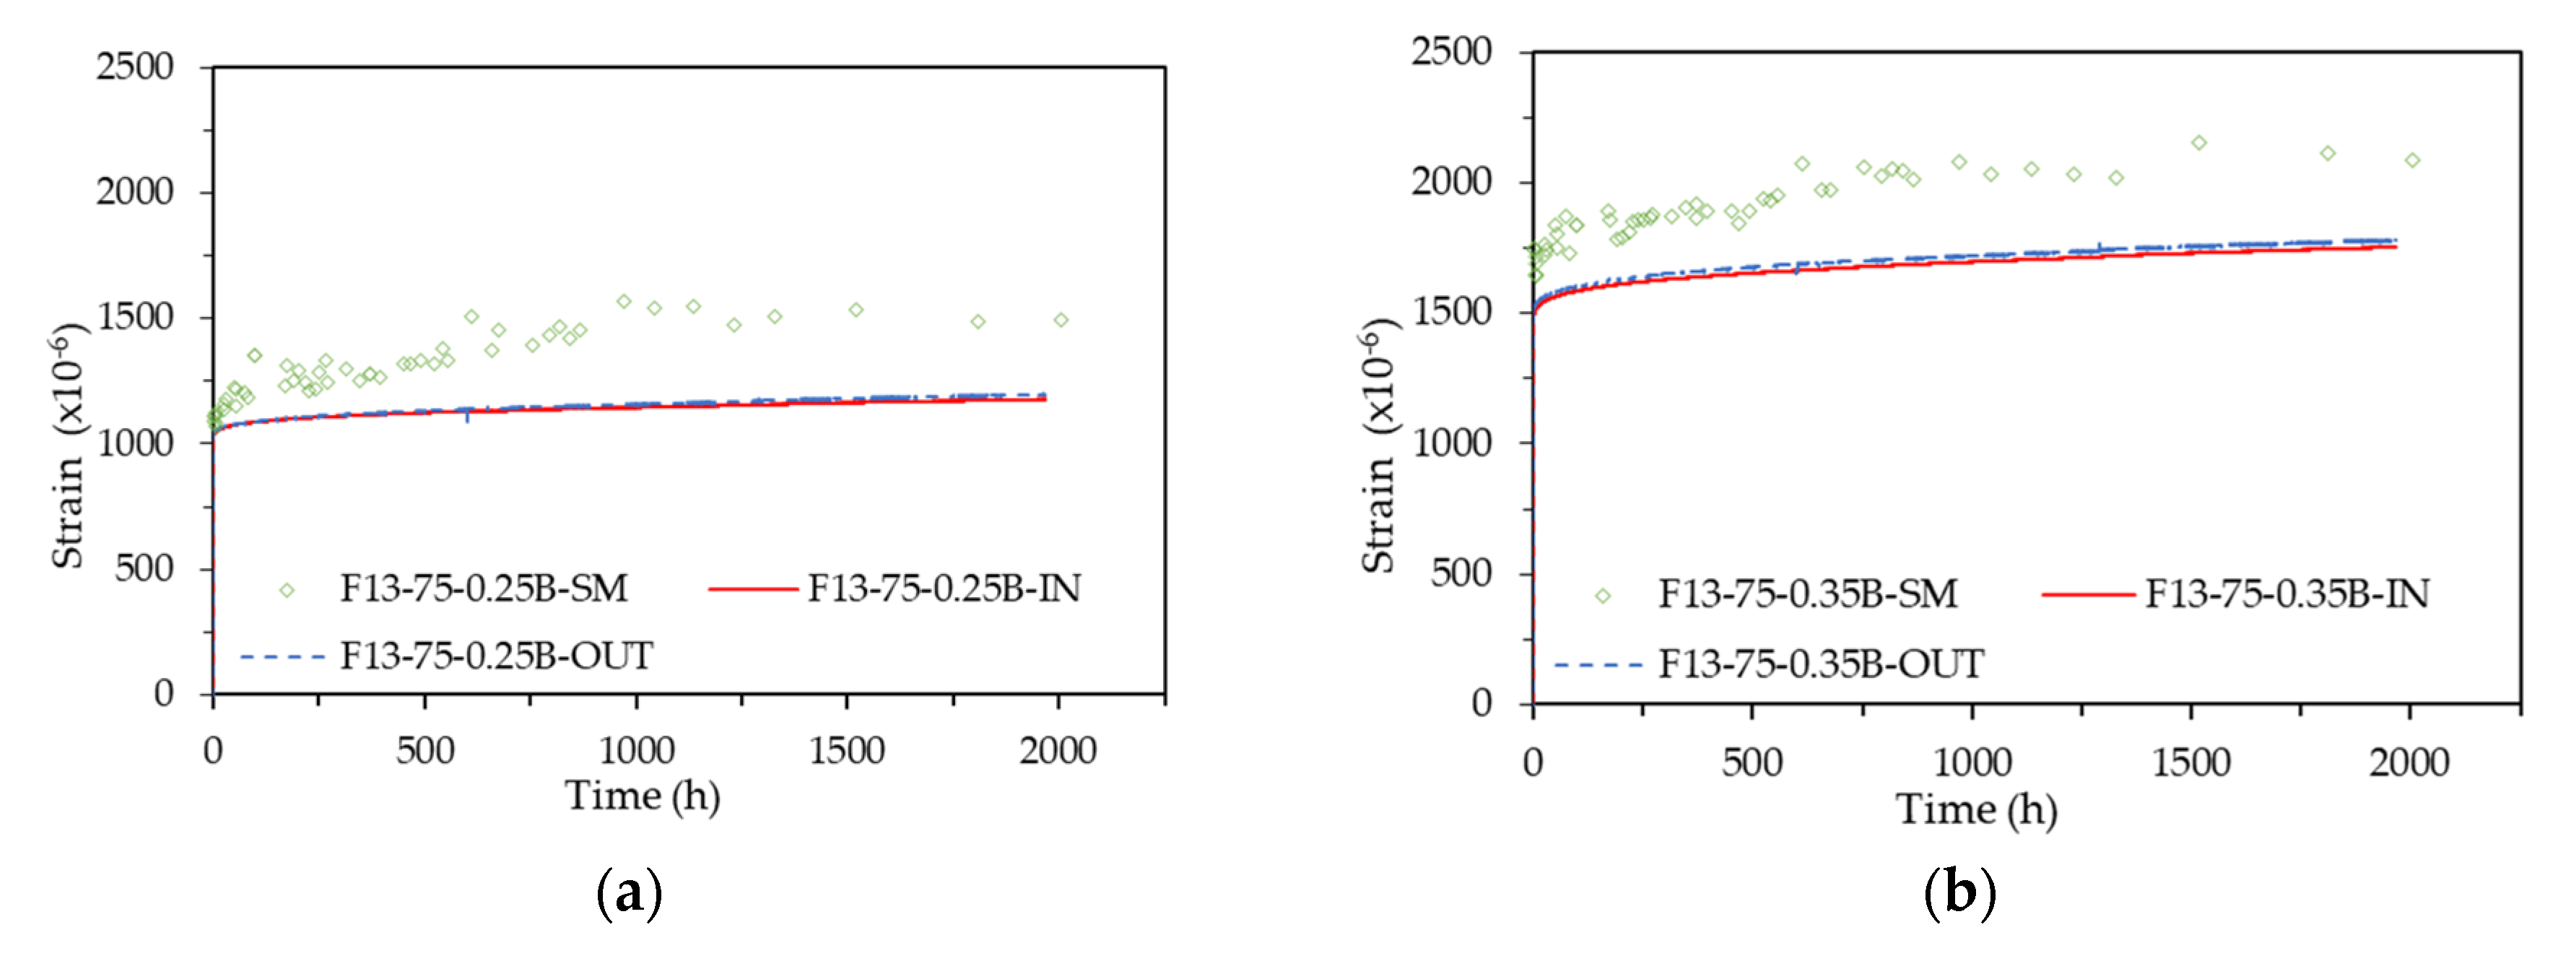
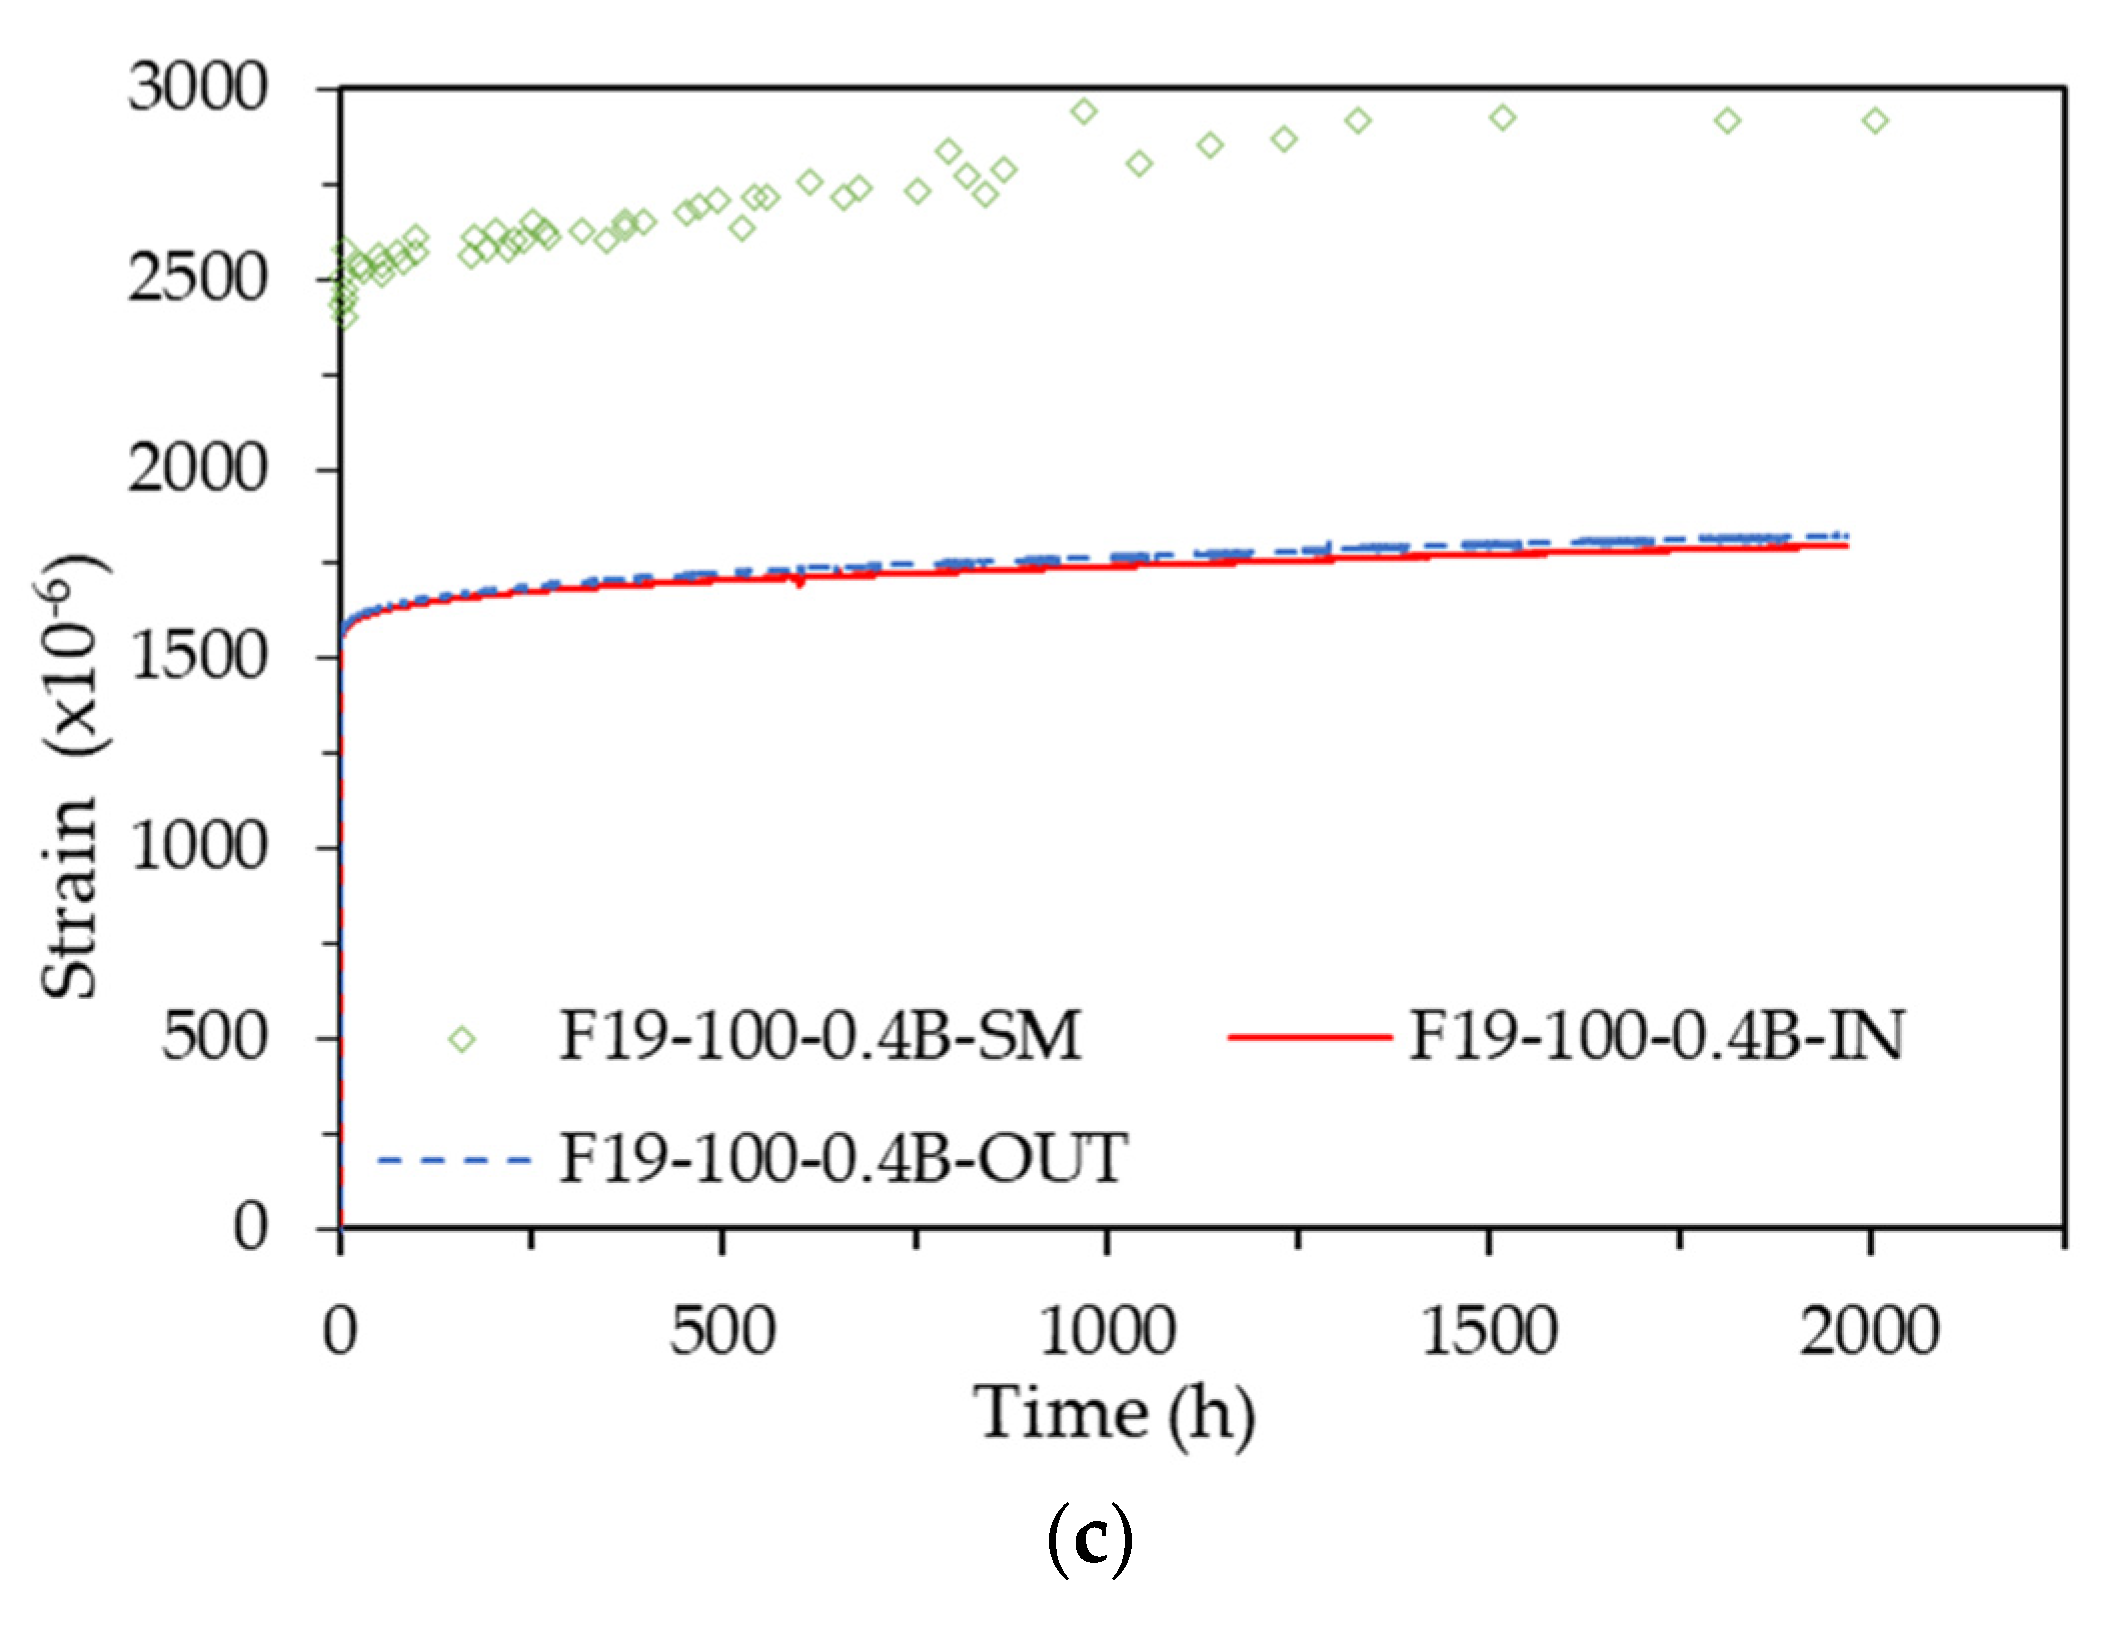
The creep strain patterns of four representative specimens, measured simultaneously using embedded strain gauges (IN), attached strain gauges (OUT), and strain meters with studs (SM), are shown in Fig. 5. The patterns derived from all measurement methods showed that the creep strain increased over
Figure 5.
Strain pattern according to strain measurement method: (a) F13-75-0.25B; (b) F13-75-0.35B; (c) F19-100-0.4B.
Figure 5.
Strain pattern according to strain measurement method: (a) F13-75-0.25B; (b) F13-75-0.35B; (c) F19-100-0.4B.
The results from the strain meters (SM) exhibited significant fluctuations and differed markedly from the results obtained by other measurement methods. These discrepancies are likely due to errors in the verification process using standard rods and observational errors by the measurer. Given that the strain meter method is highly susceptible to verification and observer errors, it can be useful for identifying general creep trends but has limitations in deriving accurate creep characteristic values.
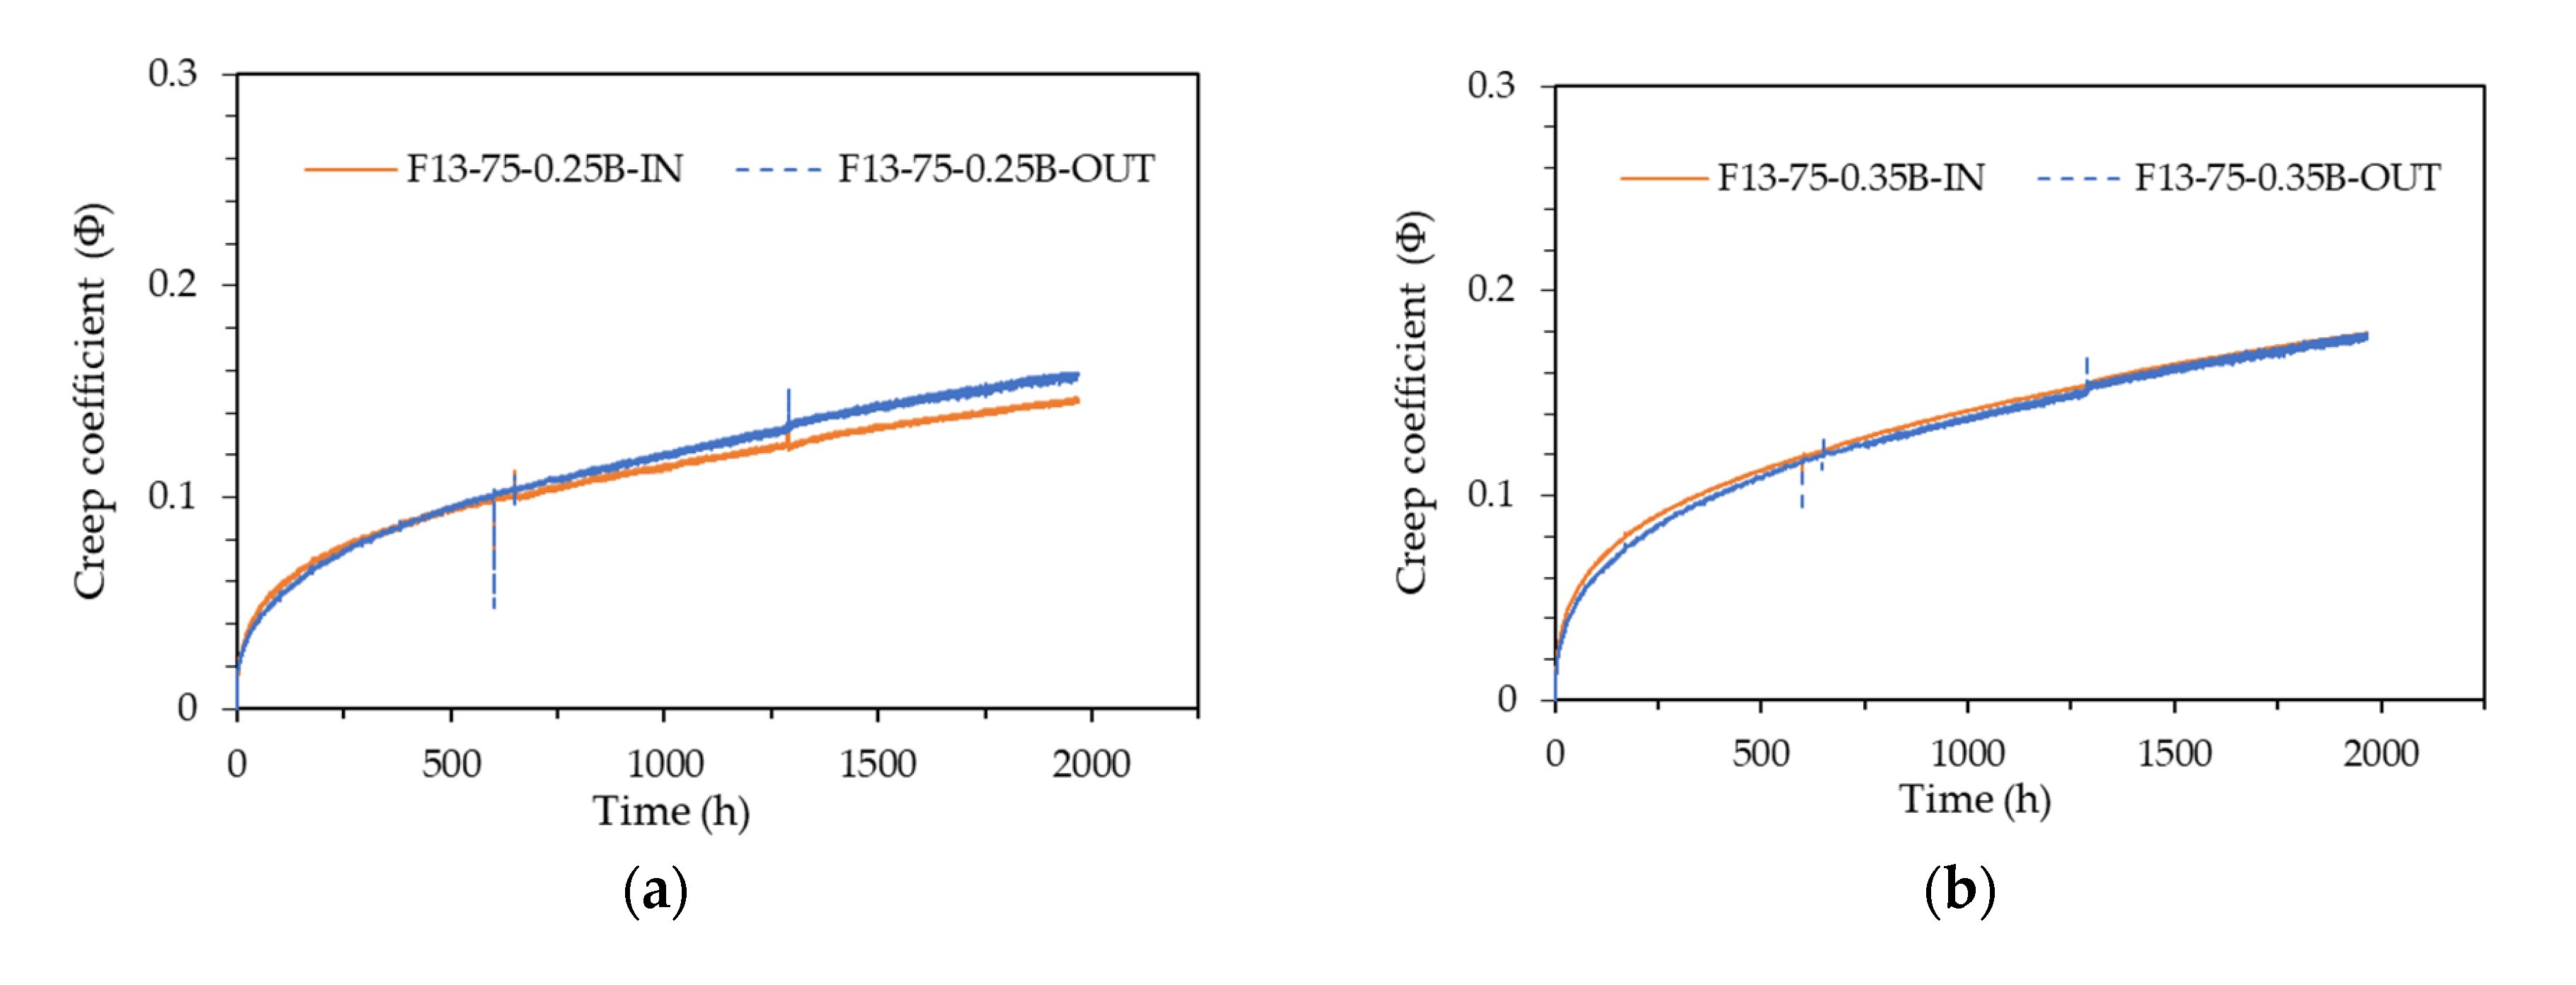
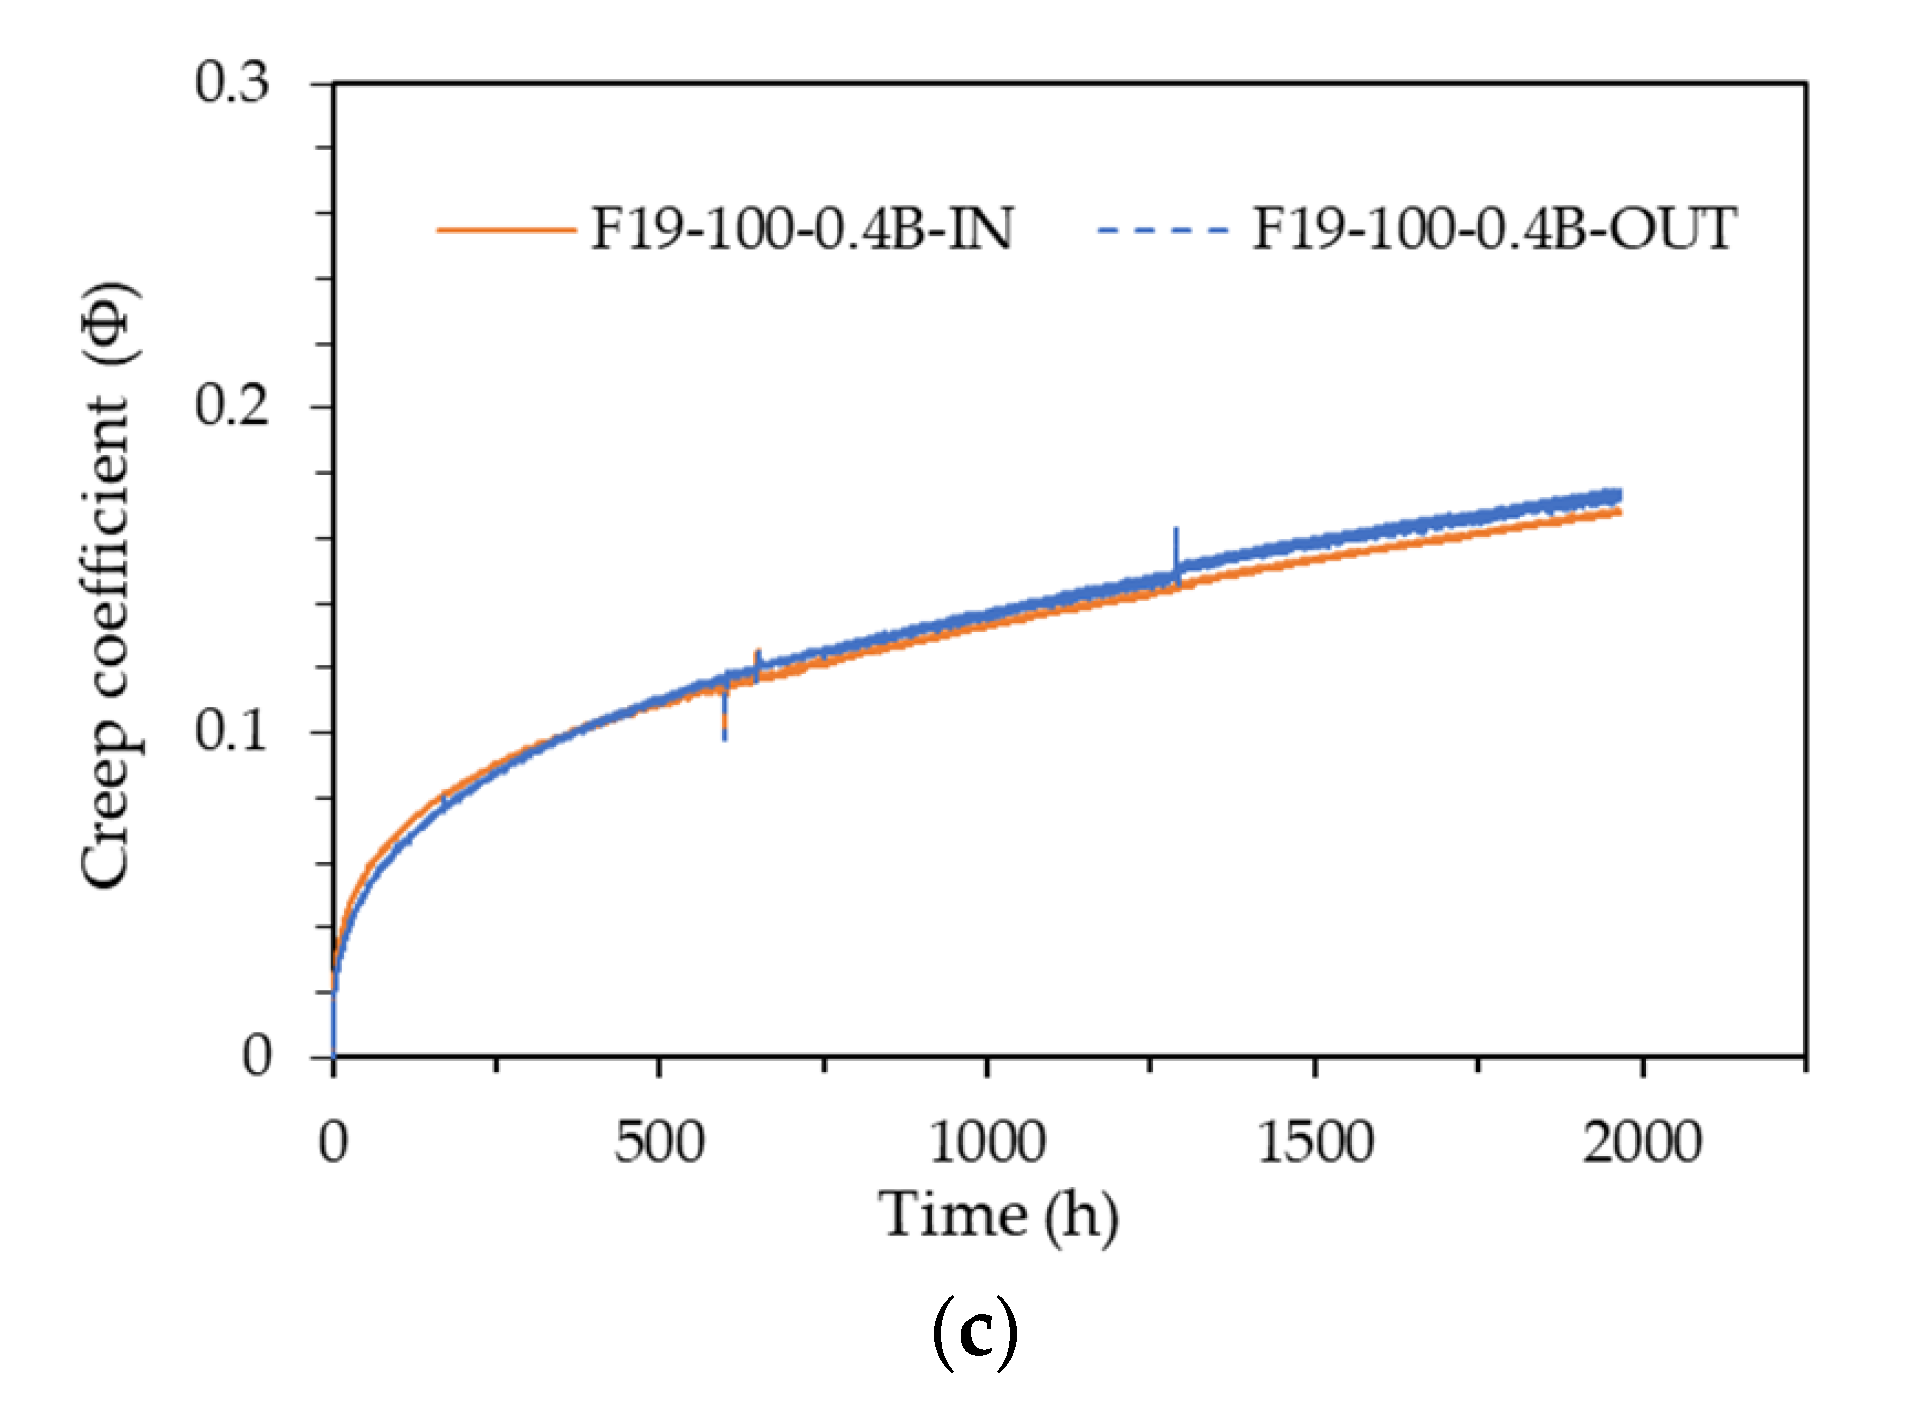
The results from the embedded strain gauges (IN) and the attached strain gauges (OUT) were very similar across all specimens. To compare the IN and OUT results, the creep strain was converted into the creep coefficient, and the trend of the creep coefficient over time is shown in Fig. 6. The creep coefficient is calculated as shown in Equation 1.
where
is the creep coefficient at concrete age
t when loading starts at age
to,
is the elastic by the loading applied at age
to,
is the creep strain at concrete age
t when loading starts at age
to,
Figure 6.
Creep coefficient pattern according to strain measurement method: (a) F13-75-0.25B; (b) F13-75-0.35B; (c) F19-100-0.4B.
Figure 6.
Creep coefficient pattern according to strain measurement method: (a) F13-75-0.25B; (b) F13-75-0.35B; (c) F19-100-0.4B.
In terms of creep coefficient, the IN and OUT results of all bottom specimens except the F19-75-0.4B specimen were similar. However, the creep coefficient increase rate of the OUT results measured with the attached strain gauge tended to be somewhat larger than the creep coefficient increase rate of the IN results measured with the embedded strain gauge, resulting in a difference in behavior. This difference seems to be due to the difference in the locations of the two strain measuring methods. The embedded strain gauge is located at the center of the specimen and measures only the vertical strain, whereas the attached strain gauge is attached to the surfaces on both sides of the cylindrical specimen and measures not only the vertical strain but also the transverse expansion strain that occurs simultaneously with the vertical strain. Therefore, the strain of the gauge attached to the surface is measured to be larger than the vertical strain.
However, since the difference is small, it can be concluded that both strain measurement methods—the embedded strain gauge and the attached strain gauge—produce comparable results. Therefore, although either method can be used to measure the creep of UHPC, it is considered more desirable to use both strain measurement methods simultaneously. This dual approach allows for mutual compensation of errors that may occur during gauge installation and data collection.
3.2. Effect of Sustained Load Intensity
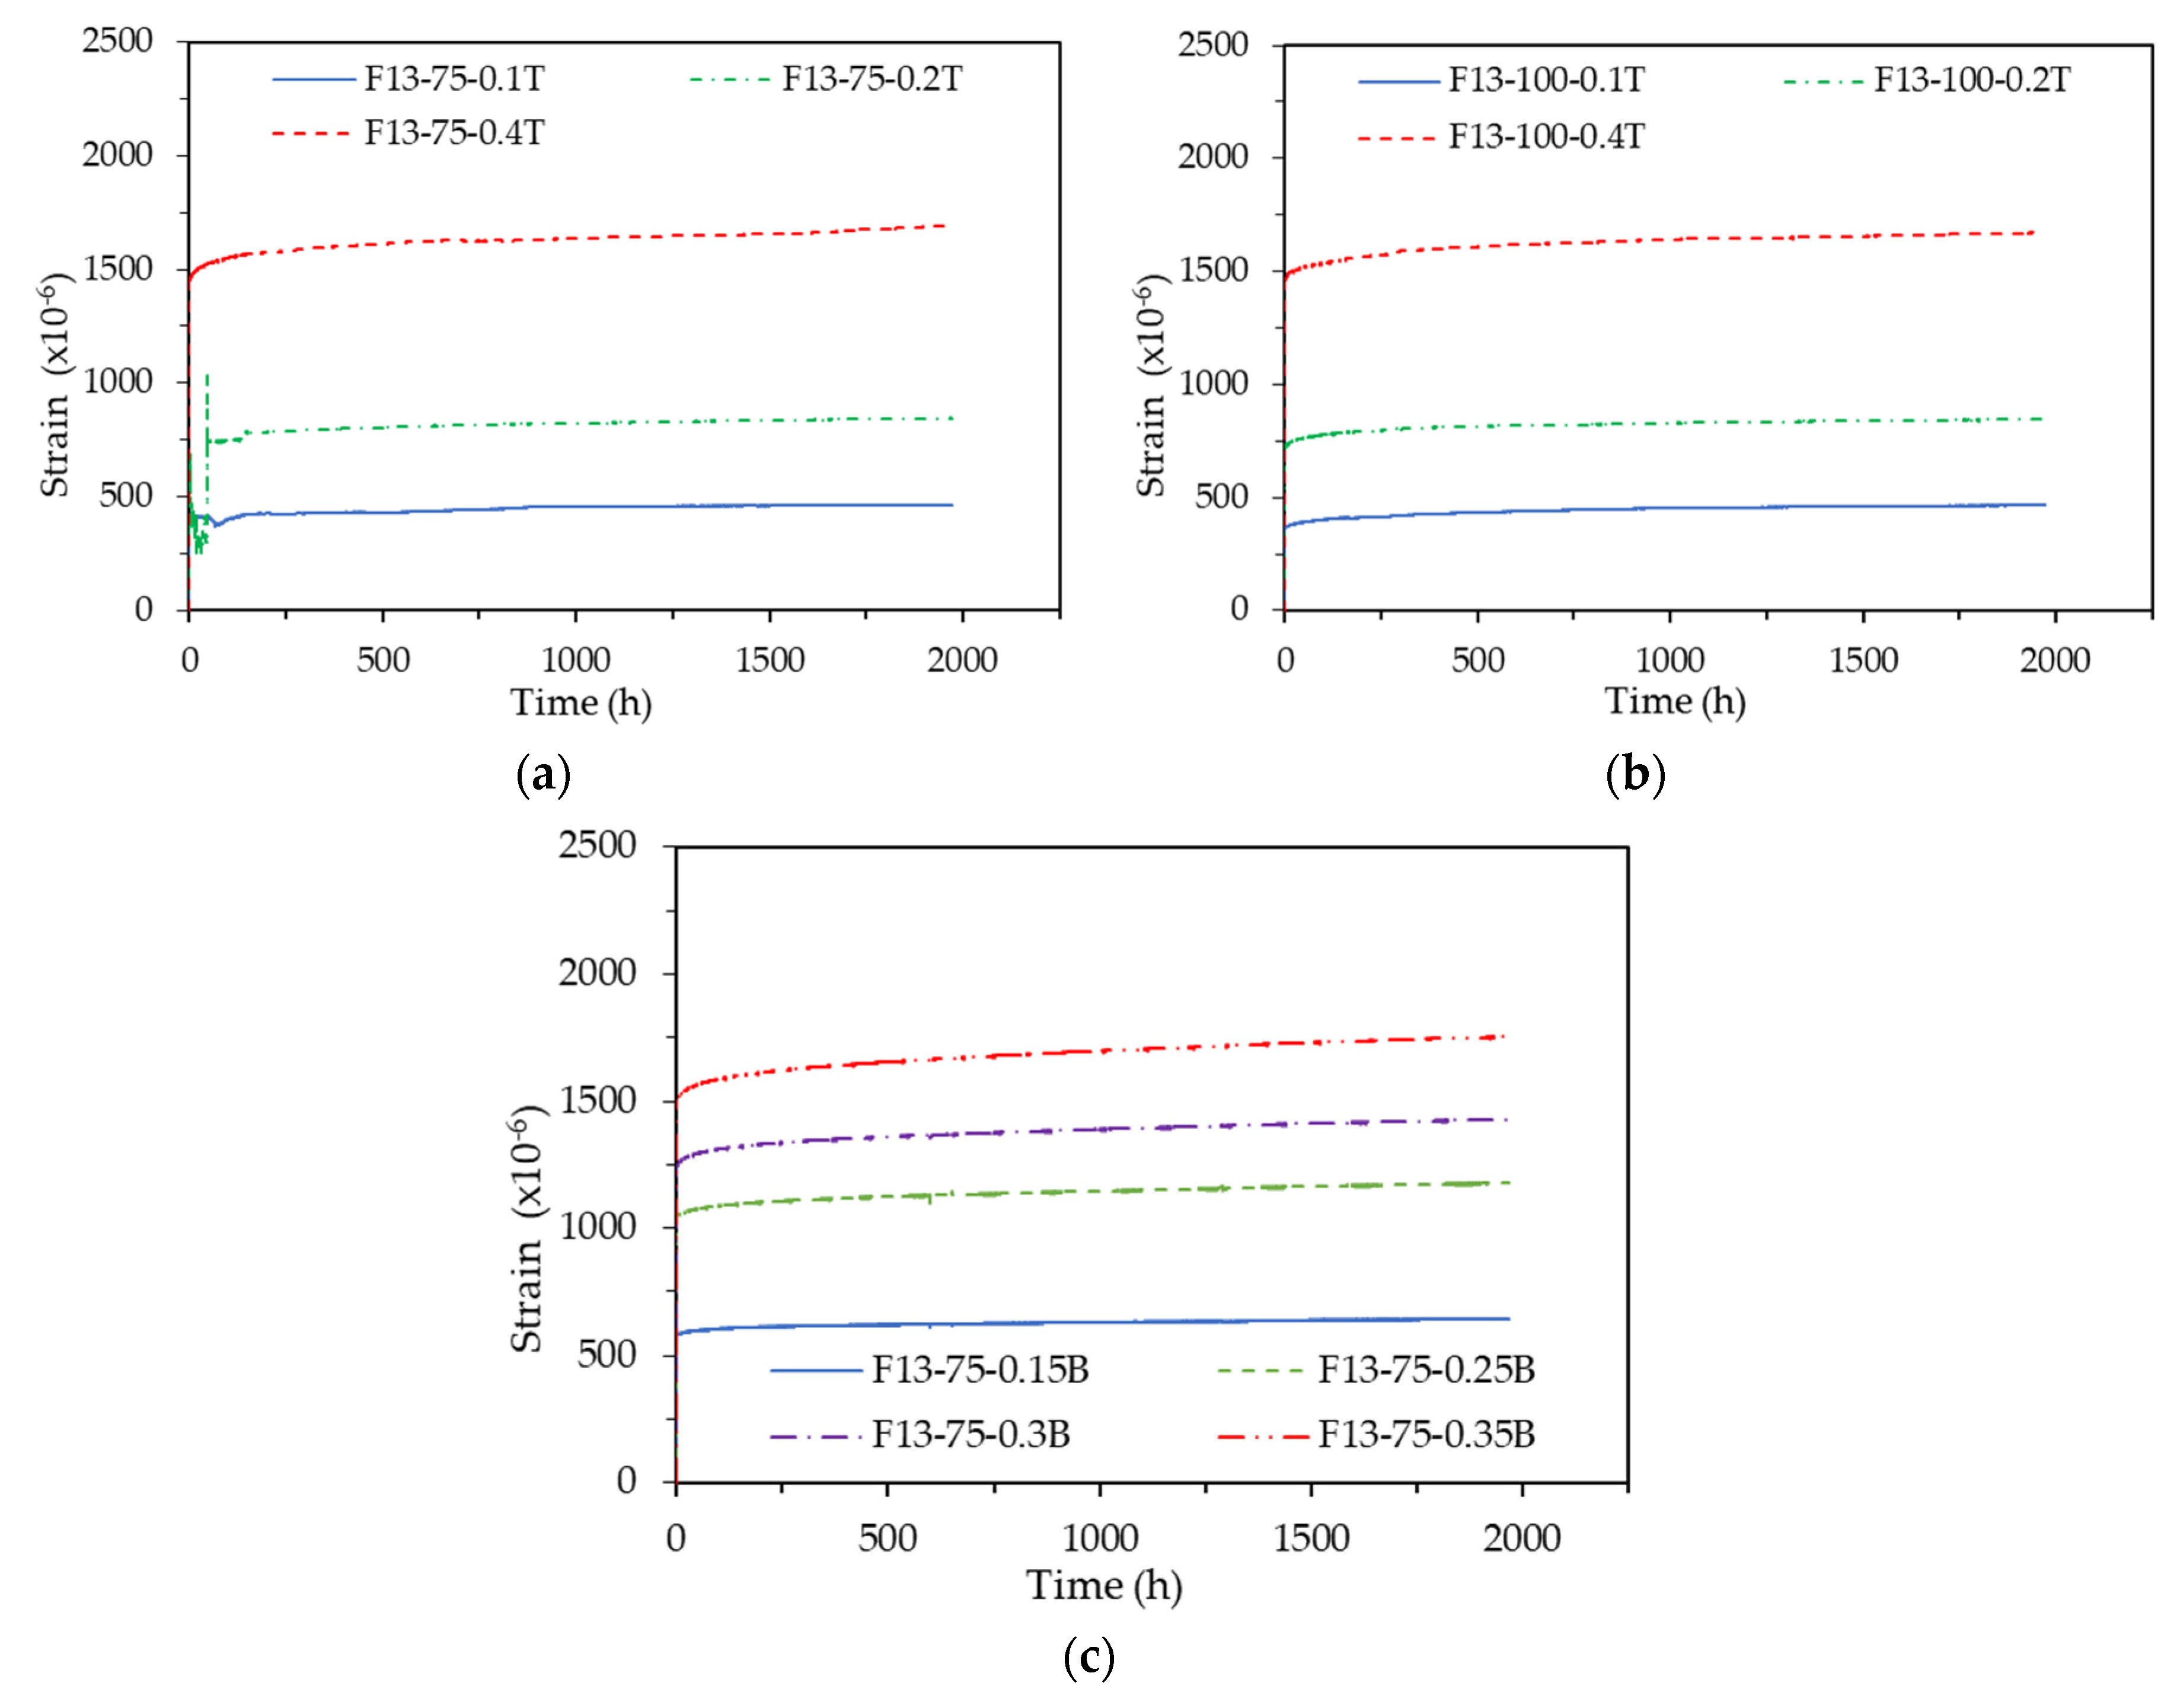
Creep tests were conducted by varying the sustained load intensity from 10% to 40% of the specified compressive strength of UHPC. The strain patterns according to the sustained load level are shown in Fig. 7, categorized by the first and second stage specimens and test specimen sizes. The strains of all specimens were measured using the embedded strain gauge. Some strain measurement results deviated from the overall trend or showed abnormal behavior. These anomalies were due to factors such as gauge errors, gauge installation errors, and setting errors during data collection. In this paper, the results of the F13-100-T Series (first stage), F13-100-T Series (first stage), and F13-75-B Series (second stage), excluding these abnormal data, were analyzed.
Figure 7.
Strain pattern according to sustained load intensity: (a) F13-75-T Series; (b) F13-100-T Series; (c) F13-75-B Series.
Figure 7.
Strain pattern according to sustained load intensity: (a) F13-75-T Series; (b) F13-100-T Series; (c) F13-75-B Series.
Overall, the elastic strain was proportional to the sustained load level, and the creep strain tended to increase at a constant rate thereafter. To quantitatively evaluate the trend, the creep strain was converted into creep coefficient, and the creep coefficient pattern over time is plotted in
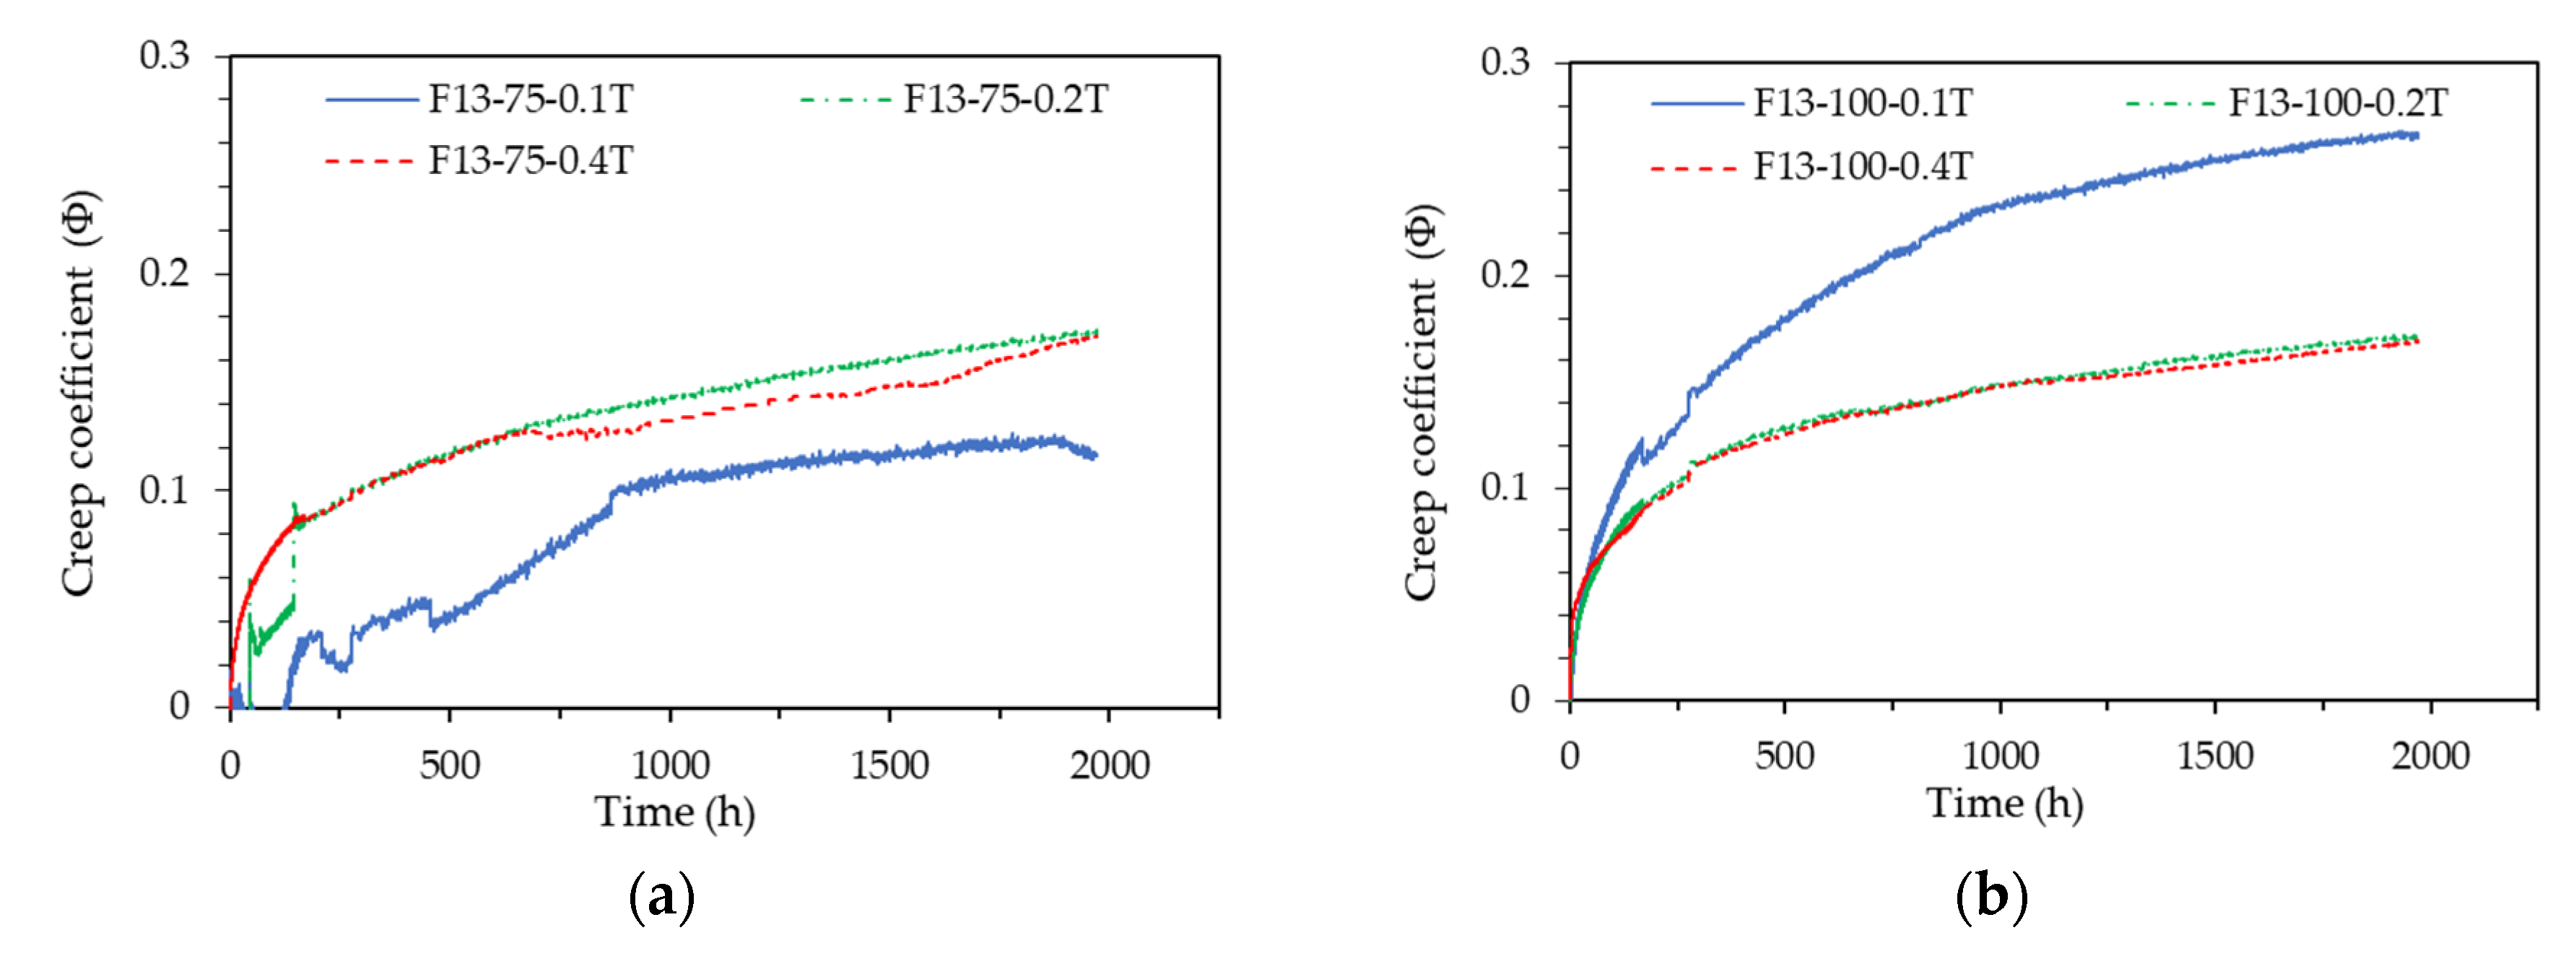
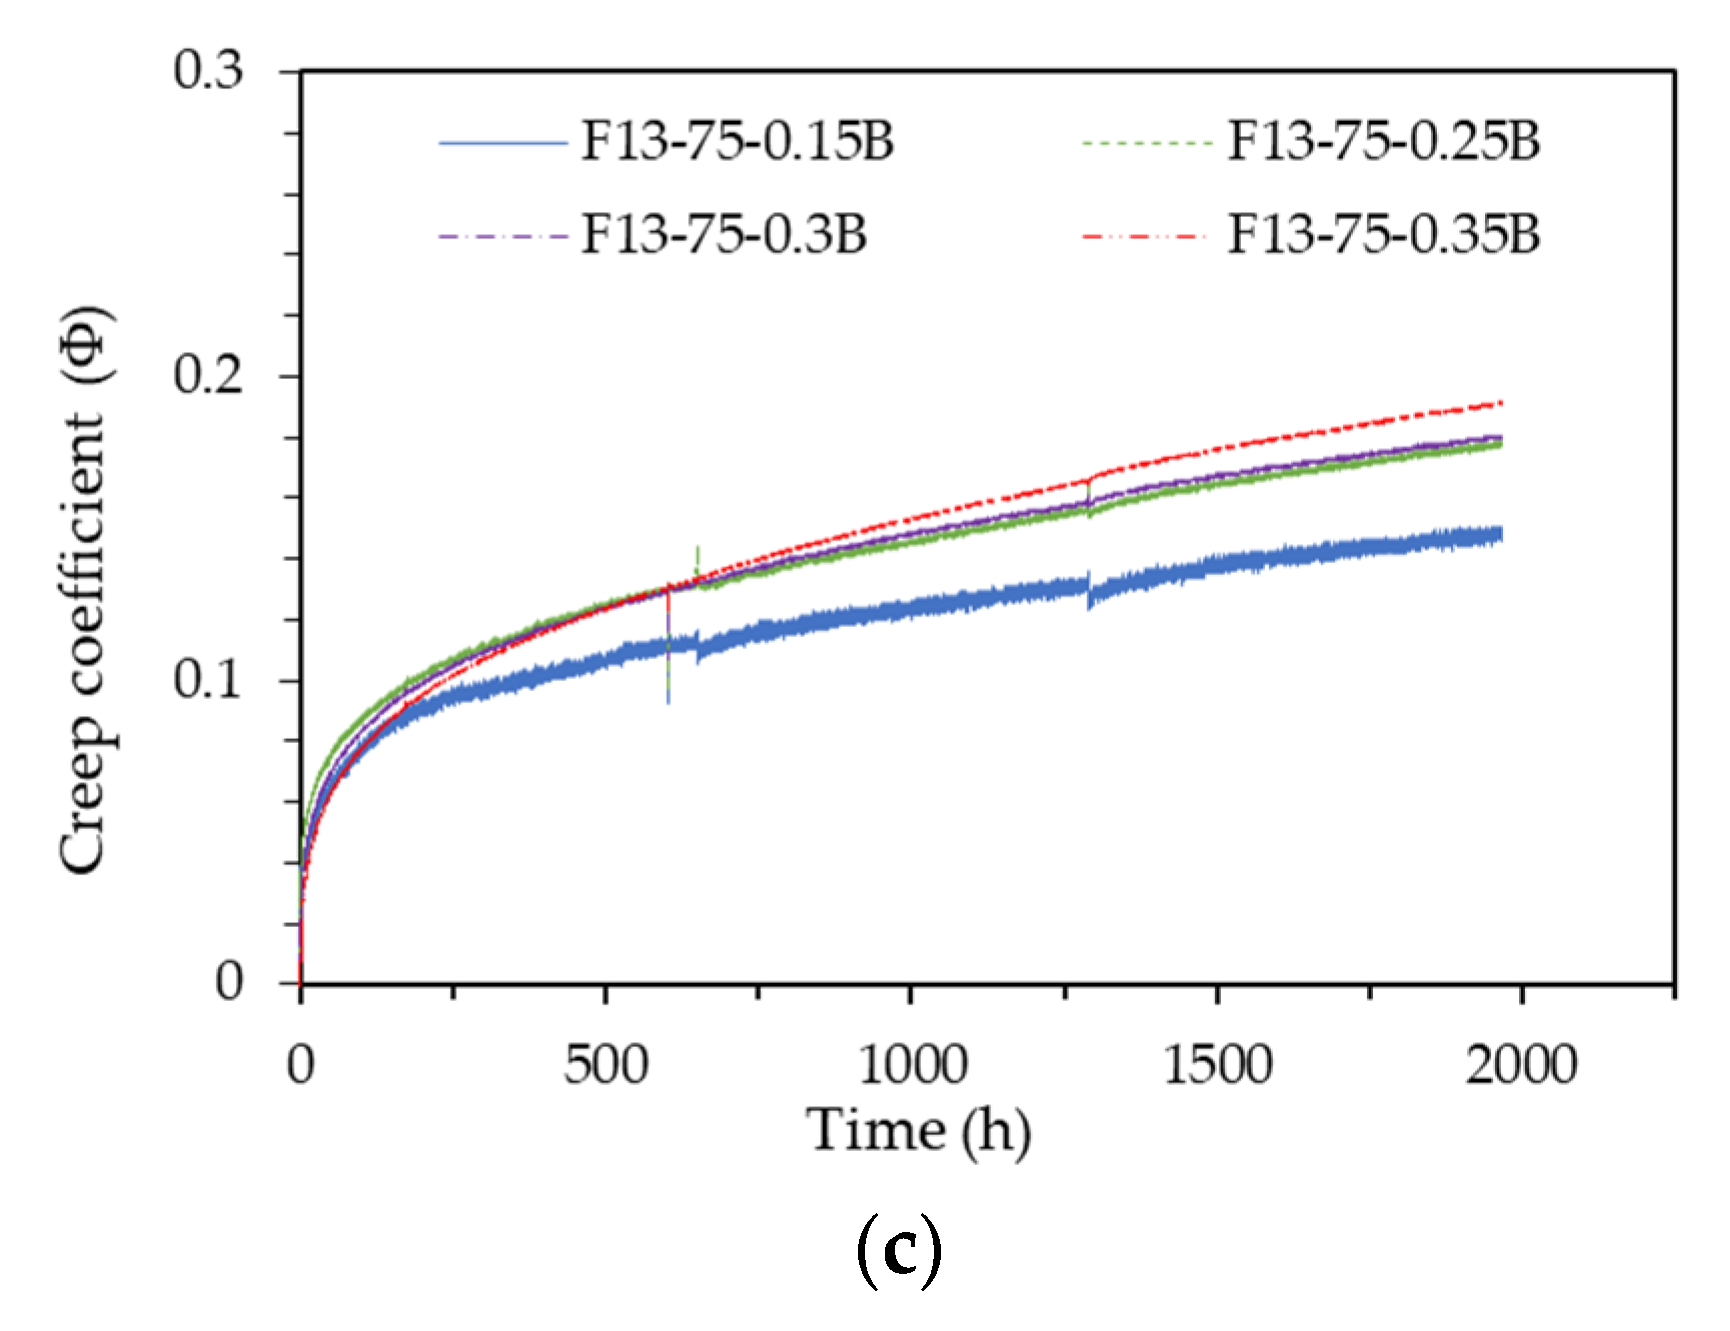
Figure 8. In the case of the first stage specimens (F13-75-T Series and F13-100-T Series), the 10% sustained load specimens showed abnormal results, while the 20% and 40% sustained load specimens showed very comparable creep coefficient behaviors, regardless of the specimen sizes. In the case of the second stage specimens (F13-75-B Series), the 15% sustained load specimen showed very low creep coefficient behavior, while the other 25%, 30%, and 35% sustained load specimens showed almost similar creep coefficient behaviors. However the creep coefficient tended to increase somewhat as the sustained load level increased.
Figure 8.
Creep coefficient pattern according to sustained load intensity: (a) F13-75-T Series; (b) F13-100-T Series; (c) F13-75-B Series.
Figure 8.
Creep coefficient pattern according to sustained load intensity: (a) F13-75-T Series; (b) F13-100-T Series; (c) F13-75-B Series.
Table 6 shows the creep coefficient values of each test specimen at a loading sustained time of 1,967 hours. The first-stage specimens showed a creep coefficient value of 0.17, except for the 10% sustained load, while the second-stage test specimens showed creep coefficient values of 0.18–0.19, except for the 15% sustained load. The first-stage specimens exhibited a consistent creep coefficient regardless of the sustained load level, whereas the second-stage specimens showed a slight increase in the creep coefficient with higher sustained load levels. This difference is likely due to variations in elastic deformation and creep deformation related to the difference in load intensity. The slightly higher creep coefficients of the second-stage test specimens are attributed to their lower concrete compressive strength (160.9 MPa) compared to that of the first-stage test specimens (198.9 MPa).
According to the David-Glanville law [
1], creep strain is proportional to the applied stress, with the proportional constant being the same for both compressive and tensile stresses. In other words, creep strain is proportional to elastic strain, and this law is valid when the stress applied to concrete is less than 60% of its ultimate strength. For sustained loads less than 60% of the compressive strength, creep strain is proportional to elastic strain, meaning that the creep coefficient can be considered constant regardless of the sustained load level.
However, the elastic modulus of concrete varies depending on the applied stress, and consequently, the elastic strain also varies. Specifically, as the stress level of the sustained load increases, the tangential elastic modulus decreases and the elastic strain increases. If the creep strain is proportional to the applied stress according to the David-Glanville law, the creep coefficient should theoretically decrease as the applied stress increases. Nevertheless, because the degree of change is not significant, the creep coefficient can effectively be considered constant regardless of the sustained load level, in accordance with the David-Glanville law.
In contrast to the David-Glanville law, a recent study reported a nonlinear relationship between applied sustained stress and creep strain [
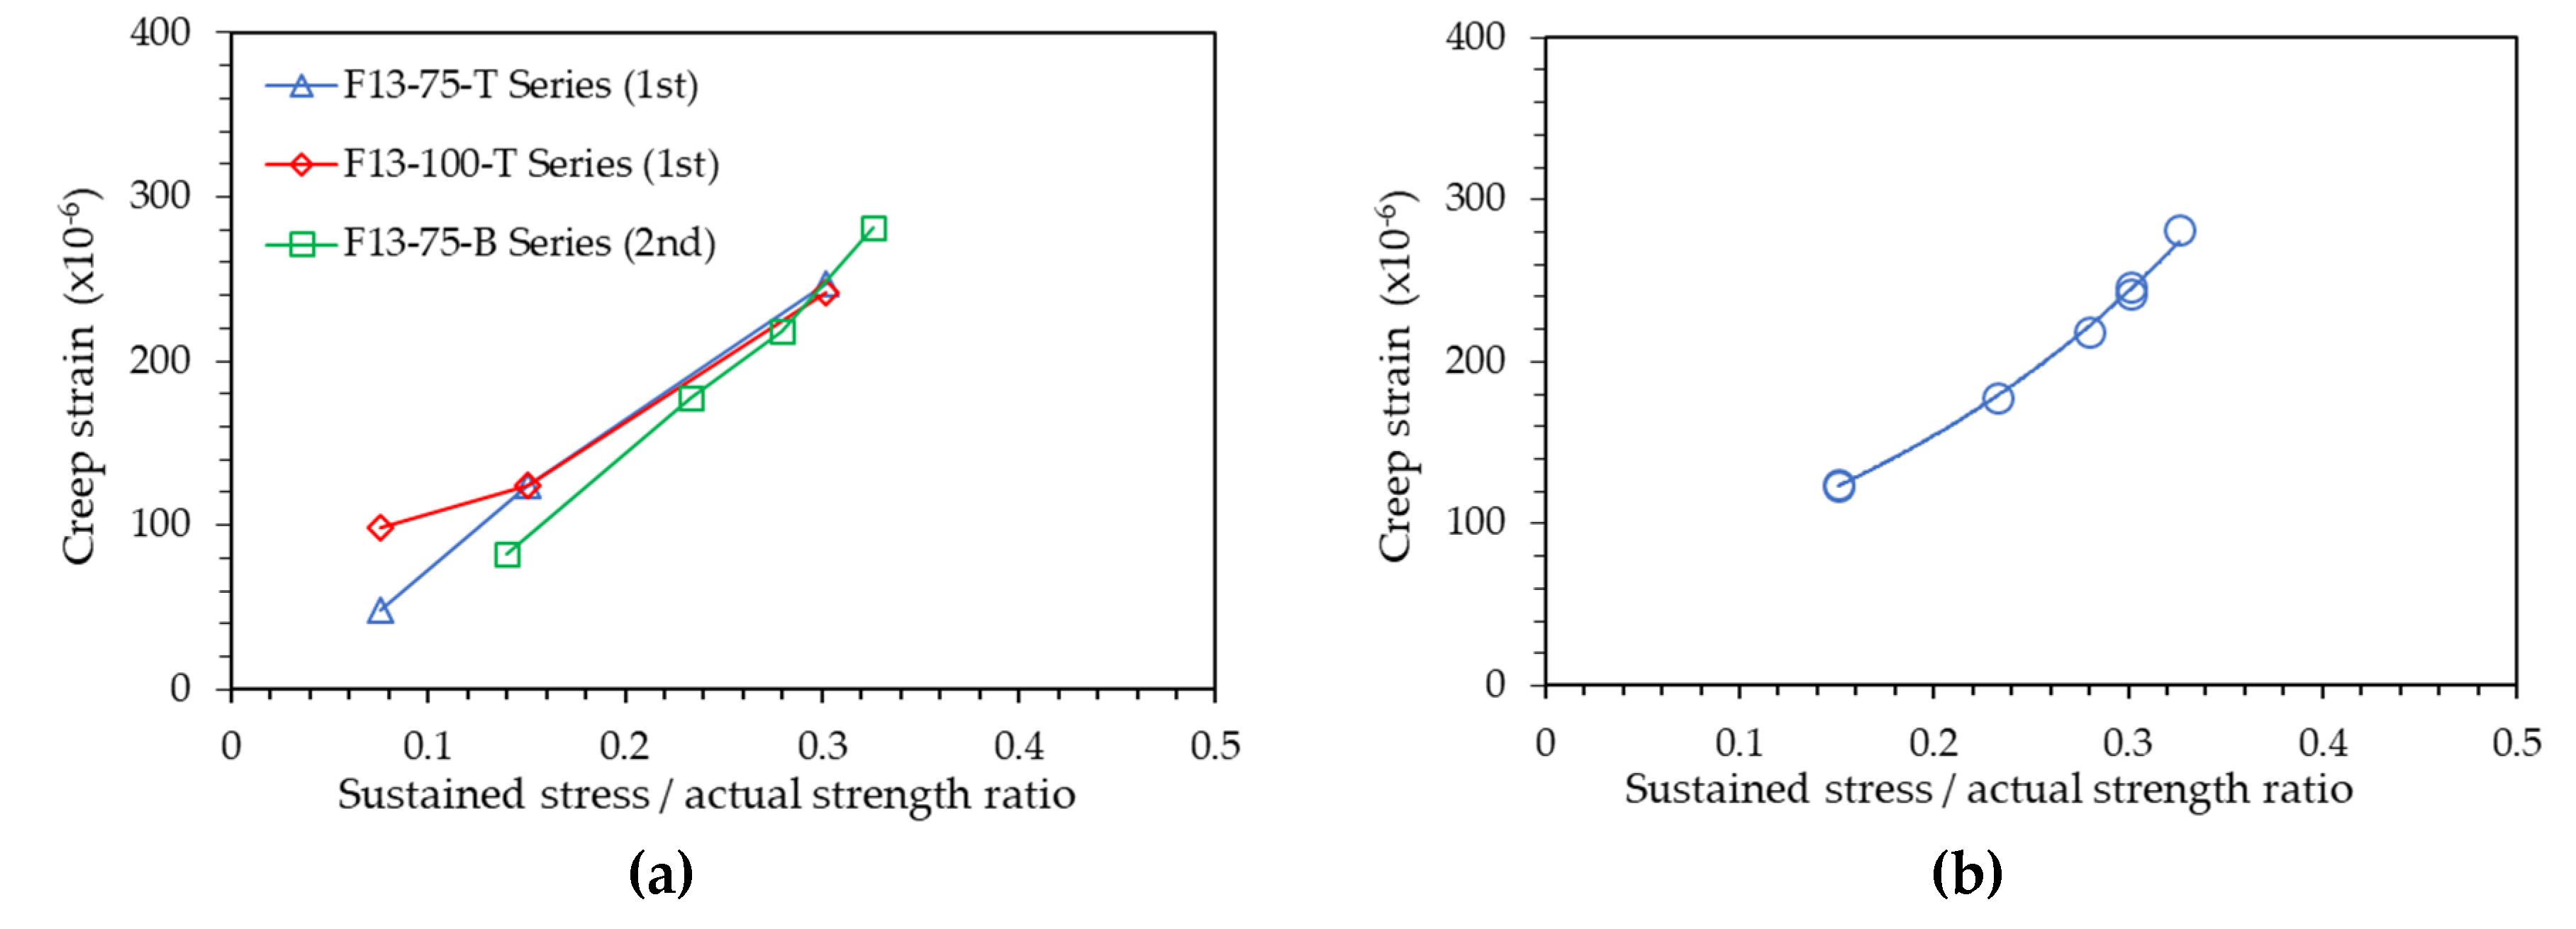
1]. To investigate the correlation between sustained stress and creep strain in UHPC, the correlation of creep strain according to the sustained load intensity derived from the experiment of this study is plotted in Fig. 9.
Figure 9(a) illustrates the creep strain pattern relative to the compressive strength ratio (sustained stress / actual compressive strength) at a sustained load duration of 1,967 hours. The results for the first and second test specimens appear to exhibit the same parabolic trend. Fig. 9(b) consolidates all test specimens, excluding those with sustained load levels of 10% and 15% due to abnormal creep measurement results, into a single graph irrespective of the series. Consequently, the sustained stress and creep strain demonstrated a parabolic relationship (R
2=0.998), indicating that UHPC also exhibits a nonlinear relationship between applied sustained stress and creep strain, consistent with recent findings [
1].
The experimental results for sustained load intensities of 10% and 15% exhibited many anomalies, deviating from the general trend. This discrepancy is attributed to significant load errors that occur when applying very low loads, and the relative deviation caused by small creep deformations is more pronounced compared to other results. Consequently, although existing standards such as KS F 2453 [
9] and ASTM C512 [
8] specify that the sustained load level should be 40% or less of the concrete’s compressive strength at the age of loading, there is a high likelihood of data errors at sustained loads of approximately 14% or less of the actual compressive strength. Therefore, it is deemed advisable to apply a sustained load ranging from 15% to 40% of the actual compressive strength.
3.3. Effect of Specimen Size
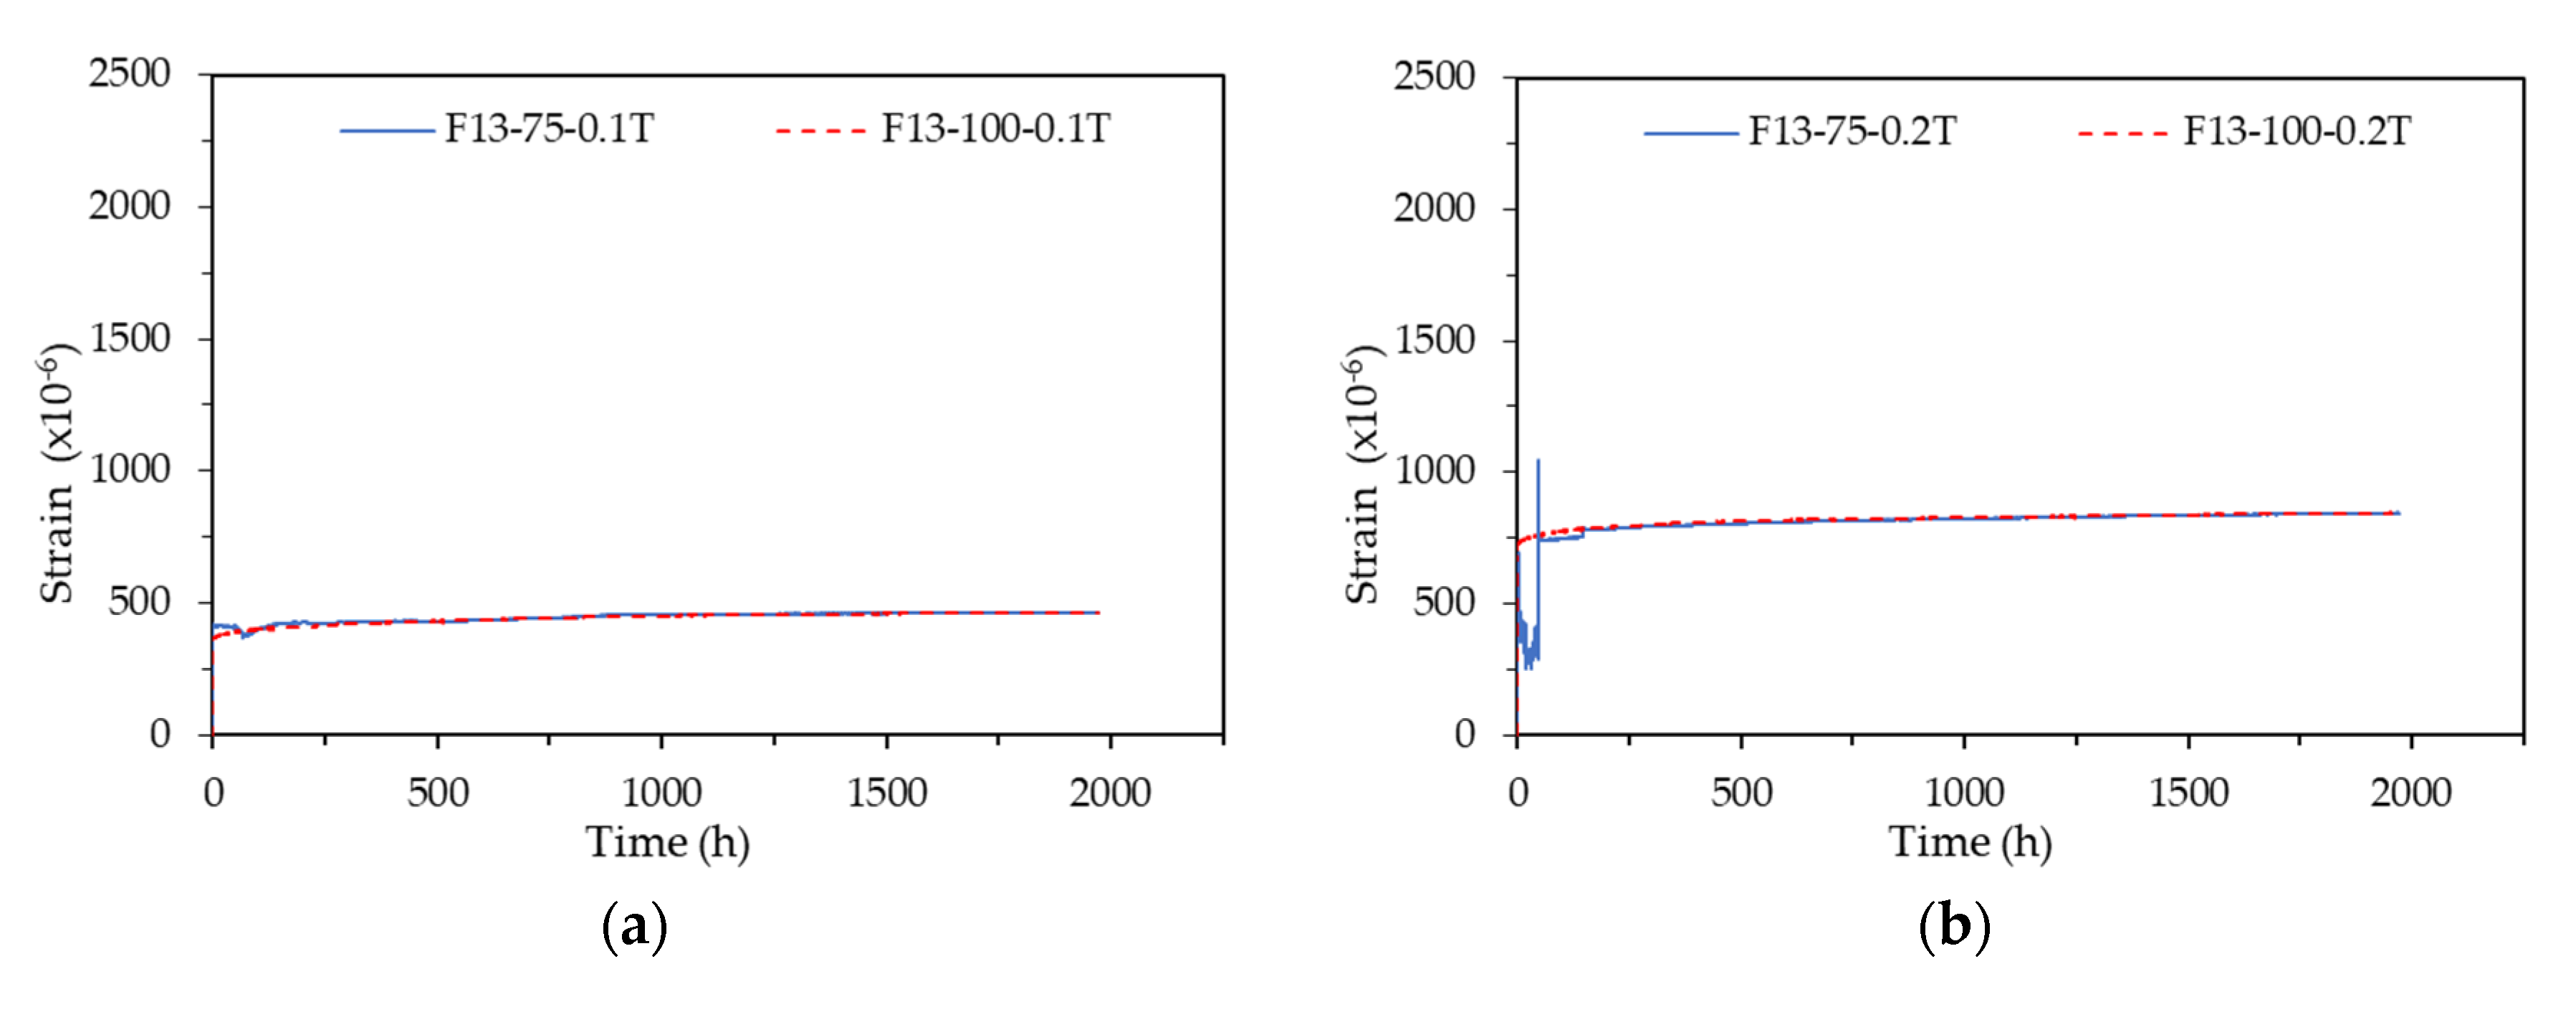
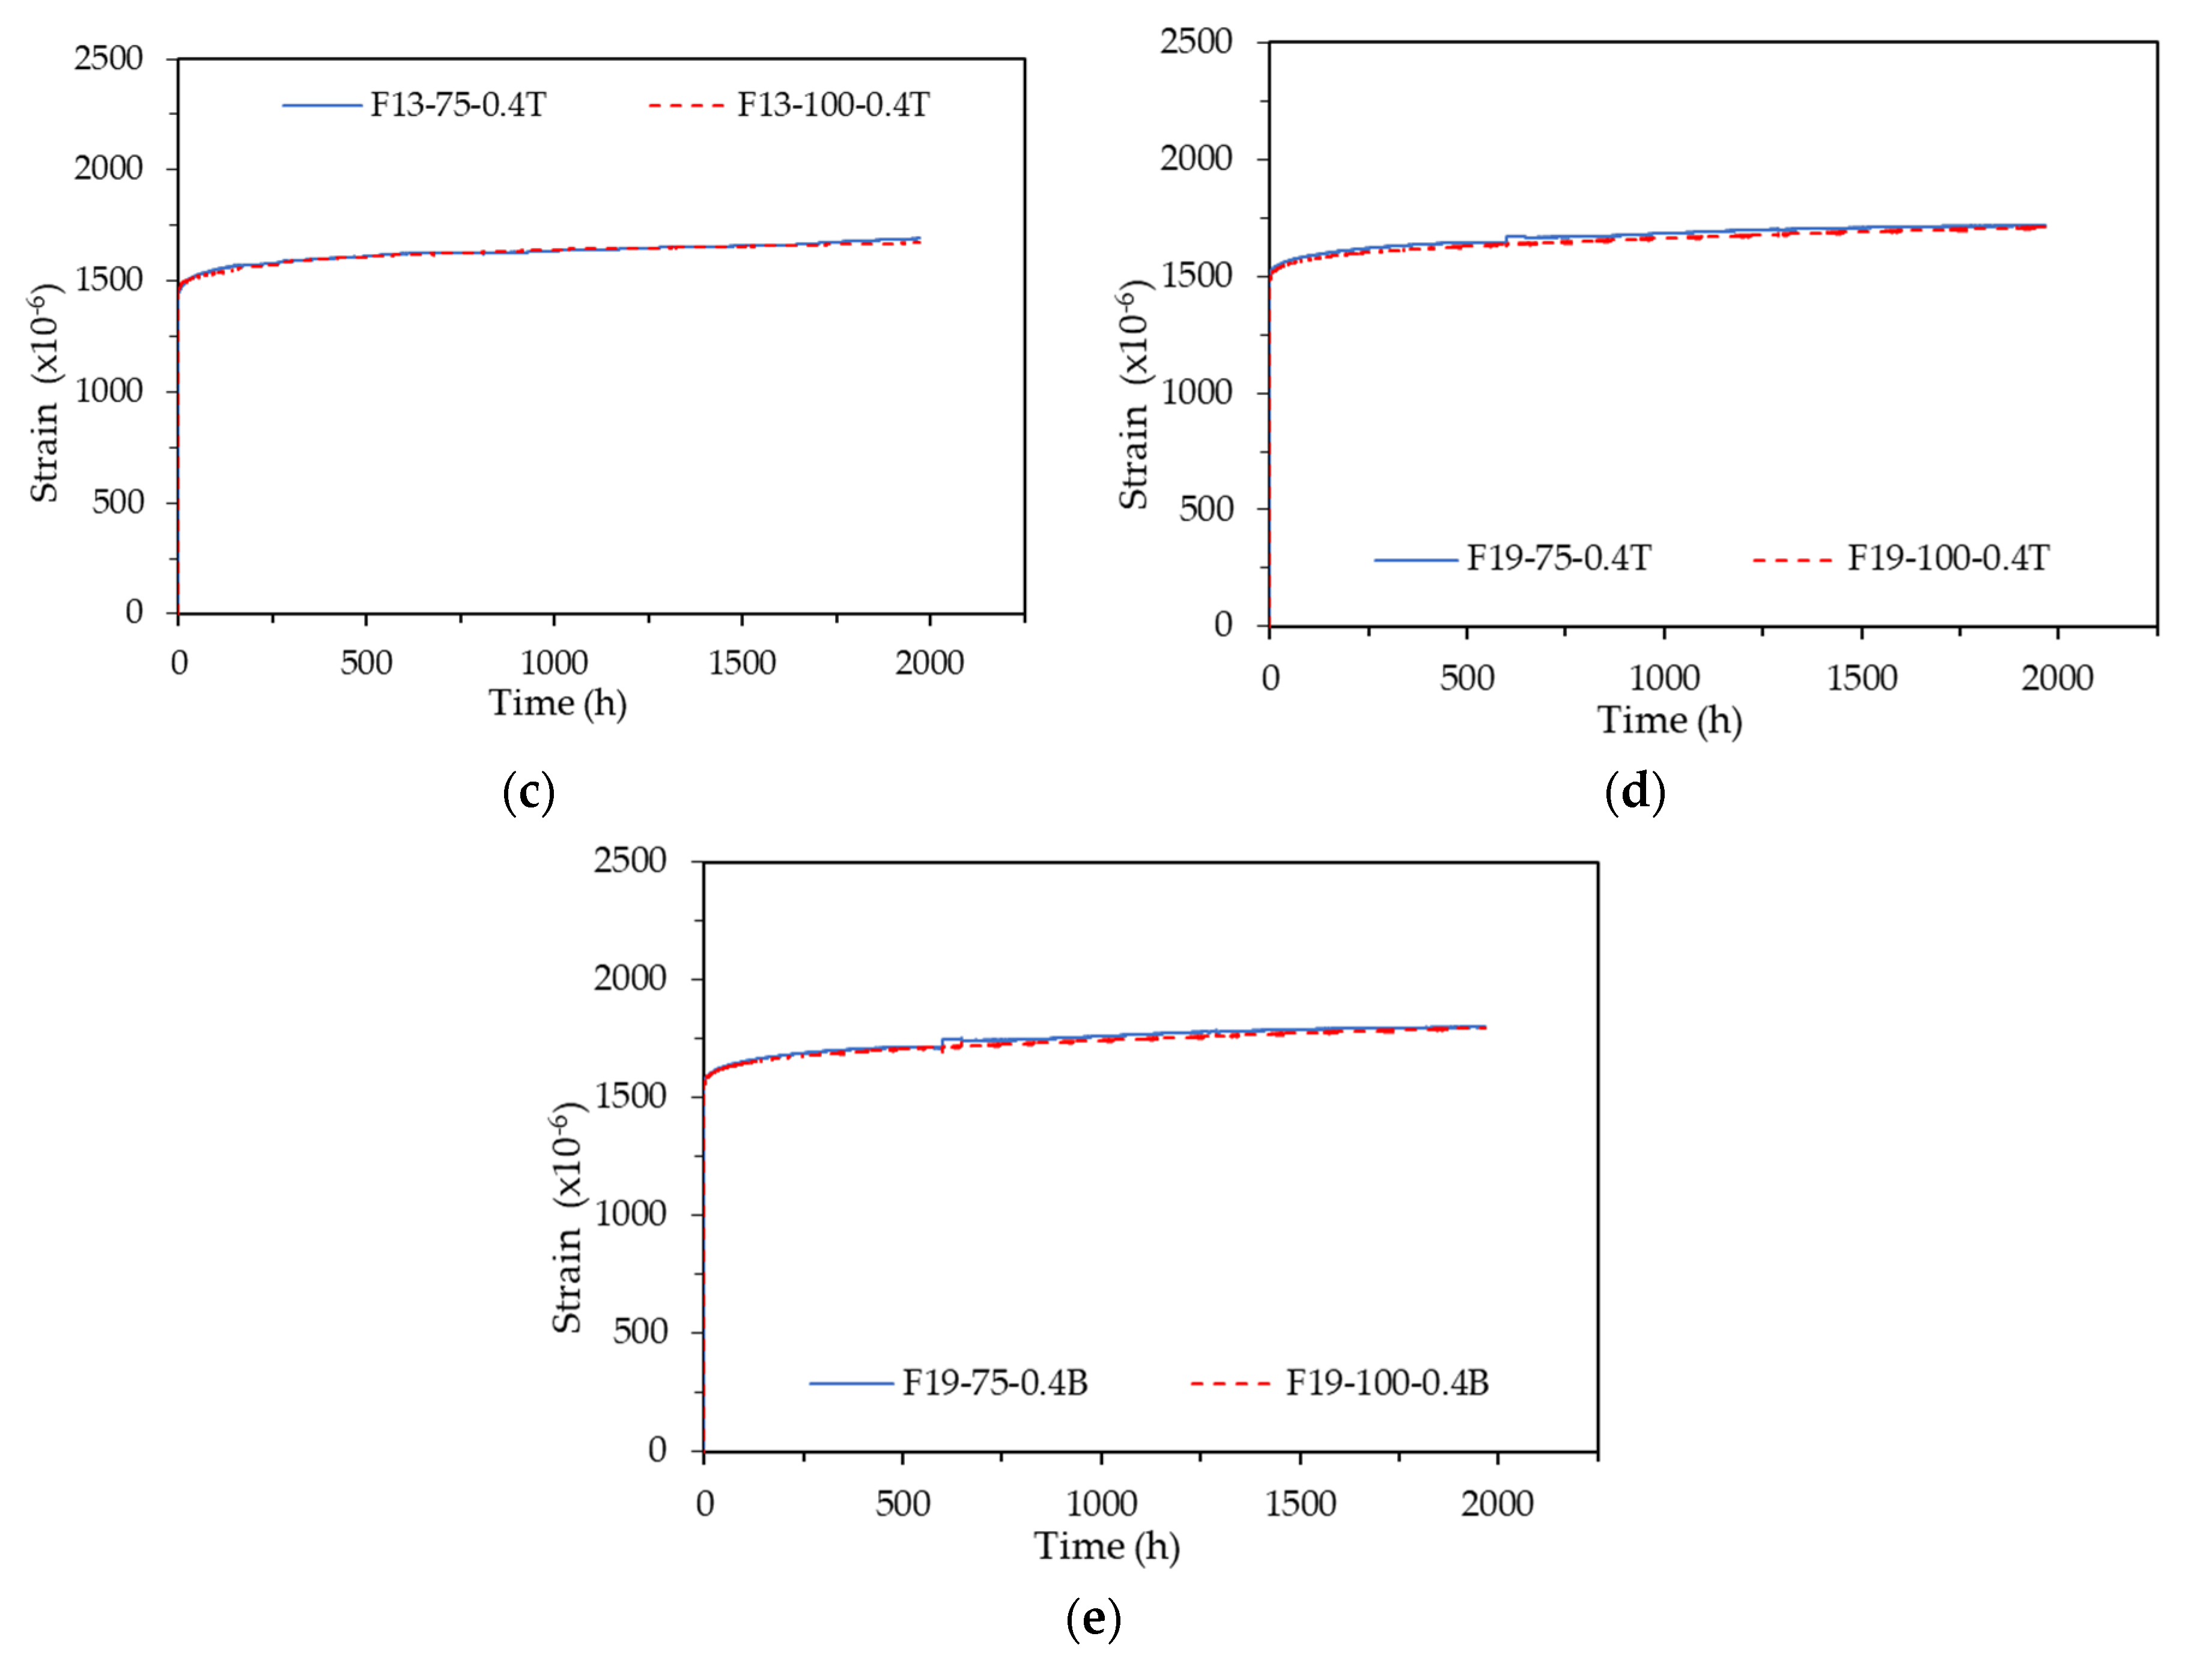
The test specimens for creep measurement were tested with different sizes of ϕ75 mm and ϕ100 mm, and the strain patterns according to the test specimen sizes were divided into the first and second-stage test specimens and are shown in Fig. 10. The strains of all test specimens were measured using the embedded strain gauge.
Examining the results of the F13-0.1T Series, F13-0.2T Series, and F13-0.4T Series, which had no data errors among the first-stage test specimens, the ϕ75 mm and ϕ100 mm specimens exhibited almost identical strain patterns. The second-stage test results similarly showed that both specimen sizes had comparable strain patterns.
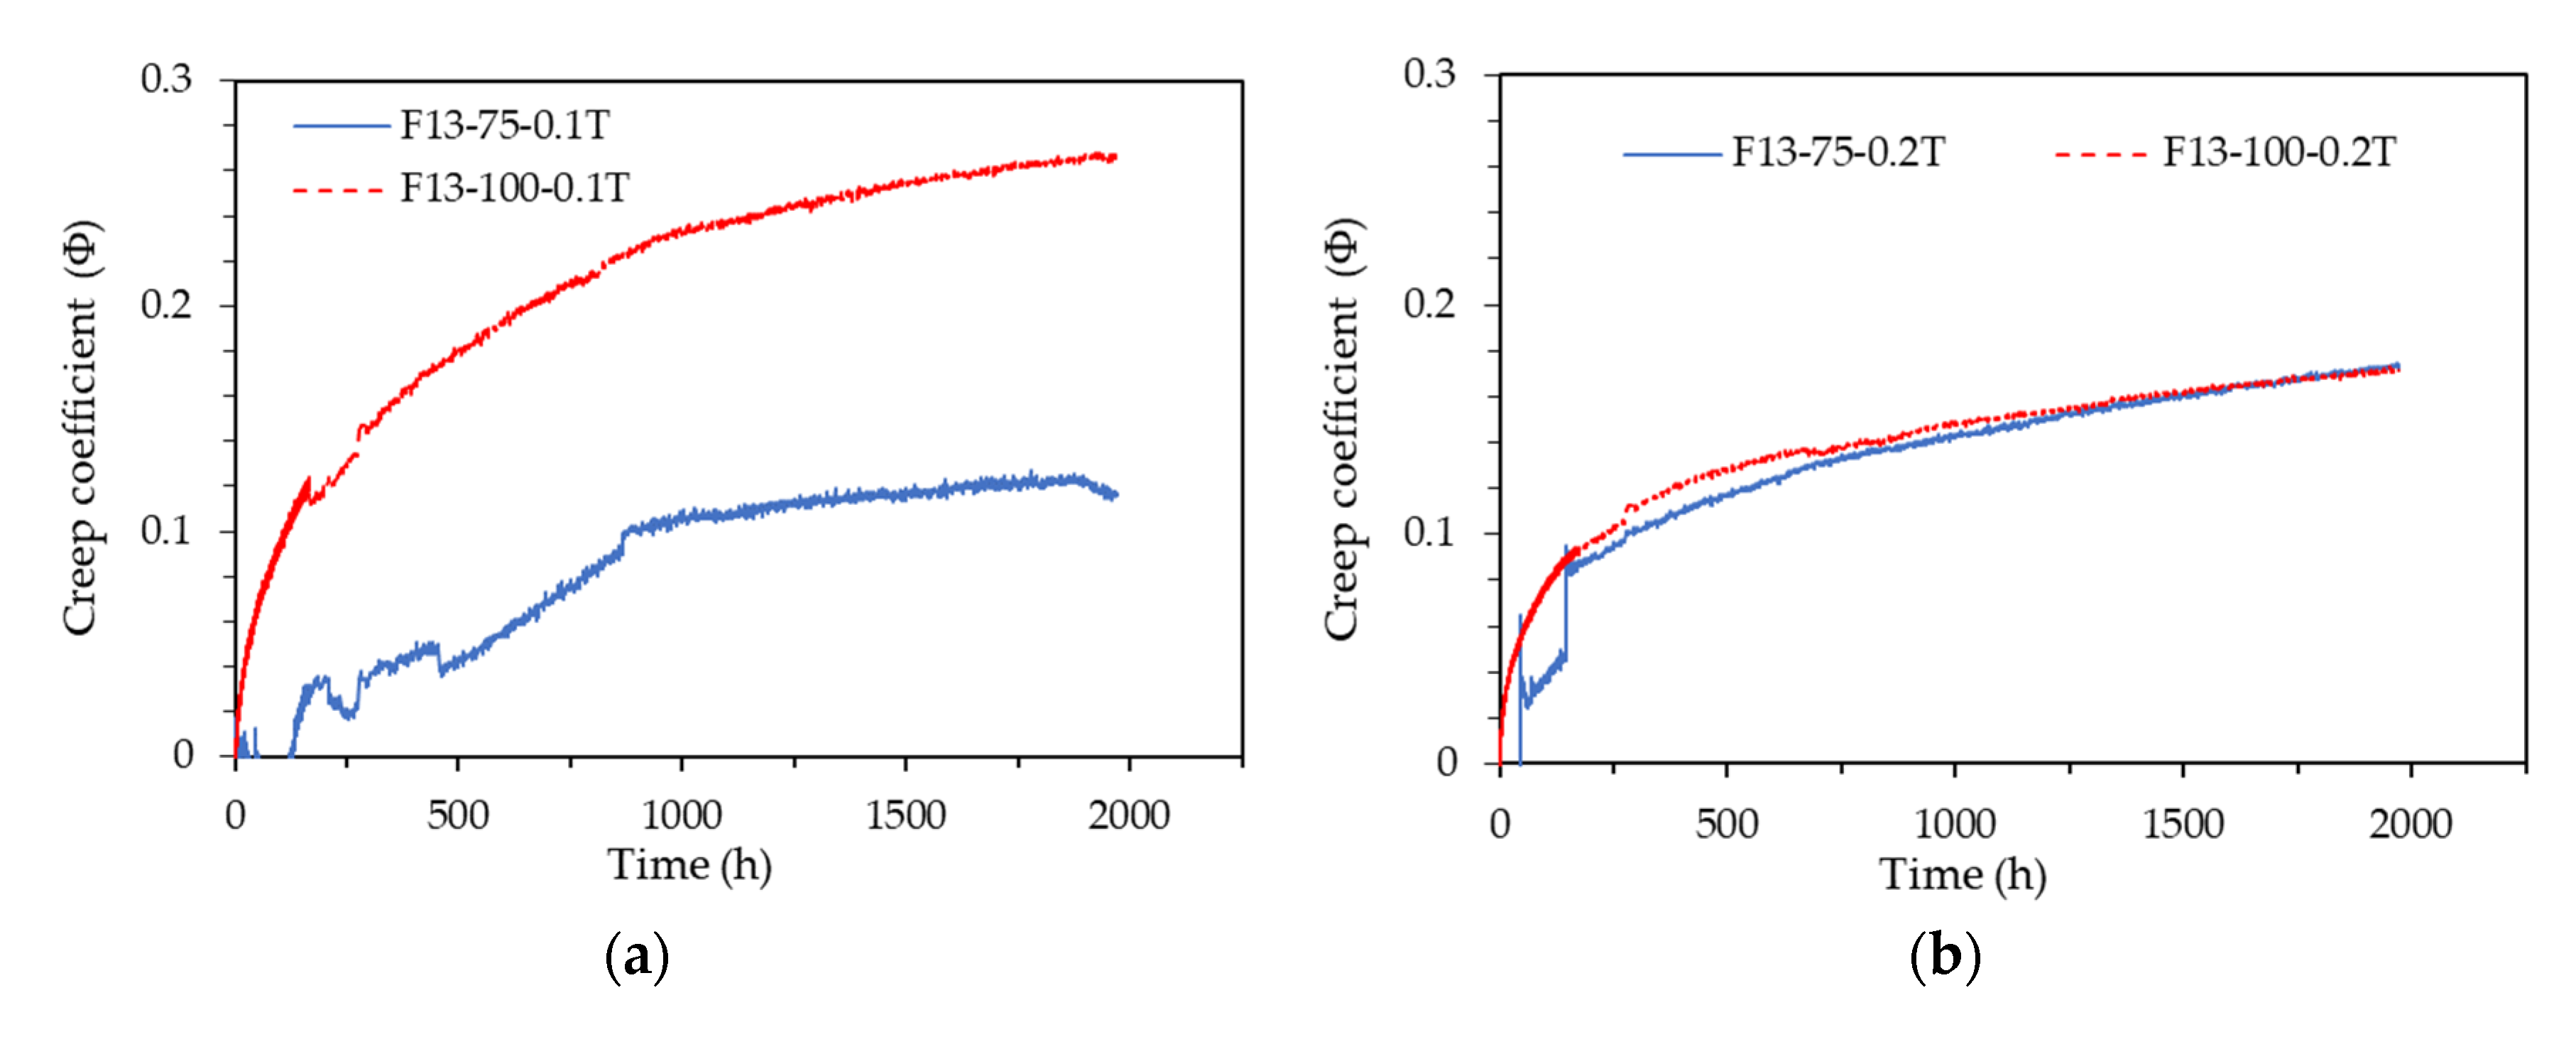
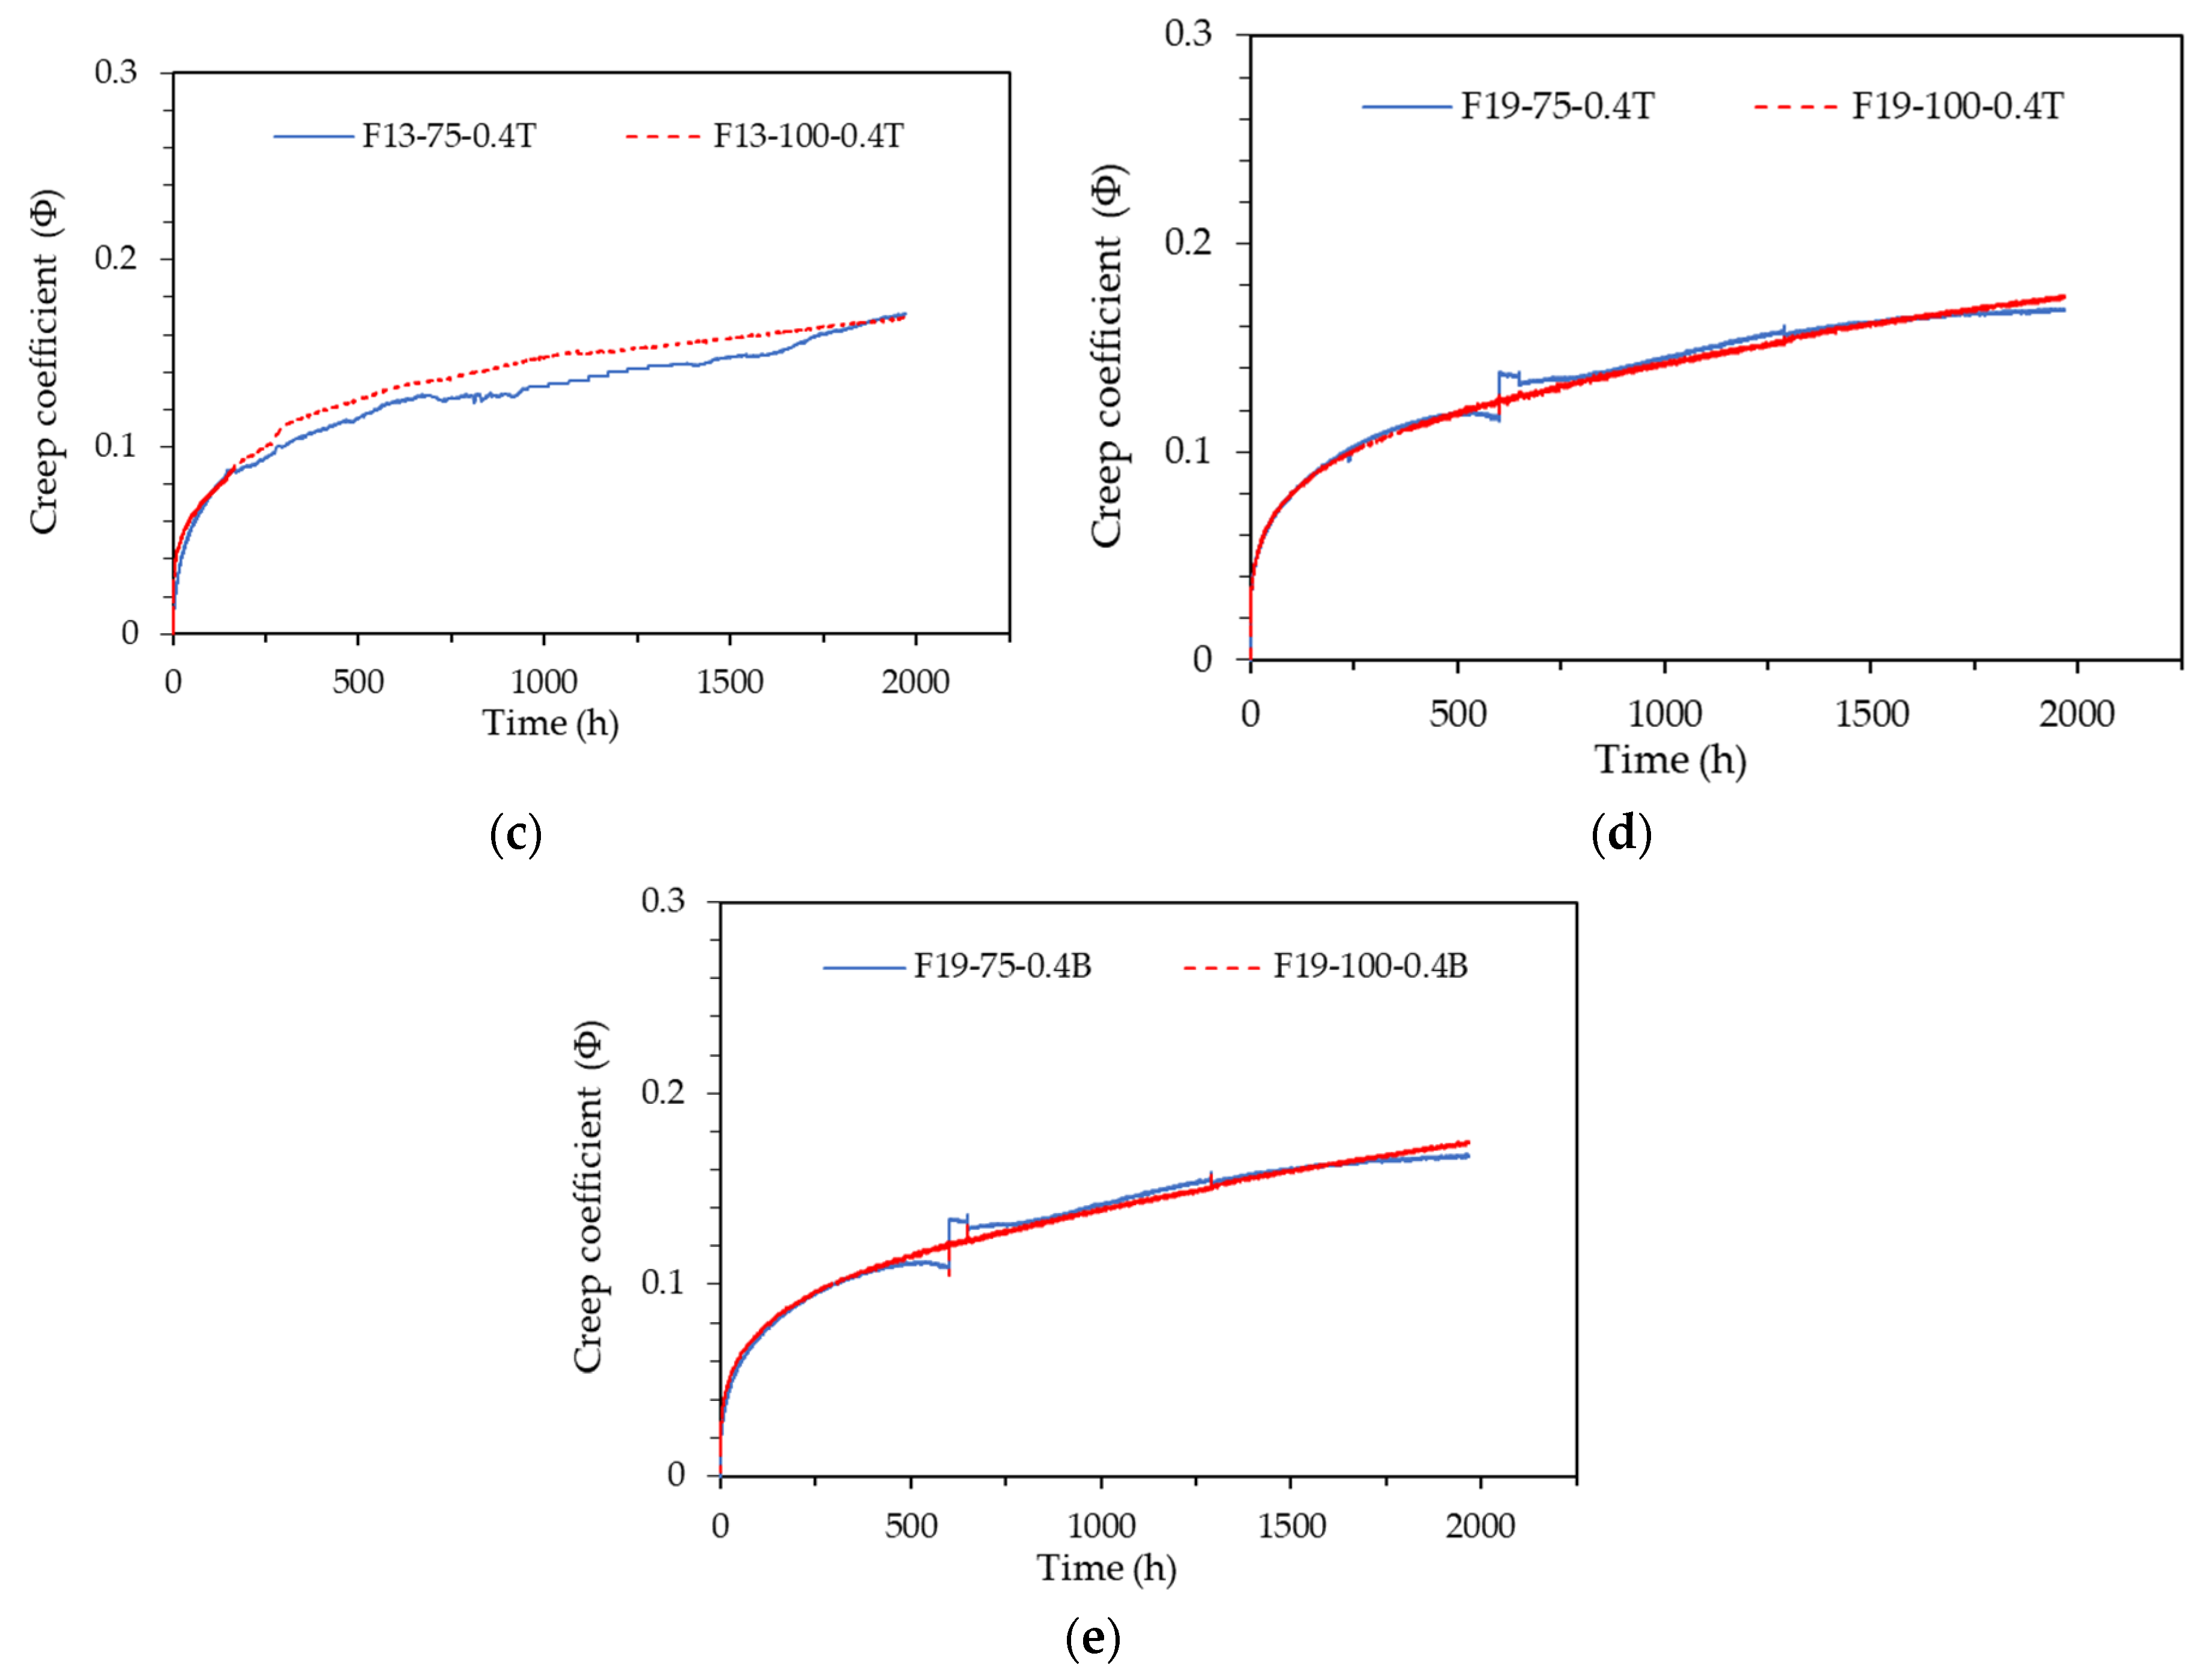
For a more accurate quantitative analysis, the creep coefficient patterns for the F13-0.1T Series, F13-0.2T Series, and F13-0.4T Series among the first-stage test specimens are shown in Fig. 4-11(a)-(c), and the creep coefficient patterns for the F19-0.4T Series and F19-0.4B Series among the second-stage test specimens are shown in Fig. 4-11(d)-(e). As illustrated in Fig. 11, the F13-0.1T Series, which was subjected to a very low load of 10% sustained load, exhibited creep coefficient patterns that varied significantly depending on the specimen size. In contrast, the remaining test specimens showed very similar creep coefficient patterns despite differences in specimen size.
Figure 11.
Creep coefficient pattern according to specimen size: (a) F13-0.1T Series; (b) F13-0.2T Series; (c) F13-0.4T Series; (d) F19-0.4T Series; (e) F19-0.4B Series.
Figure 11.
Creep coefficient pattern according to specimen size: (a) F13-0.1T Series; (b) F13-0.2T Series; (c) F13-0.4T Series; (d) F19-0.4T Series; (e) F19-0.4B Series.
Table 7 summarizes the creep coefficient values of each test specimen at a sustained load duration of 1,967 hours. All test specimens, except for those in the F13-0.1T Series, exhibited a creep coefficient value of 0.17 regardless of the specimen size. Based on these results, it is concluded that test specimens larger than ϕ75 x 150 mm are suitable for measuring the creep of UHPC, this is consistent with the ASTM C1856 [
10] standard.
While most of the ϕ100 mm test specimens demonstrated smooth and consistent graph patterns, most of the ϕ75 mm test specimens displayed data outside the normal range and exhibited fluctuations. These results suggest that the stability of measurement data is compromised when using an embedded strain gauge in a ϕ75 mm test specimen for measuring the creep of UHPC. This may be due to a higher likelihood of errors occurring during the installation of the embedded strain gauge and the casting of concrete within the narrow interior of the ϕ75 mm specimen. Although the creep measurement results were consistent across different specimen sizes, it is considered more desirable to use the ϕ100 mm test specimen rather than the ϕ75 mm specimen when employing an embedded concrete gauge to ensure stable data.
3.4. Effect of Fiber Length
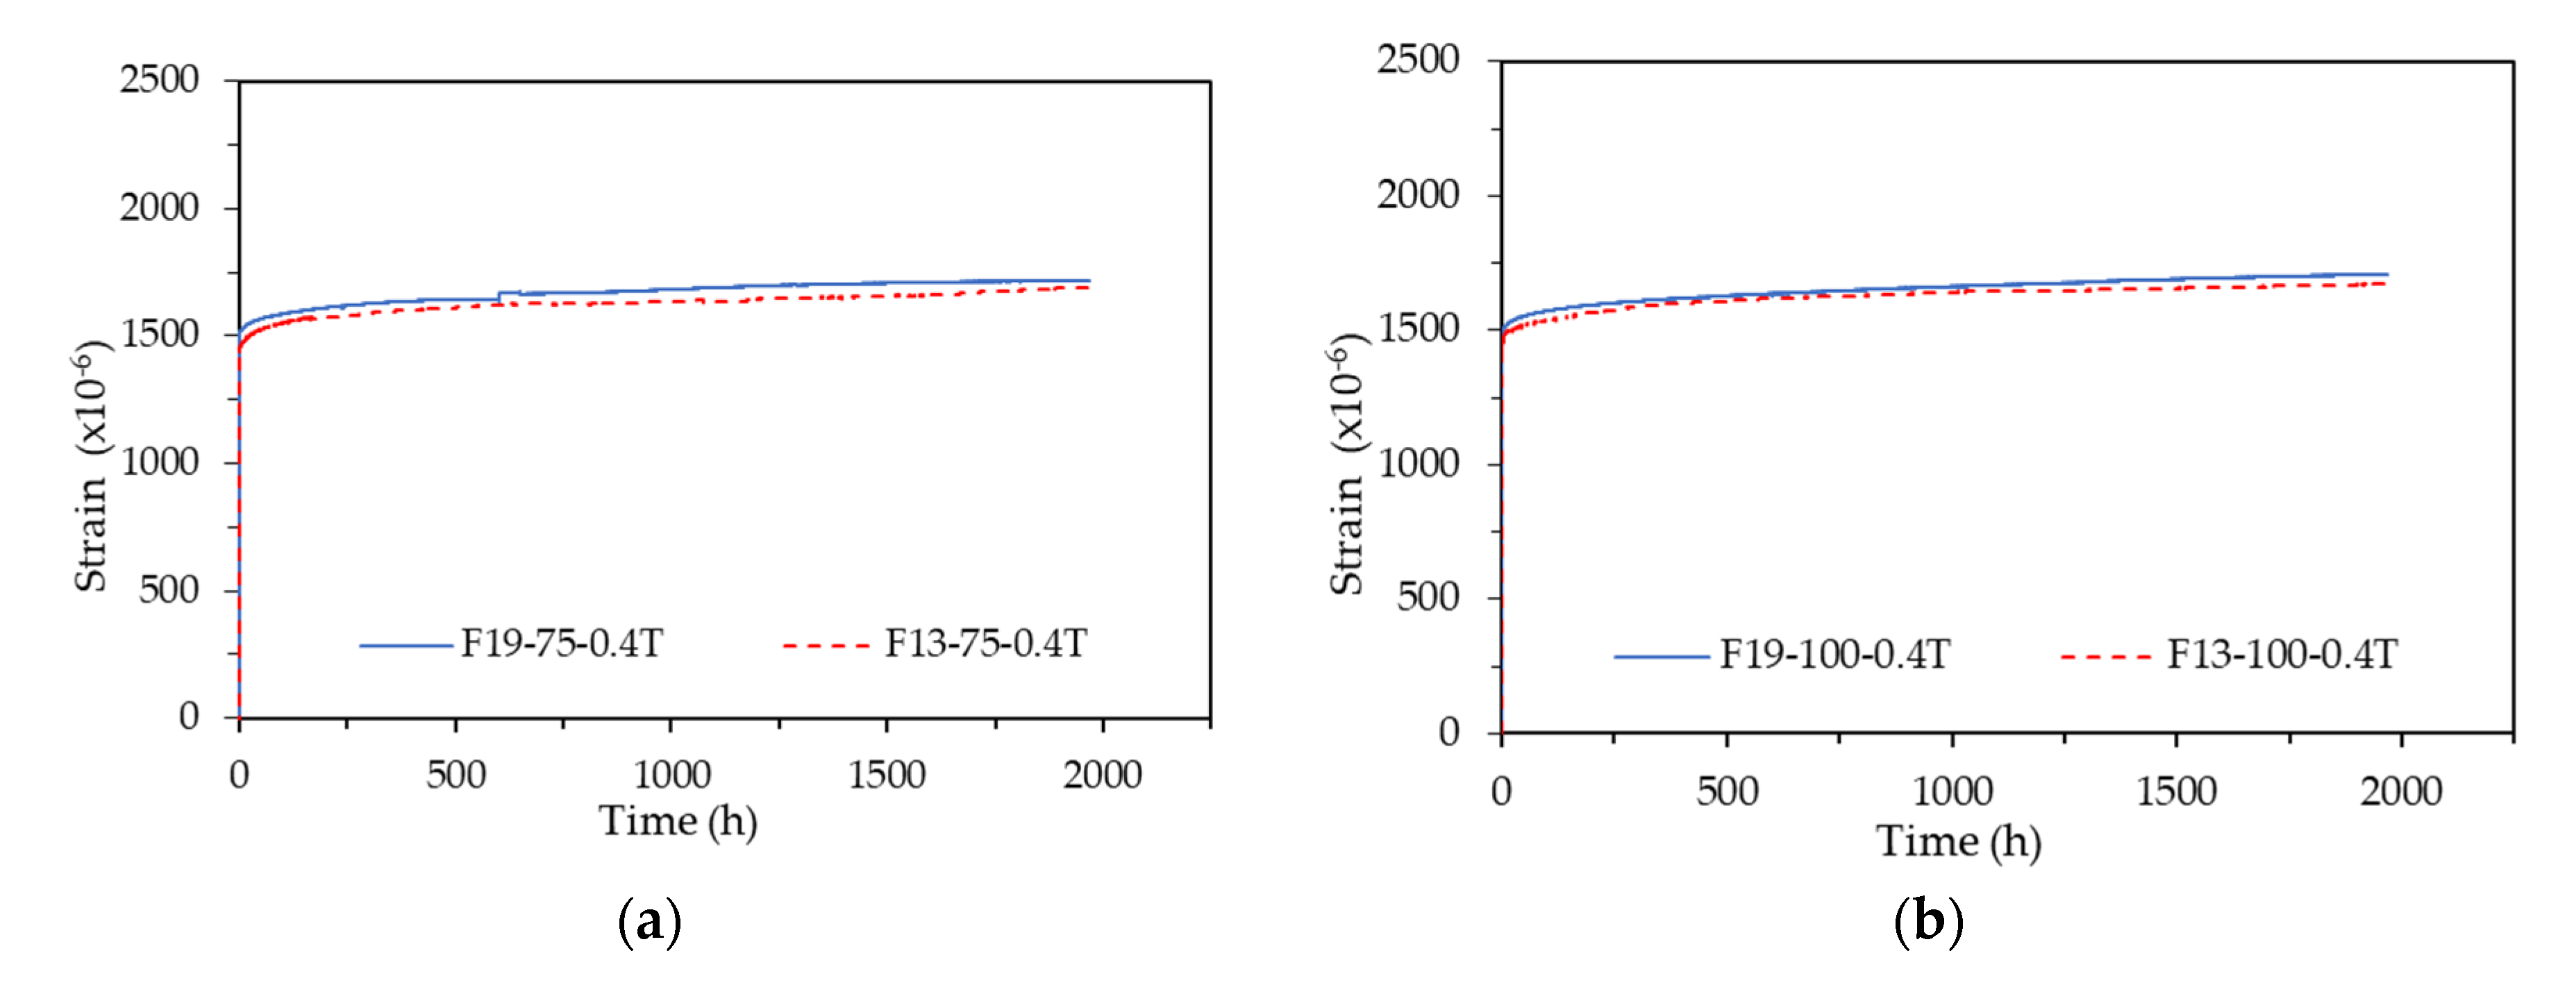
Tests were conducted by varying the length of steel fibers mixed in UHPC to 13 mm and 19.5 mm. The strain patterns according to the fiber length are shown in Fig. 12. The strain of all test specimens was measured using embedded strain gauges. When examining the results of test specimens without data errors, the strain patterns of the specimens mixed with 13 mm fibers were nearly identical to those of the specimens mixed with 19.5 mm fibers.
Figure 12.
Strain pattern according to fiber length: (a) 75-0.4T Series; (b) 100-0.4T Series.
Figure 12.
Strain pattern according to fiber length: (a) 75-0.4T Series; (b) 100-0.4T Series.
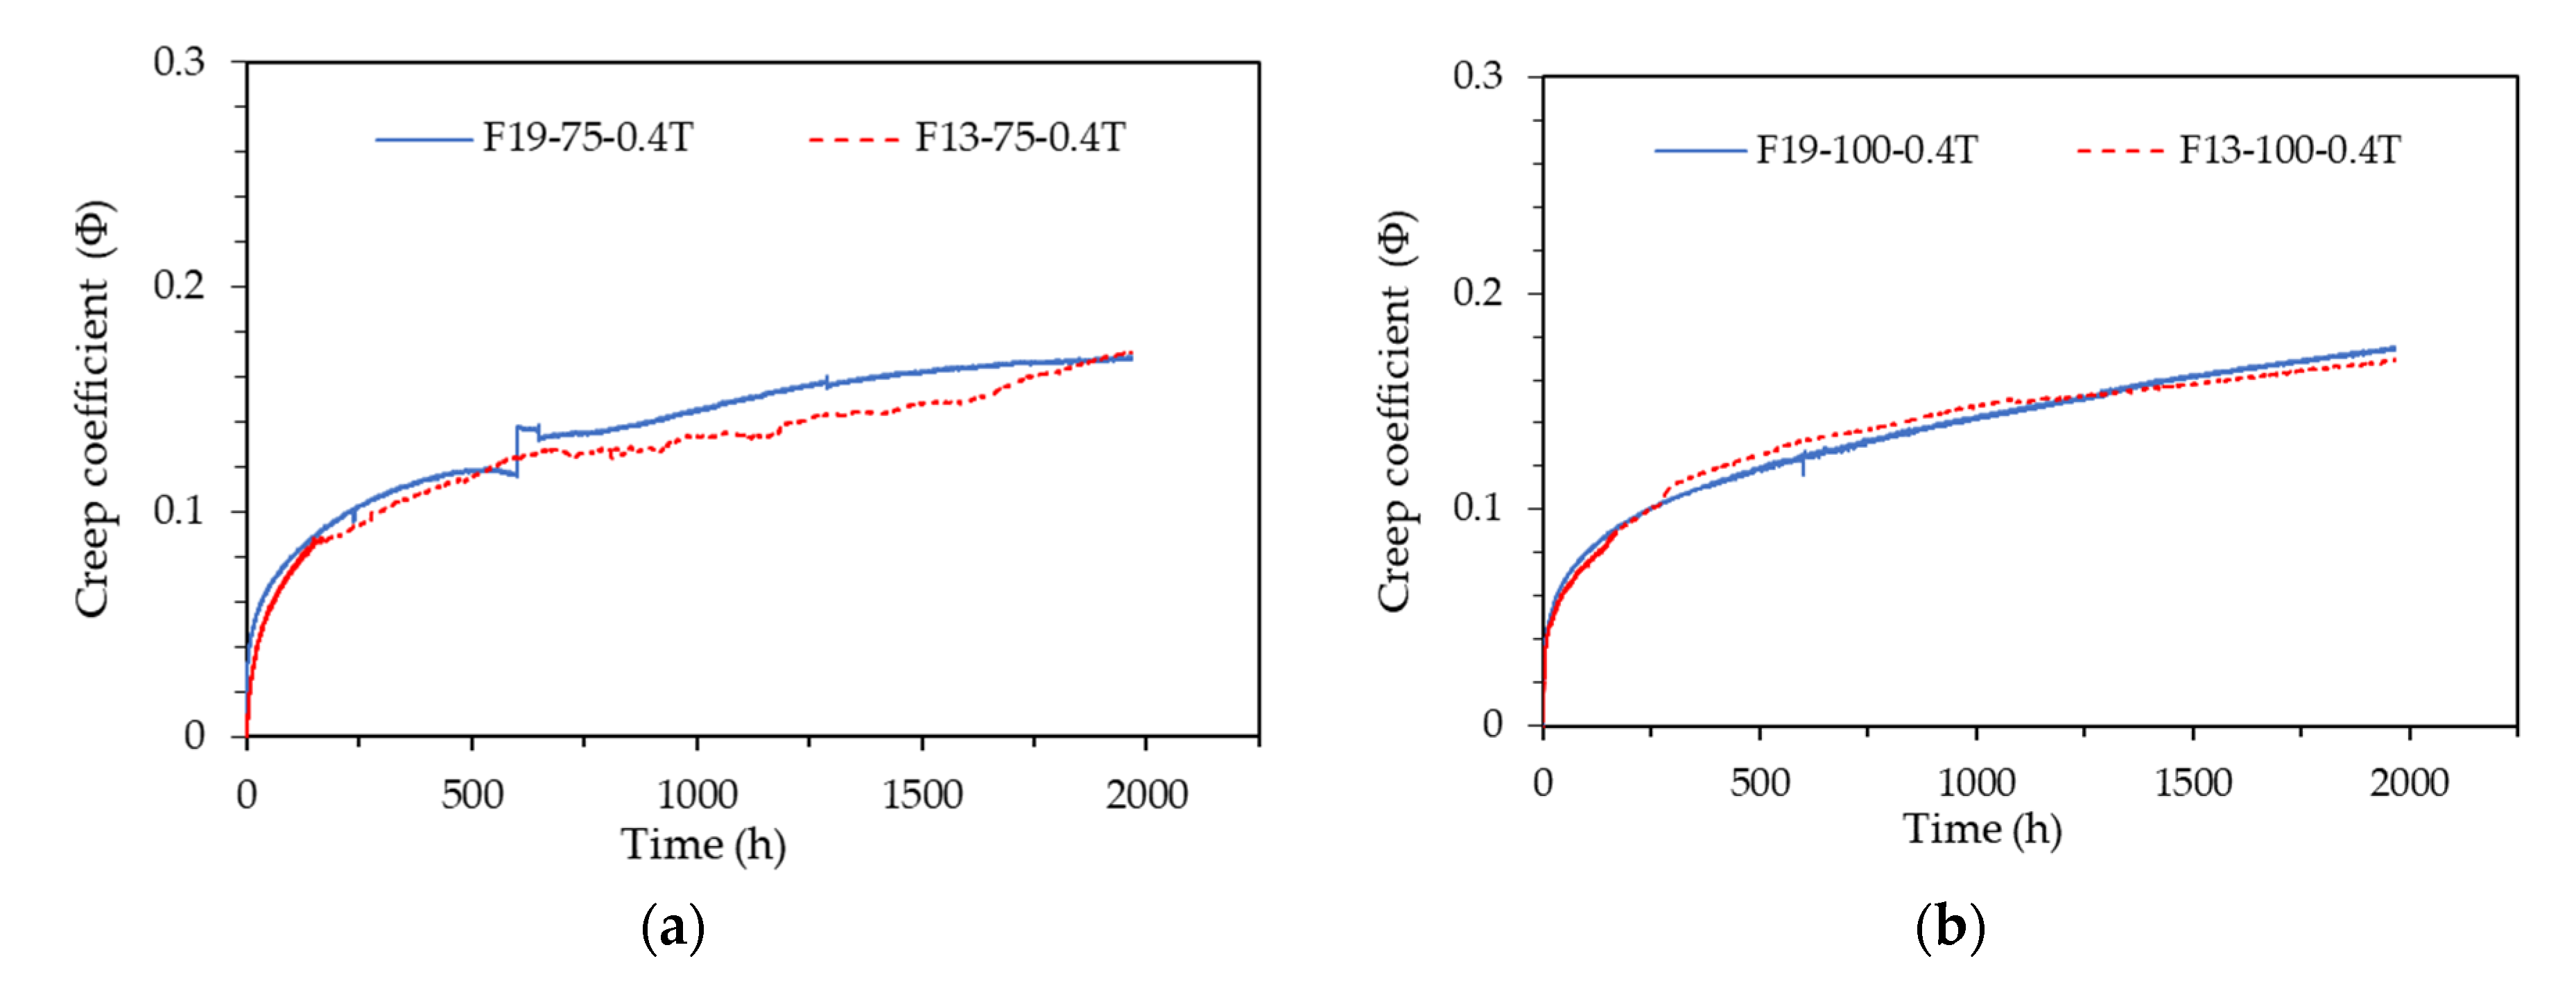
For accurate quantitative analysis, the creep coefficient patterns for the 75-0.4T Series and 100-0.4T Series with no data errors are shown in Fig. 13. As illustrated in Fig. 13, the creep coefficient patterns were very similar despite the difference in fiber length. Figs. 13 and 14 confirm that the elastic strain and creep coefficient of the specimens mixed with 13 mm fibers are slightly larger than those of the specimens mixed with 19.5 mm fibers. This is attributed to the compressive strength of the specimens mixed with 13 mm fibers (198.8 MPa) being approximately 18 MPa higher than that of the specimens mixed with 19.5 mm fibers (180.8 MPa).
Figure 13.
Creep coefficient pattern according to fiber length: (a) 75-0.4T Series; (b) 100-0.4T Series.
Figure 13.
Creep coefficient pattern according to fiber length: (a) 75-0.4T Series; (b) 100-0.4T Series.
Table 8 summarizes the creep coefficient differences according to fiber length at a sustained load duration of 1,967 hrs. All test specimens showed a creep coefficient value of 0.17 regardless of fiber length. Therefore, it was concluded that the fiber length does not affect the creep behavior up to 19.5 mm of steel fiber mixed in UHPC.
3.5. Comparison with Creep Prediction Models
To predict the creep deformation of concrete structures, various prediction equations have been developed and employed, such as the ACI209-92 model [
14], the fib MC2010 model [
15], the B3 model [16-17], and so on. Most of these concrete creep prediction models are semi-empirical, based on experimental data obtained from numerous creep tests. The influencing factors and prediction accuracy considered in each model differ. According to a previous study on the creep of UHPC by Xu et al. [
18], most creep prediction models, except for the B3 model, overestimated the creep deformation of UHPC. The B3 model is a complex model that considers the mixing ratio of concrete, thereby underestimating the creep deformation of UHPC due to the very low water-to-binder ratio of UHPC.
The existing creep models for ordinary concrete are fundamentally based on experimental observations of ordinary concrete and therefore cannot be directly applied to predict the creep deformation of UHPC [
19]. Consequently, numerous efforts have been made to modify these existing creep models based on UHPC creep test data to accurately predict UHPC creep. Xu et al. [
18] and Chen et al. [
20] have proposed creep models specifically for UHPC.
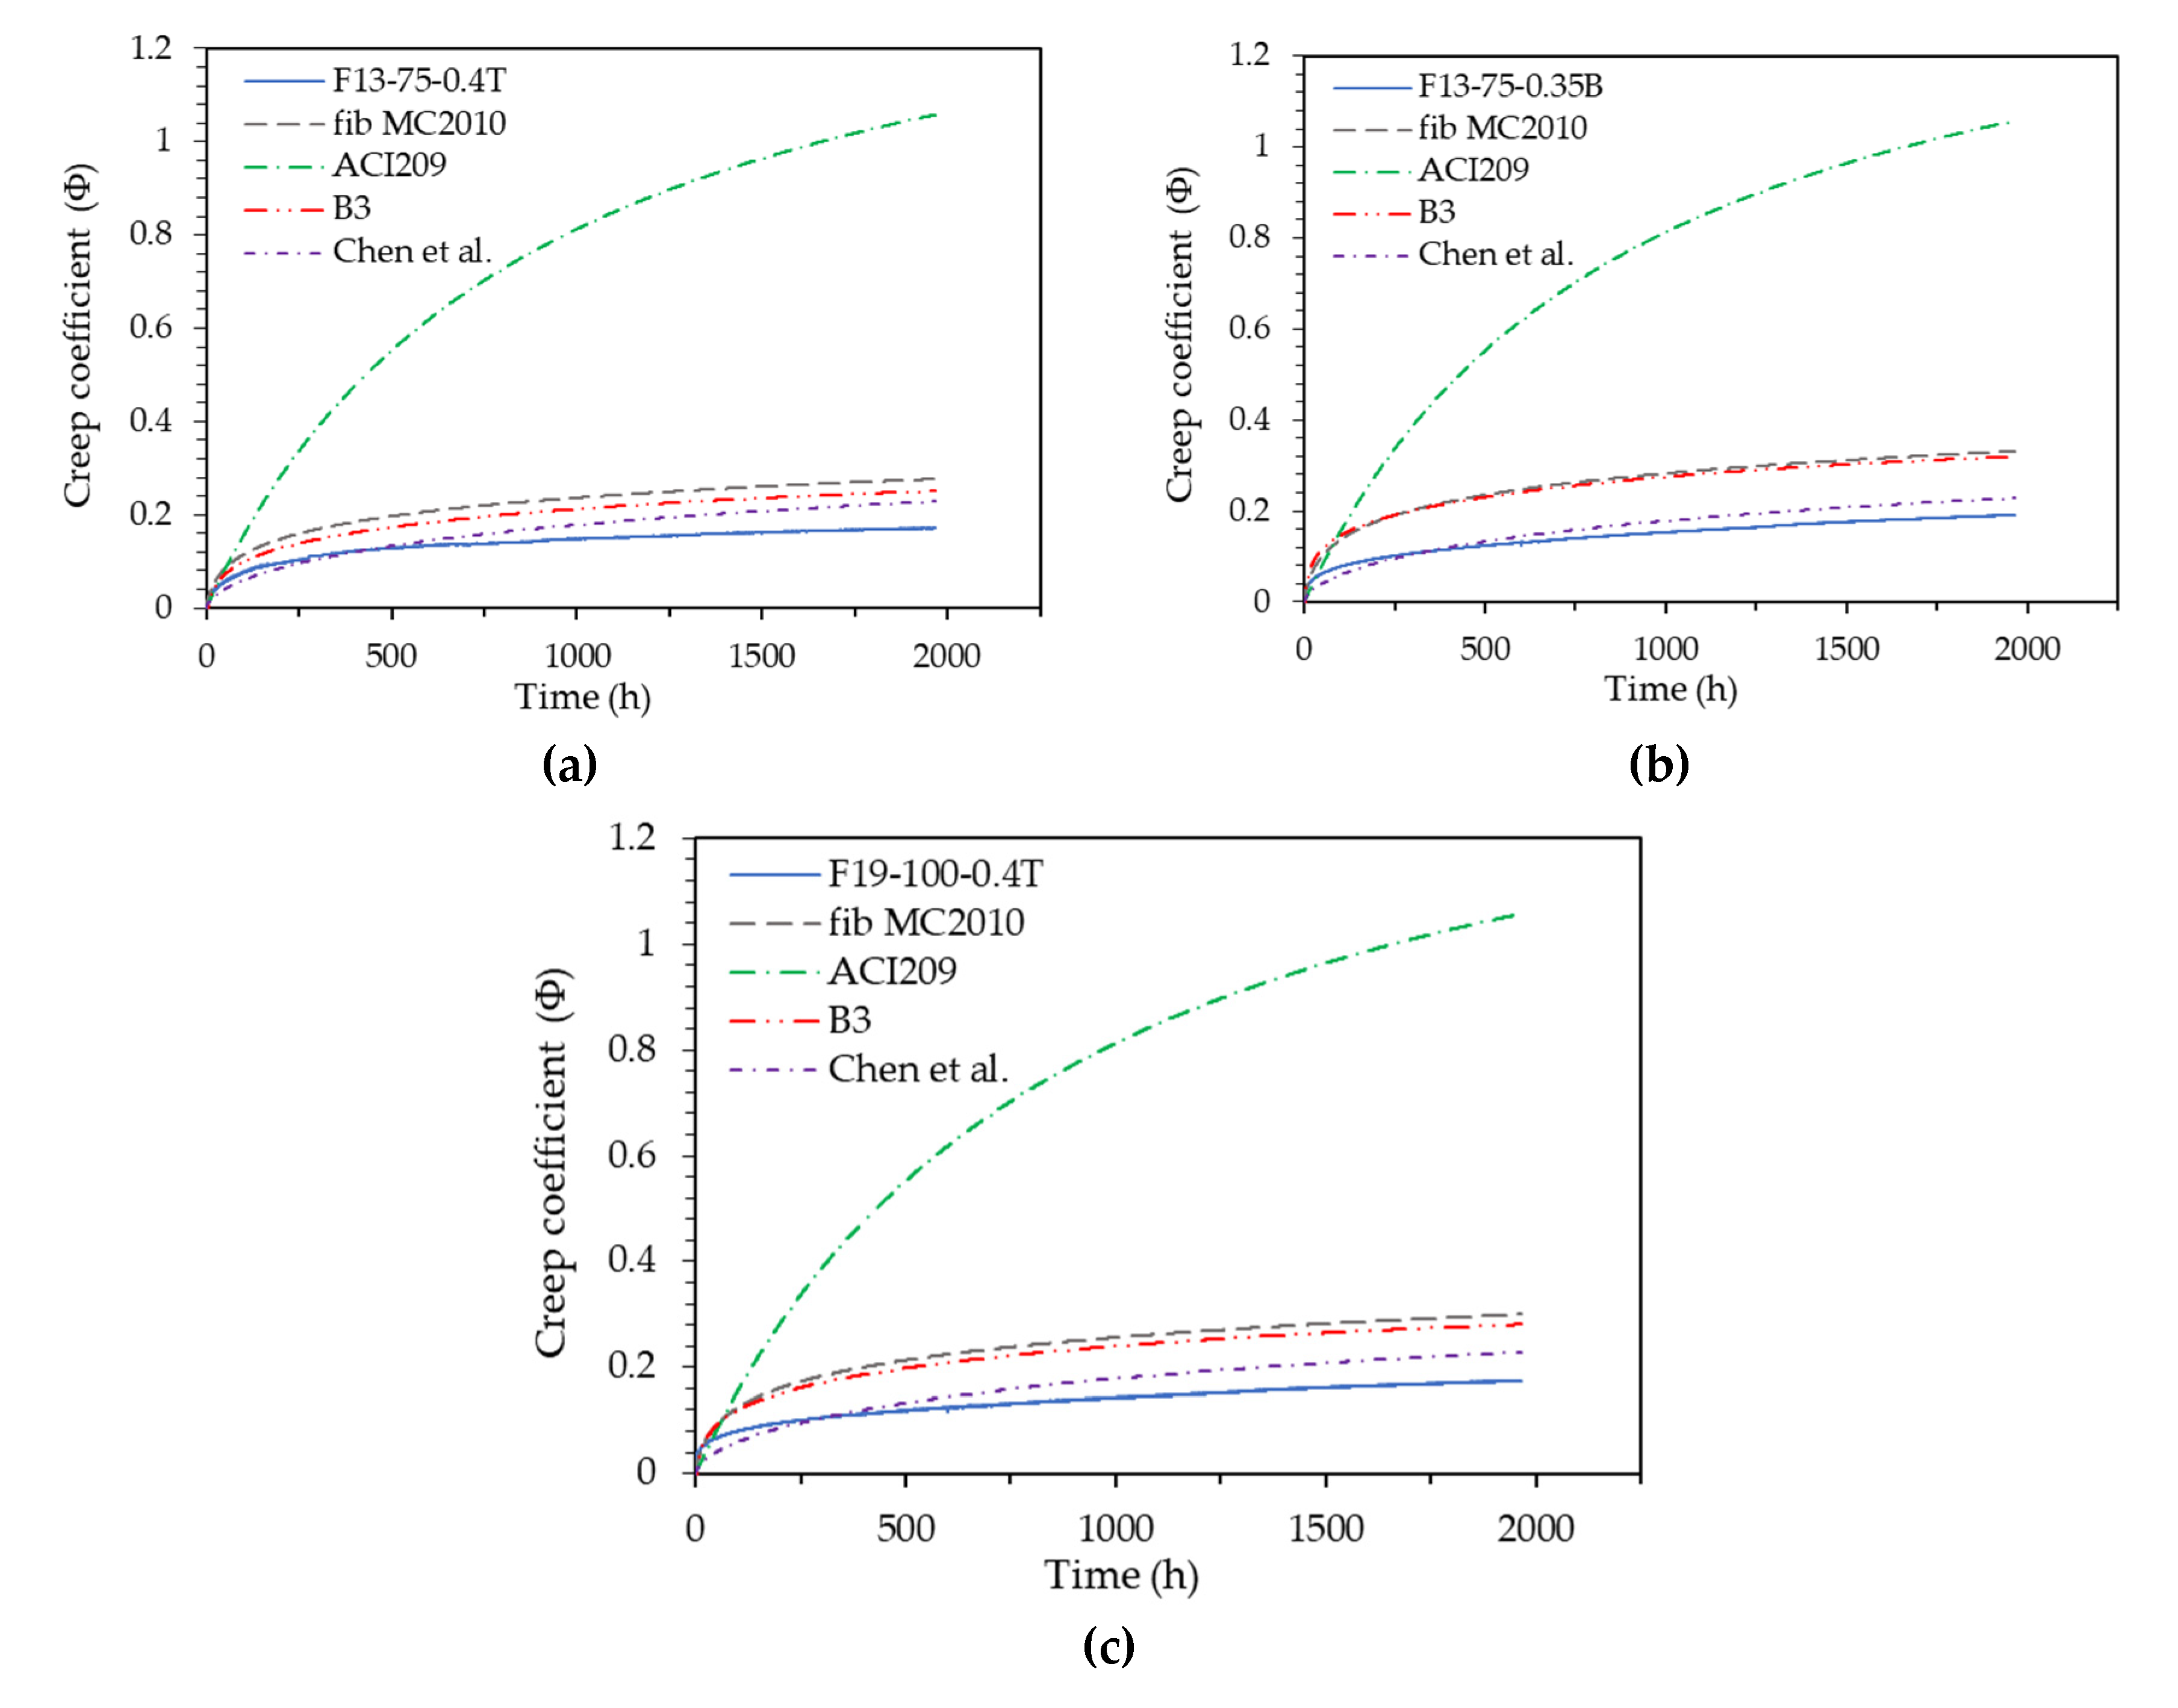
The creep coefficient patterns for representative test specimens F13-75-0.4T, F13-75-0.35B, and F19-100-0.4T in three groups with different compressive strengths are compared with the creep prediction models, which are illustrated in Fig. 14. The creep coefficient measurements of each test specimen and the creep coefficient prediction values of the creep models at a sustained load duration of 1,967 hrs are presented in
Table 9. The creep prediction models used were the ACI209-92 model [
14], the fib MC2010 model [
15], the B3 model [16-17], the Xu et al. model [
18], and the Chen et al. model [
20]. The compressive strengths of the representative test specimens F13-75-0.4T, F13-75-0.35B, and F19-100-0.4T were 198.9 MPa, 160.9 MPa, and 180.8 MPa, respectively.
As shown in Fig. 14, all creep prediction models except for the Xu et al. model [
18] were found to overestimate the creep coefficient of UHPC. In particular, the ACI209 creep model [
14] overestimated the creep coefficient of UHPC the most, with a significant difference of about 5.6 to 6.2 times. Additionally, this model did not account for variations in UHPC compressive strength, resulting in identical creep coefficient predictions for the three groups.
The Chen et al. model [
20], which aimed to predict UHPC creep deformation, overestimated the creep coefficient by 21% to 35% at a sustained loading duration of 1,967 hours and showed the closest prediction result to the actual UHPC creep measurements. However, the pattern of the predicted creep coefficient graph differed from the measured creep coefficient pattern, with the creep deformation being underestimated until approximately 600 hours. This discrepancy arises because the Chen et al. creep model [
20] was developed by modifying the coefficient based on the ACI209 model [
14] and incorporating the fiber mixing ratio factor. Consequently, it is deemed a model that can accurately predict the creep deformation of UHPC with a specific mixing ratio and strength.
The B3 model [16-17] overestimated the creep coefficient by 47% to 68% at a loading sustained time of 1,967 hrs, showing lower accuracy than the Chen et al. creep model [
20]. However, the creep coefficient pattern was very similar to the measured result pattern, and it reflected the influence of the mixing ratio and compressive strength of UHPC well. In addition, the higher the compressive strength, the more accurately the creep coefficient was predicted. The B3 model was found to predict UHPC creep deformation measured in this study best despite the mixing conditions of UHPC used in this study exceeding the B3 model [16-17] application constraints of 0.35 ≤
w/
c ≤ 0.85, 17 MPa ≤
fcm28 ≤ 70 MPa, and 160 kg/m
3 ≤
c ≤ 720 kg/m
3. Where
w is water contents,
fcm28 is compressive strength measured at the age of 28 days, and
c is cement contents.
The fib MC2010 model [
15] showed similar patterns to the B3 model [16-17], but its prediction accuracy was slightly lower than that of the B3 model. The creep coefficient was overestimated by 65% to 76% at the loading sustained time of 1,967 hrs, and the influence of the difference in the compressive strength of UHPC was reflected in the prediction results.
The creep model of Xu et al. [
18] greatly underestimated the creep deformation of UHPC, and predicted a creep coefficient close to 0 at a sustained load duration of 1,967 hrs. This is because the compressive strength of the cylindrical test specimen of UHPC, the subject of creep measurement applied to the development of the Xu et al. model [
18], was relatively low at 130 MPa or less, and the influence factor of the fiber mixing ratio was not reflected. Since the model was developed by simply subtracting the difference of 0.3 between the creep coefficient measurement results and the fib MC2010 model prediction results, it can show very low prediction accuracy depending on the difference in the compressive strength and fiber mixing ratio, and can show non-conservative prediction results.
Figure 14.
Comparison with creep prediction models: (a) F13-75-0.4T; (b) F13-75-0.35B; (c) F19-100-0.4T.
Figure 14.
Comparison with creep prediction models: (a) F13-75-0.4T; (b) F13-75-0.35B; (c) F19-100-0.4T.
4. Conclusions
To verify the existing standard test method for compressive creep of concrete and to present a compressive creep test method suitable for application to UHPC, the strain measuring method, sustained load intensity, specimen size, and fiber length were set as variables and a compressive creep test was performed on UHPC, and the following conclusions were drawn.
1) The strain meter method using a standard rod showed limitations in its use due to errors in the verification process using the standard rod and observation errors of the measurer. Although either method, an embedded strain gauge or an attached strain gauge, can be used to measure the creep of UHPC, it is considered more desirable to use both strain measurement methods simultaneously to ensure correction and reliability of the measurement data.
2) The creep test results according to the sustained load intensity variables of UHPC showed that the creep strain increases in a nonlinear relationship as the applied sustained stress increases. Since data errors are likely to occur at sustained loads of approximately 14% or less of the actual compressive strength, it is considered desirable to load at sustained loads of 15% to 40% of the actual compressive strength.
3) The creep test results for the specimen size variables showed similar creep strain and creep coefficient patterns regardless of the specimen size. Accordingly, it seems possible to perform a compressive creep test for UHPC using a specimen of ϕ75 mm or larger, as in the ASTM C1856 standard [
10]. However, since there is a high probability of errors occurring when installing the embedded concrete gauge in the narrow interior of the ϕ75 mm mold, casting concrete, and setting the specimen when using the embedded strain gauge, it is considered more desirable to use a ϕ100 mm specimen in terms of securing stable data.
4) Through creep tests on the length variables of steel fibers mixed in UHPC, it was found that the length of the steel fibers mixed in UHPC did not affect the creep behavior up to 19.5 mm.
5) The creep deformation prediction results of the ACI209-92 model [
14], fib MC2010 model [
15], B3 model [16-17], Xu et al. model [
18], and Chen et al. model [
20] were compared with the experimental results, and the B3 model was found to be relatively accurate in prediction. The B3 model overestimated the creep coefficient, however, the creep coefficient pattern was very similar to the measured result pattern, and it well reflected the influence of the mixing ratio and compressive strength of UHPC.
Author Contributions
Conceptualization, J.-M.Y.; methodology, J.-M.Y. and H.-M.P.; writing—original draft preparation, H.-M.P. and S.-R.R.; writing—review and editing, J.-M.Y. and O.K.K.; validation, J.-M.Y. and O.K.K.; investigation, S.-R.R.; project administration, O.K.K.; funding acquisition, J.-M.Y. All authors have read and agreed to the published version of the manuscript.
Funding
This work was supported by the National Research Foundation of Korea(NRF) grant funded by the Korea government(MSIT). (No. 2023R1A2C2002761).
Conflicts of Interest
The authors declare no conflict of interest.
References
- Mindess S.; Young J.F., Darwin D. <italic>Concrete</italic>; Prentice-Hall, 2003.
- Aitcin, P.C. The durability characteristics of high performance concrete: a review. <italic>Cem. Concr. Compos.</italic> <bold>2003</bold>, <italic>25(4-5)</italic>, 409-420.
- Li, J.; Wu, Z.; Shi, C.; Yuan, Q.; Zhang, Z. Durability of ultra-high performance concrete – A review. Constr. Build. Mater. 2020, 255, 119296. [Google Scholar] [CrossRef]
- Du, J.; Meng, W.; Khayat, K.H.; Bao, Y.; Guo, P; Lyu, Z.; Abu-obeidah, A.; Nassif, H.; Wang, H. New development of ultra-high-performance concrete (UHPC). Compos. Part B Eng. 2021, 224, 109220. [Google Scholar] [CrossRef]
- Yoo, D.Y.; Shin, H.O.; Yang, J.M.; Yoon, Y.S. Material and bond properties of ultra high performance fiber reinforced concrete with micro steel fibers. Compos. Part B Eng. 2014, 58, 122–133. [Google Scholar] [CrossRef]
- Liu, K.; Song, R.; Li, J.; Guo, T.; Li, X.; Yang, J.; Yan, Z. Effect of steel fiber type and content on the dynamic tensile properties of ultra-high performance cementitious composites (UHPCC). Constr. Build. Mater. 2022, 342(A), 127908. [Google Scholar] [CrossRef]
- Ferdosian, I.; Camoes, A. Mechanical performance and post-cracking behavior of self-compacting steel-fiber reinforced eco-efficient ultra-high performance concrete. Cem. Concr. Compos. 2021, 121, 104050. [Google Scholar] [CrossRef]
- ASTM. Standard test method for creep of concrete in compression; ASTM C512/C512M-15; ASTM International, West Conshohocken, PA, 2015.
- KS. Standard test method for creep of concrete in compression; KS F 2453; Korean Agency for Technology and Standards, Seoul, Korea, 2019.
- ASTM. Standard practice for fabricating and testing specimens of ultra-high performance concrete; ASTM C1856/C1856M-17; ASTM International, West Conshohocken, PA, 2017.
- KCI. Standard test method for manufacturing test specimen for strength test of ultra-high performance concrete; KCI-UC101; Korean Concrete Institute, Seoul, Republic of Korea, 2014.
- ASTM. Standard test method for flow of hydraulic cement mortar; ASTM C1437-20; ASTM International, West Conshohocken, PA, 2020.
- ASTM. Standard test method for air content of freshly mixed concrete by the pressure method; ASTM C231-09; ASTM International, West Conshohocken, PA, 2009.
- ACI Committee 209. Guide for modeling and calculating shrinkage and creep in hardened concrete; ACI 209.2R-08; American Concrete Institute: Farmington Hills, MI, USA, 2008. [Google Scholar]
- Federation international du beton. Model Code 2010; Number Vol. 65 in Fib Bulletin, International Federation for Structural Concrete (fib): 2012.
- Bažant, Z.P.; Baweja, S. Creep and shrinkage prediction model for analysis and design of concrete structures: Model B3. Mater. Struct. 1995, 28, 357–365, 415–430, 488–495. [Google Scholar]
- Bažant, Z.P.; Baweja, S. Creep and shrinkage prediction model for analysis and design of concrete structures: Model B3. <italic>The Adam Neville Symposium: Creep and Shrinkage-Structural Design Effects</italic>, 2000, SP-194, A.
- Xu, Y.; Liu, J.; Liu, J.; Zhang, P.; Zhang, Q.; Jiang, L. Experimental studies and modeling of creep of UHPC, Constr. Build. Mater. 2018, 175, 643–652. [Google Scholar] [CrossRef]
- Huang, Y.; Wang, J.; Wei, Q.; Shang, H.; Liu, X. Creep behaviour of ultra-high-performance concrete (UHPC): A review. J. Build. Eng. 2023, 69, 106187. [Google Scholar] [CrossRef]
- Chen, P.; Zheng, W.; Wang, Y.; Chang, W. Analysis and modelling of shrinkage and creep of reactive powder concrete, Appl. Sci., 2018, 8, 732. [Google Scholar]
|
Disclaimer/Publisher’s Note: The statements, opinions and data contained in all publications are solely those of the individual author(s) and contributor(s) and not of MDPI and/or the editor(s). MDPI and/or the editor(s) disclaim responsibility for any injury to people or property resulting from any ideas, methods, instructions or products referred to in the content. |
© 2024 by the authors. Licensee MDPI, Basel, Switzerland. This article is an open access article distributed under the terms and conditions of the Creative Commons Attribution (CC BY) license (http://creativecommons.org/licenses/by/4.0/).
