1. Introduction
Cement production accounts for approximately 7% of global CO2 emissions, making it one of the most significant contributors to greenhouse gas emissions. In 2021, approximately 2.9 billion tons of CO2 were emitted from global cement manufacturing (Chaudhury et al., 2023). The total volume of cement production worldwide is estimated to be 4.1 billion tons in 2023. The nation is currently working to eradicate CO2 emissions from the cement industry. The industry aims to reach a net zero emissions target by 2050 (Supriya et al., 2023). Geopolymers are an innovative new zero-cement technology used in construction. It is an environmentally friendly concrete. By implementing geopolymer concrete, it is possible to significantly reduce the impact of the carbon footprint. The numerous benefits of geopolymers include their affordability, high material efficiency, ecological sustainability, fire resistance, chemical corrosion resistance, high mechanical strength, and excellent durability (Aiken et al., 2018; Aliques-Granero et al., 2019; Lahoti et al., 2019; Liu et al., 2020c; Shill et al., 2020; Vafaei et al., 2018). Self-compacting concrete (SCC) has gained popularity in construction due to its excellent workability, minimal need for manual labour, improved finish quality, and ability to address mechanical vibration issues and associated noise pollution in urban areas (Skender et al., 2021). SCCs also pass through rebars and consolidate under their weight without segregation or bleeding, exhibiting exceptional flowability. SCGC offers the advantages of both self-compacting concrete and geopolymer concretes. It combines the flowability and self-compacting qualities of SCC with the high performance and environmental benefits of geopolymer binders (Yamini J. Patel et al., 2018). To overcome the challenge of compaction of geopolymer concrete owing to its highly viscous nature, self-compacting geopolymer concrete (SCGC) has evolved these flows and compacts by weight, avoiding the requirement for additional compaction. However, SCGC is still an area of ongoing research and development, and its practical applications may vary based on specific project requirements and available materials.
Fly ash is a fine powder that is produced by electric power plants. Fly ash generation leads to environmental issues, such as landfills and carbon footprints. (Mugahed Amran et al., 2021). Fly ash binders take longer to harden because they contain little calcium. Adding slag to geopolymer concrete mixes can help them become faster (Far H et al., 2022). Class C fly ash was added to strengthen the SCGC-C mortar samples. This makes the mortar less porous, creating a dense geopolymer structure (Ganeshan et al., 2018). A significant quantity of industrial byproducts, such as GBFS from steel manufacturing and FA from coal-fired power generation plants, are generated annually worldwide by utilizing these surplus byproducts as binders in SCGC production, the expenses and ecological impacts linked to their disposal can be avoided. The mechanical properties of the SCGC were improved by adding GGBFS at higher levels. This led to a low load displacement and high peak load because the ductility of the concrete decreased as its compressive strength increased (Saad et al., 2018). Kashani et al. (2019) studied the development of self-compacting concrete (SCC) using finer binder materials; however, the study addressed the compressive strength.
SCGC is challenging owing to its stiff matrix and rapid hardening. According to the EFNARC guidelines, Muhd et al. (2018) computed the mix proportions and developed mix calculations for SCGC. The dosage of the super plasticizers and the amount of additional water affected the workability of the freshly prepared SCGC. Self-compacting geopolymer concrete is ready for commercial use and does not require high curing temperatures (Sherin et al., 2021). The effect of the curing temperature on the SCGC strength of SCGC specimens compressed with fly ash revealed that the compressive strength increased as the temperature increased from 60°C to 70°C. As the temperature increases above 70°C, the strength decreases according to Memon et al. (2021). The compressive strength of the sample was enhanced when the molarity of the NaOH solution was increased from 8 to 12 M, according to an investigation of the influence of NaOH molarity on SCGC. However, the strength decreased when the molarity increased from 12 to 14 M. The strength decreased as the polymerization rate decreased with increasing NaOH concentration (Krishnan et al., 2019).
ANN approaches have demonstrated high accuracy in their ability to forecast experimental data, with only a minimum number of errors (Awoyera et al., 2020). Compared with ordinary concrete, SCGC offers several advantages in terms of manufacturing and placement. These advantages include the elimination of external or internal vibrations for compaction; significantly improved flowability, workability, and pumpability; and greater bonding with crowded reinforcements. Owing to the lack of established standards, SCGC has not yet been widely implemented in the construction industry, so it remains a concept in its early stages of development. This study addresses the challenges associated with self-compacting geopolymer concrete, optimizing rheological properties, enhancing workability, refining material selection, and establishing standardized testing procedures. The ultimate goal is to contribute to the development of a sustainable and easily implementable construction material that aligns with global efforts to minimize the ecological consequences of the construction sector. This study aimed to develop an optimum mix of proportions for the M30 grade. The effect of three different sodium hydroxide concentrations (8 M, 10 M, and 12 M) with a fixed ratio of sodium silicate (SS) to sodium hydroxide (SS/SH) of 2.5 was examined.
2. Materials
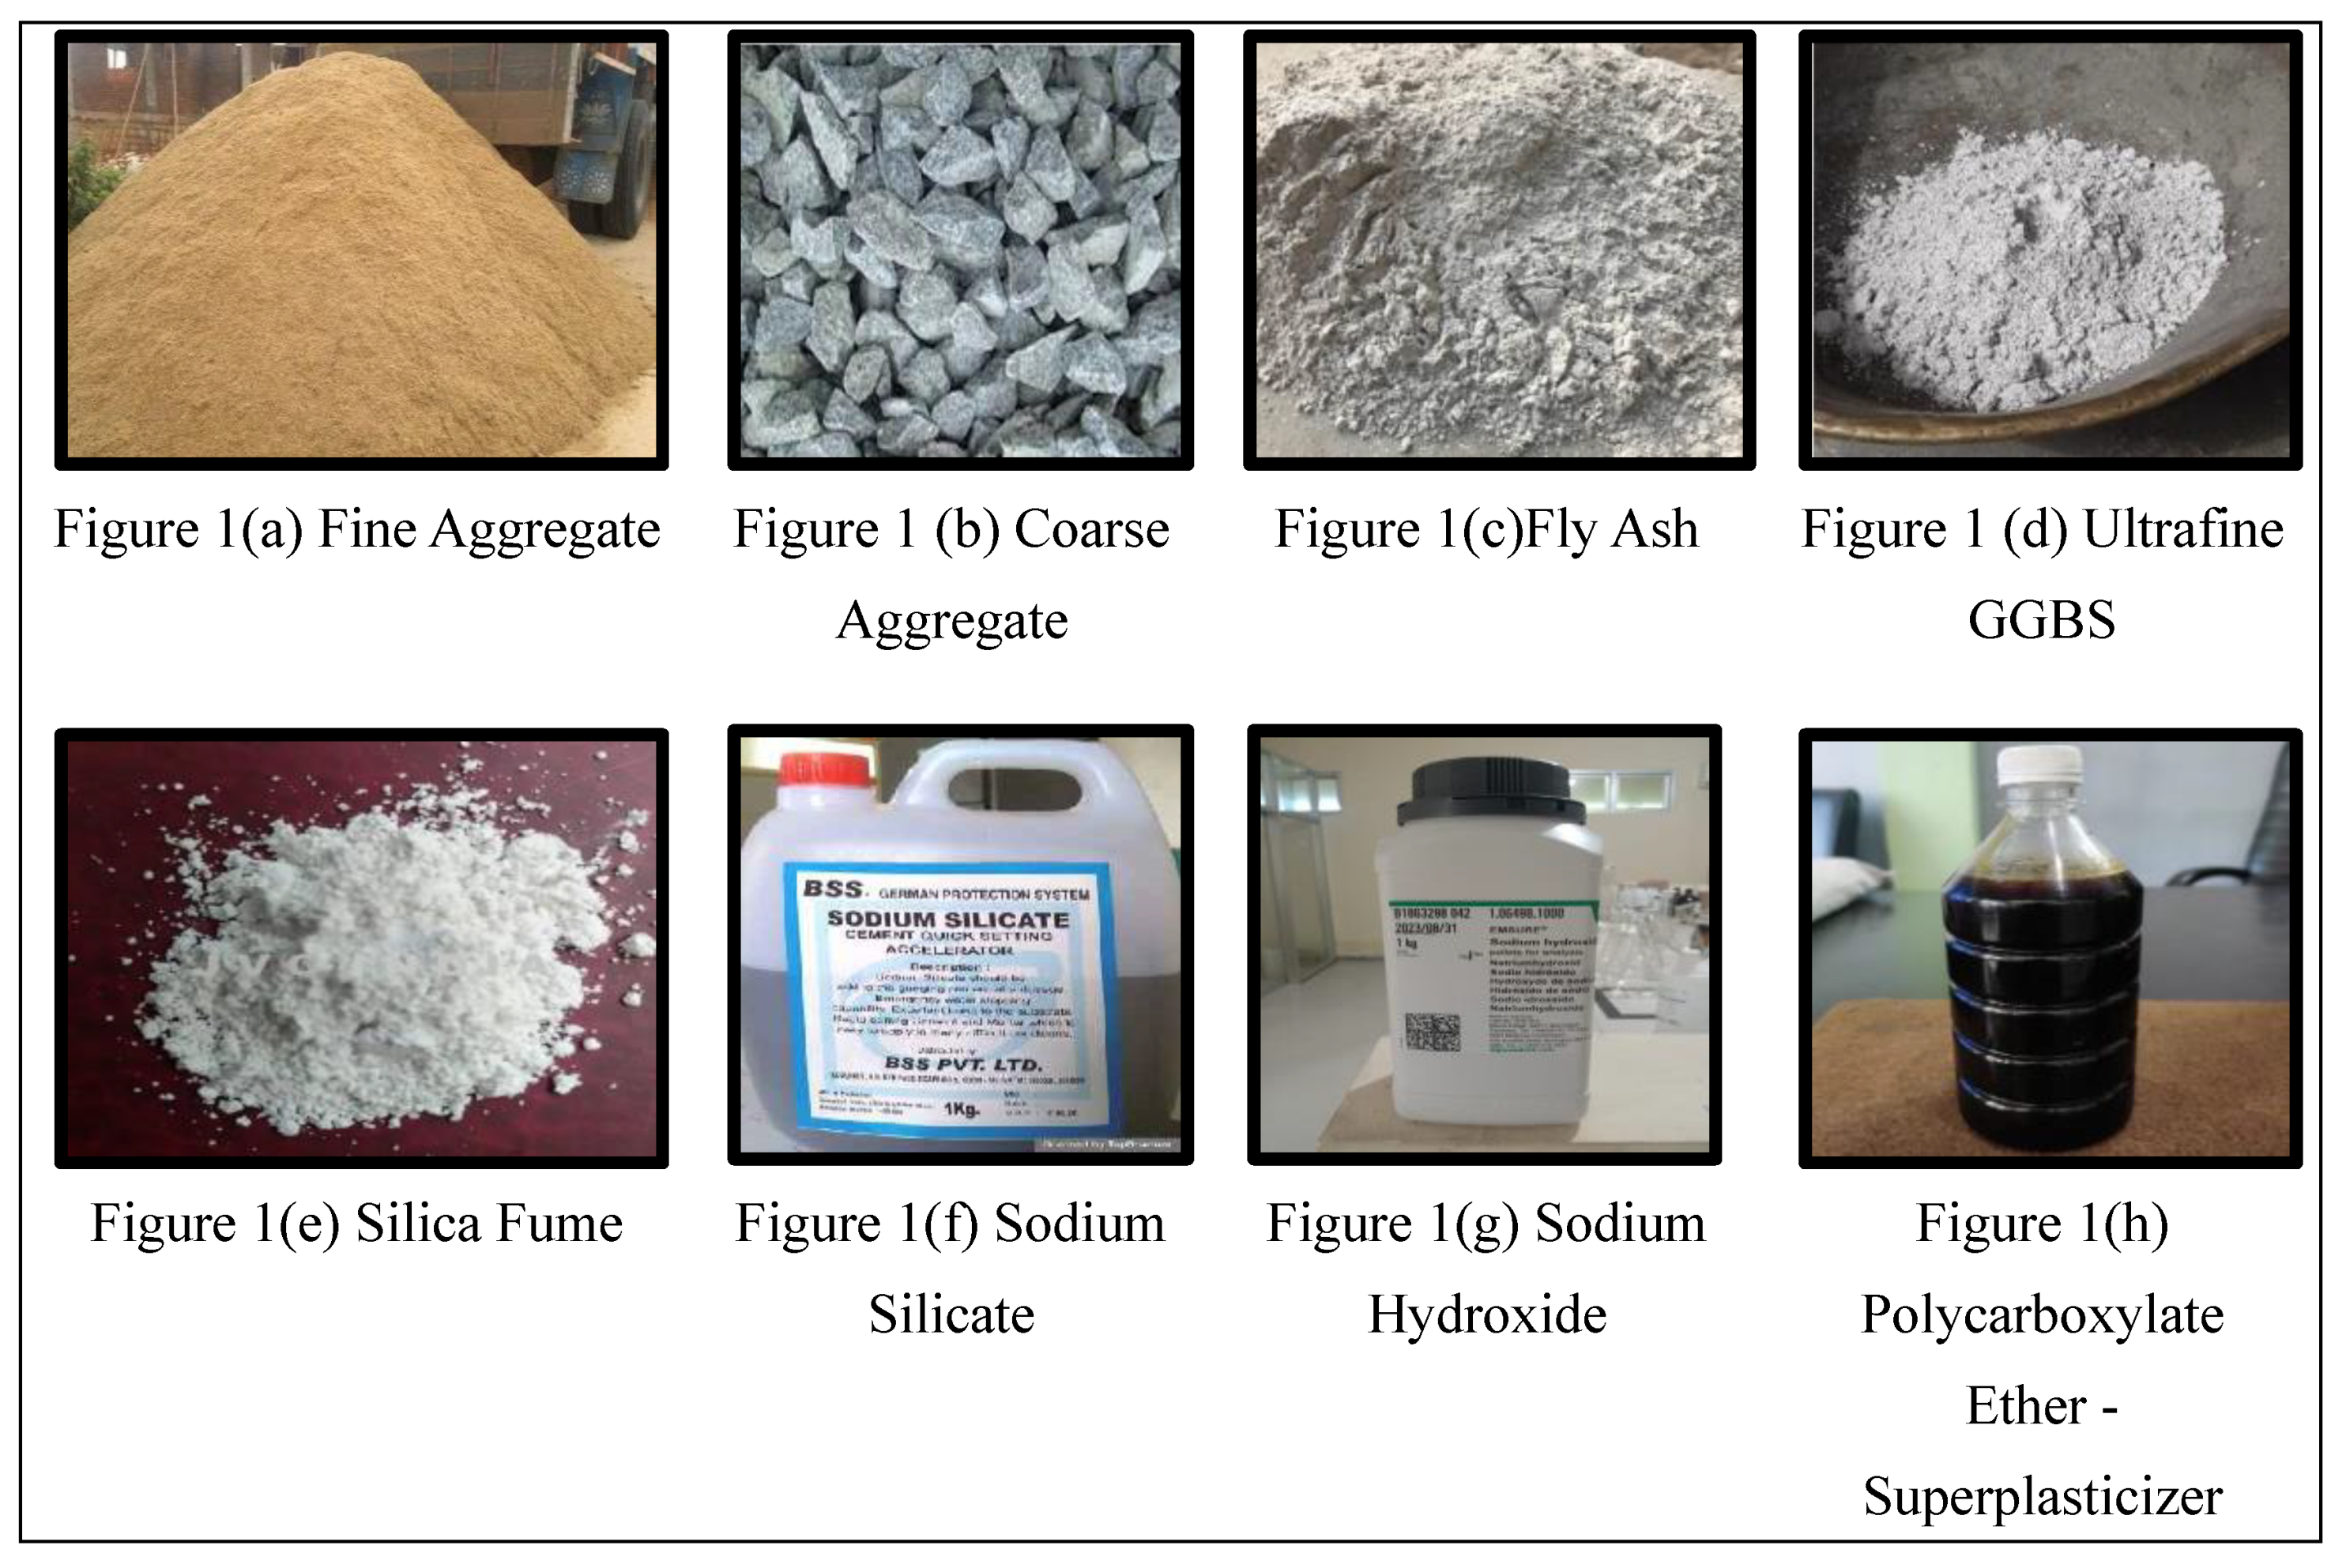
This study utilized ultrafine GGBS, fly ash, and silica fumes sourced from Astra Chemicals in Chennai, Tamil Nadu, India. Coarse aggregates with standard sizes of 20 mm and 12.5 mm complied with IS 383-1970, and locally accessible river sand that met grading zone II of that standard was employed. Coarse aggregates with dimensions of 20 mm and 12.5 mm exhibited specific gravities of 2.67 and 2.59, respectively. 2.53 is the specific gravity of the fine aggregates. The cementitious binder content is fixed at 500 kg/m
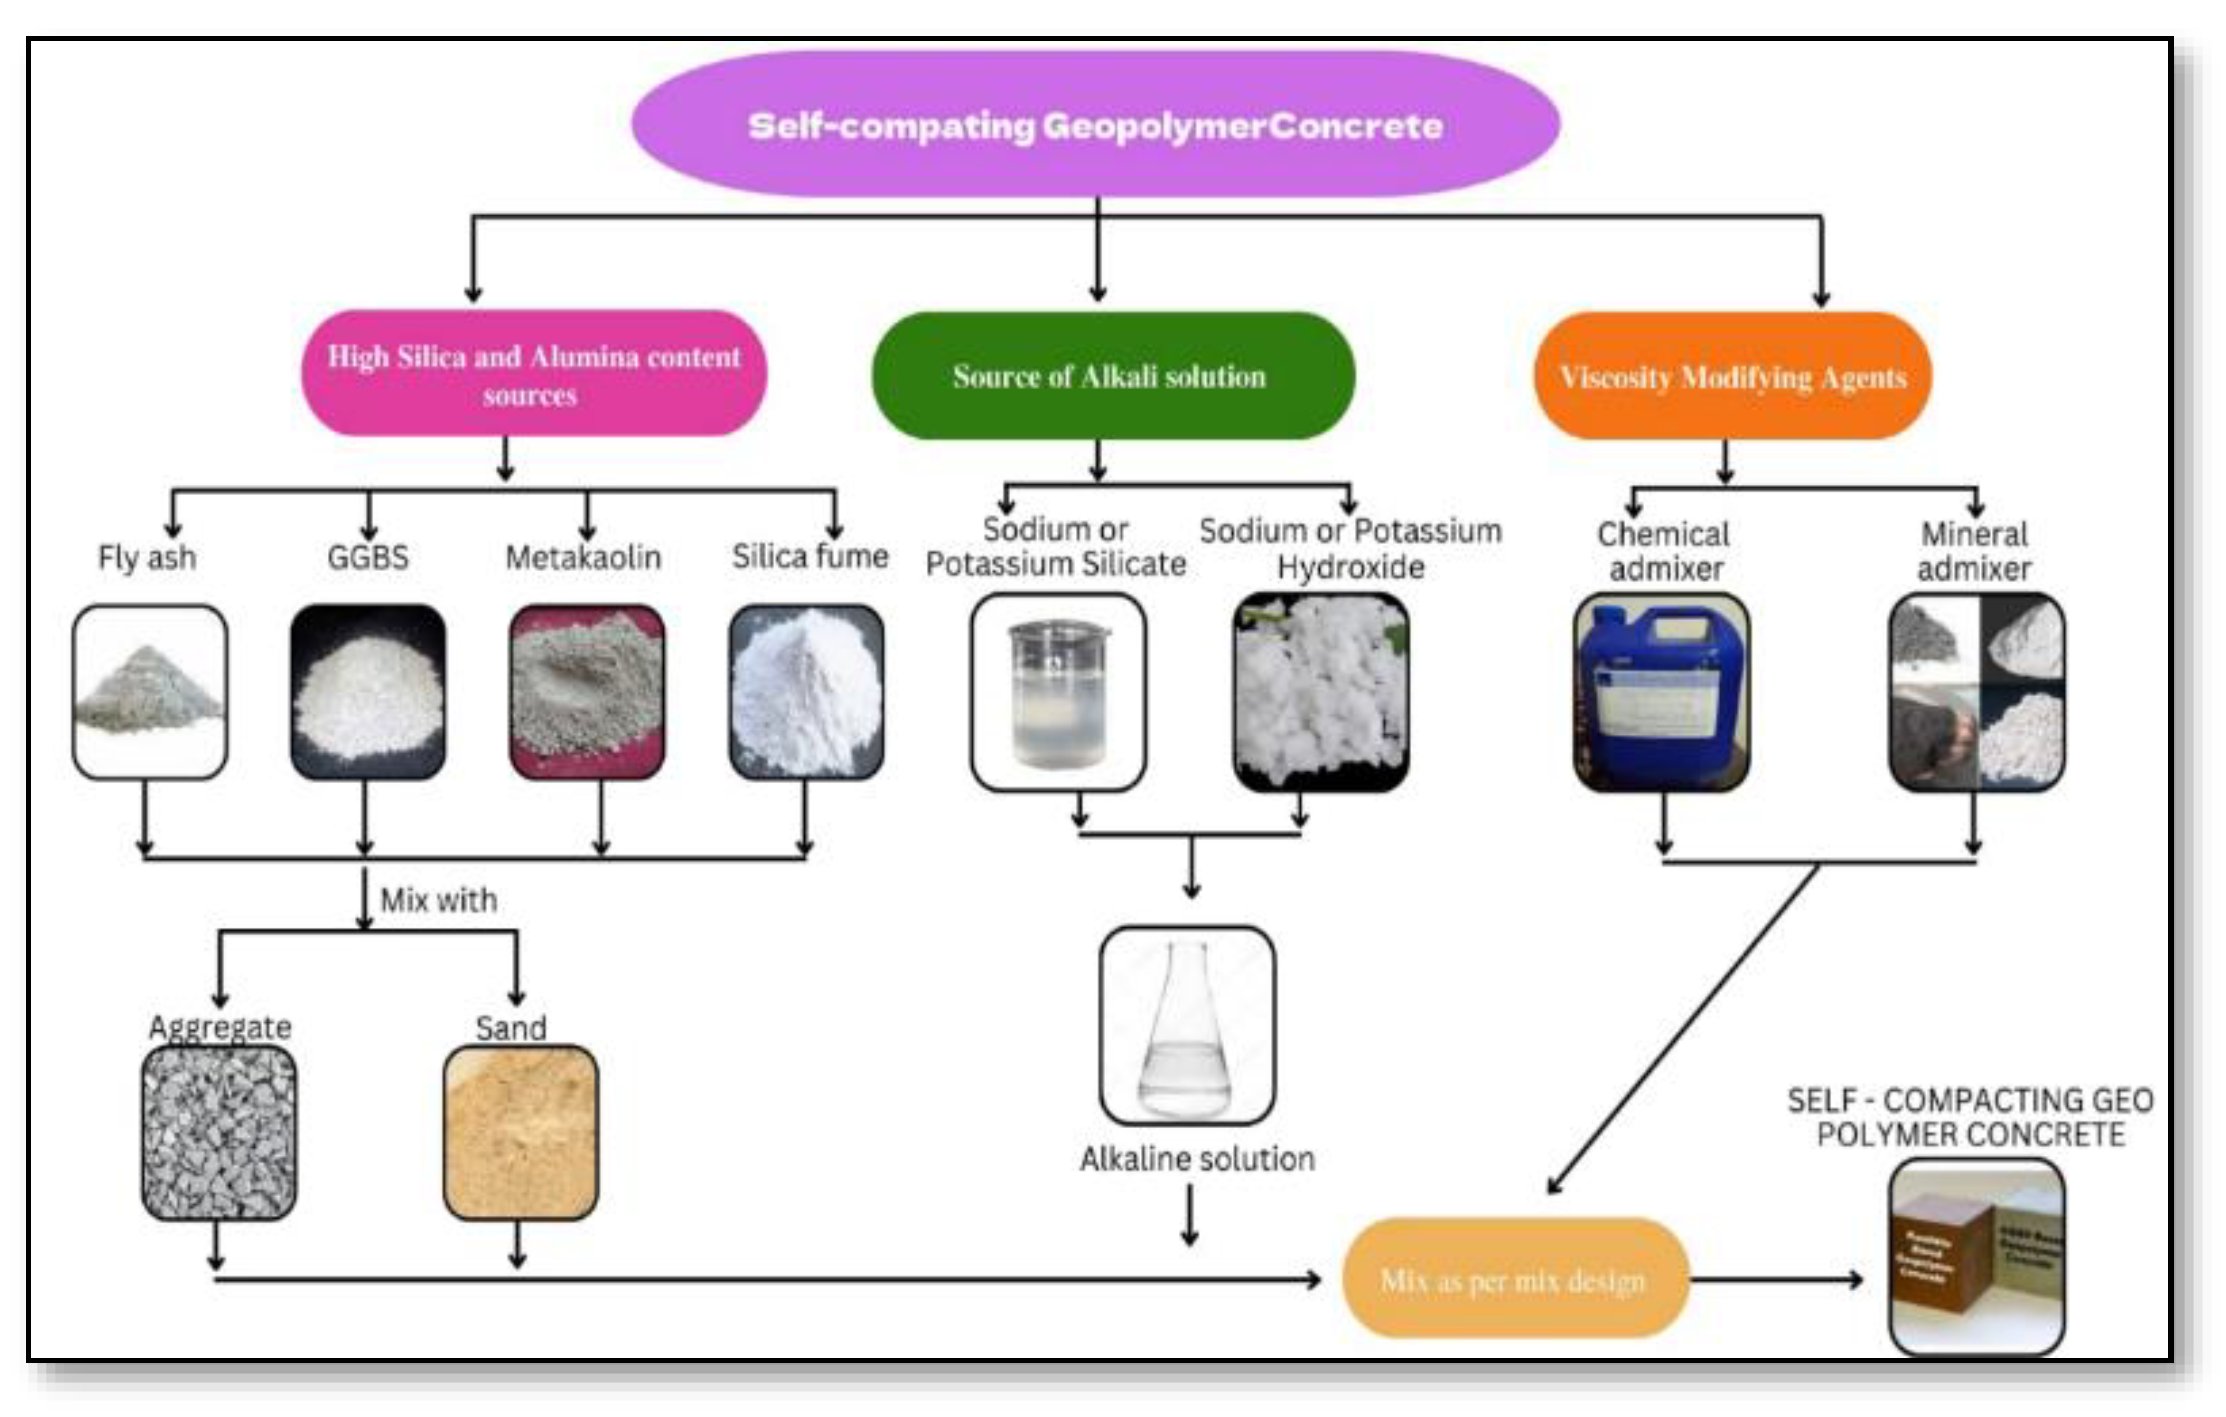
3. These products contain a sizable number of fine fillers and/or additives, which increase their viscosity. By doing this, bleeding was reduced, the mixture remained stable, and the separation of coarser particles was prevented. A low water content necessitates a superplasticizer to achieve the requisite deformability, particularly at lower binder concentrations. Material Used in the Manufacturing of SCGC in
Figure 1.
2.1. Mix Design
The mix design procedure incorporated the identification of the most effective ratios of aggregates, water, geopolymer binders, and admixtures to attain the intended characteristics of the concrete. To investigate the characteristics of SCGC, nine mixes of various mineral admixture replacements were created and tested. The cementitious material 50% fly ash at mass levels of 35%, 40%, and 45%, GGBS, and 5%, 10%, and 15% silica fume were substituted for SCGC. The water/powder mass ratio (w/p) selected after numerous trial mixes was 0.35. The overall powdered content was adjusted to 420 kg/m
3, 470 kg/m
3, and 520 kg/m
3 and was fixed at 520 kg/m
3. Owing to the unavailability of a common code for the mix design of SCGC, various mixes were designed using the criteria provided by the European Federation of Specialist Construction Chemicals and Concrete Systems (EFNARC) [
8]. These mixtures were combined with a high-range water reduction additive based on polycarboxylates. Standard tests were performed to evaluate the fresh properties of the geopolymer-reinforced concrete mixtures. These qualities include viscosity, slump flow, and passing ability. The purpose of these tests was to ensure that the mixture possessed self-compacting characteristics.
Table 1. Shows The SCGC Mix groups, Mix Designation & Mix Properties.
3. Experimental Work
3.1. Preparation of Mixes
An alkaline activator solution was produced using a combination of sodium hydroxide and sodium silicate at 27°C. The silicate and aluminate ions dissolved and then reacted through polycondensations to create a three-dimensional aluminosilicate gel network. This gel structure resembles the hydrated calcium silicate gel observed in Portland cement-based concrete. Mineral admixtures of fly ash, ultrafine GGBS ratio, and silica fume were mixed thoroughly with the fine aggregates. Then, 20 mm and 12.5 mm coarse aggregates were added at 60:40. At the end of the dry mix alkaline activator solution, 12% superplasticizers and 10% extra water were added.
Figure 2 shows the methodology for manufacturing self-compacting geopolymer concrete.
5. Fresh Properties of SCGC
The workability characteristics of fresh self-compacting geopolymer concrete (SCGC) were evaluated using several tests, including the slump flow test, T50 cm slump flow test, V-funnel test, L-box test, and J-ring test. These tests were conducted to determine the ability of the concrete to flow, pass through narrow spaces, and resist segregation according to the recommendations provided by the European Federation of National Associations Representing for Concrete (EFNARC).
5.1. Relative Slump and T50 Slump Flow
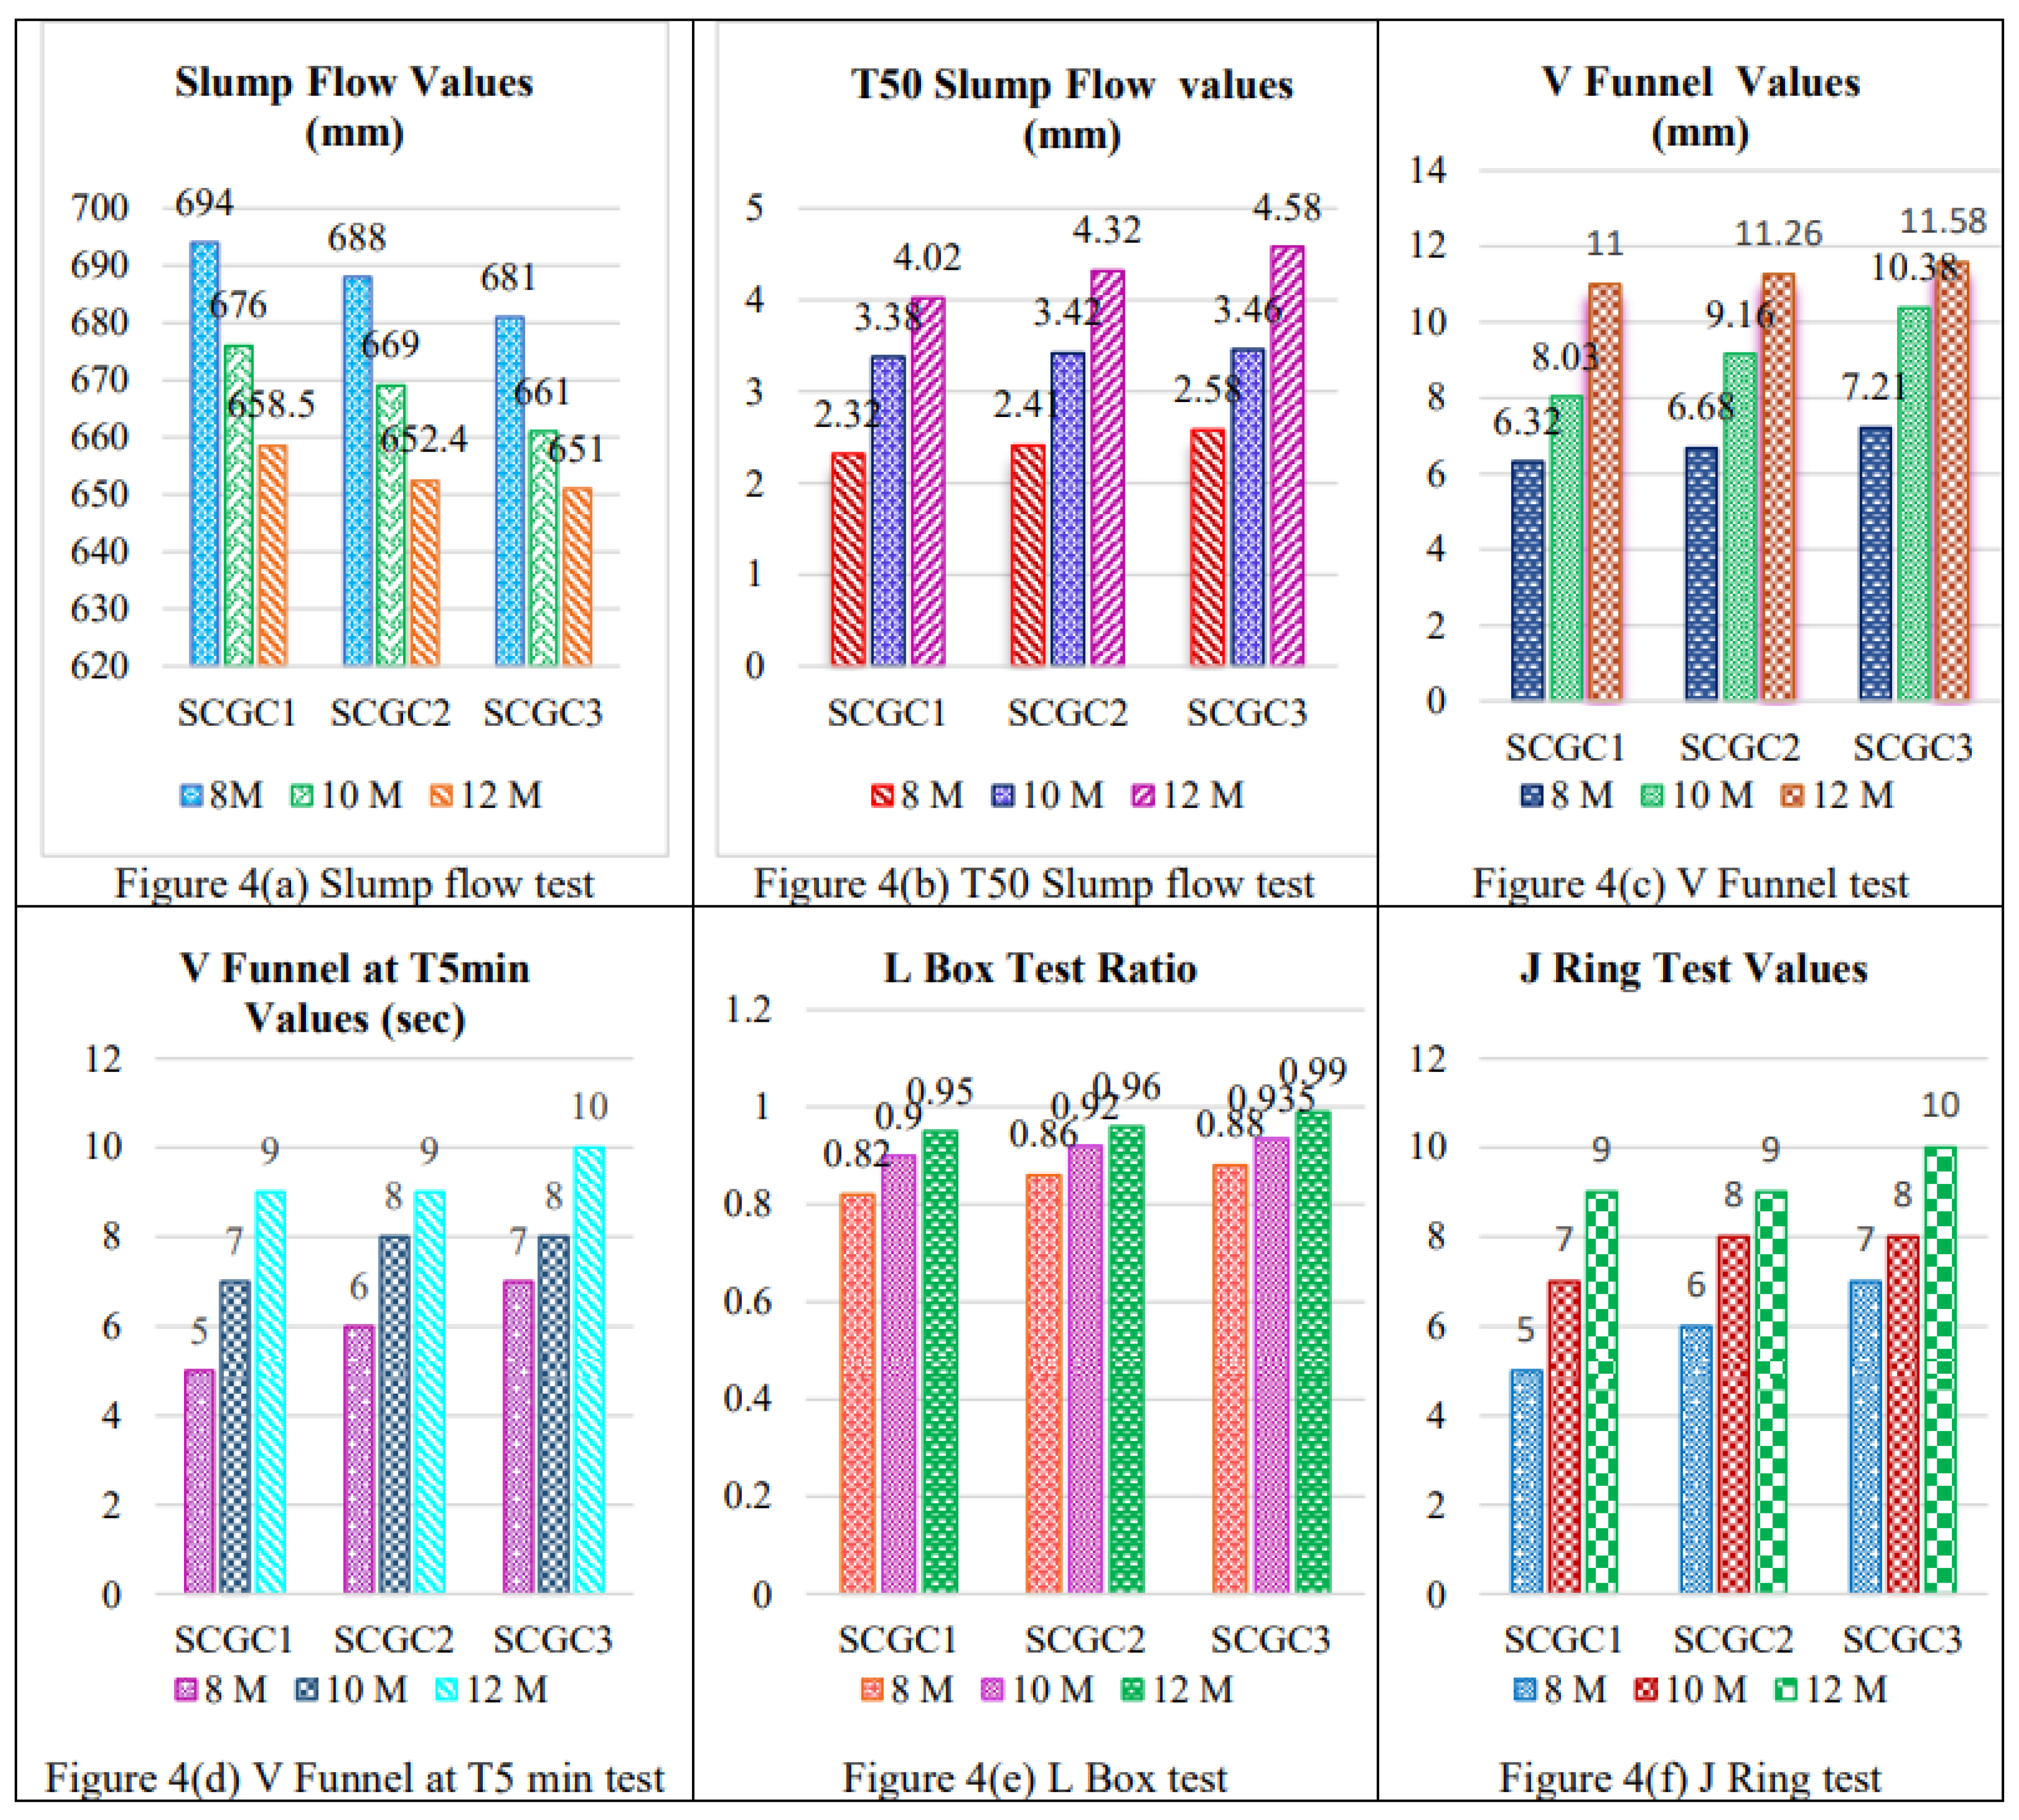
The flowability of the SCGC was evaluated using slump flow testing, which involves monitoring the spread of the concrete diameter. The slump flow ranged from 650 mm to 800 mm. Increasing the molarity of SCGC from 8 M to 12 M can increase the viscosity of the geopolymer paste due to the alkaline activator solution. The higher viscosity of the concrete mixture decreases its fluidity, resulting in increased difficulty for the mixture to flow and change shape under its weight during the slump test. As a result, the slump decreases when the mixture becomes more rigid.
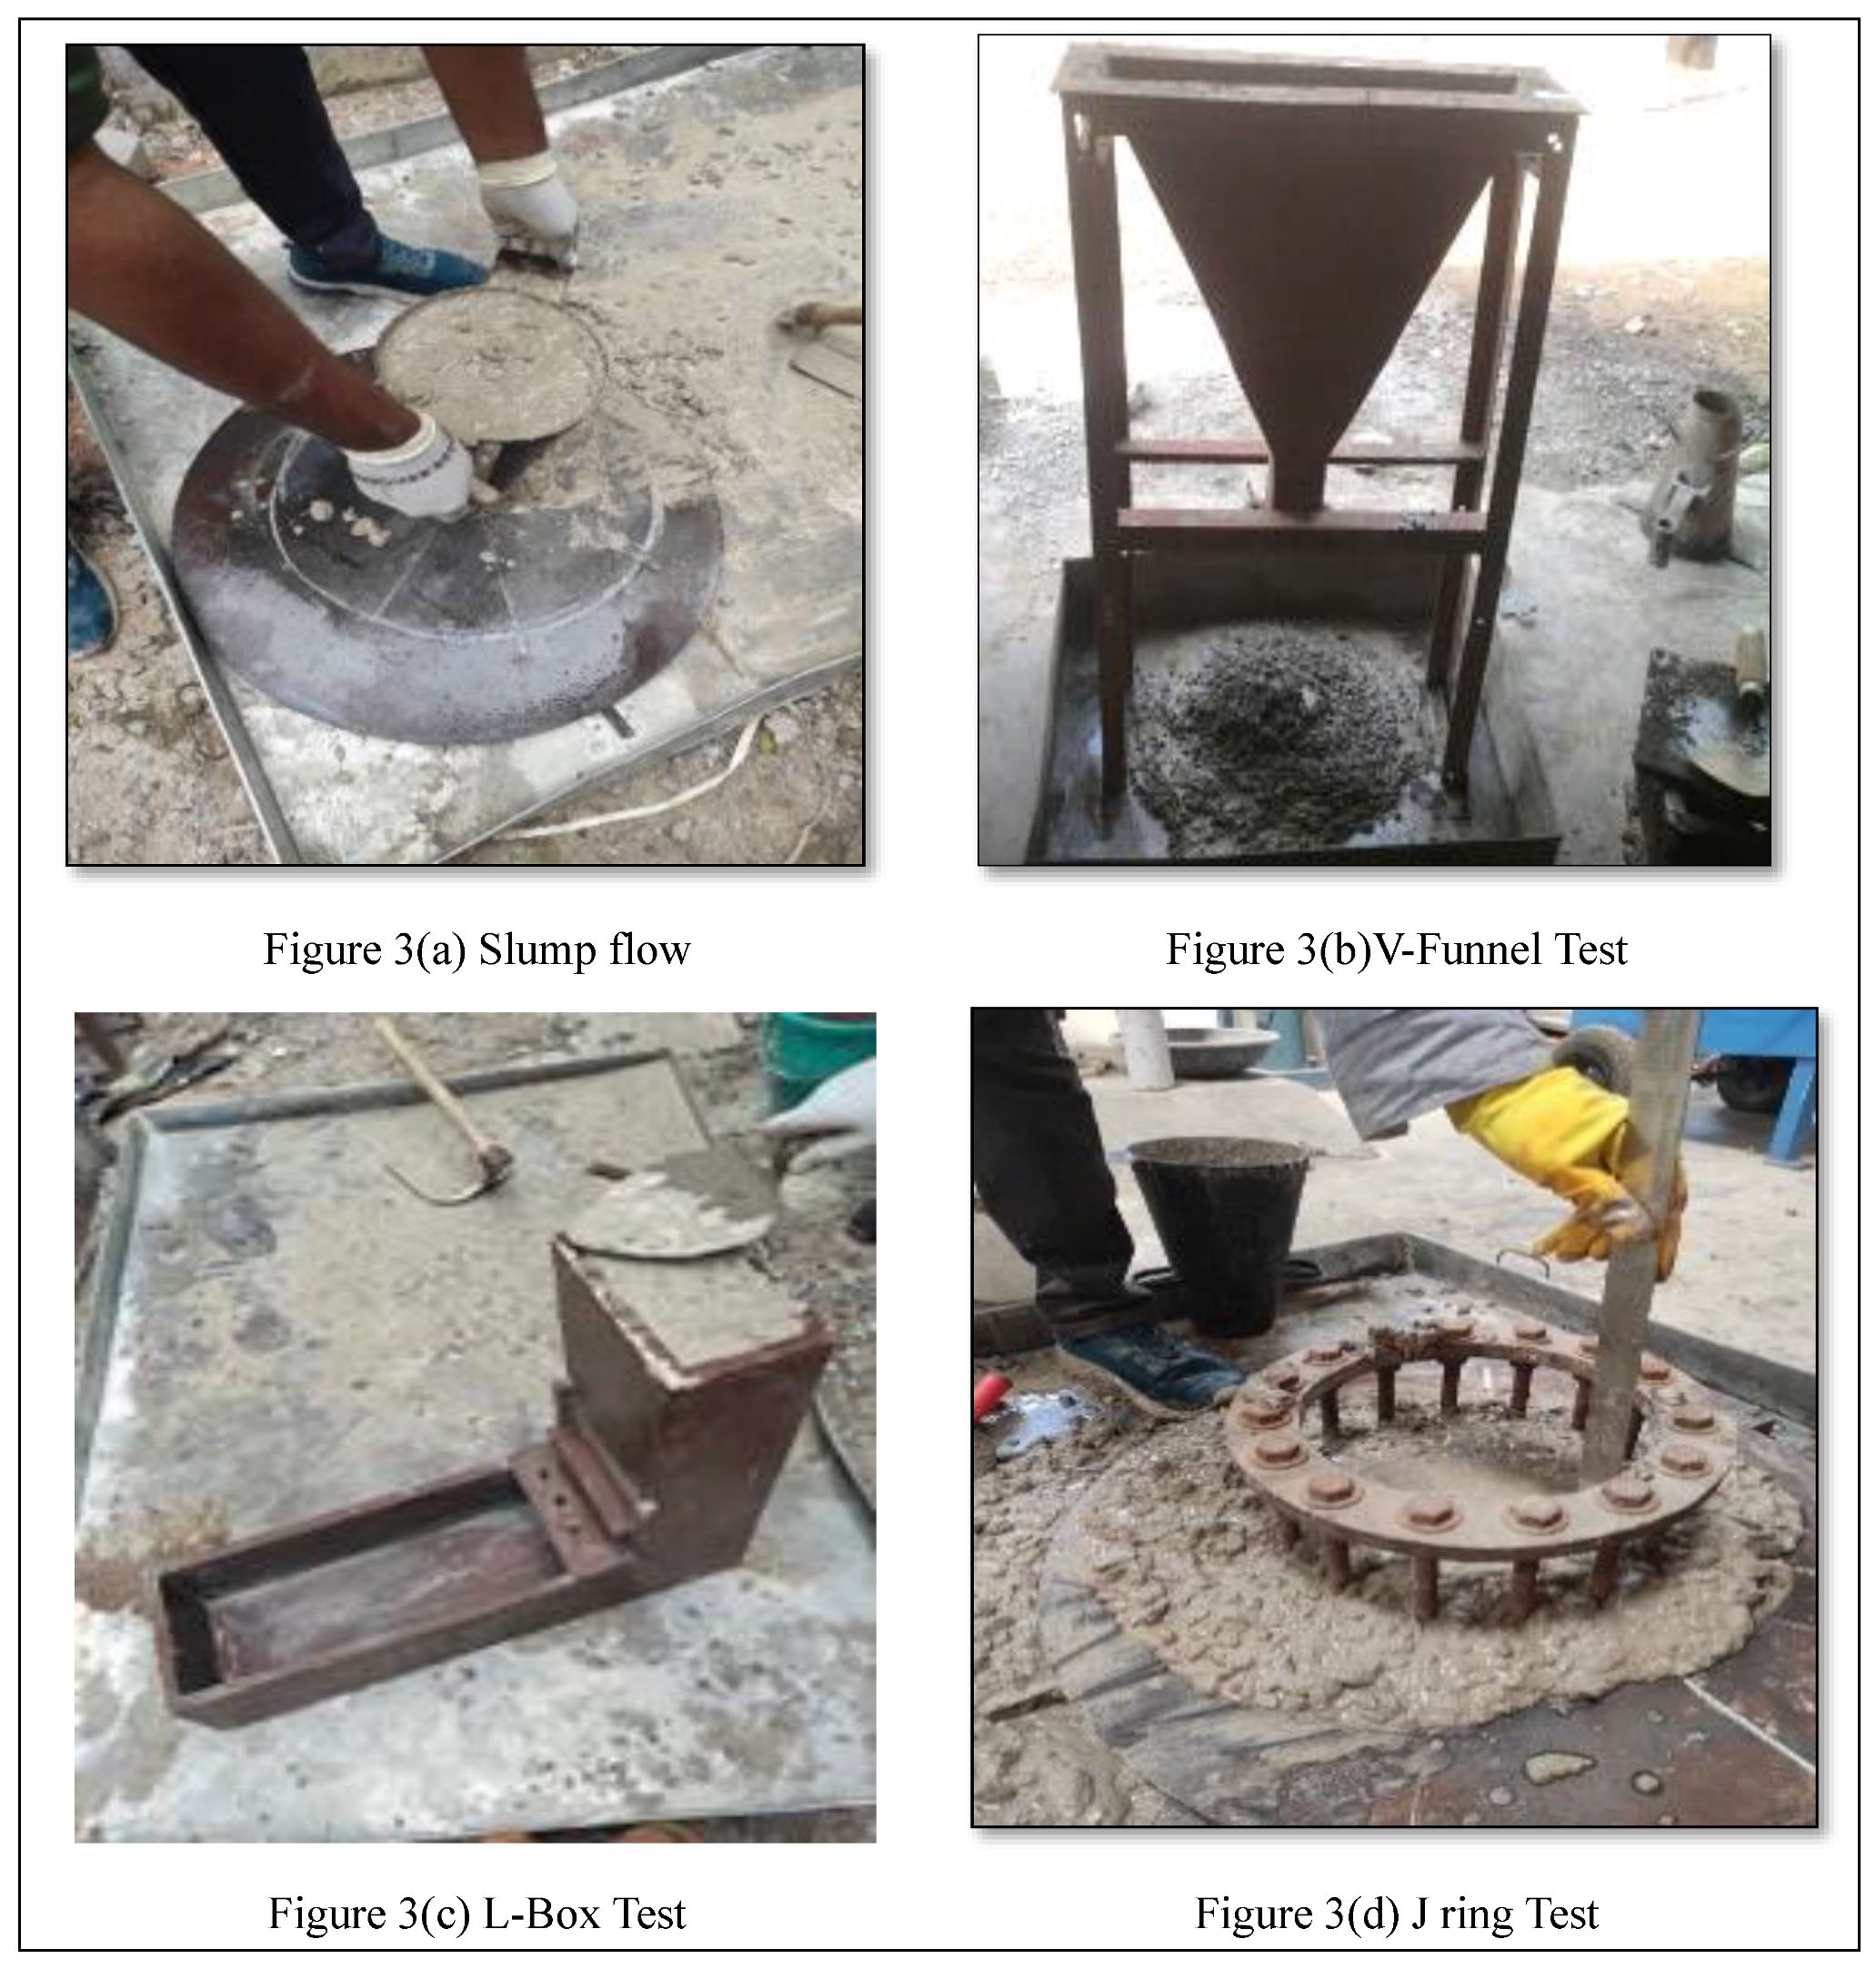
The T50 cm slump flow is the amount of time required for the slump flow to reach a diameter of 50 cm. It was measured as part of the slump flow test. Figure 3(a) illustrates the results of a slump flow test. Figures 4(a) and 4(b) display the outcomes of the slump flow test and T50 slump flow test, respectively, regarding the fresh material properties. When the molarities increased from 8 M to 12 M, the slump flow increased. When increasing the silica fume content from the SCGC1 group to the SCGC3 group, the time taken increases because of the finer content of silica fume. A shorter time indicates greater flowability.
5.2. V Funnel Test and V Funnel Test at T5
The V-funnel test can be used to measure the filling ability of concrete passing through a narrow duct. The V-funnel apparatus is composed of a vertically positioned stainless-steel funnel on a supporting stand, which forms the test set. The flow time was measured as the time required for concrete to flow through the bottom opening of the V-funnel. The flowability of the concrete can be inferred from the flow time. The V-Funnel test is illustrated in
Figure 2(b).
A 12 M activator solution corresponds to a higher alkali content in the geopolymer-reinforced concrete mixture. An excessive alkali content can accelerate the setting time and increase the rate of stiffening of the concrete, reducing its ability to flow through the V-Funnel. A better flowability is typically indicated by a shorter flow time. Following the completion of the V-funnel test, the trap was reopened and refilled with concrete. Five minutes later, the duration required for the concrete to flow through the funnel was noted as V-funnel T5- minutes. Figure 3(c) displays the results of the V-Funnel test, whereas Figure 3(d) shows the results of the V-Funnel test at T5 min.
5.3. L Box Test
This test was used to evaluate the flow and passing ability of the SCC. The typical travel length of concrete along the horizontal section of the L-box was used to calculate the flow of the SCGC. This distance indicates the passing score of the SCGC. In general, the blocking ratio of self-compacting concrete should be between 0.8 and 0.85.
Figure 2(c) shows the results of the J-ring test. Figure 3(f) displays the J values obtained from a ring test.
In the mixed groups SCGC1 to SCGC3, the silica fume content increased from 5% to 15%. When the silica fume content increases, the viscosity of the geopolymer paste may increase, increasing its resistance to flow. This increased viscosity can lead to a decrease in the flowability of the concrete mix and an increase in the L-Box ratio, indicating a reduced ability to pass through narrow spaces.
5.4. J-Ring Test
This experiment might be used to determine the passing capabilities of new SCC.
Figure 2(c) shows the results of the J-ring test. The Abrams cone was inserted inside the J-ring while performing the J-ring test. The J-ring test is a typical procedure for determining the rate at which SCC passes through confined spaces or reinforced concrete. Figure 3(f) depicts the measurement of the horizontal flow differential. When the molarities are increased from 8 M to 12 MJ, the ring strength likewise increases. Similarly, increasing the silica fume concentration leads to an increase in the flow.
4. The Compressive Strength of Concrete Forecast with an ANN
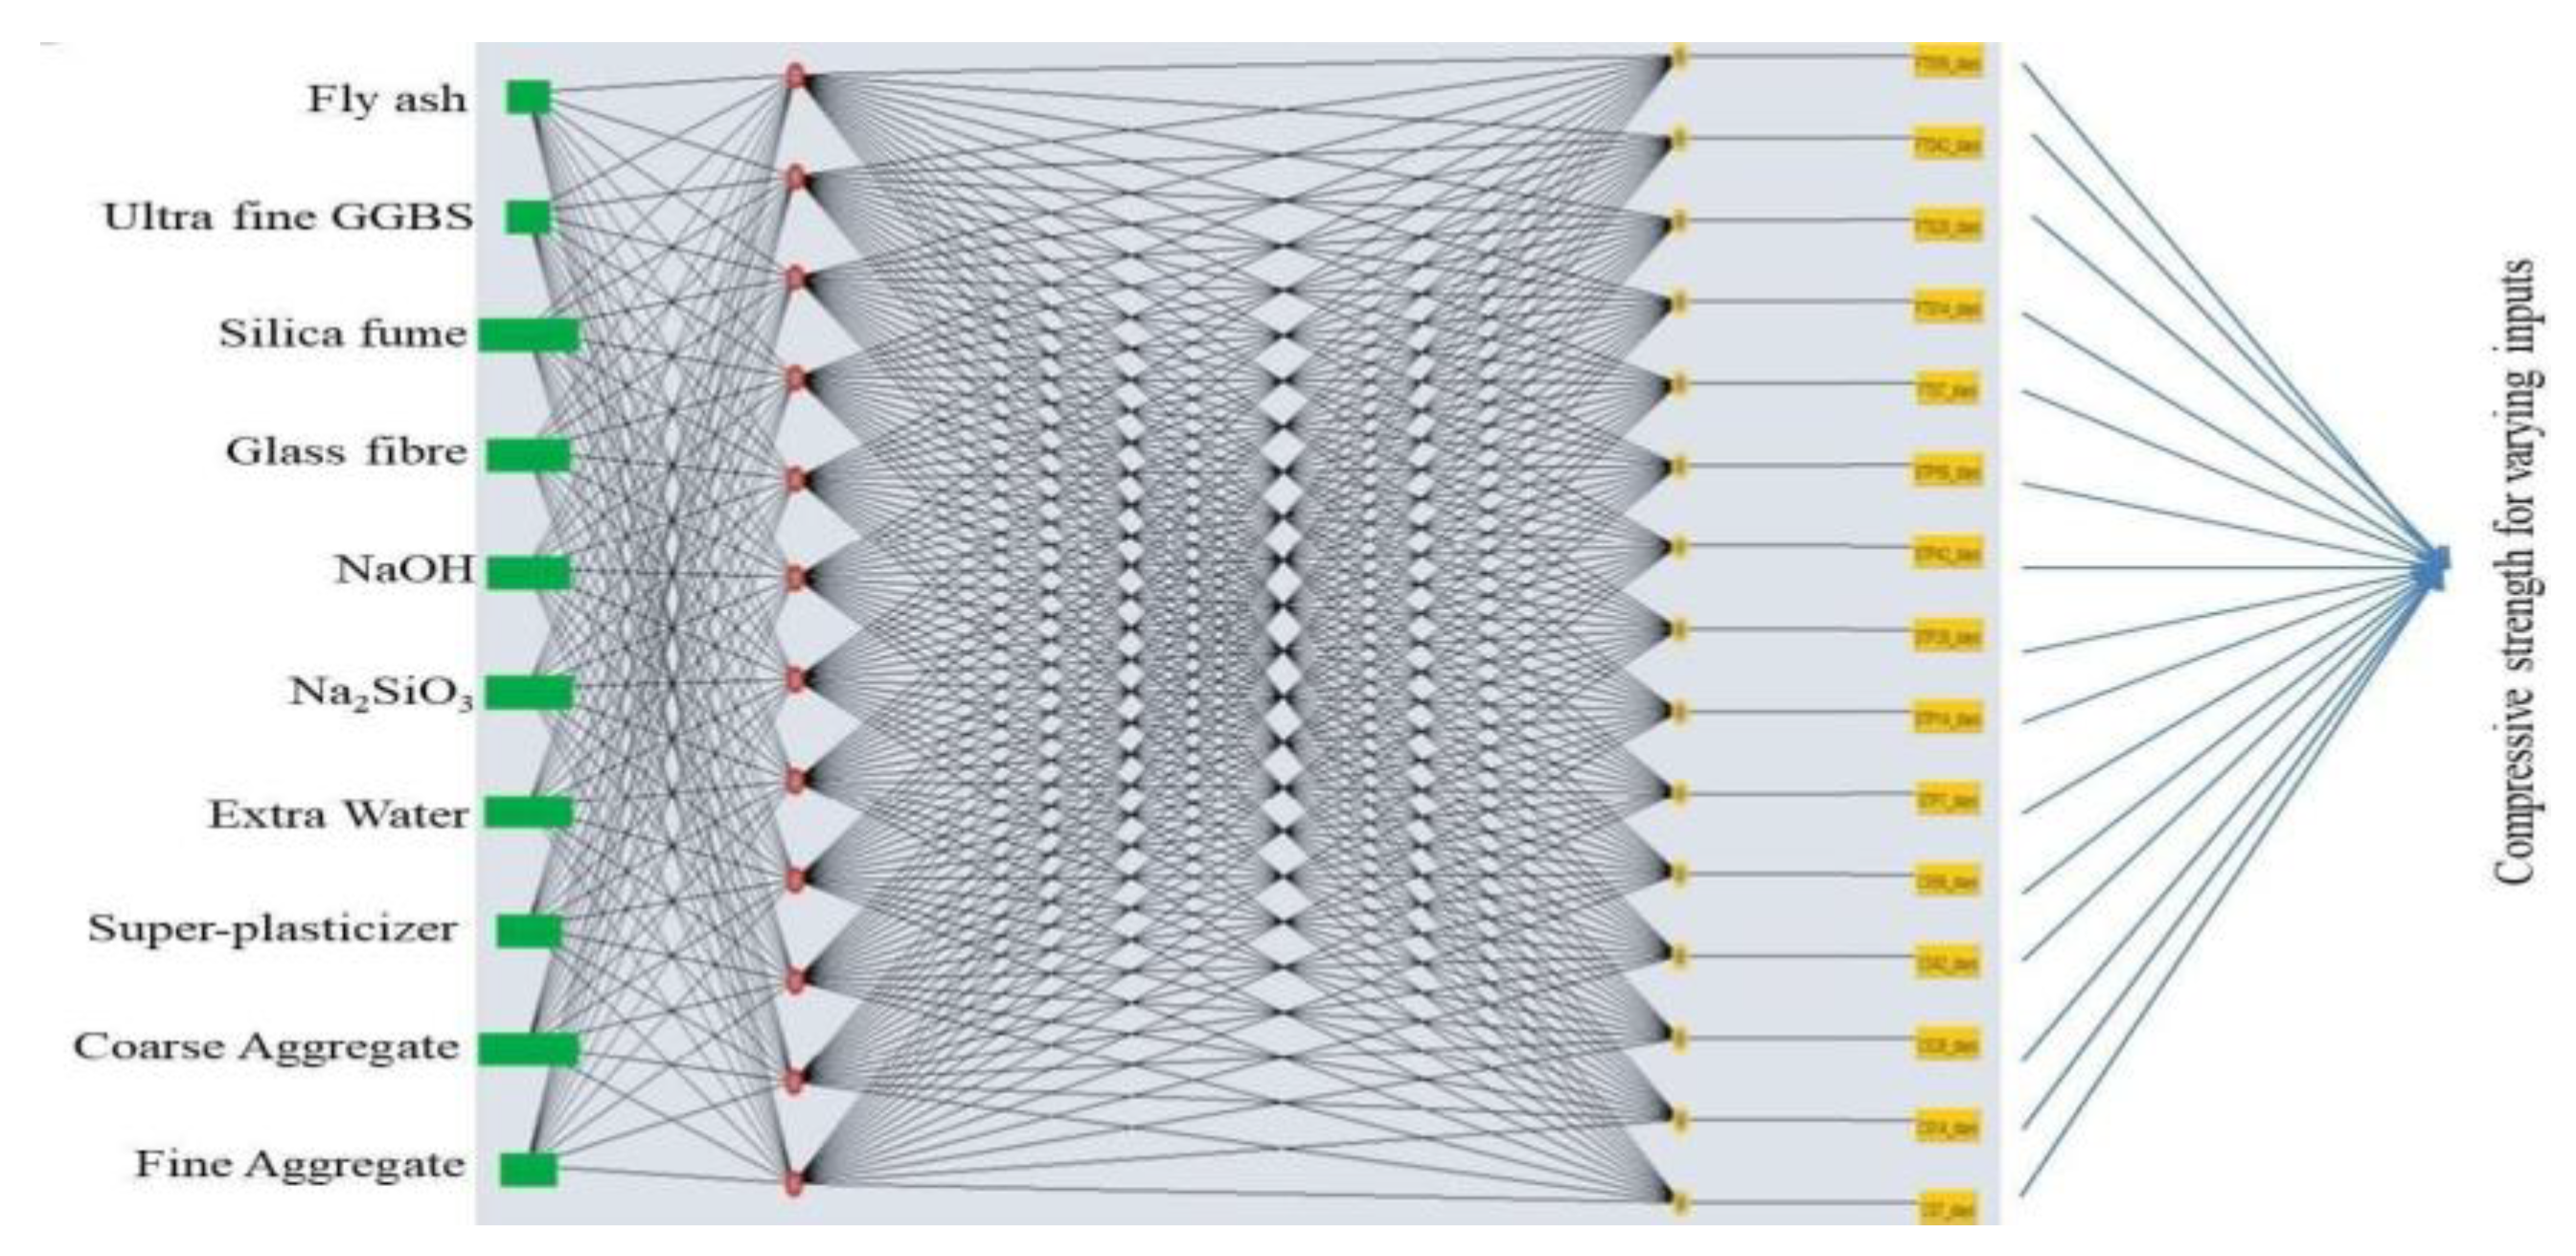
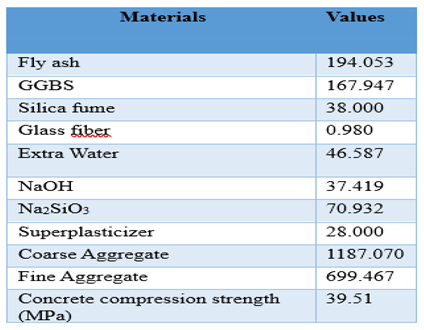
Artificial neural networks (ANNs) are digital representations of the structure and operation. Artificial neurons, often called "neurons," are connected nodes arranged in ANN layers. These neurons take impulses, process them, and then generate messages. Complicated and unpredictable interactions between numerous input variables and output strength characteristics can be efficiently captured using ANN models. To accurately forecast the compressive strength of SCGC, different factors, such as the amount of fly ash, GGBS, silica fume, extra water, sodium silicate, sodium hydroxide, and superplasticizer, were used as inputs. The compressive strength of the concrete was subsequently determined as an outcome.
Table 2 displays the input variables needed to forecast the compressive strength of SCGC using artificial neural networks.
To accurately predict the compressive strength of concrete, 450 samples were utilized as the input. The histogram of the concrete compressive strength (MPa) is shown in the following graph. The centers of the containers are shown on the abscissa, and the associated frequencies are shown on the ordinate. A bin with a centre value of 36.93 corresponds to a maximum frequency of 20%. The bin with a centre of 40.23 corresponds to a minimum frequency of 0%.
Figure 5 shows the ANN flow diagram for predicting the compressive strength of concrete.
The optimization strategy employed in this instance was the quasi-Newton method. The second derivatives are not necessary, despite the Newtonian foundation of this method. The inverse Hessian was estimated at each procedural stage using only gradient data and the quasi-Newton approach.
Table 3. The Output for Predicting the Compressive Strength of SCGC
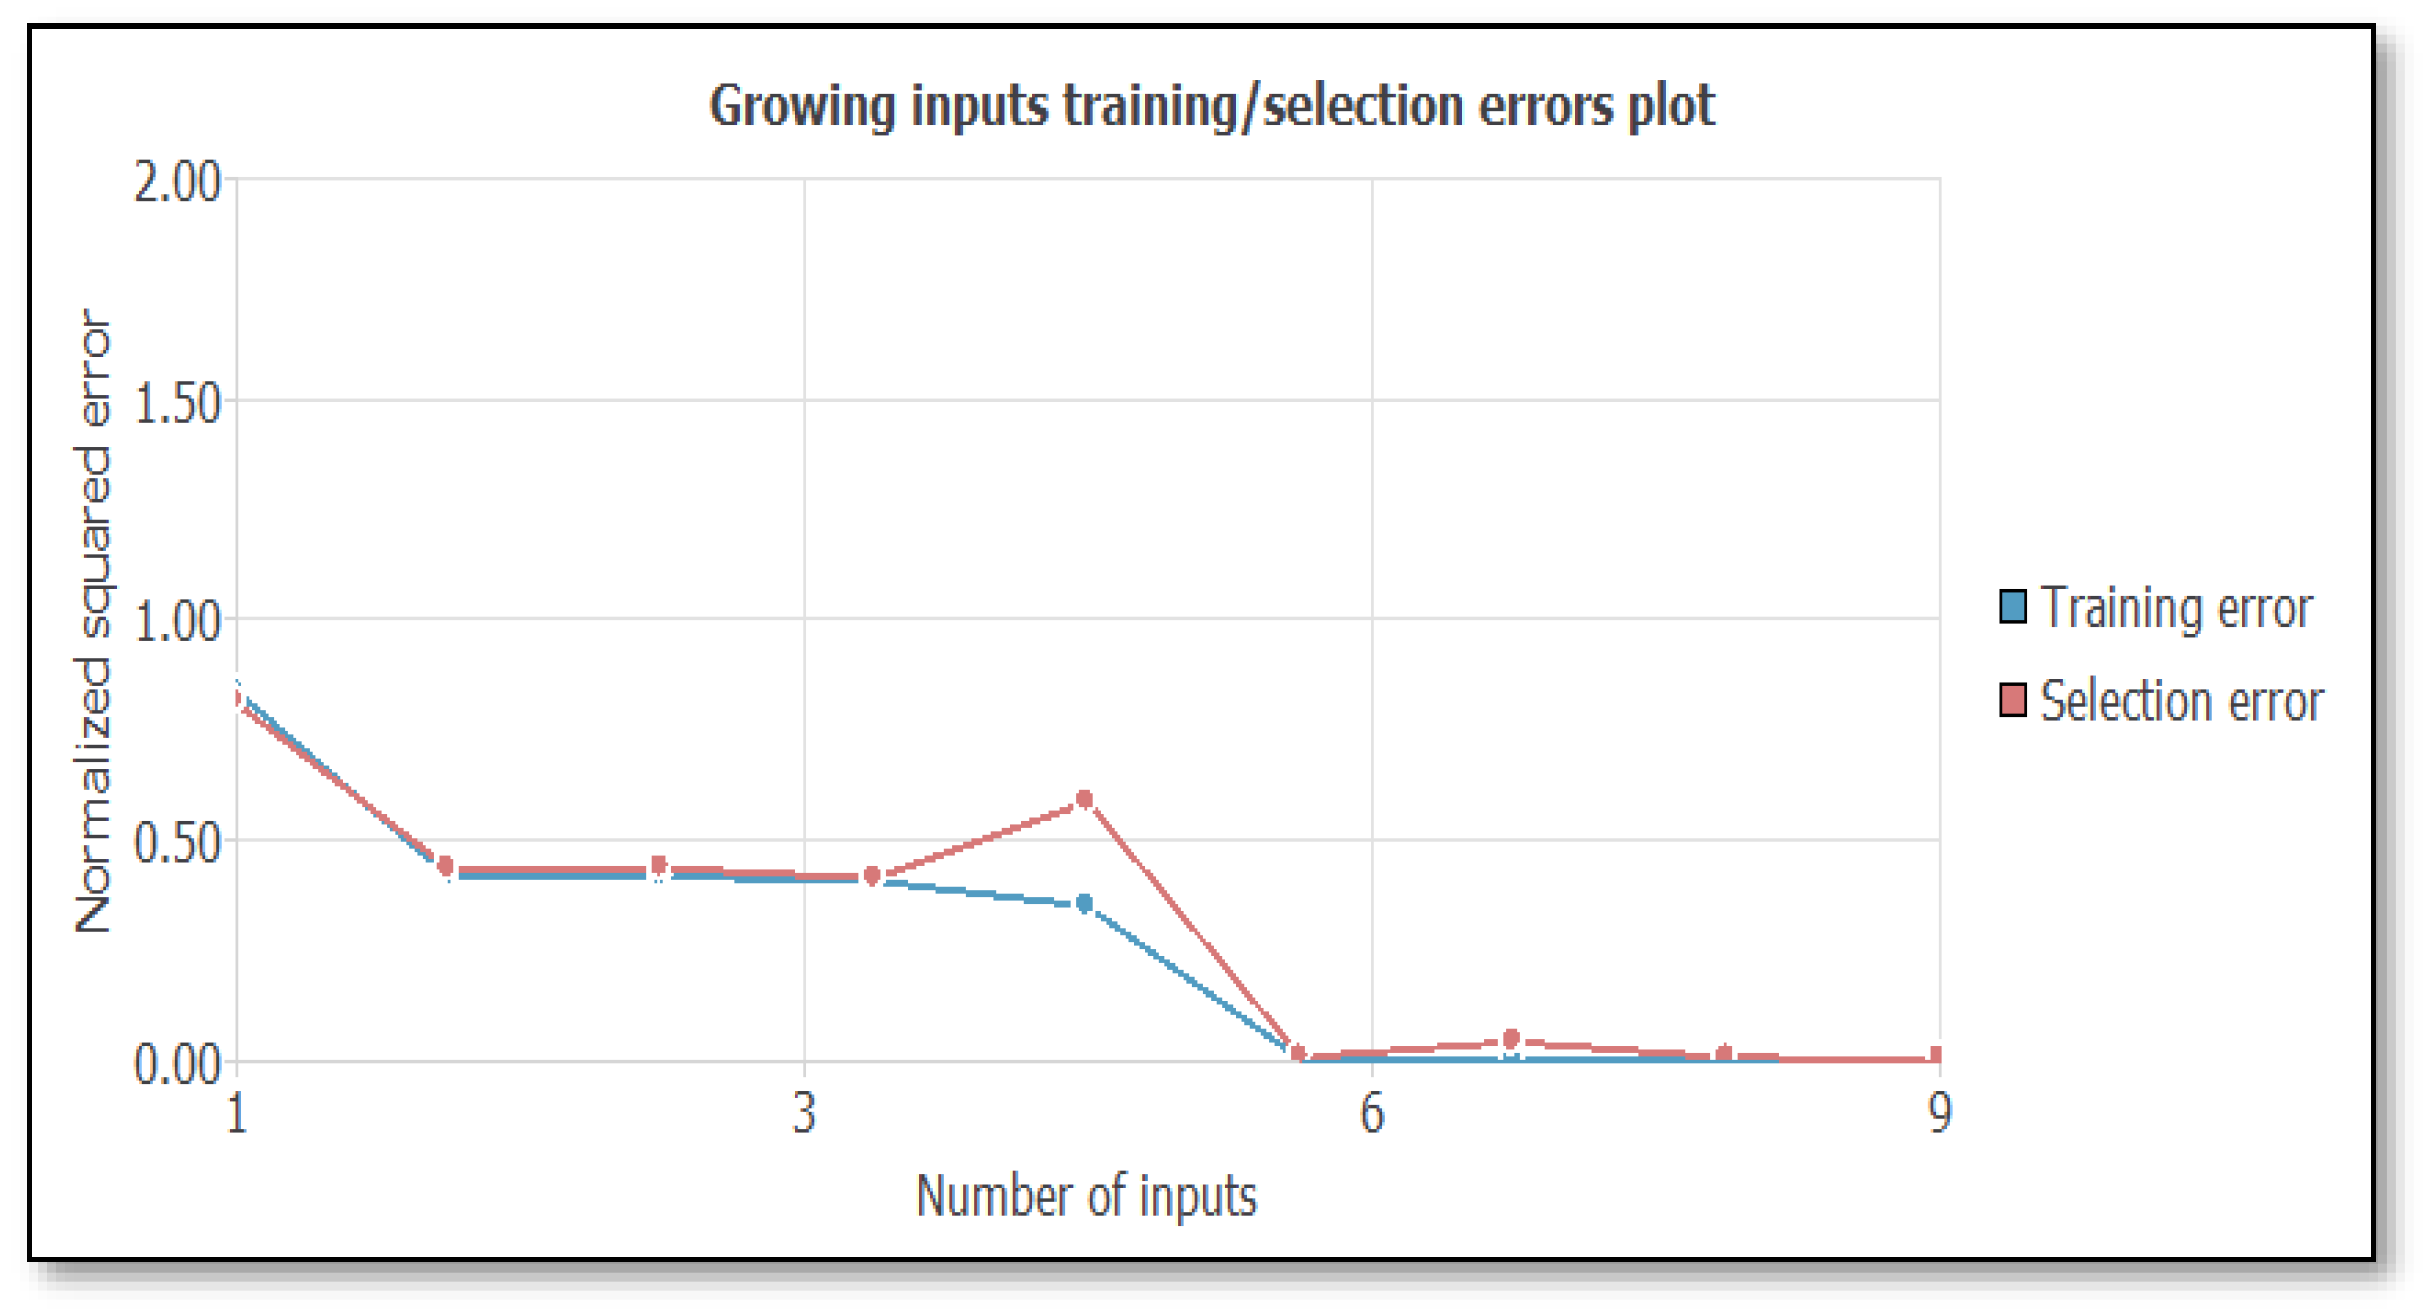
The objective of input selection is to identify the optimal subset of inputs that will effectively minimize model error. The growing input algorithm is responsible for selecting optimal inputs. As the input-selection process progresses, the error history for the various subsets is displayed in the following chart.
Figure 6 shows the training and selection error plots. The blue line shows the training error, and the red line shows the selection error.
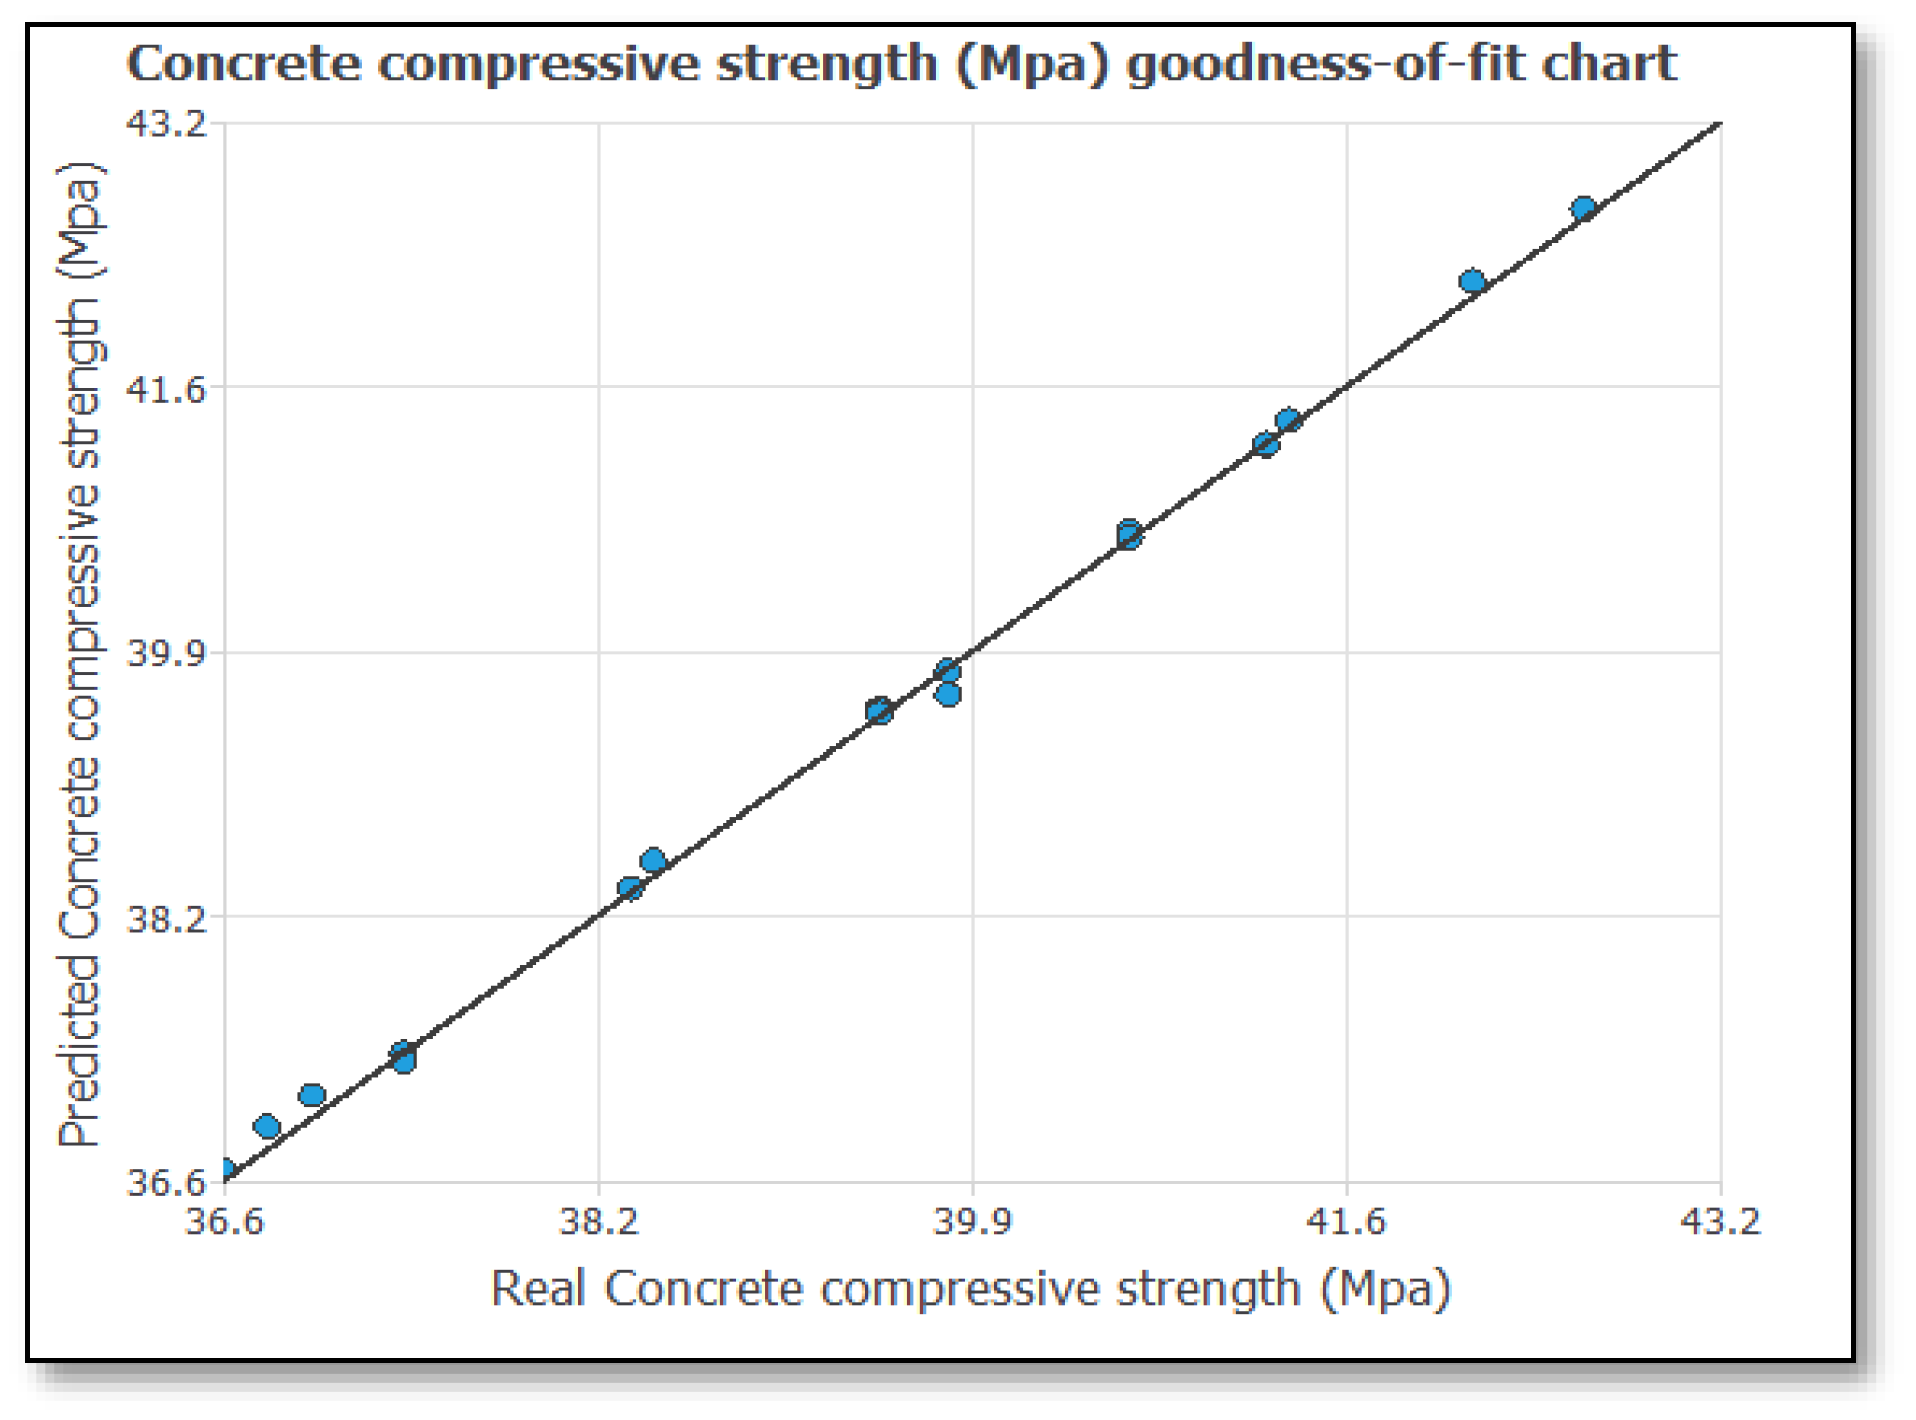
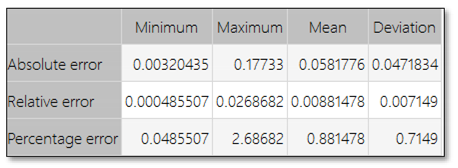
Figure 7 shows the predicted values versus the output concrete compressive strength (MPa) values. The gray line indicates the best prediction result (outputs equal to targets). Note that some scaled outputs fall outside the range defined by the targets; therefore, they are not plotted. The error statistics calculate the mean, standard deviation, minimum, and maximum errors between the neural network and the dataset's testing samples. They offer an effective means of evaluating a model's quality.
Table 4. Percentage errors of the neural network for the testing data
The minimum percentage error was 0.0485507%.
The maximum percentage error was 2.68682%.
The mean percentage error was 0.881478%.
6. Mechanical Properties
6.1. Compressive Strength
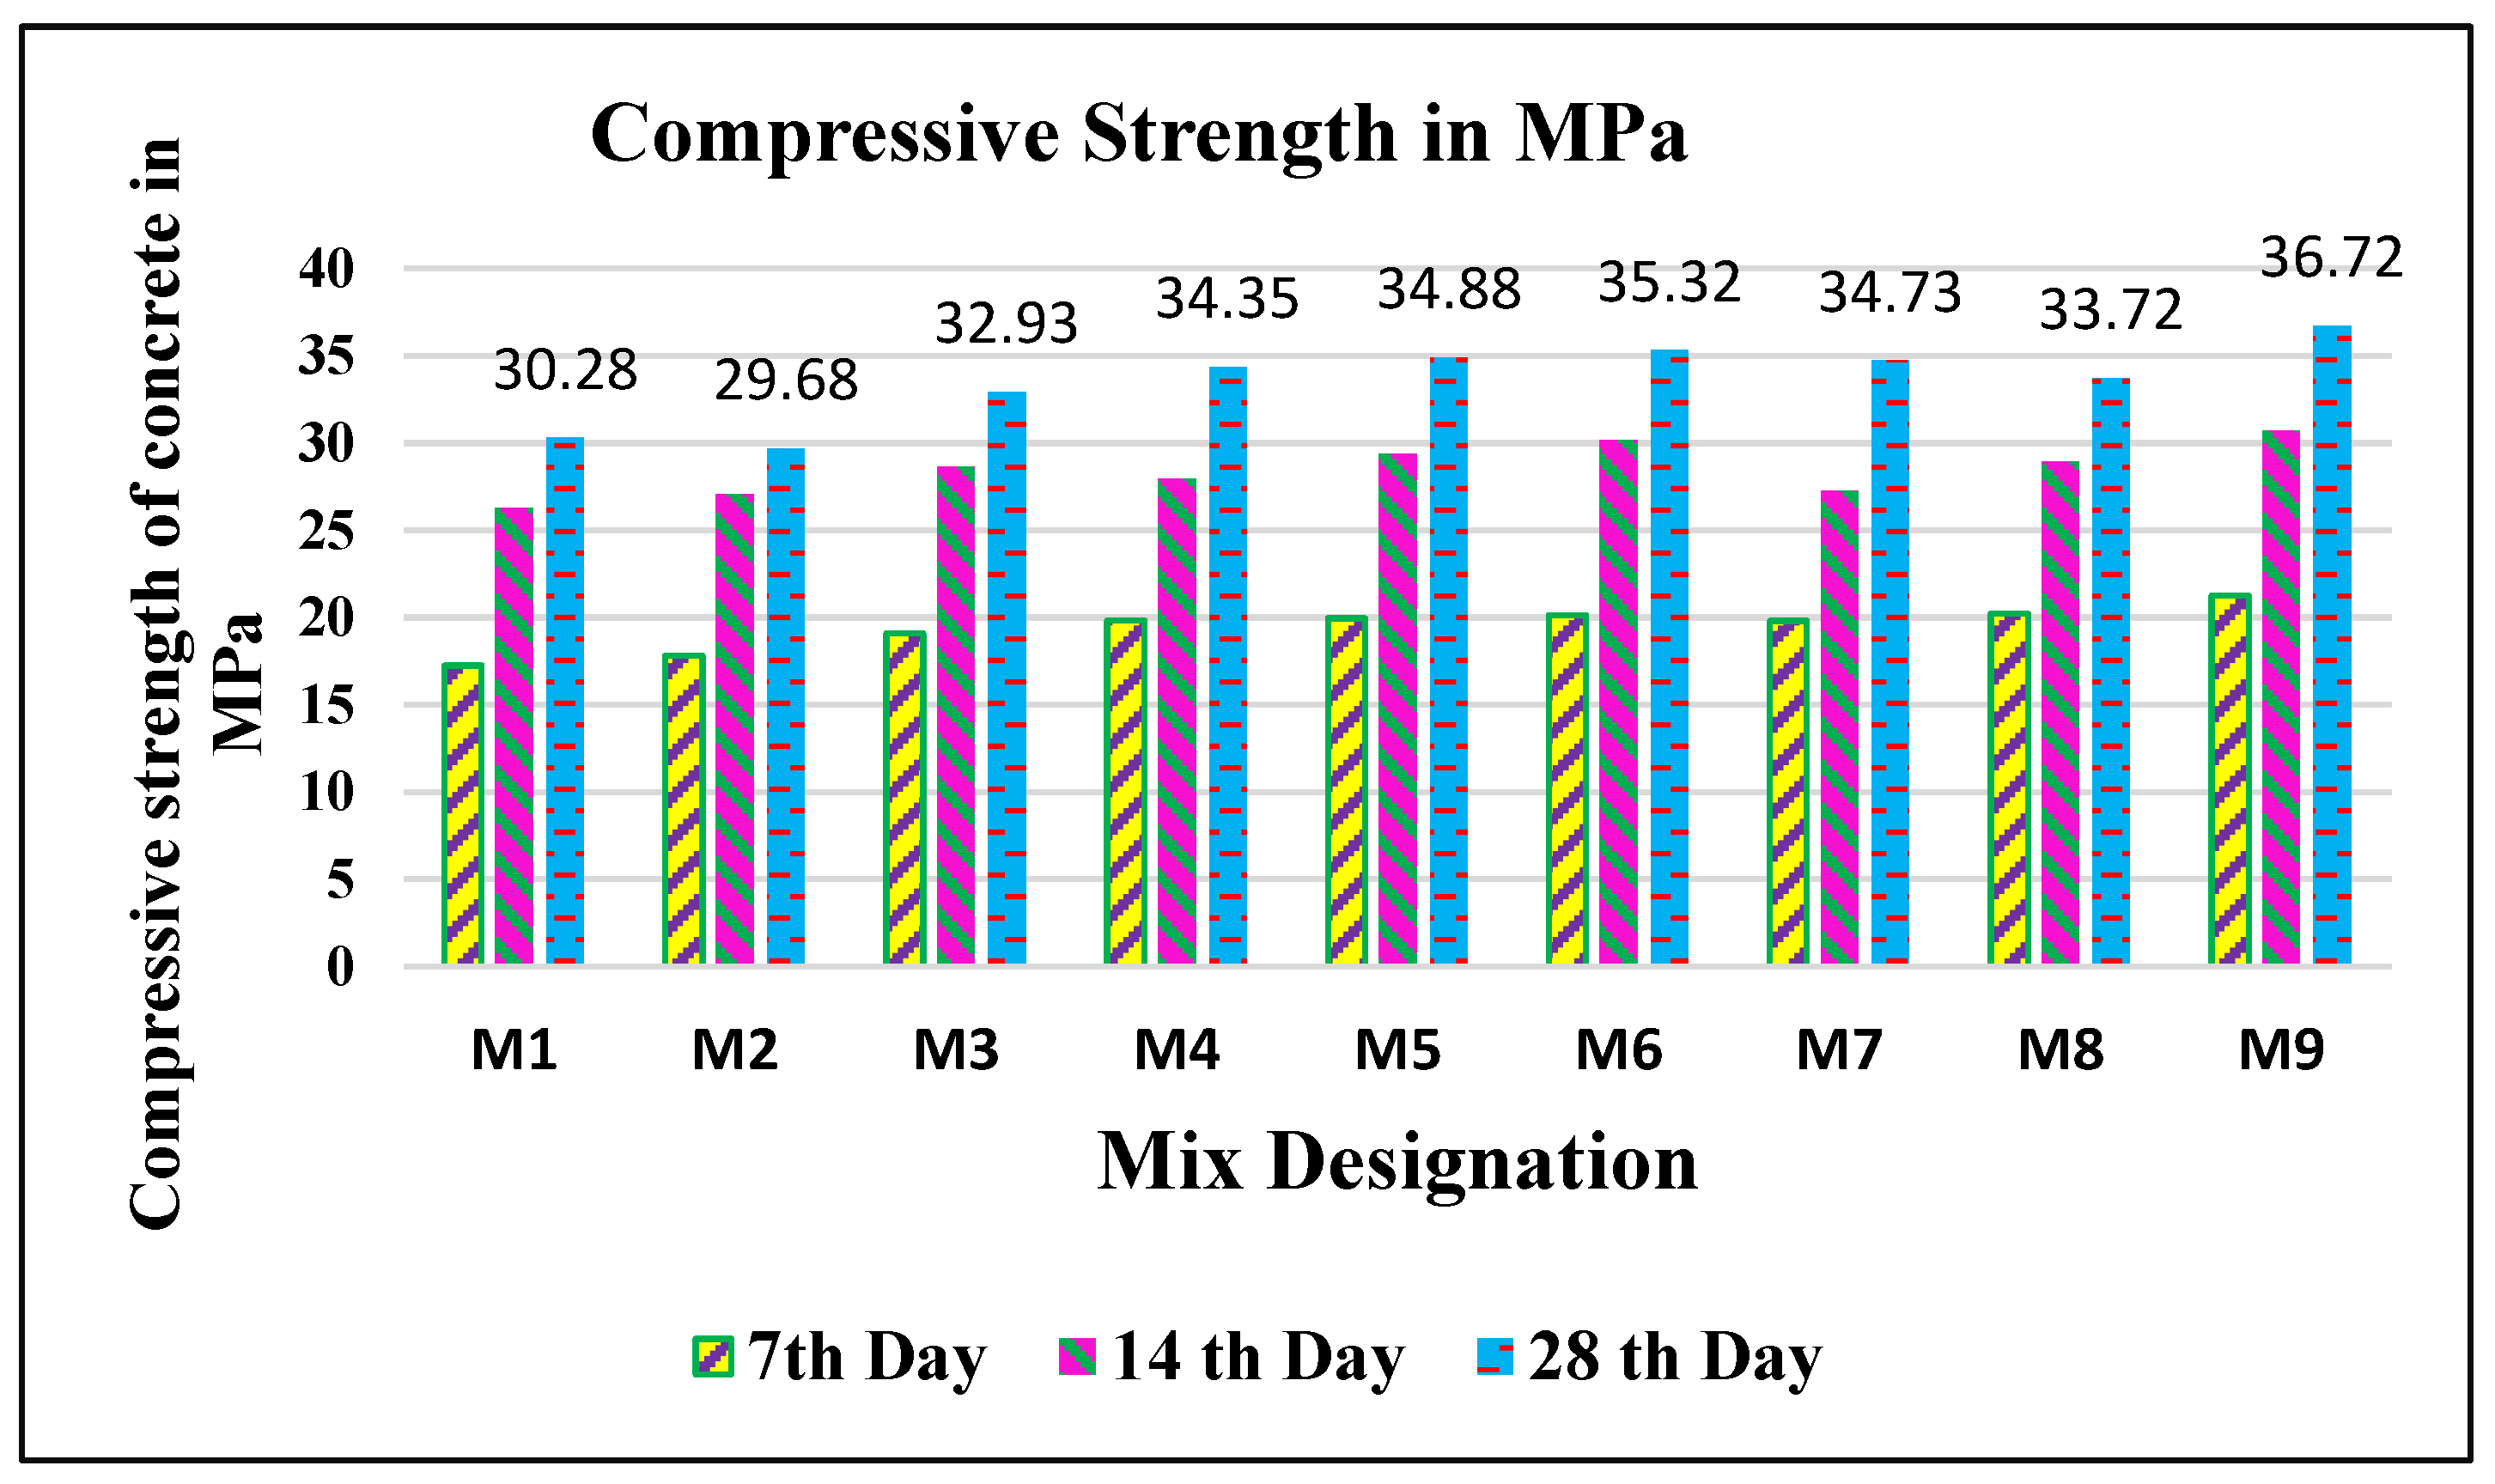
The mechanical characteristics of self-compacting geopolymer concrete (SCGC) might fluctuate depending on the mix design, curing circumstances, and geopolymer materials utilized. Increasing the quantity of mineral admixtures typically results in an increase in strength compared to that of the original mixture. However, the silica fume series demonstrated the greatest effectiveness at 15% replacement for 7 days, 14 days, and 28 days. This is because the product's fineness and better mechanical properties and increased amount of SF substituted also led to a decrease in strength.
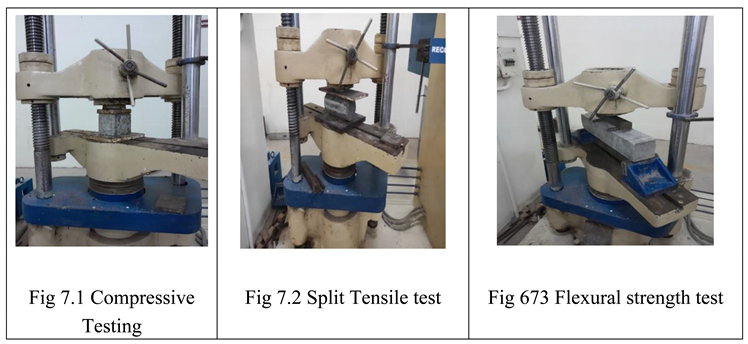
Figure 7.1 shows the compressive strength test results.
Figure 8. The compressive strength of the SCGC for different mix proportions increased more quickly in the former when comparing the concrete specimens containing only silica fume to the other samples. A higher binder content leads to the formation of more calcium silicate hydrate (C-S-H) gel. This made the aggregate pack better and increased its compressive strength. The water-to-binder ratio, binder type and quantity, and other factors significantly impact the SCGC strength.
Figure 8.
Compressive strength of SCGC for different mix proportions.
Figure 8.
Compressive strength of SCGC for different mix proportions.
6.2. Split Tensile Strength of SCGC
Concrete tensile tests can be indirectly evaluated using split tensile tests. The split tensile strength was measured seven and twenty-eight days after mixing the SCGC concrete. A cylindrical specimen 150 mm in diameter and 300 mm in height was used for the experiment.
Figure 7.2 illustrates the split tensile strength test.
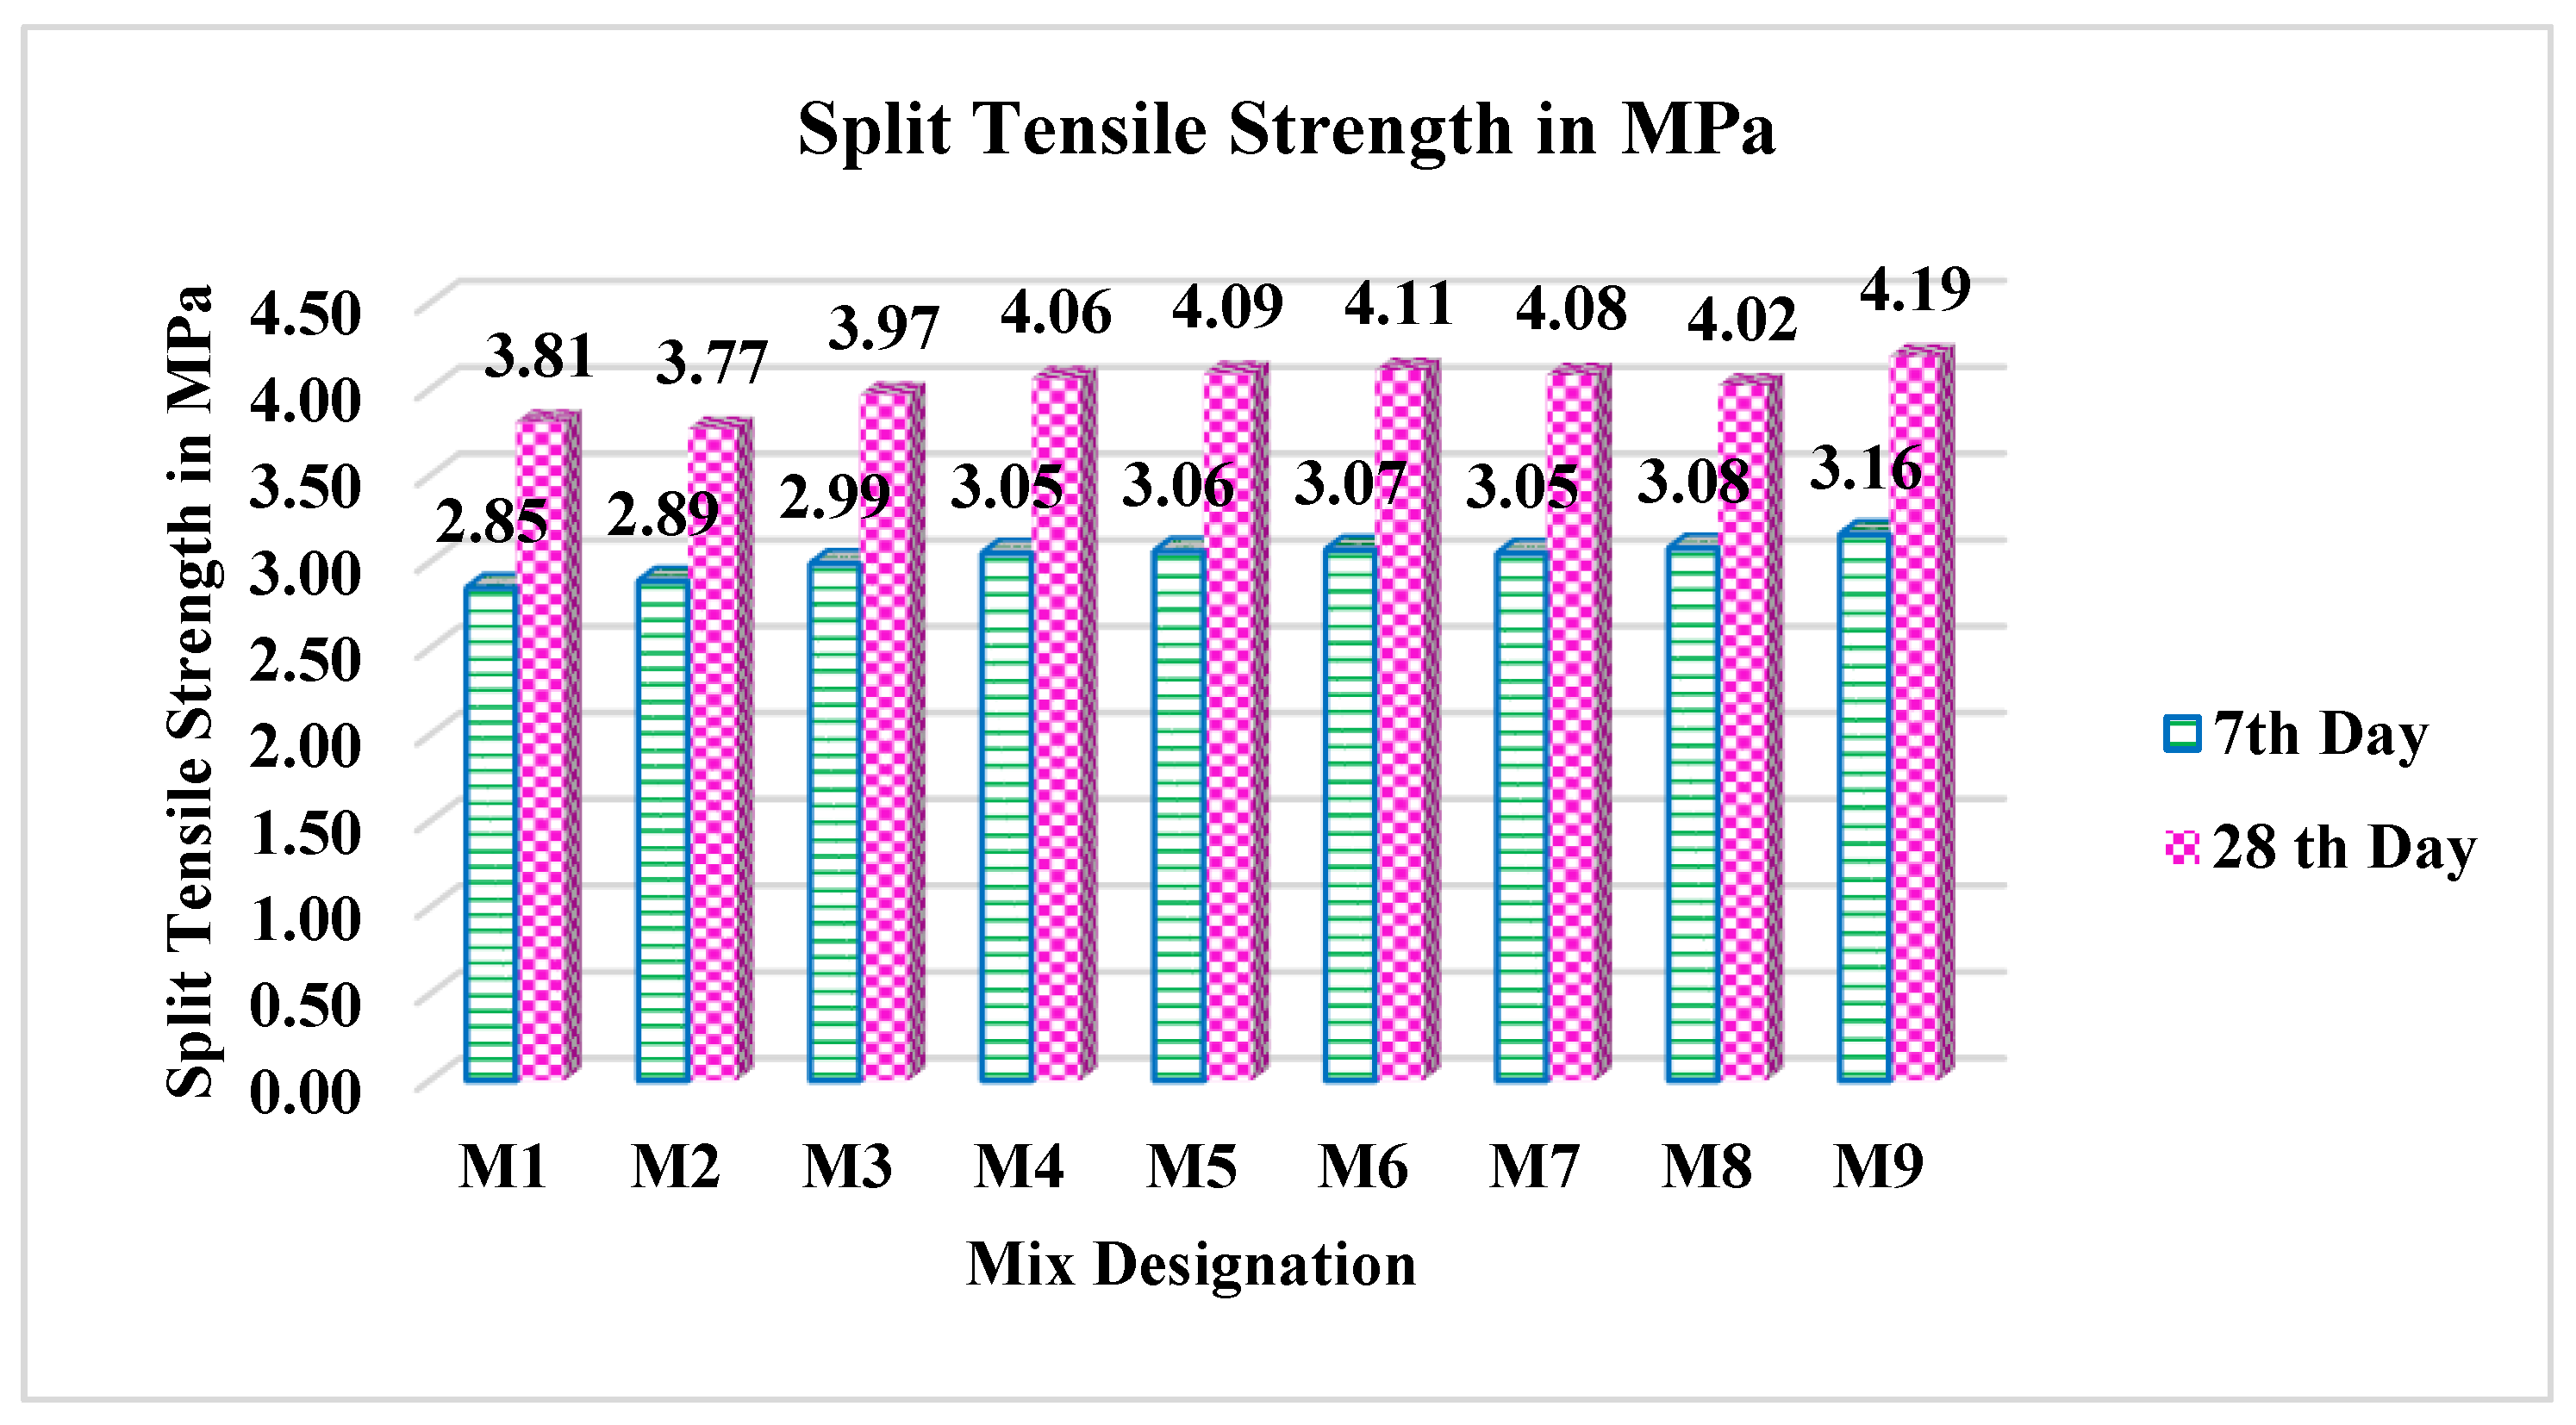
Figure 9 displays the SCGC split tensile strength for different mix proportions. Increasing the proportion of silica fume in the concrete results in improved values of split tensile strength, which is similar to the compressive strength of the concrete. Improved outcomes are obtained in SCGC by increasing the molarities and silica fume content.
6.3. Flexural Strength of the SCGC
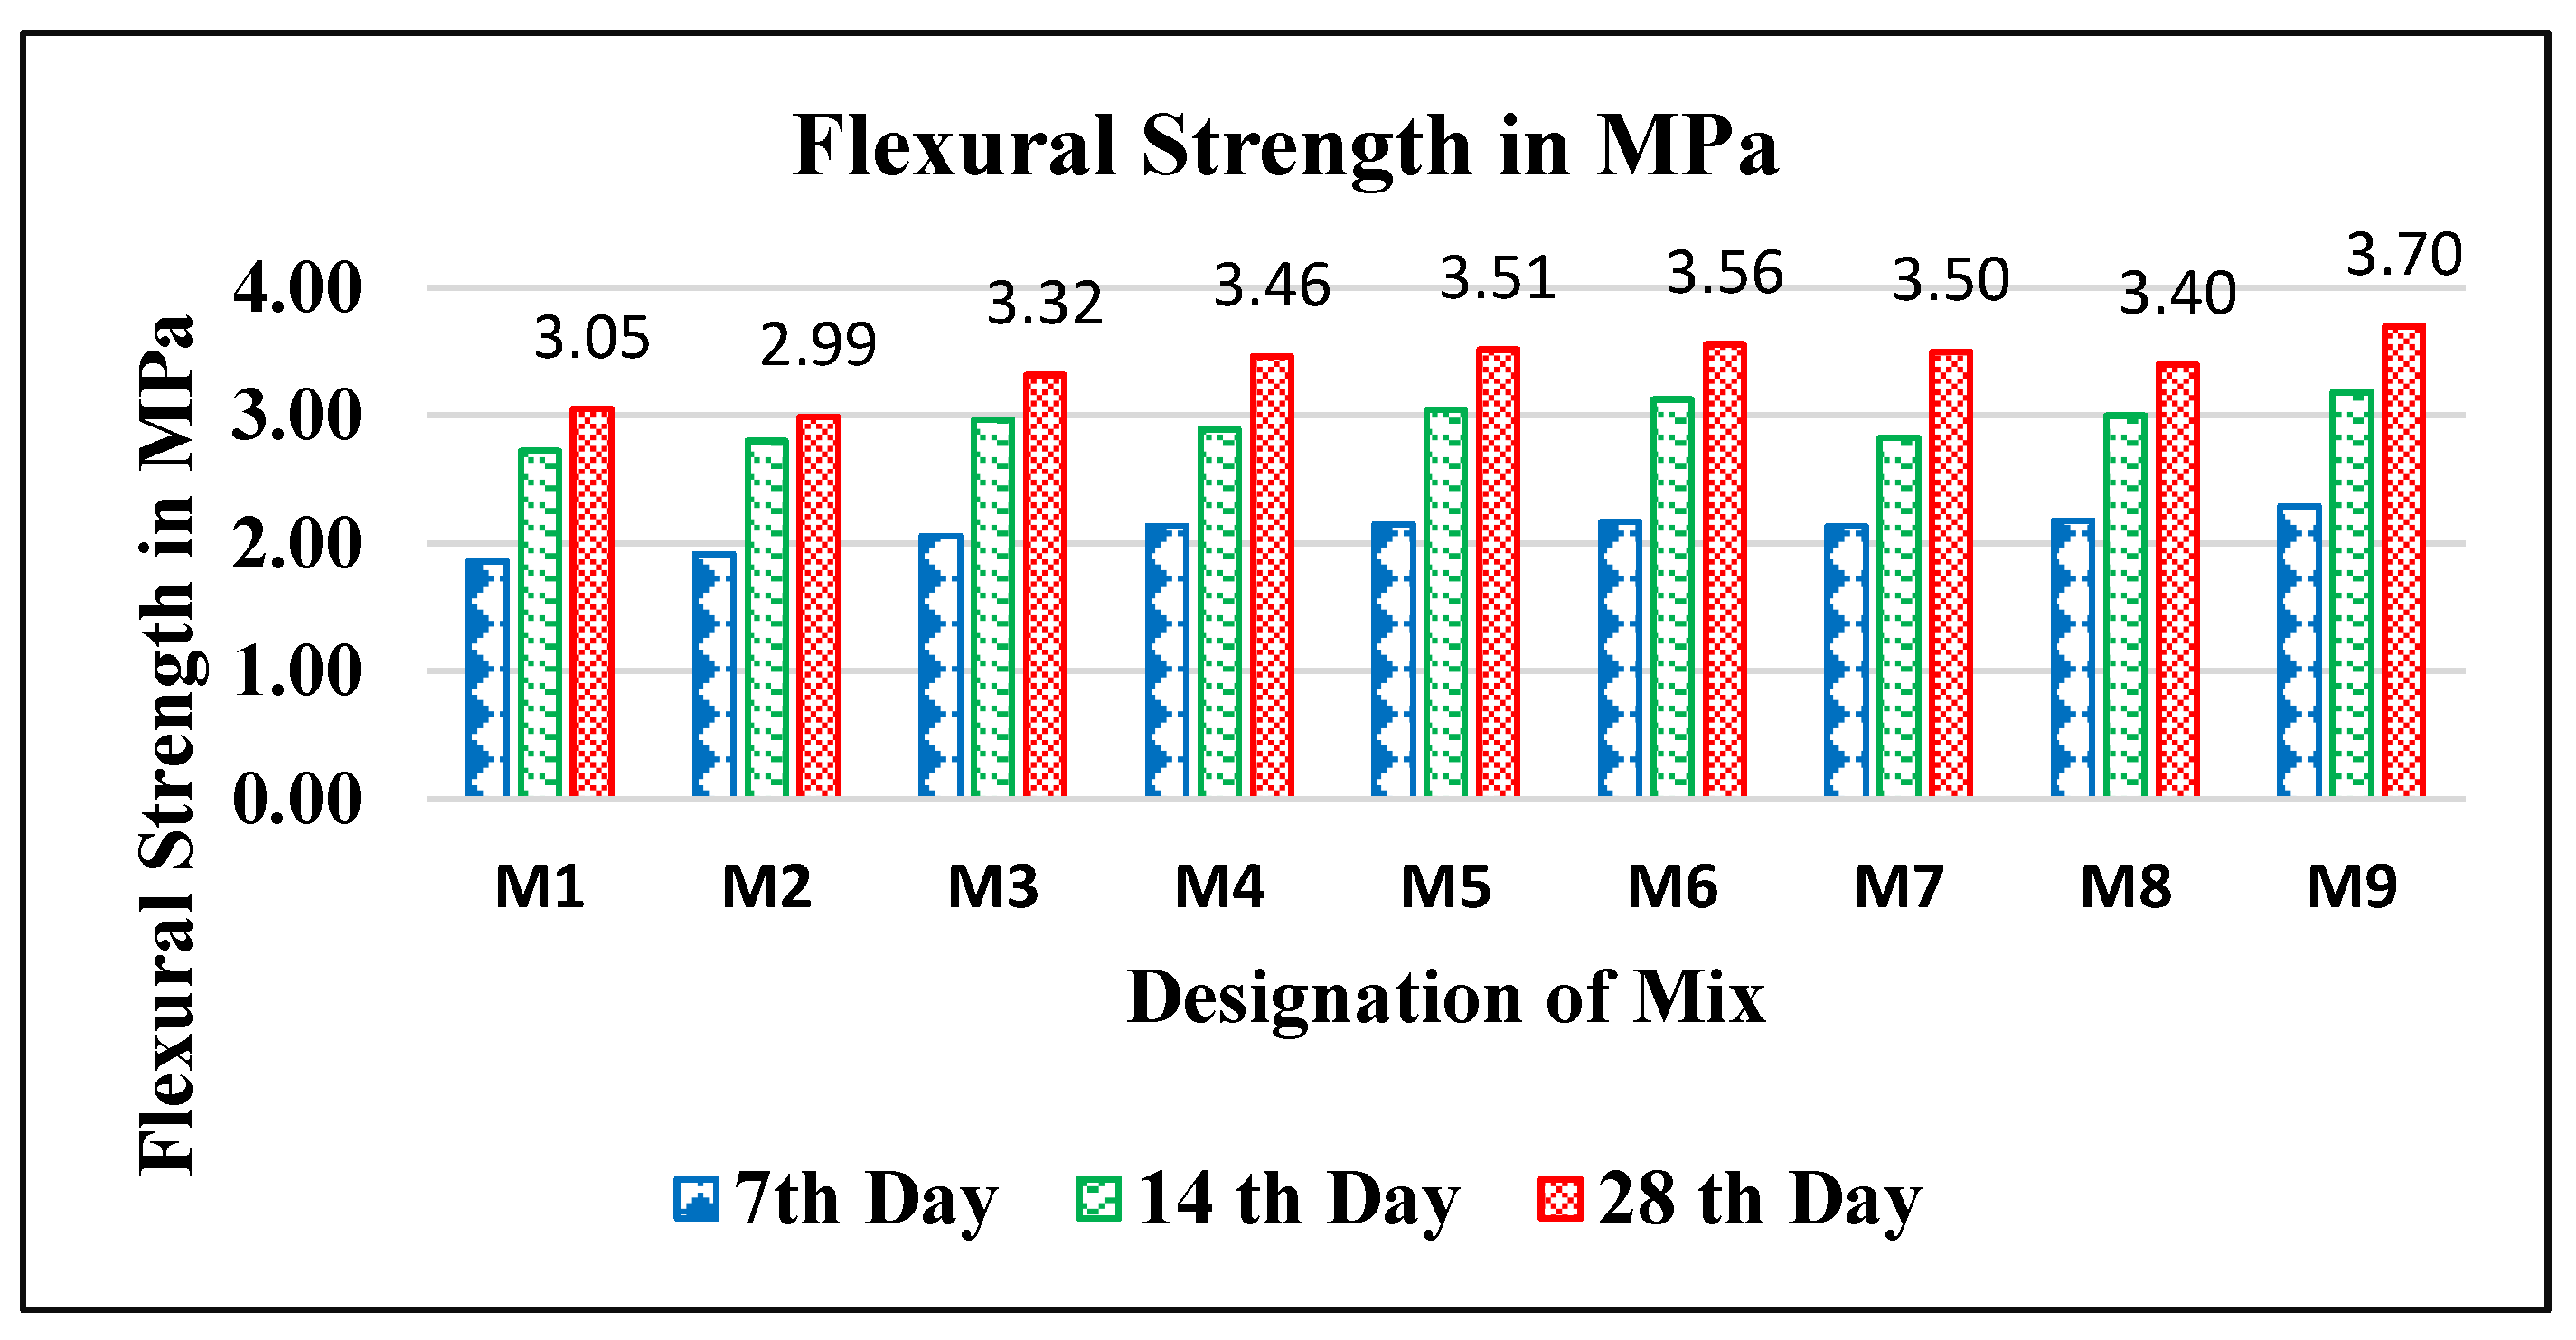
The flexural strength of the SCGC concrete at 28 days was evaluated using an ASTM C78-16 four-point bending test. The experiment was conducted on a prism with dimensions of 100x100x500 mm. A surge in compressive strength often accompanies a corresponding proportionate increase in tensile and flexural strength. A reasonable result was observed for flexure with increased silica fume content. There was not much difference between the strength values obtained for various mixes, but a mild and gradual increase can be seen from mixing M1 to M9. The silica fume will play a significant role in increasing the tensile strength of the prism, as in the split tensile test.
Figure 10 describes the flexural strength of SCGC for different mix proportions
7. Microstructural Analysis Tests
7.1. SEM
The microstructures of the three different mixes with differing molarities were observed in the microstructures of the 28-day hardened SCGC mixes under ambient curing. A microstructural study was conducted for the M3, M6, and M9 mix proportions. The results showed improved flexural strength, split tensile strength, and compressive strength. The formation of geopolymer gel with an amorphous phase is visually demonstrated in every single micrograph. The microstructure of the 5% silica fume SCGC mix is observed to have a loose and nonhomogeneous distribution of the geopolymer gel matrix, as demonstrated in the mix A figure. Additionally, some particles partially reacted and were spread throughout the mixture. A dense microstructure was observed in the 10% silica fume mixture, also known as SCGC2, in comparison to SCGC1. This was attributed to the homogenous distribution of the geopolymer gel and C-S-H gel, which resulted in a reduced number of pores and cracks. The single large crack observed is due to the evaporation of water at higher temperatures. Generally, the water needed to achieve the required workability evaporates during temperature curing, resulting in large pores and cracks. The SCGC mixed with 10% silica fume has a better microstructure than the SCGC1 and SCGC3 mixtures because the bonding of the particles is well blended. Mix C with 15% silica fume reacted similarly to mix A when several pores were visible. Hence, mix C can be considered better than A when comparing its homogeneous gel formation and lack of cracks, but it does contain some partially reacted or unreacted particles that make the result not up to the mark.
7.2. Characterization Techniques
7.2.1. XRD Analysis
The XRD patterns of the fly ash, ultrafine GGBS, and silica fume are shown in Figure 11(a), Figure 11(b), and Figure 11(c), respectively. The fly ash had a grain that was not perfectly round. Silica and aluminum oxides, several metal oxides, and unburned carbon were the primary ingredients in fly ash. X-ray diffraction analysis identified quartz, mullite, and an amorphous component derived from aluminosilicate glass as the primary crystalline phases in the fly ash. To investigate the process of phase transition in substances such as ground granulated blast furnace slag (GGBS), X-ray diffraction (XRD) is an essential approach that must be utilized. XRD revealed an amorphous aluminosilicate glassy phase in the GGBS. This phase contains a significant amount of calcium and magnesium. This result highlights the significance of X-ray diffraction (XRD) in the process of characterizing the compositions of materials. Ground granulated blast furnace slag (GGBS) and ultrafine granulated blast furnace slag (UFGGBS) exhibit comparable X-ray diffraction (XRD) patterns characterized by similar diffraction peaks. However, there are minor variations in the magnitudes of peak intensities, the broadening of peaks, or the emergence of additional peaks when dealing with ultrafine GGBS. Ultrafine GGBS changes the XRD pattern by significantly decreasing the particle size. A reduced particle size can broaden diffraction peaks due to a smaller crystallite size and more crystal defects.
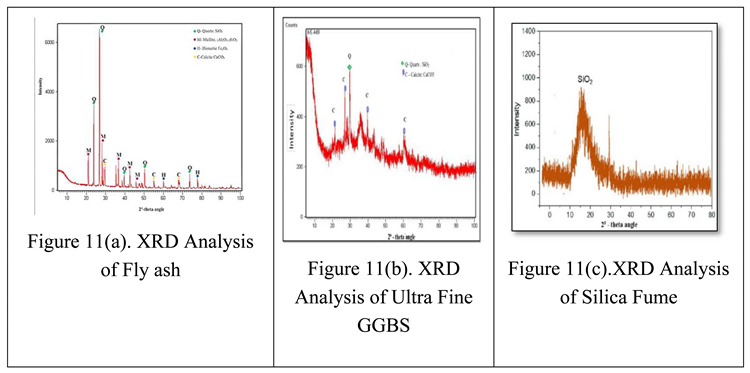
SF is a byproduct of silicon metal and ferrosilicon alloy production. Its high amorphous silica composition results in a reactive pozzolanic material. The XRD pattern of silica fume shows a broad hump rather than separate peaks. As a result, the XRD pattern exhibited a broad hump rather than sharp peaks. This hump is a characteristic feature of amorphous materials. The XRD pattern exhibits minor, wide characteristics caused by the existence of contaminants or minute quantities of crystalline phases.
7.2.2. FTIR Analysis
FTIR spectra of the powdery plaster samples were obtained in the 4000-500 cm
-1 region with a spectral resolution of 2 cm
-1 [
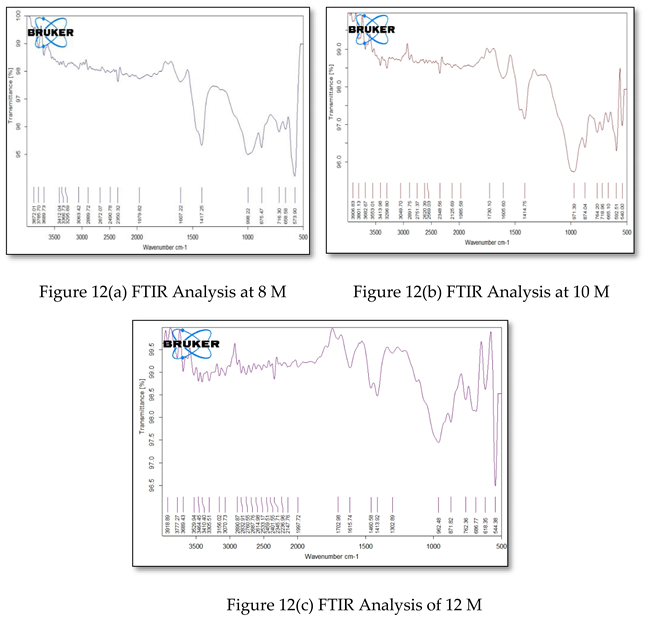
40]. Fourier transform infrared (FTIR) spectroscopy was used to collect quantitative data on various forms of calcium carbonate and mineral combinations, such as thermodynamically stable aragonite and stable calcite. Figures 12(a), 12(b), and 12(c) show the FTIR analysis of the self-compacting concrete samples. The FTIR results identified minerals such as calcite and CSH in the SCC samples. The minerals in the form of calcite and CSH in mortar increase carbonation and, therefore, compressive strength and prevent premature cracking of the SCGC samples due to water retention characteristics.
7.2.3. SEM-EDX Analysis
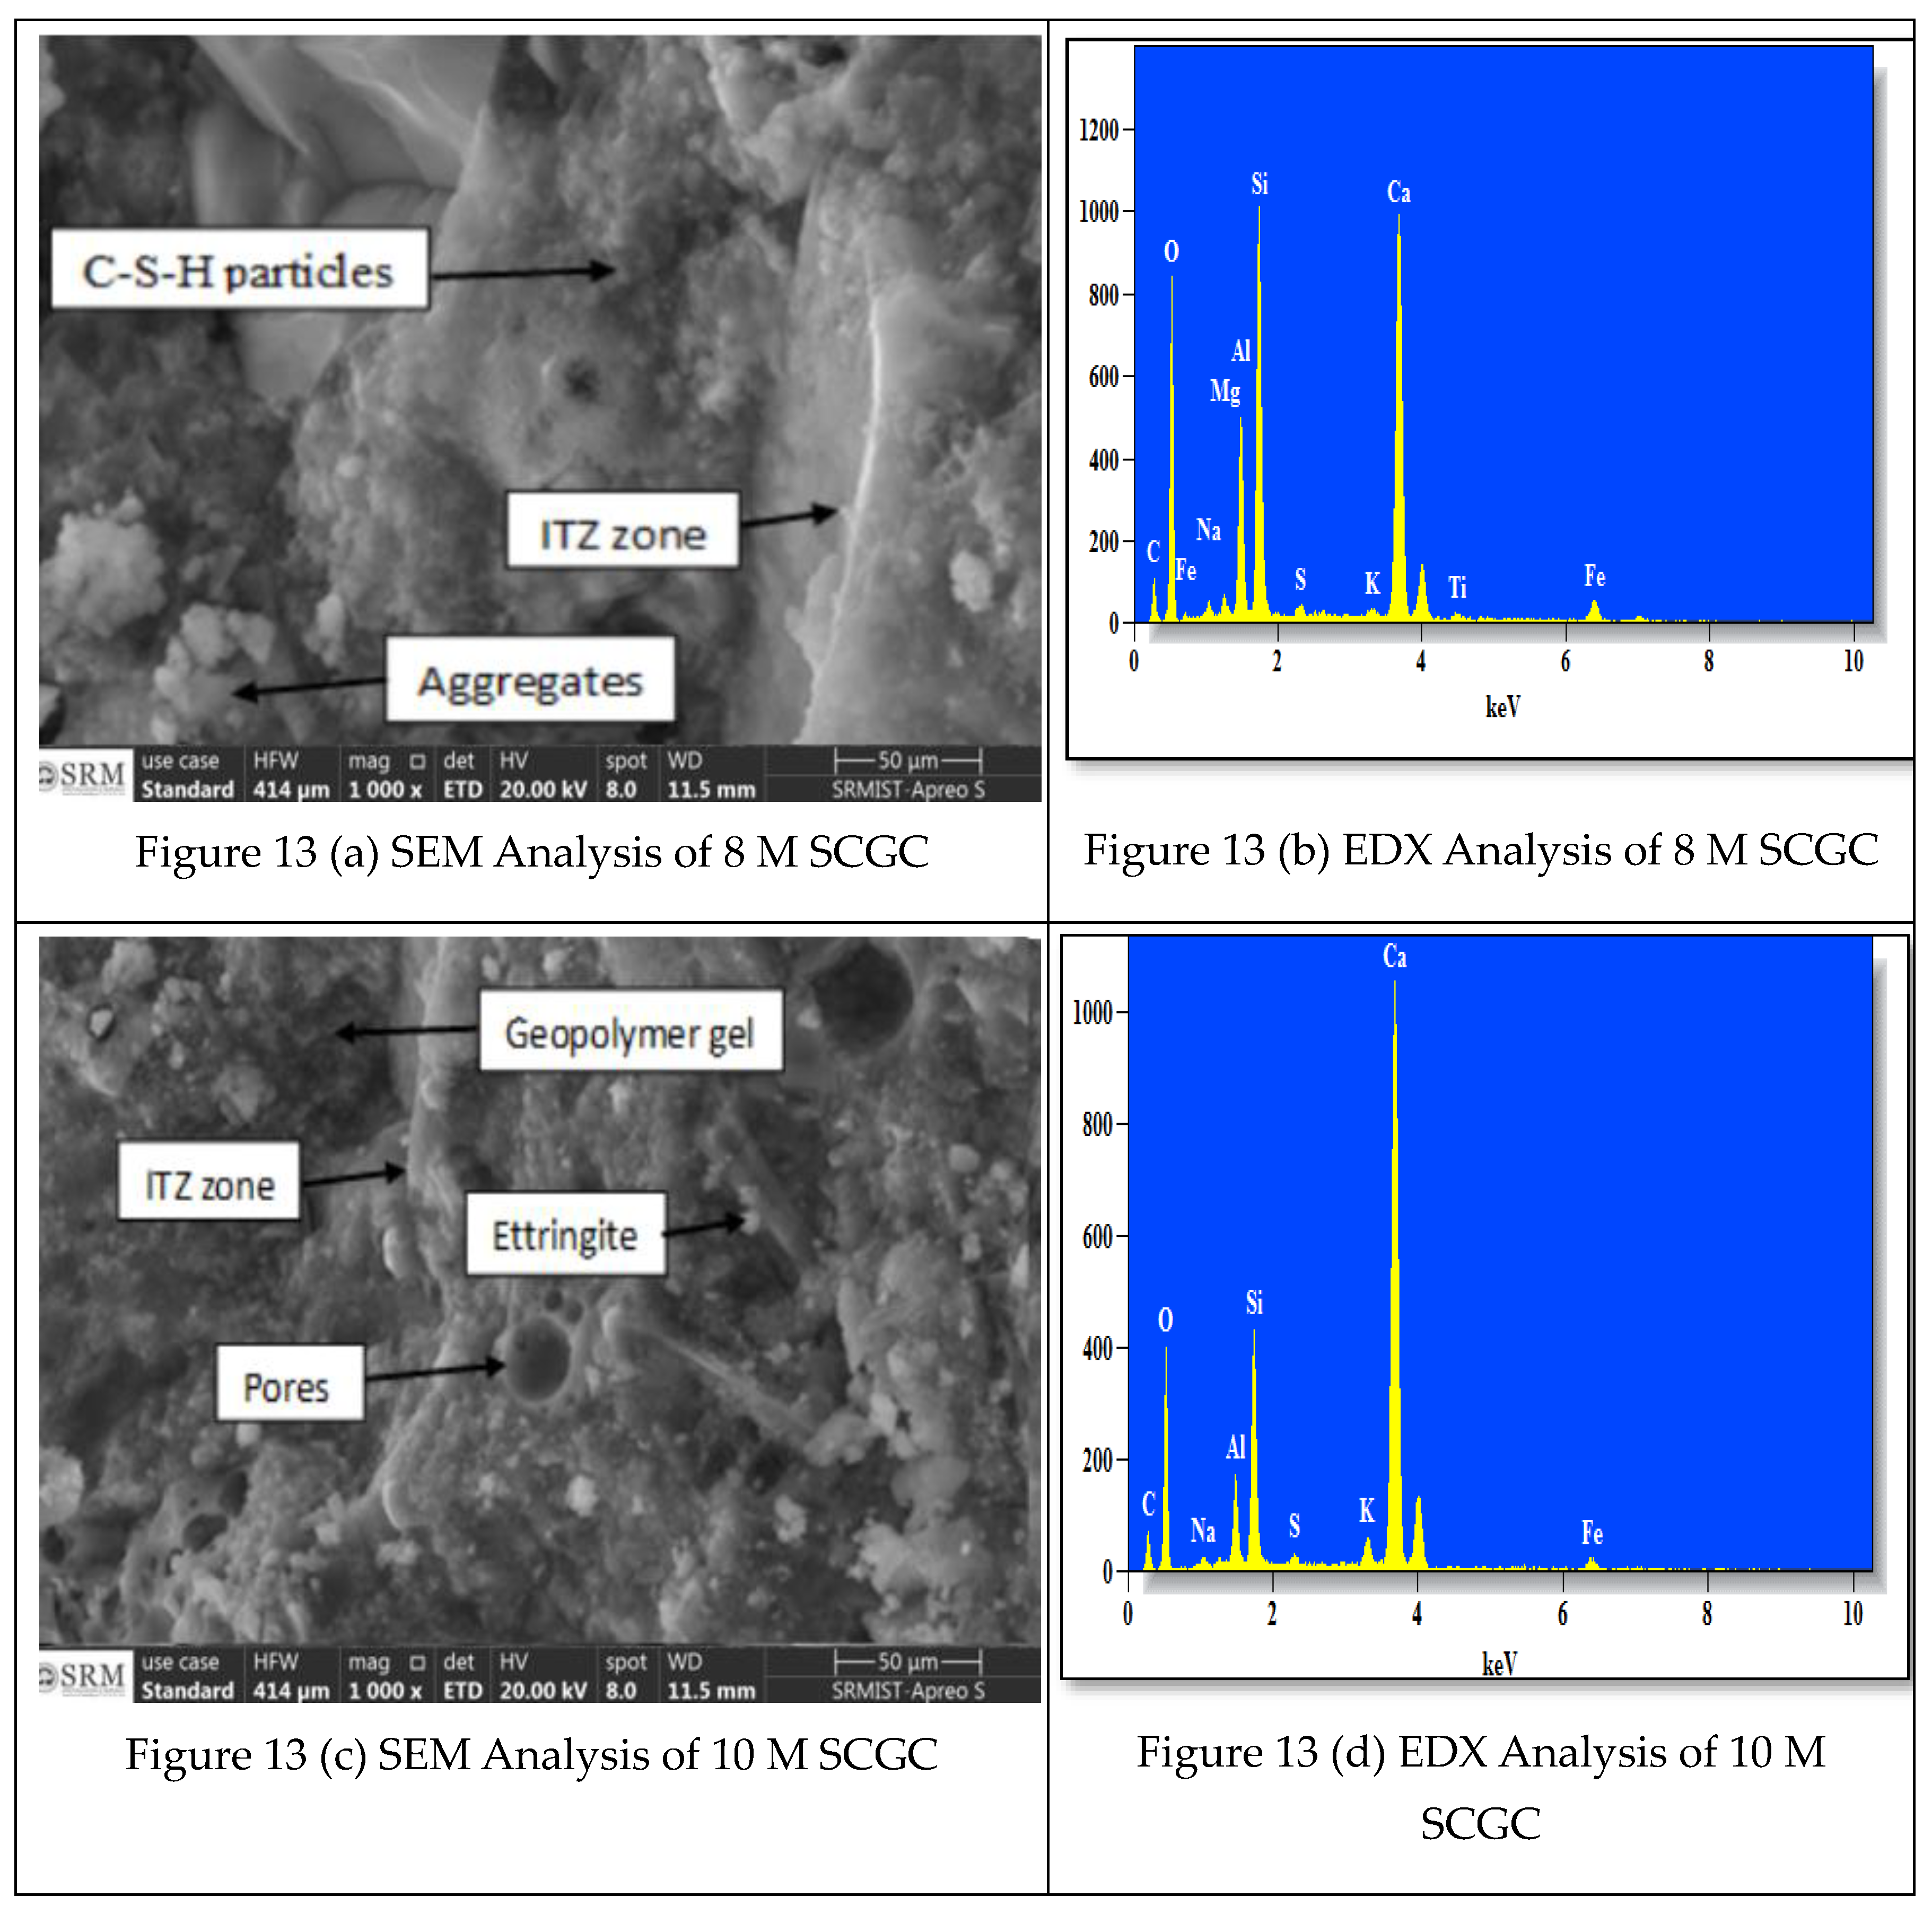
The SEM and EDX results for the above SCGC sample indicate that the mixture is mildly nonhomogeneous compared to the previous mixture. The mix contains large pores in a few places accompanied by dispersed smaller pores; cracks of any size cannot be seen in the SEM images. The geopolymer gel has been widely dense throughout the image, but certain unreacted or partially reacted components and aggregates can be found in many places of the SEM image. In addition to the above observations from the SEM images, EDX analysis revealed a massive spike in the presence of calcium components in the mixture, indicating that the components with the lowest mass percentages were sodium, sulfur, and iron.
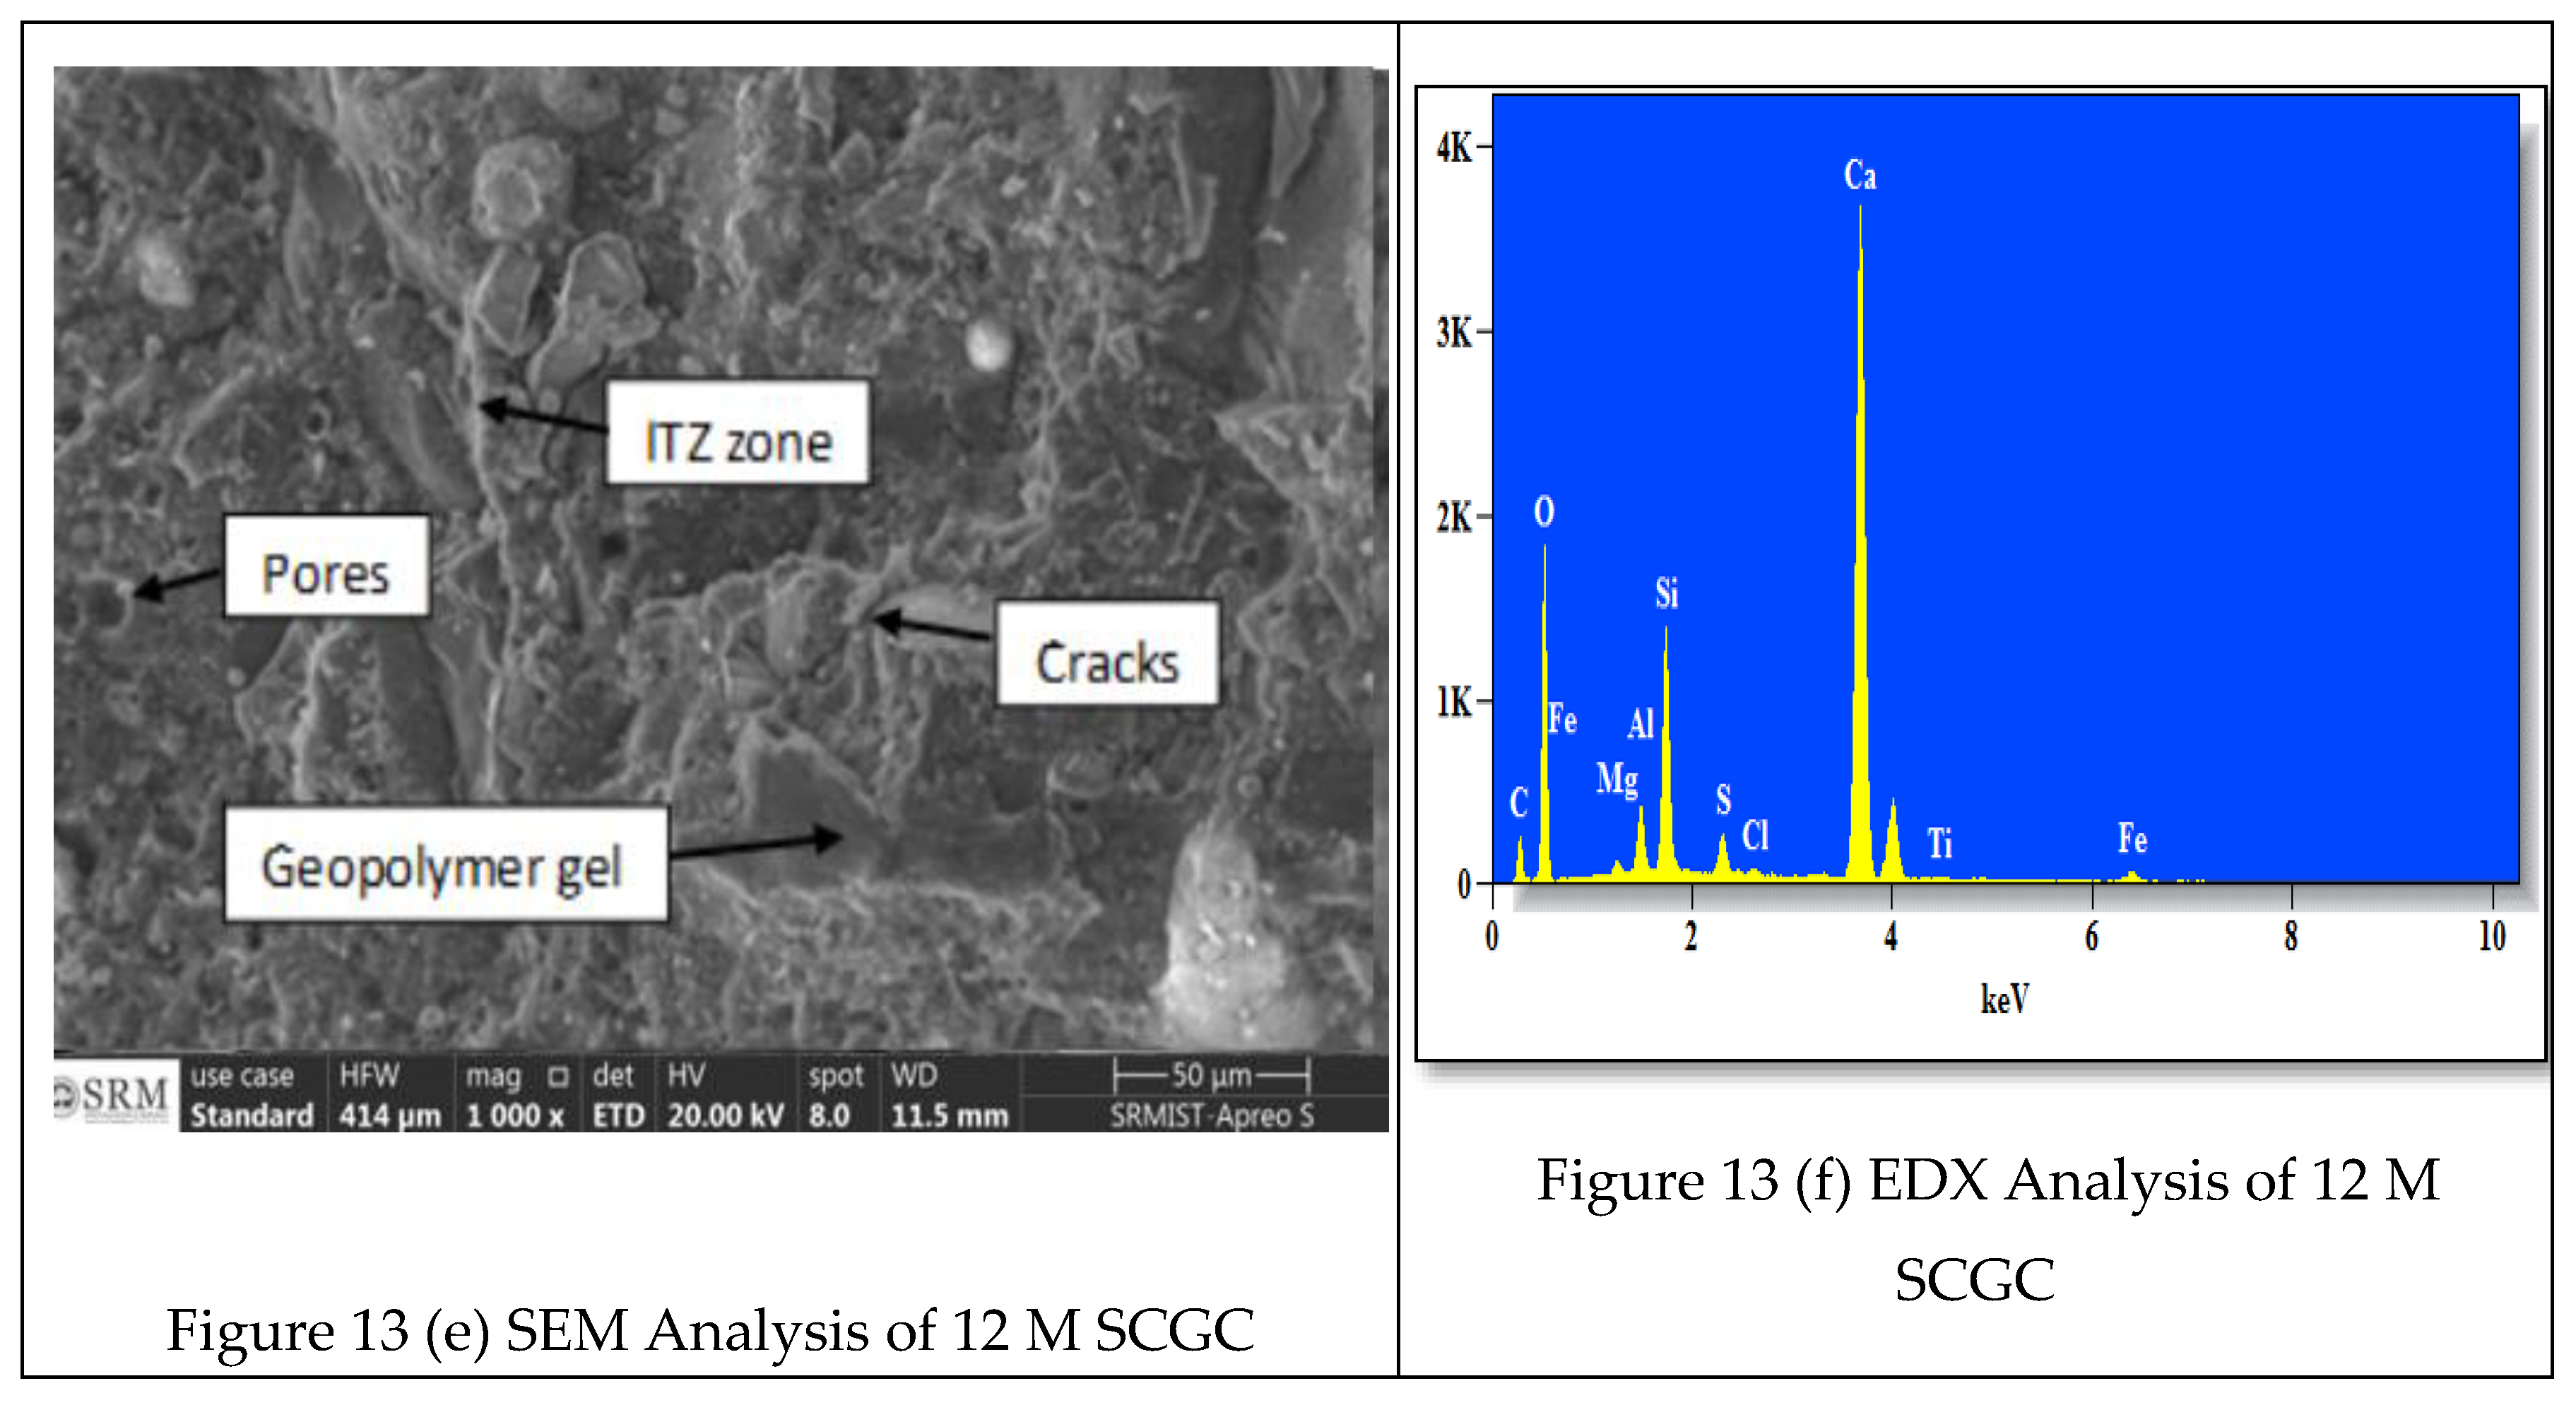
Figure 13 image showing the SEM and EDX analysis results of the SCGC of 8M, 10M, & 12M. It can be observed that the particles are well bonded in the mixture and have created a homogeneous structure. This structure has a very small number of pores and minimal to no cracks, thus resulting in a dense microstructure. The geopolymer gel seems to be in good bonding with the aggregates used, thus reducing the amount of unreacted or partially reacted components in the mixture. According to the EDS results, silica and calcium are the most abundant, while iron and titanium are the least abundant in the mixture.
The broad absorption of the single bond indicates the presence of a hydrogen bond. This band confirms the presence of hydrates (H2O), hydroxyl groups (-OH), ammonium, or amino groups. The sharp absorption at 1400.34 cm-1, 889.67 cm-1, and 710.78 cm-1 in mixed SCGC3 supports the aromatic ring absorption band, namely, the C-H bending vibration with an intensity of moderate to strong absorption, which sometimes has single or multiple absorption bands between 850 and 670 cm-1; aromatic compounds with single and strong absorption bands at approximately 710.78 cm-1. The peaks in mixture C lie at 1401.31 cm-1, 1056.04 cm-1, and 872.80 cm-1, which are again similar to those of mixture M3.
The third set of images depicting the SEM and EDS results of the 12 M SCGC mix shows that the geopolymer mix is loose and nonhomogeneous in its structure. Unlike the previous SEM image, this mixture seems to have only a minimum number of pores, especially those that are smaller in diameter and dispersed throughout the image. Moreover, no major cracks can be observed through the SEM analysis. In addition to the above analysis, it can be seen that the geopolymer gel has better binding than the previous mixture with fewer unreacted particles, which can influence the compressive strength of the material. The EDS results show a similar spike in the calcium component, while iron, titanium, and chlorine can only be scarcely observed in the mixture.
Conclusion
This article presents the effect of mineral admixtures on the mechanical properties and microstructure of self-compacting geopolymer concrete. The following conclusions are drawn based on this research study.
Fresh property tests were performed on all nine ENFAC mixtures. These parameters satisfy the flowability, passing ability, and segregation resistance requirements.
The slump flow decreases as the molarity of SCGC 8 M increases to 10 M and 12 M. Compared to those of the SCGC1 and SCGC2 groups, the workability decreases by nearly 0.87%, 1.05% and 0.94%, respectively. When comparing SCGC1 to SCGC3, the reductions are 1.91%, 2.27%, and 1.15%, respectively.
Increasing the silica fume content and decreasing the ultrafine GGBS content in the mixtures reduced the workability by an average of 2.79% and 4.92%, respectively.
When the molarity of SCGC 8 M is increased to 10 M and 12 M, the compressive strength of the concrete improves. Compared to those of the SCGC1 and SCGC2 groups, the compressive strengths of the SCGC1 and SCGC2 groups improved by approximately 13.4%, 17.5%, and 7.3%, respectively. When comparing SCGC1 to SCGC3, the percentages increase to 14.7%, 13.6%, and 11.5%, respectively.
The increased amount of C-S-H gel, together with the decreased porosity, strengthens the connection between the cementitious matrix and the aggregates. This enhanced interfacial transition zone (ITZ) contributes to increased load transfer and, as a result, greater flexural strength.
The increased ultrafine content and chemical+l compounds used in concrete influence its strength and lead to the formation of large crystals of calcium hydroxide, which weakens the ITZ.
The SEM images demonstrated that SCGC-3 with 12 M performed better according to the microstructural examination. A well-graded grain-packed void-free concrete with a significant degree of primary and secondary C-S-H gel formation was found.
When more than 15% silica fume is added, it causes a balling effect, which in turn decreases the mechanical qualities of the concrete mix and decreases its workability. An additive with silica fume is not inexpensive. The continued utility of increasing percentages may become less economical after a particular threshold.
Acknowledgements
The authors are very thankful to the management of SRM Easwari Engineering College, Chennai, for providing the facilities to perform the work and support the writing and submission of this research article. The project was completed using equipment sponsored by DST-FIST Programme No. SR/FST/College-110/2017, the Government of India and AICTE MODROBS F.No.9.66/RIFD/MODROBS/Policy -1/2017-18 Dt. 28.2.2019, Government of India.
Funding
This research did not receive any exact grant from funding agencies in the public, commercial, or nonprofit sectors.
Data availability statement
Data sharing does not relate to this article as no novel data has been generated or investigated in this study.
References
- Aiken, T. A., Kwasny, J., Sha, W., & Soutsos, M. N. (2018). Effect of slag content and activator dosage on the resistance of fly ash geopolymer binders to sulfuric acid attack. Cement and Concrete Research, 111, 23-40.
- Aliques-Granero, J. , Tognonvi, M. T., & Tagnit-Hamou, A. (2019). Durability study of AAMs: Sulfate attack resistance. Construction and Building Materials, 229, 117100.
- Bureau of Indian Standards (BIS). (1970). IS 383. Specification for coarse and fine aggregates from natural sources for concrete. Manak Bhavan, Bahadur Shah Zafar Marc.3, New Delhi.
- Chaudhury, R. , Sharma, U., Thapliyal, P. C., & Singh, L. P. (2023). Low-CO2 emission strategies to achieve net zero targets in the cement sector. Journal of Cleaner Production, 137466.
- Chindaprasirt, P. , & Chalee, W. (2014). Effect of sodium hydroxide concentration on chloride penetration and steel corrosion of fly ash-based geopolymer concrete under marine site. Construction and Building Materials, 63, 303–310. [CrossRef]
- Deb, P. S. , Nath, P., & Sarker, P. K. (2014). The effects of ground granulated blast-furnace slag blending with fly ash and activator content on the workability and strength properties of geopolymer concrete cured at ambient temperature. Materials & Design, 62, 32–39. [CrossRef]
- Demie, S. , Nuruddin, F. M., & Shafiq, N. (2013). Effects of microstructure characteristics of interfacial transition zone on the compressive strength of self-compacting geopolymer concrete. Construction and Building Materials, 41, 91–98. [CrossRef]
- EFNARC. (2005). Specification and guidelines for self-compacting concrete. Farnham: Association House.
- Ganeshan, M. , Sreevidya, V., Nirubanchakravarthy, L., & Sindhu, G. (2017). Use of Portland cement to improve the properties of self-compacting geopolymer concrete. International Journal of ChemTech Research, 10(8), 88.
- Ganeshan, M. , Sreevidya, V., Sindhu, G., Keerthi, G., Kavin, R., Naveen, K., & Ramanathan, M. (2018). Effect of fly ash blending on self-compacting geopolymers for maintaining sustainability in construction. Ecology, Environment & Conservation, 24 (1), 299–305.
- Gourley, J. T. (2003). Geopolymers: Opportunities for environmentally friendly construction materials, the materials conference: Adaptive materials for a modern society, Sydney.
- Guneyisi, E. , & Gesoglu, M. (2008). A study on durability properties of high-performance concretes incorporating high replacement levels of slag. Materials and Structures, 41, 479–493.
- Hardjito, D. , & Vijaya Rangan, B. (2005). Development and properties of low-calcium fly ash-based geopolymer concrete, research report GC 1, Curtin University of Technology, Perth, Austalia.
- Jeyaseela, J. , & Vishnuram, B. G. (2015). Study on workability and durability characteristics of self-compacting geopolymer concrete composites. International Journal of Advanced Technology in Engineering and Science, 3(1), 1246–1256.
- Kannapiran, K. (2012). Durability and flexural behavior of fly ash based geopolymer concrete beam (Ph. D. Thesis) Anna University, Chennai, India, pp. 72–90, 2012.
- Lahoti, M. , Tan, K. H., & Yang, E. H. (2019). A critical review of geopolymer properties for structural fire-resistance applications. Construction and Building Materials, 221, 514-526.
- Liu, Y., Su, P., Li, M., You, Z., & Zhao, M. (2020). Review on evolution and evaluation of asphalt pavement structures and materials. Journal of Traffic and Transportation Engineering (English Edition), 7(5), 573-599.
- Lavanya, G., & Jegan, J. (2015). Durability study on high calcium fly ash based geopolymer concrete, Hindawi Publishing Corporation. Advances in Materials Science and Engineering, 2015, 1. doi:10.1155/2015/731056. [CrossRef]
- Memon, F. A. , Nuruddin, F. M., & Shafiq, N. (2011). Compressive strength and workability characteristics of low-calcium fly ash-based self-compacting geopolymer concrete. World Academy of Science, Engineering and Technology, International Scholarly and Scientific Research & Innovation, 5(2), 64–70.
- Memon, F. A. , Nuruddin, F. M., & Shafiq, N. (2013). Effect of silica fume on the fresh and hardened properties of fly ash-based self-compacting geopolymer concrete. International Journal of Minerals, Metallurgy, and Materials, 20(2), 205–213. [CrossRef]
- Memon, F. A. , Nuruddin, F. M., Demie, S., & Shafiq, N. (2011a). Effect of curing conditions on strength of fly ash- based self-compacting geopolymer concrete. World Academy of Science, Engineering and Technology, 5, 678–681.
- Memon, F. A. , Nuruddin, F. M., Demie, S., & Shafiq, N. (2011b). Effect of superplasticizer and NaOH molarity on workability, compressive strength and microstructure properties of self-compacting geopolymer concrete. International Journal of Civil and Environmental Engineering, 5(2), 122–129.
- Memon, F. A. , Nuruddin, M. F., Khan, S., Ayub, T., & Shafiq, N. (2013). Effect of sodium hydroxide concentration on fresh properties and compressive strength of self-compacting geopolymer concrete. Journal of Engineering Science and Technology, 8, 44–56.
- Muthadhi, A., Vanjinathan, J., & Durai, D. (2016). Experimental investigations on geopolymer concrete based on Class C Fly Ash. Indian Journal of Science and Technology, 9(5), 1–5.
- Nath, P., & Sarker, P. K. (2015). Use of OPC to improve the setting and early strength properties of low calcium fly ash geopolymer concrete cured at room temperature. Cement and Concrete Composites, 55, 205–214.
- Nuruddin, M. F. (2011). Effect of mix composition on workability and compressive strength of self-compacting geopolymer concrete. Canadian Journal of Civil Engineering, 38(11), 1196–1203.
- OpenAI. (2024). ChatGPT [Large language model]. https://chat.openai.com.
- Palomo, A. , Grutzeck, M. W., & Blanco, M. T. (1999). Alkali-activated fly ashes, a cement for the future. Cement and Concrete Research, 29(8), 1323–1329. [CrossRef]
- Pattanapong, T. , Chindaprasirt, P., & Sata, V. (2015). Setting time, strength, and bond of high-calcium fly ash geo- polymer concrete. Journal of Materials in Civil Engineering, 27(7), 1–7.
- Phoongernkham, T. , Chindaprasirt, P., Sata, V., Pangdaeng, S., & Sinsiri, T. (2013). Properties of high calcium fly ash geopolymer paste with portland cement as an additive. International Journal of Minerals, Metallurgy, and Materials, 20(2), 214–220. [CrossRef]
- Phoongernkham, T. , Maegawa, A., Mishima, N., Hatanaka, S., & Chindaprasirt, P. (2015). Effects of sodium hydroxide and sodium silicate solutions on compressive and shear bond strengths of FA–GBFS geopolymer. Construction and Building Materials, 91, 1–8.
- Prasanna Venkatesan, R. , & Chinnaraj, P. K. (2015). Geopolymer concrete with ground granulated blast furnace slag and black rice husk ash. Grad-evinar, 67(8), 741–748.
- Rattanasak, U. , Pankhet, K., Chindaprasirt, P., & Sata, V. (2011). Effect of chemical admixtures on properties of high-calcium fly ash geopolymer. International Journal of Minerals, Metallurgy, and Materials, 18(3), 364–369. [CrossRef]
- Statista Inc. Global Cement Production from 1990 to 2030 Statista, Inc., New York (2018).
- Shill, S. K. , Al-Deen, S., Ashraf, M., & Hutchison, W. (2020). Resistance of fly ash-based geopolymer mortar to both chemicals and high thermal cycles simultaneously. Construction and Building Materials, 239, 117886.
- Skender, Z. , Bali, A., & Kettab, R. (2021). Self-compacting concrete (SCC) behaviour incorporating limestone fines as cement and sand replacement. European Journal of Environmental and Civil Engineering, 25(10), 1852-1873.
- Shafiq, I. , Azreen, M., & Hussin, M. W. (2017). Sulfuric acid resistant of self compacted geopolymer concrete con- taining slag and ceramic waste, MATEC Web of Conferences, 97.
- Sukmak, P., P. , De Silva, Horpibulsuk, S., & Chindaprasirt, P. (2015). Sulfate resistance of clay-portland cement and clay high-calcium fly ash geopolymer. Journal of Materials in Civil Engineering, 27(5), 1–11.
- Tennakoon, C. K. (2015). Assessment of properties of ambient cured geopolymer concrete for construction applications (Ph.D. Thesis). Swinburne University of Technology Melbourne, Australia.
- Thaarrini, J. , & Venkatasubramani, R. (2016). Properties of foundry sand, ground granulated blast furnace slag and bot- tom ash based geopolymers under ambient conditions. Periodica Polytechnica Civil Engineering, 60(2), 159–168.
- Ushaa, T. G. , Anuradha, R., & Venkatasubramani, G. S. (2015). Performance of self-compacting geopolymer concrete containing different mineral admixtures. International Journal of Materials and Engineering Sciences, 22, 471–481.
- Vijaya Rangan, B. (2014). Geopolymer concrete for environmental protection. The Indian Concrete Journal, 88(4), 41–48.
- Vafaei, M. , Allahverdi, A., Dong, P., & Bassim, N. (2018). Acid attack on geopolymer cement mortar based on waste-glass powder and calcium aluminate cement at mild concentration. Construction and Building Materials, 193, 363-372.
|
Disclaimer/Publisher’s Note: The statements, opinions and data contained in all publications are solely those of the individual author(s) and contributor(s) and not of MDPI and/or the editor(s). MDPI and/or the editor(s) disclaim responsibility for any injury to people or property resulting from any ideas, methods, instructions or products referred to in the content. |
© 2024 by the authors. Licensee MDPI, Basel, Switzerland. This article is an open access article distributed under the terms and conditions of the Creative Commons Attribution (CC BY) license (https://creativecommons.org/licenses/by/4.0/).

