Preprint
Article

Effect of Fungal Solid-State Fermentation on the Profile of Phenolic Compounds and on the Nutritional Properties of Grape Pomace

Altmetrics

Downloads

105

Views

40

Comments

0

A peer-reviewed article of this preprint also exists.

Submitted:

03 June 2024

Posted:

05 June 2024

You are already at the latest version

Alerts
Abstract
Grape pomace (GP) is considered a natural source of bioactive compounds. To improve the ex-tractability of bioactive compounds, in this work GP was biologically treated for 15 days with the white-rot fungus Trametes versicolor in laboratory jars and a tray bioreactor under solid-state fermentation (SSF) conditions. During SSF, the activity of lignolytic (laccase, manganese peroxi-dase) and hydrolytic (xylanase, cellulase, β-glucosidase and invertase) enzymes was measured, with the activity of laccase (2.66 U/gdb in jars and 0.96 U/gdb in the bioreactor) and xylanase (346.04 U/gdb in jars and 200.65 U/gdb in the bioreactor) being the highest. The effect of the com-plex enzyme system was reflected in the changes in the chemical composition of GP with in-creasing ash, crude protein and free fat content: 28%, 10% and 17% in the laboratory jars and 29%, 11% and 7% in the bioreactor, respectively. In addition, the biological treatment had a positive effect on the extractability of 13 individual phenolic compounds. Therefore, the applied SSF technique represents an effective strategy to improve the profile of phenolic compounds and the nutritional composition of GP, promoting their valorization and opening the door for potential application in the food industry and other sectors.
Keywords: 
Subject: Public Health and Healthcare  -   Public Health and Health Services

1. Introduction

Grapes are produced intensively worldwide, according to data for 2022 about 75 million tons per year, of which 37% of grapes are produced in Europe [1]. The majority of grapes (almost 80%) are used for wine or juice processing [2]. Therefore, the juice and wine industry produces the largest amount of waste, the so-called grape pomace (GP), which consists of pulp, skin, seeds and sometimes also stems [3,4]. About 20-30% of the total grapes used for winemaking are left behind in the form of GP [5,6]. According to its chemical composition, GP is rich in proteins, fibers, vitamins, sugars, minerals, etc., and what makes it particularly valuable are the phenolic compounds distributed among flavonoids such as flavanols, flavonols, anthocyanins, isoflavones, etc., phenolic acids such as hydroxycinnamic acid and hydroxybenzoic acid derivatives and stilbenes such as viniferin and resveratrol [7,8,9,10]. The mentioned components have antioxidant, anti-inflammatory, cardiovascular, anticancer, cytotoxic and antimicrobial properties, which is why they have various benefits for human health [5,8,10]. However, not all phenolic compounds from grapes are extracted into the wine during production, leaving about 70% of these bioactive compounds in GP [3]. In order to utilize the bioactive compounds and their benefits, many researchers deal with finding alternative uses of GP, such as obtaining extracts with antioxidant properties, composting and use as biomass for energy production, use in the sustainable production of food enriched with polyphenols and fiber, use in encapsulation techniques, use as fermentation substrates and feed for ruminants [6,10,11,12,13,14].
In addition to the fact that a large proportion of phenolic compounds remain in GP after winemaking, it is characteristic not only of GP but of all plant matrices that some phenols are covalently bound to cellulose, hemicellulose, lignin, pectin and structural proteins in the lignocellulosic structure, which gives them the property of insolubility and low extractability. Numerous methods are used for the degradation of lignocellulosic biomass and for extraction of bioactive compounds, but one biological technique that is attracting increasing attention and appears promising for modifying the lignocellulosic complex and releasing soluble phenols is solid-state fermentation (SSF) [6,11]. SSF is the cultivation of microorganisms on a solid substrate without the presence of free water and offers an alternative for the production of various enzymes, bioactive compounds and other valuable components at low production costs [15,16]. SSF is a very complex process whose development is influenced by numerous factors such as the concentration of the inoculum, the chemical composition of the substrate, pH value, temperature, moisture content and aeration [17]. Microorganisms from the group of yeasts, bacteria and fungi are used in SSF but the most common are filamentous fungi such as T. versicolor, which has aroused great interest in medicine, pharmacy and the food industry since ancient times due to its nutritional and therapeutic properties [15,18].
This study aimed to evaluate the effect of SSF with T. versicolor on the release of phenolic compounds from GP and on the modification of chemical composition of GP at laboratory scale (jars and tray bioreactor). This work builds on the lack of literature data on the chemical composition of GP biologically treated with T. versicolor, as the novelty of this work is valuable insights into the modified chemical composition and release of individual phenolic compounds of biologically treated GP by T. versicolor under SSF conditions, as well as considerations for its potential application in the pharmaceutical, food and feed industries.

2. Materials and Methods

2.1. Chemicals and Reagents

Standards for Ultra-High-Performance Liquid Chromatography (UHPLC) analysis of phenolic compounds (phenolic acids, flavan-3-ols, flavonols, procyanidin, stilbenes) were obtained from Sigma Aldrich (Saint Louis, MO, USA), Acros Organics (Geel, Belgium), Extrasynthese (Genay, France) and Applihem (Darmstadt, Germany). Reagents for spectrophotometric determination of total phenolic compounds, total flavonoids, and total extractable proanthocyanidins were purchased from Alfa Aesar GmbH & Co KG (Kandel, Germany) and Acros Organics (Geel, Belgium). Standards for UHPLC analysis of sugars were purchased from Acros Organics (Geel, Belgium). UHPLC grade reagents (methanol, acetonitrile, glacial acetic acid) were purchased from J.T. Baker (Arnhem, The Netherlands), Macron Fine Chemicals (Gliwice, Poland) and Fisher Chemical (Loughborough, United Kingdom). Hydrochloric acid, sulfuric acid, n-butanol, and n-hexane were obtained from Carlo Erba Reagents GmbH (Emmendingen, Germany) and water was deionized in a Milli-Q water purification system (Millipore, Bedford, MA, USA). Ergosterol, 2,2’-azino-bis(3-ethylbenzothiazoline-6-sulfonic acid) diammonium salt (ABTS) and p-nitrophenyl were obtained from Sigma Aldrich (Saint Louis, USA), copper sulfate, 3,5-dinitrosalicylic acid (DNS), p-nitrophenyl-β-D-glucopyranoside, veratryl alcohol and potato dextrose agar from Biolife Italiana (Milan, Italy) and wheat arabinoxylan from Megazyme Ltd (Bray, Ireland).

2.2. Substrate and Microorganism

Initial sample of grape pomace (GP) variety Cabernet Sauvignon was provided by a local winery (Erdut) in eastern Croatia. GP consisted of skin, pulp and seeds. After collection, it was stored at - 20 °C before being used as substrate in solid-state fermentation (SSF).
Biological treatment of GP was carried out with the filamentous fungus Trametes versicolor TV6 (Microbial Culture Collection of the National Institute of Chemistry, Ljubljana, Slovenia) cultivated on potato dextrose agar (PDA) at 27 °C for ten days.

2.3. Biological Treatment of Grape Pomace by Trametes Versicolor

2.3.1. Laboratory Jars

GP was defrozen and coarsely crushed using a blender (Philips, HR 2860), then mixed with 30 mL of distilled water in 720 mL laboratory jars, autoclaved (121 °C / 15 min) and cooled to room temperature. GP was inoculated with a spore suspension which was prepared by vortexing 5 mycelial discs (diameter of 1 cm) of the culture from a Petri dish in 10 mL of sterile water. The spore concentration in the prepared suspensions was 1 x 10⁶ spores/mL, and the moisture content of the substrate after inoculation was about 67%. Incubation was performed at 27 °C in an incubator with a fan set to 10% (KB 115, BINDER GmbH, Tuttlingen, Germany) for 15 days. The height of the substrate layer in the jars was about 4 cm. The GP control sample was prepared in the same way, with the difference that the same amount of sterile water was added instead of the spore suspension, which corresponds to day “0”.

2.3.2. Tray Bioreactor

SSF in the tray bioreactor was performed by distributing pre-sterilized GP (m = 1150 g) mixed with 150 ml water onto the plates, cooling to 27 °C after sterilization of the bioreactor and reaching the desired temperature in the bioreactor (27 °C). The substrate was inoculated by adding 25% of the inoculum in proportion to the total mass of substrate on the plate, mixing the inoculum lightly with the substrate. The inoculum was prepared by cultivating T. versicolor in laboratory jars for 10 days according to the protocol described in subsection 2.3.1. The moisture content of the substrate after inoculation was approximately 71% and the height of the substrate layer on the plate was 2 cm. The process took place under natural aeration without mixing. Humidification in the bioreactor was performed via an external container with sterile water. SSF in the tray bioreactor was carried out for 15 days. A schematic representation and details about the tray bioreactor can be found in the paper published by Planinić et al [19].
After biological treatment in jars and in the tray bioreactor, the samples were sterilized (121 °C / 15 min) to stop the SSF process. The samples were then dried at room temperature for 48 h and ground to a particle size of ≤ 1 mm using an ultracentrifugal mill (Retsch ZM200, Haan, Germany). Then the samples were stored at +4 °C until extraction and further analysis.

2.4. Enzyme Activity Measurement

For the measurement of enzyme activity after 1-10 and 15 days of fermentation, samples were prepared by extracting 2 grams of GP in a buffer solution. The different types of buffer solutions used to prepare the GP extracts for enzyme activity measurement are listed in Table 1. Extraction was performed using a vortex, shaking the samples for 15 seconds every 5 minutes (30 minutes in total). Samples were then centrifuged at 10,000 × g for 5 minutes and the resulting supernatant was used to measure activity of hydrolytic enzymes (xylanase, cellulase, β-glucosidase and invertase) and lignolytic enzymes (laccase, manganese peroxidase; MnP). Measurements were conducted in triplicate using a UV–VIS spectrophotometer (UV-1280, Shimadzu, Kyoto, Japan) and the results were expressed in U/gdb.
The activity of xylanase (endo-1,4-β-xylanase) and cellulose (endoglucanases and exoglucanases) was determined by the DNS method [20,21], β-glucosidase activity was determined according to the study of [22], and invertase activity was determined by the method of [23]. The activities of MnP and laccase were determined by monitoring the oxidation of the substrate 2,6-dimethoxyphenol (DMP) at 469 nm for 120 s according to the method of [24].

2.5. Determination of Biomass Concentration

The biomass concentration was determined using an indirect method by determining the ergosterol concentration. The entire protocol is described in the paper published by Šelo et al. [9]. In brief, the extracts obtained after extraction of the free fats from the GP samples were subjected to saponification followed by extraction with n-hexane. The contents remaining in the flasks were evaporated with rotavapor (Büchi B-210, Flawil, Switzerland) and dissolved by adding 2 mL of methanol, then filtered through a membrane with a pore size of 0.45 µm (Chromafil Xtra PTFE) and used for UHPLC analysis. The ergosterol concentration was expressed as mg of ergosterol per gram of fat (mg/gF).

2.6. Analysis of Chemical Composition of Grape Pomace

The procedure for the preparation of liquid extracts for chemical composition analyzes are shown in Table 2, as well as analyzes carried out on solid samples of GP. For each method, the reference according to which the method was performed is listed. A detailed description and the protocol of the applied methods as well as the calculation formulas can be found in our previously published papers Šelo et al. [9] and Martinović et al. [8].

2.7. Statistical Analysis

The software TIBCO Statistica 14.0.0.15 (TIBCO Software Inc., Palo Alto, CA, USA) was used for statistical data processing. To test the significance of the difference between the arithmetic means of the samples representing the populations, a one-way analysis of variance (ANOVA) was performed, followed by a post-hoc test, i.e., Duncan’s test for multiple ranges (p < 0.05).
Principal component analysis (PCA) was determined by selecting the two highest principal components (PC1 and PC2) that divided the samples according to lignolytic (laccase, MnP) and hydrolytic (β-glucosidase, xylanase, cellulase, invertase) enzyme activities, antioxidant activity measured by DPPH, FRAP and ABTS methods, total phenolic compounds (TP), total flavonoids (TF), total proanthocyanidins (TPA), biomass concentration (BC), carbon and nitrogen ratio (C:N) and duration of SSF (5, 10 and 15 days) in laboratory jars and tray bioreactor.
A Student’s t-test at 95% significance level (p < 0.05) was used to compare the mean values of individual phenolic contents between day “0” (untreated sample) and the day of fermentation when the maximum yield of phenolic compounds was obtained.

3. Results and Discussion

The basidiomycete T. versicolor is a filamentous fungus that belongs to the white rot fungi and is known for its ability to degrade the complex structure of lignocellulosic biomass thanks to a complex system of enzymes it produces during its growth [17]. T. versicolor can be cultivated on various substrates in a wide temperature range, even between 15 and 32 °C [38,39]. Substrate properties such as particle size and chemical composition have a major influence on the performance of the SSF process, as do numerous parameters such as moisture content, temperature, availability of nutrients and fermentation time [40]. In this study, T. versicolor was used for the biological treatment of GP for 15 days in laboratory jars and a tray bioreactor at 27 °C. The solid-state fermentation (SSF) resulted in a loss of substrate mass of 38.52% after 15 days in the jars, as shown in Table 3. The moisture content of the substrate before the start of SSF in jars and bioreactor was 71.8% and 66.9%, respectively, and decreased over time (Table 3). The average temperature in the bioreactor was in the range of 27.0 – 27.6°C and the average temperature of the substrate on the plates was in the range of 26.7 – 27.7°C during the 1-5, 10 and 15 days of fermentation (Table 3).

3.1. Enzyme Activity Measurement

Research reports that white-rot fungi can efficiently degrade lignocellulosic biomass to carbon dioxide and water because they have the ability to produce extracellular enzymes that catalyze the biochemical reactions involved in the degradation of the lignocellulosic complex [11]. In this study, the activity of lignolytic enzymes (laccase, manganese peroxidase; MnP) and hydrolytic enzymes (β-glucosidase, xylanase, cellulase, invertase) was measured during the SSF processes in jars and tray bioreactor (1-10 and 15 days of SSF).
T. versicolor produces a complex system of enzymes and is best known for the production of the enzyme laccase [17]. Laccase from T. versicolor is used in the enzymatic oligomerization and polymerization of phenolic compounds as an alternative to chemical methods and catalyzes the oxidation of phenolic compounds with the formation of phenoxy radicals and quinones. In the presence of certain reactants, laccase can be involved in the formation of various homomolecular or heteromolecular oligomers or polymers and phenolic, quinonoid or quinoneimine structures [41]. Besides laccase, T. versicolor produces many other enzymes such as oxidases, peroxidases, reductases, hydrolases and pectinases, some of which may also be involved in the degradation of lignocellulosic biomass [6,17,42].
In this study, of the lignolytic enzymes the highest activity was observed for laccase (2.66 U/gdb in jars (6th day) and 0.96 U/gdb in the bioreactor (3rd day)) and of hydrolytic enzymes for xylanase (346.04 U/gdb in jars (15th day) and 200.65 U/gdb in the bioreactor (7th day)) (Figure 1a-c).
MnP and invertase activity was highest after 10 days of SSF in the bioreactor (0.32 U/gdb and 16.24 U/gdb). Cellulase activity was highest after the first day of SSF (1.33 U/gdb) in jars, after which it decreased and followed the same trend until the end of fermentation.
The activity of enzyme β-glucosidase reached a constant increase during 10-day fermentation in both, jars and bioreactor, as shown in Figure 1b. On the 15th day of SSF, there was a decrease in β-glucosidase activity, which could be due to a lack of nutrients for the microorganism leading to a decrease in enzyme production. A similar increasing trend was observed for β-glucosidase after 12 days of SSF of grape seeds with M. anka, which was reported by Zhao et al. [6].

3.2. Determination of Biomass Concentration and pH Measurement

To determine the concentration of biomass, an indirect method was used in which the concentration of ergosterol, the primary sterol in the cell membrane of filamentous fungi, was determined during 1-5, 10 and 15 days of SSF.
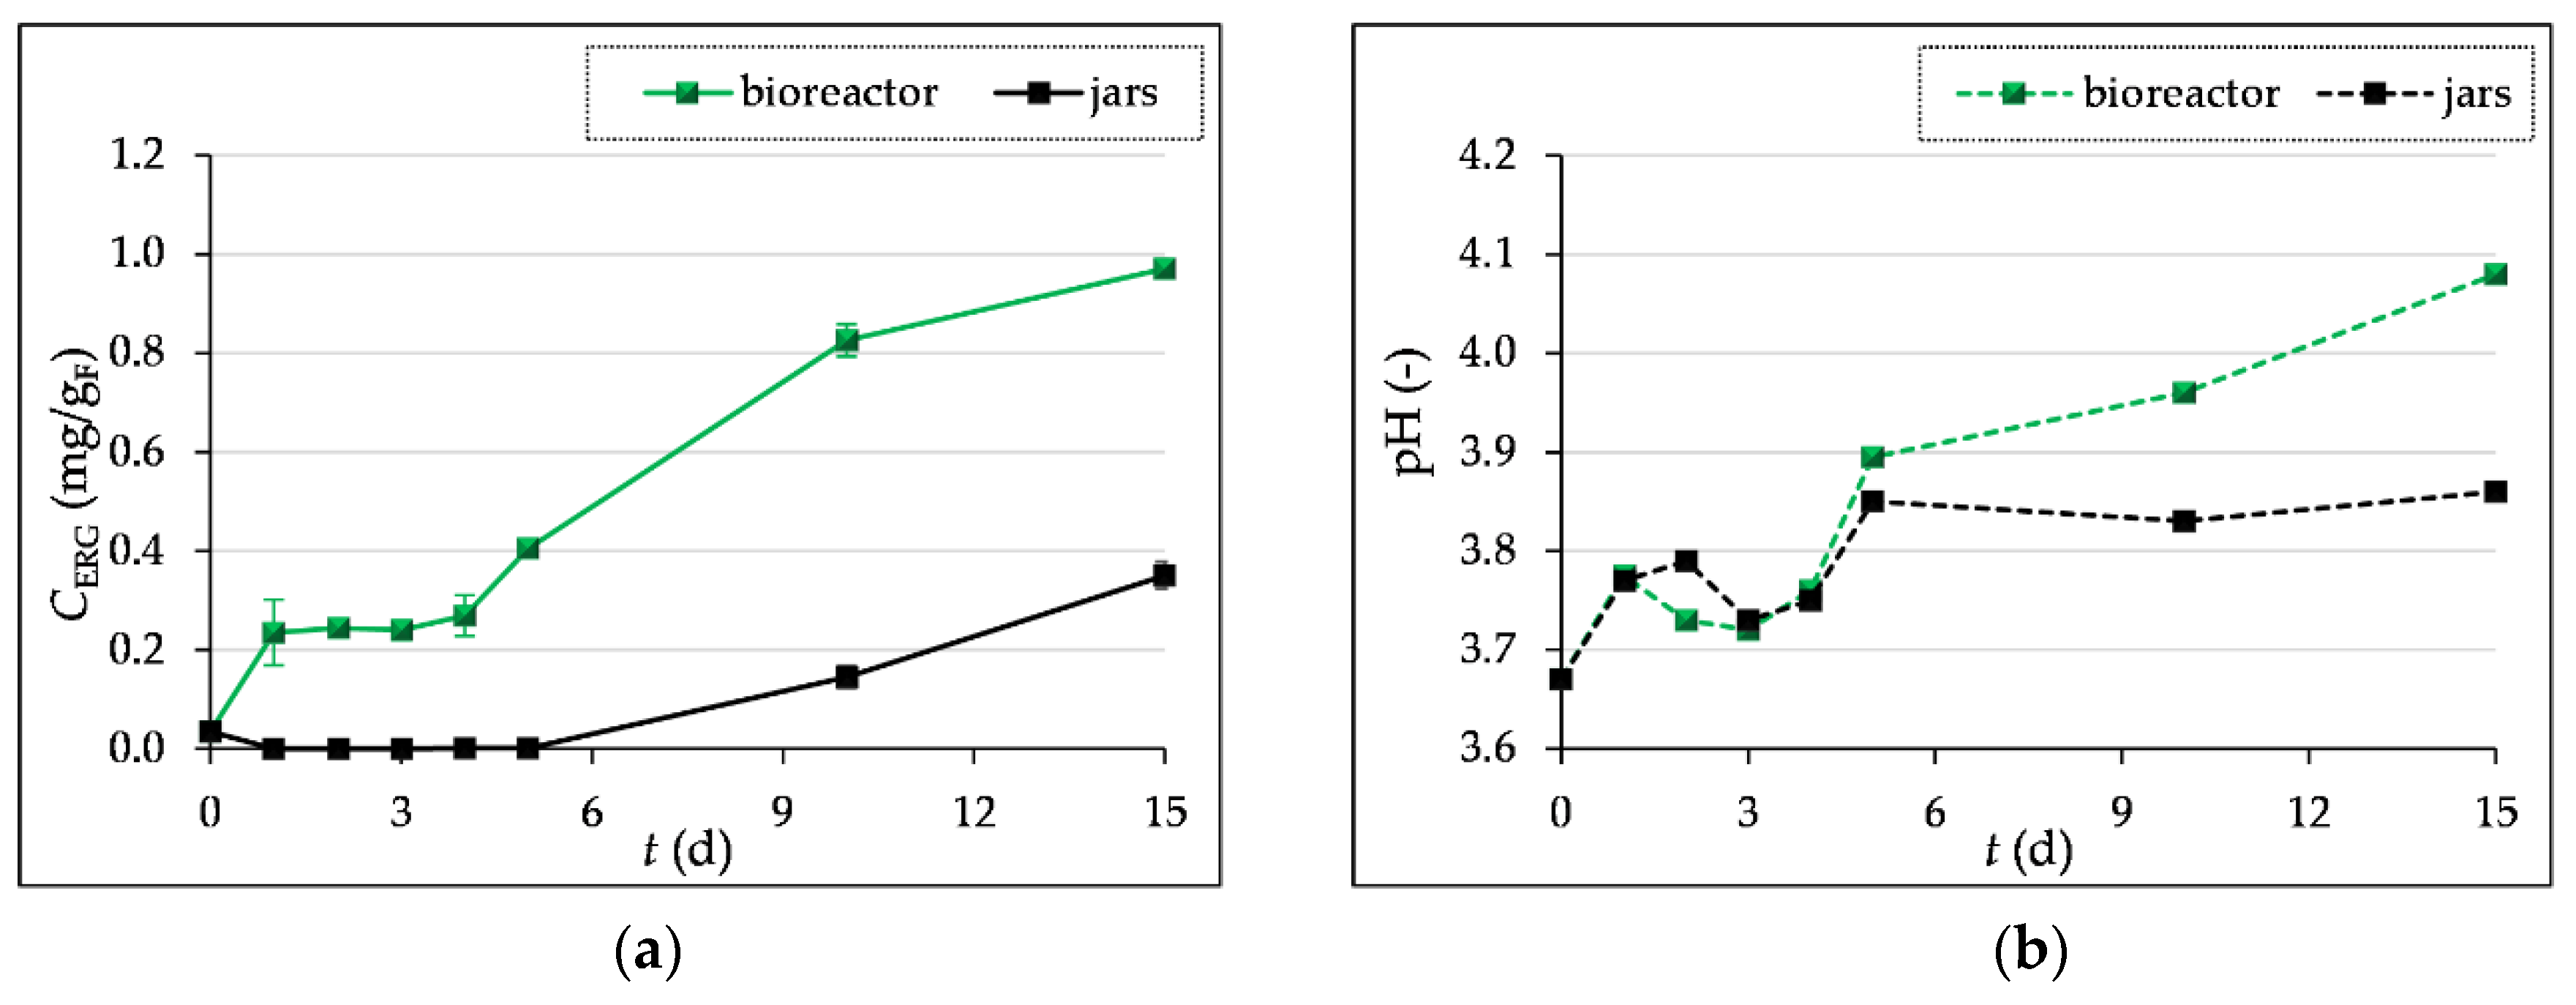
The highest ergosterol content was measured after 15 days of SSF in laboratory jars (0.34 mg/gF) and in the tray bioreactor (0.97 mg/gF). As can be seen in Figure 2a, the ergosterol content in the grape pomace (GP) during SSF in jars is very low for the first 7 days, after which it starts to increase until the end of fermentation. In the process carried out in the bioreactor, the ergosterol content is slightly higher in the first four days than in the laboratory jars. The reason for this is the inoculation of the substrate in the bioreactor with the T. versicolor already cultivated in the laboratory jars. The increase in ergosterol content visible after the 4th day of fermentation in the bioreactor could be related to the faster adaptation and growth of the already grown culture compared to the growth in the laboratory jars, where the inoculum was a prepared spore suspension and the culture needed more time to adapt to the given growth conditions.
In addition to monitoring the biomass concentration, the change in the pH value of the substrate during fermentation was also monitored, as the pH value influences the development of the SSF process, i.e. the production of secondary metabolites [40].
Figure 2b shows a decrease in the pH value of the substrate on days 3 and 4 of SSF compared to the first two days of fermentation, which can be explained by the production of organic acids, while after 5 days a slight increase in pH is observed, which then shows a uniform value with a slight increase until the end of fermentation. The assimilation of organic acids by the microorganism can affect the increase in the pH value [43]. In the bioreactor, the pH value ranged from 3.69 (˝0˝ day) to 4.08 and in the laboratory jars up to 3.86, after 15 days of fermentation.

3.3. Chemical Composition of Grape Pomace

As mentioned in the introduction section, the GP is a heterogeneous mixture of seeds, skin and pulp and is rich in phenolic compounds, proteins, vitamins, aromatic substances, dietary fiber, pectin, minerals and color substances. Its chemical composition can vary greatly depending on the content of the individual components (seeds, skin, pulp) the variety, the degree of ripeness, the harvest and even the winemaking conditions [10,15].
In this study, the results of the chemical composition analysis refer to the dry mass of the sample, and all measurements were performed in triplicate.

3.3.1. Ash, Crude Proteins and Free Fats Content Determination

According to literature, the ash content in GP is in the range of 3 - 9.3%, the protein content in the range of 7 - 14.41% and the fat content in the range of 6.44 - 10.47% [10,11,13,44,45].
In this study, ash content increased by 28% and by 29% after 15 days of fermentation with T. versicolor in laboratory jars and tray bioreactor (Figure 3a). Crude protein content increased by 10% after 15 days of SSF in jars, while in the bioreactor the protein content increased by 11% after 10 days of fermentation (Figure 3b). A 17% increase in free fats content was also observed after 15 days of fermentation in jars, while in the bioreactor free fats content increased by 7% after 5 days of SSF (Figure 3c). From the results presented, it appears that SSF of GP by T. versicolor can improve their nutritional value in terms of mineral, protein and fatty acid enrichment. An improvement in the nutritional composition of grape seeds after SSF with Aspergillus niger was also published by [46].
Gungor et al. [47] reported that fermentation of GP (enriched with a nutrient solution containing glucose, urea, (NH4)2SO4, peptone, KH2PO4 and MgSO4) with Aspergillus niger increased ash content from 4.1% to 8.5% and crude protein content from 12.6% to 28.3%. The increase in crude protein content can be attributed to the production of enzymes and/or mycelia by the fungus used [46,47]. The results of Abid et al. [11] show an increase in crude protein content from 10.3% to 12.8% and 12.9% after four and eight days of SSF of GP with Pleurotus cornucopiae and Ganoderma resinaceum, while ash content also increased from 9.3% to 14.8% and 16.2%.
GP contains minerals of which potassium, phosphorus, calcium and iron are the most abundant. However, the increase in the content of ash and lipids may be related to the growth of the fungus, as the cell wall of fungi contains both lipids and inorganic components and the ash content of fungi varies depending on the fungal species and growth conditions [48,49,50].
Mostafa et al. [38] investigated the composition of wild T. versicolor collected from different locations in northern India and reported that this fungus can accumulate metals element from the environment in which it grows and found the presence of eight metals (Cd, Cr, Cu, Fe, Mn, Zn, Ni and Co). Fluctuations in ash content are caused by various metal elements in the substrate that have been absorbed by the fungal mycelium and then transferred to the upper body parts of T. versicolor. Mostafa et al. [38] also reported that T. versicolor has an average content of protein of 8.12%–11.06%, fat of 0.93%–1.26% and total ash of 2.42%–3.48%.

3.3.2. Crude Fiber Content Determination

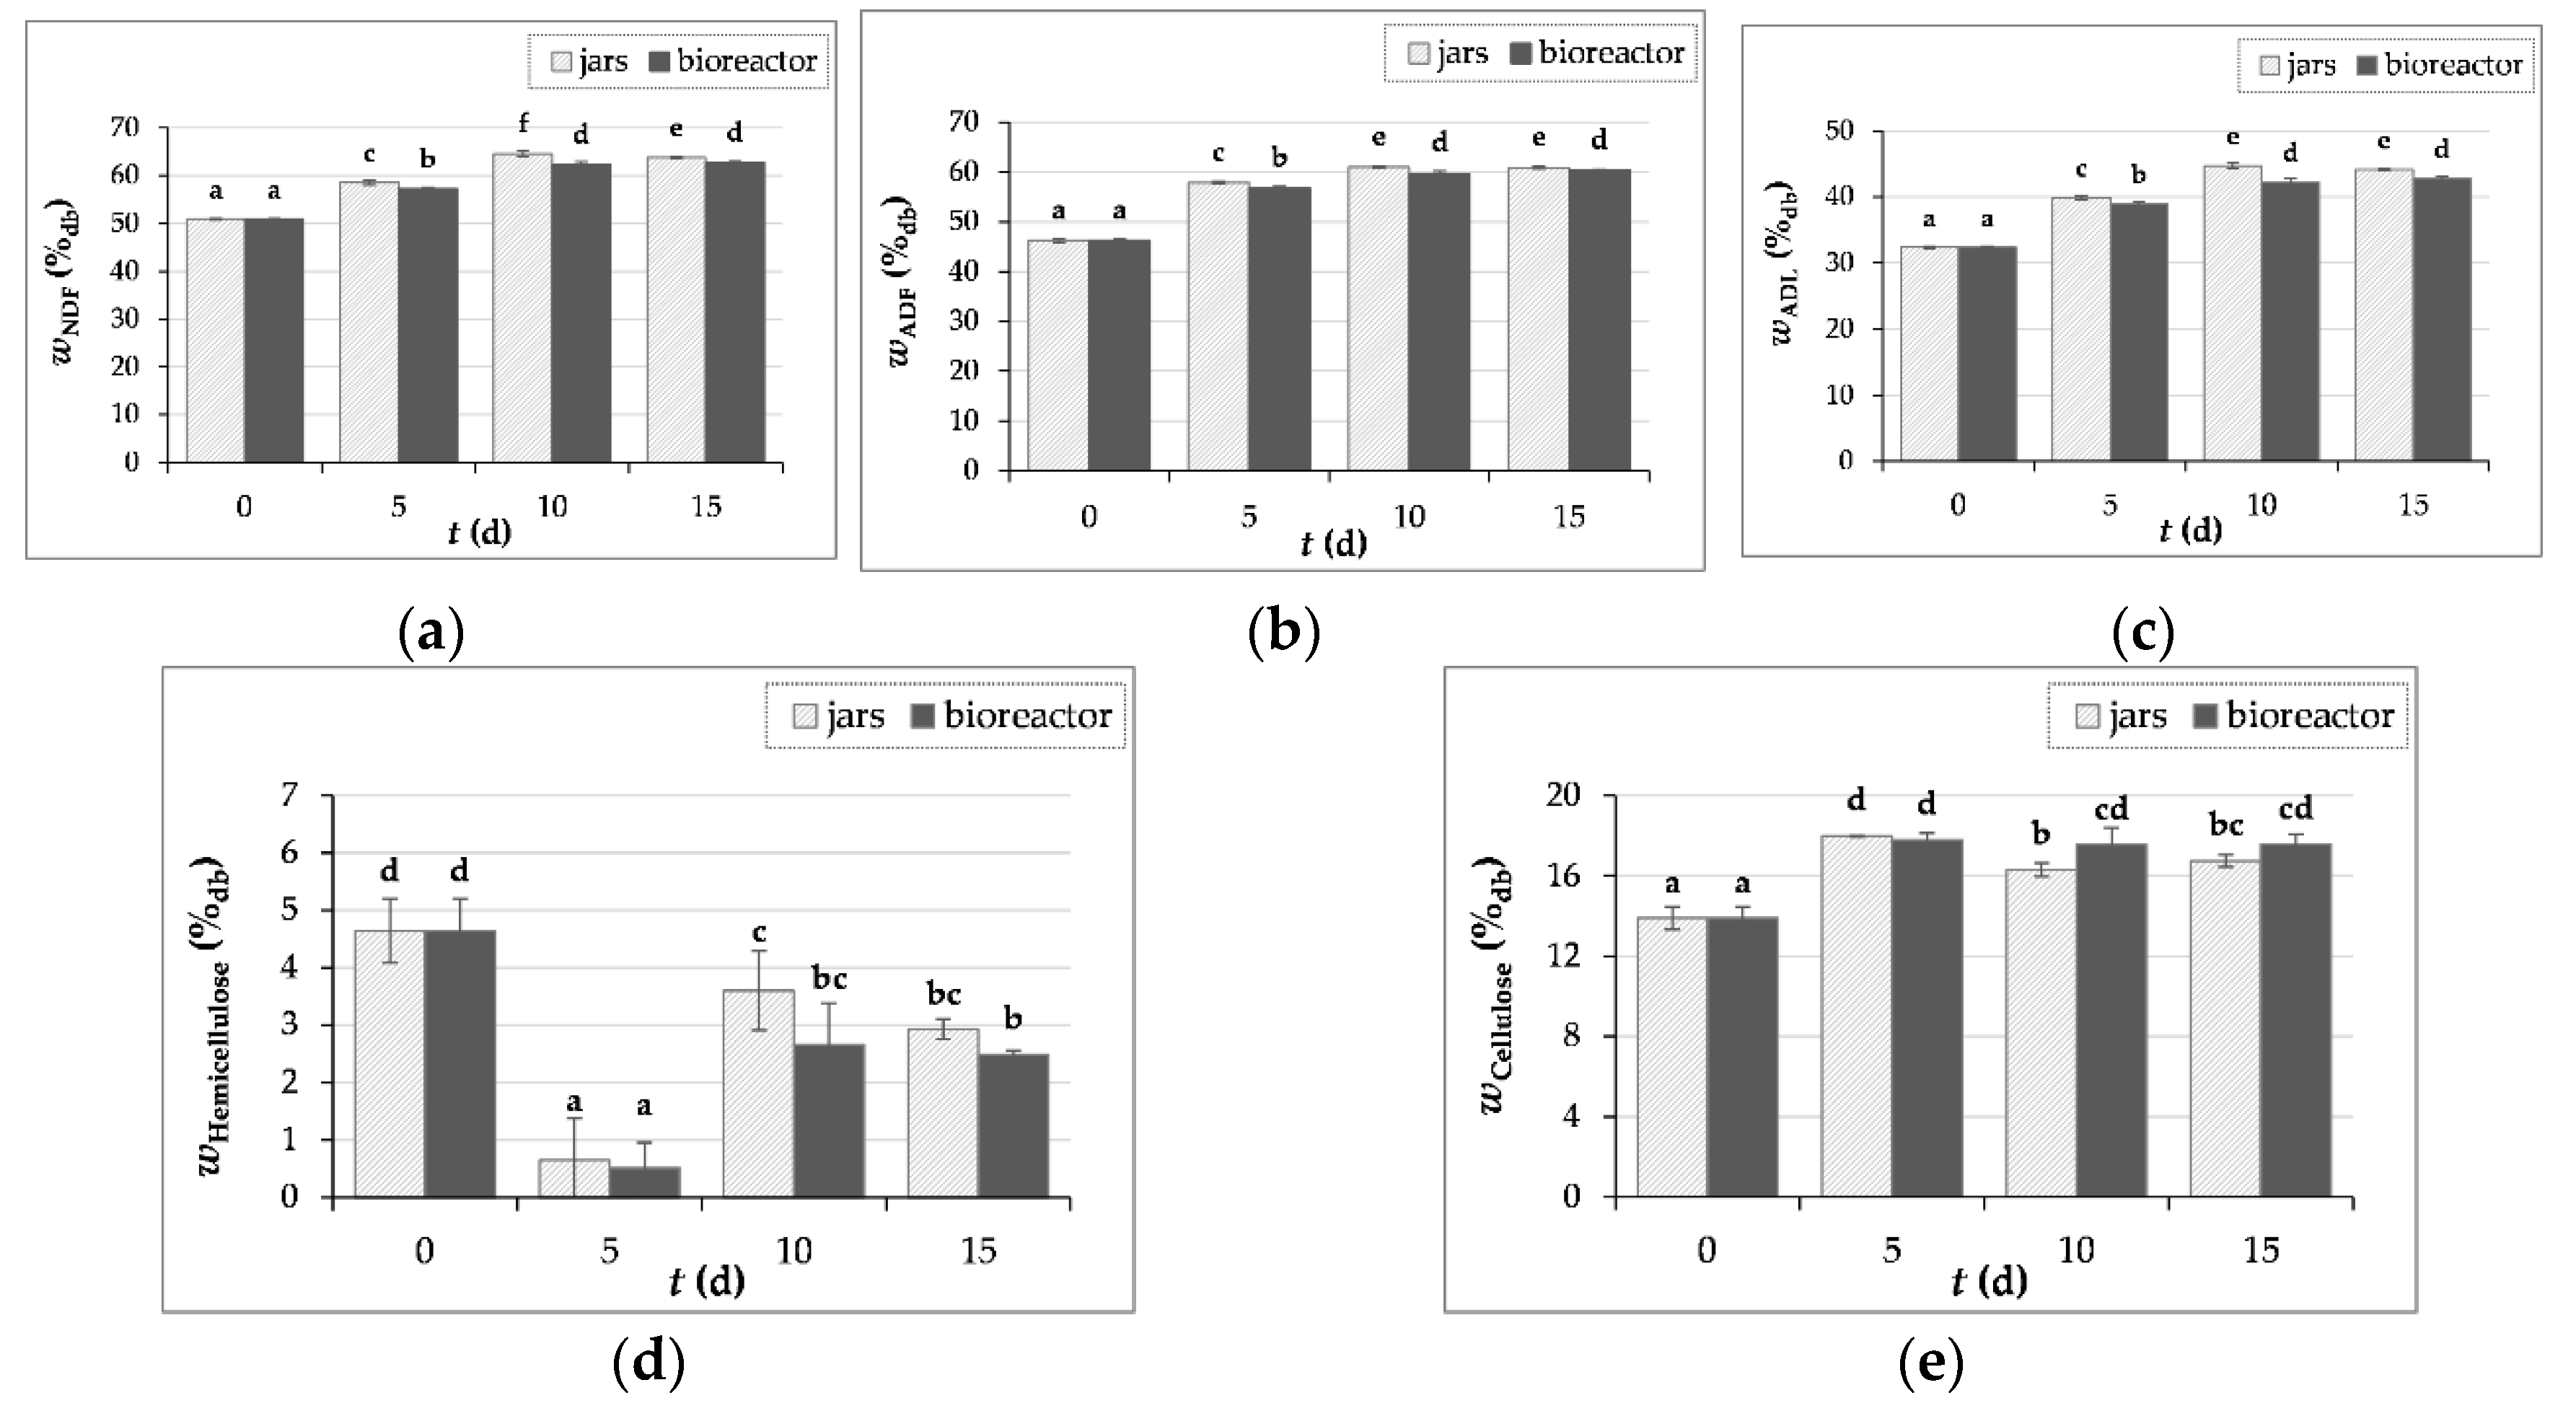
Figure 4a-e shows the results of NDF, ADF and ADL as well as the cellulose and hemicellulose content, whereby the hemicellulose content was calculated as the difference between NDF and ADF and the cellulose content as the difference between ADF and ADL, while ADL represents the lignin content.
During SSF of GP with T. versicolor, an increase in crude fiber content was observed. The NDF, ADF and ADL content increased by 27%, 32% and 38% after 10 days of SSF in jars and by 23%, 30% and 32% after 15 days of SSF in the bioreactor. Similar values for fiber content in the initial GP sample of Cabernet Sauvignon grape variety were published by Martinović et al. [8], where NDF, ADF and ADL contents were 50.33 ± 1.69%, 40.03 ± 2.35% and 25.80 ± 0.92%, respectively.
According to the literature, the lignin content in GP varies between 11.6 – 41.3% [51,52,53]. The high lignin content makes the degradation of GP more difficult, as it is more difficult for microorganisms to access cellulose and hemicellulose [53]. In this study, the lignin content in the initial sample of GP was 32.36 ± 0.20%. An increase in the lignin content was observed from 32.36 ± 0.20% to 44.71 ± 0.39% in jars (day 10) and 42.71 ± 0.31% in a bioreactor (day 15) (Figure 4c). Cellulose content in GP increased by 29% and by 28% after 5 days of biological treatment in jars and bioreactor, after which the cellulose content decreases until the 15th day of fermentation (Figure 4e). Figure 4d shows a decrease in the hemicellulose content, which could be a consequence of the action of hydrolytic enzymes such as xylanase produced by T. versicolor. Xylanases act on the decomposition of xylan, the main unit of hemicellulose, as shown by the increase in the concentration of arabinose and xylose released from the hemicellulose structure in the SSF process carried out in jars and bioreactor [54].
Abid et al. [11] reported that in GP treated with Pleurotus cornucopiae and Ganoderma resinaceum the crude fiber content decreases after four and eight weeks of fermentation, suggesting that the timing of fermentation is crucial and it is necessary to determine the optimal duration of SSF depending on the desired product.
The results of crude fiber obtained in our study could be related to the fact that microorganisms initially use simple and readily available carbon sources such as simple sugars for their growth. They then produce hydrolytic enzymes that catalyze the hydrolysis reaction of complex polysaccharides into simpler polysaccharides. The reason for the increase in lignin and cellulose content could therefore be that the fungus first consumes other components present in the substrate.

3.3.3. Measurement of Sugar Concentration

From a total of 13 analyzed standards of individual sugars; ribose, cellobiose, galactose, maltose monohydrate, mannose, arabinose, maltotriose, rhamnose, sucrose, glucose, fructose, arabinose and xylose, the last five sugars were quantified in GP extracts.
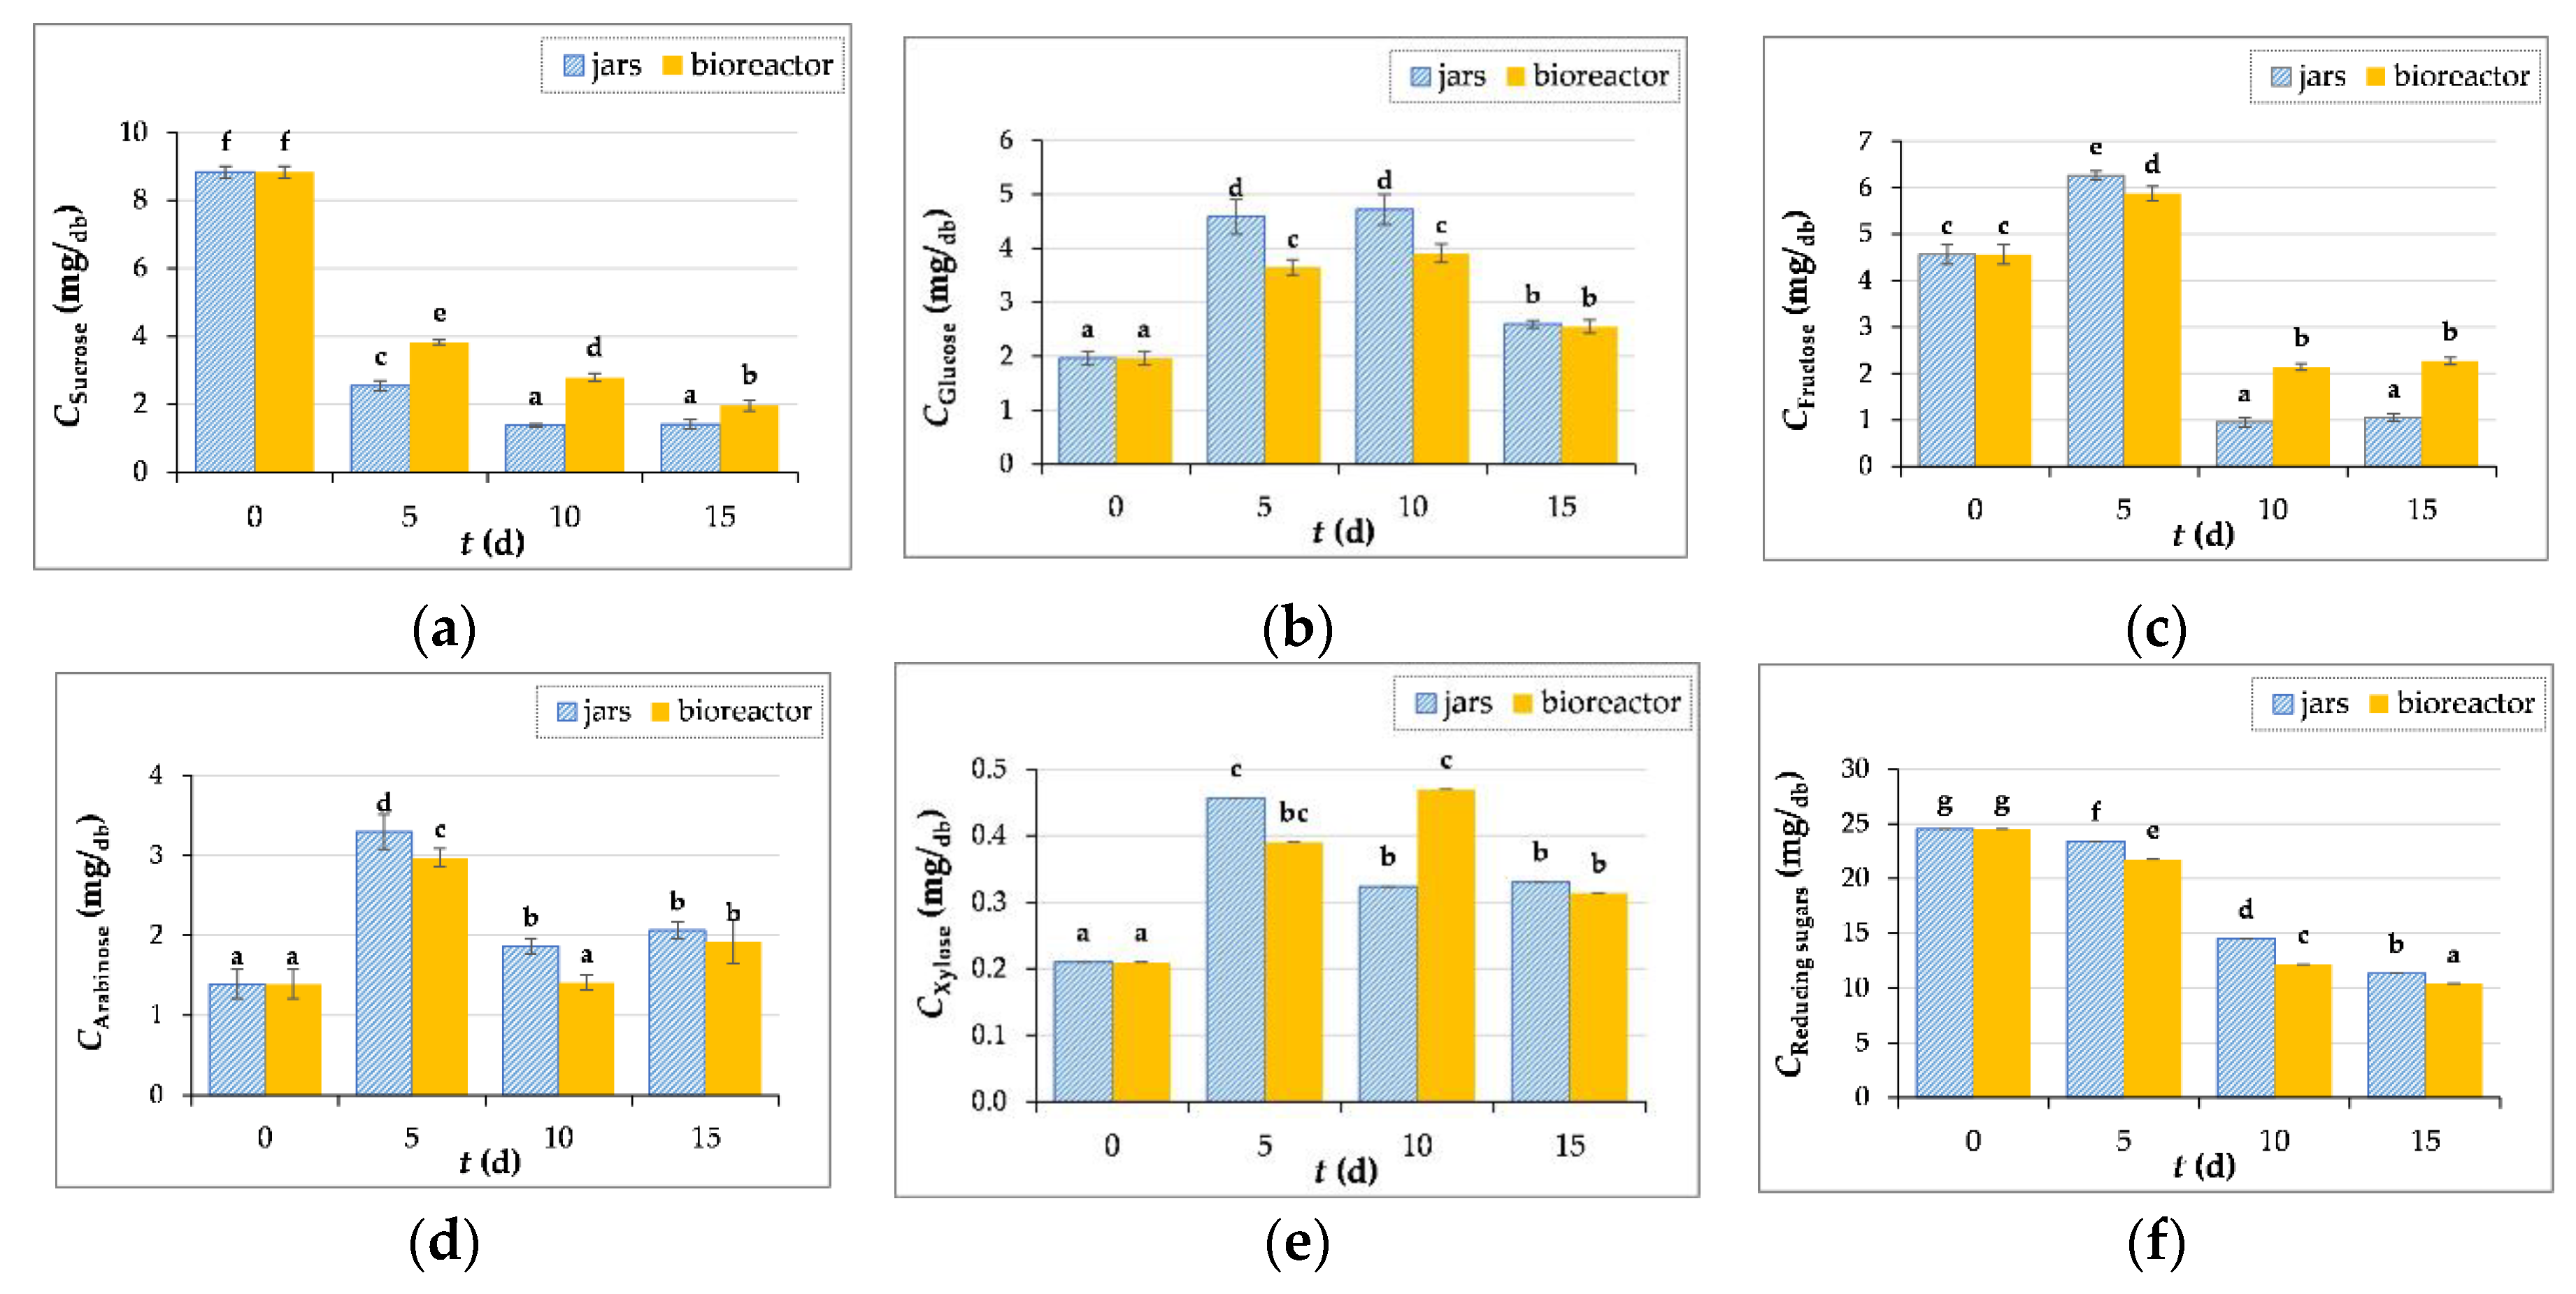
Figure 5a shows the sucrose content in GP during biological treatment. It is obvious that the content decreases until the end of fermentation, which is due to the presence of the enzyme invertase, which catalyzes the hydrolysis of sucrose into glucose and fructose. The glucose content in control sample (day “0”) was 1.97 ± 0.13 mg/gdb, then increases during the 10-day biological treatment in jars (4.72 ± 0.28 mg/gdb) and bioreactor (3.91 ± 0.17 mg/gdb), followed by a decrease in the content on the 15th day of fermentation in jars (2.60 ± 0.07 mg/gdb) and a bioreactor (2.55 ± 0.12 mg/gdb) (Figure 5b). The fructose content increases after 5 days of fermentation and then decreases until the 15th day of fermentation (Figure 5c). The content of xylose and arabinose increased after SSF both in the jars and in the bioreactor (Figure 5d-e).
However, it should be noted that the microorganisms simultaneously use simple sugars as an energy source for their growth and development, which is the reason for the decrease in the content of certain sugars during SSF [55]. This is also confirmed by the decrease in the concentration of reducing sugars from 24.52 ± 0.33 mg/gdb (˝0˝day) to 11.34 ± 0.25 mg/gdb in the process carried out in jars and to 10.42 ± 0.14 mg/gdb in a bioreactor after 15 days of fermentation (Figure 5f). When the readily available sugars are consumed, the fungi degrade more complex molecules in the lignocellulosic structure to obtain nutrients.

3.3.4. Measurement of Carbon and Nitrogen Content

When analyzing the solid samples of GP before (day “0”) and after SSF (day 5, 10, 15), no inorganic carbon (ICgp) was detected, so the TOCgp is equal to the total carbon (TCgp), as the TOCgp value is calculated from the difference between TCgp and ICgp.
The TOCgp (total organic carbon in solid samples of GP) and TOCgpe (total organic carbon in GP extract) results shown in Figure 6a-b indicate the consumption of organic carbon by microorganisms during the SSF process. Moreover, during the SSF process, carbon is continuously consumed but also released, for example, in the form of glucose by the action of hydrolytic enzymes, especially cellulases [56]. As for TN, in this work, its percentage decreased after the first 5 days of fermentation and then increased until the 15th day of fermentation (Figure 6c), which is consistent with the results for the crude protein content, whose increase may be the reason for the increase in total nitrogen.
From the data for carbon and nitrogen content during fermentation (Figure 6b-c), the C:N ratio was calculated, which was 35 for the initial GP sample and decreased during fermentation. After 15 days of SSF, the C:N ratio in the jars and in the bioreactor was 18 and 19, respectively. The ratio of carbon and nitrogen is an important parameter in the SSF process and a C:N ratio below 50 is recommended in the cultivation of basidiomycetes, for example to increase the yield of lignolytic enzymes [55]. If it is necessary to correct the C:N ratio, it is possible to combine substrate with lignocellulosic biomass that has a different chemical composition, for example GP with wheat bran or olive pomace [9,53].

3.4. Phenolic Compound and Antioxidant Activity Measurement

3.4.1. Determination of Total Phenolic Compound and Antioxidant Activity

The content of total phenolic compounds (TP), total flavonoids (TF) and extractable proanthocyanidins (TPA) was determined in the GP extracts before (˝0˝ day) and after the biological treatment with T. versicolor (5, 10, 15 days), and the results are explored in mg/gdb. For the same samples, antioxidant activity was measured using DPPH, FRAP and ABTS methods and the results are expressed in trolox equivalents (mgT/gdb). The SSF had no positive effect on increasing the yield of TP, TF and TPA, the content of which decreased by 76%, 76% and 83% in the laboratory jars and by 77%, 83% and 87% in the tray bioreactor after 15 days of fermentation (Table 4). Various studies indicate that the reason for the decrease in total phenolic compounds content could be the enzymatic degradation and polymerization of phenolic compounds released during the growth of microorganisms [57,58].
The results also demonstrated that similar downward trend was observed in the results of antioxidant activity with all three methods used (DPPH, ABTS and FRAP) by 82%, 82% and 77% in laboratory jars and by 83%, 72% and 84% in a tray bioreactor, after 15 days of SSF (Table 4).
According to the study of the authors Zhao et al. [6], after fermentation of grape seeds with four different microorganisms (A. niger CICC 2214, A. niger CICC 41481, Eurotium cristatum and M. anka), there was an increase in TP, TF and antioxidant activities measured by the DPPH and ABTS methods. In this study in which GP was treated with T. versicolor, as in the study in which GP was treated with Rhizopus oryzae [9], the antioxidant activity gradually decreases during SSF, possibly due to the utilization or conversion of antioxidant substances [58]. All this suggests that the ability to release phenolic compounds from the lignocellulosic structure depends mainly on the microorganism used and the enzymes produced during the fermentation process, since numerous studies claim that various hydrolases have a great influence on the degradation of the cell wall of plant matrices, leading to the release or synthesis of phenolic compounds [6,59]. Release or synthesis of phenolic compounds can have a positive effect on increasing antioxidant activity, since each phenolic compound has a specific antioxidant activity depending on its chemical structure [42,60]. And the antioxidant activity of phenolic compounds depends not only on their content, but also on the donor proton capacity and the ability to delocalize the electrons of the aromatic ring [6].

3.4.2. Principal Components Analysis

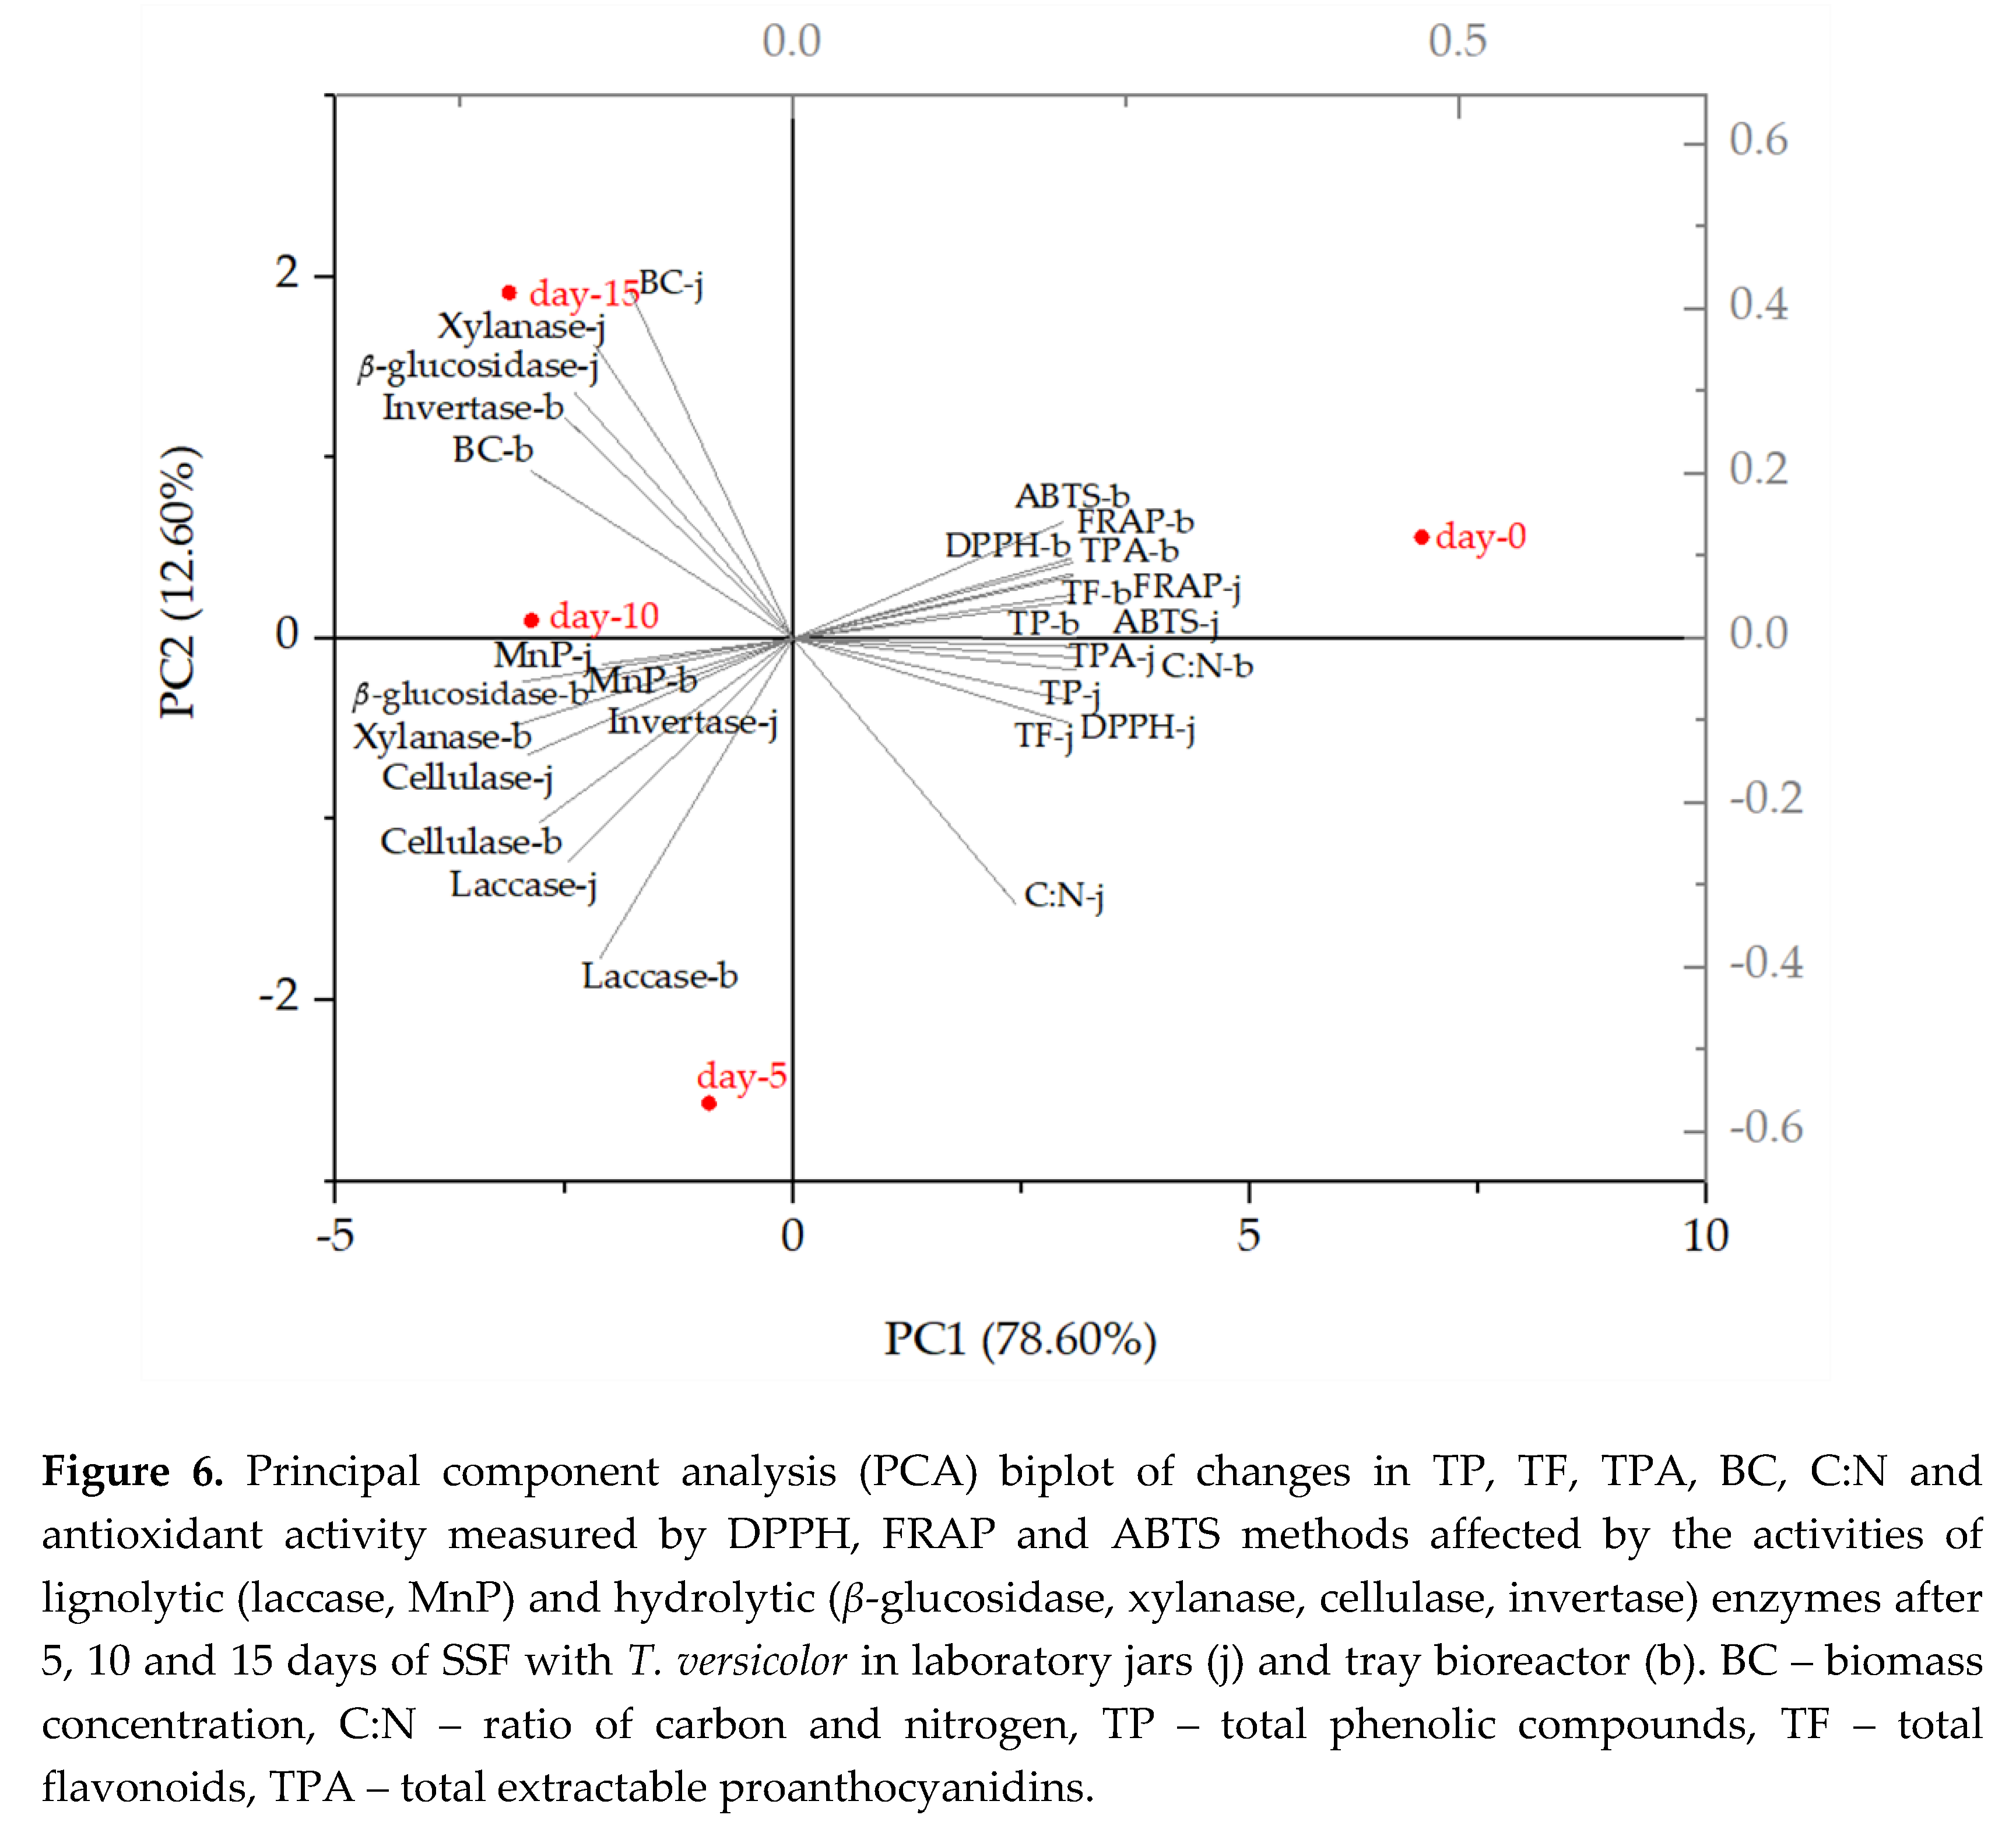
The PCA biplot showed the changes in TP, TF, TPA and antioxidant activity measured by DPPH, FRAP and ABTS methods affected by the activities of lignolytic (laccase, MnP) and hydrolytic (β-glucosidase, xylanase, cellulase, invertase) enzymes after 5, 10 and 15 days of SSF with T. versicolor. The two principal components described 91.20% of the total variance of the analyzed data (78.60% for PC1 and 12.60% for PC2). The control group (day “0”) was far from all fermented GP samples, suggesting that the enzyme activities produced during SSF significantly reduced the total phenolic compound content and antioxidant activity, with which they showed a negative correlation. The activities of xylanase and β-glucosidase obtained after 15 days of SSF in jars are distributed on the positive side of PC2 and correlate strongly with biomass concentration (BC). As the biomass concentration increased, the C:N ratio, located on the opposite side of the BC on the biplot, decreased, indicating that T. versicolor utilized carbon and nitrogen sources from the substrate during fermentation. Similar results were obtained in the bioreactor, where all enzymes except invertase are on the negative side of PC2.
A look at the biplot shows that there was not much difference between the results obtained in the jars and those obtained in the bioreactor in terms of TP, TF, TPA and antioxidant activity measured by DPPH, FRAP and ABTS methods.
Preprints 108239 i001
Although the amount of total phenolic compounds and antioxidant activity decreased during SSF, the fermentation had positive effect on the increase of certain individual phenolic compounds, which results are presented in the next section.

3.4.3. Determination of Individual Phenolic Compound Content

Although phenolic compounds from GP have long been the subject of numerous studies, the growing interest in this area is mainly due to the benefits that these compounds could have for human health. In this study, 21 individual phenolic compounds were identified and quantified in the GP extracts using Ultra-High-Performance Liquid Chromatography (UHPLC). The results indicate that SSF with T. versicolor significantly affects the profile and content of phenolic compounds in GP. SSF had a positive effect on the extractability of 13 individual phenolic compounds listed in Table 5. Tian et al. [59] reported that the increase in the content of certain phenolic compounds during SSF may be related to the breakdown of anthocyanins that results in the accumulation of phenolic compounds, which was the case in their research during SSF of blueberry pomace with fungi (A. niger, A. oryzae, M. anka) and bacteria (L. acidophilus, L. plantarum, L. casei).
In this study, the content of phenolic compounds was recorded before (day ˝0˝, Co) and after SSF (the maximum content of individual phenolic compounds in GP extracts was recorded after a specific day of SSF with T. versicolor, Ci,max.), as shown in Table 5. No increase in extractability was observed for caffeic acid, ferulic acid, vanillic acid, p-coumaric acid, catechin, epicatechin, rutin and procyanidin B2 after SSF (data not shown).
A statistically significant (p < 0.05) increase in extractability of individual phenolic compounds from GP after SSF in laboratory jars was observed for all compounds listed in Table 5, with the exception of gallic acid, syringic acid and resveratrol. After SSF in a tray bioreactor, a statistically significant (p < 0.05) increase in extractability was observed for all compounds listed in Table 5, with the exception of gallic acid, whose extractability decreased significantly after SSF, and syringic acid, whose content was equal to that of the control sample (day “0”). According to the study published by Zhao et al. [6], the content of gallic acid was also significantly reduced after SSF of grape seeds with the fungi M. anka and E. cristatum. It has been reported that aromatic compounds can be metabolized by microorganisms by using them as a carbon source via the ring cleavage pathway [61].
Of the hydroxybenzoic acids, a statistically significant increase in extractability was observed for ellagic acid after the first day of fermentation with a 3.7-fold increase in laboratory jars and a 3.9-fold increase in tray bioreactor compared to its content in the control sample. The content of p-hydroxybenzoic acid increased 1.8-fold in jars (day 10) and 2.2-fold in bioreactor (day 15), as did the content of 3,4-dihydroxybenzoic acid by 1.7-fold (day 10) in jars and 2.4-fold (day 3) in bioreactor.
Of the hydroxycinnamic acids, a statistically significant increase in extractability was observed only for o-coumaric acid with an increase of 1.7-fold (day 2) in jars and 1.5-fold (day 1) in the tray bioreactor. SSF with T. versicolor also affected the content of flavan-3-ols (epicatechin gallate and gallocatechin gallate), where the content of epicatechin gallate increased 1.5-fold after SSF in jars and 2.2-fold after SSF in the bioreactor, in both cases after two days of fermentation. The content of gallocatechin gallate increased 1.4-fold and 1.6-fold after two days of fermentation in jars and bioreactor, respectively.
The positive effect of SSF with T. versicolor was also reflected in the flavonols (quercetin and kaempferol), with the maximum increase in quercetin content of 2.9-fold after the first day of fermentation in both processes and kaempferol of 3.3-fold in the jars and 3.5-fold in the bioreactor, also after the first day of fermentation in both cases.
For procyanidin, increased extractability was achieved with procyanidin B1, from 304.27 ± 0.37 µg/gdb to 460.39 ± 12.31 µg/gdb in jars (day 2) and to 510.34 ± 18.72 µg/gdb in the bioreactor (day 1).
In the case of stilbene, a statistically significant 1.2-fold increase in resveratrol was observed after only two days of fermentation in the bioreactor. A statistically significant increase in the yield of ε-viniferin was observed in both processes, with the content increasing from 17.52 ± 1.64 µg/gdb (˝0˝ day) to 44.33 ± 1.12 µg/gdb in jars and to 46.55 ± 1.30 µg/gdb in the bioreactor after the first day of fermentation.
Zhao et al. [6] investigated the influence of SSF of grape seeds with four different microorganisms on the extractability of individual phenolic compounds, with M. anka being the most effective with an increase in procyanidin B1, chlorogenic acid, catechin, epicatechin gallate, syringic acid, ferulic acid and resveratrol content. Then, E. cristatum had an effect on increasing the content of procyanidin B1, syringic acid, rutin, ferulic acid and chlorogenic acid, while the two strains of A. niger had a minor effect on the release of phenolic compounds.
The literature shows that hydrolases such as β-glucosidase, pectinase, xylanase and cellulose are directly related to the release of soluble phenolic compounds from plant matrices. As shown in subsection 3.1., the activity of β-glucosidase increased consistently during SSF, which may have influenced the release of the aforementioned phenolic compounds [6]. It is also claimed that the phenolic compounds can be produced by the microorganisms during SSF or released from the substrate [42]. Studies also state that T. versicolor may contain phenolic acids such as p-hydroxybenzoic acid, protocatechuic acid and vanillic acid [38].

4. Conclusions

The valorization of grape pomace (GP) is actual topic, not only in the food industry, but also in cosmetics, biomedicine and pharmaceutic industry. The use of GP as a substrate under SSF conditions with T. versicolor seems to be a potential technique for the release of soluble phenolic compounds from the lignocellulosic structure, i.e. for the improvement of the profile of bioactive substances and for the general improvement of the nutritional and functional properties (increase in mineral, ash, protein, fat content) of biologically treated GP. At the same time, the use of GP is an alternative for reducing waste, improving sustainability and the circular bioeconomy.

Author Contributions

Conceptualization, G.Š., M.P. and A.B.-K.; investigation, G.Š; formal analysis, A.-M.K.; writing—original draft preparation, G.Š.; writing—review and editing, M.P., M.T. and A.B.-K.; supervision, A.B.-K. All authors have read and agreed to the published version of the manuscript.

Funding

This research was funded by the Croatian Science Foundation under the project (IP-2018-01-1227) “Development of a sustainable integrated process for the production of bioactive isolates from food industry residues” (POPI-WinCEco), and by the European Regional Development Fund (ERDF) under the project (KK.01.1.1.04.0107) “Bioconversion of lignocellulosic materials into high-value animal feed” (Bio4Feed).

Data Availability Statement

All relevant data are available within the manuscript.

Acknowledgments

The authors thank the Microbial Culture Collection of the National Institute of Chemistry (MZKI, Ljubljana, Slovenia) for obtaining microbiological culture.

Conflicts of Interest

The authors declare no conflicts of interest.

References

  1. FAOSTAT. Available online: https://www.fao.org/faostat/en/#data/QCL (accessed on 30 May 2022).
  2. Cui, W.; Wang, Y.; Sun, Z.; Cui, C.; Li, H.; Luo, K.; Cheng, A. Effects of Steam Explosion on Phenolic Compounds and Dietary Fiber of Grape Pomace. LWT 2023, 173, 114350. [Google Scholar] [CrossRef]
  3. Bucić-Kojić, A.; Tišma, M.; Šelo, G.; Grgić, J.; Perković, G.; Planinić, M. Winery Production Residues as Feedstocks within the Biorefinery Concept. Engineering Power 2022, 17, 11–17. [Google Scholar]
  4. Siller-Sánchez, A.; Luna-Sánchez, K.A.; Bautista-Hernández, I.; Chávez-González, M.L. Use of Grape Pomace from the Wine Industry for the Extraction of Valuable Compounds with Potential Use in the Food Industry. Curr Food Sci Tech Rep 2024, 2, 7–16. [Google Scholar] [CrossRef]
  5. Ferreira-Santos, P.; Nobre, C.; Rodrigues, R.M.; Genisheva, Z.; Botelho, C.; Teixeira, J.A. Extraction of Phenolic Compounds from Grape Pomace Using Ohmic Heating: Chemical Composition, Bioactivity and Bioaccessibility. Food Chemistry 2024, 436, 137780. [Google Scholar] [CrossRef] [PubMed]
  6. Zhao, Y.; Liu, D.; Zhang, J.; Shen, J.; Cao, J.; Gu, H.; Cui, M.; He, L.; Chen, G.; Liu, S.; et al. Improving Soluble Phenolic Profile and Antioxidant Activity of Grape Pomace Seeds through Fungal Solid-State Fermentation. Foods 2024, 13, 1158. [Google Scholar] [CrossRef] [PubMed]
  7. Silva, A.; Silva, V.; Igrejas, G.; Aires, A.; Falco, V.; Valentão, P.; Poeta, P. Phenolic Compounds Classification and Their Distribution in Winemaking By-Products. Eur Food Res Technol 2023, 249, 207–239. [Google Scholar] [CrossRef]
  8. Martinović, J.; Lukinac, J.; Jukić, M.; Ambrus, R.; Planinić, M.; Šelo, G.; Klarić, A.-M.; Perković, G.; Bucić-Kojić, A. Physicochemical Characterization and Evaluation of Gastrointestinal In Vitro Behavior of Alginate-Based Microbeads with Encapsulated Grape Pomace Extracts. Pharmaceutics 2023, 15, 980. [Google Scholar] [CrossRef] [PubMed]
  9. Šelo, G.; Planinić, M.; Tišma, M.; Martinović, J.; Perković, G.; Bucić-Kojić, A. Bioconversion of Grape Pomace with Rhizopus Oryzae under Solid-State Conditions: Changes in the Chemical Composition and Profile of Phenolic Compounds. Microorganisms 2023, 11, 956. [Google Scholar] [CrossRef] [PubMed]
  10. Caponio, G.R.; Minervini, F.; Tamma, G.; Gambacorta, G.; De Angelis, M. Promising Application of Grape Pomace and Its Agri-Food Valorization: Source of Bioactive Molecules with Beneficial Effects. Sustainability 2023, 15, 9075. [Google Scholar] [CrossRef]
  11. Abid, K.; Boudagga, S.; Abid, O.; Najar, T.; Jaouani, A. Bioconversion of Grape Pomace Waste into Suitable Alternative Feed for Ruminants with Pleurotus Cornucopiae and Ganoderma Resinaceum via Solid-State Fermentation Bioprocess. Biomass Conv. Bioref. 2023. [Google Scholar] [CrossRef]
  12. Gerardi, C.; D’Amico, L.; Durante, M.; Tufariello, M.; Giovinazzo, G. Whole Grape Pomace Flour as Nutritive Ingredient for Enriched Durum Wheat Pasta with Bioactive Potential. Foods 2023, 12, 2593. [Google Scholar] [CrossRef] [PubMed]
  13. Martinović, J.; Lukinac, J.; Jukić, M.; Ambrus, R.; Planinić, M.; Šelo, G.; Klarić, A.-M.; Perković, G.; Bucić-Kojić, A. In Vitro Bioaccessibility Assessment of Phenolic Compounds from Encapsulated Grape Pomace Extract by Ionic Gelation. Molecules 2023, 28, 5285. [Google Scholar] [CrossRef] [PubMed]
  14. Perković, G.; Martinović, J.; Šelo, G.; Bucić-Kojić, A.; Planinić, M.; Ambrus, R. Characterization of Grape Pomace Extract Microcapsules: The Influence of Carbohydrate Co-Coating on the Stabilization of Goat Whey Protein as a Primary Coating. Foods 2024, 13, 1346. [Google Scholar] [CrossRef] [PubMed]
  15. Šelo, G.; Planinić, M.; Tišma, M.; Tomas, S.; Koceva Komlenić, D.; Bucić-Kojić, A. A Comprehensive Review on Valorization of Agro-Food Industrial Residues by Solid-State Fermentation. Foods 2021, 10, 927. [Google Scholar] [CrossRef] [PubMed]
  16. Cerda-Cejudo, N.D.; Buenrostro-Figueroa, J.J.; Sepúlveda-Torre, L.; Torres-León, C.; Chávez-González, M.L.; Ascacio-Valdés, J.A.; Aguilar, C.N. Solid-State Fermentation for the Recovery of Phenolic Compounds from Agro-Wastes. Resources 2023, 12, 36. [Google Scholar] [CrossRef]
  17. Tišma, M.; Žnidaršič-Plazl, P.; Šelo, G.; Tolj, I.; Šperanda, M.; Bucić-Kojić, A.; Planinić, M. Trametes Versicolor in Lignocellulose-Based Bioeconomy: State of the Art, Challenges and Opportunities. Bioresource Technology 2021, 124997. [Google Scholar] [CrossRef] [PubMed]
  18. Torreggiani, A.; Beccaccioli, M.; Verni, M.; Cecchetti, V.; Minisci, A.; Reverberi, M.; Pontonio, E.; Rizzello, C.G. Combined Use of Trametes Versicolor Extract and Sourdough Fermentation to Extend the Microbiological Shelf-Life of Baked Goods. LWT 2023, 189, 115467. [Google Scholar] [CrossRef]
  19. Planinić, M.; Zelić, B.; Čubel, I.; Bucić-Kojić, A.; Tišma, M. Corn Forage Biological Pretreatment by Trametes versicolor in a Tray Bioreactor. Waste Manag Res 2016, 34, 802–809. [Google Scholar] [CrossRef] [PubMed]
  20. Bailey, M.J.; Biely, P.; Poutanen, K. Interlaboratory Testing of Methods for Assay of Xylanase Activity. J. Biotechnol. 1992, 23, 257–270. [Google Scholar] [CrossRef]
  21. Ghose, T.K. Measurement of Cellulase Activities. Pure Appl. Chem. 1987, 59, 257–268. [Google Scholar] [CrossRef]
  22. Karpe, A.V.; Dhamale, V.V.; Morrison, P.D.; Beale, D.J.; Harding, I.H.; Palombo, E.A. Winery Biomass Waste Degradation by Sequential Sonication and Mixed Fungal Enzyme Treatments. Fungal Genet. Biol. 2017, 102, 22–30. [Google Scholar] [CrossRef] [PubMed]
  23. Margetić, A.; Vujčić, Z. Comparative Study of Stability of Soluble and Cell Wall Invertase from Saccharomyces Cerevisiae. Prep. Biochem. Biotechnol. 2017, 47, 305–311. [Google Scholar] [CrossRef] [PubMed]
  24. Lueangjaroenkit, P.; Kunitake, E.; Sakka, M.; Kimura, T.; Teerapatsakul, C.; Sakka, K.; Chitradon, L. Light Regulation of Two New Manganese Peroxidase-Encoding Genes in Trametes polyzona KU-RNW027. Microorganisms 2020, 8, 852. [Google Scholar] [CrossRef] [PubMed]
  25. Waterhouse, A.L. Determination of Total Phenolics. In Current Protocols in Food Analytical Chemistry; Wiley: Wrolstad, 2001. [Google Scholar]
  26. Marinova, D.; Ribarova, F.; Atanassova, M. Total phenolics and total flavonoids in bulgarian fruits and vegetables. J. Univ. Chem. Technol. Metall. 2005, 40, 255–260. [Google Scholar]
  27. Škerget, M.; Kotnik, P.; Hadolin, M.; Hraš, A.R.; Simonič, M.; Knez, Ž. Phenols, Proanthocyanidins, Flavones and Flavonols in Some Plant Materials and Their Antioxidant Activities. Food Chem. 2005, 89, 191–198. [Google Scholar] [CrossRef]
  28. Bucić-Kojić, A.; Planinić, M.; Tomas, S.; Jakobek, L.; Šeruga, M. Influence of Solvent and Temperature on Extraction of Phenolic Compounds from Grape Seed, Antioxidant Activity and Colour of Extract. International Journal of Food Science & Technology 2009, 44, 2394–2401. [Google Scholar] [CrossRef]
  29. Re, R.; Pellegrini, N.; Proteggente, A.; Pannala, A.; Yang, M.; Rice-Evans, C. Antioxidant Activity Applying an Improved ABTS Radical Cation Decolorization Assay. Free Radical Biol. Med. 1999, 26, 1231–1237. [Google Scholar] [CrossRef] [PubMed]
  30. Benzie, I.F.F.; Strain, J.J. The Ferric Reducing Ability of Plasma (FRAP) as a Measure of “Antioxidant Power”: The FRAP Assay. Anal. Biochem. 1996, 239, 70–76. [Google Scholar] [CrossRef]
  31. Šelo, G.; Planinić, M.; Tišma, M.; Grgić, J.; Perković, G.; Koceva Komlenić, D.; Bucić-Kojić, A. A Comparative Study of the Influence of Various Fungal-Based Pretreatments of Grape Pomace on Phenolic Compounds Recovery. Foods 2022, 11, 1665. [Google Scholar] [CrossRef]
  32. Alarcón, E.; Hernández, C.; García, G.; Ziarelli, F.; Gutiérrez-Rivera, B.; Musule, R.; Vázquez-Marrufo, G.; Gardner, T.G. Changes in Chemical and Structural Composition of Sugarcane Bagasse Caused by Alkaline Pretreatments [Ca(OH)2 and NaOH] Modify the Amount of Endoglucanase and β-Glucosidase Produced by Aspergillus niger in Solid-State Fermentation. Chem. Eng. Commun. 2021, 209, 594–606. [Google Scholar] [CrossRef]
  33. Miller, G.L. Use of Dinitrosalicylic Acid Reagent for Determination of Reducing Sugar. Anal. Chem. 1959, 31, 426–428. [Google Scholar] [CrossRef]
  34. AOAC. AOAC. AOAC Official Method 942.05. In Official Methods of Analysis of AOAC International, 16th ed.; AOAC International: Arlington, VA, USA, 1995. [Google Scholar]
  35. Goering, H.K.; Van Soest, P.J. Forage Fiber Analyses (Apparatus, Reagents, Procedures, and Some Applications). In Agriculture Handbook; No. 379; Agricultural Research Service, U.S. Department of Agriculture: Washington, DC, USA, 1970; pp. 1–24. [Google Scholar]
  36. AOAC. AOAC. AOAC Official Method 2001.11. In Official Methods of Analysis of AOAC International, 18th ed.; AOAC International: Gaithersburg, MD, USA, 2005. [Google Scholar]
  37. AOAC. AOAC. AOAC Official Method 945.16. In Official Methods of Analysis of AOAC International, 18th ed.; AOAC International: Gaithersburg, MD, USA, 2005. [Google Scholar]
  38. Mostafa, Y.S.; Širić, I.; Alamri, S.A.M.; Alrumman, S.A.; Kumar, P.; Abou Fayssal, S.; Zjalić, S.; Singh, R.; Eid, E.M. Assessment of Metal Elements and Biochemical Constituents of Wild Turkey Tail (Trametes versicolor) Mushrooms Collected from the Shivalik Foothills of the Himalayas, India. Forests 2023, 14, 2247. [Google Scholar] [CrossRef]
  39. Fabros, J.A.; Lazo, M.K.M.; Magpantay, J.E.S.; Abon, M.D.; Dulay, R.M.R.; Kalaw, S.P.; Reyes, R.G. The Effect of Nutritional and Physical Factors on the Growth of Trametes versicolor (L.) Lloyd and Its Mycochemical and Cytotoxic Properties. Studies in Fungi 2023, 8. [Google Scholar] [CrossRef]
  40. Kumar, D. Fungal Lipase Production by Solid State Fermentation-An Overview. Journal of Analytical & Bioanalytical Techniques 2015, 06. [Google Scholar] [CrossRef]
  41. Athanasiou, P.E.; Gkountela, C.I.; Patila, M.; Fotiadou, R.; Chatzikonstantinou, A.V.; Vouyiouka, S.N.; Stamatis, H. Laccase-Mediated Oxidation of Phenolic Compounds from Wine Lees Extract towards the Synthesis of Polymers with Potential Applications in Food Packaging. Biomolecules 2024, 14, 323. [Google Scholar] [CrossRef] [PubMed]
  42. Erskine, E.; Ozkan, G.; Lu, B.; Capanoglu, E. Effects of Fermentation Process on the Antioxidant Capacity of Fruit Byproducts. ACS Omega 2023, 8, 4543–4553. [Google Scholar] [CrossRef] [PubMed]
  43. Botella, C.; Ory, I. de; Webb, C.; Cantero, D.; Blandino, A. Hydrolytic Enzyme Production by Aspergillus awamori on Grape Pomace. Biochemical Engineering Journal 2005, 26, 100–106. [Google Scholar] [CrossRef]
  44. De Bellis, P.; Maggiolino, A.; Albano, C.; De Palo, P.; Blando, F. Ensiling Grape Pomace With and Without Addition of a Lactiplantibacillus plantarum Strain: Effect on Polyphenols and Microbiological Characteristics, in Vitro Nutrient Apparent Digestibility, and Gas Emission. Front. Vet. Sci. 2022, 9, 808293. [Google Scholar] [CrossRef] [PubMed]
  45. Mohamed Ahmed, I.A.; Özcan, M.M.; Al Juhaimi, F.; Babiker, E.F.E.; Ghafoor, K.; Banjanin, T.; Osman, M.A.; Gassem, M.A.; Alqah, H.A.S. Chemical Composition, Bioactive Compounds, Mineral Contents, and Fatty Acid Composition of Pomace Powder of Different Grape Varieties. Journal of Food Processing and Preservation 2020, 44, e14539. [Google Scholar] [CrossRef]
  46. Altop, A.; Güngör, E.; Erener, G. Aspergillus Niger May Improve Nutritional Quality of Grape Seed and Its Usability in Animal Nutrition through Solid-State Fermentation. International Advanced Researches and Engineering Journal 2018, 2, 273–277. [Google Scholar]
  47. Gungor, E.; Altop, A.; Erener, G. Effect of Raw and Fermented Grape Pomace on the Growth Performance, Antioxidant Status, Intestinal Morphology, and Selected Bacterial Species in Broiler Chicks. Animals 2021, 11, 364. [Google Scholar] [CrossRef] [PubMed]
  48. Ruiz-Herrera, J. Fungal Cell Wall: Structure, Synthesis, and Assembly; 1st ed.; CRC Press: Boca Raton, FL, USA, 1991; pp. 5–18. [Google Scholar]
  49. Sukma, A.; Jos, B.; Sumardiono, S. Kinetic of Biomass Growth and Protein Formation on Rice Bran Fermentation Using Rhizopus oryzae. MATEC Web Conf. 2018, 156, 01023. [Google Scholar] [CrossRef]
  50. Machado, A.R.; Voss, G.B.; Machado, M.; Paiva, J.A.; Nunes, J.; Pintado, M. Chemical Characterization of the Cultivar ‘Vinhão’ (Vitis vinifera L.) Grape Pomace Towards Its Circular Valorisation. SSRN - Elsevier. [CrossRef]
  51. Zheng, Y.; Lee, C.; Yu, C.; Cheng, Y.-S.; Simmons, C.W.; Zhang, R.; Jenkins, B.M.; VanderGheynst, J.S. Ensilage and Bioconversion of Grape Pomace into Fuel Ethanol. J. Agric. Food Chem. 2012, 60, 11128–11134. [Google Scholar] [CrossRef] [PubMed]
  52. Manara, P.; Zabaniotou, A.; Vanderghem, C.; Richel, A. Lignin Extraction from Mediterranean Agro-Wastes: Impact of Pretreatment Conditions on Lignin Chemical Structure and Thermal Degradation Behavior. Catal. Today 2014, 223, 25–34. [Google Scholar] [CrossRef]
  53. Teles, A.S.C.; Chávez, D.W.H.; Oliveira, R.A.; Bon, E.P.S.; Terzi, S.C.; Souza, E.F.; Gottschalk, L.M.F.; Tonon, R.V. Use of Grape Pomace for the Production of Hydrolytic Enzymes by Solid-State Fermentation and Recovery of Its Bioactive Compounds. Food Research International 2019, 120, 441–448. [Google Scholar] [CrossRef] [PubMed]
  54. Li, X.; Dilokpimol, A.; Kabel, M.A.; de Vries, R.P. Fungal Xylanolytic Enzymes: Diversity and Applications. Bioresource Technology 2022, 344, 126290. [Google Scholar] [CrossRef] [PubMed]
  55. Zamora Zamora, H.D.; Silva, T.A.L.; Varão, L.H.R.; Baffi, M.A.; Pasquini, D. Simultaneous Production of Cellulases, Hemicellulases, and Reducing Sugars by Pleurotus Ostreatus Growth in One-Pot Solid State Fermentation Using Alstroemeria Sp. Waste. Biomass Conv. Bioref. 2021. [Google Scholar] [CrossRef]
  56. Yu, H.; Xie, B.; Khan, R.; Dong, J.; Shen, G. The Changes in Macronutrients and Microbial Community Structure during the Co-Composting of White Wine Distillers’ Grains and Potassium Silicate. J. Clean. Prod. 2021, 319, 128681. [Google Scholar] [CrossRef]
  57. Zambrano, C.; Kotogán, A.; Bencsik, O.; Papp, T.; Vágvölgyi, C.; Mondal, K.C.; Krisch, J.; Takó, M. Mobilization of Phenolic Antioxidants from Grape, Apple and Pitahaya Residues via Solid State Fungal Fermentation and Carbohydrase Treatment. LWT - Food Sci. Technol. 2018, 89, 457–465. [Google Scholar] [CrossRef]
  58. Chen, Q.; Su, J.; Zhang, Y.; Li, C.; Zhu, S. Phytochemical Profile and Bioactivity of Bound Polyphenols Released from Rosa Roxburghii Fruit Pomace Dietary Fiber by Solid-State Fermentation with Aspergillus Niger. Molecules 2024, 29, 1689. [Google Scholar] [CrossRef]
  59. Tian, Z.-X.; Li, Y.-F.; Long, M.-X.; Liang, Q.; Chen, X.; Huang, D.-M.; Ran, Y.-Q. Effects of Six Different Microbial Strains on Polyphenol Profiles, Antioxidant Activity, and Bioaccessibility of Blueberry Pomace with Solid-State Fermentation. Front Nutr 2023, 10, 1282438. [Google Scholar] [CrossRef] [PubMed]
  60. Akbulut, M.; Çoklar, H.; Bulut, A.N.; Hosseini, S.R. Evaluation of Black Grape Pomace, a Fruit Juice by-Product, in Shalgam Juice Production: Effect on Phenolic Compounds, Anthocyanins, Resveratrol, Tannin, and in Vitro Antioxidant Activity. Food Science & Nutrition n/a. [CrossRef]
  61. Fuchs, G.; Boll, M.; Heider, J. Microbial Degradation of Aromatic Compounds — from One Strategy to Four. Nat Rev Microbiol 2011, 9, 803–816. [Google Scholar] [CrossRef] [PubMed]
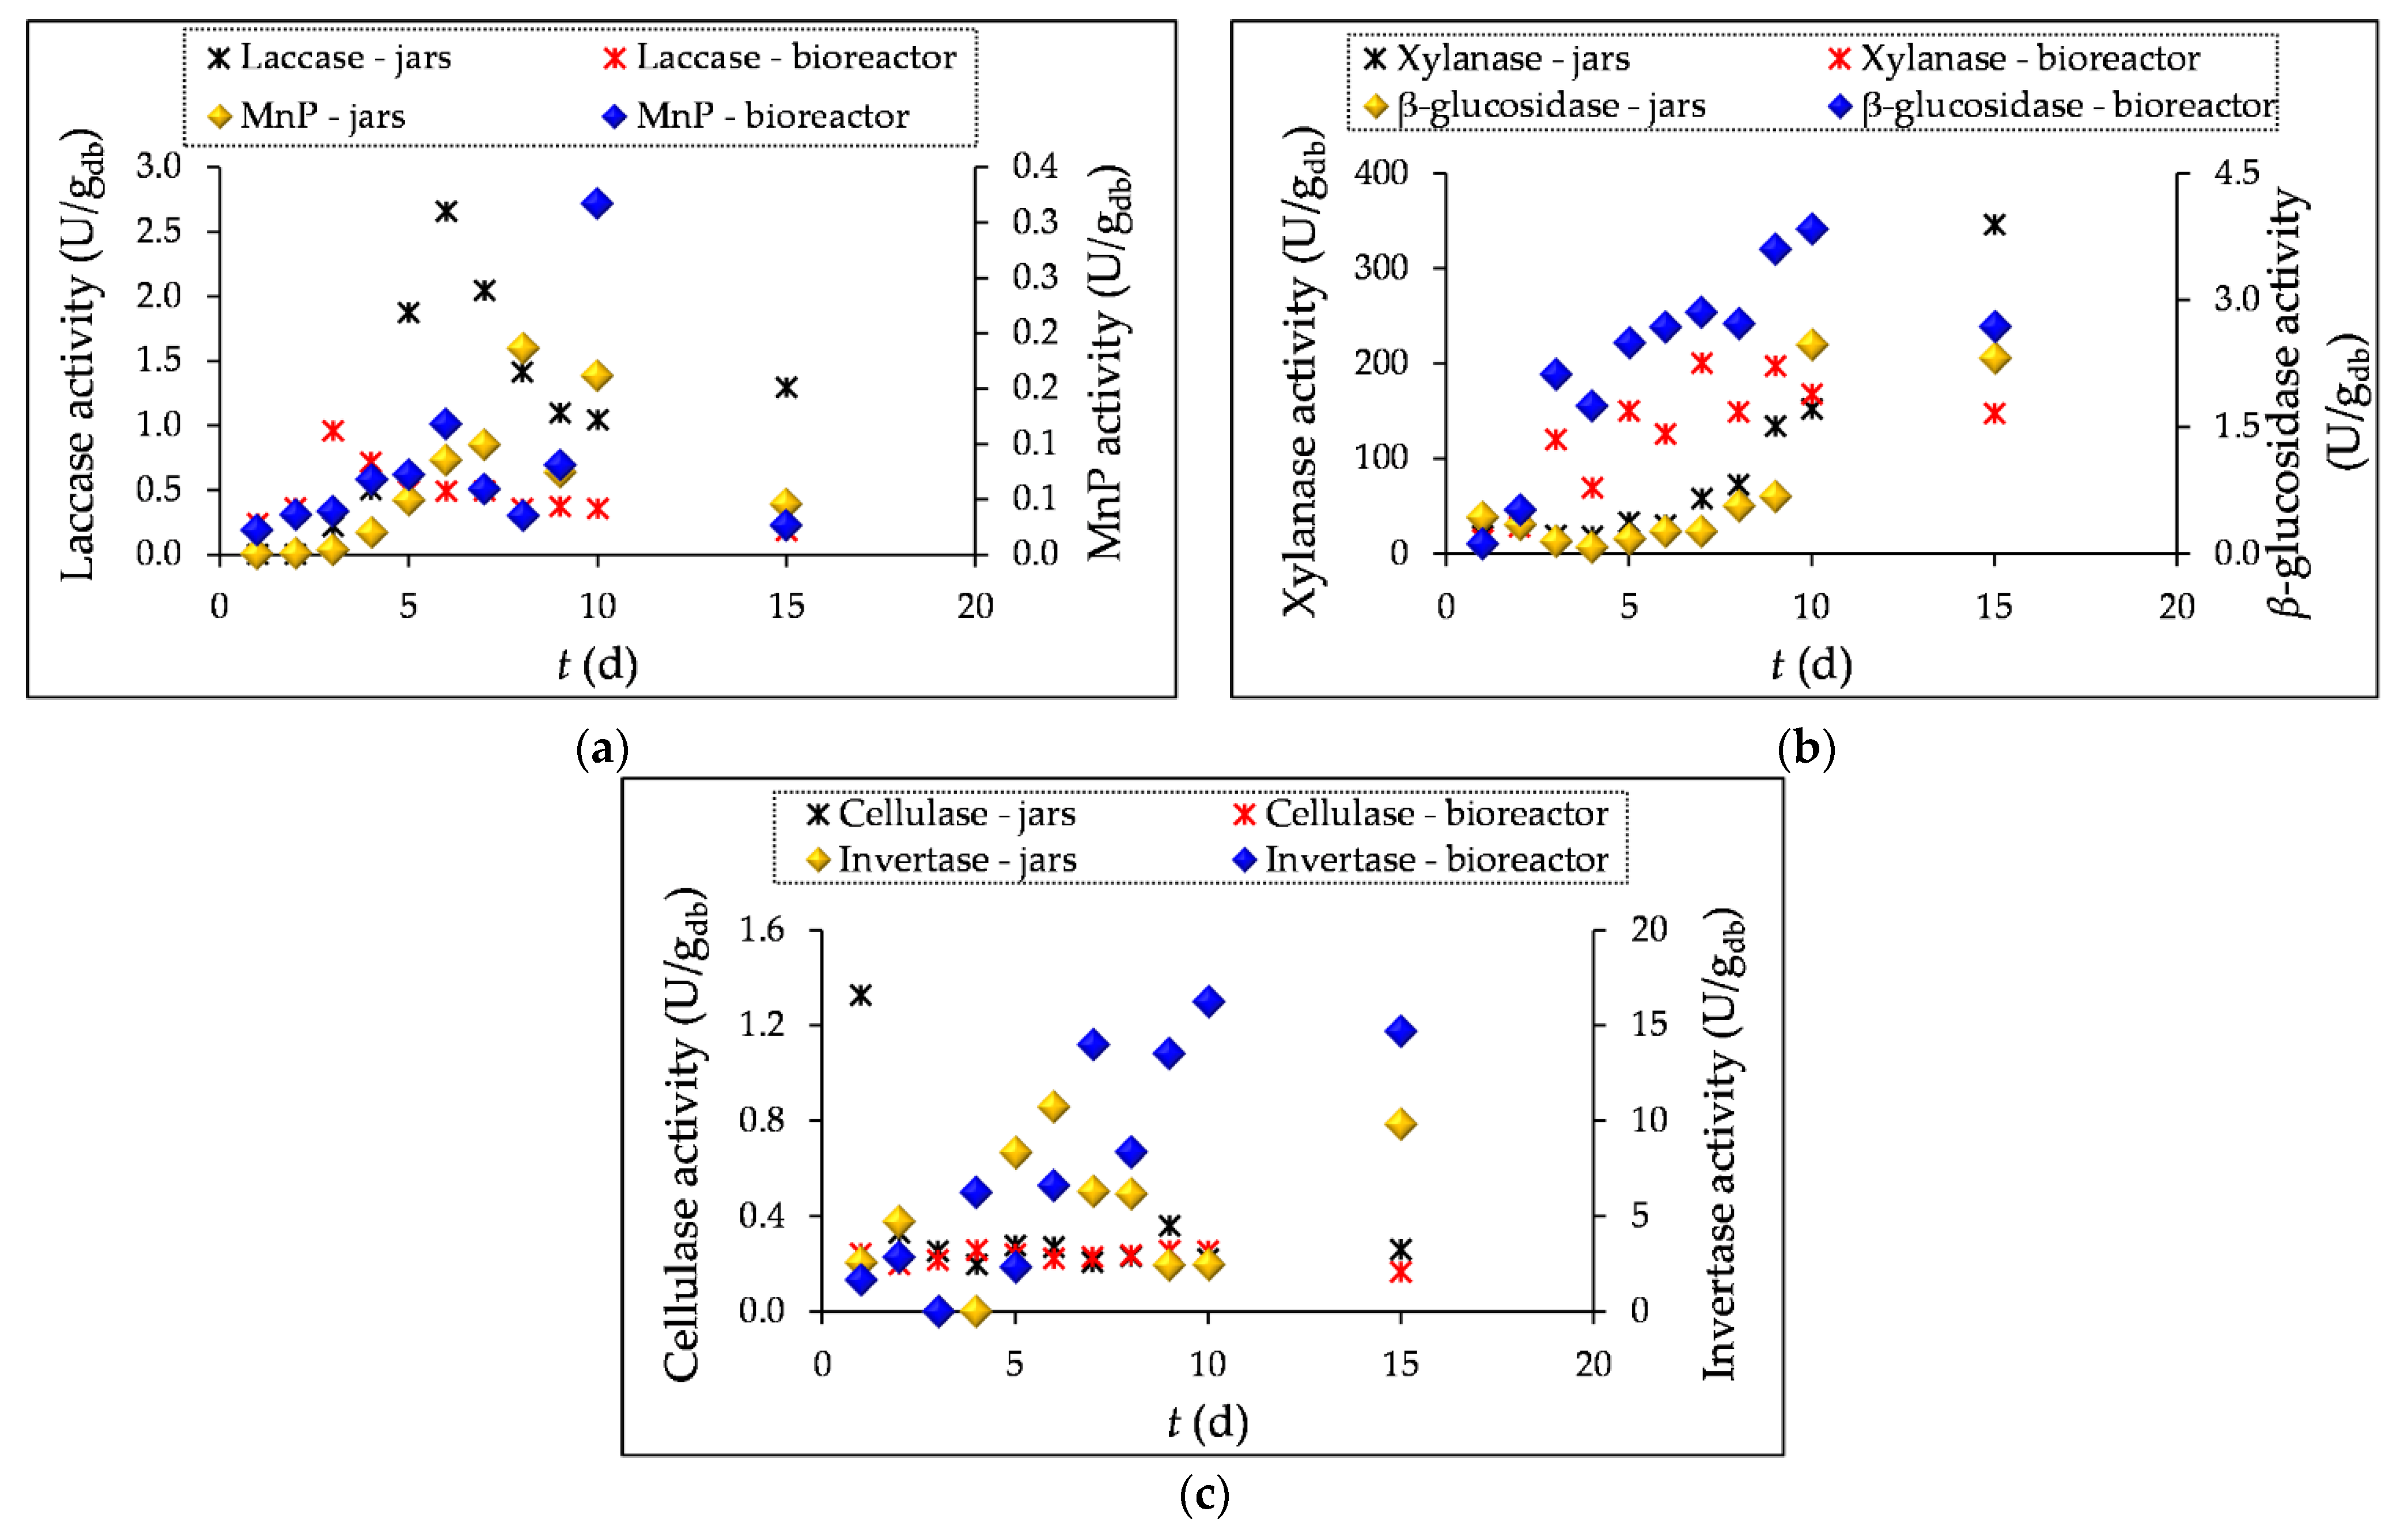
Figure 1. Enzyme activity of lignolytic enzymes; laccase and manganese peroxidase (MnP) (a), hydrolytic enzymes; xylanase and β-glucosidase (b) and cellulase and invertase (c) during SSF of GP (1 – 10 and 15 days) by T. versicolor in laboratory jars and tray bioreactor.
Preprints 108239 g001
Figure 2. Ergosterol concentration (CERG) (a) and pH values (b) in grape pomace before (day “0”) and during the 1-5, 10 and 15 day SSF process by T. versicolor in laboratory jars and tray bioreactor.
Preprints 108239 g002
Figure 3. The content (w) of ash (a), crude protein (b) and free fats (c) GP samples before (day “0”) and after 5, 10 and 15 days of SSF with T. versicolor in laboratory jars and tray bioreactor. Samples marked with different lowercase letters of the alphabet are statistically significantly different from each other (p < 0.05, post-hoc Duncan’s multiple range test).
Preprints 108239 g003
Figure 4. The content of NDF – neutral detergent fibers (a), ADF – acid detergent fibers (b), ADL – acid detergent lignin; lignin content (c), hemicellulose (d) and cellulose (e) in GP before (day “0”) and after 5, 10 and 15 days of SSF with T. versicolor in laboratory jars and tray bioreactor. Samples marked with different lowercase letters of the alphabet are statistically significantly different from each other (p < 0.05, post-hoc Duncan’s multiple range test).
Preprints 108239 g004
Figure 5. The content of sucrose (a), glucose (b), fructose (c), arabinose (d), xylose (e) and reducing sugars (f) in GP extracts before (day “0”) and after 5, 10 and 15 days of SSF with T. versicolor in laboratory jars and tray bioreactor. Samples marked with different lowercase letters of the alphabet are statistically significantly different from each other (p < 0.05, post-hoc Duncan’s multiple range test).
Preprints 108239 g005
Figure 6. The content (w) of total organic carbon in crude samples of GP (TOCgp), total organic carbon in GP extracts (TOCe) and total nitrogen (TN) before (day “0”) and after 5, 10 and 15 days of SSF with T. versicolor in laboratory jars and tray bioreactor. Samples marked with different lowercase letters of the alphabet are statistically significantly different from each other (p < 0.05, post-hoc Duncan’s multiple range test).
Preprints 108239 g006
Table 1. Different types of buffer solutions used for the preparation of GP extracts for the enzyme activity measurement.
Lignolytic enzymes Buffer solution pH
Laccase 50 mM sodium malonate buffer 4.5
Manganese peroxidase (MnP) 50 mM sodium malonate buffer 4.5
Hydrolyticenzymes Buffer solution pH
Xylanase 50 mM sodium citrate buffer 5.3
Cellulase 50 mM sodium citrate buffer 4.8
β-glucosidase 100 mM sodium acetate buffer 5.0
Invertase 100 mM sodium acetate buffer 4.5
Table 2. Extract preparations and methods applied for the analysis of the chemical composition of grape pomace.
Liquid extract preparation Analysis
1.
The mass of 1 g of solid GP (≤ 1 mm) was extracted with 40 mL of ethanol : water (1:1) in sealed flasks at 80 °C in a water bath (Julabo, SW-23, Seelbach, Germany) by shaking at 200 rpm for 120 min. After extraction, the samples were centrifuged at 10,000 × g for 10 min (Z 326 K, Hermle Labortechnik GmbH, Wehingen, Germany) and the supernatant was used for analysis.
  • total phenolic compounds; TP [25]
  • total flavonoids; TF [26]
  • total extractable proanthocyanidins; TPA [27]
  • antioxidant activity; DPPH [28], FRAP [29], ABTS [30]
2.
Extracts were prepared by extracting 1g of solid GP with 25 mL of distilled water in sealed flasks. The extraction was carried out in triplicate in a water bath by shaking at 170 rpm for 30 min at 30 °C. Then, the suspension was centrifuged at 10,000 × g for 10 min and the supernatant was used for analysis.
  • total nitrogen (TN) [31]
  • total organic carbon (TOCgpe)* [31]
  • reducing sugar (RS) [32,33]
  • individual sugar [31]
3.
For pH measurement, the mass of 2 grams of the biologically treated GP was suspended in 10 mL of distilled water, shaken on the vortex for 30 min, and centrifuged at 10,000 × g. The supernatant was used to measure pH (HI 2211 pH/ORP Meter, Hanna instruments Ltd, Zagreb, Croatia).
  • pH measurement
Solid samples of GP Analysis
  • GP with a particle size of ≤ 1 mm was analyzed before (day “0”) and after biological treatment (day 5, 10, 15)
  • dry matter content [31]
  • ash content [34]
  • neutral detergent fiber (NDF) [35]
  • acid detergent fiber (ADF) [35]
  • acid detergent lignin (ADL) [35]
  • crude protein [36]
  • total carbon (TC) [31]
  • inorganic carbon (IC) [31]
  • total organic carbon (TOCgp)* [31]
  • free fat [37]
* TOCgpe – total organic carbon in GP extract, TOCgp – total organic carbon in solid sample of GP.
Table 3. Substrate weight loss and moisture content in laboratory jars, temperature and moisture content in tray bioreactor during SSF of GP before (day “0”) and after SSF (day 1-5, 10, 15) with T. versicolor.
day “0” day 1 day 2 day 3 day 4 day 5 day 10 day 15
Weight loss - jars (%db) - 9.0 11.7 14.8 15.6 16.4 25.2 38.5
Moisture content- jars (%db) 71.8 71.7 70.5 68.5 65.9 68.4 60.6 51.1
Moisture content- bioreactor (%db) 66.9 58.7 57.1 57.2 57.1 49.4 45.4 29.7
Tbioreactor (°C) - 27.3 27.0 27.5 27.5 27.6 27.2 27.5
TGP in bioreactor (°C) - 26.7 26.6 27.6 27.7 27.6 27.4 27.3
Tbioreactor– average temperature in a tray bioreactor during SSF, TGP in bioreactor – average temperature of the substrate in a tray bioreactor during SSF.
Table 4. Total phenolic compounds and antioxidant activity measured by DPPH, ABTS and FRAP methods in GP extracts before (day “0”) and after SSF (day 5, 10, 15) by T. versicolor in laboratory jars and tray bioreactor.
Compound GP SSF in laboratory jars SSF in a tray bioreactor
day “0” day 5 day 10 day 15 day 5 day 10 day 15
TP (mg/gdb) 50.08±0.08 m 23.68±0.11 h 14.79±0.28 e 12.43±0.07 b 14.31±0.04 d 12.64±0.06 b 11.62±0.07 a
TF (mg/gdb) 25.14±0.06 n 13.91±0.03 j 8.23±0.06 g 5.99±0.03 d 6.91±0.04 f 4.52±0.03 b 4.22±0.07 a
TPA (mg/gdb) 8.55±0.04 n 3.32±0.04 i 1.80±0.03 f 1.44±0.03 d 1.55±0.03 e 1.32±0.02 c 1.09±0.04 a
DPPH (mgT/gdb) 57.50±0.00 g 27.50±0.00 c 18.50±0.00 b 10.50±0.00 a 11.50±0.00 a 10.50±0.00 a 10.0±0.00 a
ABTS (mgT/gdb) 314.00±0.00 k 114.00±0.01 f 85.50±0.00 d 57.50±0.00 a 72.00±0.00 b 102.50±0.00 e 88.50±0.00 d
FRAP (mgT/gdb) 212.50±0.00 h 67.50±0.01 d 58.50±0.01 c 48.50±0.00 b 37.50±0.00 a 35.00±0.00 a 34.00±0.00 a
All results are given as mean (n = 3) ± SD. Values in the same row labelled with different lowercase letters of the alphabet are statistically significantly different from each other (p < 0.05, post-hoc Duncan multiple range test), samples belonging to the population with the lowest mean value of each component are labelled with the letter “a”; TP – total phenolic compounds, TF – total flavonoids, TPA – total extractable proanthocyanidins.
Table 5. The content of individual phenolic compounds in extracts obtained from grape pomace before SSF (day “0”, Co) and after SSF by T. versicolor in laboratory jars and in a tray bioreactor (maximum content of individual phenolic compounds in grape pomace extracts recorded after a certain duration of SSF, Ci,max.).
Phenolic compound day “0” SSF in laboratory jars SSF in tray bioreactor
Co (µg/gdb)* Ci,max. (µg/gdb)* p** tSSF (d) Ci,max. (µg/gdb)* p** tSSF (d)
GA 267.77 ± 11.78 275.59 ± 11.90 0.6249 1. 248.40 ± 4.41 0.0450 1.
EA 34.65 ± 3.66 129.11 ± 14.82 0.0125 1. 136.02 ± 3.84 0.0000 1.
p-HBA 5.05 ± 2.15 9.33 ± 0.02 0.0007 10. 10.96 ± 0.43 0.0040 15.
SA 86.37 ± 2.15 95.79 ± 3.22 0.0933 10. 86.64 ± 2.86 0.5661 3.
3,4-DHBA 138.61 ± 9.87 237.46 ± 5.73 0.0082 10. 338.03 ± 2.19 0.0005 3.
o-CoA 4.43 ± 0.11 7.74 ± 0.33 0.0082 10. 6.83 ± 0.58 0.0263 4.
EPG 166.69 ± 8.42 246.27 ± 7.32 0.0128 2. 373.05 ± 4.25 0.0001 2.
GCG 291.57 ± 2.35 408.79 ± 15.58 0.0042 2. 480.89 ± 4.18 0.0000 2.
QU 173.32 ± 16.54 504.31 ± 16.98 0.0034 1. 507.29 ± 31.17 0.0067 1.
KA 10.22 ± 1.06 33.78 ± 0.65 0.0017 1. 35.75 ± 1.09 0.0024 1.
PB1 304.27 ± 0.37 460.39 ± 12.31 0.0019 2. 510.34 ± 18.72 0.0028 1.
RES 46.07 ± 3.48 56.65 ± 3.54 0.1204 1. 54.46 ± 0.67 0.0353 2.
VIN 17.52 ± 1.64 44.53 ± 1.12 0.0035 1. 46.55 ± 1.30 0.0034 1.
GA – gallic acid, EA – ellagic acid, p-HBA – p-hidroxybenzoic acid, SA – syringic acid, 3,4-DHBA – 3,4-dihydroxybenzoic acid, o-CoA – o-coumaric acid, EPG – epicatechin gallate, GCG – gallocatechin gallate, QU – quercetin, KA – kaempferol, PB1 – procyanidin B1, RES – resveratrol, VIN – ε-viniferin; * Results are expressed as mean (n = 3) ± SD; ** To compare the mean values of the concentration of individual phenolic compounds between day “0” (biologically untreated sample of GP) and the day of fermentation when the maximum yield of individual phenolic compounds was reached, the Student’s t-test was used for dependent samples with a confidence level of 95% (red colored values - statistically significant difference with p < 0.05).
Disclaimer/Publisher’s Note: The statements, opinions and data contained in all publications are solely those of the individual author(s) and contributor(s) and not of MDPI and/or the editor(s). MDPI and/or the editor(s) disclaim responsibility for any injury to people or property resulting from any ideas, methods, instructions or products referred to in the content.
Copyright: This open access article is published under a Creative Commons CC BY 4.0 license, which permit the free download, distribution, and reuse, provided that the author and preprint are cited in any reuse.
Prerpints.org logo

Preprints.org is a free preprint server supported by MDPI in Basel, Switzerland.

Subscribe

© 2024 MDPI (Basel, Switzerland) unless otherwise stated