Preprint
Article

The Urban-Rural Transformation and Its Influencing Mecha-Nisms on Air Pollution in the Yellow River Basin

Altmetrics

Downloads

80

Views

30

Comments

0

A peer-reviewed article of this preprint also exists.

Submitted:

05 June 2024

Posted:

06 June 2024

You are already at the latest version

Alerts
Abstract
Air pollution has recently gained much attention from the general population. Despite pollution control being an issue in both urban and rural regions, most of the available research has concentrated on urban districts. Hence, investigations into how urban-rural transition affects PM2.5 are warranted within the framework of urban-rural integration. Using the Yellow River Basin as a case study, this study employed the entropy method and Analytic Hierarchy Process (AHP) to uncover the extent of urban-rural transformation. It then used the spatial autocorrelation method to investigate the spatiotemporal features of PM2.5 and the spatial econometric model to investigate the mechanisms that influence the relationship between urban-rural transformation and PM2.5. The results are as follows: (1) Over time, there was a discernible upward tendency in the change in urban-rural areas. The development has progressed from asymmetrical north-east and south-west elevations to a more balanced pattern of north-east, middle-east, and west-west elevations. (2) The PM2.5 concentration increased steadily, then fluctuated, and finally decreased. Notably, the general pattern has not changed much, and it is high in the east and low in the west. (3) Different subsystems of the urban-rural transformation have different impacts on air pollution at different stages. The influence of industrial transformation (IT) on PM2.5 showed an inverted “N-shaped” curve of negative-positive-negative changes, and the industrial structure played a leading role in the spatiotemporal evolution of PM2.5. Currently, an inverted "U-shaped" curve forms the left side of the impact of population transition (PT) on PM2.5. Land development (LT) has a "U-shaped" curve for its effect on PM2.5. This research provides a new perspective on the topic of PM2.5 and its connection to urban-rural integration, which is crucial to understanding the dynamics of this shift. To achieve its goal of high-quality development, it supports regional initiatives to reduce PM2.5 emissions in the Yellow River Basin. Moreover, it can provide a reference for decision-makers in the world’s densely populated areas that suffer from serious air pollution.
Keywords: 
Subject: Environmental and Earth Sciences  -   Geography

1. Introduction

Cities often drive global economic development, whereas rural areas generally supply the resources they need while bearing the resulting environmental pressure [1]. Based on the report, there is predicted to be a 1.76 billion increase in the world's urban population from 2000 to 2024, with developing countries expected to account for 86% of this rise. [2]. However, extensive and rapid urbanization has spawned many environmental problems, among which air pollution is particularly serious [3,4]. In particular, haze pollution, mainly in the form of PM2.5 emissions, is most prominent. In response to these changes, the Chinese government established a new ambient air quality standard (GB3095-2012) in 2012; it states that primary PM2.5 concentrations cannot exceed 15 μg/m3 and secondary PM2.5 concentrations cannot exceed 35 μg/m3. Although China has made some progress in reducing PM2.5 pollution, it still lags behind Japan, the United States and other developed nations. According to the World Health Organization’s (WHO) Global Air Quality Report 20202022, the average annual concentration of PM2.5 in China consistently exceeded five to seven times the health standard set by the WHO (≤5 μg/m3) (https://www.iqair.cn) and the current situation of PM2.5 emissions remains pessimistic. Even though the Yellow River Basin's natural environment has improved, the area still has several ecological challenges. Contributing significantly to China's social and economic development and ecological security, the Yellow River Basin is vital to the country's basic industries, energy, chemical industry, and other sectors. The CPC Central Committee and the State Council in 2020 pointed out that the Yellow River has a poor ecological background, weak resource endowments, and environmental carrying capacity, as well as deep environmental pollution. In 2022, the Ministry of Ecology and Environment, the National Development and Reform Commission, the Ministry of Natural Resources, and the Ministry of Water Resources issued an Ecological and Environmental Protection Plan for the Yellow River Basin, which declared that ensuring air quality standards in key areas and improving the level of air pollution control were key priorities. Due to its long history of agricultural production, the Yellow River Basin has a dense population and industry. Thus, its air quality has been in a state of severe decline for many years [5]. Rapid urbanization drives the population–land relationship and urban-rural development in the Yellow River Basin, especially as it regards typical ecological problems such as water and air pollution caused by rapid urbanization and industrial development in its middle and lower reaches, and thus is a region in which population, natural resources, and environmental conflicts are highly concentrated [6]. Therefore, this study takes the Yellow River Basin as the research object, summarizes the spatiotemporal characteristics of air pollution during its urban-rural transition period, and further examines its influencing mechanisms. The research results are conducive to the sustainable, high-quality development of the Yellow River Basin. They can provide a reference for decision-makers in densely populated developing countries suffering serious air pollution.
During the urban-rural transition, problems such as rural economic weakness, environmental pollution, and resource shortages have been experienced worldwide [7]. However, the urban-rural transition is inevitable [8]. Researchers have studied the fundamental nature, objective, and components of urban-rural change. Liu, Long, and other academics assert that the core of the urban-rural transition is facilitating the fundamental overhaul of industrial, agricultural production, and urban-rural dynamics [9,10]. Industrial development, land transformation, and population transition are important components of rural spatial transformation [11]. The research on urban-rural transformation has also shifted from focusing on single-factor analyses of land transformation [9], industrial development [12], and the population transition [13] to the systematic exploration of a multifactor transformation that includes people, land, and industry [2,14,15,16]. Scholars have also studied the resource and environmental problems associated with the urban-rural transformation. Due to weak environmental management in rural areas, urban pollution has gradually been transferred to rural areas. Many enterprises with high energy consumption, heavy pollution, or that are difficult to regulate will relocate to or discard untreated waste in rural areas. In addition, rural air pollution is aggravated due to straw burning and related farming practices [1,17,18]. Urban-rural areas are inseparable after their integration, and only by placing equal emphasis on both can sustainable development be achieved [19,20]. Hence, giving equal importance to controlling pollution in both urban and rural areas is imperative. While previous research has made progress in comprehending urban-rural change and conducting a qualitative analysis of the associated resource and environmental concerns, there is a scarcity of studies investigating the quantitative correlation between these two factors. Moreover, the research concerning the urban-rural transformation in the Yellow River Basin is inadequate, with a specific absence of knowledge regarding its impact on air pollution and the underlying causes.
PM2.5, as the main pollutant that causes haze, not only reduces visibility but poses a serious threat to human health [21]. As more attention is being paid to air pollution, there have been notable achievements in related research. Cheng et al. pointed out that the Gangetic Plain of India and central and eastern China (i.e., the Yellow River Basin regions) are the most serious PM2.5 pollution areas globally [3]. At present, the research on PM2.5 mainly involves the nature, sources of PM2.5 [22,23] as well as its spatial agglomeration characteristics and spatial heterogeneity [24,25]. The temporal and spatial characteristics of PM2.5 were studied using such methods as spatial autocorrelation and ellipse of standard deviation [26,27,28]. Various techniques such as geographical weighted regression, geographical detector, spatial econometric models, and random forest have been employed to analyze the components that influence PM2.5 [29,30,31,32,33,34]. The influencing factors of PM2.5 encompass various natural factors such as terrain, altitude, and others [20,32]. Additionally, economic development, population density, industrial structure, foreign direct investment (FDI), scientific and technological inputs, social activity intensity, municipal transportation, energy consumption, environmental regulation, urban landscape, urbanization, and other social and economic factors also play roles in PM2.5 levels [35,36,37,38]. However, the current discussion on the impact of urbanization on PM2.5 is mostly based on city-level analyses. In addition, the approach to controlling air pollution commonly adopted in China focuses on treating its symptoms. It thus lacks systematic, comprehensive, and holistic considerations of factors in urban-rural areas.
Studying the factors that cause the change from rural to urban areas and how they affect the levels of PM2.5 pollution is crucial for achieving sustainable development. Nevertheless, our current comprehension of the factors that drive the impact of the shift from urban to rural areas on air pollution remains inadequate. This study focuses on 498 counties in the Yellow River Basin, which are considered representative locations. This study uses extensive county-level data to examine the spatial and temporal patterns of urban-rural change and its impact on air pollution. It employs several approaches to analyze the integration of urban and rural areas completely. The purpose of this study was to (1) measure the level of the urban-rural transformation in the study area, (2) accurately assess the overall level of air pollution in the Yellow River Basin, and (3) explore the influencing mechanisms of the urban-rural transition on air pollution. This study aimed to elucidate the multidimensional relationships and patterns between land, population, industrial transformation, and PM2.5 at the county level to support the formulation of regional PM2.5 emission reduction policies and provide a reference for decision-makers in densely populated and severely polluted regions worldwide.

2. Analytical Framework

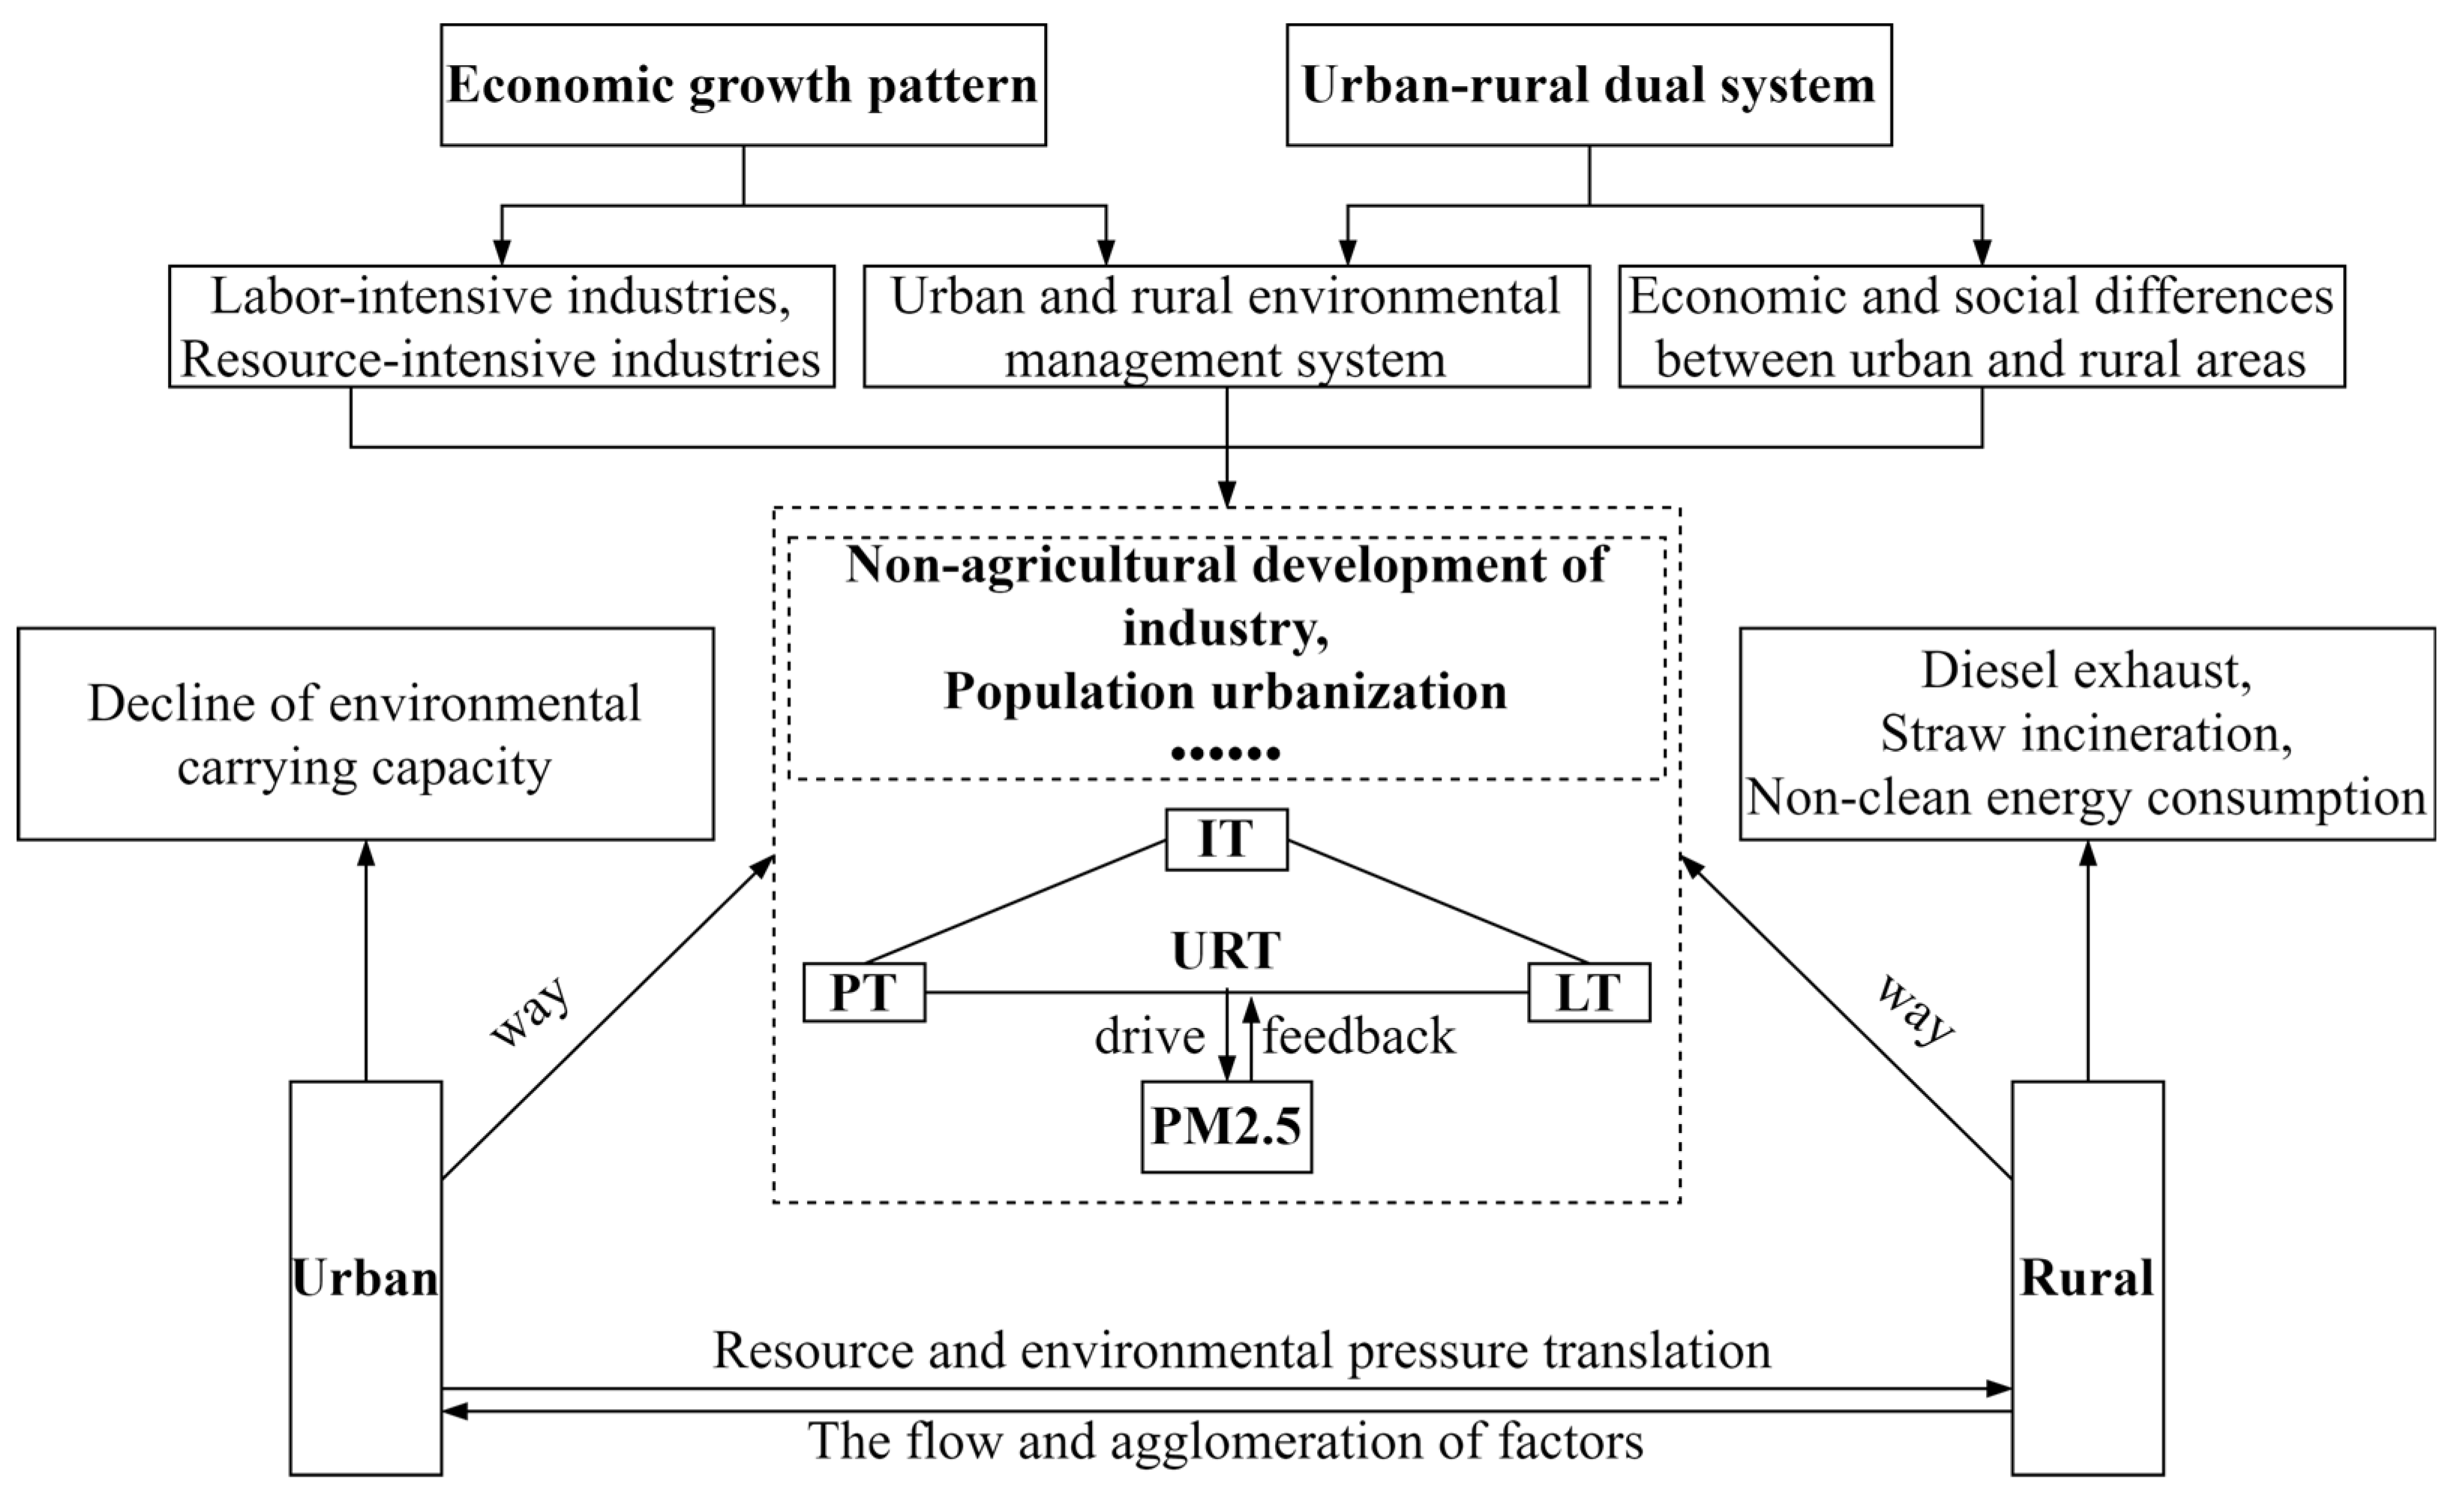
The urban and rural systems have experienced significant transformations due to globalization, urbanization, industrialization, information technology, and various other causes. The occurrence of haze in the transitional phase between urban and rural areas is closely linked to the long-standing urban-rural dual system and economic development pattern applied in China [1]. Following reform and opening-up policies, China has embarked on numerous labor-intensive and resource-intensive industries characterized by significant input, substantial consumption, and considerable pollution. Under the guidelines of economic construction as the center, China's environmental governance always follows the way of pollution first and then treatment. Simultaneously, China carries out the strategy of urban-biased development, which has produced a huge difference in economic and social development between urban and rural areas. Several imprudent practices, including the burning of straw, emitting diesel emissions, and utilizing polluting energy sources like coal, have been adopted by farmers to improve their standard of living despite the detrimental effects on the environment and resource depletion. In broad strokes, the haze issue during transition periods can be attributed to the urban-rural dual system and the direct influence of China's economic development model. The economic growth model established under the urban-rural dual system, the environmental management system, and the urban-rural development gap served as the foundation for these forces [17]. The transition period witnessed the urbanization of the rural population and the non-agricultural sector as the primary drivers of factor flow and aggregation. Subsequently, concerns have increased in rural regions, whereas the carrying capacity of resources and the environment in urban areas has progressively waned. Simultaneously, rural regions experience the strain of resources and the environment due to the transmission of factors from urban spots (Figure 1). In a multidimensional fashion, this article quantitatively analyses the pollution problem resulting from the rapid urban and rural transformation (URT) process.

3. Materials and Methods

3.1. Study Area

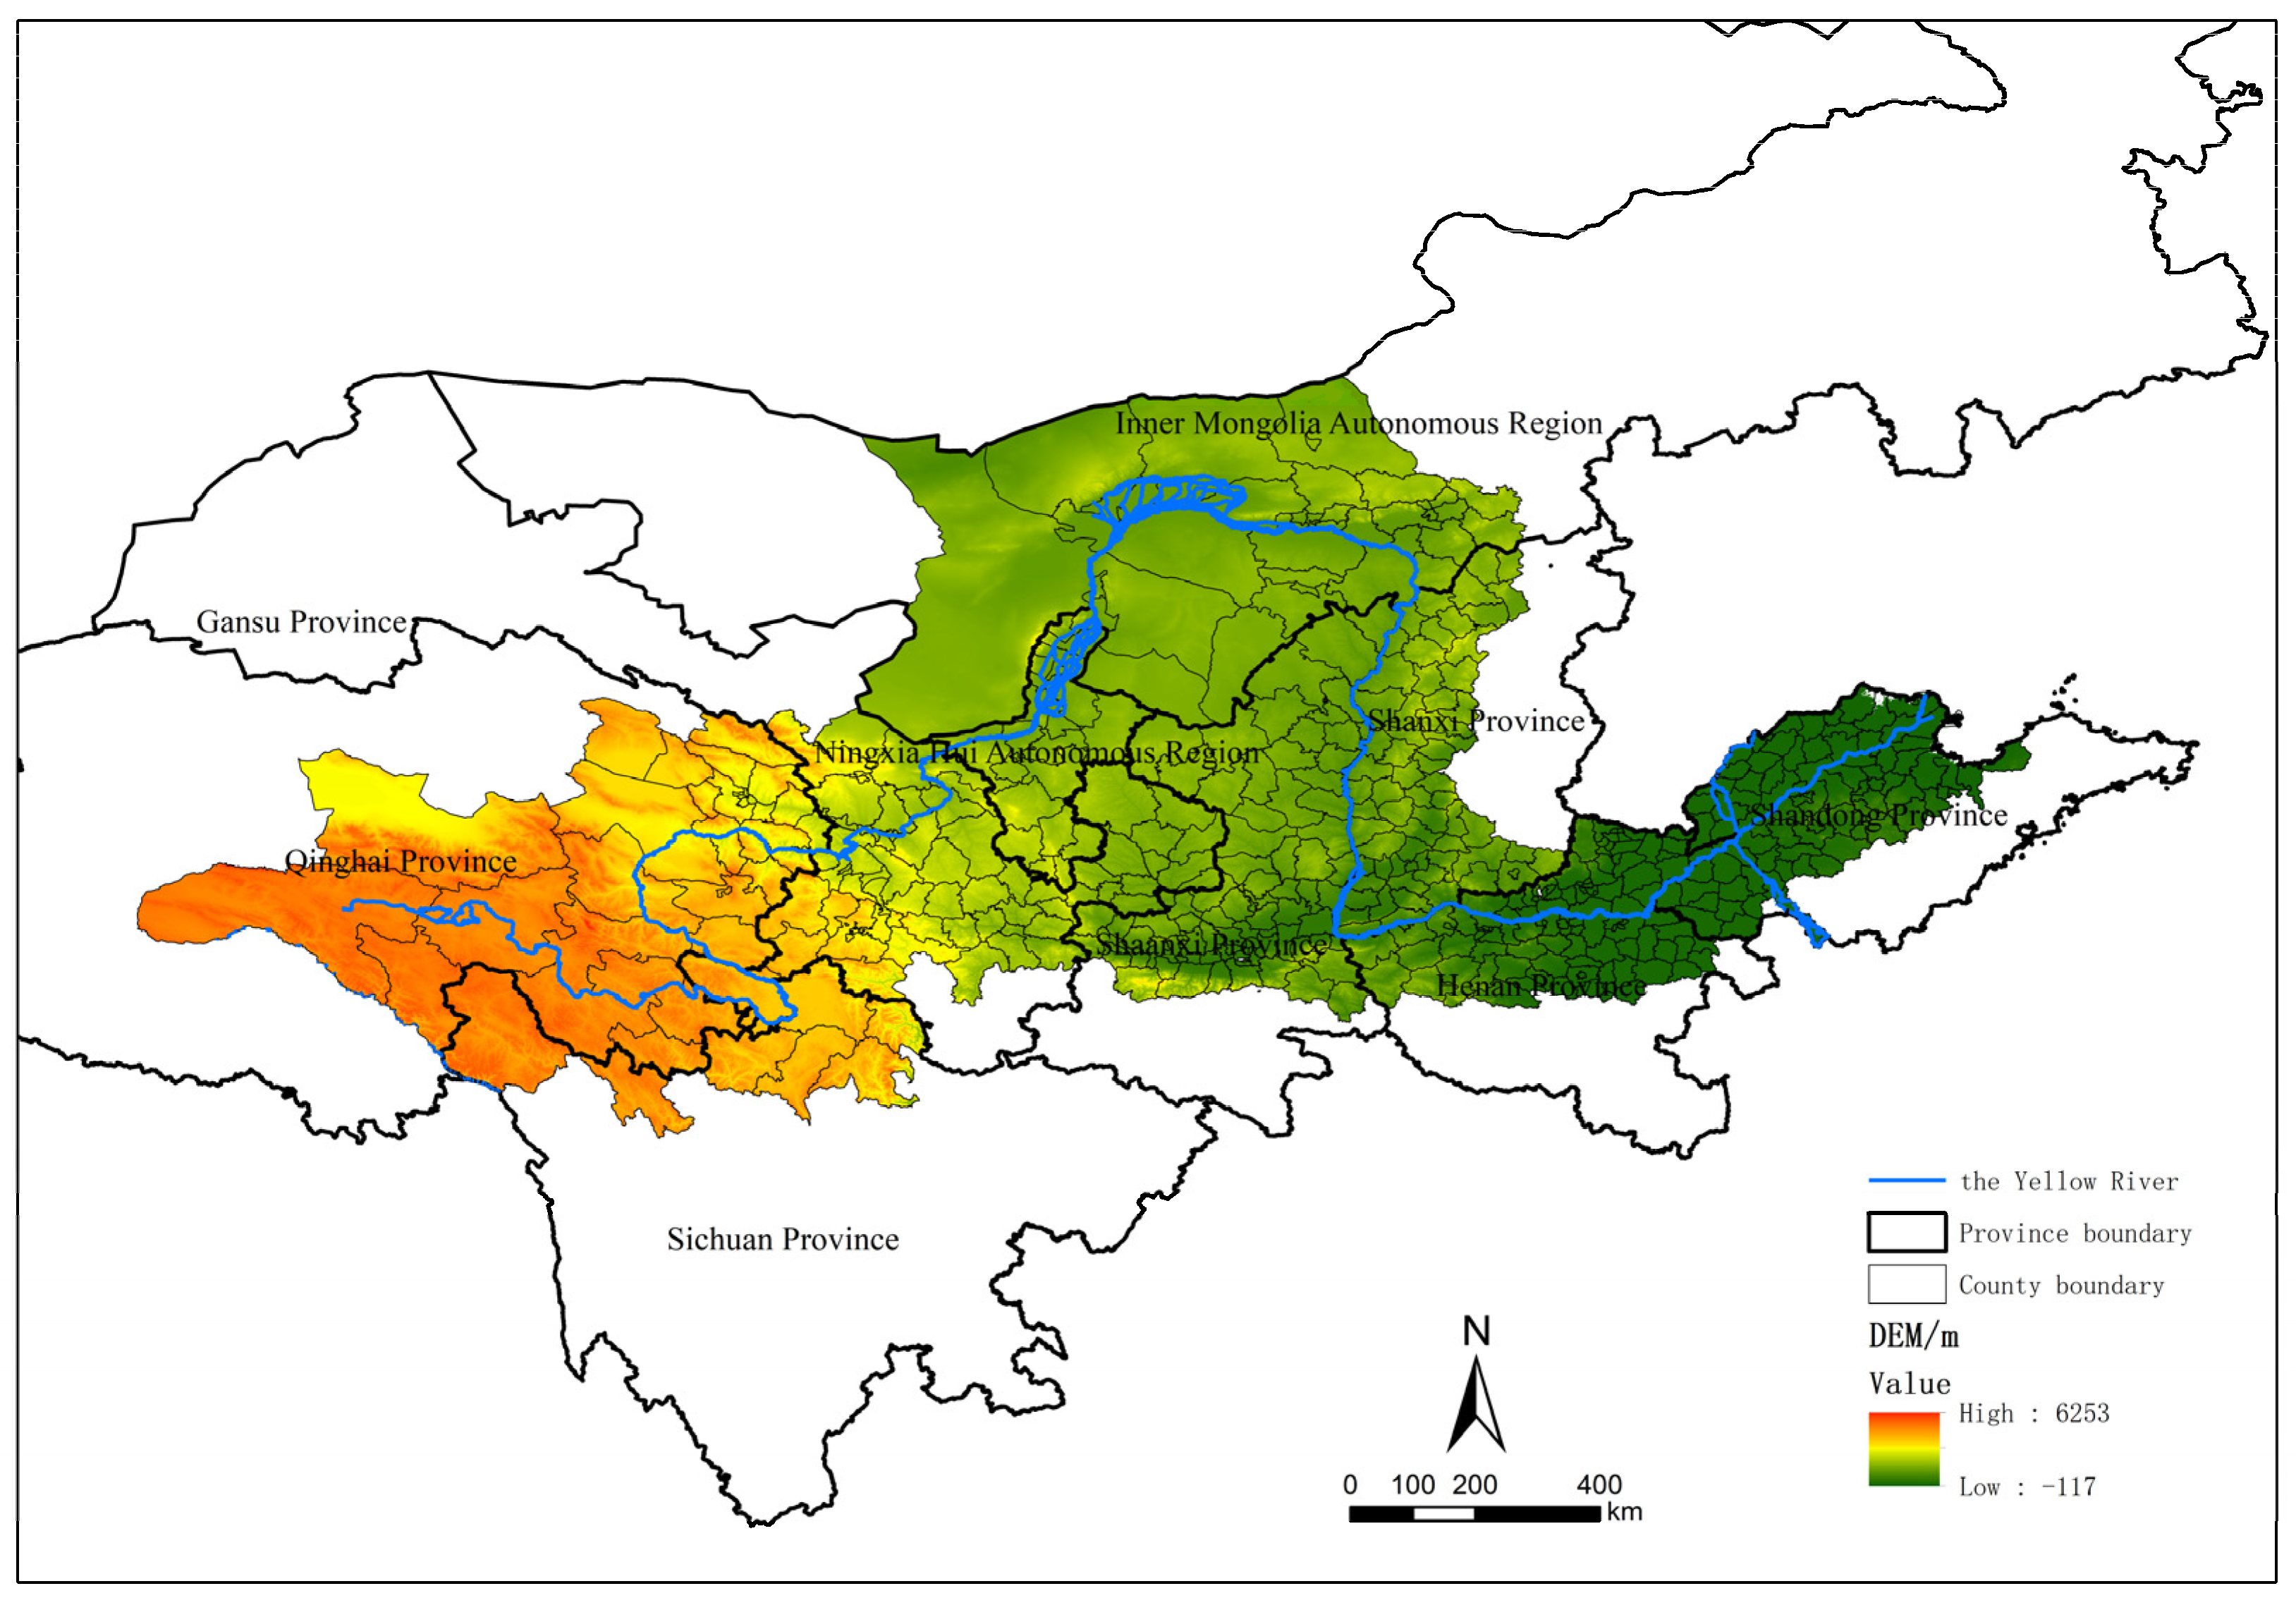
The Ecological Environment Protection Plan for the Yellow River Basin defines the geographical extent of the basin as encompassing the county-level administrative regions of nine provinces (i.e., autonomous regions), including Qinghai, Sichuan, Gansu, Ningxia, Inner Mongolia, Shaanxi, Shanxi, Henan, and Shandong provinces, where the main and tributaries flow of the Yellow River. This includes the main river and its tributaries. This study focused on 498 counties in the Yellow River Basin as the research subjects, considering the spread of air pollution and the correlation of economic and other aspects across county-level units (Figure 2). The study area's permanent population reached roughly 212.23 million by the end of 2020, or 15.03% of China's total population. The gross domestic product is roughly 9.8 trillion yuan, representing around 9.66% of the nation's output. The urbanization rate, on average, stands at approximately 56.6%, below the urbanization rate reported in the national population census (63.9%). The policy of fostering the "Rise of the Central Region" was reinforced by the Central Committee of the Communist Party of China and the State Council in 2006, which issued several opinions. During this timeframe, sectors with substantial energy consumption, pollution, and emissions were significantly shifted from the economically advanced eastern areas to the central region [39]. As a consequence, the central region experienced elevated levels of PM2.5 pollution. In 2013, the State Council released the Ecological Environment Protection Plan for the Yellow River Basin, which partially tackled the issue of air pollution. The average annual concentration of PM2.5 in the Yellow River Basin in 2020 was 37.56 μg/m3, exceeding the secondary air quality level (35 μg/m3) established by the Chinese government in 2012 and well below the health threshold set by the World Health Organization (≤5 µg/m3). Consequently, air pollution continues to pose a significant danger. As our understanding of the interconnectedness between urban and rural areas grows, it is crucial to prioritize air pollution mitigation in both settings. Hence, it is imperative to investigate the influential mechanisms of urban-rural transformation on PM2.5 in the Yellow River Basin.

3.2. Data Sources

The data include county-level administrative boundary vectors, average annual PM2.5 concentrations, explanatory variables, and control variables (Table 1). Among them, the county-level administrative boundary vector data were finally obtained using ArcGIS software based on the 2021 administrative regions as the benchmark, which resulted in 498 county-level units. Average annual PM2.5 concentration data were derived from the global PM2.5 dataset. The advantages of this data are its long observation times, high observation accuracy, and wide coverage [40]. In addition, drawing upon existing research, this study divides the urban-rural transition into three dimensions: PT, IT, and LT [41,42]. Simultaneously, existing studies have shown that natural factors, population size, energy optimization, human activities, vegetation cover, and other factors impact PM2.5 [4,43,44]. Therefore, studying the impact of the urban-rural transition on PM2.5 requires us to include these factors as control variables. The specific data of the explanatory and control variables are set as follows (Table A1):
(1) PT, IT, and LT are set as the core explanatory variables (Table 2). PT is a process by which the rural population is transformed into an urban population through its agglomeration into the urban. The urbanization rate of the population is a measure of the extent to which people are moving from rural areas to cities. It is calculated by dividing the number of people living in cities permanently by the total number of permanent residents. IT is a comprehensive process that involves direct or indirect adjustments to various aspects of the existing industrial structure, characterized by the proportion of non-agricultural industrial output to total regional output. LT results from a combination of urban land (LUT) and rural land (LRT) change. On the one hand, land transformation is reflected in the sprawling expansion of urban construction. Conversely, cultivated land is closely related to transforming urban-rural areas. It is represented by the ratio of town dwelling, industrial, and mining land in the county and the ratio of cultivated land in the county, respectively. The population data come from the census data in 2000 (the fifth census year), 2010 (the sixth census year), and 2020 (the seventh census year). The economic data mainly come from 2001, 2011, and 2021 China County Statistical Yearbook, Qinghai Province, Sichuan Province, Gansu Province and Ningxia Provincial Statistical Yearbook, as well as the national economic and social development statistical bulletins in relevant cities and counties in the Yellow River Basin in 2000, 2010, and 2020. Some missing data were processed by replacing missing values using SPSS26 software for mean and linear interpolation. The statistics for urban industrial, mining, and agricultural land originate from the Resource and Environmental Science Statistics Center of the Chinese Academy of Sciences, accessible at http://www.resdc.cn/. The data presented here are derived from Landsat TM/ETM remote sensing pictures. The necessary data are obtained through a process of supervised classification and reclassification.
(2) Regarding the selection of control variables, electricity consumption (EL) represents not only the consumption of industrial energy in urban areas but also the reduction in the use of non-clean energy sources, such as coal in rural areas, as represented by per capita electricity consumption. The continuous expansion of population size (POP) leads to problems such as expanding construction land, traffic congestion, housing shortages, reduction in per capita public resources, and increased energy consumption intensity. In theory, the expansion of the population will exacerbate the increase in PM2.5, which is associated with the number of permanent residents. The intensity of social activity reflects the comprehensive intensity of human socioeconomic activities. Previous studies have shown a close relationship between nighttime light image data and energy consumption, urban population density, and total GDP characterized by nighttime light brightness (NLT) [45,46]. The vegetation index can accurately reflect the surface vegetation coverage status and is represented by the annual normalized vegetation index (NDVI). The data originated from the China Annual Vegetation Index Spatial Distribution Dataset, managed by the Resources and Environmental Sciences and Data Center of the Chinese Academy of Sciences (http://www.resdc.cn).

3.3. Research Methods

3.3.1. Index of Urban-Rural Transformation

The process of urban-rural transformation encompasses various dimensions, including population dynamics, land utilization, and industrial development. This paper uses previous study findings to develop an index to measure urban-rural change in counties within the Yellow River Basin. The index is constructed based on three fundamental factors: population, land, and industry (Table 1). Within the indication system, the criterion layer consists of three dimensions: PT, IT, and LT. The indicator layer integrates the three aspects above while considering the availability of data. The weight of each indicator layer is determined by the objective weighing method, namely the entropy approach, and the subjective weighting method, known as AHP. These methods are used to accurately assess the contribution of each indicator layer to the urban-rural transformation. As the value increases, the contribution also increases, and vice versa. The specific process is as follows:
1.
Data standardization processing [47].
To eliminate the influence of different indices on the comprehensive evaluation of the urban-rural transformation, this paper adopts the range standardization method to standardize the data of four explanatory variables indices of counties and districts in the Yellow River Economic Belt in 2000, 2010, and 2020 year. The calculation is expressed as:
Forward   pointer :   r i j   =   A i j m i n ( A i j ) m a x ( A i j ) m i n ( A i j )
Negative   indicators :   r i j = m a x ( A i j ) A i j m a x ( A i j ) m i n ( A i j )
where rij is the index value after standardization; Aij is the original value of index data; max(Aij) and min(Aij) are the maximum and minimum values of the original Aij indicator, respectively.
2.
Calculate the weights.
In this paper, the objective and subjective weighting methods are used to determine the index weights. Specifically, the objective weighting law avoids the problem of subjective assumptions. Still, there is a problem in that the weight of indicators is judged only by the differences in the data themselves. Thus, it sometimes ignores the differences in the actual importance of the indicators, thereby resulting in unreasonable weights. While the subjective weighting method is reasonable in judging the difference in the importance of information represented by the indicators, it still has the problems of subjective assumptions and random scoring [48]. Therefore, this paper adopts the combination weighting method based on entropy and AHP to calculate the level of the urban-rural transition in the Yellow River Basin.

3.3.2. Kernel Density Estimation

This paper uses the Kernel density method to analyze the distribution of PM2.5 in the Yellow River Basin and estimate the dynamic distribution characteristics of PM2.5 in the Yellow River basin.

3.3.3. Spatial Autocorrelation Analysis

Air pollution is spatially dependent and heterogeneous. In terms of PM2.5, due to the fluidity of the atmosphere, the occurrence of haze often affects multiple neighboring regions. Therefore, this paper uses the global autocorrelation Moran’s index to test the spatial correlation of PM2.5 in the Yellow River Basin, the specific formula of which is as follows:
I =   n i   =   1 n j   =   1 n W i j ( x i x ¯ ) ( x j x ¯ ) ( i   =   1 n j   =   1 n W i j ) i   =   1 n ( x i x ¯ ) 2
where xi and xj are the observed values in region i and j; n is the number of counties; Wij is the space weight matrix; and x is the average of the observed values in n regions. The global Moran index I is a rational number with values distributed in [-1,1]. When I > 0, a positive correlation exists; when I < 0, a negative correlation exists; when I = 0, there is no spatial correlation. The larger the absolute value of I, the stronger the spatial autocorrelation is (i.e., the stronger the overall spatial agglomeration of PM2.5).

3.3.4. Spatial Metrology Model

Normal least squares regression models have spatial dependence issues when analyzing the spatial impacts of numerous variables. This article uses the spatial econometric model to examine the elements contributing to air pollution and how it correlates with space. Common components include the spatial lag model (SLM), the spatial error model (SEM), the spatial Durbin model (SDM), and others. Spatial Durbin is an expanded version of the spatial lag and spatial error models that incorporates both endogenous interaction effects (WY) and exogenous interaction effects (WX) [49]. Its specific formula is as follows:
y   =   ρ W y + X β + W X θ + μ μ ~ N ( 0 δ 2 )
where Wy describes the endogenous interaction effect of y; WX describes the exogenous interaction effect of X; ρ is the spatial autoregressive coefficient; θ is the coefficient on exogenous interaction effect. When θ = 0, it is the SLM model, and when θ = - ρβ, it is the SEM model. The more significant θ is, the stronger the spatial interaction between explanatory variables, and it can be theoretically determined whether there is a spatial spillover effect. This paper selects the adjacent space weight matrix and uses the spatial weight matrix based on the reciprocal square of Euclidean distance as the robustness test of the model results. Regarding optimal model selection, LM, Hausman, effect, WALD and LR test were carried out sequentially, and log-likelihood ratios were used to compare the goodness-of-fit of different models.

4. Results

4.1. Characteristics of the Spatiotemporal Evolution of the Urban-Rural Transformation

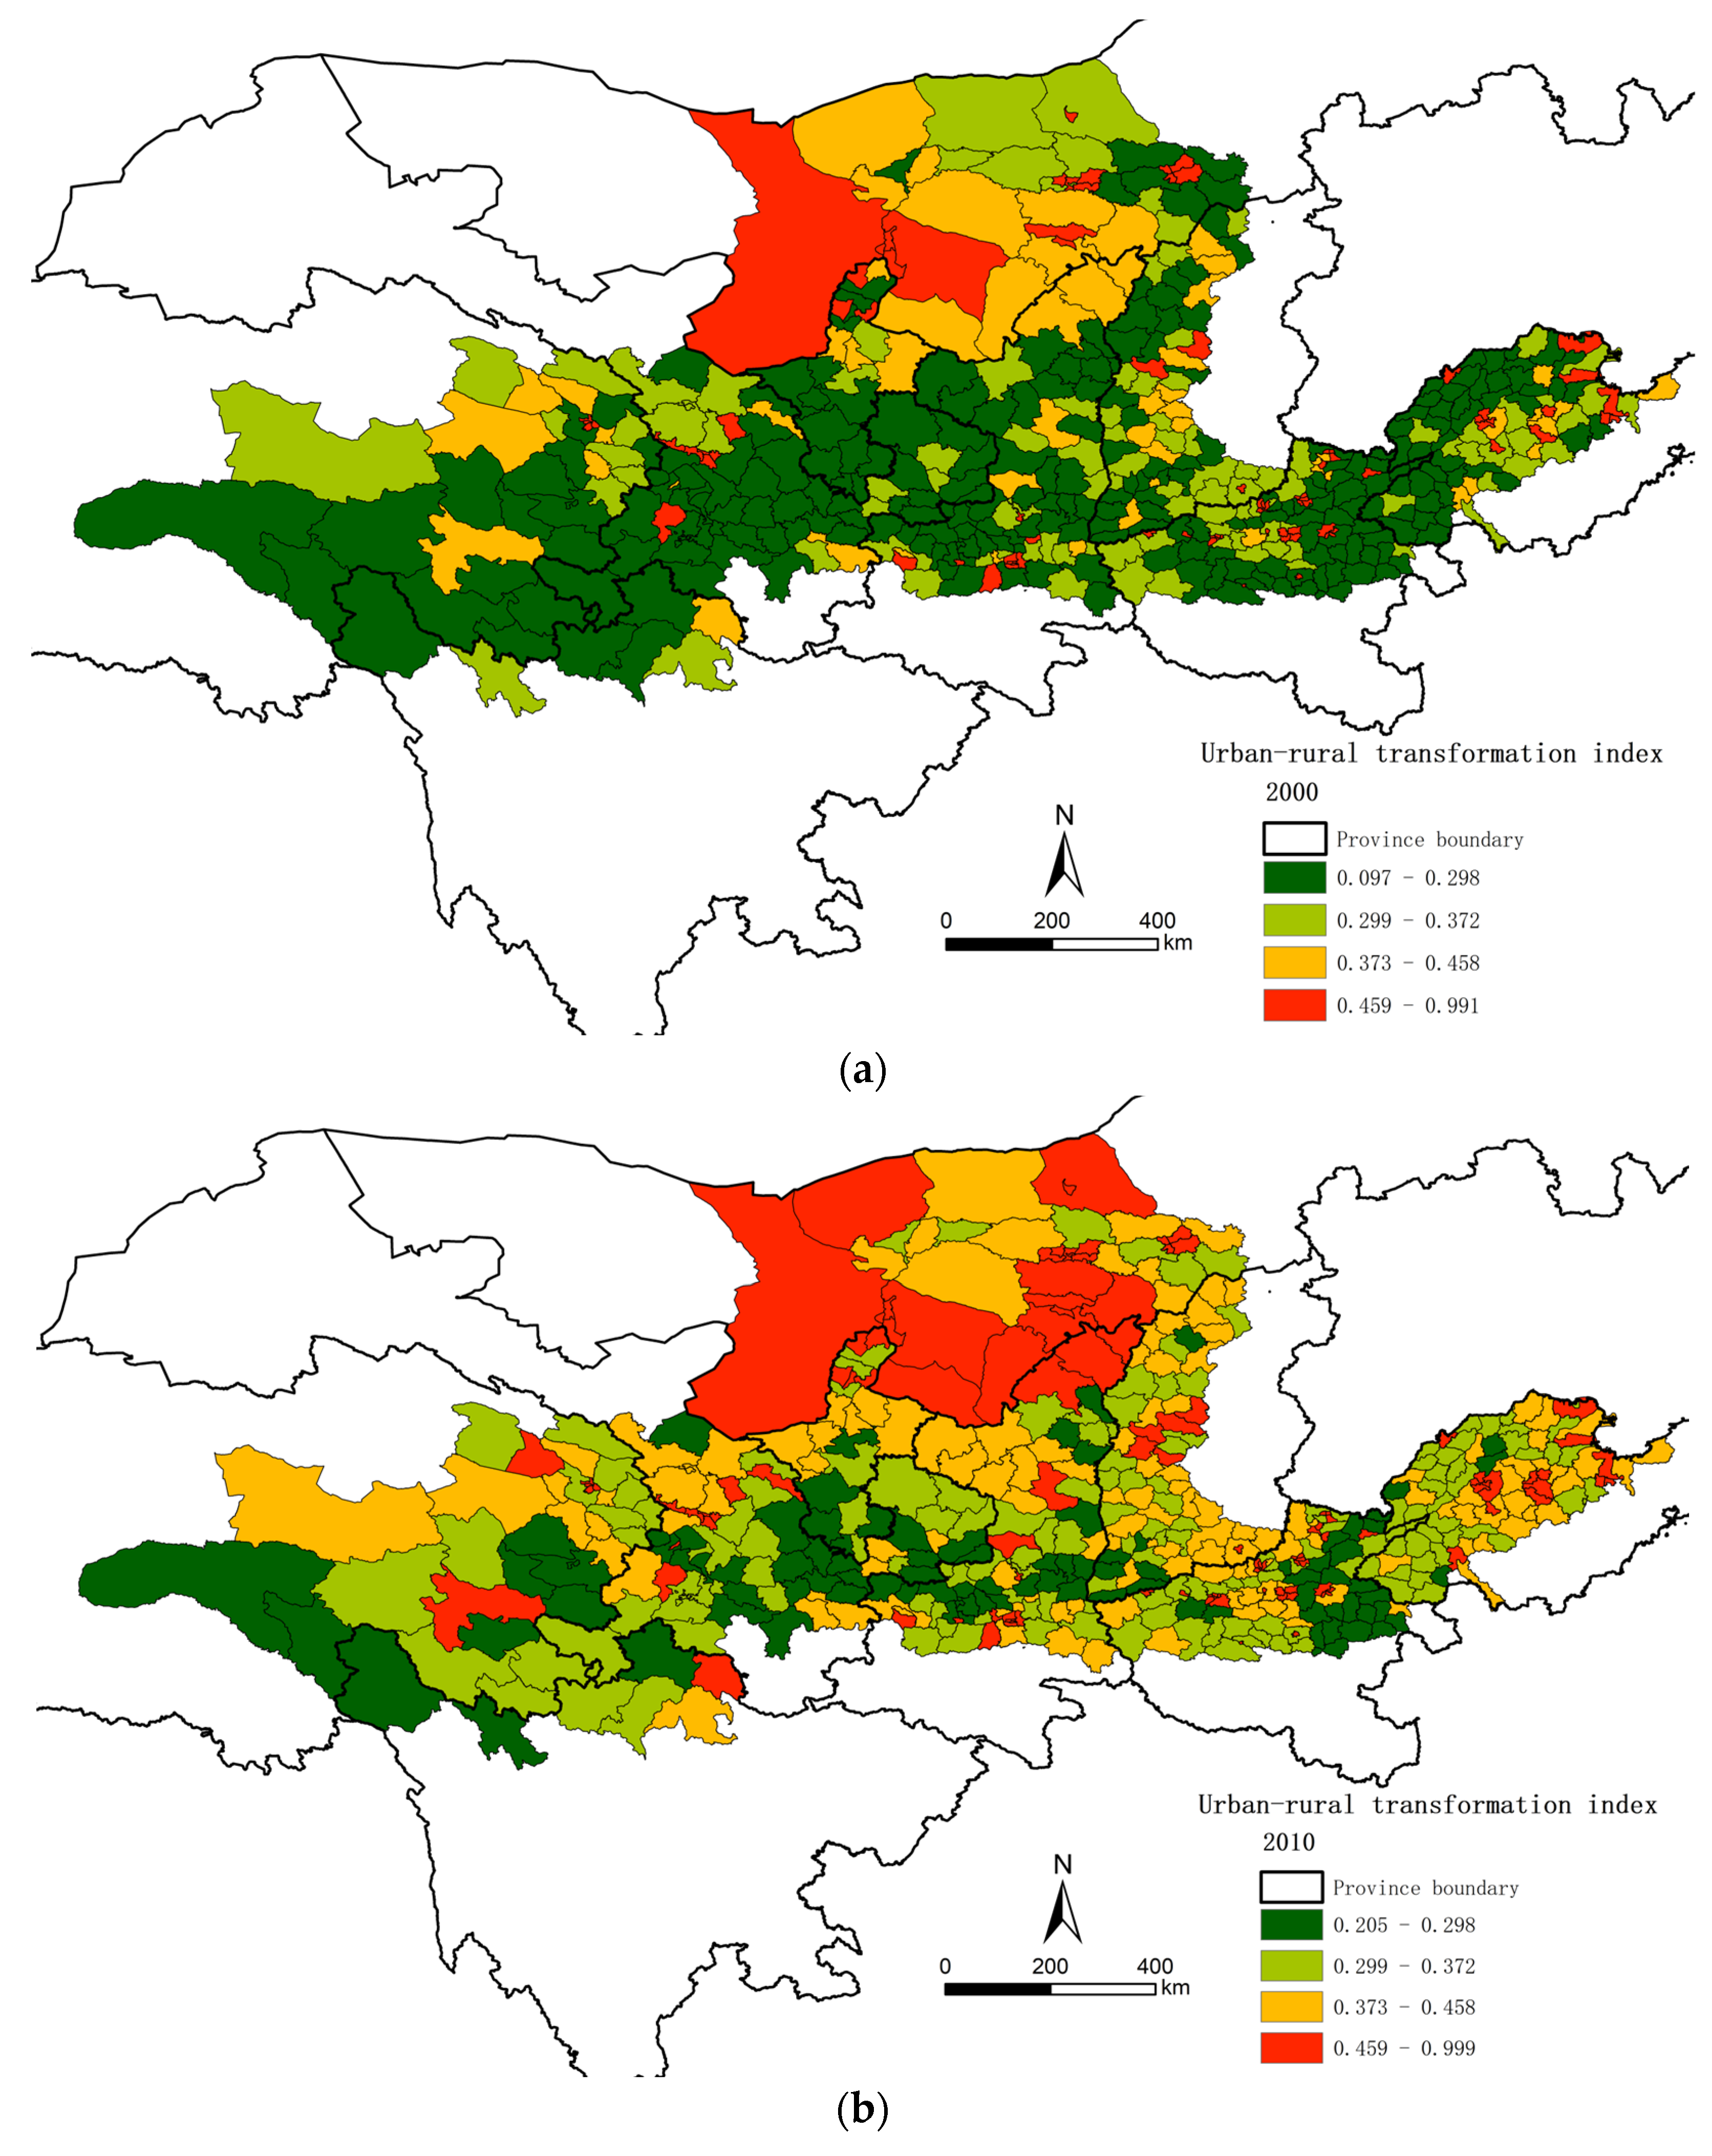
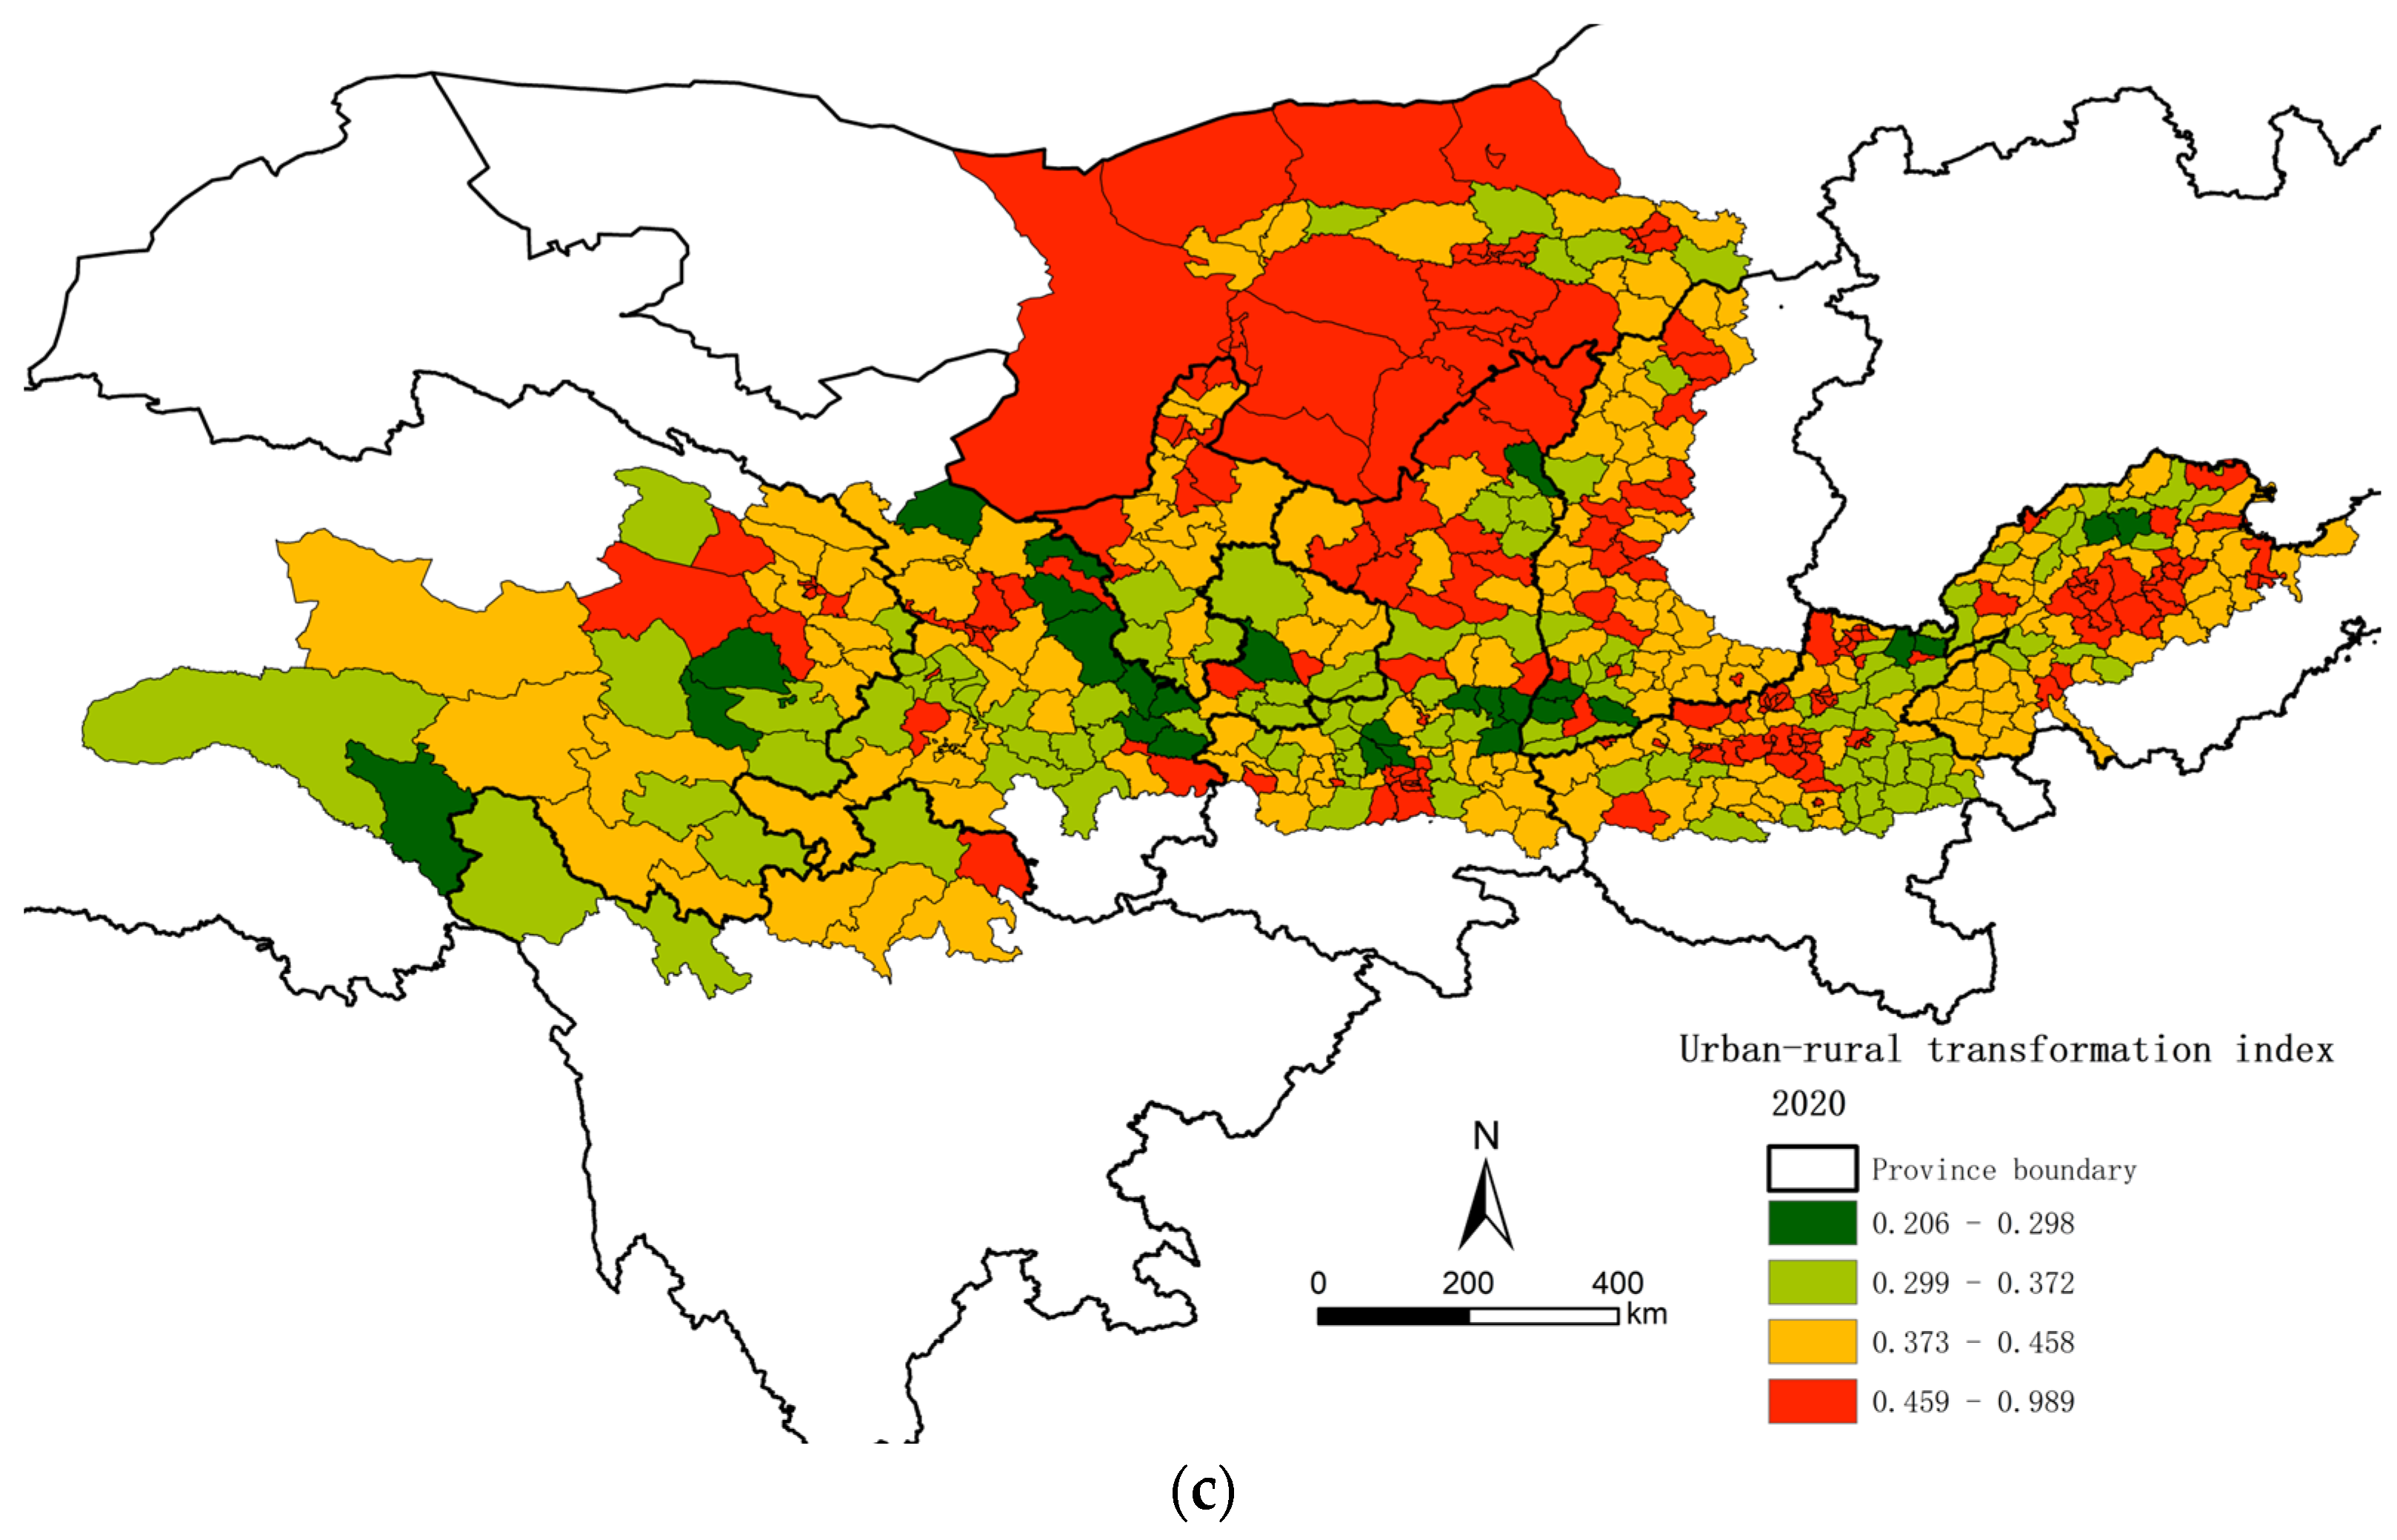
Using the quartile technique, the Yellow River Basin counties' urban-rural transformation is assessed as follows: 25% (1/4th quartile), 50% (1/2th quartile), and 75% (3/4th quartile). Figure 3 shows the spatial representation of the four tiers of urban-rural change in counties: low, lower, higher, and high.
There was a considerable increase in the total transition level of urban-rural areas between 2000 and 2020. Overall, the urban-rural transformation has been trending upwards, with average index values of 0.3284, 0.3947, and 0.4478 in 2000, 2010, and 2020, respectively. Overwhelmingly, the degree of urban-rural change was low in 2000, with 71.49 percent of counties falling into zones with Low or Lower index values. There was a concentration in the western and central regions, and 253 counties had low index values, and 103 had lower index values. Dispersed over the province capital areas, the regions with high index values comprise just 17.06% of the total. Even though fewer counties had Low index scores in 2010, the urban-rural transformation index was higher than in 2000. A total of 49.59% of counties are located in areas with Higher or Higher index values. Among these, high-value areas are consistently distributed in provincial capital cities and exhibit a relatively high level of urban-rural transformation in Inner Mongolia Province. The proportion of counties with Low index values decreased from 50.81% to 15.46%, primarily in the west and east of Qinghai Province, Northern Sichuan Province, Central and Eastern Gansu Province, Southern Ningxia Province, Eastern Henan Province, and other regions. In 2020, the urban-rural transformation in the Yellow River Basin increased significantly compared to 2000. This was due to the rural revitalization strategy and poverty alleviation measures. 71.49% of the counties and districts were located in areas with high or high-index values, while only 0.03% had low index values. Counties that have high index values tend to cluster around major cities. Counties in the Yellow River Basin with low index values are dispersed over the borderlands of different provinces.
Over time, the Yellow River Basin's urban-rural transformation level has shifted from asymmetrical growth in the north and east to a more balanced pattern of development in the middle and west. A decrease in the urban-rural transformation index difference from 0.894 to 0.785 during the research period suggests that the spatial differences in the region's urban-rural transformation shrank. Most of Inner Mongolia's and each province's counties with a high degree of urban-rural transformation are located in or close to the cities. This might be because Inner Mongolia is rich in natural gas, rare earth metals, coal, sheep, and a relatively tiny population. Consequently, it is leading the urban-rural transformation with its greater urbanization rate and more developed economy than other provinces and cities in the Yellow River Basin. The western regions and the periphery of provinces in the Yellow River basin are primarily home to the counties with lower index values. The urban-rural transformation may progress slowly in the western region since its physical geography is unstable and constrained by numerous factors like topography, resource distribution, policies, etc.

4.2. Characteristics of the Spatiotemporal Evolution of PM2.5

4.2.1. Distribution situation of PM2.5 in the Yellow River Basin

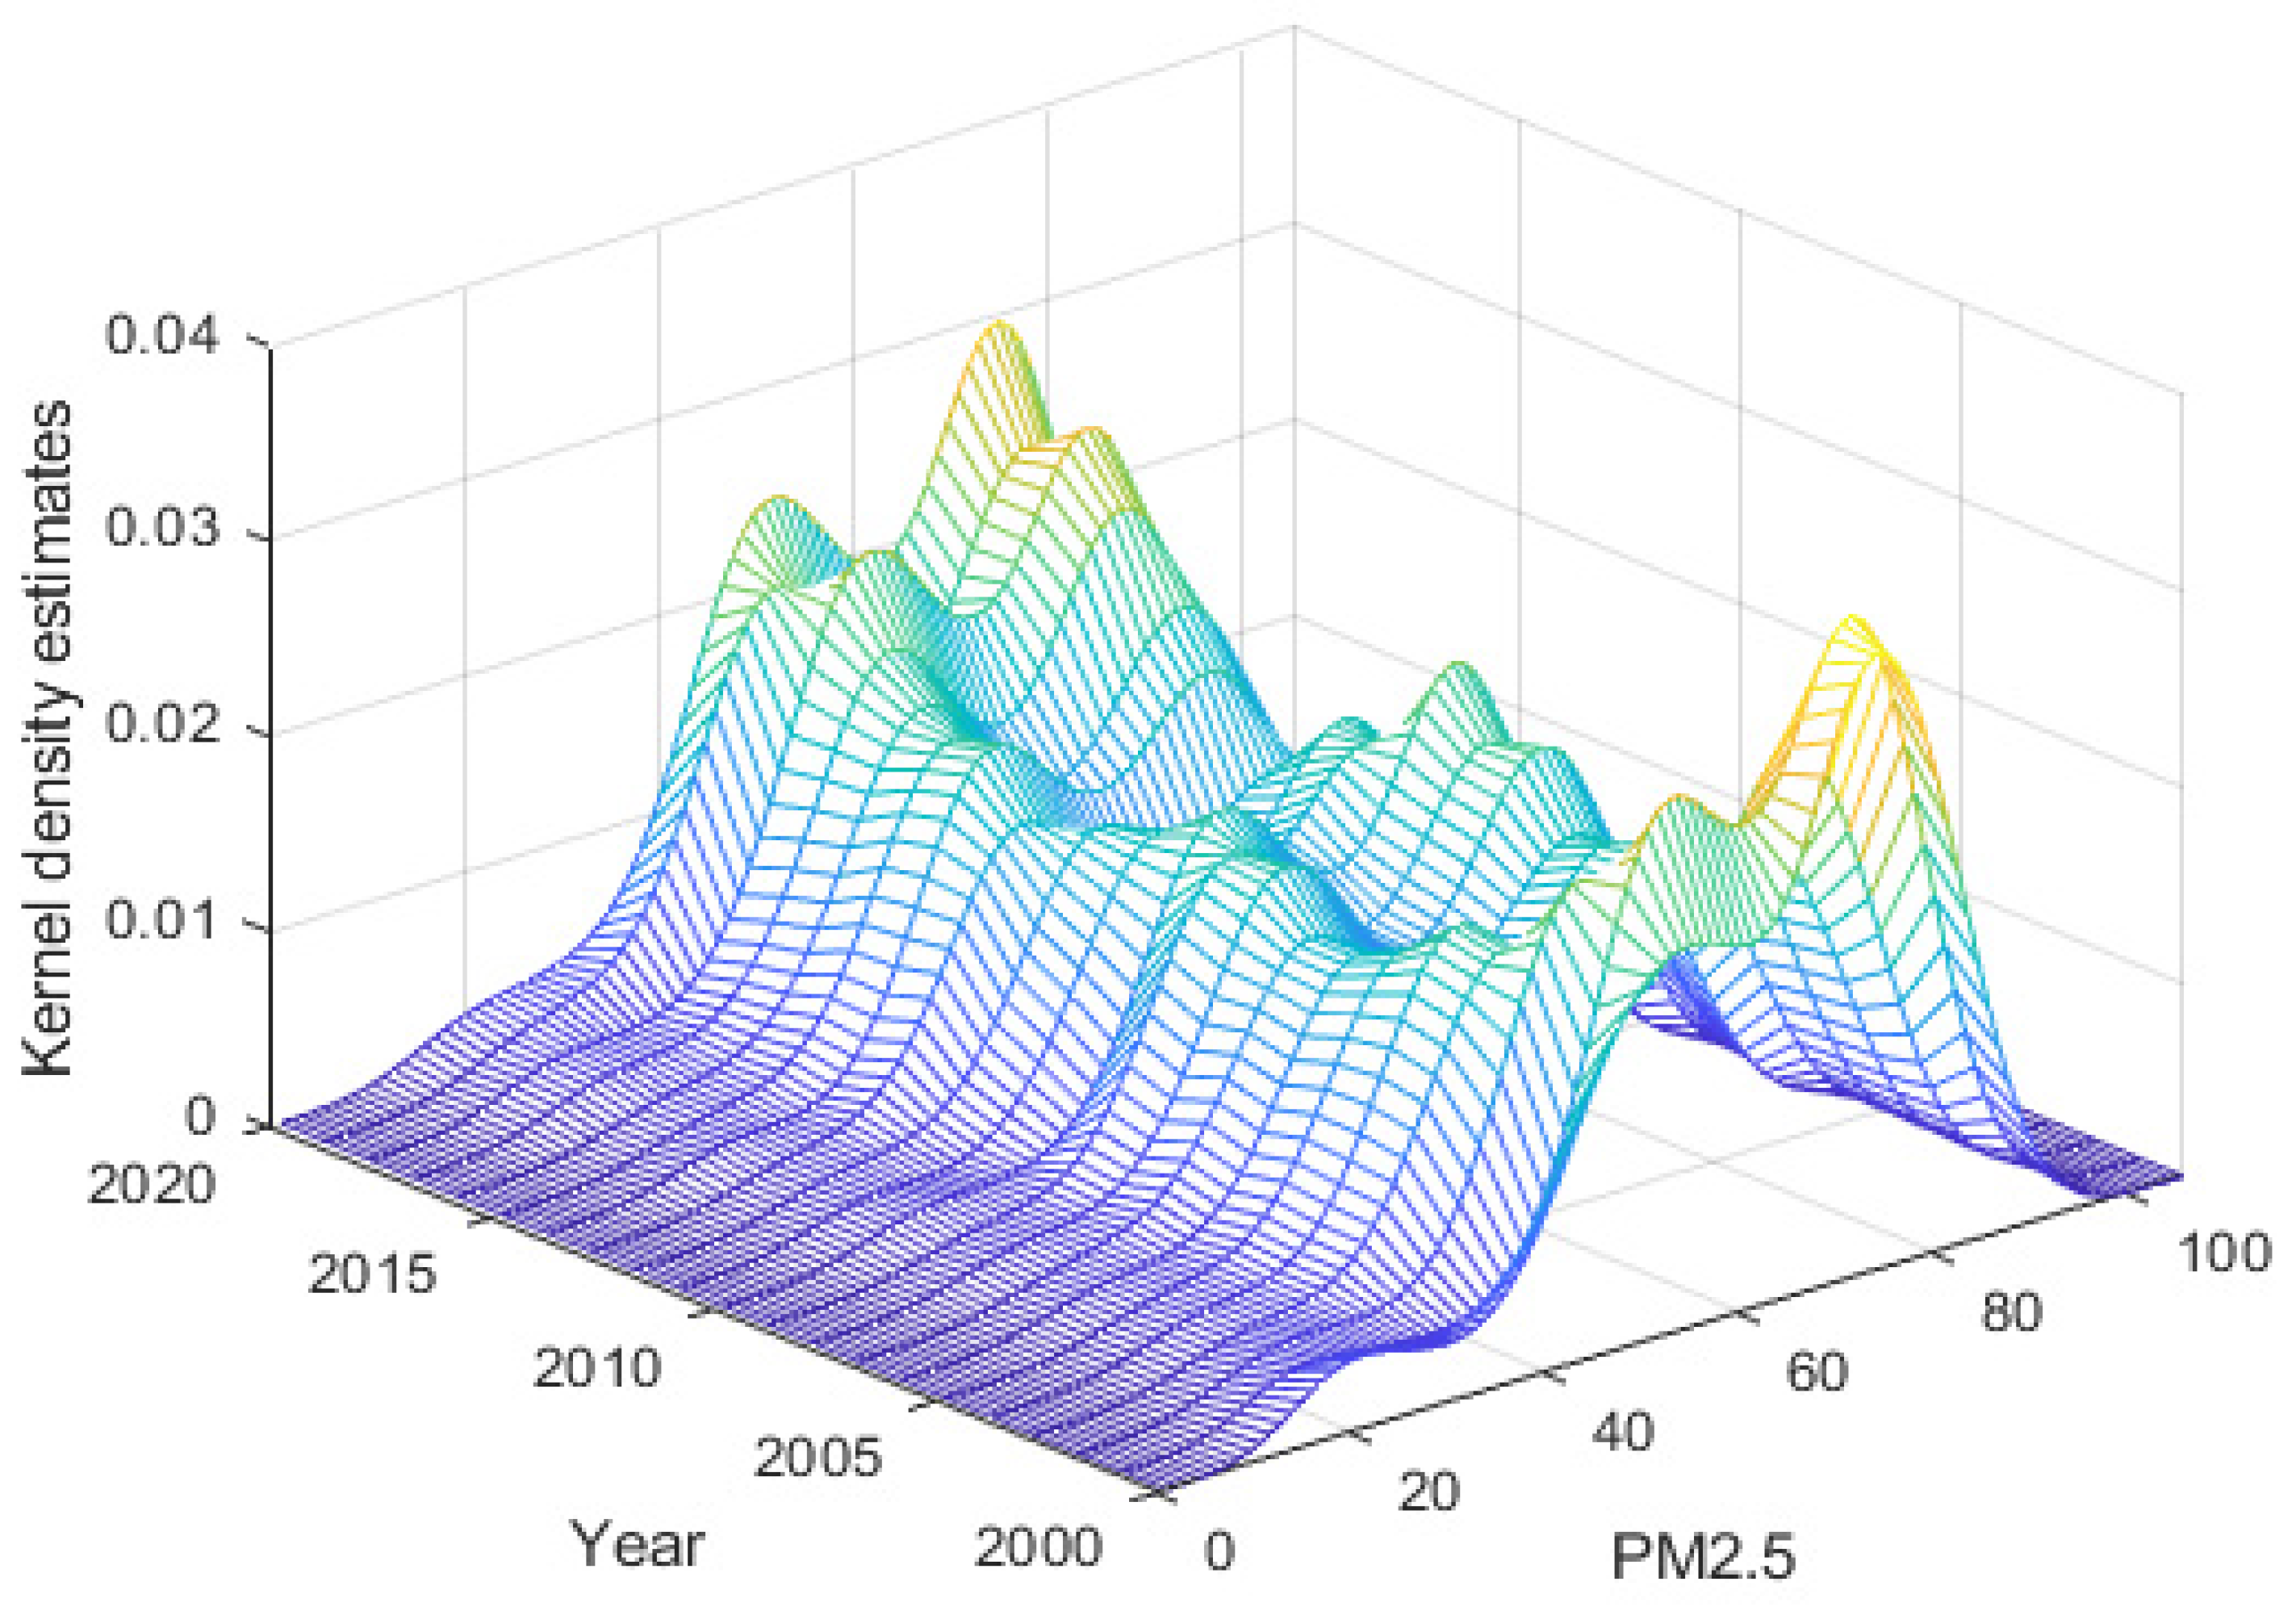
The distribution condition of PM2.5 in 498 counties of the Yellow River Basin from 2000 to 2020 is analyzed in this paper using the Kernel density approach. From Figure 4, we may deduce the PM2.5 dynamic dispersion features. When looking at the data as a time series, there were turning points in the average PM2.5 concentration between 2006 and 2015. From 2000 to 2006, it showed an upward trend, with the average concentration increasing from 43.39 μg/m3 to 59.57 μg/m3, which is the maximum value observed during the study period. From 2006 to 2015, the overall average concentration of the region was at a relatively high level, and pollution was relatively severe. From 2015 to 2020, the overall average annual concentration in the region showed a downward trend. During this period, the State Council of China issued policies such as the Action Plan for Air Pollution Prevention and Control in 2013, which curbed air pollution to some extent. However, there are significant differences in PM2.5 among different counties, but the fluctuations are small, and the overall trend tends to be consistent. In the dynamic distribution characteristics, first of all, from the characteristics of the peak, the peak of PM2.5 concentration in the Yellow River basin showed a trend of first decreasing and then rising during the sample period. The shape of the wave peak did not change significantly, indicating that the gap of PM2.5 concentration in all counties persisted. When looking at the nuclear density curve regarding the number of wave peaks, we can see that it went from having many side peaks to just one, and the side peaks gradually flattened and widened. This suggests that the overall PM2.5 concentration in the Yellow River basin was reduced, too. Finally, from the perspective of distribution pattern, the nuclear density curve has obvious right tail characteristics, indicating that PM2.5 in these counties is greatly different, and individual counties exceed others.

4.2.2. Spatial Pattern of PM2.5 in the Yellow River Basin

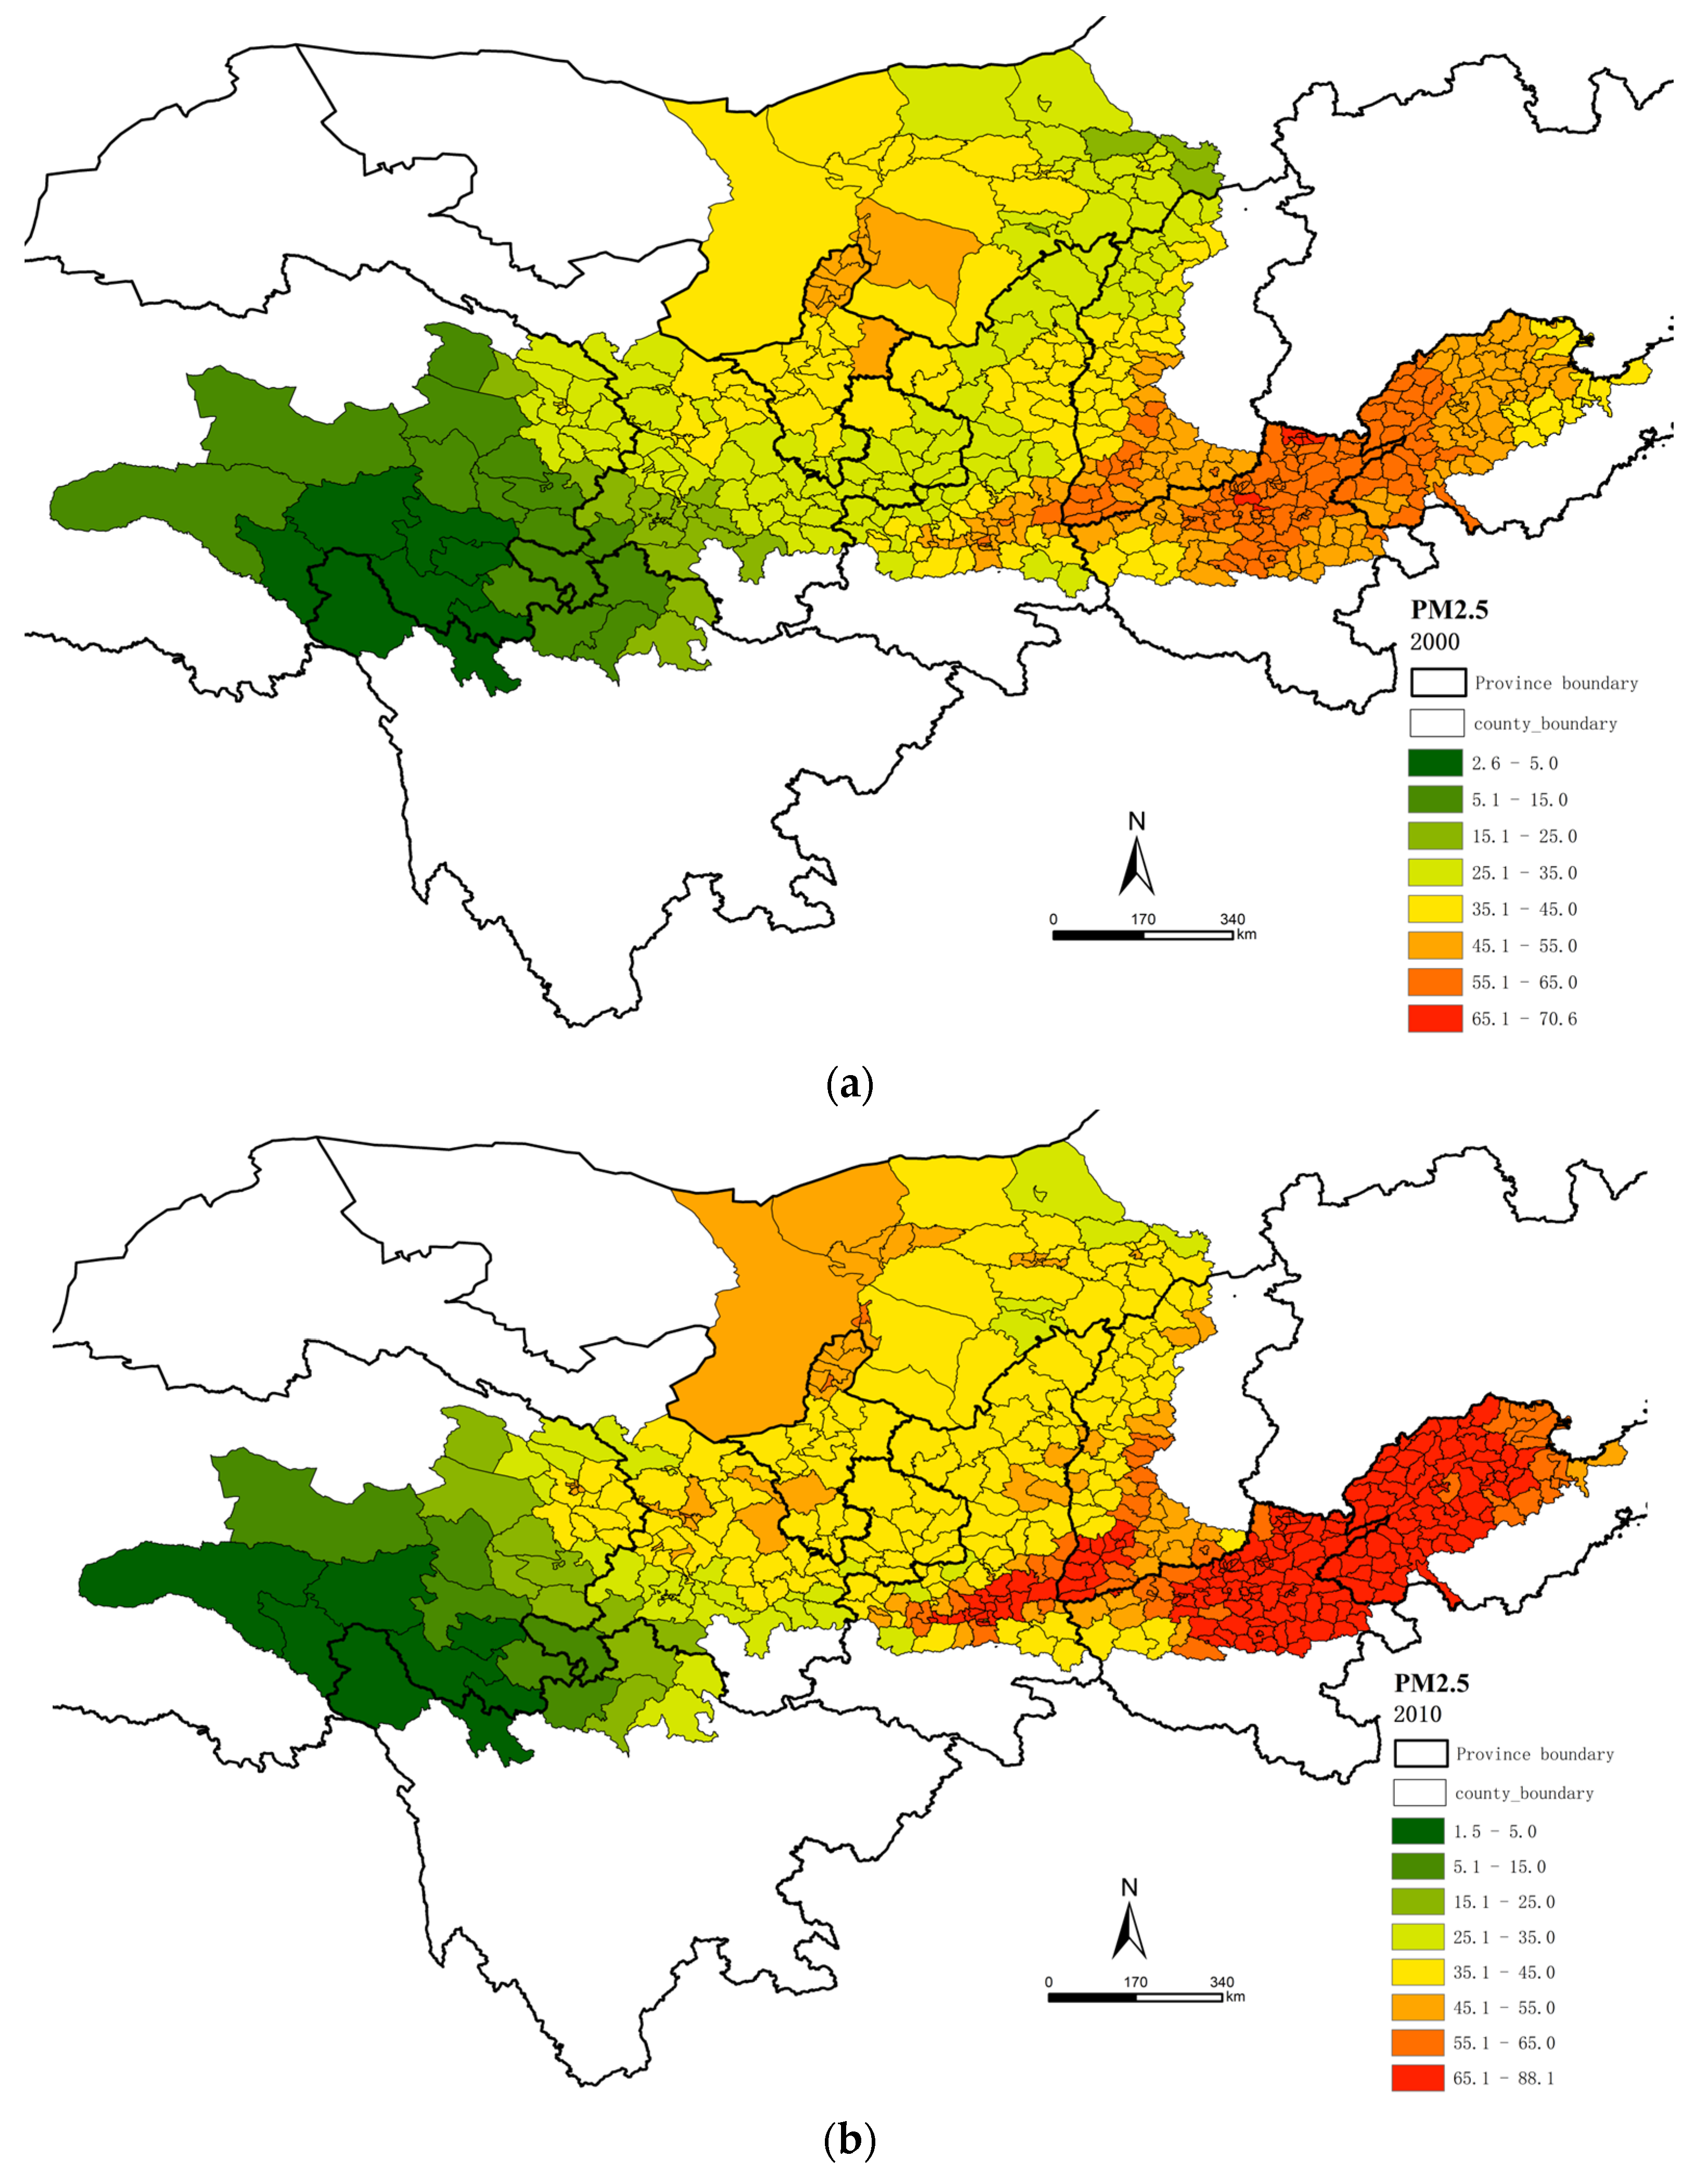
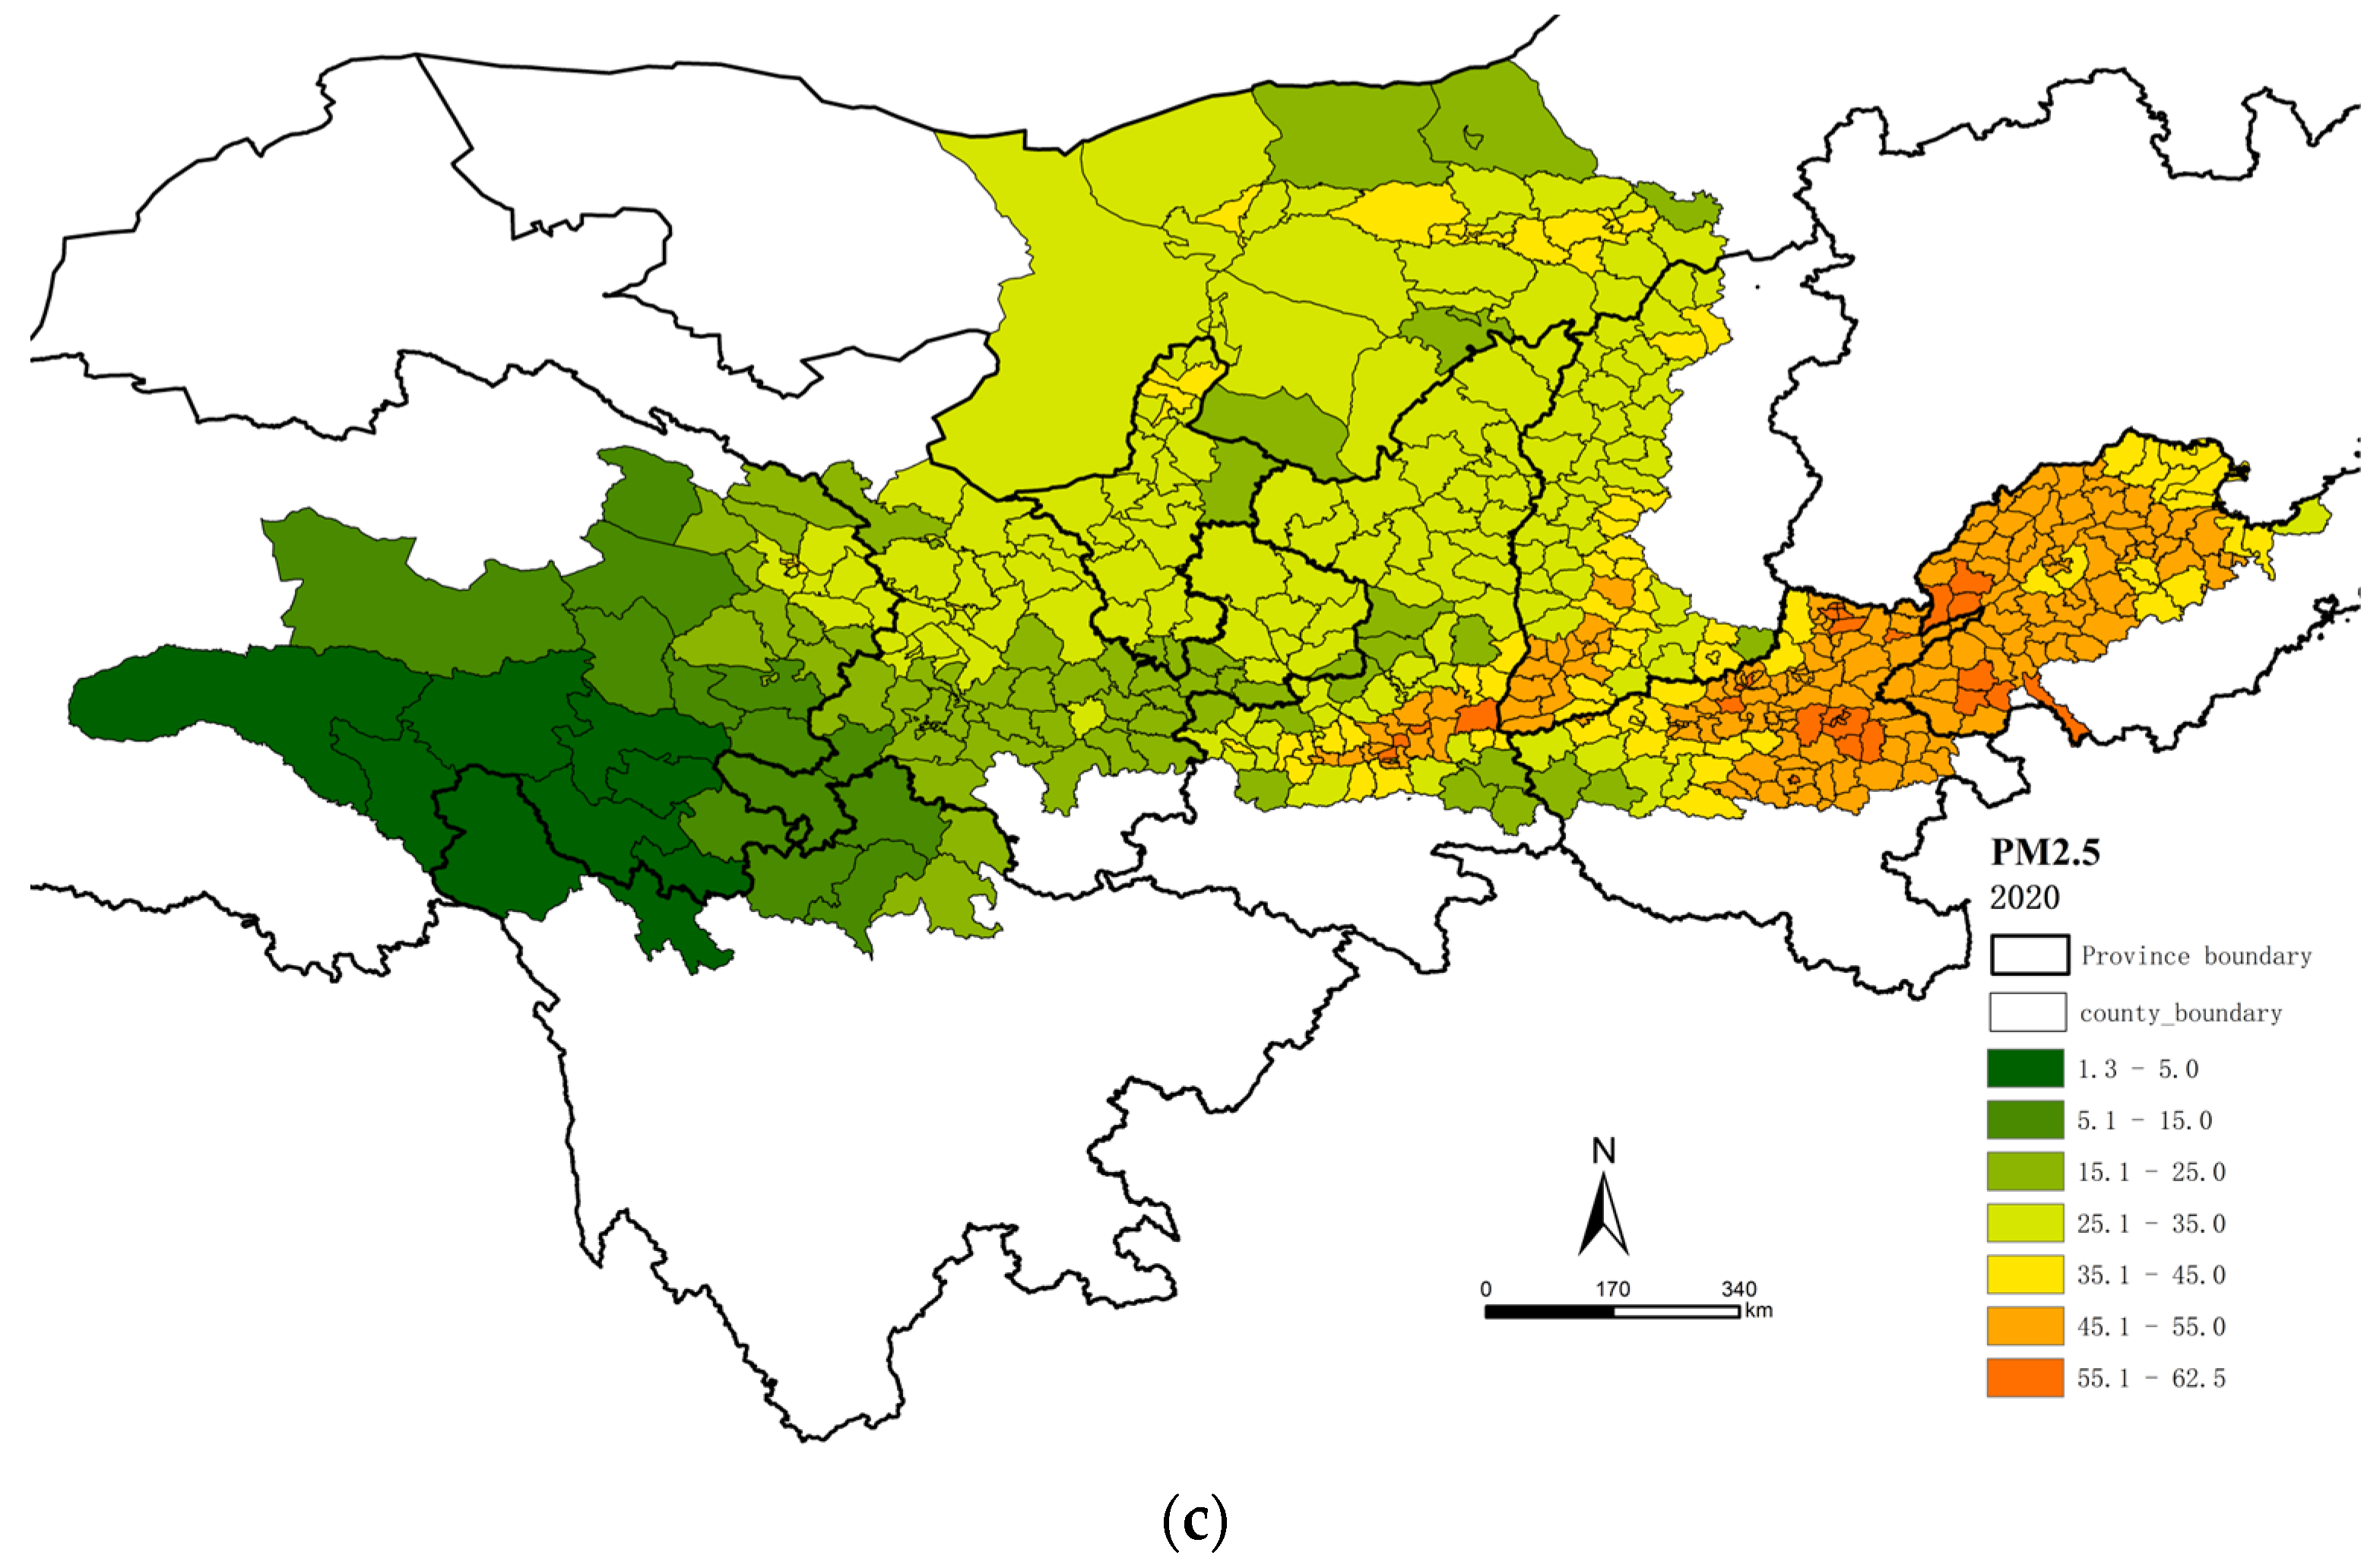
To further analyze the spatial differences of PM2.5, the PM2.5 values of 498 counties in the Yellow River Basin in 2000, 2010, and 2020 were visualized (Figure 5). Generally, it showed a spatial distribution pattern of high in the east and low in the west. PM2.5 is generally high in Shandong and Henan provinces, with some counties in Shaanxi, Shanxi, Inner Mongolia, Ningxia, and Gansu provinces having relatively high PM2.5, while they are relatively low in the northern regions of the Qinghai and Sichuan provinces. Specifically, 29.52% of the districts and counties reached the second level of air quality standards in 2000 and were mainly distributed in the western part of the region. The areas with higher PM2.5 are mostly located in Shandong, Henan, Shanxi, and Shaanxi provinces and are distributed around various urban centers. In 2010, pollution intensified compared to 2000, with 10.84% of districts and counties meeting the second level of air quality standards. Shandong, Henan, Shaanxi, and Shanxi provinces further increased air pollution and became a “heavy disaster area” for haze. The flat terrain in these areas provides ideal conditions for the diffusion of pollutants, and, coupled with the abundance of resource-dependent cities in these regions; their economic development generally faces difficulties such as a lack of economic diversity and underdeveloped energy-saving and emissions-reducing technologies, which exacerbate industrial pollution. In 2020, the number of areas with high PM2.5 significantly decreased, and their spatial distribution contracted. Among all districts and counties, the lowest annual PM2.5 concentration is 1.27 μg/m3; the highest is 62.44 μg/m3. The number of districts and counties that have reached the second level of air quality standards increased to 233, accounting for 46.79% of the sample. However, according to WHO standards, the average annual concentration of PM2.5 should be less than 5 μg/m3 to be sufficient to prevent harm to human health, but only nine districts and counties meet that standard.

4.2.3. PM2.5 Spatial Correlations

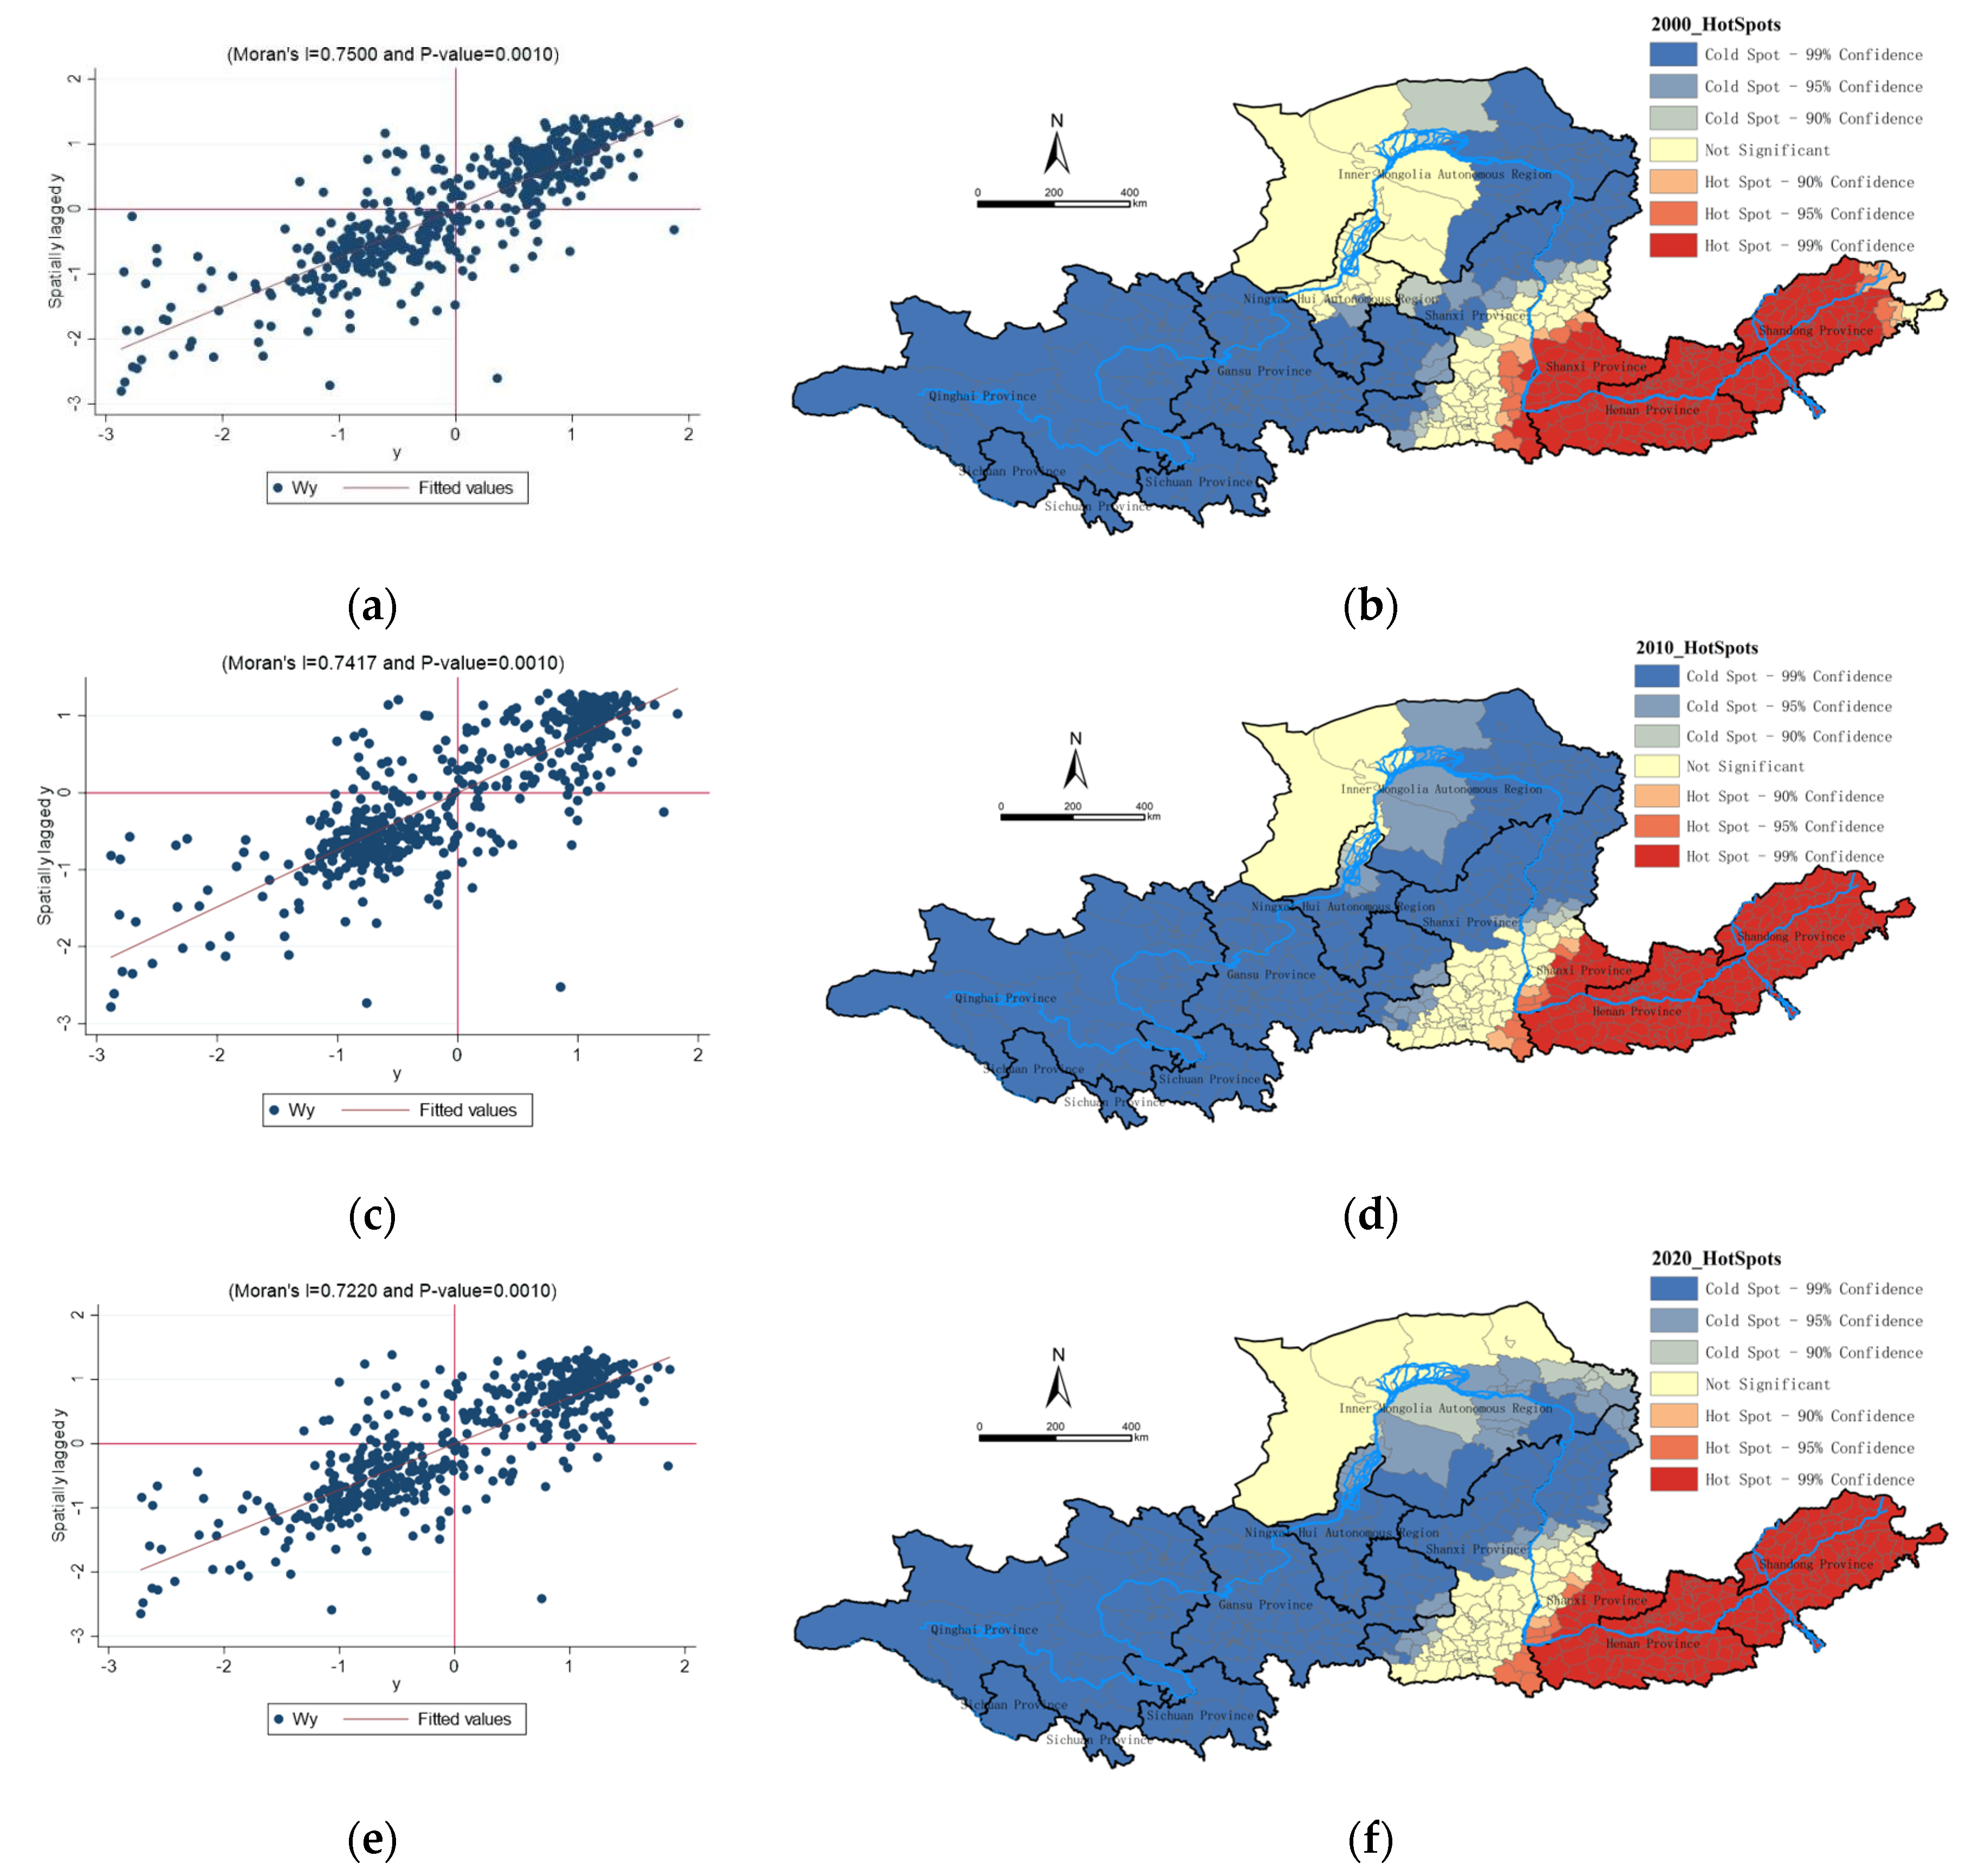
We used Stata16 and ArcGIS10.4 software to analyze the correlation of PM2.5, and Moran’s I was 0.75***, 0.742***, and 0.722***, thus indicating a significant positive spatial correlation (Figure 6a, 6c and 6e). Local Moran’s I is used to further detect the local clustering of PM2.5. The cold-hot spot analysis (Figure 6b, 6d and 6f) shows that the “high–high” clustering is mainly concentrated in the eastern part of the region. From 2000 to 2010, the “high–high” agglomeration area moved eastward, and air pollution in Shaanxi and Shanxi improved, while that in Shandong further intensified. From 2010 to 2020, there was no significant change in the “high–high” agglomeration area, while Henan and Shandong provinces have always been areas of high PM2.5. The “low–low” clustering is mainly concentrated in the western part of the region, and the clustering points in Qinghai Province gradually connect with those in the eastern region of Inner Mongolia, with obvious spatial effects.

4.3. The Processes by which PM2.5 is Affected by the Urban-Rural Transition

4.3.1. Applicability Test of Model

When examining the spatial impact of air pollution, it is seen that PM2.5, as the variable being studied, has notable spatial autocorrelation. This work utilizes the spatial econometric model to address the issue of spatial dependence, which the standard least squares regression model cannot handle. First, an LM test was conducted to determine the most appropriate method among SLM, SEM, and SDM. The test compared LM (lag), LM (error), RobustLM (lag), and RobustLM (error), and all four parameters were shown to be statistically significant at the 1% level. This suggests that both SLM and SEM are good options. Thus, in this investigation, the choice was made to use SDM, a more comprehensive version of SLM and SEM that includes both endogenous and exogenous interaction effects. Second, the Hausman and impact tests were conducted, revealing that the time effect of SDM is superior. Subsequently, the WALD and LR tests were employed to assess the appropriateness of the model and ascertain if SDM would deteriorate into SLM or SEM. The results all rejected the original hypothesis. Therefore, it was reasonable to choose SDM (Table 3).
The estimation results of SDM (Table 4) are further analyzed. W_lnPM2.5 is significant at the 0.1% level, and the estimated values of individual, time, and time-fixed effects reach 0.870, 0.396, and 0.546, respectively, thus indicating that the explanatory variable PM2.5 has a significant endogenous interaction effect in space. Under the condition that all other explanatory variables are controlled, each 1% increase in PM2.5 in a neighboring area will increase about 0.5% in local PM2.5. Hence, the diffusion and propagation of atmospheric contamination over different areas will substantially impact the concentration of local PM2.5. In the time effect of SDM, the R2 value of 0.723 is greater than the individual and the individual and time fixed effects, thus indicating that the degree to which the model can explain the dependent variable PM2.5 is 72.3%. Furthermore, the quadratic terms of PT, IT, and LT are all significant at less than the 5% level; that is, the reliability of the results is greater than 95%. This indicates a nonlinear relationship between the urban-rural transition and PM2.5. We further analyze this relationship in Figure 6, and the U-test is conducted to measure the “U-shaped” relationship that exists in LT. In addition, the estimation of the coefficient representing the exogenous interaction effect under time effects is given in Table 3. It can be seen that EL and POP have significant significance. The direct and indirect effects of SDM are given in Table 5 to analyze this phenomenon further.

4.3.2. Model Results and Influencing Mechanisms

To achieve sustainable and high-quality development in the Yellow River Basin, examining urban and rural areas as an organic system and analyzing how subsystems like population, land, and industry affect PM2.5 is beneficial. This approach is based on the idea of urban-rural integration.
  • Impact of PT on PM2.5.
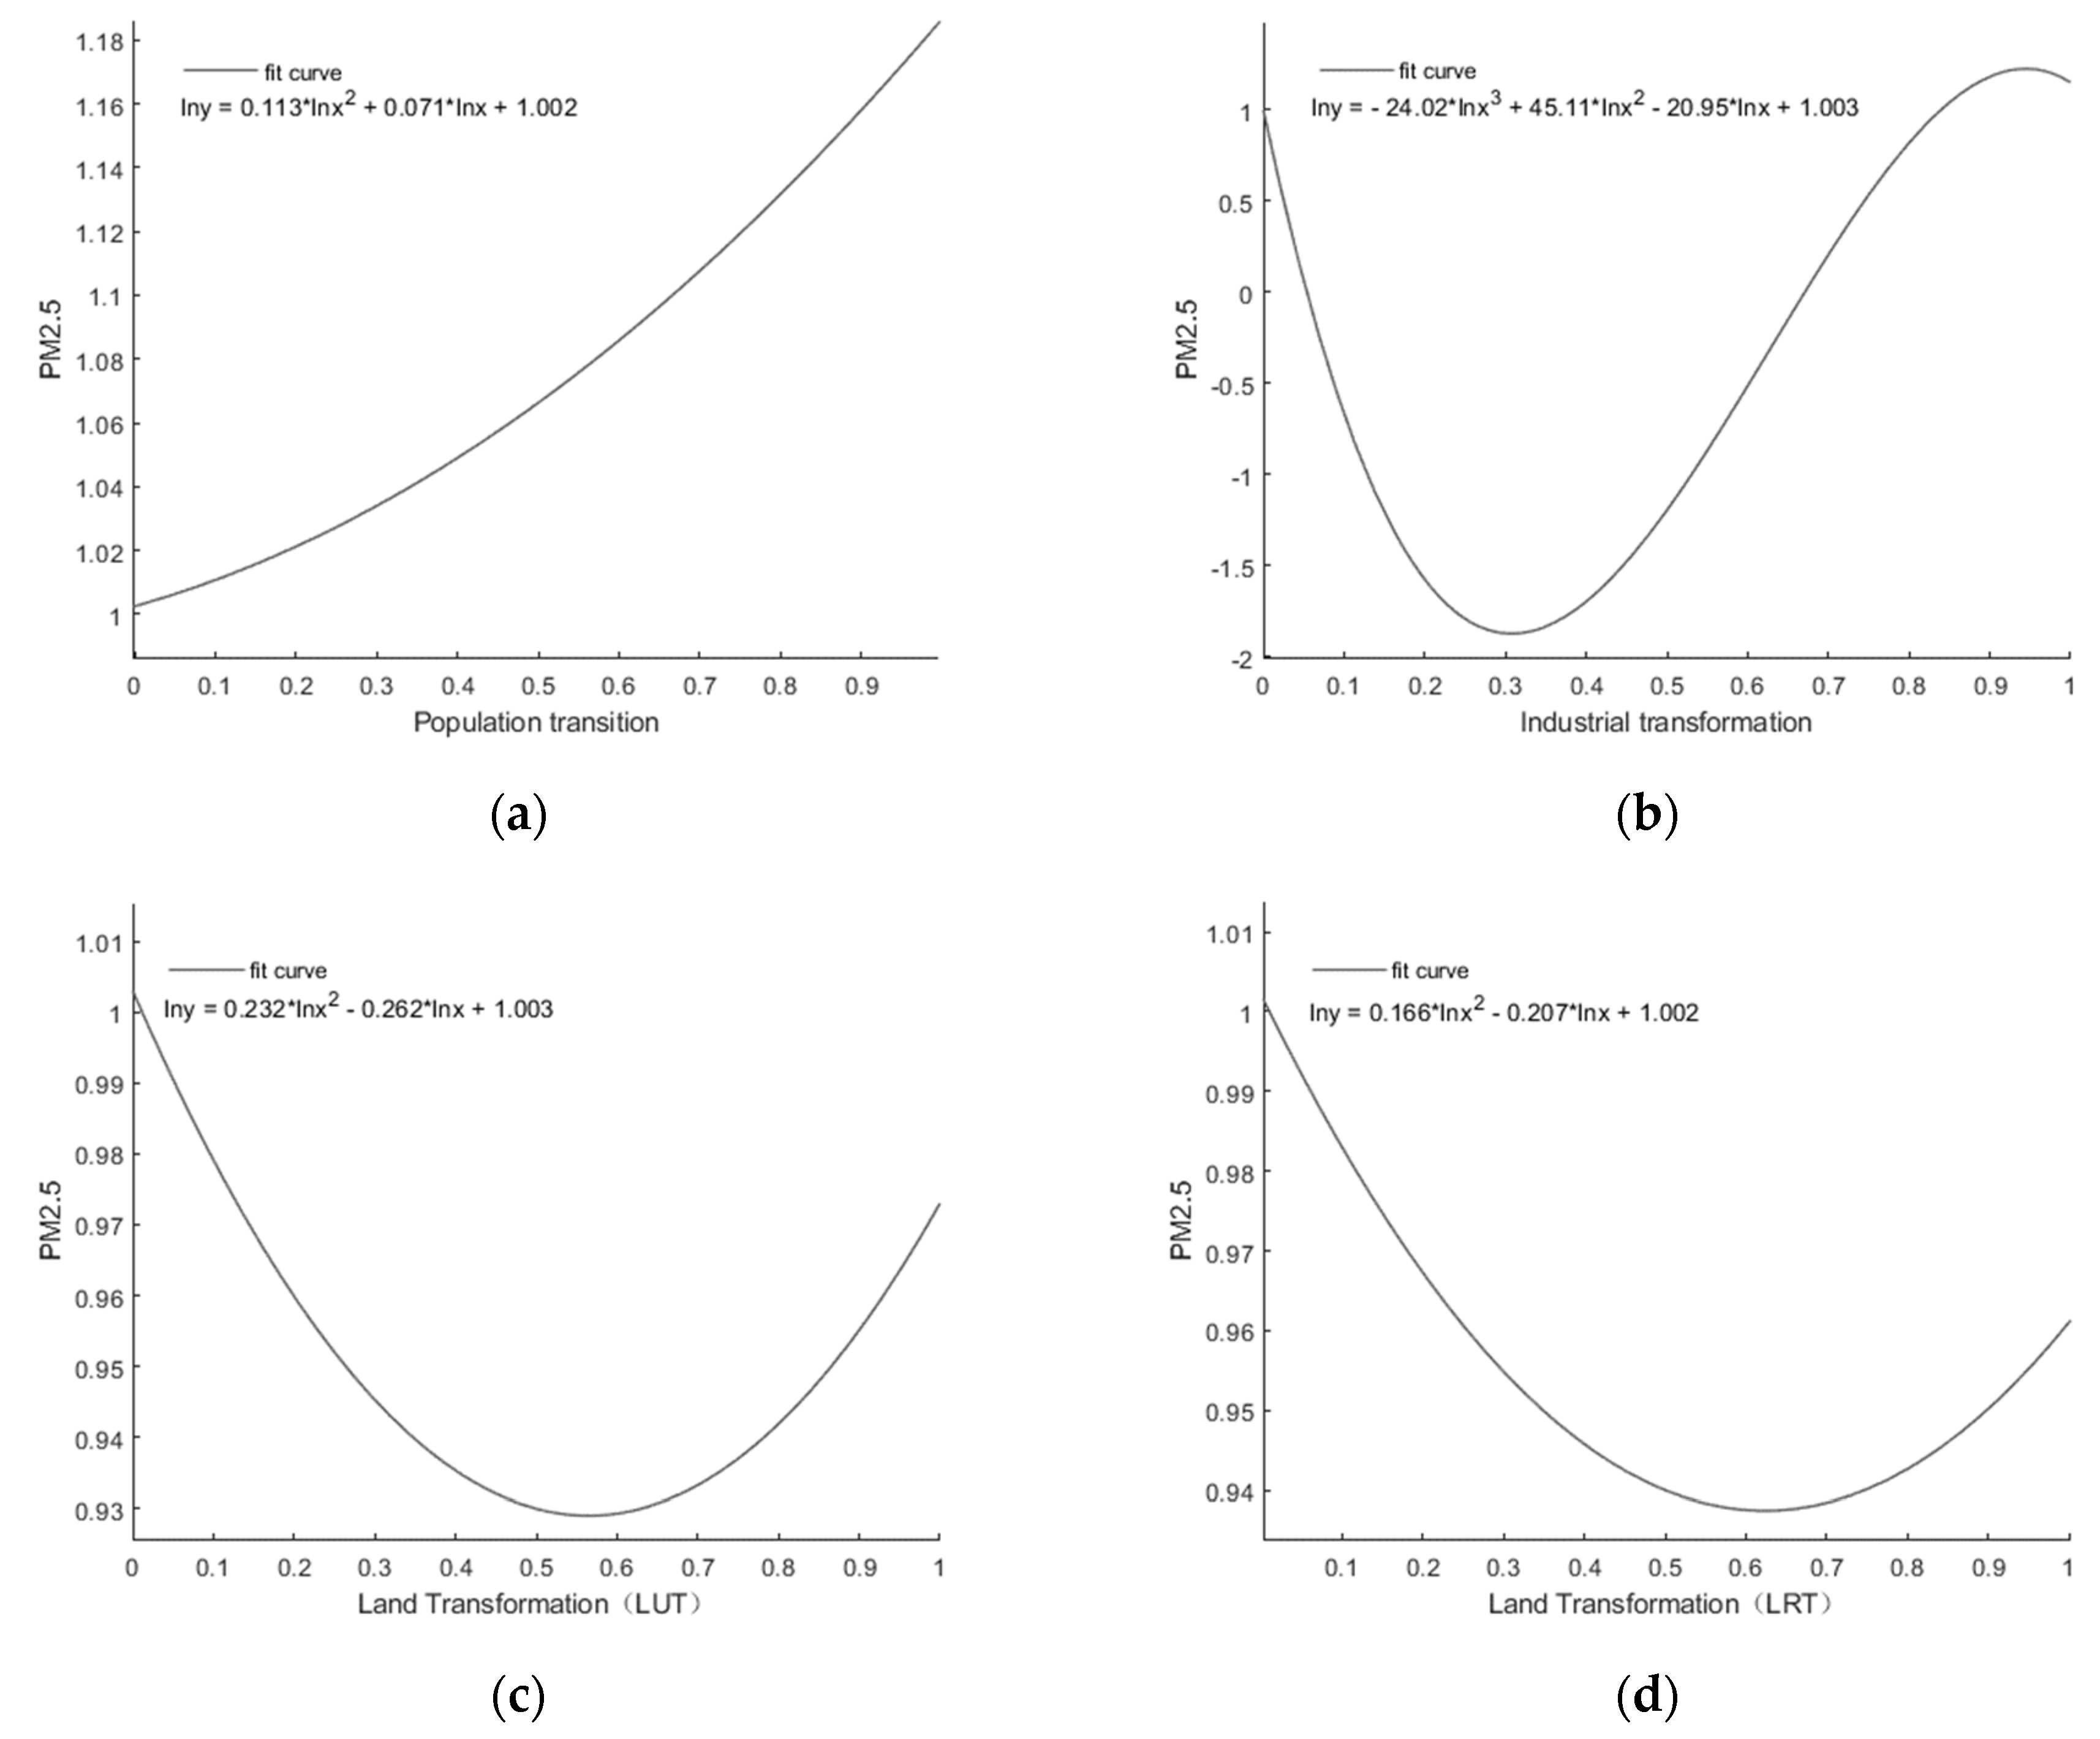
According to the results of SDM analysis with the population urbanization rate as the core explanatory variable (Table 5), as the PT deepens, the elastic coefficient on its influence on PM2.5 changes from 0.071 to 0.113. That is, the rural-to-urban agglomeration will increase the pollution. Increased consumption of resources, such as private car exhaust and coal, has exacerbated PM2.5 emissions [50]. Based on the census statistics, the percentage of the urban population in the Yellow River Basin has risen from 32.63% in 2000 to 56.55% in 2020. In the densely populated areas in the middle and lower reaches of the Yellow River Basin, the increase in the number of private motor vehicles per capita has aggravated road congestion, thereby resulting in carbon dioxide and PM2.5 emissions soaring, which has led to an increase in the occurrence of PM2.5 (Figure 7a).
2.
Impact of IT on PM2.5.
A negative-positive-negative relationship between IT and PM2.5 is indicated by an inverted "N-shaped" curve between the two variables, as shown in Table 5, which is the outcome of SDM analysis using the proportion of non-agricultural industry as the primary explanatory variable. When the proportion of non-agricultural industries is lower than 30.8%, the elasticity coefficient of industrial transformation on PM2.5 is -20.948 and is significant at less than the 1% level. The increase in the proportion of secondary and tertiary industries is conducive to reducing PM2.5 emissions. When the proportion of non-agricultural industries is relatively low, the levels of economic development and industrialization are low, the economy is simple, and the impact on the environment is within the range of its carrying capacity. When the proportion of non-agricultural industries is between 30.8% and 94.4%, the elasticity coefficient is 45.114 and is significant at less than the 1% level. The increase in the proportion of secondary and tertiary industries will significantly increase PM2.5. Against the backdrop of low barriers to global trade and low awareness of local environmental protection, some pollution-intensive enterprises, such as chemical and energy with high pollution and high emissions, were consolidated, and the economic model based on industrial production led to the aggravation of PM2.5 pollution. As industrialization and urbanization progress, there is a significant rise in the demand for energy and fuel consumption. Such development comes at a certain environmental cost in countries with the dominant secondary industry. Simultaneously, the energy-saving and emissions-reducing technology is relatively underdeveloped, and the emissions of industrial dust, smoke, and other pollutants greatly aggravate PM2.5. An elasticity coefficient of -24.017 is observed when the proportion of non-agricultural industries surpasses 94.4%, and a decrease in PM2.5 is observed as the proportion of secondary and tertiary industries increases. With the proposal of the concept of industrial ecology, green industries are gaining prominence, the improvement of clean energy utilization technologies forces the industrial structure to transform, and the establishment of industrial parks in the county has saved the cost of pollution prevention and control, which greatly curb PM2.5 emissions (Figure 7b).
3.
Impact of LT on PM2.5.
According to the results of the SDM analysis with construction land proportion and cultivated land proportion as the core explanatory variables (Table 5), both exhibit a “U-shaped” relationship. With the increase in LUT and LRT, their impact on PM2.5 is inhibited and then enhanced. This may be because urban construction, industrial and mining, residential construction, and cultivated lands are developed from wastelands. Thus, the environmental impact is within the range of its carrying capacity. In the later stage, the expansion of construction land will increase PM2.5. More urban space will be created as a result of land use expansion, which in turn will increase energy consumption and the distances people have to commute. Therefore, the low-density distribution of the population and the dispersed layout of urban space will lead to the increase of PM2.5. Moreover, the increase in the proportion of construction land implies that the proportion of forest land, wetland, and other ecological green areas is reduced, which reduces the environmental carrying capacity, making it difficult to restore and purify the environment [37]. It is worth mentioning that the increase in the proportion of cultivated land will also aggravate PM2.5. This is mainly because the increase in the proportion of cultivated land will expand the crop planting area, which may increase straw burning and fuel use. However, agricultural soils contribute significantly to emissions of polluting gases through the use of chemical fertilizers. Furthermore, the importance of such factors will continue to increase in response to implementing policies designed to control fossil fuel use and increase fertilizer inputs due to the growing demand for food[51] (Figure 7c and 7d).
4.
Direct and indirect effects.
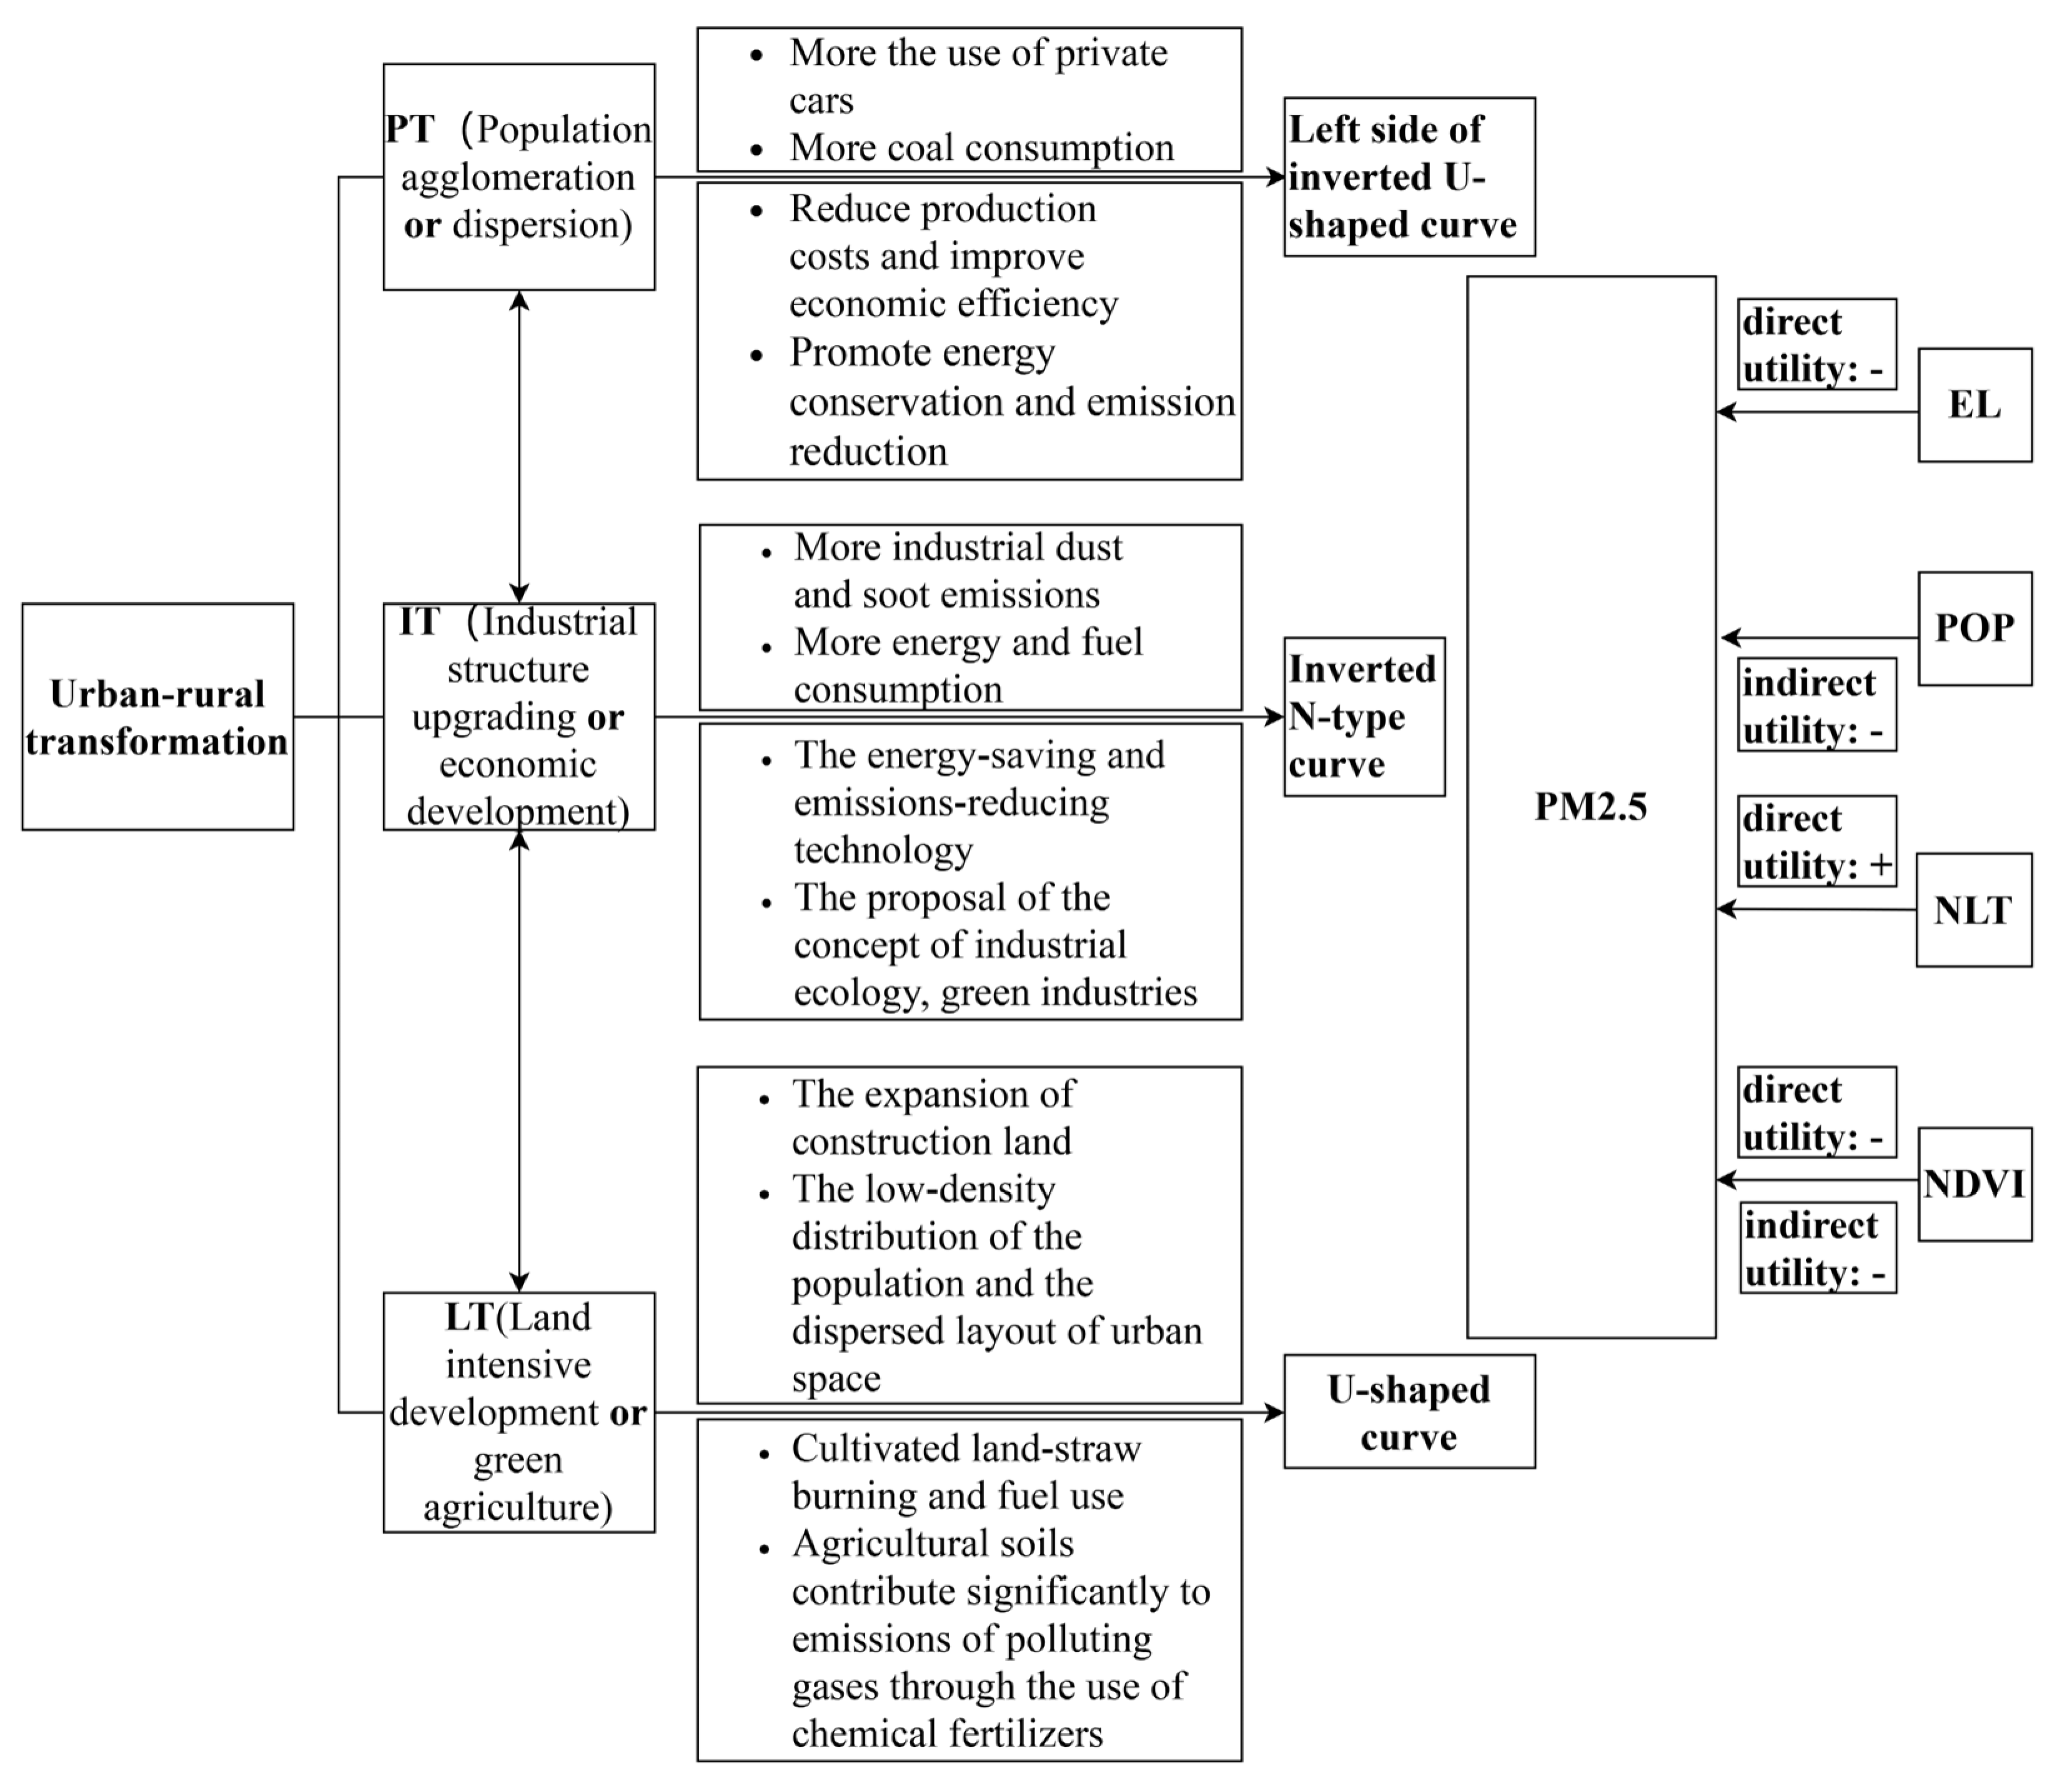
The contribution of different explanatory variables can be compared by analyzing the significance of the explanatory variables and the absolute values of the standardized coefficients given in Table 6. Regarding direct effects, IT, LRT, and NLT positively affect PM2.5, while EL and NDVI have an inhibitory effect. The direct effects on local air pollution are ranked as follows: LRT > NLT > IT > EL > NDVI. An increase in the proportion of cultivated land, social activity, and non-agricultural industry will directly exacerbate local air pollution, and the vegetation index will reduce it. In this model, EL has an inhibitory impact on PM2.5, which may indicate a decrease in the use of non-clean energy sources such as coal and firewood in the county and rural. Regarding indirect effects, the spillover effects are ranked as follows: LRT > LUT > POP > NDVI > PT. Among them, LT positively affects PM2.5 in adjacent areas, while NDVI has an inhibitory effect. Expanding land in neighboring counties will also exacerbate local PM2.5, and NDVI in neighboring counties will also reduce local pollution. In this model, POP and PT have an inhibitory effect on PM2.5 in neighboring areas. This indicates that the increase in population in neighboring counties, as well as the increase in the local population, will reduce local PM2.5. This may be due to urbanization, which leads to large-scale migration to the county and reduces the carrying pressure on the surrounding environment (Figure 8).

5. Discussion

Air pollution is a cross-regional problem with complex formation mechanisms. The key to promoting urban-rural integration and economic development while protecting the environment is quantitatively assessing the level of urban-rural transformation and the temporal and spatial variations of PM2.5. Furthermore, it is crucial to evaluate the driving mechanism behind urban-rural transformation and its impact on changes in PM2.5 concentration. The empirical findings will be discussed in the following parts:
  • The driving force in large cities;
The urban-rural transformation measured in this article emphasized the coordination of urbanization and ruralization. To a certain extent, it embodies the overall process of agricultural and rural modernization [52]. The urban-rural change in the Yellow River Basin has a spatial pattern characterized by high levels in the northern and eastern regions and low levels in the southern and western regions. The counties with High or Higher index values are mainly distributed in Inner Mongolia and near the capital city of each province. This could be attributed to the proximity of the counties around the provincial capital to the economic hub of the province. As urban-rural integration progresses, the connection between urban and rural areas is growing stronger, and rural areas are greatly influenced by the influences originating from metropolitan centers. The counties with Low or Lower index values are mainly distributed in the western part and the border areas of each province. This may be because counties in the provincial border regions are affected by their spatial location as well as administrative barriers and policies. Most of the border regions are at the “end” of each province’s economic system regarding geography and their integration into high-level regional development strategies, resulting in inefficient and slow development. This indicates that large cities can promote urban-rural transformation, but their range is limited. In the future, attention should be paid to these edge areas at the “end” of each province’s economic system. It is therefore recommended to break down administrative barriers, form a joint force, and promote cooperative development by leveraging each region’s advantages.
2.
Take integrated and localized measures to control air pollution.
PM2.5 in the Yellow River Basin shows a clear spatial correlation, thus indicating the need for regional collaboration to control air pollution. To enhance the collective efforts in preventing and controlling regional air pollution, it is imperative to promote awareness of urban-rural integration in the future. “High–high” aggregation areas are mainly concentrated in the eastern part of the region, with the Henan and Shandong provinces being the most heavily affected regions. This suggests that air pollution in these areas is particularly severe, and localized ecological restoration policies should be established accordingly.
3.
The influencing mechanisms of PM2.5 by different subsystems of the urban-rural transformation vary.
According to the research results, the impact of IT on PM2.5 has the highest elastic coefficient, thus indicating that the industrial structure plays a dominant role in the spatiotemporal evolution of PM2.5. Specifically, the impact of IT on PM2.5 shows an inverted “N-shaped” curve. This indicates that different stages of industrial transformation have different effects on air pollution, and the relationship between IT and PM2.5 is shifting from positive to negative. This could be attributed to the transformation of the Yellow River Basin industry from a factor-driven model to a green technology-driven model. In the future, it may be necessary to abandon economic models that do not consider the environment and continue accelerating industrial restructuring and transformation through innovative green technologies in counties to create a sustainable industrial system in the Yellow River Basin.
Regarding the impact of PT on PM2.5, excessive rural-urban population aggregation leads to insufficient public resources, traffic congestion, and high energy intensity, resulting in a continued rise in PM2.5. It should be noted that some studies have pointed out that the spatial aggregation of the population can reduce production costs and improve economic efficiency, promote energy conservation and emissions reduction, and improve the overall air pollution situation, thereby reducing the pollution caused by PM2.5 emissions [43]. According to the principles of urban economics, moderate population aggregations can reduce atmospheric pollution. The impact of PT on PM2.5 will appear as a downward sloping trend (i.e., the left-hand side of the “U-shaped” curve). In the future, the spatial layout of the population and the carrying capacity of resources and environment should be considered overall, and the spatial planning of the land should be scientifically formulated.
Regarding the influence of LT on PM2.5, the relationship between LUT, LRT, and PM2.5 exhibits a “U-shaped” curve. The uncontrolled expansion of construction land results in a scattered layout and low land use efficiency, resulting in pollution problems in many counties. The increase in the proportion of cultivated land will also aggravate atmospheric pollution, which indicates that soil and air pollution influence each other, creating a pollution cycle [17]. In the future, it is urgent to ensure purposeful development, redefine Urban built-up area boundaries according to scientific findings, and rationally expand cities while preventing their uncontrolled expansion. Decision-makers should firmly grasp the concept of safe, efficient, ecological, and high-quality urban land space planning, strengthen land use controls and ecological red lines, and include urban construction land and ecological preservation land in national spatial planning [44]. Furthermore, it is imperative to consider the three-dimensional effect of soil pollution, restrict the emissions of harmful gases from agricultural land through active land management, and vigorously develop green agriculture, which will benefit the economy, ecosystems, and human health in urban-rural areas of the region.

6. Conclusions

This study utilized remote sensing imagery and panel data collected from counties in the Yellow River Basin between 2000 and 2020 to create an index measuring urban-rural change. The spatiotemporal pattern was revealed using the entropy approach and AHP hierarchical analysis. In addition, spatial autocorrelation was employed to examine the spatiotemporal properties of PM2.5, while spatial econometric models were utilized to study the non-linear correlation and influencing processes between the urban-rural transformation and PM2.5. The main conclusions are as follows.
From 2000 to 2020, the urban-rural transformation in the Yellow River basin has shown a clear upward trend. From a spatial distribution perspective, it has evolved from high in the north and the east and low in the south and the west to high in the north and balanced in the east, middle, and west, and the interregional differences are gradually narrowing. Counties with High or Higher indexes are mainly distributed in Inner Mongolia and the counties around cities in various provinces, while counties with Low or Lower index values are mainly distributed in the western and peripheral areas of various provinces.
PM2.5 showed inflection points in 2006 and 2015, with a trend of first rising, then fluctuating around a high baseline, then gradually decreasing. PM2.5 in the Yellow River basin generally exhibits a spatial pattern that is high in the east and low in the west, and “high–high” clusters are mainly concentrated in the eastern regions, thus indicating that Henan and Shandong provinces have high concentrations of haze, while “low–low” clusters are mainly concentrated in the western part of the region.
Different stages in the development of various subsystems of the urban-rural transformation have different impacts on PM2.5. The impact of IT on PM2.5 exhibits an inverted “N-shaped” curve of negative-positive-negative changes, and the industrial structure plays a controlling role in the spatiotemporal evolution of PM2.5. Presently, the influence of the PT on PM2.5 has taken the form of the left extremity of an inverted "U-shaped" curve. A "U-shaped" relationship illustrates the effect of LT on PM2.5.
Regarding direct effects, IT, LRT, and NLT all have a positive impact on PM2.5, while EL and NDVI have a negative effect on it. Regarding indirect effects, LT (LUT, LRT) has a positive impact on the PM2.5 of adjacent areas, while NDVI and POP have a negative effect on it.
This research offers a novel approach to examining the correlation between urban-rural change and PM2.5 within urban-rural integration. Implementing PM2.5 emission reduction measures in the Yellow River Basin promotes sustainable and high-quality development. Furthermore, it can serve as a valuable resource for policymakers in densely populated regions that experience significant air pollution, particularly in developing nations.
Author Contributions

Conceptualization, M.C. and C.X.; methodology, C.X.; software, Z.Y.; validation, W.S., Z.C. and C.X.; formal analysis, C.X.; resources, M.C.; data curation, Z.Y.; writing—original draft preparation, Z.Y.; writing—review and editing, Z.Y.; visualization, Z.Y.; supervision, C.X.; project administration, M.C.; funding acquisition, M.C. All authors have read and agreed to the published version of the manuscript.

Funding

This research was funded by Key Science and Technology Program of Henan Province, grant number 242102320240.

Data Availability Statement

The data presented in this study are available on request from the corresponding author.

Conflicts of Interest

The authors declare no conflicts of interest.

Appendix A

Table A1. Descriptive statistics.
Variable name Mark Mean value Standard error Minimum Maximum
PM2.5 concentrations PM2.5 45. 15813 16. 9881 1. 265238 88. 11379
Population transformation PT 44. 44847 27. 03547 0 100
Industrial transformation IT 79. 68927 15. 54944 19. 97809 100
Land transformation Construction land LUT 10. 9204 13. 29152 0. 0052168 99. 42327
Cultivated land LRT 45. 9908 24. 79752 0. 0047788 87. 46495
Electricity consumption EL 4754. 903 9823. 977 202. 3436 159999. 2
Population size POP 842. 4223 2214. 075 1500 2146000
Normalized vegetation index NDVI 0.8199384 0.0996595 0.3 0.92
Nighttime light brightness NLT 9. 045765 12. 40715 0 63

References

  1. Li, Y.; Liu, Y., Investigation of the Resource and Environment Issues in the Urban-rural Transition in China. Economic Geography 2013, 33, 61-65.
  2. Yang, Y.; Liu, Y.; Li, Y.; Li, J., Measure of urban-rural transformation in Beijing-Tianjin-Hebei region in the new millennium: Population-land-industry perspective. Land Use Policy 2018, 79, 595-608.
  3. Cheng, Z.; Luo, L.; Wang, S.; Wang, Y.; Sharma, S.; Shimadera, H.; Wang, X.; Bressi, M.; Miranda, R. M. D.; Jiang, J.; Wei, Z.; Fajardo, O.; Yan, N.; Hao, J., Status and characteristics of ambient PM2.5 pollution in global megacities. Environment International 2016, 89-90, 212-221.
  4. Zhao, H.; Cheng, Y.; Zheng, R., Impact of the Digital Economy on PM2.5: Experience from the Middle and Lower Reaches of the Yellow River Basin. International Journal of Environmental Research and Public Health 2022, 19.
  5. Wu, D., Hazy weather research in China in the last decade: A review. Acta Scientiae Circumstantiae 2012, 32, 257-269.
  6. Liu, Y.; Xia, J.; Wang, Y.; Song, J.; Zhao, X.; Liu, X., Coordinated human-earth system and high-quality development in Yellow River Basin. Journal of Northwest University (Natural Science Edition) 2022, 52, 357-370.
  7. Liu, Y. S.; Yan, B.; Wang, Y. F., Urban-Rural Development Problems and Transformation Countermeasures in the New Period in China. Economic Geography 2016, 36, 1-8.
  8. Liu, Y., Research on the Urban-rural integration and rural revitalization in the new era in China. Acta Geographica Sinica 2018, 73, 637-650.
  9. Long, H., Land Use Transition and Rural Transformation Development. Progress in Geography 2012, 31, 131-138.
  10. Liu, Y., Rural Transformation Development and New Countryside Construction in Eastern Coastal Areas of China. Acta Geographica Sinica 2007, 62, 563-570.
  11. Yang, R.; Liu, Y.; Long, H.; Zhang, Y., Research progress and prospect of rural transformation and reconstruction in China: paradigms and main content. Progress in Geography 2015, 34, 1019-1030.
  12. Ma, X.; Sun, X., Space-Time Evolvement and Problem Area Diagnosis of Agriculture Transformation Development in Jiangsu Province since 2000——Based on a Total Factor Productivity Perspective. Economic Geography 2016, 36, 132-138.
  13. Tong, W.; Guo, J.; Su, F.; Xu, W., Progress and prospect of the impact of population migration on rural transformation development under the background of rural revitalization. Scientia Geographica Sinica 2022, 42, 662-669.
  14. Li, T.; Long, H. L., Analysis of rural transformation development from the viewpoint of"population-land-industry": the case of Shandong Province. Economic Geography 2015, 35, 149-155.
  15. Li, J.; Jia, L.; Liu, Y.; Yang, Y.; Jiang, N., Measuring model of rural transformation development path in Fuping County of Beijing-Tianjin-Hebei region. Habitat International 2018, 74, 48-56.
  16. Wang, Z.; Fang, C., Spatial-temporal characteristics and determinants of PM 2.5 in the Bohai Rim Urban Agglomeration. Chemosphere 2016, 148, 148-162.
  17. Wang, Y.; Shi, L.; Liu, Y., Evolution process of environmental pollution and its driving mechanisms in rural areal systems. Journal of Agro-Environment Science 2020, 39, 2495-2503.
  18. Lan, R.; Eastham, S. D.; Liu, T.; Norford, L. K.; Barrett, S. R., Air quality impacts of crop residue burning in India and mitigation alternatives. Nature Communications 2022, 13, 6537.
  19. Fang, C., On integrated urban and rural development. J. Geogr. Sci 2022, 32, 1411-1426.
  20. Liu, Y.; Li, Y., Revitalize the world's countryside. Nature 2018, 548, 275-277.
  21. Lelieveld, J.; Evans, J. S.; Fnais, M.; Giannadaki, D.; Pozzer, A., The contribution of outdoor air pollution sources to premature mortality on a global scale. Nature 2015, 525, 367-374.
  22. Sun, Y. L.; Zhuang, G. S.; Tang, A. H.; Wang, Y.; An, Z. S., Chemical characteristics of PM2.5 and PM10 in haze-fog episodes in Beijing. Environmental Science and Technology 2006, 40, 3148-3155.
  23. Miao, Q.; Jiang, N.; Zhang, R.; Zhao, X.; Qi, J., Characteristics and sources of PM2.5 pollution in typical cities of the Central Plains urban agglomeration in autumn and winter. Environmental science 2021, 42, 19-29.
  24. Wang, Z.; Liang, L.; Wang, X., Spatiotemporal evolution of PM2.5 concentrations in urban agglomerations of China. Journal of Geographical Sciences 2021, 31, 878-898.
  25. Mi, Y.; Sun, K.; Li, L.; Lei, Y.; Yang, J., Spatiotemporal pattern analysis of PM2.5 and the driving factors in the Middle Yellow River Urban Agglomerations. Journal of Cleaner Production 2021, 299, 126904.
  26. Yang, M.; Wang, Y., Spatial-temporal characteristics of PM2.5 and its influencing factors in the Yangtze River Economic Belt. China population,resources and environment 2017, 27, 91-100.
  27. Guo, X.; Mu, X.; Ding, Z.; Qin, D., Nonlinear effects and driving mechanism of multidimensional urbanization on PM2.5 concentrations in the Yangtze River Delta. Acta Geographica Sinica 2021, 76, 1274-1293.
  28. Li, H.; Tong, H.; Wu, X.; Lu, X.; Meng, S., Spatial and Temporal Evolution Characteristics of PM_(2.5) in China from 1998 to 2016. Chinese Geographical Science 2020, 30, 947-958.
  29. Liu, H.; Fang, C.; Huang, J.; Zhu, X.; Zhou, Y.; Wang, Z.; Zhang, Q., The spatial-temporal characteristics and influencing factors of air pollution in Beijing-Tianjin-Hebei urban agglomeration. Acta Geographica Sinica 2018, 73, 177-191.
  30. Tang, D.; Li, L.; Yang, Y., Spatial Econometric Model Analysis of Foreign Direct Investment and Haze Pollution in China. Polish Journal of Environmental Studies 2016, 25, 317-324.
  31. Wang, J.; Wang, S.; Li, S., Examining the spatially varying effects of factors on PM2.5 concentrations in Chinese cities using geographically weighted regression modeling. Environmental Pollution 2019, 248, 792-803.
  32. Zhao, Y.; Zhang, X.; Chen, M.; Gao, S.; Li, R., Regional variation of urban air quality in China and its dominant factors. Acta Geographica Sinica 2021, 76, 2814-2829.
  33. Zhou, L.; Zhou, C.; Yang, F.; Che, L.; Sun, D., Spatio-temporal evolution and the influencing factors of PM2.5 in China between 2000 and 2015. J. Geogr. Sci. 2019, 29, 253-270.
  34. Geng, J.; Shen, S.; Cheng, C., Spatio-temporal evolution and the multi-scale socio-economic influencing mechanism of PM2.5 in the Yellow River Basin during the China's 13th Five-Year Plan. Journal of Geo-information Science 2022, 24, 1163-1175.
  35. Fan, C.; Tian, L.; Li, J., Research progress of impact of urban form on air quality. Urban Development Studies 2017, 24, 92-100.
  36. Chen, J.; Wang, S.; Zhou, C.; Li, M., Does the path of technological progress matter in mitigating China's PM2.5 concentrations? Evidence from three urban agglomerations in China. Environmental Pollution 2019, 254, 113012.
  37. Zhu, W.; Wang, M.; Zhang, B., The effects of urbanization on PM2.5 concentrations in China's Yangtze River Economic Belt: New evidence from spatial econometric analysis. Journal of Cleaner Production 2019, 239, 118065.
  38. Han, L., Relationship between urbanization and urban air quality: An insight on fine particulate dynamics in China. Progress in Geography 2018, 37, 1011-1021.
  39. Chen, Y.; Chen, Y., Analysis of China's industrial layout adjustment and industrial transfer. Contemporary economy & management 2011, 33, 38-47.
  40. Lee, S.; Serre, M. L.; van Donkelaar, A.; Martin, R. V.; Burnett, R. T.; Jerrett, M., Comparison of Geostatistical Interpolation and Remote Sensing Techniques for Estimating Long-Term Exposure to Ambient PM2.5 Concentrations across the Continental United States. Environmental Health Perspectives 2012, 120, 1727-1732.
  41. Long, H.; Zou, J.; Li, T.; Liu, Y., Study on the characteristic and territorial types of rural transformation development: The Case of the "Southern Jiangsu-Northern Shaanxi" transect. Geographical research 2012, 31, 495-506.
  42. Li, T.; Long, H., Rural development from viewpoints of transformation and coordination: a case in Shandong Province. Progress in Geography 2014, 33, 531-541.
  43. Cheng, K.; Hong, Z., Effect of urban population aggregation index on air pollution. China population, resources and environment 2022, 32, 51-62.
  44. Yang, X.; Wang, J.; Cao, J.; Ren, S.; Ran, Q.; Wu, H., The spatial spillover effect of urban sprawl and fiscal decentralization on air pollution: evidence from 269 cities in China. Empirical Economics 2022, 63, 847-875.
  45. Xiao, H.; Ma, Z.; Mi, Z.; Kelsey, J.; Zheng, J.; Yin, W.; Yan, M., Spatio-temporal simulation of energy consumption in China's provinces based on satellite night-time light data. Applied Energy 2018, 231, 1070-1078.
  46. Wu, Y.; Shi, K.; Chen, Z.; Liu, S.; Chang, Z., Developing Improved Time-Series DMSP-OLS-Like Data (1992–2019) in China by Integrating DMSP-OLS and SNPP-VIIRS. IEEE Transactions on Geoscience and Remote Sensing 2022, 60.
  47. Zhu, X.; Wei, G., Discussion on the excellent standard of dimensionless method in entropy method. Statistics and Decision 2015,, 12-15.
  48. Guo, Q.; Zhang, Z., Spatial-temporal evolution of factors aggregating ability in urban agglomeration in the middle reaches of the Yangtze River. Acta Geographica Sinica 2017, 72, 1746-1761.
  49. Cheng, Y.; Wang, Z.; Ye, X.; Wei, Y., Spatiotemporal dynamics of carbon intensity from energy consumption in China. Journal of Geographical Sciences 2014, 24, 631-650.
  50. Xu, B.; Lin, B., Regional differences of pollution emissions in China: contributing factors and mitigation strategies. Journal of Cleaner Production 2015, 112, 1454-1463.
  51. Almaraz, M.; Bai, E.; Chao, W.; Trousdell, J.; Houlton, B. Z., Agriculture is a major source of NOx pollution in California. Science Advances 2018, 4, eaao3477.
  52. Cao, Z.; Li, Y.; Chen, Y., Approaches to rural transformation and sustainable development in the context of urban-rural integration. Acta Geographica Sinica 2019, 74, 2560-2571.
Figure 1. An analytical framework for the urban-rural transformation and its impact on air pollution.
Preprints 108426 g001
Figure 2. Study area.
Preprints 108426 g002
Figure 3. Spatiotemporal pattern of the urban-rural transformation from 2000 to 2020: (a) Urban-rural transformation index in 2000; (b) Urban-rural transformation index in 2010; (c) Urban-rural transformation index in 2020.
Preprints 108426 g003aPreprints 108426 g003b
Figure 4. Distribution situation of PM2.5 in 498 counties in the Yellow River Area.
Preprints 108426 g004
Figure 5. Spatiotemporal pattern of PM2.5 from 2000 to 2020: (a) Spatiotemporal pattern of PM2.5 in 2000; (b) Spatiotemporal pattern of PM2.5 in 2010; (c) Spatiotemporal pattern of PM2.5 in 2020.
Preprints 108426 g005aPreprints 108426 g005b
Figure 6. Global and local correlations of PM2.5: (a) Moran’s I of PM2.5 in 2000; (b) Cold-hot spot analysis of PM2.5 in 2000; (c) Moran’s I of PM2.5 in 2010; (d) Cold-hot spot analysis of PM2.5 in 2010; (e) Moran’s I of PM2.5 in 2020; (f) Cold-hot spot analysis of PM2.5 in 2020.
Preprints 108426 g006
Figure 7. Effect of the urban-rural transformation on PM2.5: (a) Effect of the PT on PM2.5; (b) Effect of the IT on PM2.5; (c) Effect of the LUT on PM2.5; (d) Effect of the LRT on PM2.5.
Preprints 108426 g007
Figure 8. Flow chart of the influencing mechanisms on PM2.5.
Preprints 108426 g008
Table 1. Variable selection and definition.
Variable type Variable selection Variable definition
Dependent variable PM2.5 concentration (PM2.5) Degree of air pollution
Explanatory variables Population transition (PT) The urbanization rate of the population
Industrial transformation (IT) Non-agricultural development of industry
Land transformation (LT) Construction land (LUT) The sprawling expansion of urban and town construction
Cultivated land (LRT) The ratio of cultivated land in the county
Control variables Electricity consumption (EL) the consumption of industrial energy and non-clean energy
Population size (POP) Number of permanent residents
Nighttime light brightness (NLT) The night light brightness value of each county and district
Normalized vegetation index (NDVI) Urban average annual normalized vegetation index
Table 2. Explanatory variables weight.
Explanatory variables Variable selection Indicator weight Estimate properties
Urban-rural transformation (URT) Population transition (PT) 0.23 +
Industrial transformation (IT) 0.22 +
Land transfor-mation (LT) Construction land (LUT) 0.37 +
Cultivated land (LRT) 0.18 -
Table 3. Model test.
Test Statistic Likelihood ratio (chi2) P-value Prob>chi2
Moran’s I 5.123 0.000
LM-Spatial error 740.439 0.000
RobustLM-Spatial error 269.159 0.000
LM-Spatial lag 584.981 0.000
RobustLM-Spatial lag 113.701 0.000
LR-Ind 279.77 0.000
LR-Time 3633.36 0.000
LR-Spatial error 21.55 0.0058
LR-Spatial lag 29.44 0.0003
WALD-Spatial error 21.41 0.0032
WALD-Spatial lag 29.62 0.0001
Hausman 244.49 0.000
Table 4. The coefficient on the exogenous interaction effect under time effects.
Variables Ind Time Both
W-lnPM2.5 0.870*** 0.396*** 0.546***
Main
lnPT 0.00714 0.0710*** 0.00498
ln2PT 0.000886 0.0375* 0.000612
lnIT -0.446 -9.864** -1.739
ln2IT 1.277 20.84** 4.101
ln3IT -0.807 -10.93** -2.352
lnLUT -0.0141 0.253*** 0.0170
ln2LUT -0.00450 -0.153*** -0.000974
lnLRT -0.0597 0.437*** -0.0382
ln2LRT 0.126*** -0.0537** 0.132***
EL -0.106*** 0.0286 -0.103***
POP 0.00918 0.0290* 0.000774
NLT 0.0810*** 0.105*** 0.0938***
NDVI 0.00885 -0.0251 0.00987
Wx
lnPT -0.0728
ln2PT -0.0346
lnIT -3.447*
ln2IT 7.768*
ln3IT -4.327*
lnLUT -0.0868*
ln2LUT 0.192***
lnLRT 0.110*
ln2LRT -0.0357
EL 0.146***
POP 0.0101*
NLT -0.0455
NDVI -0.00931
Variance
sigma2_e 0.0126*** 0.0154*** 0.0123***
R2 0.454 0.723 0.207
N 1494 1494 1494
t-statistics in parentheses* p <0.05, ** p <0.01, *** p <0.001. Note: The urban-rural transition itself failed the model due to high collinearity.
Table 5. The outcomes of the Durbin spatial regression model.
Explanatory variable Population transformation (PT) Industrial transformation (IT) Land transformation (LT)
Construction land (LUT) Cultivated land (LRT)
lnPM2.5 0.523*** 0.534*** 0.559*** 0.895***
lnURT 0.071** -20.948*** -0.262*** -0.207*
ln2URT 0.113* 45.114*** 0.232*** 0.166**
ln3URT -24.017***
lnEL -0.254*** -0.246*** -0.052*** 0.157***
lnPOP 0.138*** 0.130*** 0.037** 0.046
lnNLT 0.078*** 0.110*** 0.134*** 0.070***
lnNDVI -0.039* -0.041** -0.029* -0.028**
R2 0.469 0.536 0.618 0.266
N 1494 1494 1494 1494
*, **, and * * * indicate significance at the 10%, 5%, and 1% levels, respectively.
Table 6. Analysis of spatial spillover effect.
Explanatory variable Direct effect Indirect effect
lnPT 0.018 -0.033**
lnIT 0.044*** 0.009
lnLUT 0.032 0.211***
lnLRT 0.384*** 1.028**
lnEL -0.059*** 0.039
lnPOP -0.005 -0.122***
lnNLT 0.315*** 0.093
lnNDVI -0.015* -0.062**
*, ** and * * * indicate significance at the 10%, 5%, and 1% levels, respectively.
Disclaimer/Publisher’s Note: The statements, opinions and data contained in all publications are solely those of the individual author(s) and contributor(s) and not of MDPI and/or the editor(s). MDPI and/or the editor(s) disclaim responsibility for any injury to people or property resulting from any ideas, methods, instructions or products referred to in the content.
Copyright: This open access article is published under a Creative Commons CC BY 4.0 license, which permit the free download, distribution, and reuse, provided that the author and preprint are cited in any reuse.
Prerpints.org logo

Preprints.org is a free preprint server supported by MDPI in Basel, Switzerland.

Subscribe

© 2024 MDPI (Basel, Switzerland) unless otherwise stated