1. Introduction
Synthetic carbon allotropes, including both carbon nanotubes (CNTs) and graphene based systems, are regarded as a robust and versatile class of materials. They were brought to the attention of the scientific community by the discovery of the multi-walled and single-walled carbon nanotubes by Iijima in 1991[
1] and 1993[
2] respectively, and the first isolation and measurement of the graphene properties by Novoselov and Geim (leading to the conferring of the Novel Prize) in 2004.[
3]
Carbon nanomaterials can be prepared using a variety of synthetic techniques that include arc discharge, laser ablation, chemical vapor deposition (CVD) and exfoliation of graphite. Particularly, when CVD is employed to obtain SWCNTs, the process usually leads to the formation of impurities such as amorphous carbon and metal (catalyst residue) and graphitic nanoparticles (that can also coat the catalyst particles) or fullerenes.[
4] Since the presence of these species can interfere with the properties and quality of the tubular nanostructures, their removal using a purification step prior to their processing is usually required. When it comes to graphene, both CVD and exfoliation of graphite remain as the most commonly employed approaches. Modification of the electronic structure and intrinsic properties of graphene-based materials is usually obtained via the introduction of structural defects,[
5,
6] attaching inorganic and organic species via decoration and functionalization,[
7,
8,
9] and doping.[
10,
11,
12] Meanwhile, several strategies have been reported to potentiate, modify or take advantage of the characteristics of CNTs. They can be either endohedrally modified by introducing a variety of compounds within their hollow structure,[
13] or undergo exohedral modification, by inducing structural doping or attaching bearing functionalities onto their walls.[
14,
15] Physical and chemical modification of carbon nanomaterials thus leads to a variety of systems that find applications in fields that include catalysis,[
16] electronics[
17] or biomedicine.[
18]
One particular and relatively straightforward strategy to tune the properties of both graphene based materials and CNTs consists on the introduction of foreign atoms (chemical doping) within the honeycomb lattice that is the structural basis of both the 2D layers and the nanotubes walls, respectively.[
19] Nitrogen doping is the most commonly used approach for this purpose, with a myriad of reports describing synthetic methodologies to embed N atoms within the carbonaceous skeleton, thus modifying the properties of the materials.[
20,
21,
22] In this field, although research on doping CNTs[
23] is not scarce, most efforts have been focused on the structural modification of graphene-based materials, by tuning two key parameters ruling the properties of the N-doped systems, namely, the concentration and nature of the N-based moieties.[
24,
25] N-doping allows tuning not only the conductivity,[
26] but also other physico-chemical properties including mechanical properties,[
24,
27] and thermal stability[
28]. As a consequence, N-doped carbon materials find application in fields like catalysis, batteries, sensors[
29], electronics [
30] and dye absorption.
In order to build a wide and precise portrait of the structure, morphology, composition, dimensionality and morphology, carbon nanomaterials are usually evaluated using a variety of characterization techniques. These include electron microscopy, X-ray diffraction, X-ray photoelectron, ICP, UV-Vis, IR-Vis and Raman spectroscopies and thermal analysis, to name some. Thermogravimetric analysis (TGA) is a simple, but widely used, technique to characterize carbon derivatives.[
31,
32] TGA allows monitoring temperature-induced physical and chemical changes to materials. By analyzing weight variations of the sample (thermal events), it is possible to determine the temperature at which a reaction takes place, and can thus provide information on the thermal stability of a material. Moreover, thermal events might offer useful information to elucidate the composition of the material and to study phenomena such as phase transitions, absorption/desorption, chemisorption, oxidation, degradation or solid-gas reactions. The atmosphere used during the measurement plays a significant role in the information collected from the analysis.[
33] When performing TGA on carbon-based systems under oxidizing gases (O
2 or air), usually, a pronounced weight loss, typically occurring above 400 °C (temperature largely dependent on the sample), corresponds to the oxidation of the carbon skeleton into carbon dioxide, while the resulting residue (if so) might consists of oxidized inorganic materials, such as catalyst or other compounds employed for their synthesis or post-synthesis treatments.[
4,
34] Meanwhile, a weight loss, occurring at lower temperature (that in some cases can even overlap with the main thermal event) is usually attributed to the elimination of labile groups, namely, water molecules or also to bearing functionalities attached to the surface of the analyzed systems.[
35,
36] When using inert gases to perform TGA (argon, helium and nitrogen – although nitrogen could be regarded as a source of N in some cases –), the weight loss corresponds to the removal of functional groups because combustion of the sp
2 skeleton does not occur in absence of an oxidizing ambient.[
37] Other parameters, like gas flow, heating rates and mass of sample may induce variations in the TG curve and therefore, affect the interpretation of the data collected from TGA. Here, we provide insights on the role of these parameters, providing tools for the selection of the optimal conditions to design reliable experiments and exploit the benefits of thermal analysis for the characterization of carbon nanomaterials. It is worth noting that a clear and detailed description of the conditions employed for the measurements of the thermal properties of the samples allows minimizing errors when comparing analysis performed. Previous studies have been devoted to analyze the oxidation of CNTs[
38] and to explore the role of the parameters stablished to perform thermal analysis[
39,
40], however, a detailed analysis of their influence on the study of CNTs and graphene-based materials has not been reported.
3. Results and discussion
Due to their ease of manipulation, CNTs will be initially used to understand the role of the different TGA parameters. To complete the study, graphene-based materials will also be investigated.
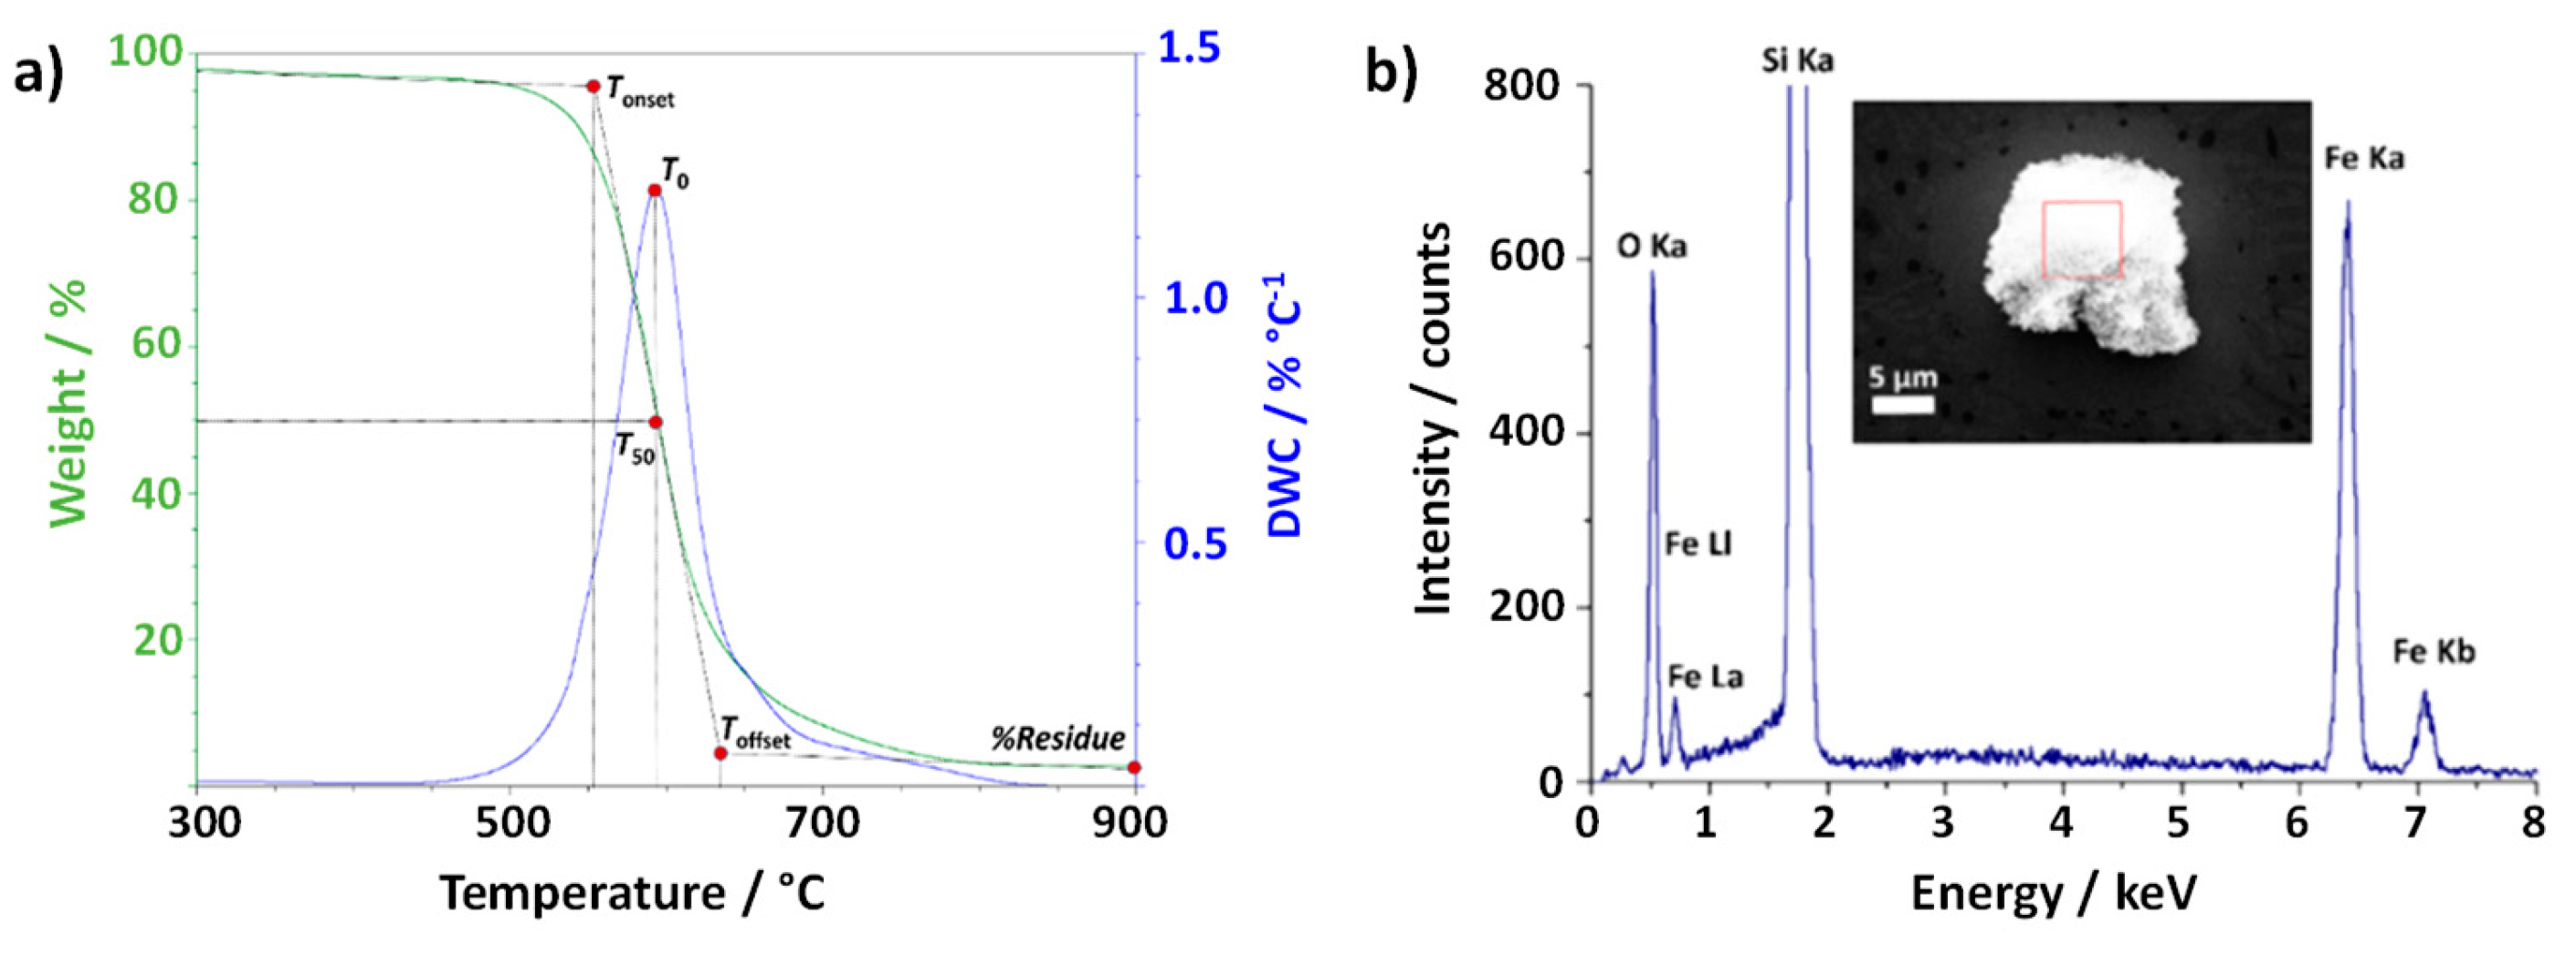
Figure 1a) shows the thermogravimetric curve, resulting from plotting the % weight of as-received (raw) CNTs with respect to temperature. In this case the material is annealed under flowing air (25 mL min
-1, 10 °C min
-1) up to 900 °C. As it can be observed, a main thermal event occurs when annealing SWCNTs under an oxidizing atmosphere (air). The annealing treatment has induced the total combustion of the carbonaceous fraction, while a solid residue, probably resulting from the oxidation of the inorganic fraction has been obtained, and collected after cooling down.
The TGA curve is a useful tool to analyze the oxidation process of a material. Four main temperatures can be defined to describe the process that occurs when the sample undergoes the oxidation; three of which can be determined directly from the resulting plot. Tonset and Toffset give a temperature range in where the oxidation takes place, while T50 corresponds to the temperature at which 50 % of weight loss occurs. An additional value, T0, can be obtained from the derivative thermogravimetry (DTG) curve (dw/dT) and it is defined as the temperature of the maximum in the weight loss rate. Finally, from DTG we can also calculate the surface area underneath the peak, A. It is worth noting that a comparison between A values is not possible for treatments performed at different heating rates, because this area is also time dependent.
Additionally, in order to obtain a precise overview of the material, the composition of the residue remnant from the process was assessed. In this case, SEM along with EDS analysis was carried out (
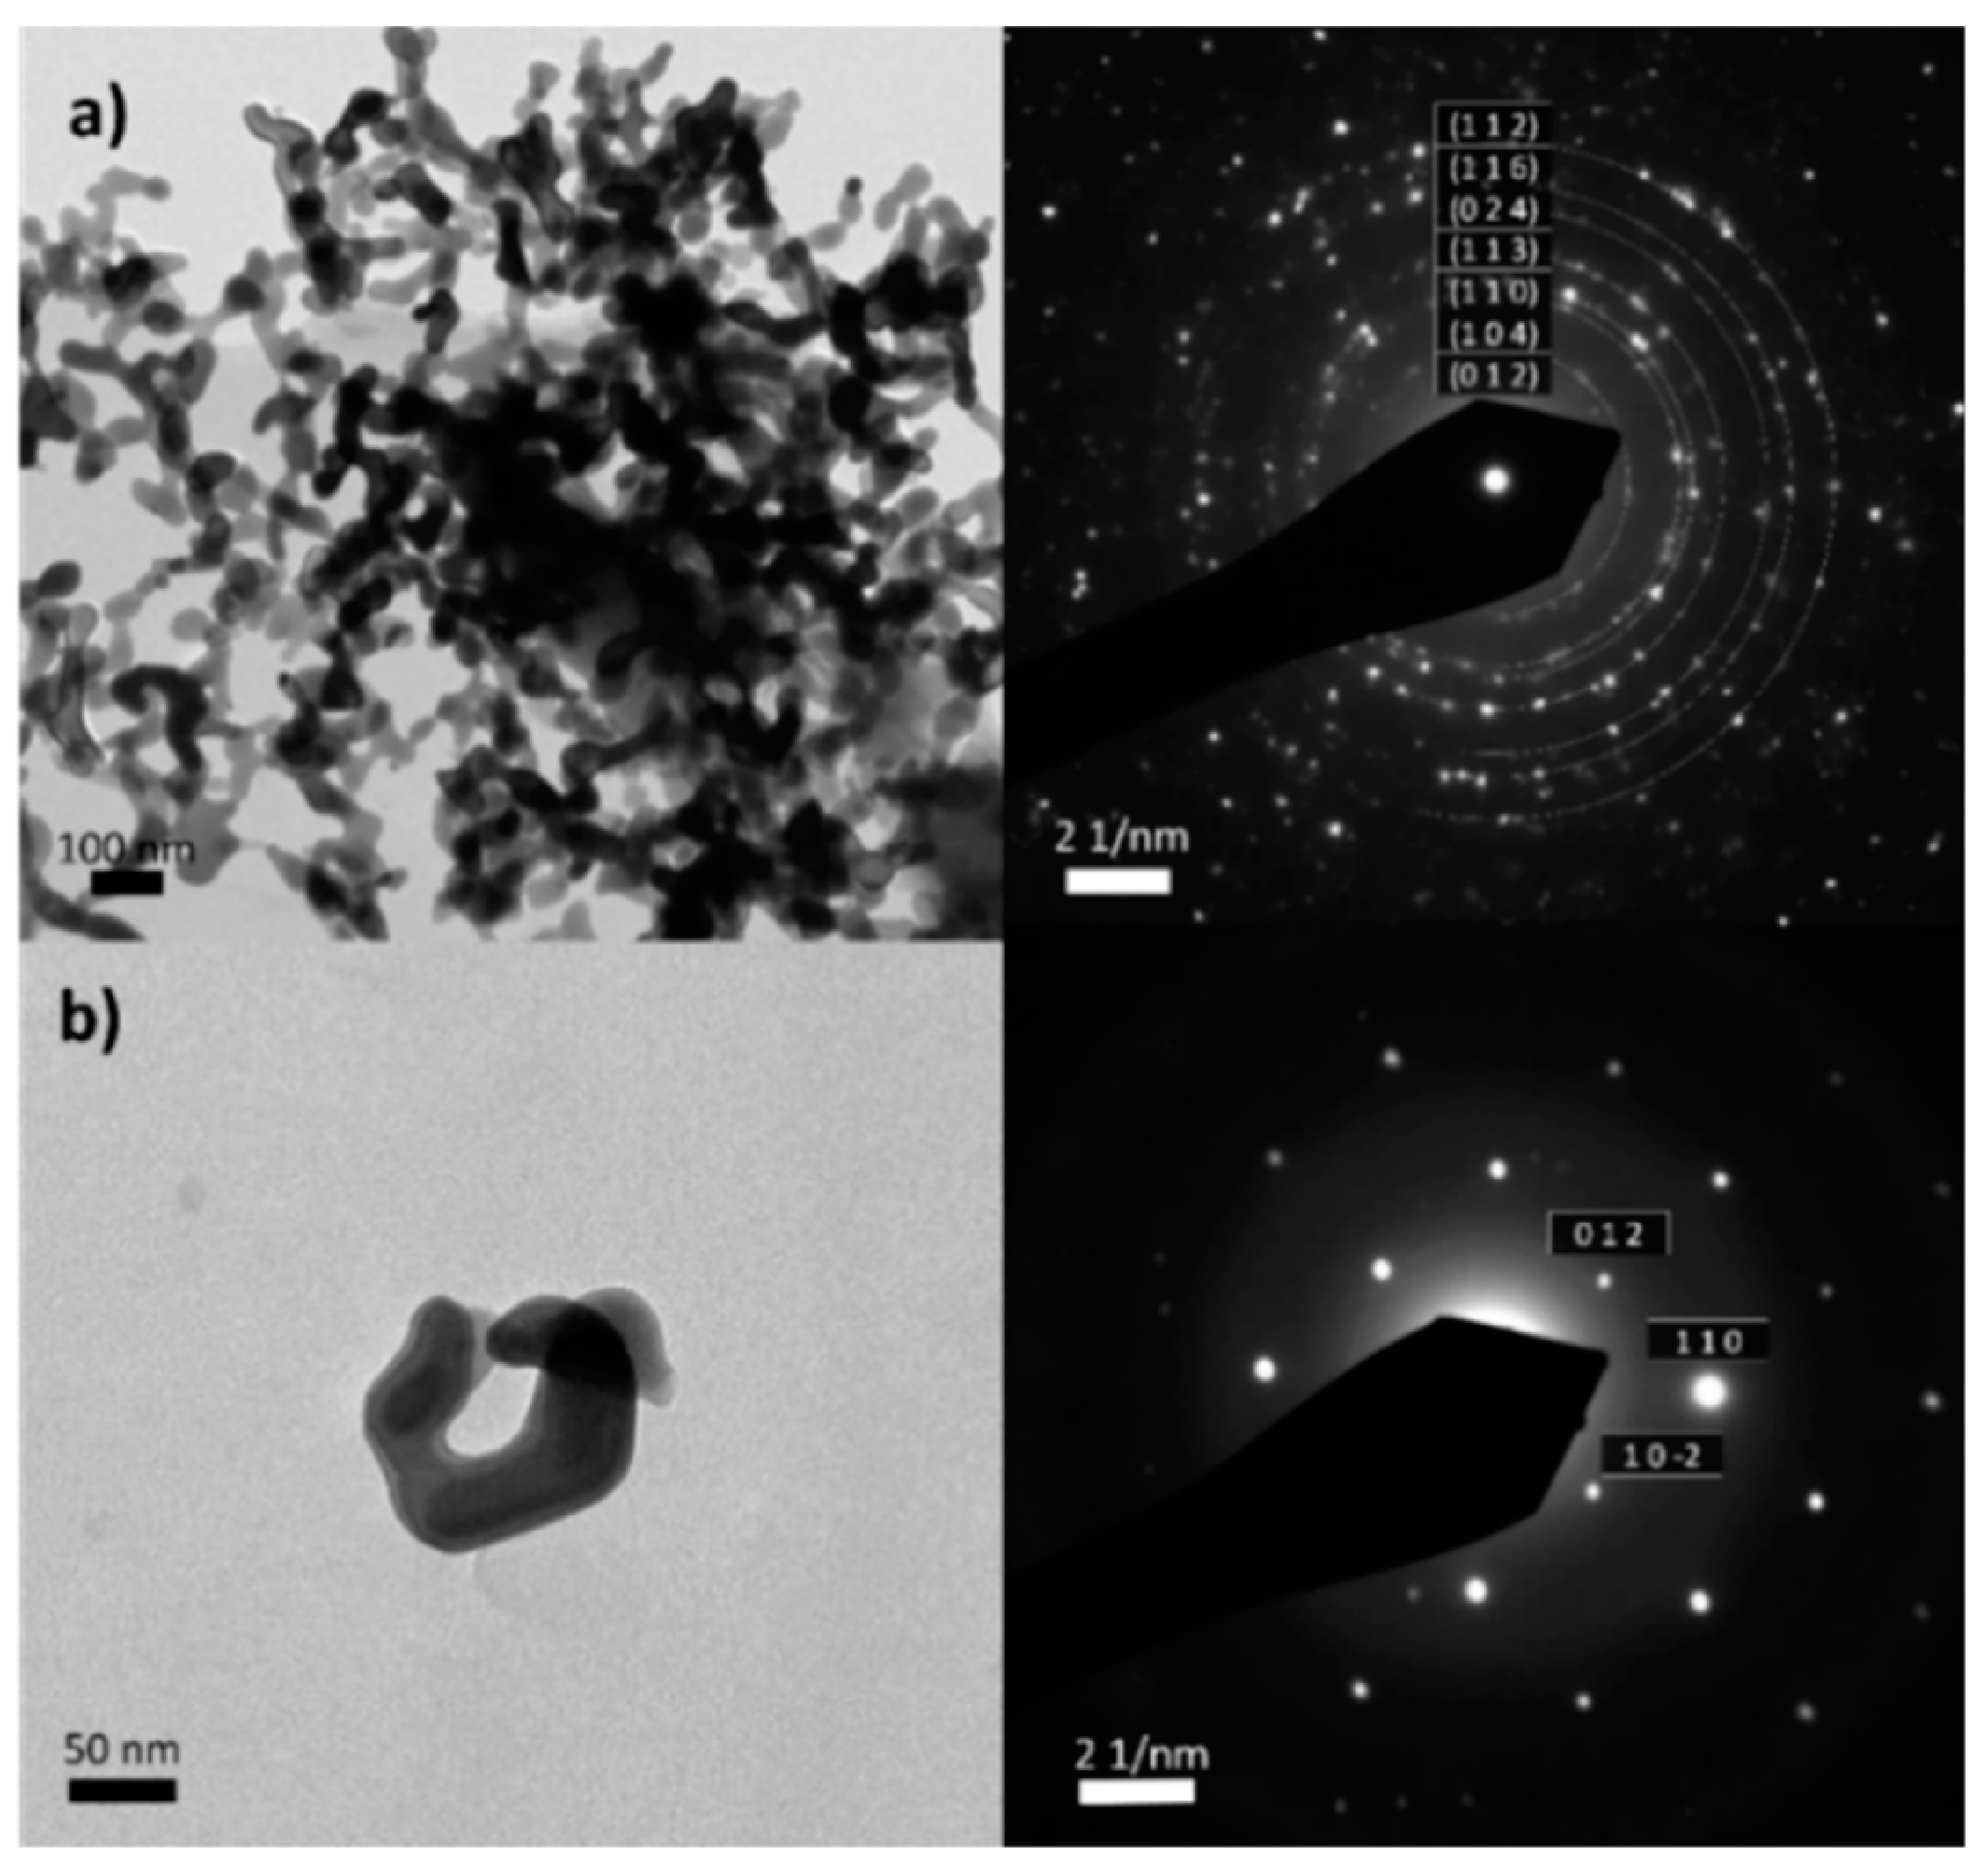
Figure 1 b)). The obtained spectrum revealed the presence of both iron and oxygen, probably corresponding to an iron oxide, resulting from the oxidation (during the TGA) of iron catalyst, already present in the sample from the synthesis process. The structure of the residue has been determined by electron diffraction.
Figure 2 shows the morphology of the collected residue by TEM, along with its selected area electron diffraction (SAED) pattern. In both, monocrystalline and polycrystalline areas, the patterns correspond to iron(III) oxide, hematite. Therefore, the presence of other iron derivatives (ex. iron carbide) or species, previously detected in CNTs can be discarded.[
44]
TGA requires the definition of certain experimental parameters, such as sample mass, heating rate and glass flow. In order to determine their role in the resulting TGA data, several experiments were next performed. TGA was carried out on both raw and purified SWCNTs. In all cases, the sample was initially allowed to stabilize at rt for 20 min. Afterwards, it was heated up to 120 °C, at 10 °C min-1. The system was isothermally kept during 20 minutes, under a constant air flow (20 mL min-1). This step was performed to eliminate any water or volatile species, from the environment, that might have physisorbed onto the sample. Afterwards, the system was annealed up to 900 °C and then allowed to cool down to room temperature. For statistical purposes and to get reliable data, five replicas were performed for each experiment.
Initially, the influence that the employed sample mass has on the TGA curve was evaluated. Both flow rate (25 mL min
-1) and heating rate (10 °C min
-1) were kept invariable during the analysis.
Figure 3a,b register both the thermogravimetric and the calculated derivative curves obtained after annealing 1, 2, 5, 10 and 20 mg of raw SWCNTs under air. Visual inspection of TGA curves suggests slight variations in terms of combustion temperatures when different amounts of material were employed. Let us initially focus on the temperatures at which the thermal events initiate (
Tonset). No major differences in
Tonset are observed when changing the mass of sample (from 1 to 20 mg;
Figure 3c). In contrast, a more pronounced variation is perceived in the
Toffset values. Whereas the
Tonset remains barely constant in the range of 1-10 mg, a significant increase is clearly visible when using 15 mg and 20 mg of sample (reaching up to 650 °C and 681 °C, respectively). This suggests that, once the minimum temperature required for starting the oxidation is reached, the combustion of the sample already starts, but the more sample is present the longer time it takes to complete the oxidation process. This is reflected by a prolongation of the thermal event thus inducing variations in shape of the thermogravimetric curve.
As it was explained above, DTG curves resulting from calculating dw/dT (Figure 3 b)) allow determining the temperature at which the weight loss rate reaches its maximum (T0, solid blue circles). However, further information can be obtained by the analysis of the DTG curve, with respect to the quality, morphologic characteristics or heterogeneity of the sample. For instance, the width of the DTG curve can be used as an indicator of material purity, where a narrower peak might correspond to the presence of a higher purity material. It is also possible to discern between two or more overlapping reactions. In our study, the difference in the shape of the curves cannot be attributed to sample heterogeneity because all the analyses were carried out using the same batch of CNTs. Therefore, it only depends on the time elapsed between the start of the thermal event and the complete combustion of the sample.
The presence of inorganic impurities, in the present case iron catalyst, can also be determined by TGA taking into account the residual weight after the complete oxidation of the sample, which as observed by ED corresponds to Fe
2O
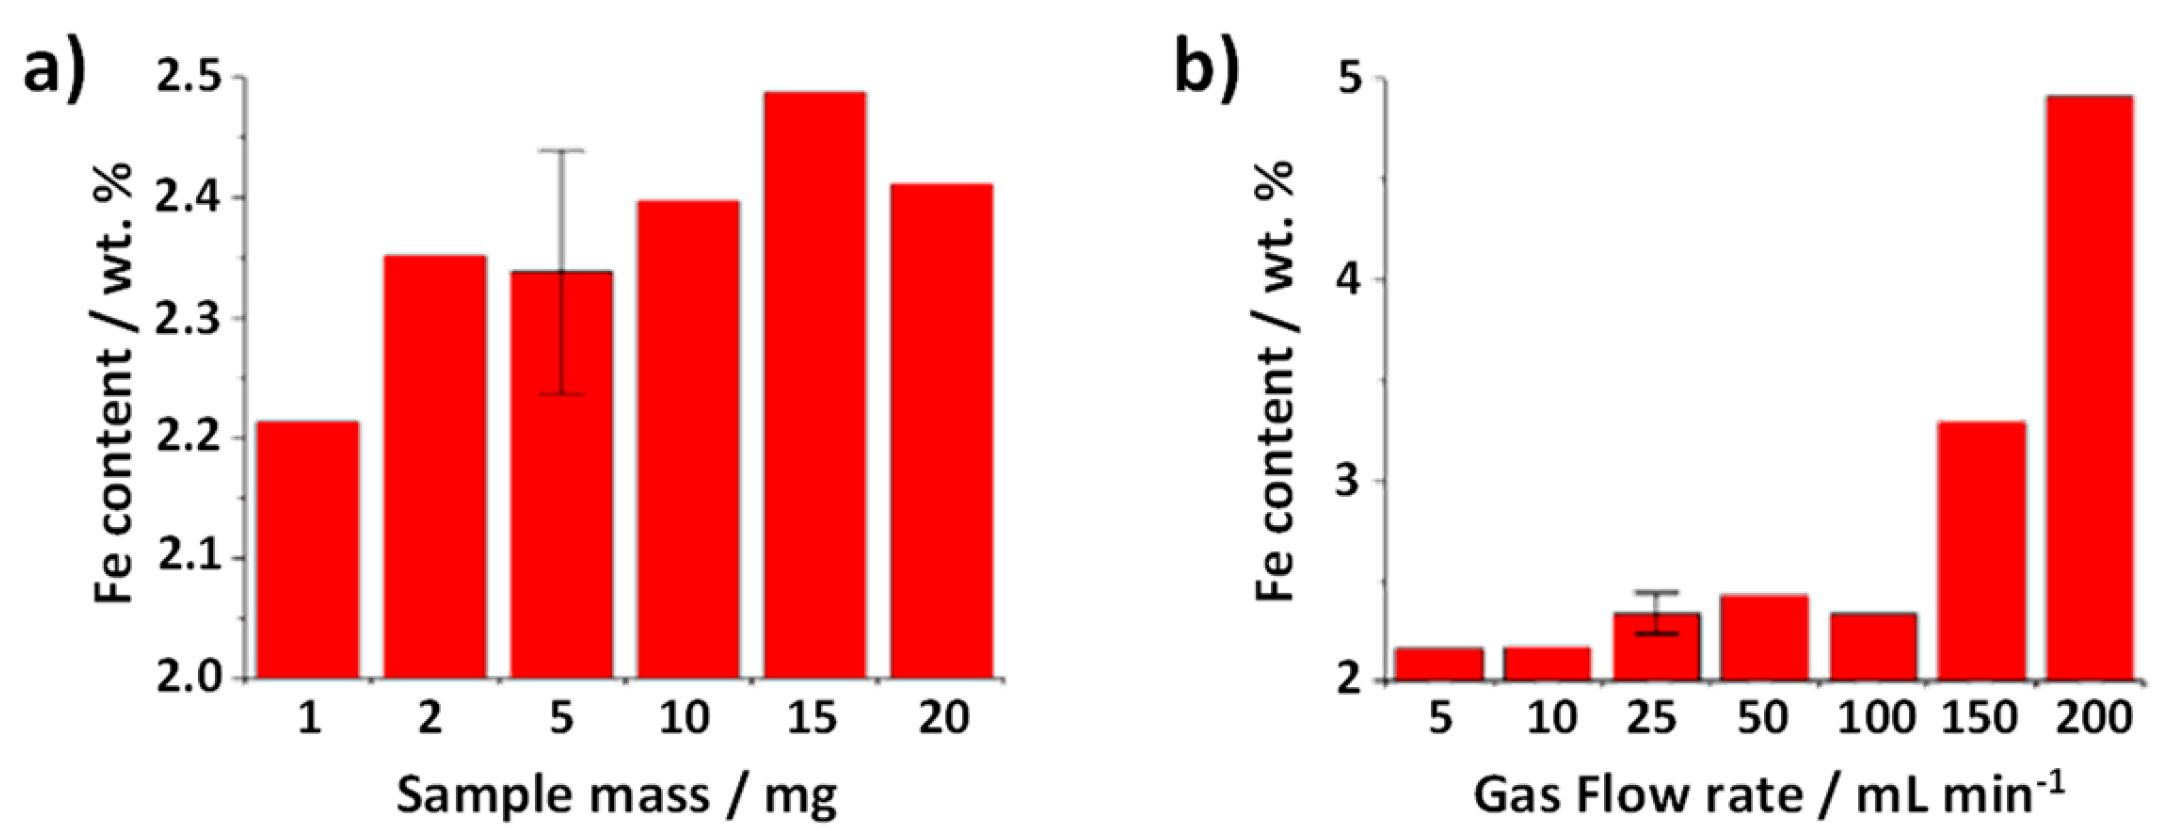
3. Therefore, it is possible to quantitatively determine the iron present in the sample by simple stoichiometry (
Figure 4a). Similar values are obtained within experimental error (error bar included for one of the analysis) regardless of the employed mass. Nevertheless, a lower small of iron content would seem to be present when using only 1 mg of sample. Therefore, using larger amounts of sample, whenever possible, would be desirable.
Next, the role of the gas flow rate was assessed. To minimize the experimental error that might be induced by using a low amount of sample, 5 mg of SWCNTs were employed. TGA were performed by annealing raw SWCNTs at a heating rate of 10 °C min
-1 up to 900 °C, under flowing air at 5, 10, 25, 50, 100, 150 and 200 mL min
-1. As it can be observed in
Figure 4b significant differences are observed after calculating the amount of iron catalyst present in raw SWCNTs from the different TGA curves. There is a clear tendency to determine a much larger amount of catalyst content when using the highest flow rates (150 and 200 mL min
-1). The use of a large flow rate may induce a slight push up of the platinum pan employed for the analysis thus altering the TGA output data. Therefore, the use of flow such high flow rates does not seem appropriate to study this type of materials.
Figure 5a,b shows the thermogravimetric curves resulting from the above-mentioned treatments, along with their DTG curves. Similarly to the previous case, the variation in the
Tonset for the range of gas flow rates investigated does not show significant differences, suggesting that this parameter does not play a significant role in the start of the oxidation. However, a delay in the complete oxidation of the sample (
Toffset) is clearly visible when using low gas flow rates, namely 5 mL min
-1 (continuous green line) and 10 mL min
-1 (blue dotted line). This might be induced by the lack of oxygen supply, which is crucial for the combustion of the tubular carbon nanostructures. The longer lapse of time required to finish the thermal event, makes the
Toffset values shift towards significantly higher temperatures for the samples treated under lower flow rates (691°C and 656 °C, for 5 mL min
-1 and 10 mL min
-1, respectively), as it can be appreciated in
Figure 5c. As expected, wider DTG peaks can be observed from the 5 and 10 mL min
-1 analyses (
Figure 5b). In the case of the TGA at 5 mL min
-1 a T
0 of more than 30 °C is observed with respect to TGA performed at ≥ 25 mL min
-1.
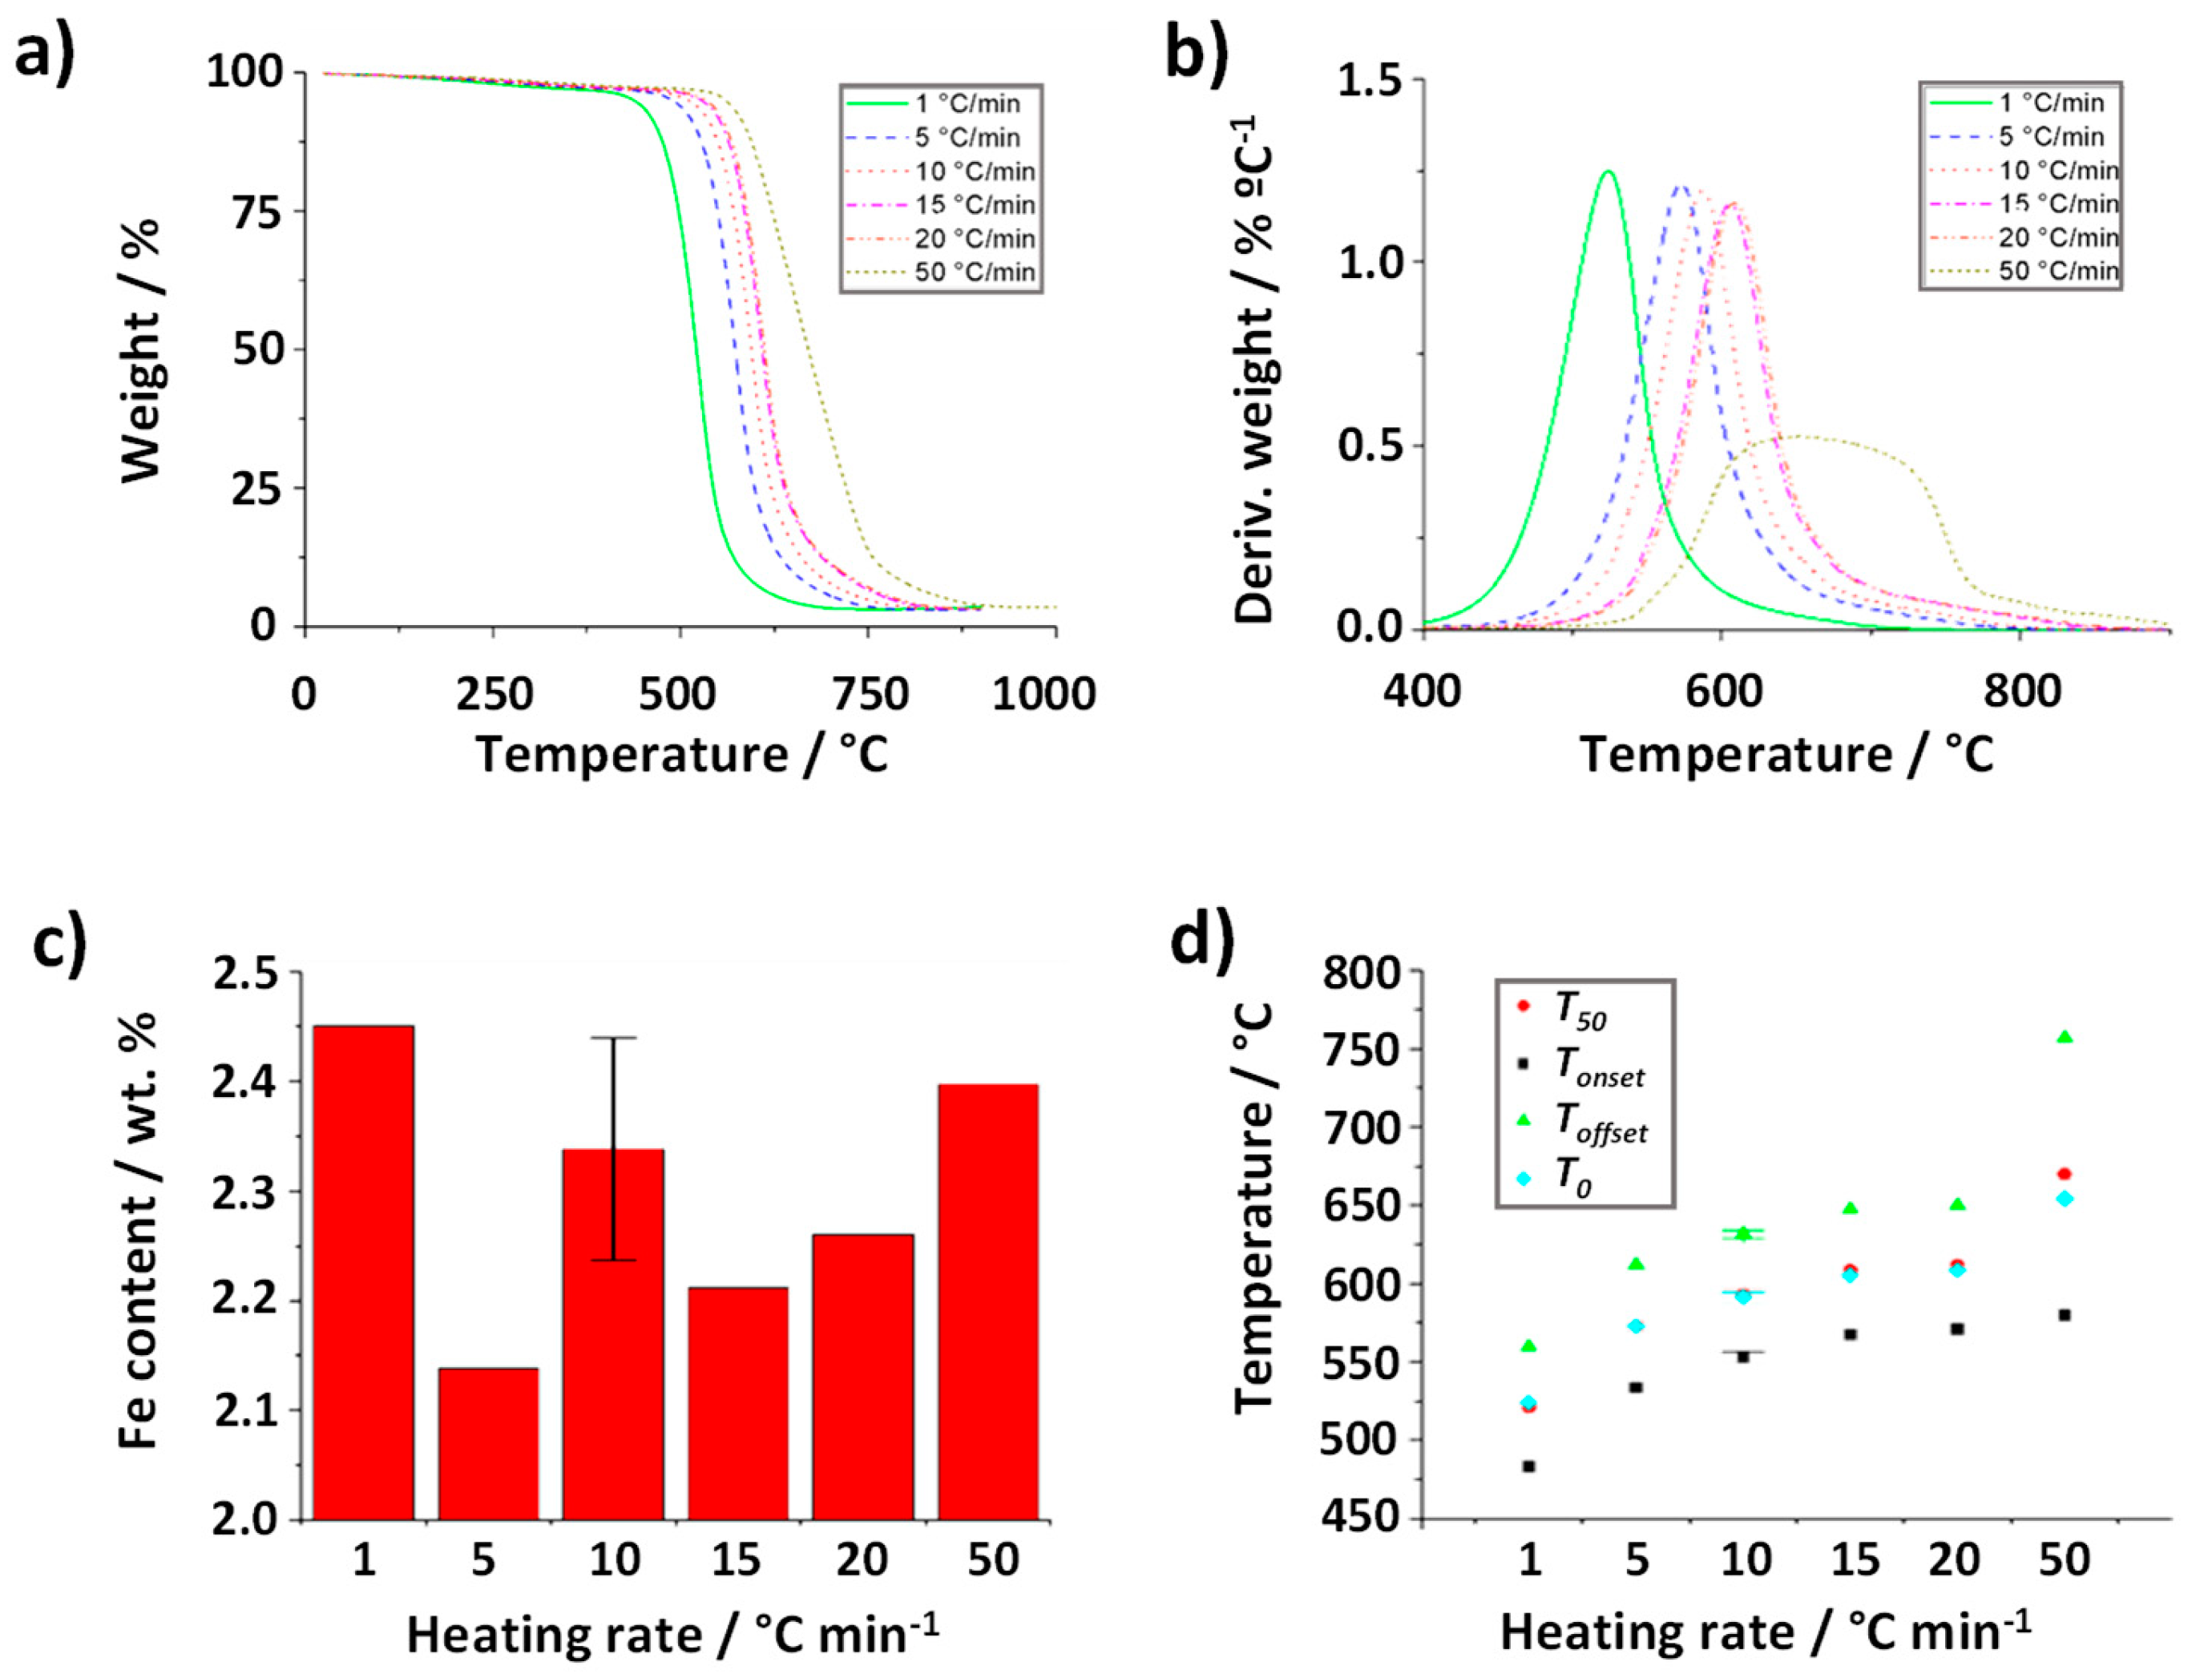
Finally, the role played by the heating rate in the oxidation process was evaluated. For this purpose, a series of annealing treatments were performed on 5 mg of CNTs using an air flow rate of 25 mL min
-1. The heating rates employed were 1, 5, 10, 15, 20 and 50 °C min
-1. The resulting TGA are shown in
Figure 6a. As it can be observed, this parameters turned out to play the major role and important changes can be observed, both in terms of the shape of the TGA curve and temperatures at the oxidation occurs. Visual inspection suggests that there is a direct relationship between the heating rate and the temperature of combustion of the CNTs, with a range of
Tonset between 483 °C and 582 °C. Moreover, TG curves of the samples treated under both the lower (1 °C min
-1) and the higher temperature (50 °C min
-1) rates are clearly differentiated from those annealed under temperature rates ranged between 5 and 20 °C min
-1. It is worth noting though that the catalyst content determined under the different heating rates was similar within experimental error (
Figure 6c). According to previous reports, thermal conductivity and transition kinetics might affect more significantly when the heating rate is modified. Instrument effects may also play a role.[
45,
46] In case of the evaluated nanocarbons, one additional aspect should be considered. As mentioned before, the presence of impurities, resulting from the CVD process, alters the characteristics of the sample. For instance, the oxidation of amorphous carbon is known to occur at lower temperatures than CNTs.[
47] The presence of this impurity in the raw material could account for the early combustion observed when the sample is treated a 1 °C min
-1 (continuous green line). Once the combustion of the amorphous carbon starts to take place, the temperature of the system might locally increase because it is an exothermic process (releases energy), which might in turn result into the earlier oxidation of the nanotubes. This phenomenon becomes more visible when using the slowest heating rate. Despite a continuous increase of
Tonset is observed when increasing the heating rate, the width of the thermals event remains almost invariable up to 20 °C min
-1 (
Toffset-Tonset ~ 78 °C,
Figure 6d), with symmetric DTG curves
Figure 6b that suggest negligible during the oxidation process once started.
Interestingly, at the highest flow rate (50 °C min
-1) marked differences in the shape of the TGA curve are appreciated, which result in a large broadening of the DTG curve (
Toffset-Tonset ~182 °C,
Figure 6d). It is worth noticing that at the end of the TGA at 900 ºC the collected residue was black, indicating that the carbon fraction had not been completely oxidized, and it was necessary, only in this case, to perform the analysis up to 1000 ºC to achieve a complete oxidation of the sample.
The capability of the thermobalance to homogeneously heat the sample can contribute to the obtained results. Let us consider that the temperature of the furnace increases from A to B. In order to obtain appropriate and trustable data of the process, the entire sample might reach the target conditions (temperature B), homogeneously, before its weight is registered by the equipment; on the contrary, the analysis might induce to deviations between the temperature of the program and the real temperature (Treal) of the sample.This is the case when the system is annealed too fast and Treal is lower than the expected temperature (T set in the controller). This is the case of the sample analyzed at a heating rate of 50 °C min-1. The slope of the TG curve also decreases due to a more prolonged time of oxidation of the sample (Toffset ~764 °C), similarly affecting the calculation of the DTG.
By analyzing the set of parameters above described we have clearly stressed the importance, not only of carefully selecting the conditions of the measurements in TGA, but also of using always the same parameters, to obtain suitable and comparable information from this technique. Next, to complete the study we will analyze thermal curves resulting from the oxidation of as-received (raw) and purified SWCNTs. Initially, and according to the results obtained above, we employed the following parameters to obtain reliable information from the analysis: 5 mg of sample, a heating rate of 10 °C min
-1 and a gas flow of 25 mL min
-1. These parameters were selected considering aspects like the shape of the TG curve (which indicates the homogeneity of the oxidation process), variations in the commencement and completion of the thermal event, and determination of the inorganic residue.
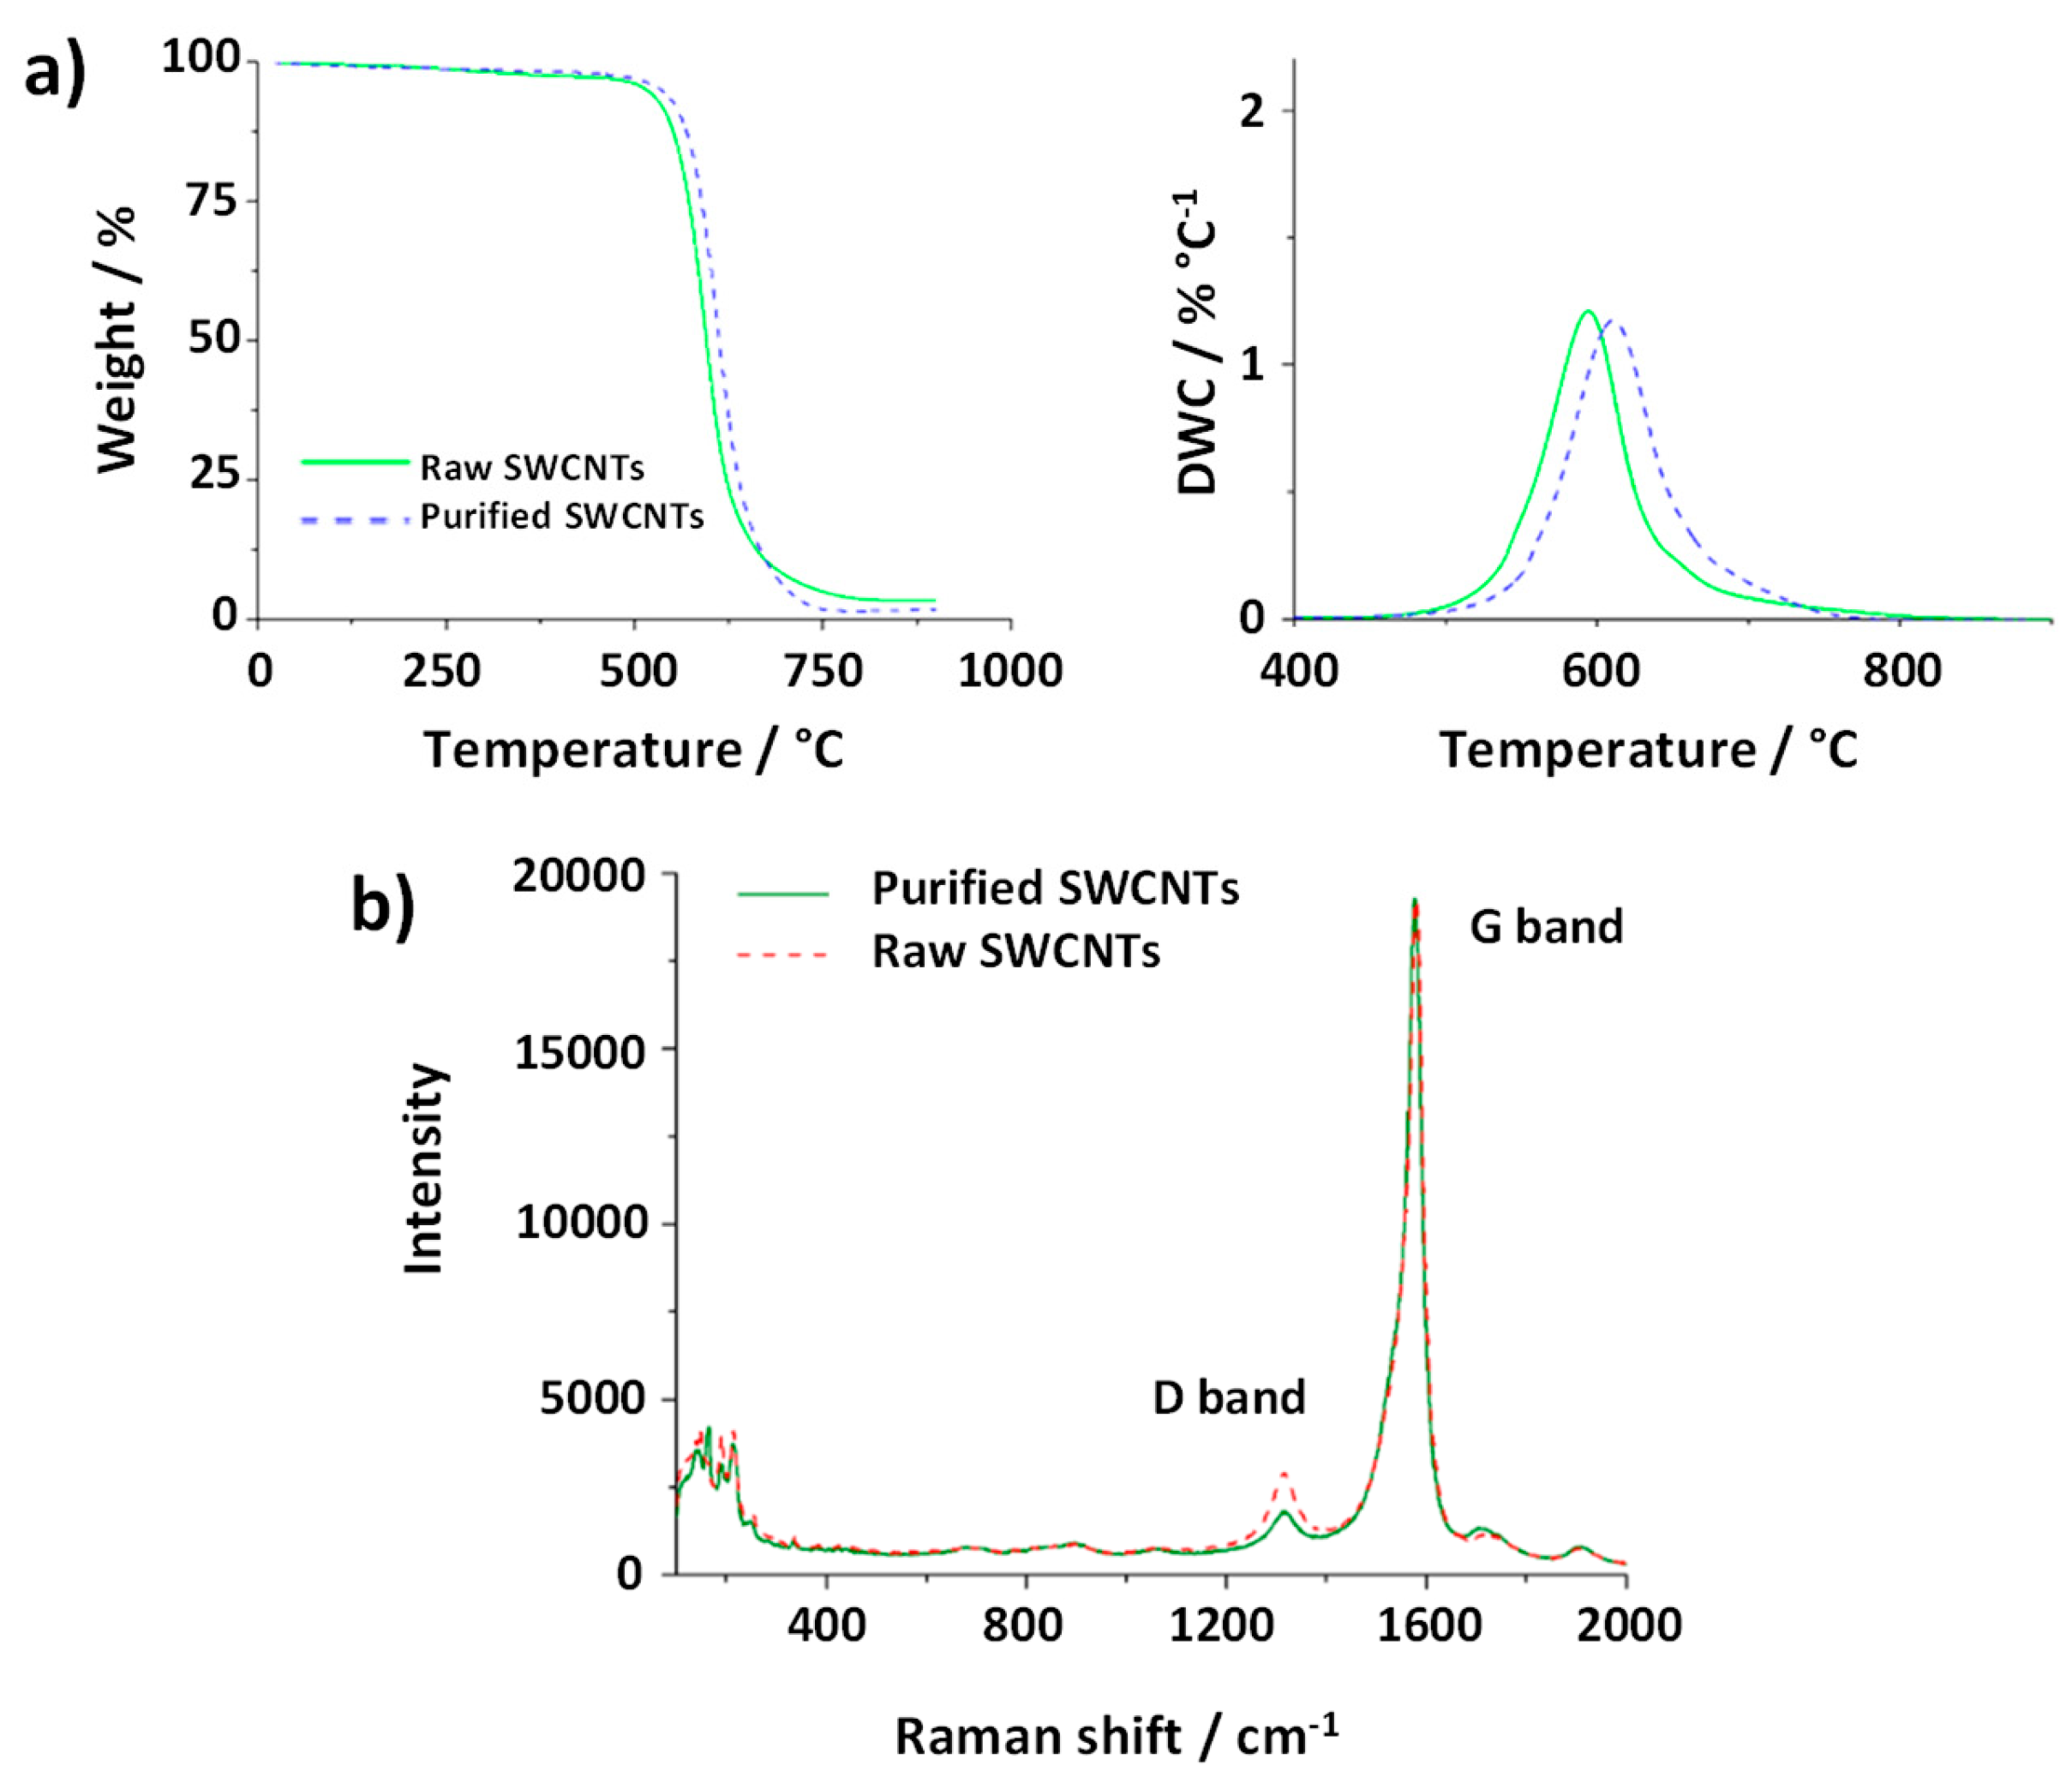
Figure 7a shows both TGA and DTG curves of the analyzed materials. Purified SWCNTs were obtained performed using a previously reported steam and acid treatment,[
49] which allows the efficient removal of amorphous carbon, graphitic particles and metal catalyst from the sample. The removal of these impurities results in a higher thermal stability of the sample, thus requiring higher energy to undergo the combustion, compared to the pristine one. This is in agreement with the shift of
T0 (DTG curve) for the purified CNTs with respect to the raw material.
Raman spectroscopy provides information about the structure, crystallinity and purity of the CNTs. Two bands are commonly present in the CNTs Raman spectra. The first one, located around 1570 cm
-1 corresponds to the E
2g photon at the Brillouin zone center and it is characteristic of the vibrations of sp
2 C atoms along the graphitic conjugated network. Meanwhile, the D band (around 1350 cm
-1) results from stimulating sp
3 carbon atoms, being generally attributed to the presence of defects in the structure of the CNTs. Moreover, these vibrations would also be associated to the presence of non-crystalline structures in the sample, as in the case of amorphous carbon. Thus, the I
D/I
G ratio is, usually employed as an indicator of the quality of the CNTs. Raman spectra of both purified and raw CNTs are shown in
Figure 7b. The spectra were normalized for comparison. After the purification treatment the D band decreased (I
D/I
G ratio from 13.7 ± 0.4 to 9.8 ± 1.6 (N=4)). Since the purification protocol involves annealing the material under a mixture of steam/argon at 900 °C, the increase in the crystallinity of the sample can be attributed either to the elimination of defects of the CNTs walls or to the removal of amorphous carbon. Therefore, Raman spectroscopy provides evidence on the indirect information extracted from TGA. SQUID was also performed for monitoring the content of catalyst in the samples. In agreement with TGA, the amount of Fe after purification decreased, starting from 1.4 wt. % (3.1 emu/g) for the raw material, down to 0.5 wt. % of Fe (1.1 emu/g) for the purified CNTs. Finally, elemental analysis revealed an increase in the C content after the purification (from 91.4% for raw material to 96.9% after purification), as consequence of the removal of metal catalyst by the acid treatment.
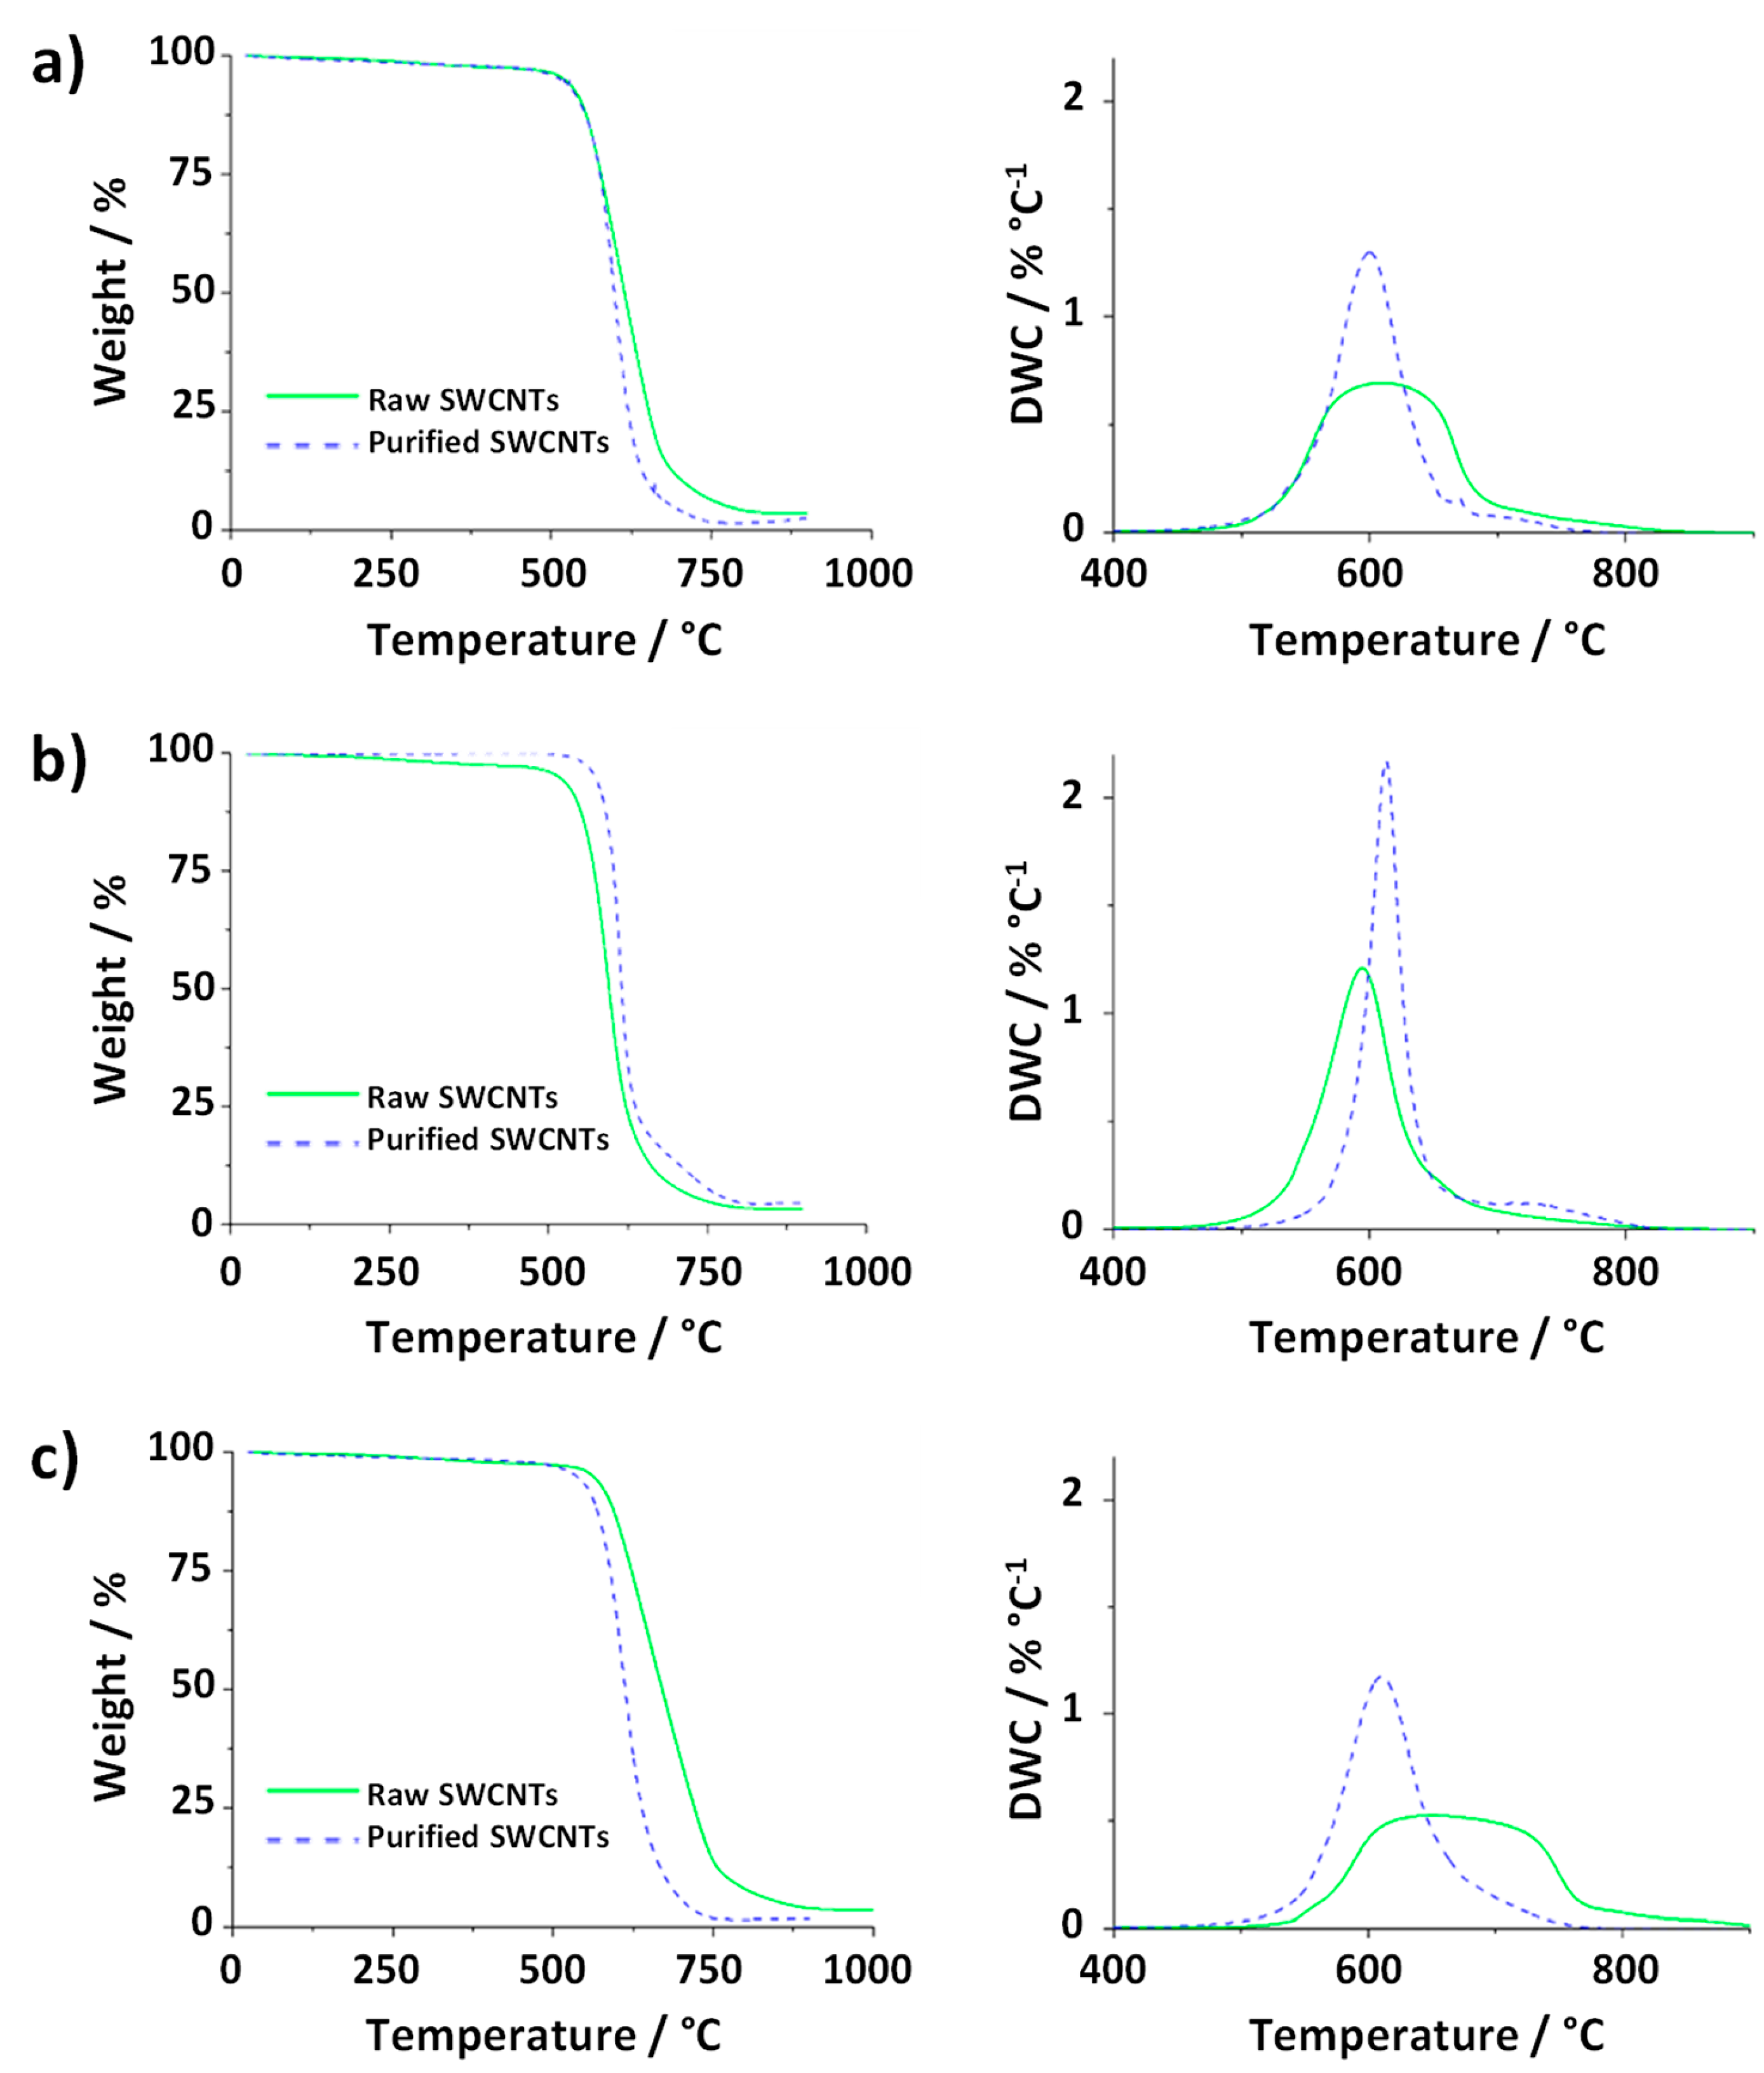
These to samples where then employed to illustrate the effect of the previsouly discussed TGA parameters on the resulting curves. First, the amount of sample was changed.
Figure 8a shows the TGA and DTG curves resulting from the analysis of 1 mg of purified SWCNTs and 20 mg of the raw material (25 mL min
-1 gas flow and heating rate of 10 °C min
-1). Comparision of the data with the TGA curves obtained using the same TGA parameters for both samples (
Figure 7a), reveals that the increase in the amount of raw nanotubes results in a delay in the
Toffset. This is probably because the presence of a large amount of sample requires either more energy or time for the total combustion under similar conditions. As consequence, the determination of the thermal stability of the materials can be compromised when using different amounts of samples, as in the case of
Figure 8a, where raw SWCNTs would seem to present a higher thermal stability than the purified SWCNTs, thus leading to false conclusions.
An inverse effect is observed when comparing samples treated under different heating rates
Figure 8b. If the TGA curve of purified CNTs annealed at 10 °C min
-1 is compared with the TGA of raw material oxidized at 50 °C min
-1 (sample mass 5 mg, gas flow 25 mL min
-1) the slope of the TG curve varies, being more pronounced for the purified sample. When using a higher flow rate for purified CNTs (200 mL min
-1) than for raw CNTs (25 mL min
-1) to anneal 5 mg of sample at a heating rate of 10 °C min
-1 (
Figure 8c), the relative residue of the raw sample seems to increase, leading to an Fe content of 3.1 wt. %, which is markedly superior to the Fe calculated from the curve obtained from the experiment performed on pristine CNTs at lower flow rate (2.3 wt. %,
Figure 7a). The observed inversed quantity of catalyst among raw and purified SWCNTs would also result in false conclusions, because the amount of iron is decreased by purification, as determikned by SQUID.
One particular case, in which the determination of the thermal stability by TGA is especially useful, includes the evaluation of carbon nanomaterials which structure have been modified via covalent or not covalent functionalization. A variety of reports have demonstrated that, for instance, the introduction of foreign species within the sp
2 skeleton via replacing C atoms by dopant species like boron or nitrogen, not only induces changes in the electronic behavior of the material, but also affects the stability of the sample and its response against physical and chemical processes like thermal transport[
50] or oxidation.[
51,
52] In order to have insights about the role of the TGA conditions in the evaluation of modified planar nanocarbons, we have analyzed a material that we previously reported, which has demonstrated an enhanced thermal stability against the oxidation by air compared with its non-doped counterpart.[
53] The sample (N-doped reduced graphene oxide, hereafter N-doped RGO) resulted from the ammonolysis treatment of graphene oxide (GO) using pure ammonia gas at 500 °C for 1 h. By performing TGA of the sample (2 mg, heating rate 10 °C min
-1) along with other characterization techniques, we have demonstrated that the introduction of N atoms within the honeycomb lattice of graphene induced up to 162 °C increase in the T
onset with respect to a sample prepared under the same experimental conditions but replacing ammonia by argon. As shown in
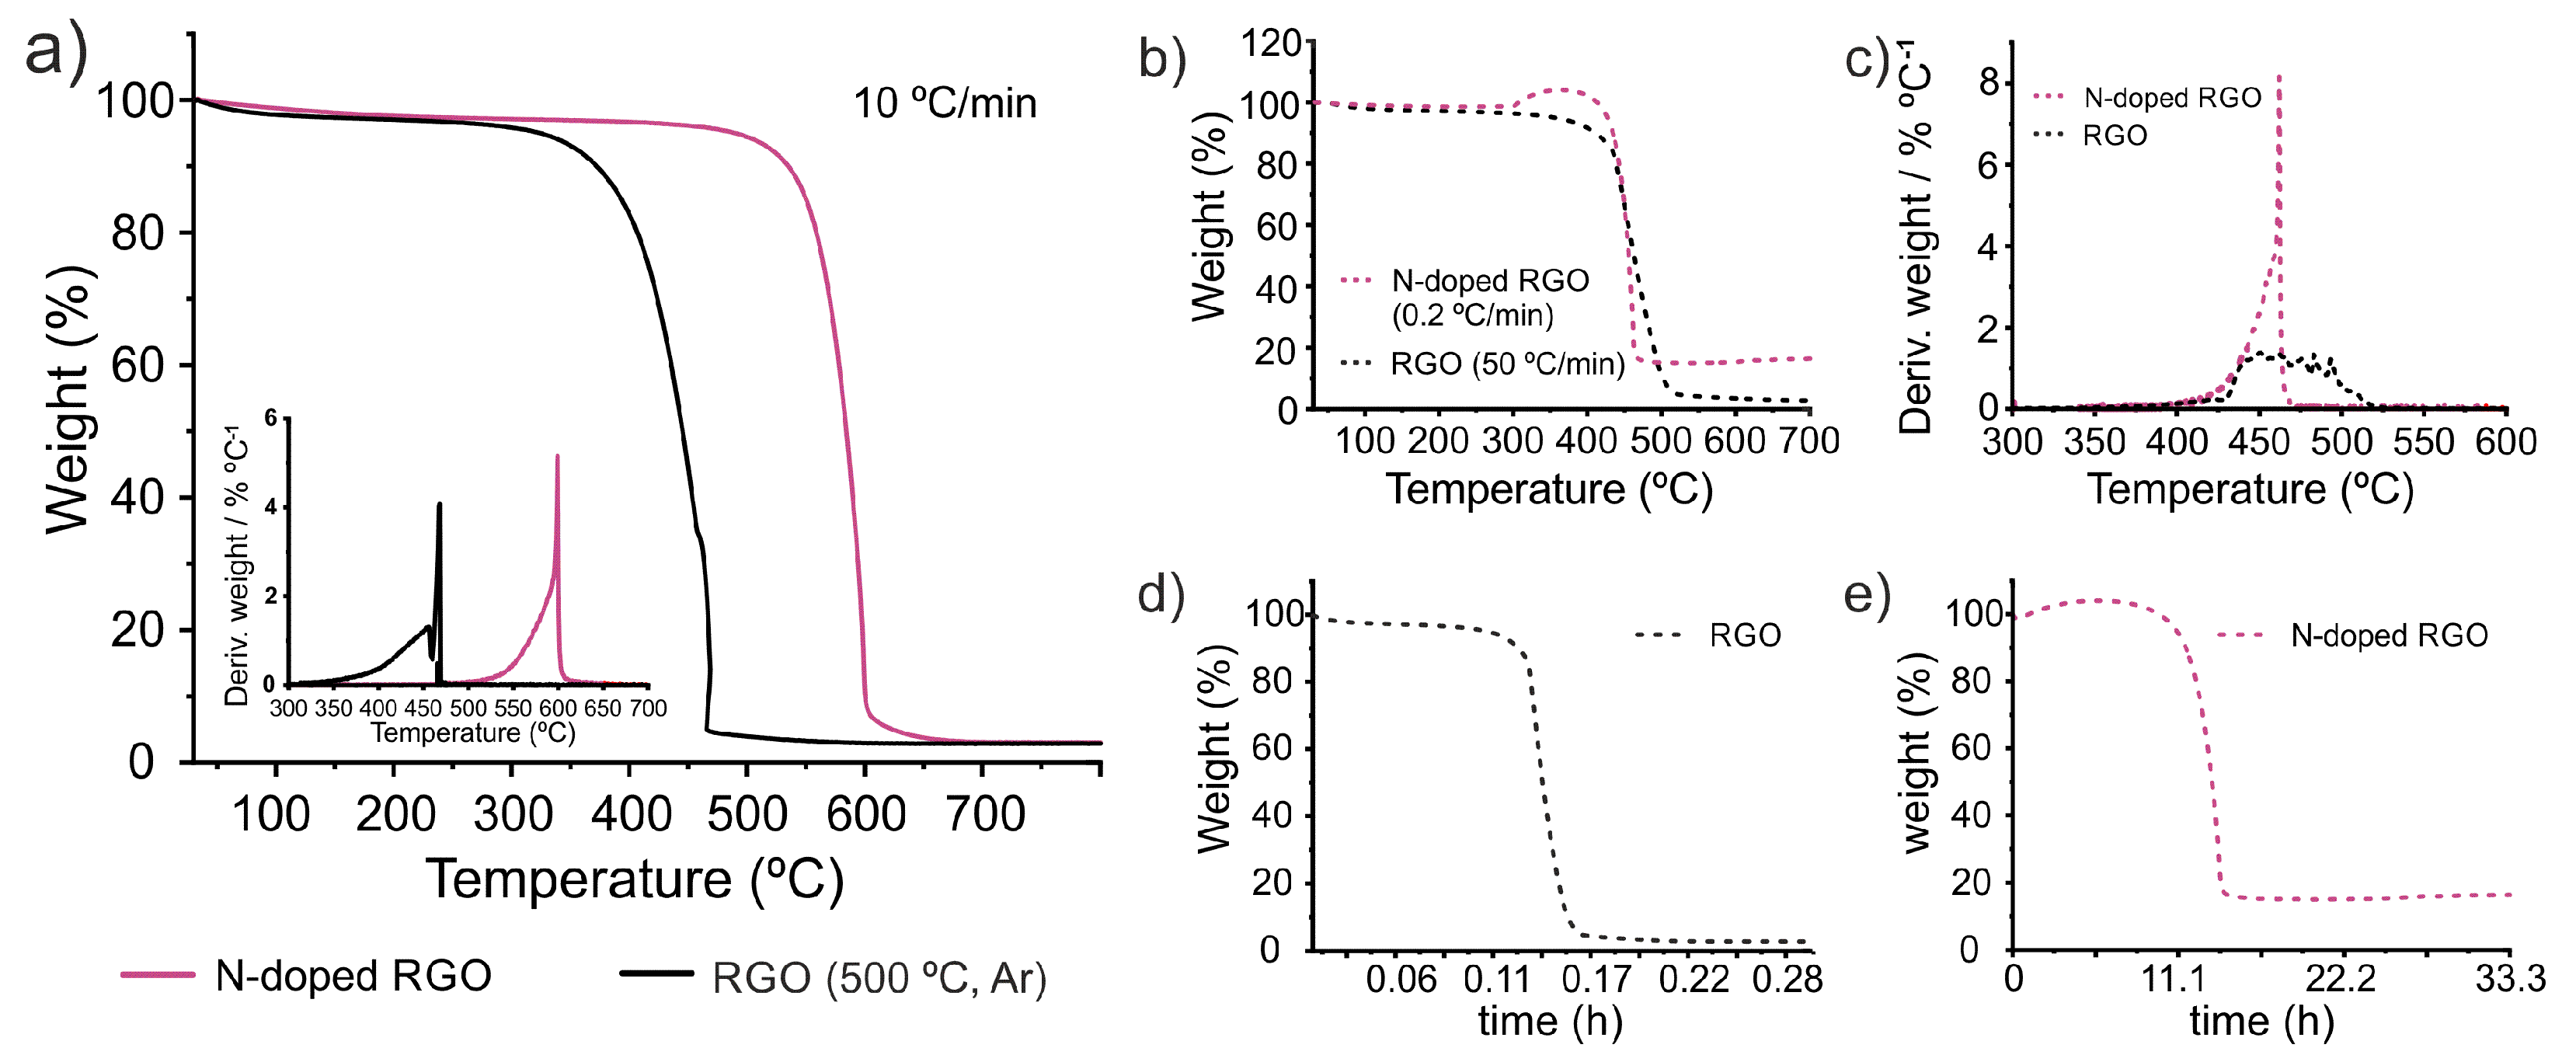
Figure 9a an important difference between T
onset of the samples is observed in the TGA curves of both RGO and N-doped RGO, performed under the same TGA parameters. Next, we analyzed the samples using markedly different conditions.
Figure 9b shows the TGA curves of RGO treated at the highest heating rate employed in this work, 50 °C min
-1, while N-doped RGO was annealed using a heating rate much more low, 0.2 °C min
-1. Such a low heating rate, not previously employed within this work, was used with the aim to obtain marked differences between the analyses. Both, sample weight and air flow were kept constant. Due to the long duration of the treatment performed to the N-doped sample, and considering that no thermal event would occur under 300 °C, an initial heating rate of 10 °C min
-1 was employed up 300 °C, to reduce the total time of analysis. Then the system was annealed at 0.2 °C min
-1 until the sample underwent its total combustion. The sudden change in the heating rate results in an apparent increase of the sample weight. This can be considered an artifact of the measurement, likely due to the lengthy measurement, of almost one day and a half (
Figure 9e represents the weight % vs time for N-doped RGO;
Figure 9d for RGO). Despite the weight % is no longer relevant and also a high residual value is obtained, the temperature at which the oxidation process takes place it is worth discussion. In case of both reduced GO and N-doped RGO, the temperature at which the combustion takes place agrees with the behavior of the evaluated SWCNTs. A significant increase of the heating rate (from 10 °C min
-1 to 50 °C min
-1) induces a shift of
Toffset towards higher T (from 475 °C to 502 °C for the annealed RGOs). In case of the N-doped RGO, the use of a very slow heating rate results in a dramatic reduction of the
Toffset, from 599 °C to 462 °C. In this way, both samples N-doped RGO and RGO, would seem to have the same thermal stability against oxidation. The use of a slow heating rate, for N-doped RGO, results in a narrower DTG curve than RGO.
