Preprint
Article

Heat Stress Effects on Physiological and Milk Yield Traits of Holstein Friesian Crossbreds Reared in Tanga Region, Tanzania

Altmetrics

Downloads

133

Views

61

Comments

0

A peer-reviewed article of this preprint also exists.

Submitted:

05 June 2024

Posted:

06 June 2024

You are already at the latest version

Alerts
Abstract
Global warming caused by climate change is a challenge for dairy farming, especially in sub-Saharan countries. Under high temperature and relative humidity dairy cows suffer from heat stress. The objective of this study was to investigate the effects and relationship of heat stress (HS) measured by temperature-humidity index (THI) on physiological parameters and milk yield and composition of lactating Holstein Friesian crosses reared in the humid coastal region of Tanzania. A total of 29 lactating Holstein Friesian x Zebu crossbred dairy cattle with 50% (HF50) and 75% (HF75) Holstein Friesian blood levels in their second and third month of lactation were used. Breed composition of Holstein Friesian was determined based on animal recording system used at the Tanzania Livestock Research Institute (TALIRI), Tanga. Data collected included daily temperature, relative humidity, daily milk yield, and physiological parameters (core-body temperature, rectal temperature, respiration rate, and panting score). The THI was calculated using the equation of National Research Council [39]. The THI values were categorized into three classes i.e. low THI (76-78), moderate THI (79-81) and high THI (82-84). The effects of THI on physiological parameters and milk yield and composition were assessed. Also, the effects of genotype, parity, lactation month, and interaction of these parameters with THI i on milk yield, milk composition, and physiological parameters were investigated. The results indicate that THI and its interaction with genotypes, parity, and lactation month had highly significant effect on all the parameters. THI affected (P ˂ 0.05) average daily milk yield and milk fat %, protein %, lactose %, and solids – not – fat %. When THI increased from moderate to high values, average daily milk yield declined from 3.49 ± 0.04 to 3.43 ± 0.05 liters/day while fat % increased from 2.66 ± 0.05% to 3.04 ± 0.06% and protein decreased from 3.15 ± 0.02% to 3.13 ± 0.03%. No decline was observed on lactose % whilst solids – not – fat % declined from 8.56 ± 0.08% to 8.55 ± 0.10%, when the THI values increased from moderate to high. Also, THI affected (P˂0.05) physiological parameters. Core-body temperature (CBT), rectal temperature (RT), respiration rate (RR) and panting score (PS) increased from 35.60 ± 0.01 to 36.00 ± 0.01oC, 38.03 ± 0.02 to 38.3.30 ± 0.02oC, 62.53 ± 0.29 to 72.35 ± 0.28 breaths/min and 1.35 ± 0.01 to 1.47 ± 0.09, respectively, when THI increased from low to high. THI showed a low positive correlation with average daily milk yield and fat percentage whilst protein, lactose, and solids – not - fat percentages showed negative relationships with THI (P ≤ 0.05). The CBT, RT, RR, and PS showed positive relationships (P ≤ 0.05) with THI. These negative relationships indicate that there is an antagonistic correlation between sensitivity to HS and degree of production. It is concluded that the THI, genotype, parity, and lactation month, and their interactions with THI significantly affected milk yield, milk composition, and physiological parameters of lactating Holstein Friesian dairy crosses at THI thresholds ranging from 77 to 84.
Keywords: 
Subject: Biology and Life Sciences  -   Animal Science, Veterinary Science and Zoology

1. Introduction

Tanzania is ranked third in Africa after Ethiopia and Sudan in terms of cattle population [23]. The country’s cattle population is about 36.6 million [58] of which 96.1% are indigenous breeds [57]. These indigenous breeds have low genetic potential for milk production. Efforts to improve milk production of the indigenous breeds through crossbreeding with temperate dairy breeds started in mid 1960s, following the realization that the use of pure exotic dairy breeds was a failure due to lack of adaptability to the local environment. The crossbreeding of local cattle with temperate dairy breeds was pursued as a means to increase milk production in the country. At the moment dairy cattle comprise only 2.6% of the cattle population in Tanzania [57] and it is mainly the crosses of Holstein-Friesian, Jersey, Ayrshire with Tanzania shorthorn Zebu breed [23]. The average milk production of these crossbred dairy cattle is very low, usually less than nine liters of milk per cow per day [50]. This suboptimal production performance is attributed in part to the long-term exposure of the animals to extreme environmental conditions, including high temperatures, humidities, wind speed, cloud cover, and solar radiation [48,50]. It is also due to the poor nutrition, management, and production system [22], in addition to other factors such as health status and genotype [15,28].
In Tanzania, dairy cattle production system consists of three sub-sectors i.e., traditional cow-meat-milk, improved smallholder dairy, and commercial dairy farms [26]. The production system in Tanga region is predominantly mixed crop-livestock system, involving cut and carry stallfeeding of fodder, forage, maize and bean crop residues and supplementation of agro-industrial-by-products [50]. The smallholder dairy farmers keep small herds, fewer than ten heads of dairy cattle per household, comprised of Holstein-Friesian and Ayrshire and their crosses [50]. These dairy cattle breeds are predominant in the smallholder farms in Tanzania, especially in Tanga region[50]. Among the dairy cattle breeds, the Holstein breed is popular among dairy farmers in Tanzania due to its high milk production potential. However, the potential of Holstein cows to emit body heat by skin evaporation is reduced in hot and humid environments. Therefore, Holstein cows are at a greater risk of facing heat stress (HS) [64]. In recent years, dairy cattle farmers in Tanga region have regarded increase in temperature due to climate change as the main problem causing low productivity and profitability of dairy cattle [48].
Tanzania is currently experiencing the negative impacts of climate change characterized by an average annual increase in temperature of 1.0oC since 1960 and average decrease in rainfall of 2.8 mm per month and 3.3% per decade [25]. Increase in ambient temperature, relative humidity, wind speed, and solar radiation above a dairy cattle thermal neutral zone causes HS [3,44]. Heat stress is a condition in which dairy cattle become unable to dissipate the heat load generated by their body metabolism and the environment, thereby failing to maintain their body thermal balance [6,12,61]. The thermoneutral zone for Bos taurus dairy cattle breeds typically ranges from 0.50C to 200C [19,20]. Exposure of dairy cattle to high ambient temperature and relative humidity alters numerous physiological responses in order to maintain homeostasis [16]. When physiological mechanisms fail to counterbalance the excessive heat load, dairy cattle suffer from HS effects [10,11,51]. This is associated with a decline in feed intake, increased water consumption, decline in milk yield [37], alteration in milk composition and physiological parameters such as respiratory rate (RR), rectal temperature (RT), core body temperature (CBT) and panting score (PS) [8,40,43,56]. Reduction in milk yield due to an increase in temperature-humidity index (THI) values has been reported by [43] and [60]. [43] reported a decline of 0.009 kg and 0.012 kg in milk protein and milk fat percentages, respectively, at a THI threshold above 72 for US Holstein dairy cattle. In the Mediterranean climate in Tunisia, [10] reported a milk yield decline of 21% for Holstein Friesian dairy cattle. In Kenya, [32] reported that the average milk production loss was -0.29, -0.19, and -0.37kg/THI unit per day for the first, second, and third lactation, respectively for Holstein Friesian, Jersey, and Guernsey breeds. In Rwanda, [38] reported that THI had a negative effect on daily milk production with a decline of -0.11kg milk/THI unit at most.
The temperature-humidity index has proven to be a useful tool to measure the effects of HS in dairy cattle as it uses air temperature and relative humidity with different weighting scales in animals [12,21,27]. Other climatic indices developed to investigate the degree of HS in dairy cattle include adjusted THI, heat load index, thermal stress index, equivalent temperature index, and dairy heat load index [33]. However, these environmental indices defined in the literature have remained largely unexplored in genetic evaluation studies, and THI continues to be the most popular indicator of HS in dairy cattle [21,33]. The THI values are generally divided into classes depending on the severity of HS in dairy cattle [33]. For instance, [3] classified THI ˂ 72 as comfort, 72 ˂ THI ˂ 79 as mild stress, 80 ˃ THI ˂ 89 as moderate stress, and THI ˃ 90 as severe stress. However, THI thresholds for dairy cattle comfort zone vary depending on production status, acclimatization level, pregnancy status, diet, and climatic conditions such as wind speed, solar radiation, and relative humidity [19].
Identification of HS thresholds is crucial as they can be used to monitor lactating dairy cattle welfare and execute potential mitigation strategies to HS [13], especially in sub-Saharan climates where lactating dairy cattle are exposed to extreme ambient temperature and relative humidity [24]. Dairy cattle in many parts of sub-Saharan Africa are routinely subjected to high ambient temperature and relative humidity. However, information on the effect of HS on milk production, milk composition, physiological traits, and income losses to farmers under sub-Saharan climatic conditions is very limited [16]. Moreover, the relationship between dairy cattle genotypes and responses to HS has not been established under the smallholder dairy cattle production system in sub-Saharan countries [16,51]. The objectives of this study were to investigate the effects of HS as measured by temperature-humidity index (THI) on physiological parameters, milk yield and milk composition of lactating Holstein Friesian dairy cattle crosses reared in the eastern coast of Tanzania. In addition, the study assessed the relationships between THI and physiological parameters, milk yield, and milk composition parameters.

2. Materials and Methods

2.1. Study Site

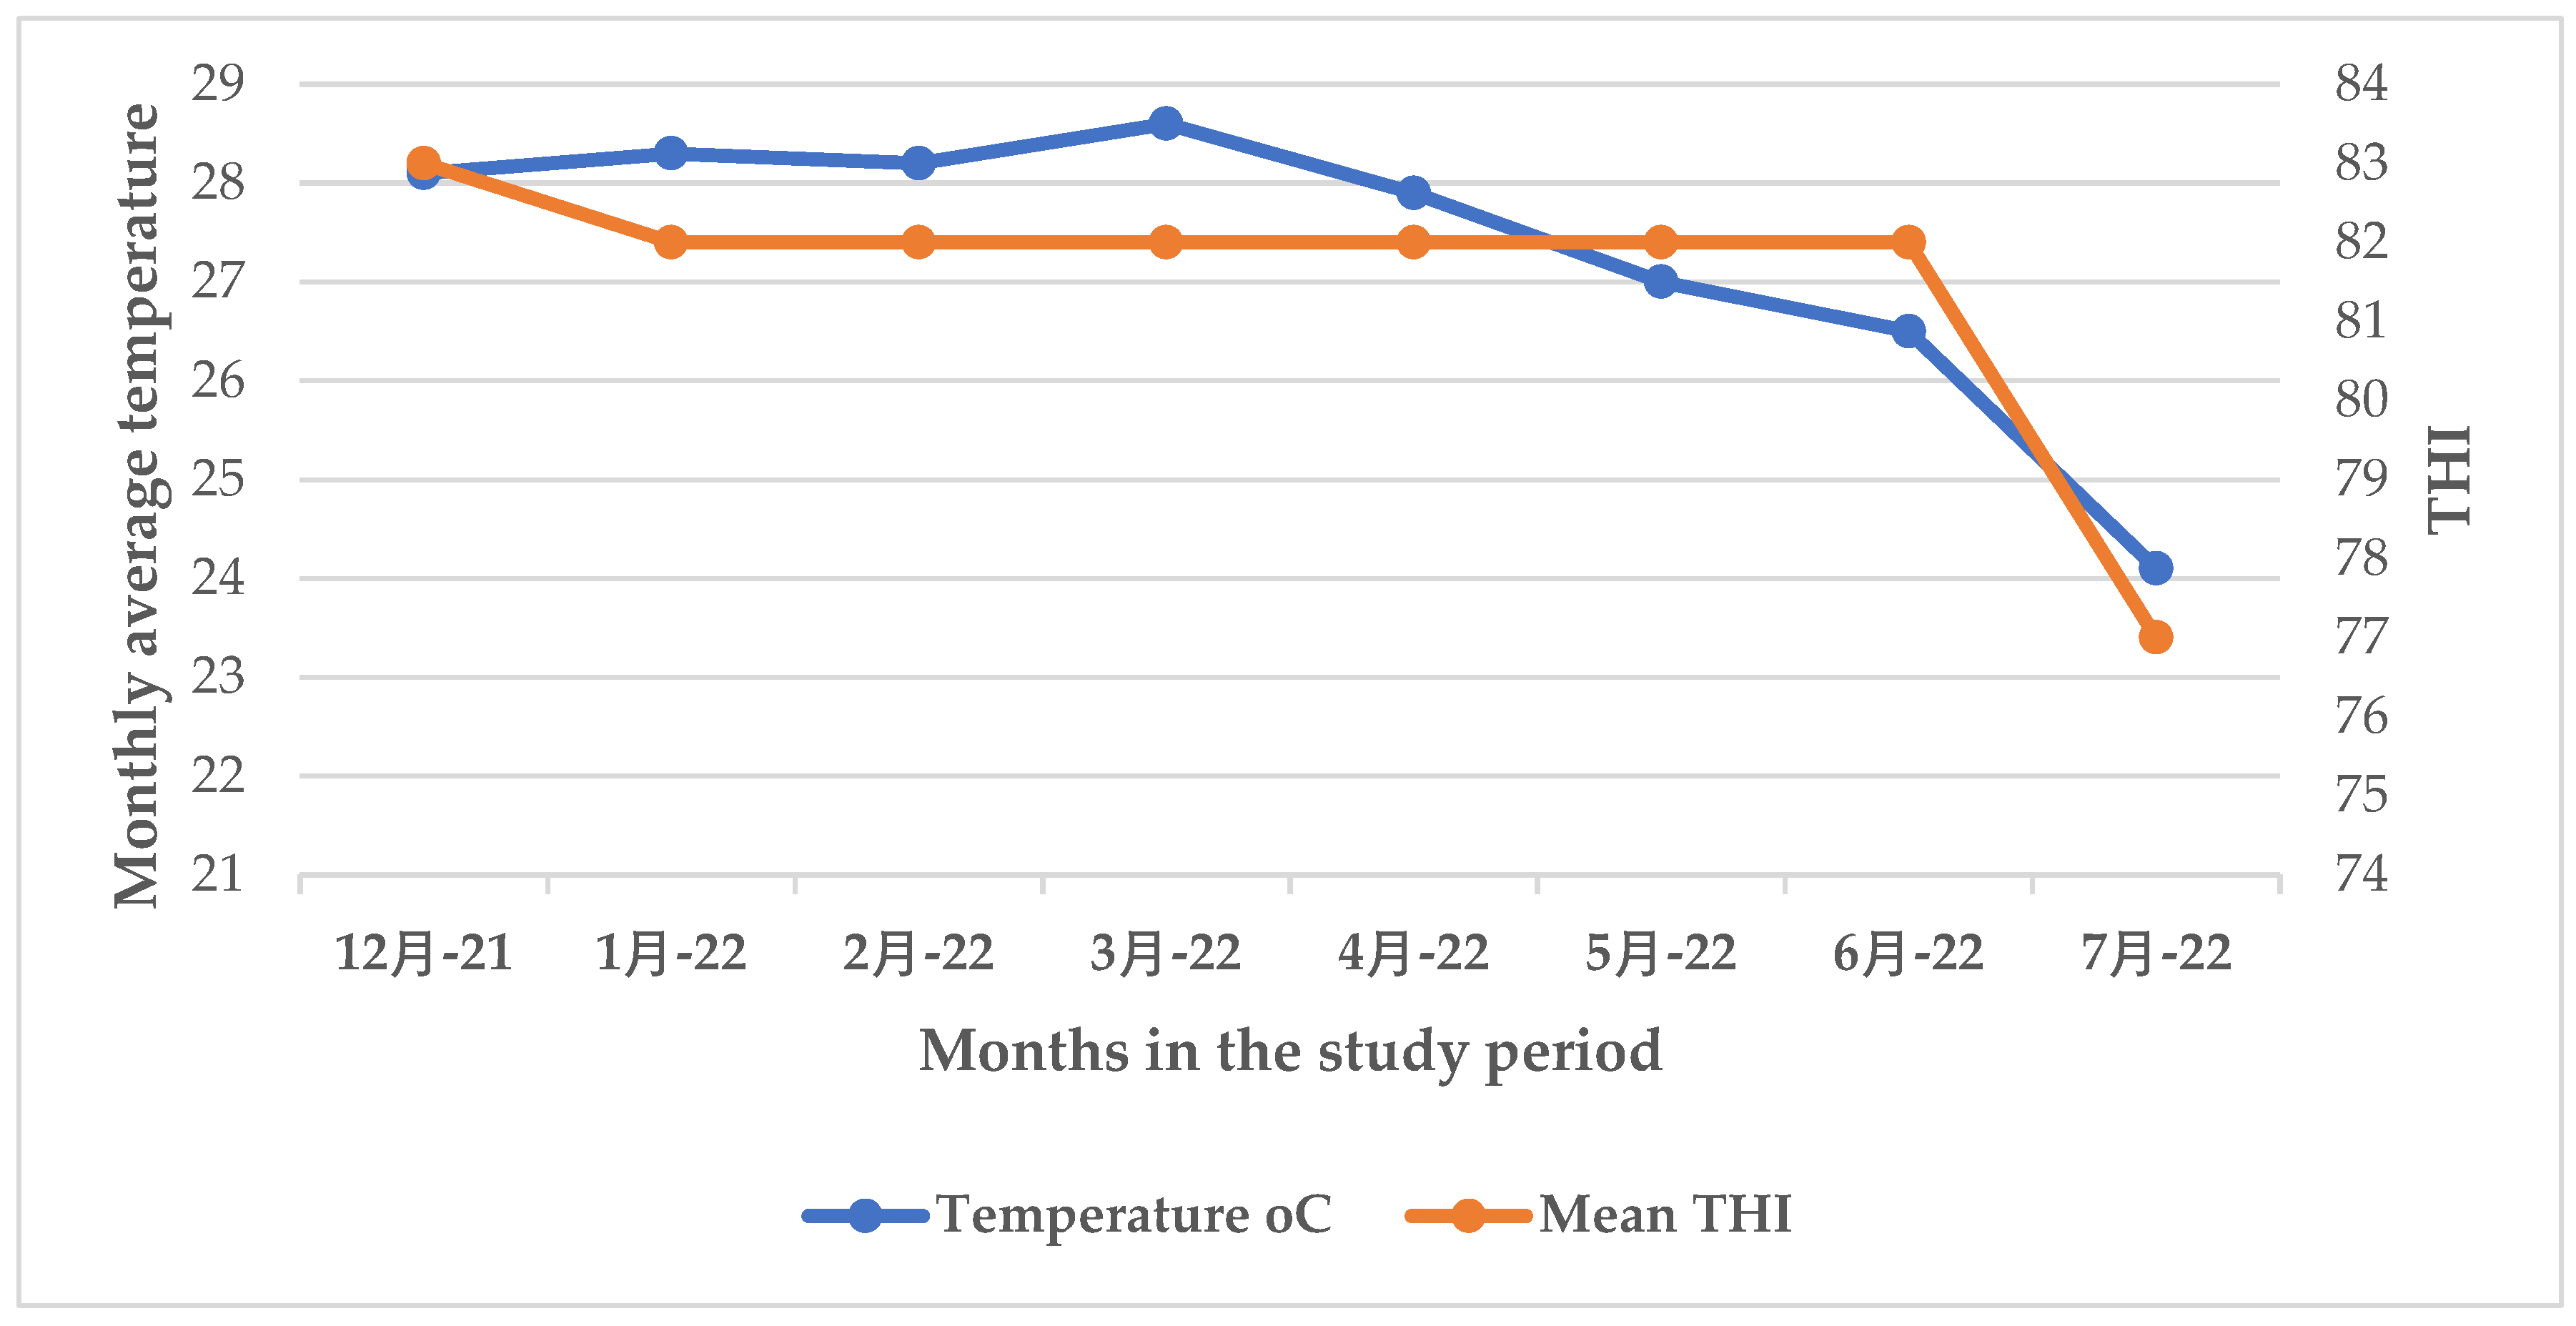
This study was conducted at the Tanzania Livestock Research Institute (TALIRI) - Tanga dairy cattle farm located in Tanga municipality. The institute is situated at 50S and 390E at an altitude of 6 m above sea level and 6 km inland from the Indian Ocean. The Tanga region is located in the eastern coastal lowlands of Tanzania. The region covers 26,680 km2 and lies between latitude 4.965088o S and 5.5743o S and longitude 38.2744o E and 38.7787 o E [47]. The coastal lowland has high temperatures and humidities as well as high heat load with THI reaching above 77.29 in the hot season [50]. Additionally, annual rainfall in the area ranges from 1230 to 1400 mm, falling in two seasons with peaks occurring during April - May and October - November. The mean temperature in cool months (between May and August) is about 20 – 24 ◦C and 23 – 28 ◦C during the night and day, respectively. The mean temperature ranges between 260C and 330C, with January and February being the hottest months of the year. The atmospheric humidity of the region ranges between 65% and 100% [34]. Figure 1 shows the mean temperature and THIs during the recording months in hot and cool seasons.

2.2. Animal Selection, Management and Experimental Design

This study was conducted from 1st January 2022 to 28th February 2022 (hot season) and 1st June up to 31st July 2022 (cool season) (Figure 1). TALIRI Tanga dairy farm was purposely selected as it is located in the eastern lowlands where the temperatures and humidity are high and the institute has facilities that are conducive for the research work. The farm keeps Holstein-Friesian crosses with 50 (HF50) and 75% (HF75) Friesian blood levels. A total of 29 lactating Holstein Friesian dairy cattle crosses were selected based on the following criteria: - the cow having two – four parities, being in the second to third month of lactation, freedom from lameness, and absence of any other signs of health disorders. Table 1 shows the number of animals used in this study for each genotype, parity and lactation month. The management practices for all experimental cows in the two seasons were similar. The cows were freely grazed with other cattle from 08:00 to 12:00 h and 17:00 to -18:30 h in a farm with approximatively 15 ha of natural pasture and Napier grasses. All experimental cows were supplemented with 1 kg of concentrate in the morning and 1 kg in the evening, making the total amount of concentrate provided per day to 2 kg during milking time. The ingredients and chemical composition of the concentrate diet supplemented to the dairy cows are shown in Table 2. The cows had access to drinking water at all times. The animals were weighed before the start of the experiment and at the end of the experiment.

2.3. Data Collection for Milk Yield and Milk Composition Parameters

Daily milk yield records and physiological parameters were collected in the morning and evening during milking time (04:00 - 06:00 h and 14:30 - 17:00 h). Dairy cows were milked through hand milking. The amount of milk produced by each cow was measured using calibrated milking cups immediately after milking in the morning and evening hours. For milk composition determination, a total of 50 ml of milk per cow was collected weekly on Monday morning and afternoon and put in the falcon tube and then stored in the cool box. The milk samples were analyzed for protein, fat, lactose, and solids–not-fat on the next day using a Lactoscan machine (Lactoscan MCC-K3051) [2]. The milk sample was placed at room temperature to yield best results. Briefly, before starting milk sample analyses, the milk analyzer was cleaned using warm water and 3% acidic solution (Lactoweekly cleaning solution) and again with the warm water. After cleaning the Lactoscan machine, the milk sample was placed in the tube where the machine was taking 25 ml of milk sample, and displays the milk parameter values after 1 min. The parameters analyzed using a Lactoscan machine include milk sample temperature, fat, protein, lactose, solids– not–fat percentages, density, added water, electrical conductivity, pH, and salt.

2.4. Data Collection for Physiological Parameters

Data recorded for physiological traits included core-body temperature (CBT), respiration rate (RR), rectal temperature (RT) and panting score (PS), which were collected every day between 04: 00 h and 06:00 h and between 14:30 h and 17:00 h. The CBT was measured using a digital infrared thermometer at the site located 20 cm below the vertebral column of the animal. Respiration rates were collected in seconds and were taken from standing cows to make 5 flank movements [4,5,40]. The RR were obtained by counting twice the number of breaths in the flank region for a period of 15 seconds. The average values were multiplied by four to obtain the number of breaths per minute. Respiration rate was only recorded while the animal was standing (± ruminating). When the animal was performing other activities (walking, grazing, social, or grooming behavior), the counting was stopped. Determination of RR was done before milking at the milking parlor. The RT was measured using a veterinary digital thermometer inserted at 3 cm in the rectum for approximately 1 min. At the same time, the cows were observed in the morning and afternoon for signs of open mouth panting to determine the PS on a scale of zero to four (Table 3), where 0 = normal breathing, 1 = slightly panting, 2 = moderate panting, 3 = strong panting, and 4 = severe panting [31].

2.5. Calculation of Temperature Humidity Index

Climate data were obtained from the Tanga meteorological station located 500 m away from TALIRI Tanga dairy cattle farm. Table 4 shows the environmental conditions during the experimental periods. The data collected included daily maximum and minimum temperatures (◦C) and relative humidity (%). Daily THI was calculated using the equation of [39] which is considered as the most appropriate for the equatorial climate of Tanzania [16]; THI = (1.8 × Tmax + 32) − [(0.55 − 0.0055 × Rhmin) × (1.8 × Tmax − 26.8)], where Tmax is the maximum daily dry-bulb temperature (°C) and Rhmin is the minimum daily relative humidity (%). Each THI was computed using a 4- day average of daily maximum dry bulb temperature (Tmax) and minimum relative humidity (Rhmin) obtained from measures on the test day and 3 days prior to the test day as recommended by [16]. This range helps to determine the prolonged effects of HS on physiological and milk production parameters recorded on a particular day [16]. In this study, only the maximum daily THI was used in the analyses because milk yield traits and physiological parameters are more sensitive to the extreme values of the maximum THI relative to the daily average THI [7,40,55]. Moreover, the use of maximum daily THI has been recommended by [43] who indicated that combining daily temperature and humidity values from public weather stations to define THI shows a superior goodness of fit than other combinations under the hot and humid conditions. The computed daily THI values were categorized into three groups as follows: low (THI = 76 - 78), moderate (THI = 79 - 81), and high (THI = 82 - 84). These THI classes were grouped based on the mean and in accordance with the number of records for animals: (1) class A: THI≥76≤78 (no HS condition); (2) class B: THI≥79≤81 (moderate HS condition); and (3) THI≥82≤84 (severe HS condition).

2.6. Statistical Analysis

Data analysis was performed using SAS 9.2 statistical package (SAS, 2003). The effects of THI, genotype, parity, months of lactation, and their interactions were analyzed using PROC MIXED procedure of SAS 9.2. The statistical model included fixed effects for THI, genotype, parity, months of lactation, and the interactions between THI and genotype, parity, and months of lactation. The dependent variables were daily milk yield, milk composition (fat, protein, lactose and solids–not-fat), and physiological (CBT, RR, RT, and PS) parameters. The final mixed linear model for each parameter was as follow:
Yijklmnpr = μ + THIi + Gj + Pk + L + (THI*G) ij + (THI*P) ik + (THI*L) iℓ
where Yijkℓmnpr is the phenotypic records for milk yield or milk composition or physiological parameters, µ is the overall mean; THIi is the effect of the ithTHI class; Gj, Pk, L are the effects of genotype, parity and months of lactation, respectively; (THI*G)ij is the effect of interaction of the ith THI class and jthG; (THI*P)ik is the effect of the interaction of ithTHI class and kth parity; (THI*L)iℓ is the effect of the interaction of ithTHI class and ℓth months of lactation. The effects of season (hot and cool) and milking time (morning and afternoon) were confounded within THI. Thus, were removed from the model. For all models, the significance of the differences between pairs of means was tested using the Tukey-Kramer test and significance was declared at P ≤ 0.05. The PROC REG and PROC CORR procedures of SAS 9.2 were used to determine the linear, nonlinear relationship, and Pearson correlation coefficients between THI values and milk yield, milk composition, and physiological parameters to better evaluate the relationship between these parameters and THI.

3. Results

3.1. Effect of THI, Genotype, Parity, and Months of Lactation on Milk Yield and Milk Composition Parameters of Crossbred Dairy Cattle

In this study, THI, genotype, parity, and months of lactation had significant effect on milk yield, milk fat, protein, lactose, and solids–not fat percentage (P ˂0.05). Daily milk yield, fat, protein, lactose, and solids-not-fat percentages increased (P ˂0.05) slightly with increasing THI values from 76 to 78, remained fairly constant for the THI of 79 to 81, and declined for the THI of 82 – 84. In short, no decrease was observed at low THI value of 76 to 78 and there was a higher decrease at 82 to 84. In terms of milk composition, both average fat, protein, lactose, and solids– not-fat percentages significantly declined as THI increased. Regarding the genotype, the HF75 showed higher milk yield (3.55± 0.04 L/day) compared to HF50 (3.03± 0.04 L/day). However, the HF50 showed higher milk fat, protein, and lactose percentage compared with the HF75. In the present study, parity influenced milk yield and composition parameters such that daily milk yield declined (P<0.05) from 2nd to 3rd parity, followed by a sharp increase in the 4th parity. Milk fat, protein, lactose, and solids–not-fat percentages increased (P<0.05) from 2nd to 3rd parity, followed by a slight decline in the 4th parity. In short, 2nd parity dairy cattle showed higher milk yield compared with the 3rd parity dairy cattle whilst the reverse trend was observed on milk composition parameters. Similarly, the months of lactation also had significant effect on milk yield and composition parameters such that milk yield declined (P<0.05) from 2nd month (3.41±0.03 L/day) to 3rd month of lactation (3.09± 0.03 L/day) whilst milk fat, protein, lactose, and solids-not-fat percentages increased from 2nd to 3rd month of lactation (Table 5).

3.2. Effect of THI, Genotype, Parity, and Months of Lactation on Physiological Parameters of Crossbred Dairy Cattle

In this study, THI, genotype, parity, and months of lactation month had a significant effect on physiological parameters (P ˂0.05). There was a small increase in physiological parameters at low THI values of 76 to 78, whilst a higher increase in these parameters was observed at high THI values of 82 to 84. Generally, when THI ranged from 76 to 78 and 77 to 81, dairy cattle had low to moderate HS as indicated by all physiological parameters. Dairy cattle respired significantly faster (72.78± 0.29 breaths/min) and panted relatively more frequently (1.46±0.01) when the THI values ranged from 82 to 84. The average CBT and RT of lactating Holstein Friesian cows followed a similar trend, with significantly higher RT and CBT recorded when THI was above 82 - 84.
Regarding the genotype, the both HF50 and HF75 showed similar increase in all physiological parameters (Table 6). In the present study, parity also influenced physiological parameters such that these parameters declined (P<0.05) slightly from 2nd to 3rd parity. In short, dairy cattle in the 3rd parity showed a small increase in CBT, RT, RR, and PS compared with the 2nd and 4th parity dairy cattle. However, the 4th parity dairy cattle showed a higher increase in all the physiological parameters compared with the 2nd and the 3rd parity dairy cattle. Generally, both dairy cattle in the 2nd month and 3rd month of lactation showed similar increase in the physiological parameters. The months of lactation also influenced physiological parameters such dairy cattle in the 3rd month of lactation showed a slightly higher increase in CBT, RT, and RR compared with dairy cattle in the 2nd month of lactation (P<0.05) (Table 6).

3.3. Effect of Interaction of Genotype and THI on Milk Yield, Milk Composition, and Physiological Parameters of Dairy Cattle

The effect of genotype and THI interactions were significant for milk yield and milk composition parameters (Table 7). The HF75 dairy cattle showed a decline in milk yield from 3.53±0.10 to 3.45±0.05 L/day when THI increased from low (76-78) to high (82-84) THI values. In contrast, the HF50 dairy cattle showed an increase in milk yield from 2.68±0.08 L/ day to 3.58±0.04 L/ day as THI increased from low to high THI values. For both HF50 and HF75, milk fat content slightly increased when the THI increased from low (76-78) to high (82-84) THI values, but the increase in milk fat content was larger in HF75 than in HF50. Moreover, protein, lactose, and solids – not - fat percentages increased (P<0.05) for both HF50 and HF75 dairy cattle when THI values ranged from low to moderate THI, then slightly declined at the same rate when THI changed from moderate to high THI values.
Regarding physiological parameters, both HF50 and HF75 dairy cattle showed slightly increase (P<0.05) in all physiological parameters as THI increased from low to high THI. The HF50 dairy cattle respired and panted at significantly higher rate at moderate (62.97±0.41 breaths/min) and high THI (72.72±0.40 breaths/min) compared with HF75, which showed 62.29±0.43 breaths/min at moderate THI and 72.52±0.41 breaths/min at high THI. Overall, HF50 and HF75 indicated similar HS patterns for physiological parameters as THI values increased from low to high THI thresholds (Table 7).

3.4. Effect of Parity and THI on Milk Yield, Milk Composition, and Physiological Parameters of Dairy Cattle

The effect of parity and THI interactions on milk yield, milk composition, and physiological parameters were significant (Table 8). Dairy cattle in the 4th parity showed higher milk yield per day (3.66±0.13 L/day and 3.58±0.06 L/day) compared to cows in the 2nd parity (3.08±0.09 L/day and 3.38±0.05 L/day) and cows in the 3rd parity (2.84±0.12 L/day and 2.61±0.06 L/day) at the THI values of 76-78 and 79-81, respectively. Generally, dairy cattle in the 3rd parity showed low milk yield per day compared to those in the 4th and 2nd parity. Furthermore, dairy cattle in the 4th parity had higher milk fat content (2.70±0.16%) compared to cows in the 2nd parity (2.66±0.11% and 2.83±0.07%) and 3rd parity cows (2.65±0.14% and 2.87±0.09%) at the THI values of 76 - 78 and 79 – 8, respectively. Nevertheless, dairy cattle in the 2nd and 3rd parity had similar contents of milk protein, milk lactose, and milk solids – not - fat, and similar reduction patterns were observed when THI increased from moderate (79 - 81) to high (82 – 84) THI values whilst dairy cattle in the 4th parity showed a slightly increase in all the milk composition parameters as THI increased from low to high THI values.
Regarding physiological parameters, dairy cattle in the 3rd parity respired significantly faster (74.04±0.36 breaths/min) and panted relatively more frequently (1.48±0.02) compared to cows in the 2nd parity, which showed a RR of 73.09±0.31 breaths/min and a PS of 1.46±0.01 at THI thresholds of 82 - 84 (Table 8).

3.5. Effect of Months of Lactation and THI on Milk Yield, Milk Composition, and Physiological Parameters of Dairy Cattle

Dairy cattle in the 2nd and 3rd month of lactation showed slightly increase (P<0.05) in milk yield as THI values increased from low to high THI values. Dairy cattle in the 2nd month of lactation also showed high milk yield per day (3.38±0.04 L/day and 3.87±0.05 L/day) compared to 3rd month of lactation dairy cattle (3.25±0.07 L/day and 3.18±0.06 L/day), respectively at moderate to high THI thresholds. However, dairy cattle in the 3rd month of lactation showed higher milk fat content (2.66±0.15% and 2.79±0.10%) compared to 2nd month of lactation dairy cattle (2.62±0.08% and 2.78±0.05%) at THI values of 76-78 and 79-81, respectively. Both 2nd and 3rd month of lactation dairy cattle showed similar patterns of increase (P<0.05) in protein, lactose, and solids – not - fat percentages from low to moderate THI values, also with similar reduction patterns when THI thresholds increased from moderate to high THI values (Table 9).
Regarding physiological parameters, both dairy cattle in the 2nd and 3rd month of lactation showed similar patterns of increase in all physiological parameters. Dairy cattle respired more frequently with 71.47±0.42 breaths/min and 73.66±0.41 breaths/min in the 2nd and 3rd month of lactation at THI of 82 - 84, respectively. There also indicated slight panting score of 1.44±0.02 in the 2nd month and 1.48±0.02 in the 3rd month of lactation at THI value of 82-84 (Table 9).

3.6. Pearson Correlation Coefficients between THI, and Milk Yield, Milk Composition, and Physiological Parameters

In this study, milk yield (r = 0.24, P <0.0001) and fat % (r = 0.15, P ≤0.05) were positively correlated with THI. However, milk protein % (r = -0.15, P ≤0.05), milk lactose (r = -0.13, P ≤0.05), and milk solids – not – fat percentages (r = -0.14, P ≤0.05) were negatively correlated with THI. On the other hand, the milk composition parameters showed a highly positive correlation across themselves (Table 10). Furthermore, a highly significant positive correlation between THI and all the physiological parameters was observed. The CBT (r = 0.67, P <0.0001), RT (r = 0.63, P <0.0001), and RR (r = 0.63, P <0.0001) were highly positively correlated with THI whilst the PS (r = 0.16, P <0.0001) showed low positive correlation with THI (Table 11).

3.7. Relationship between THI and Milk Yield and Composition Parameters

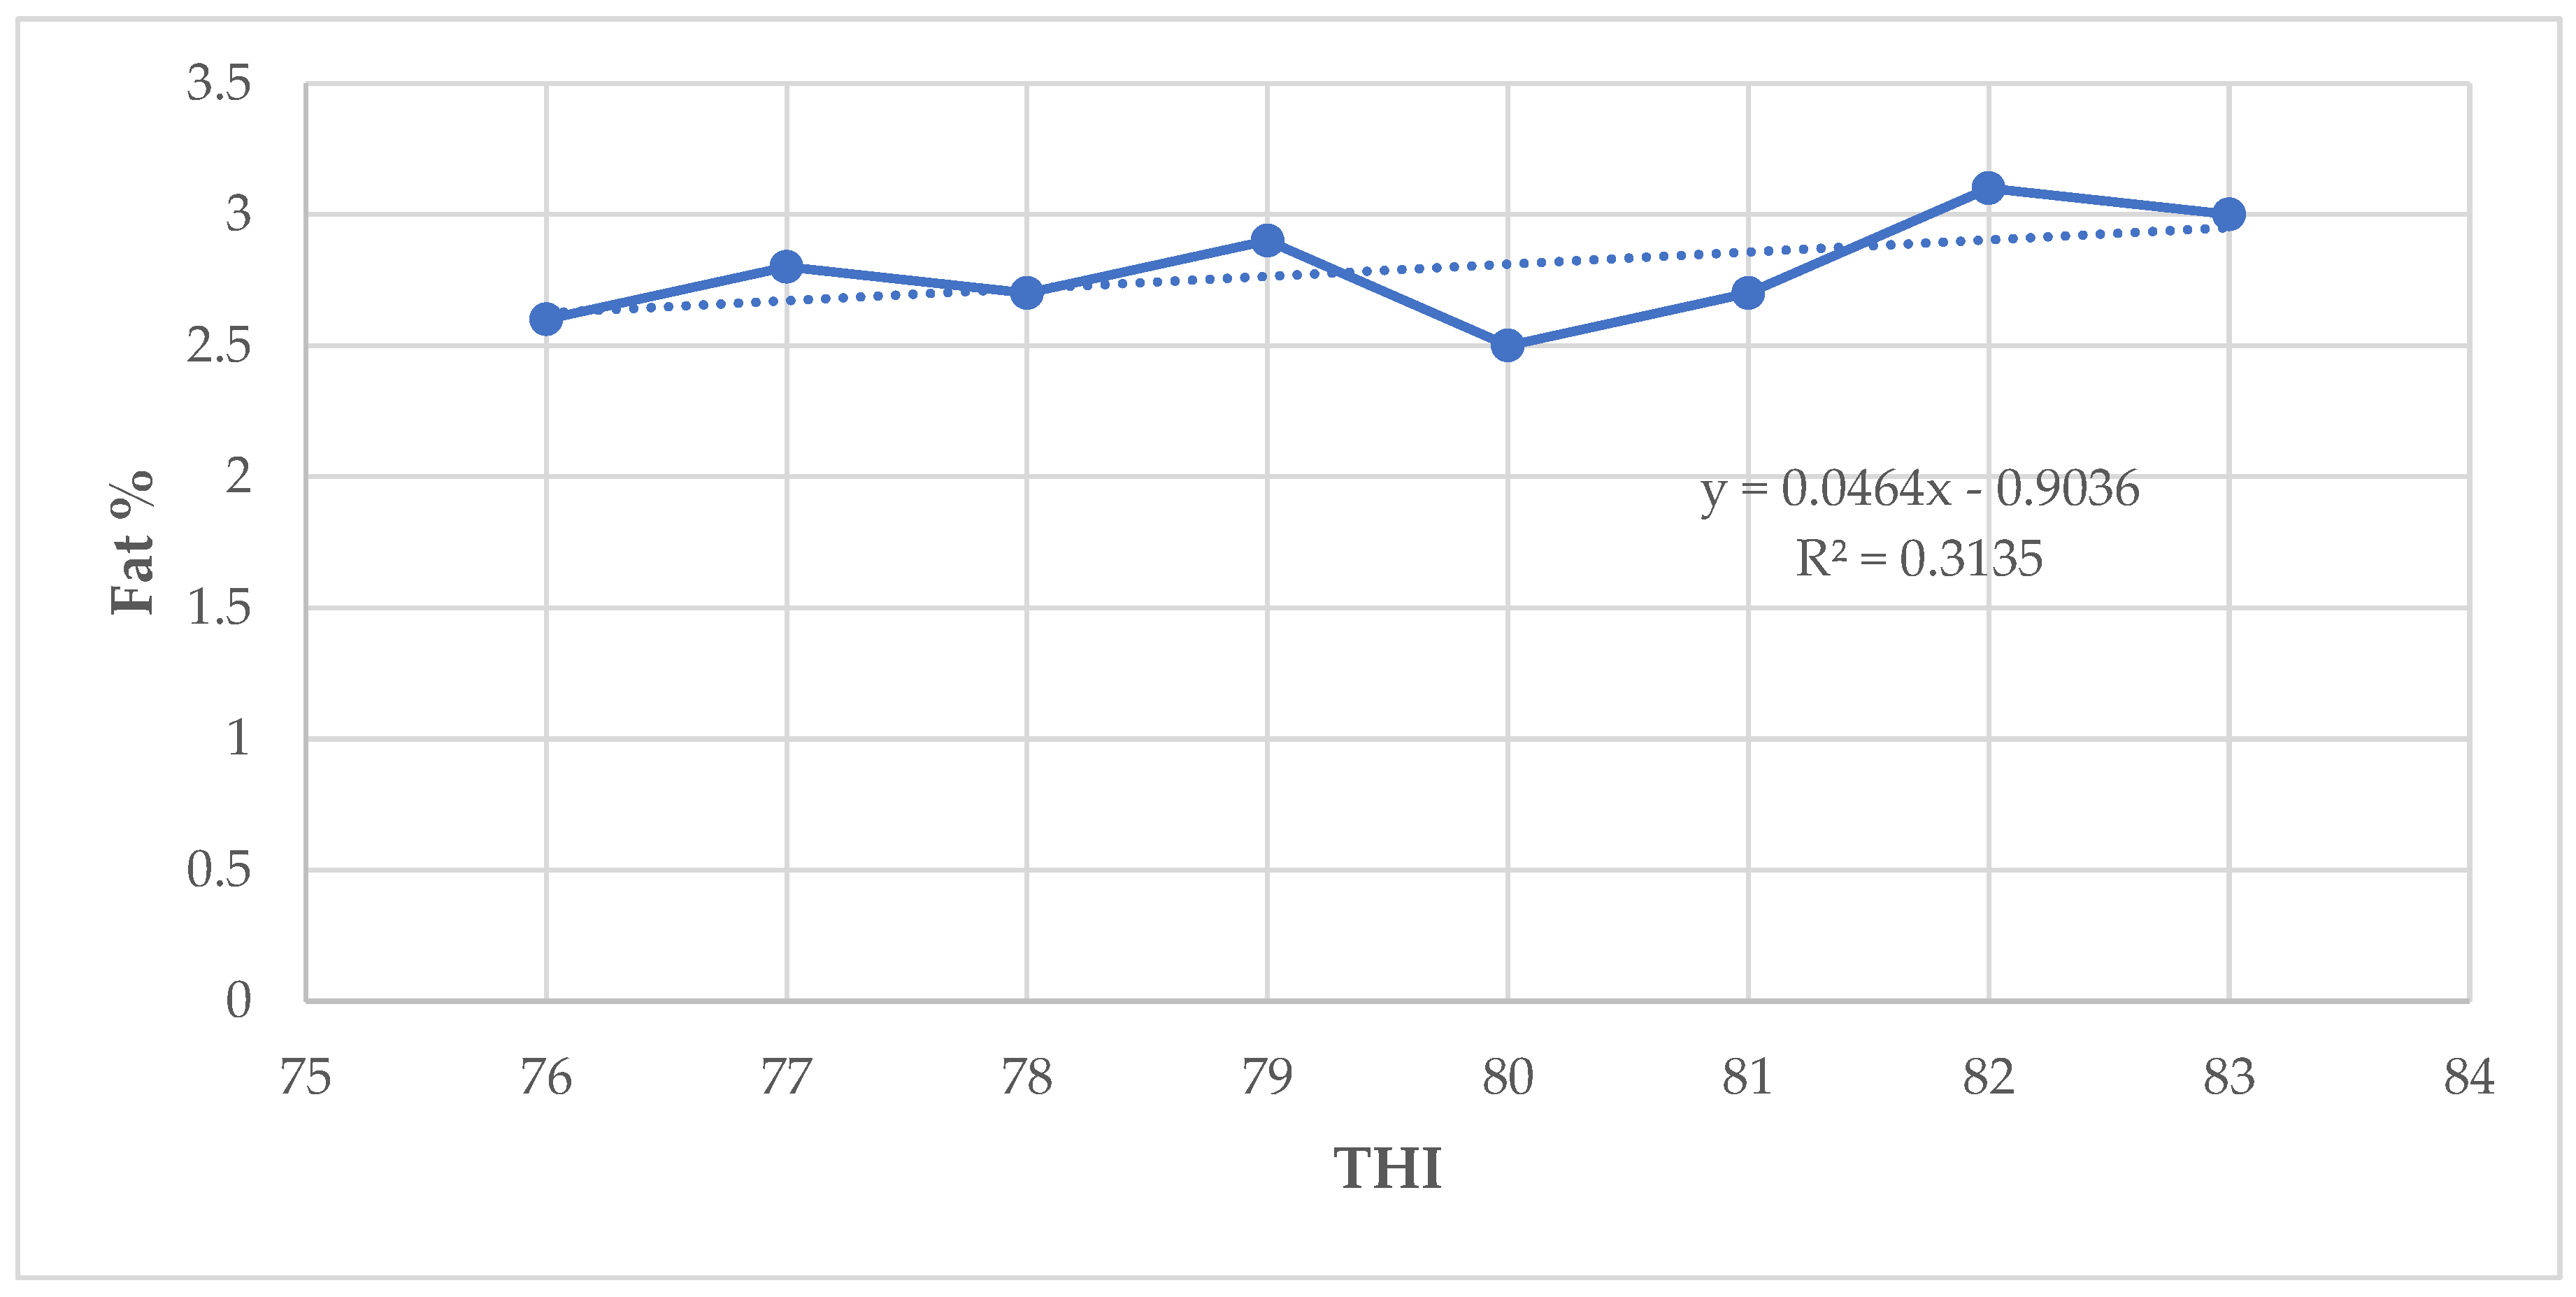
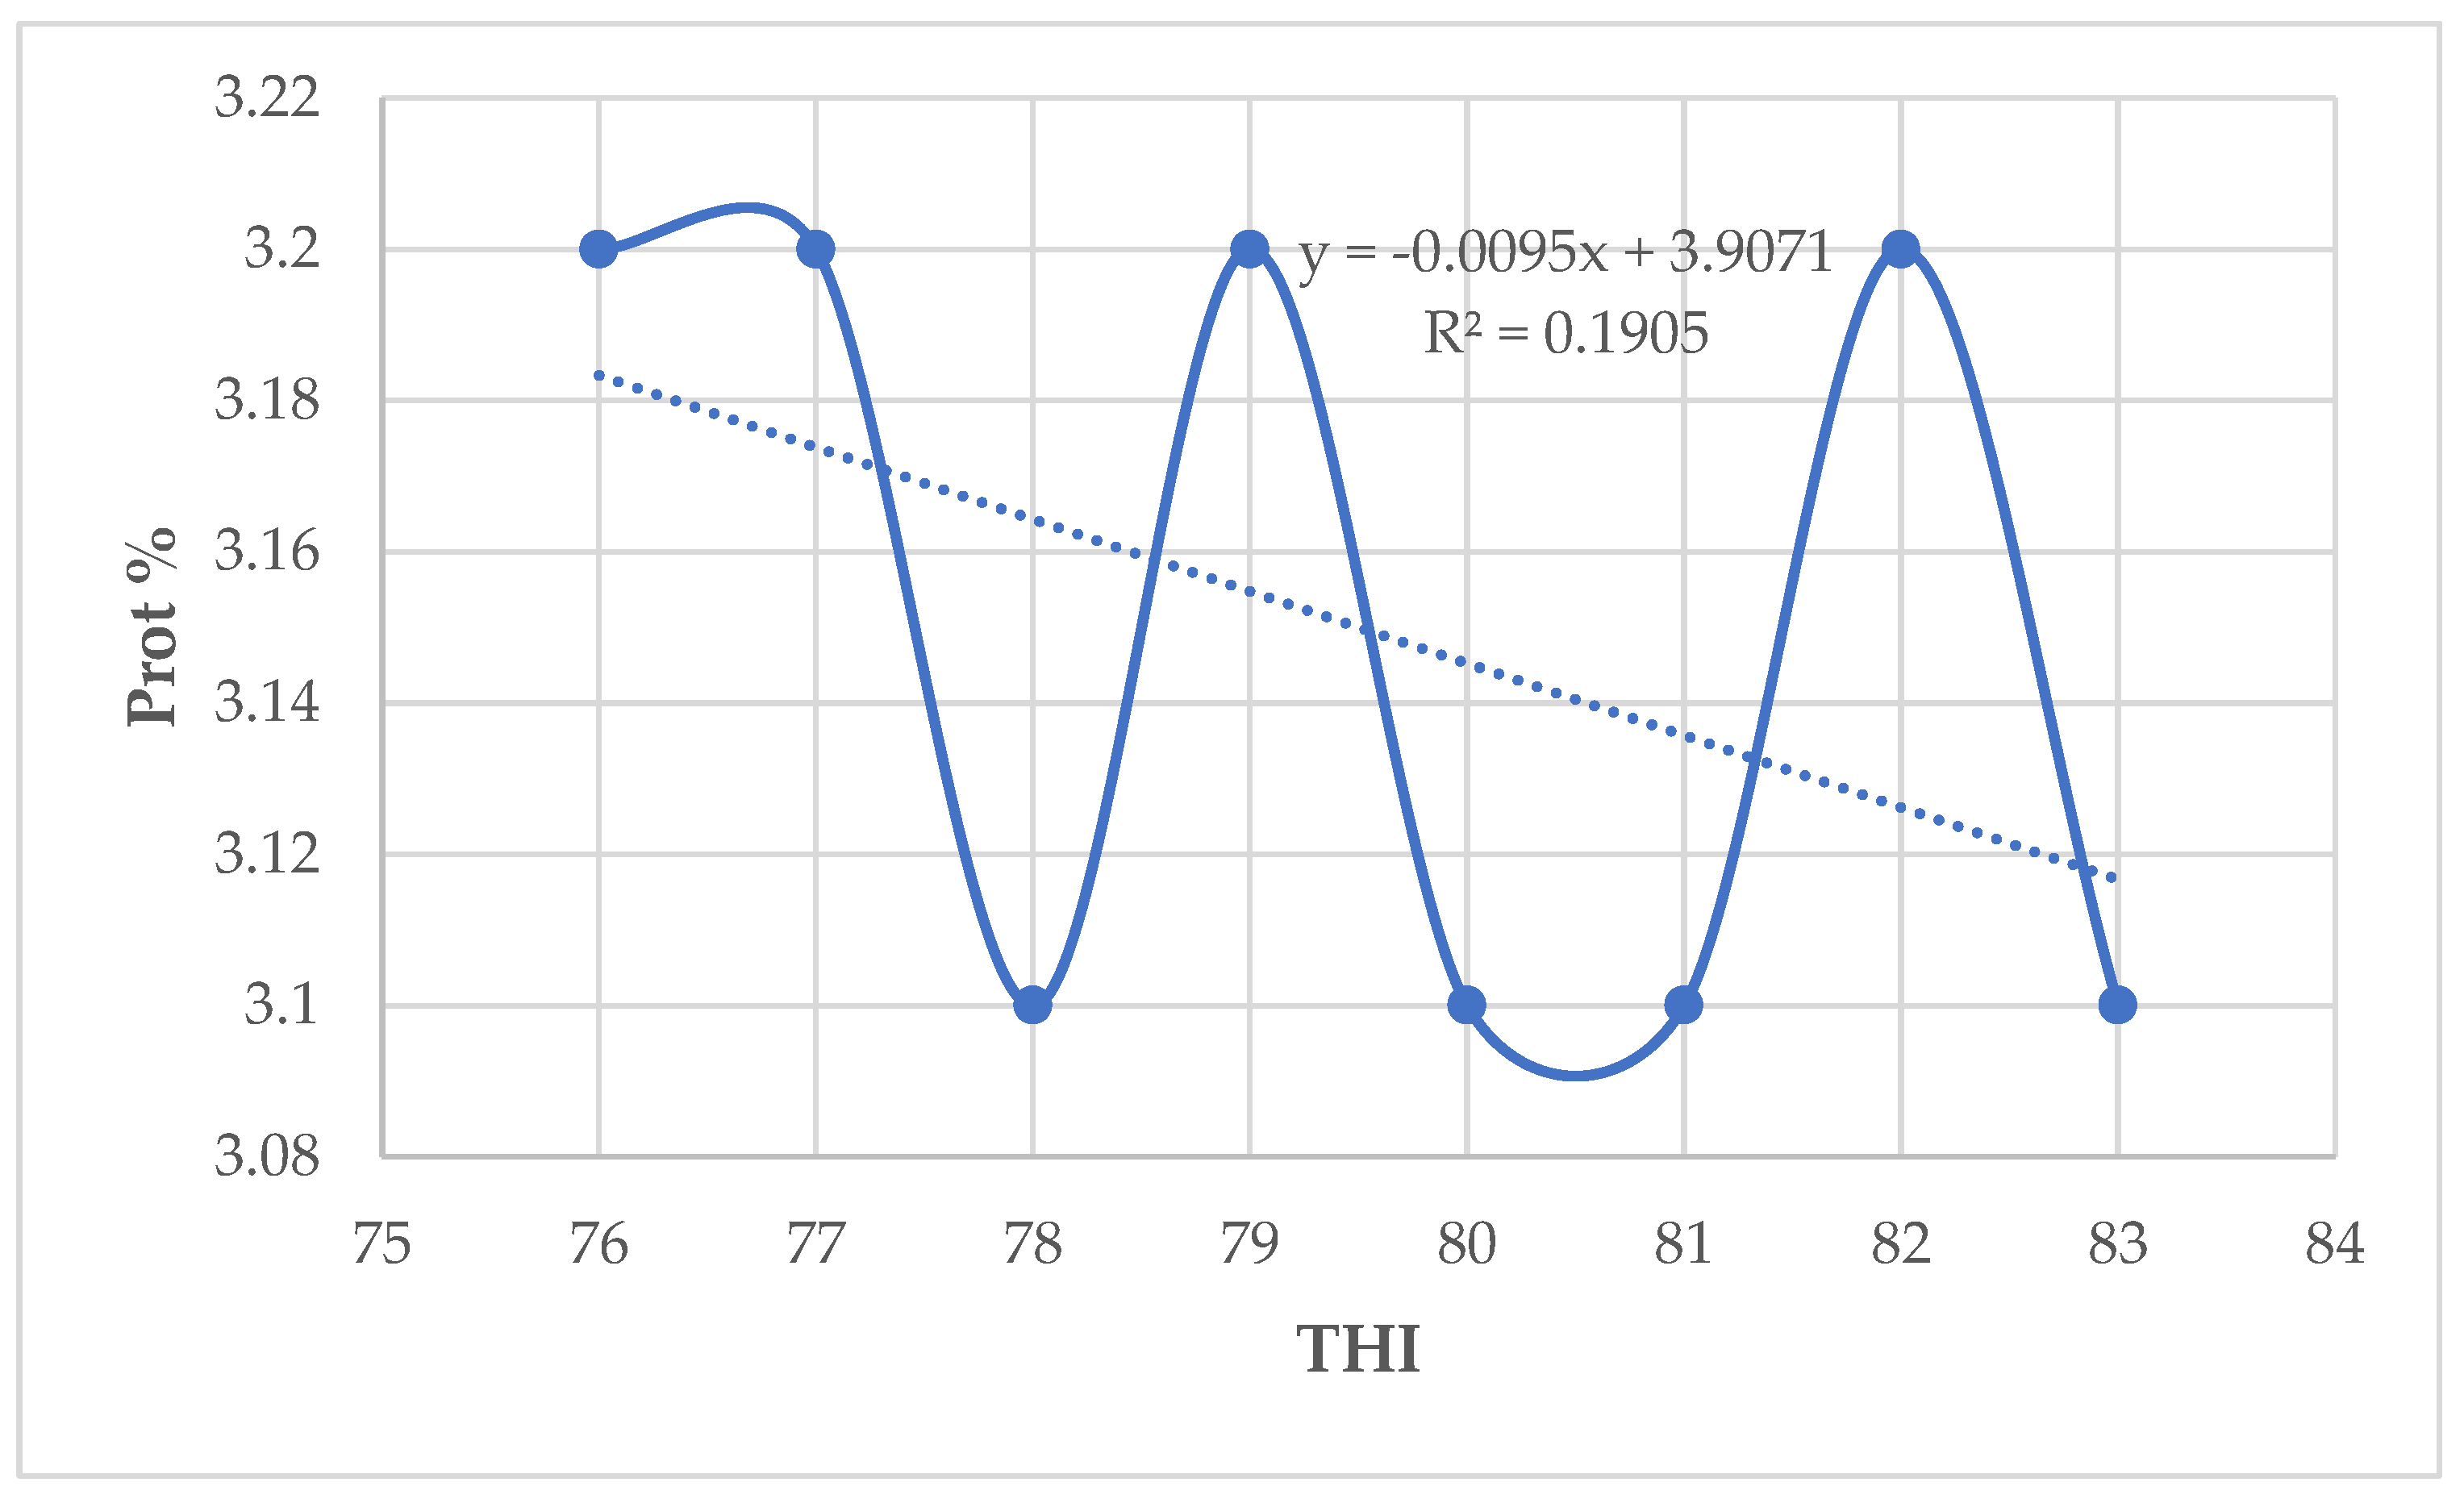
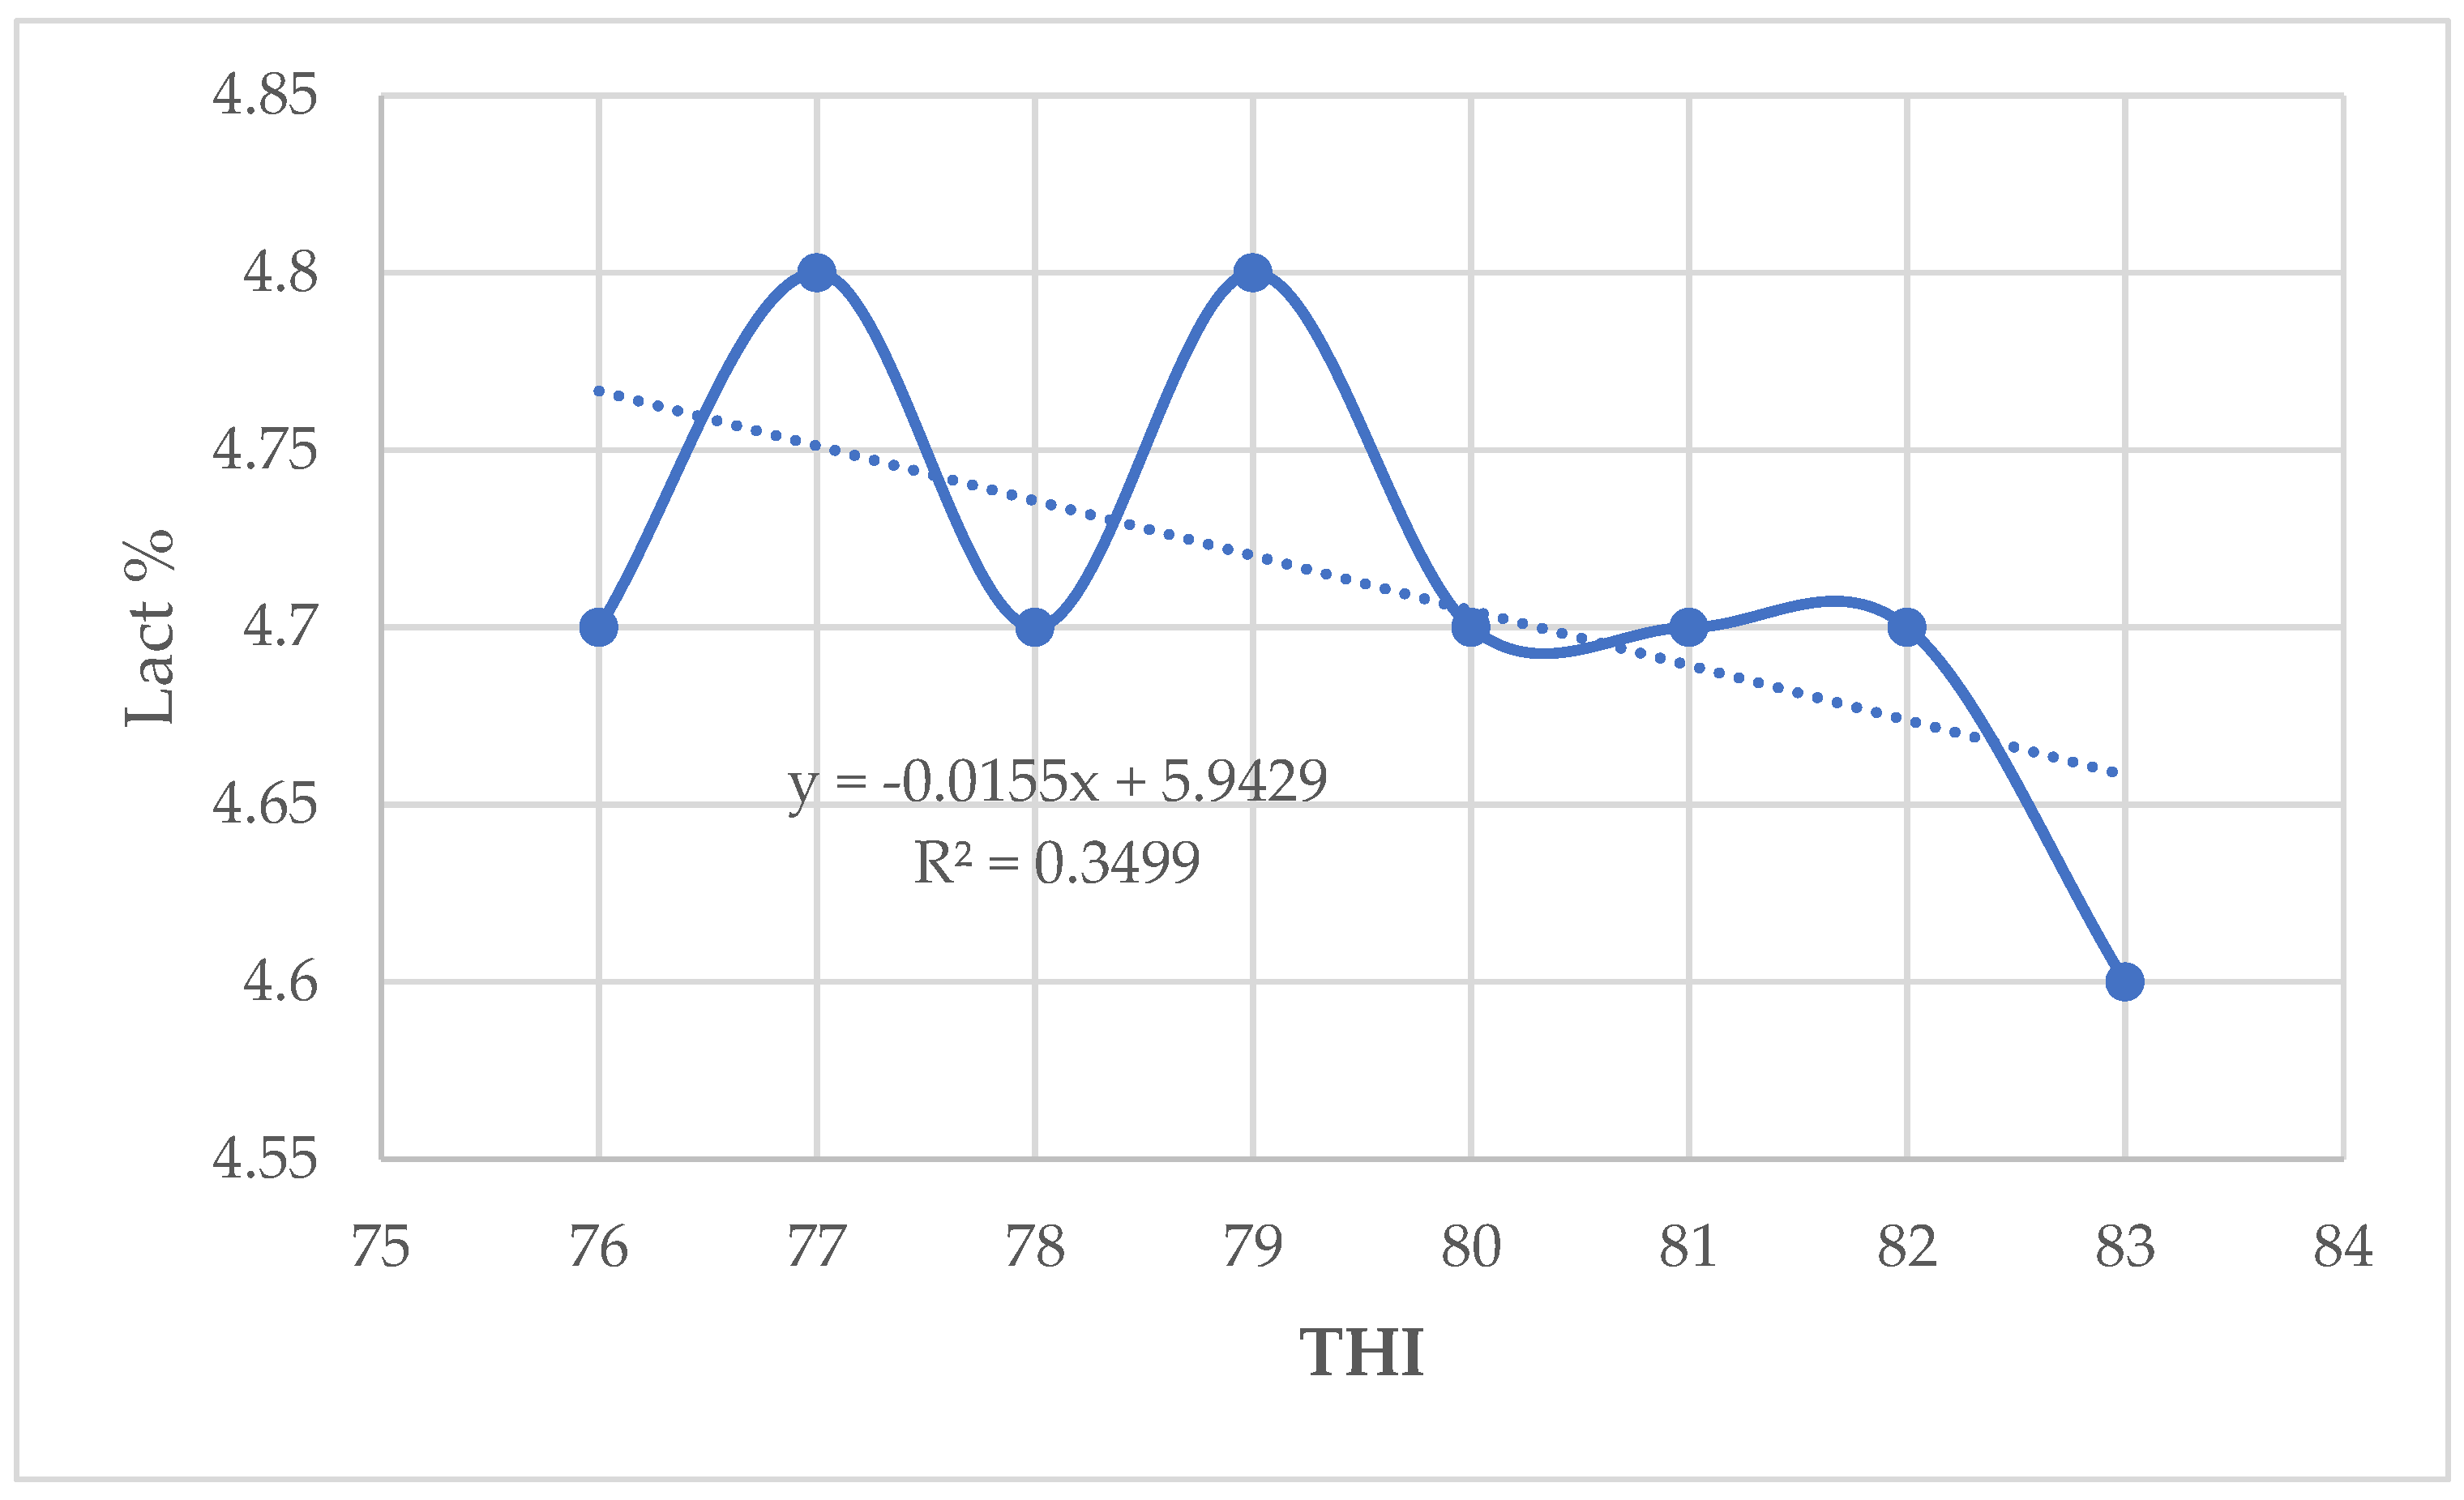
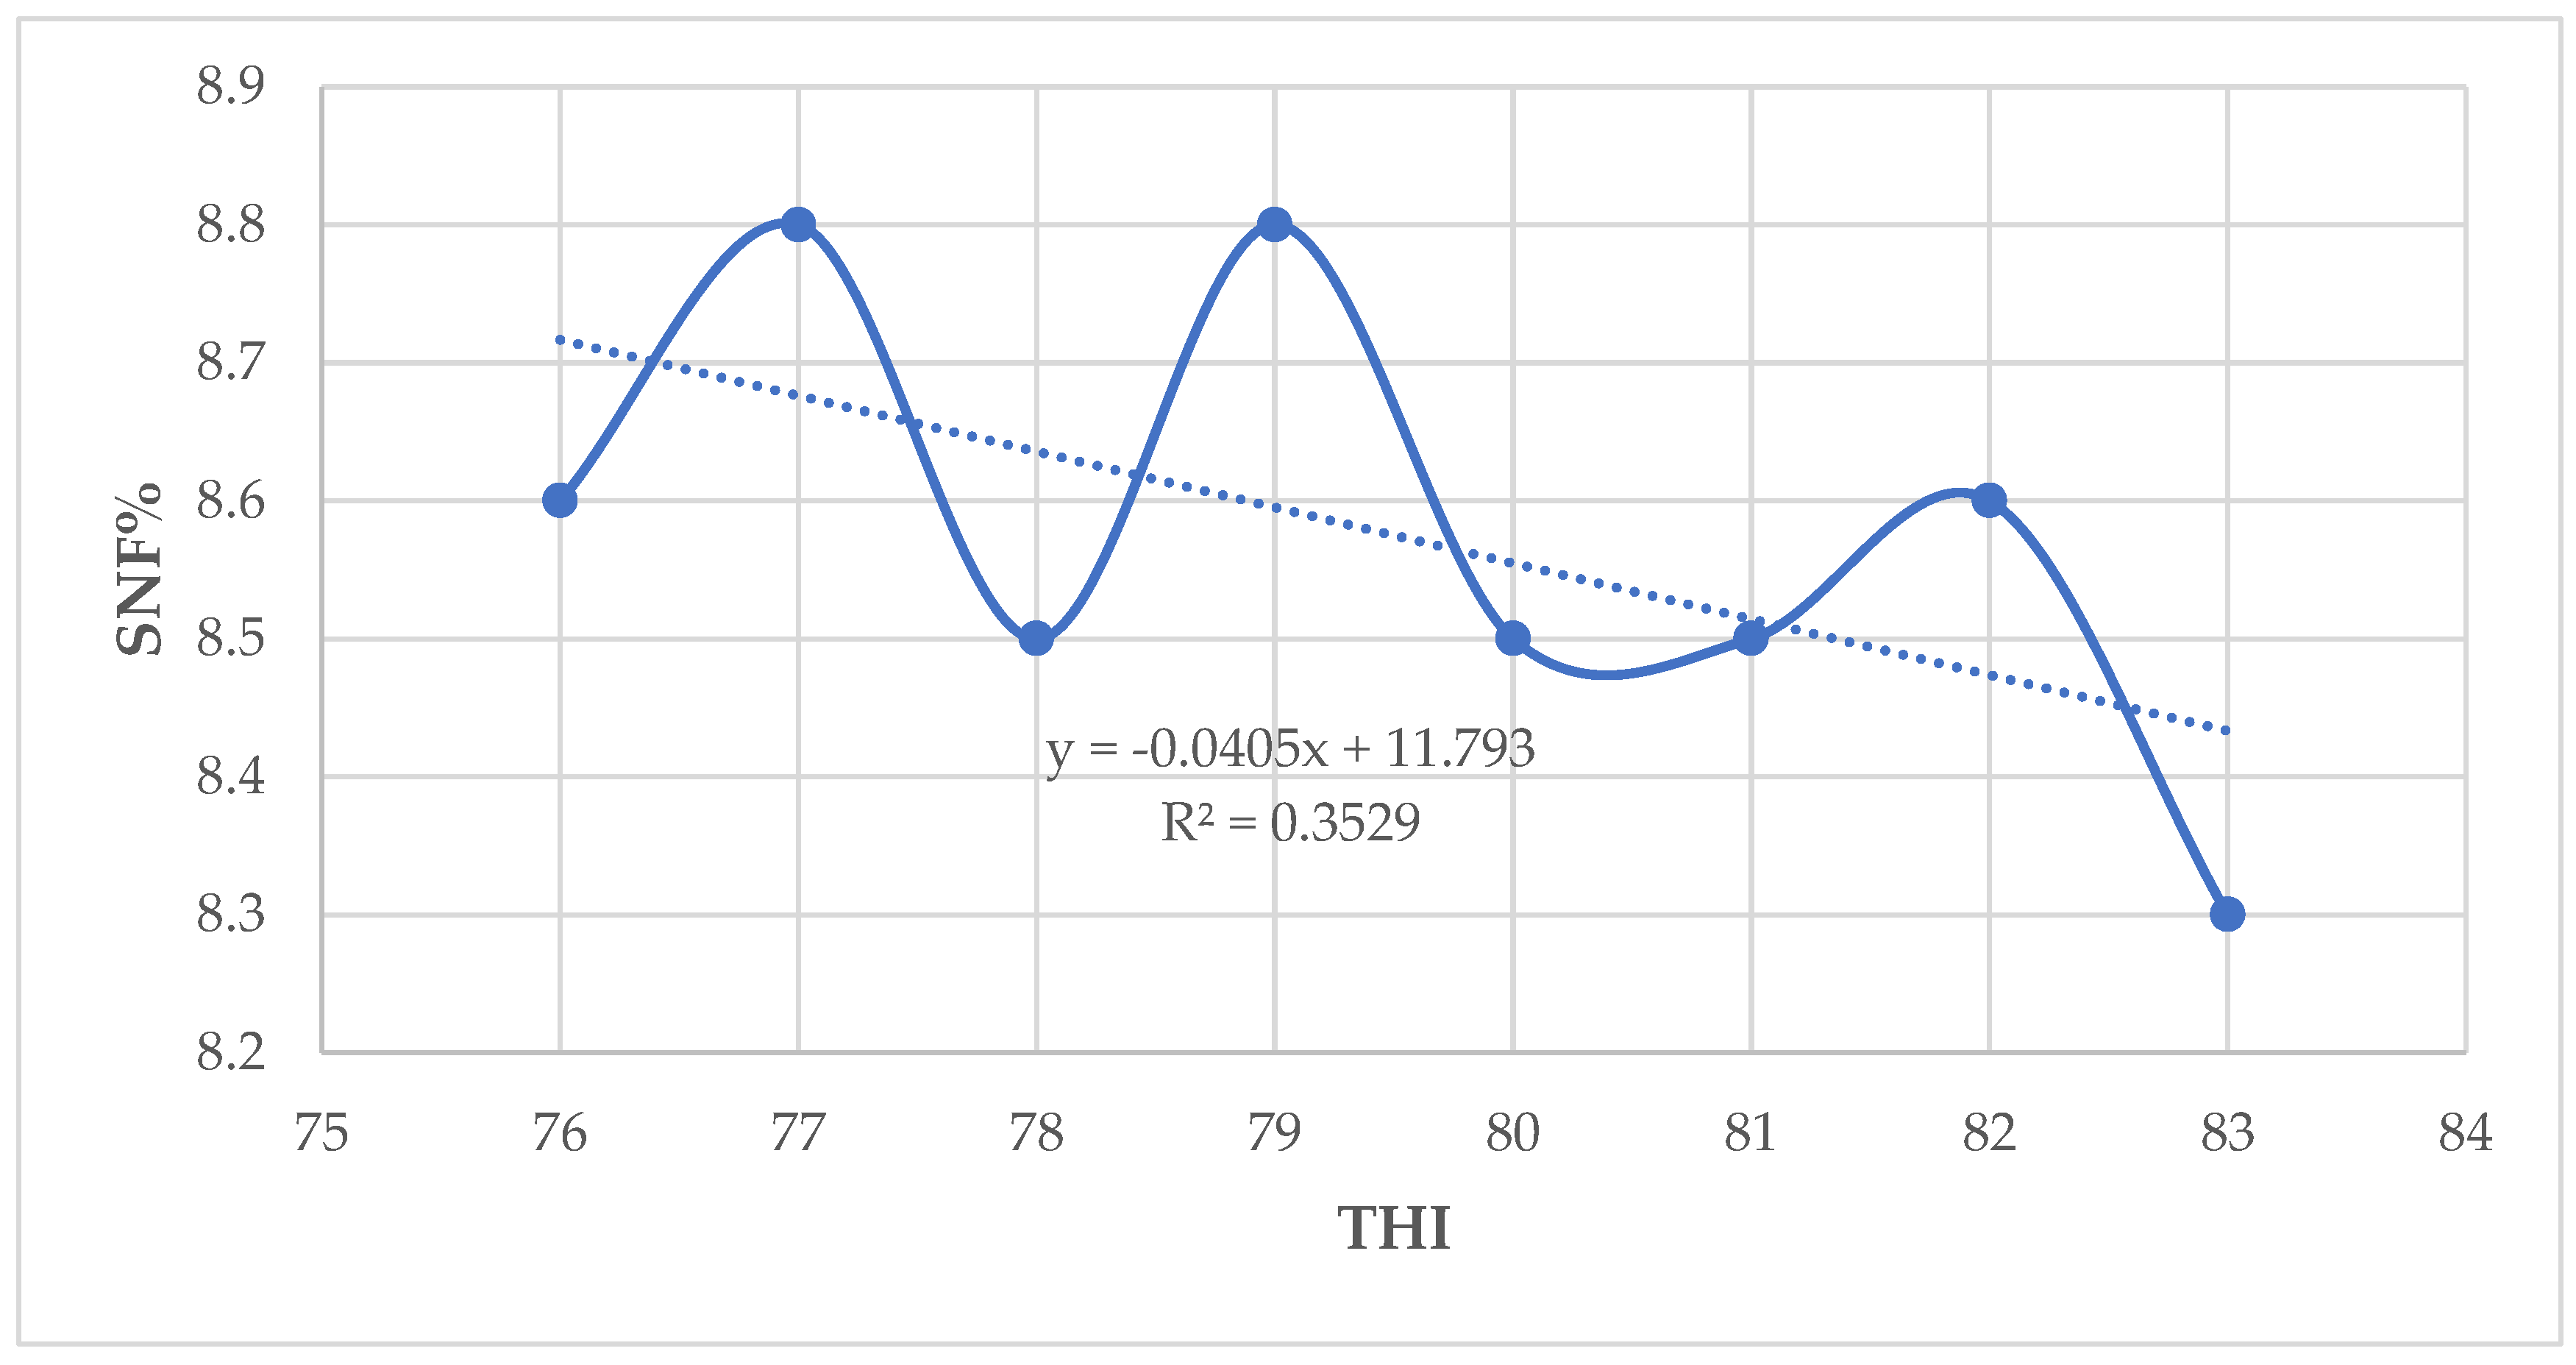
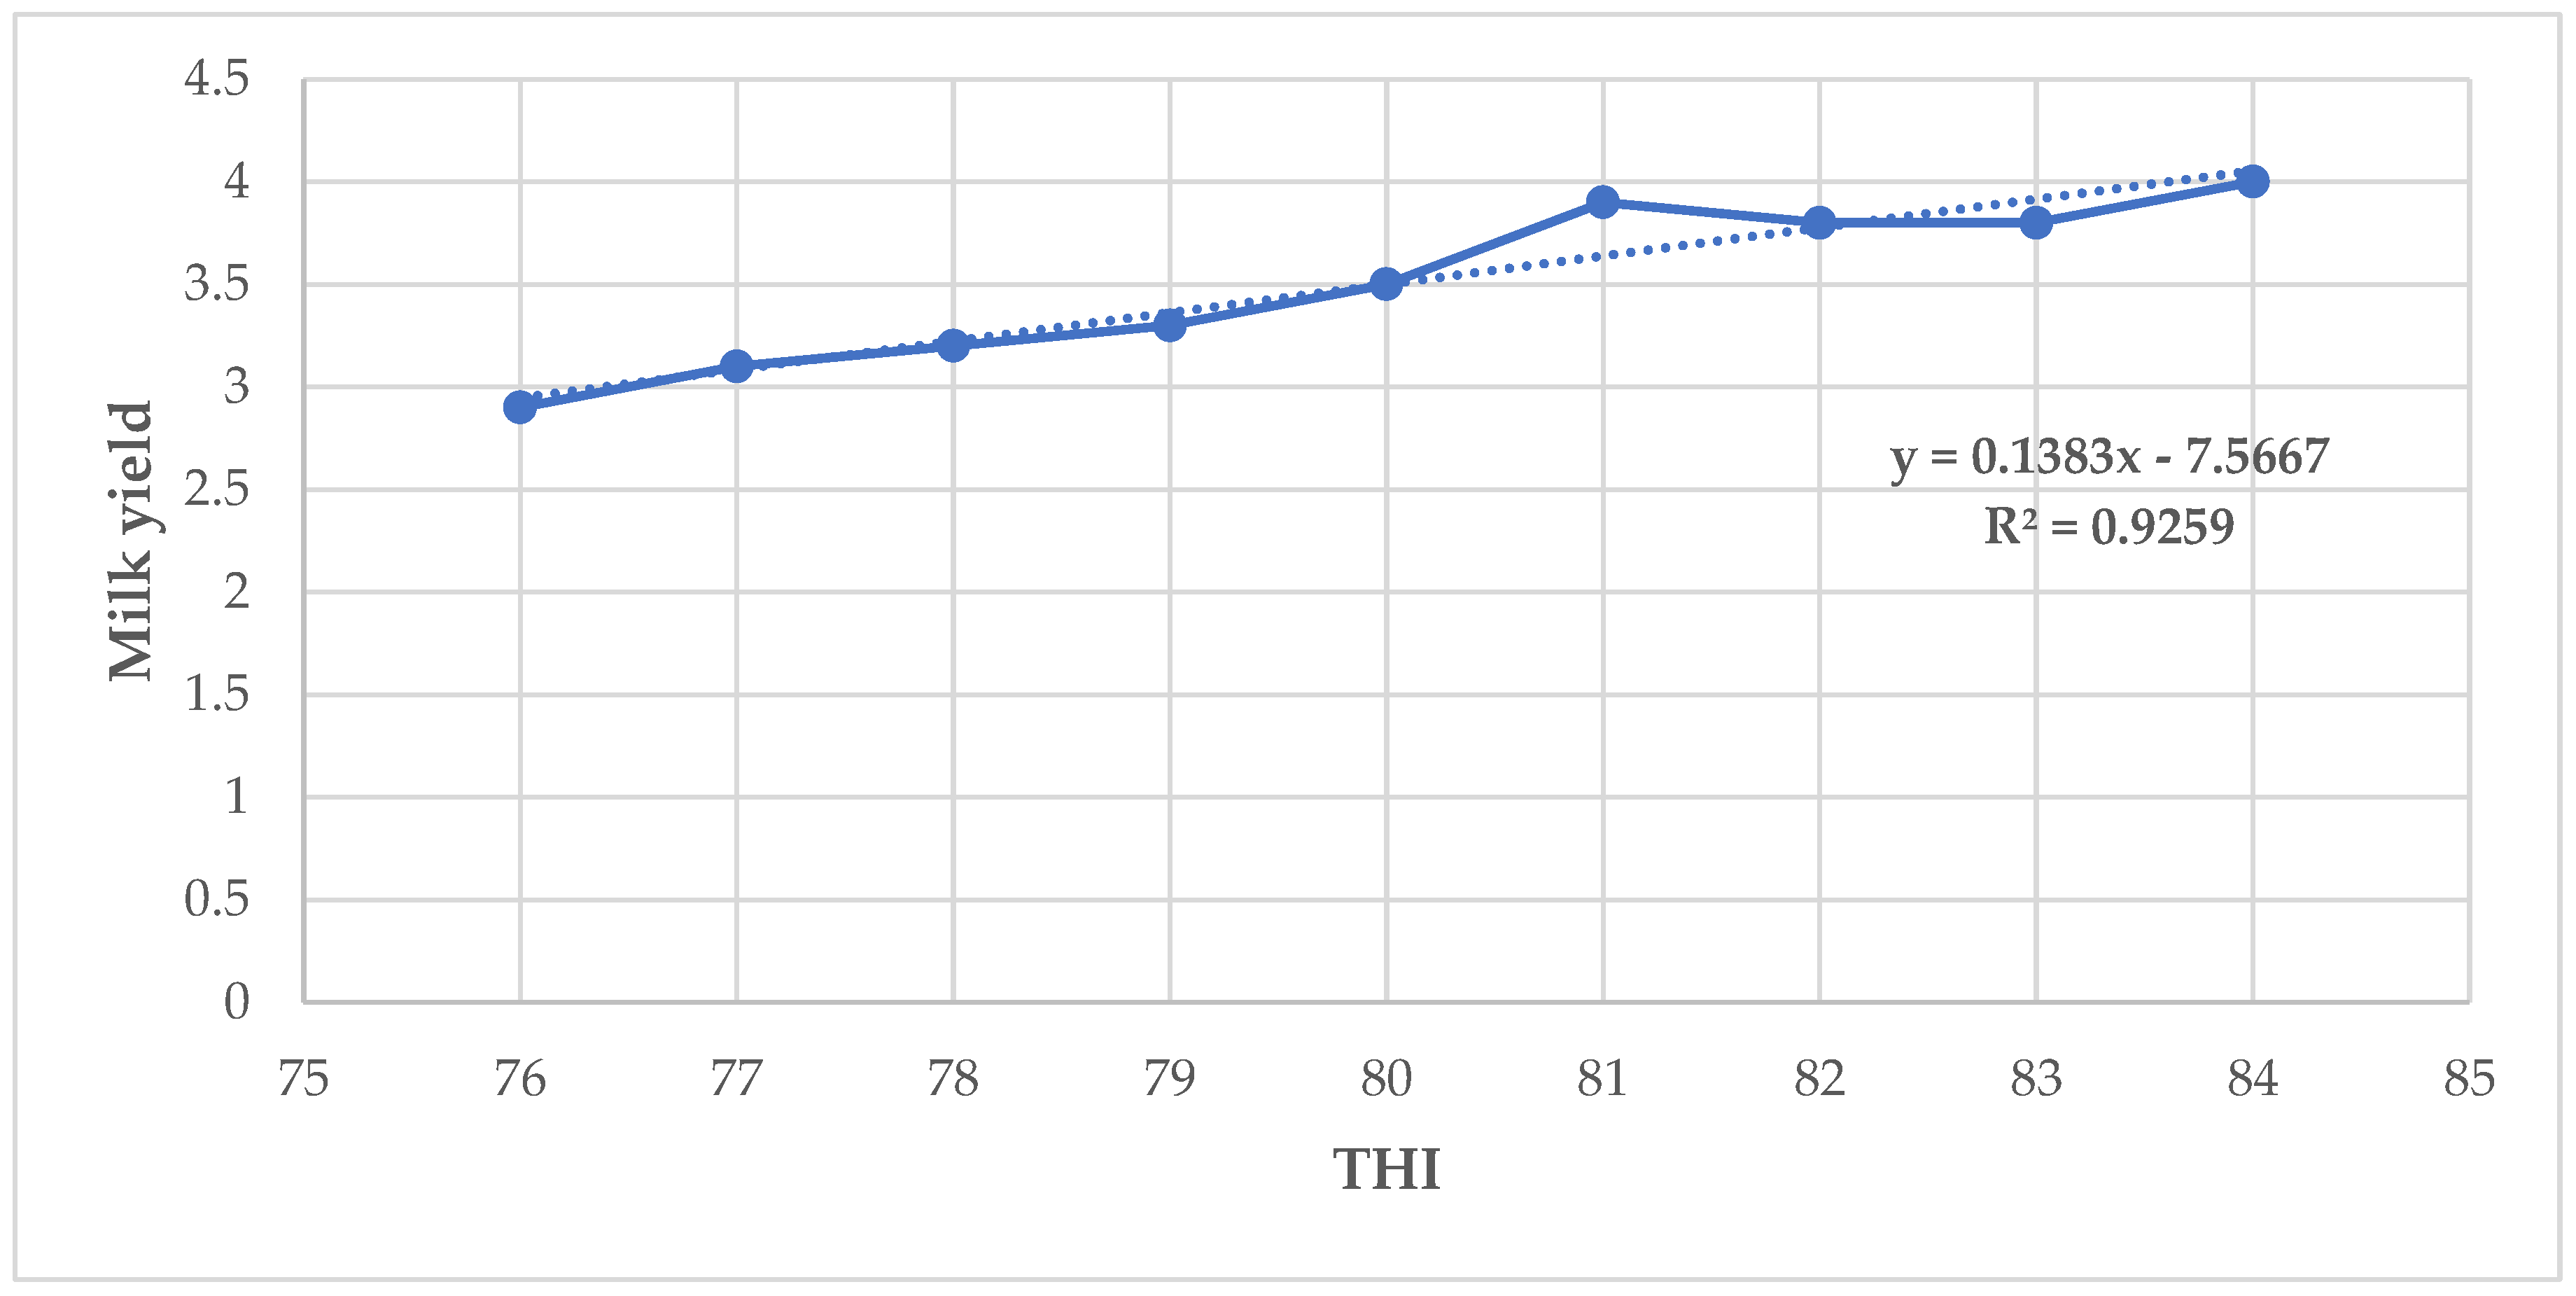
In this study, milk yield and fat percentage showed low positive association with THI (P<0.05) (Figure 2 and Figure 3). However, protein, lactose, and solids -not – fat percentage showed low negative correlation with THI (P<0.05) (Figure 4, Figure 5 and Figure 6).

3.8. Relationship between THI and Physiological Parameters

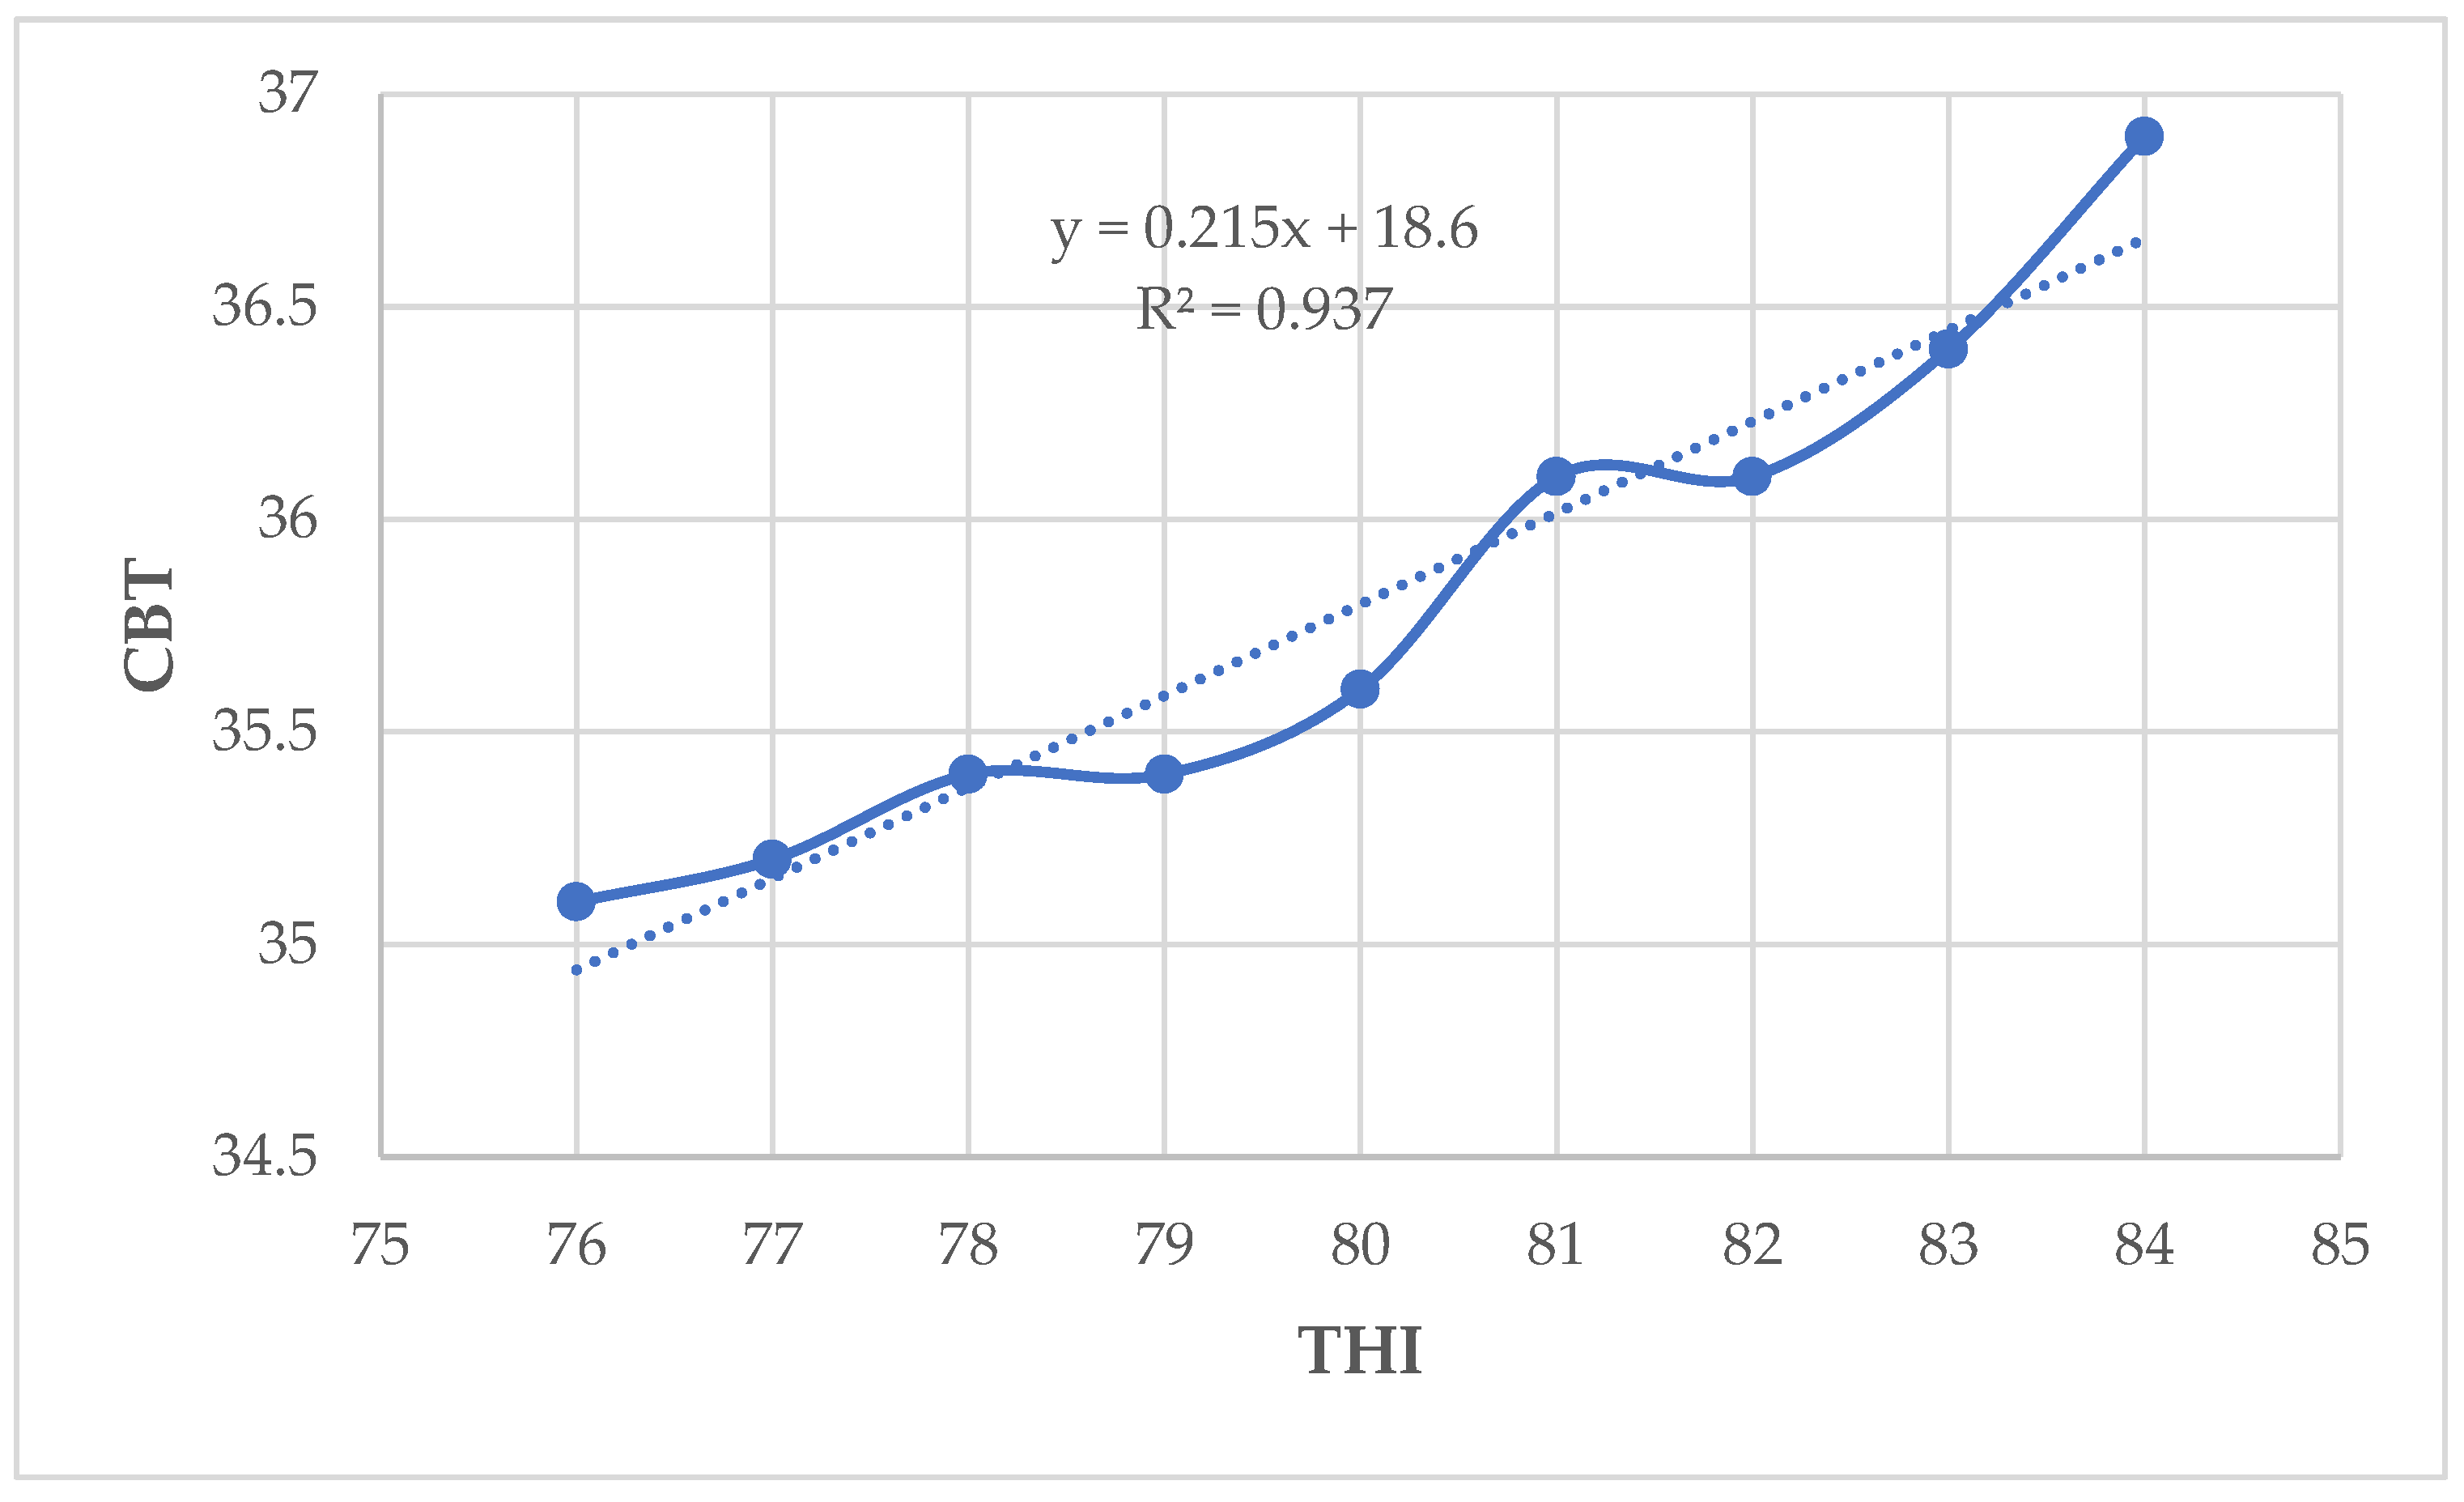
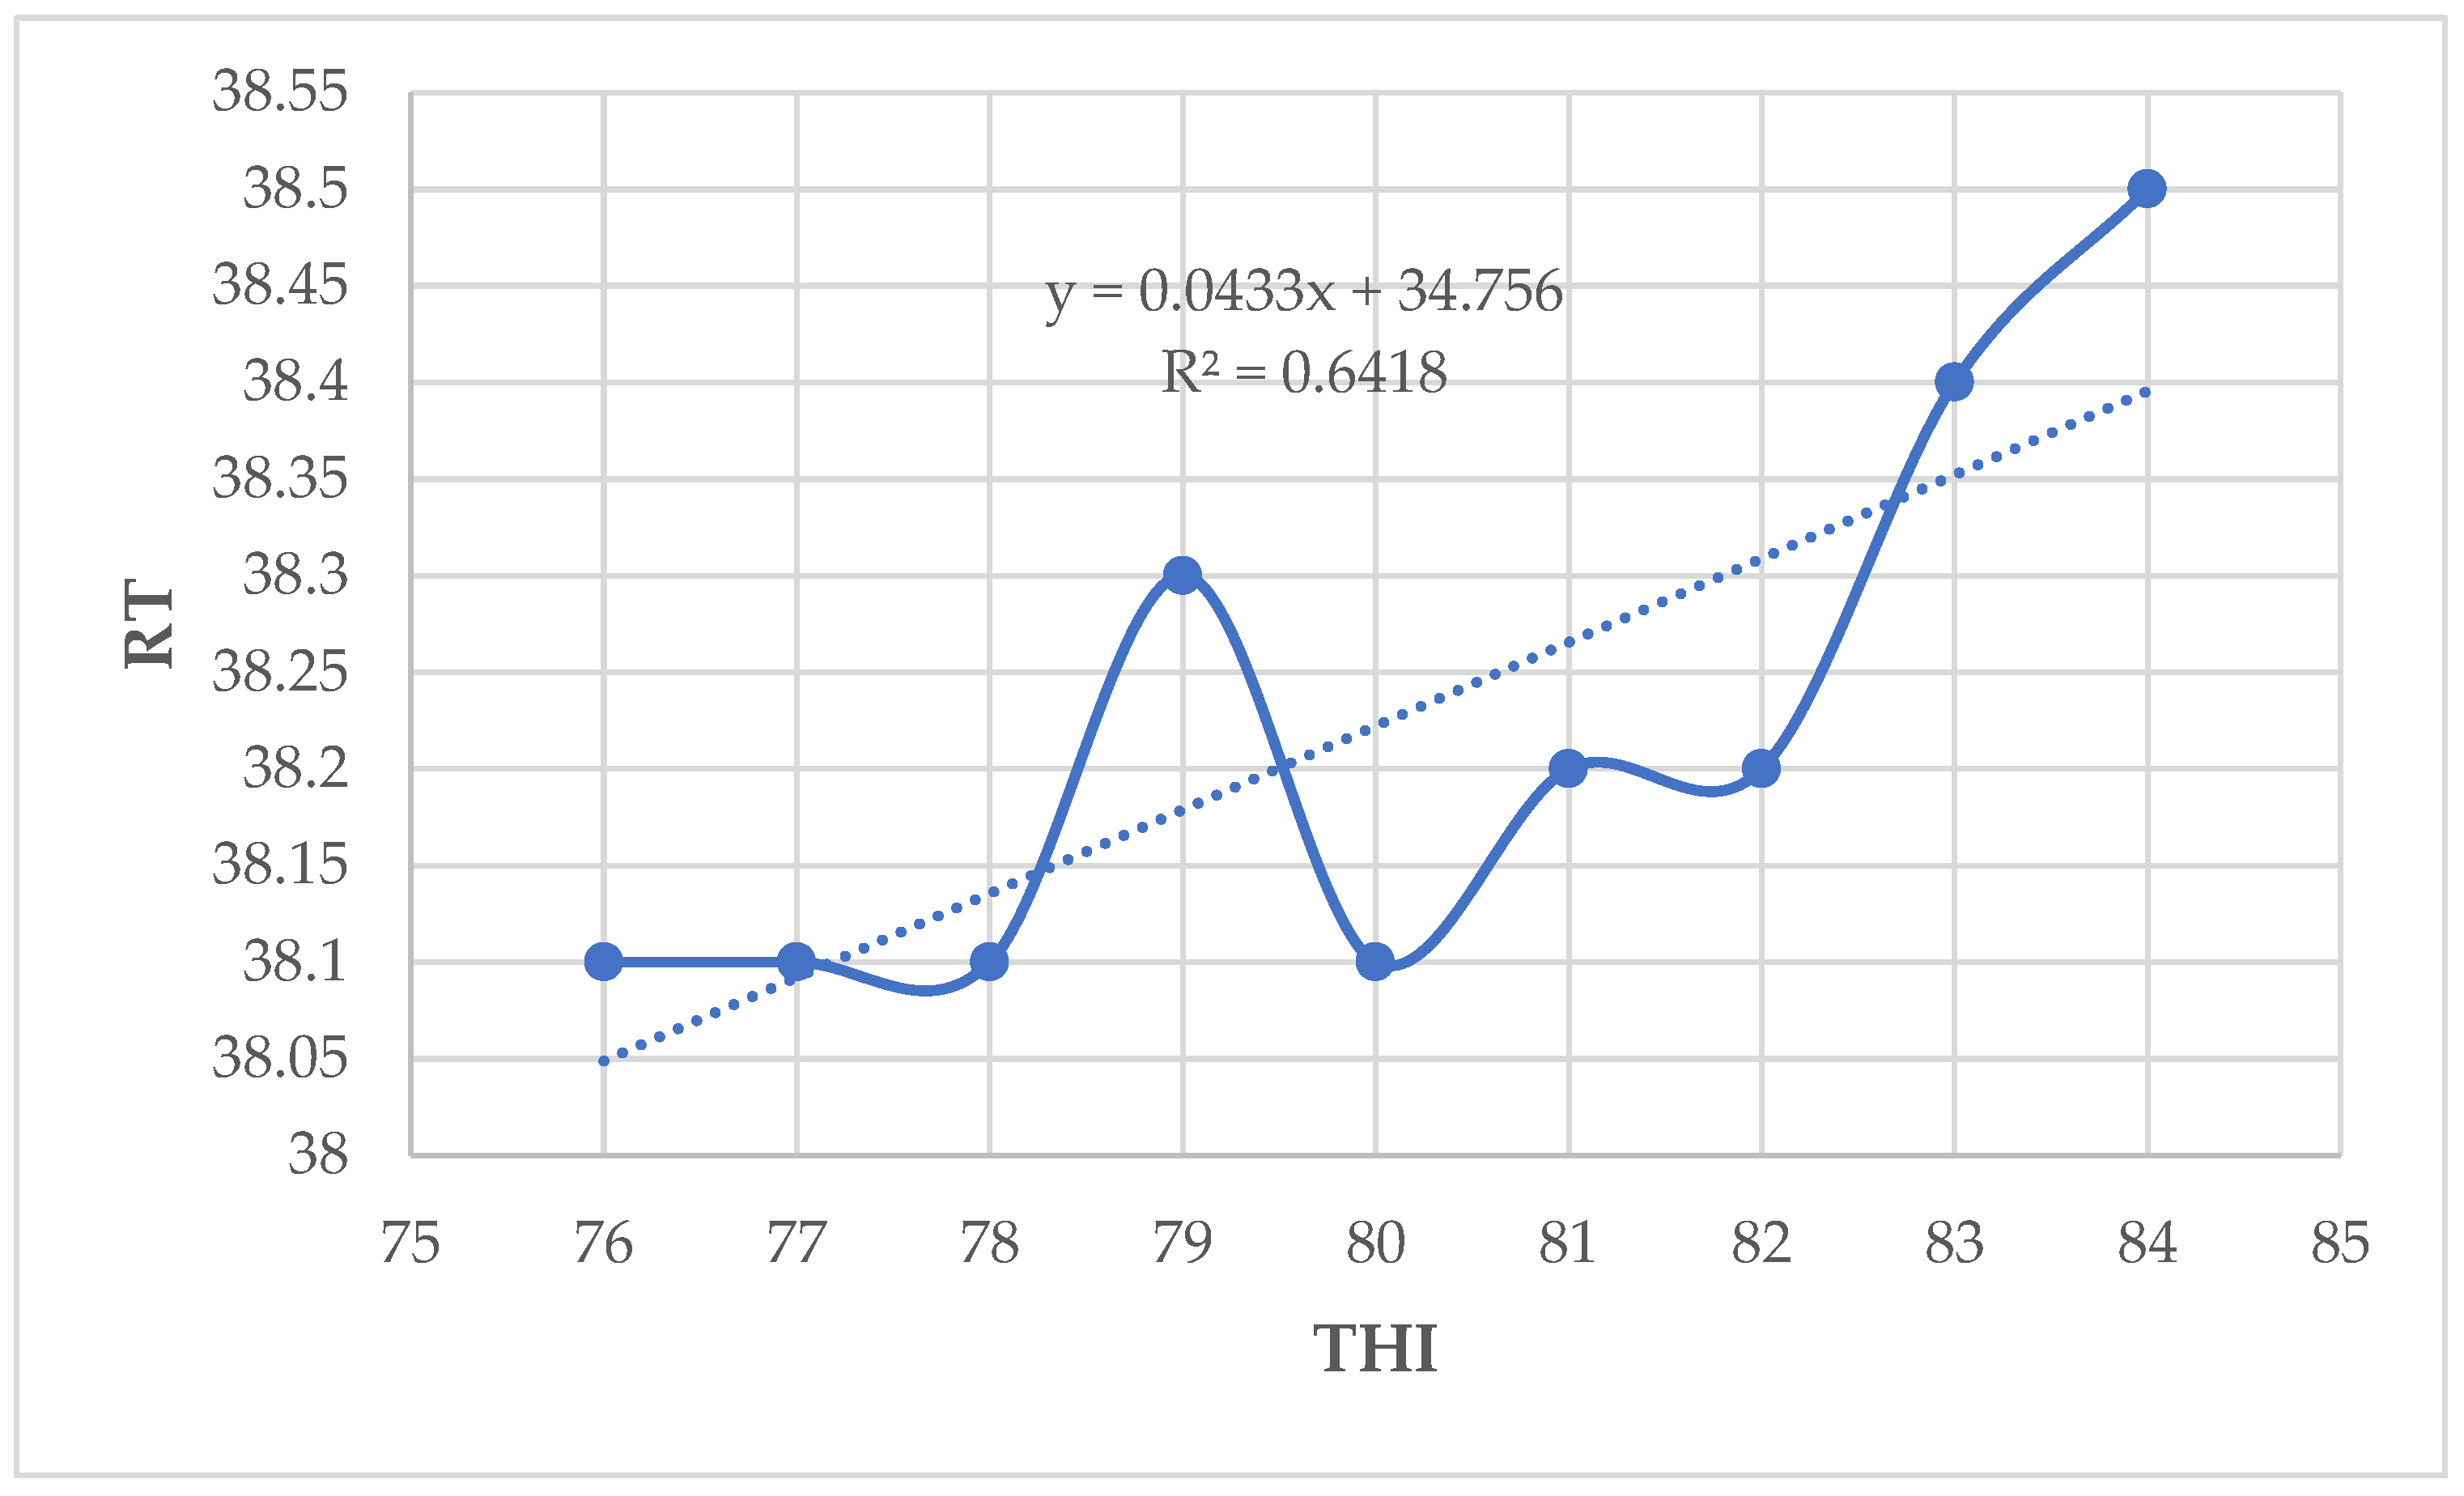
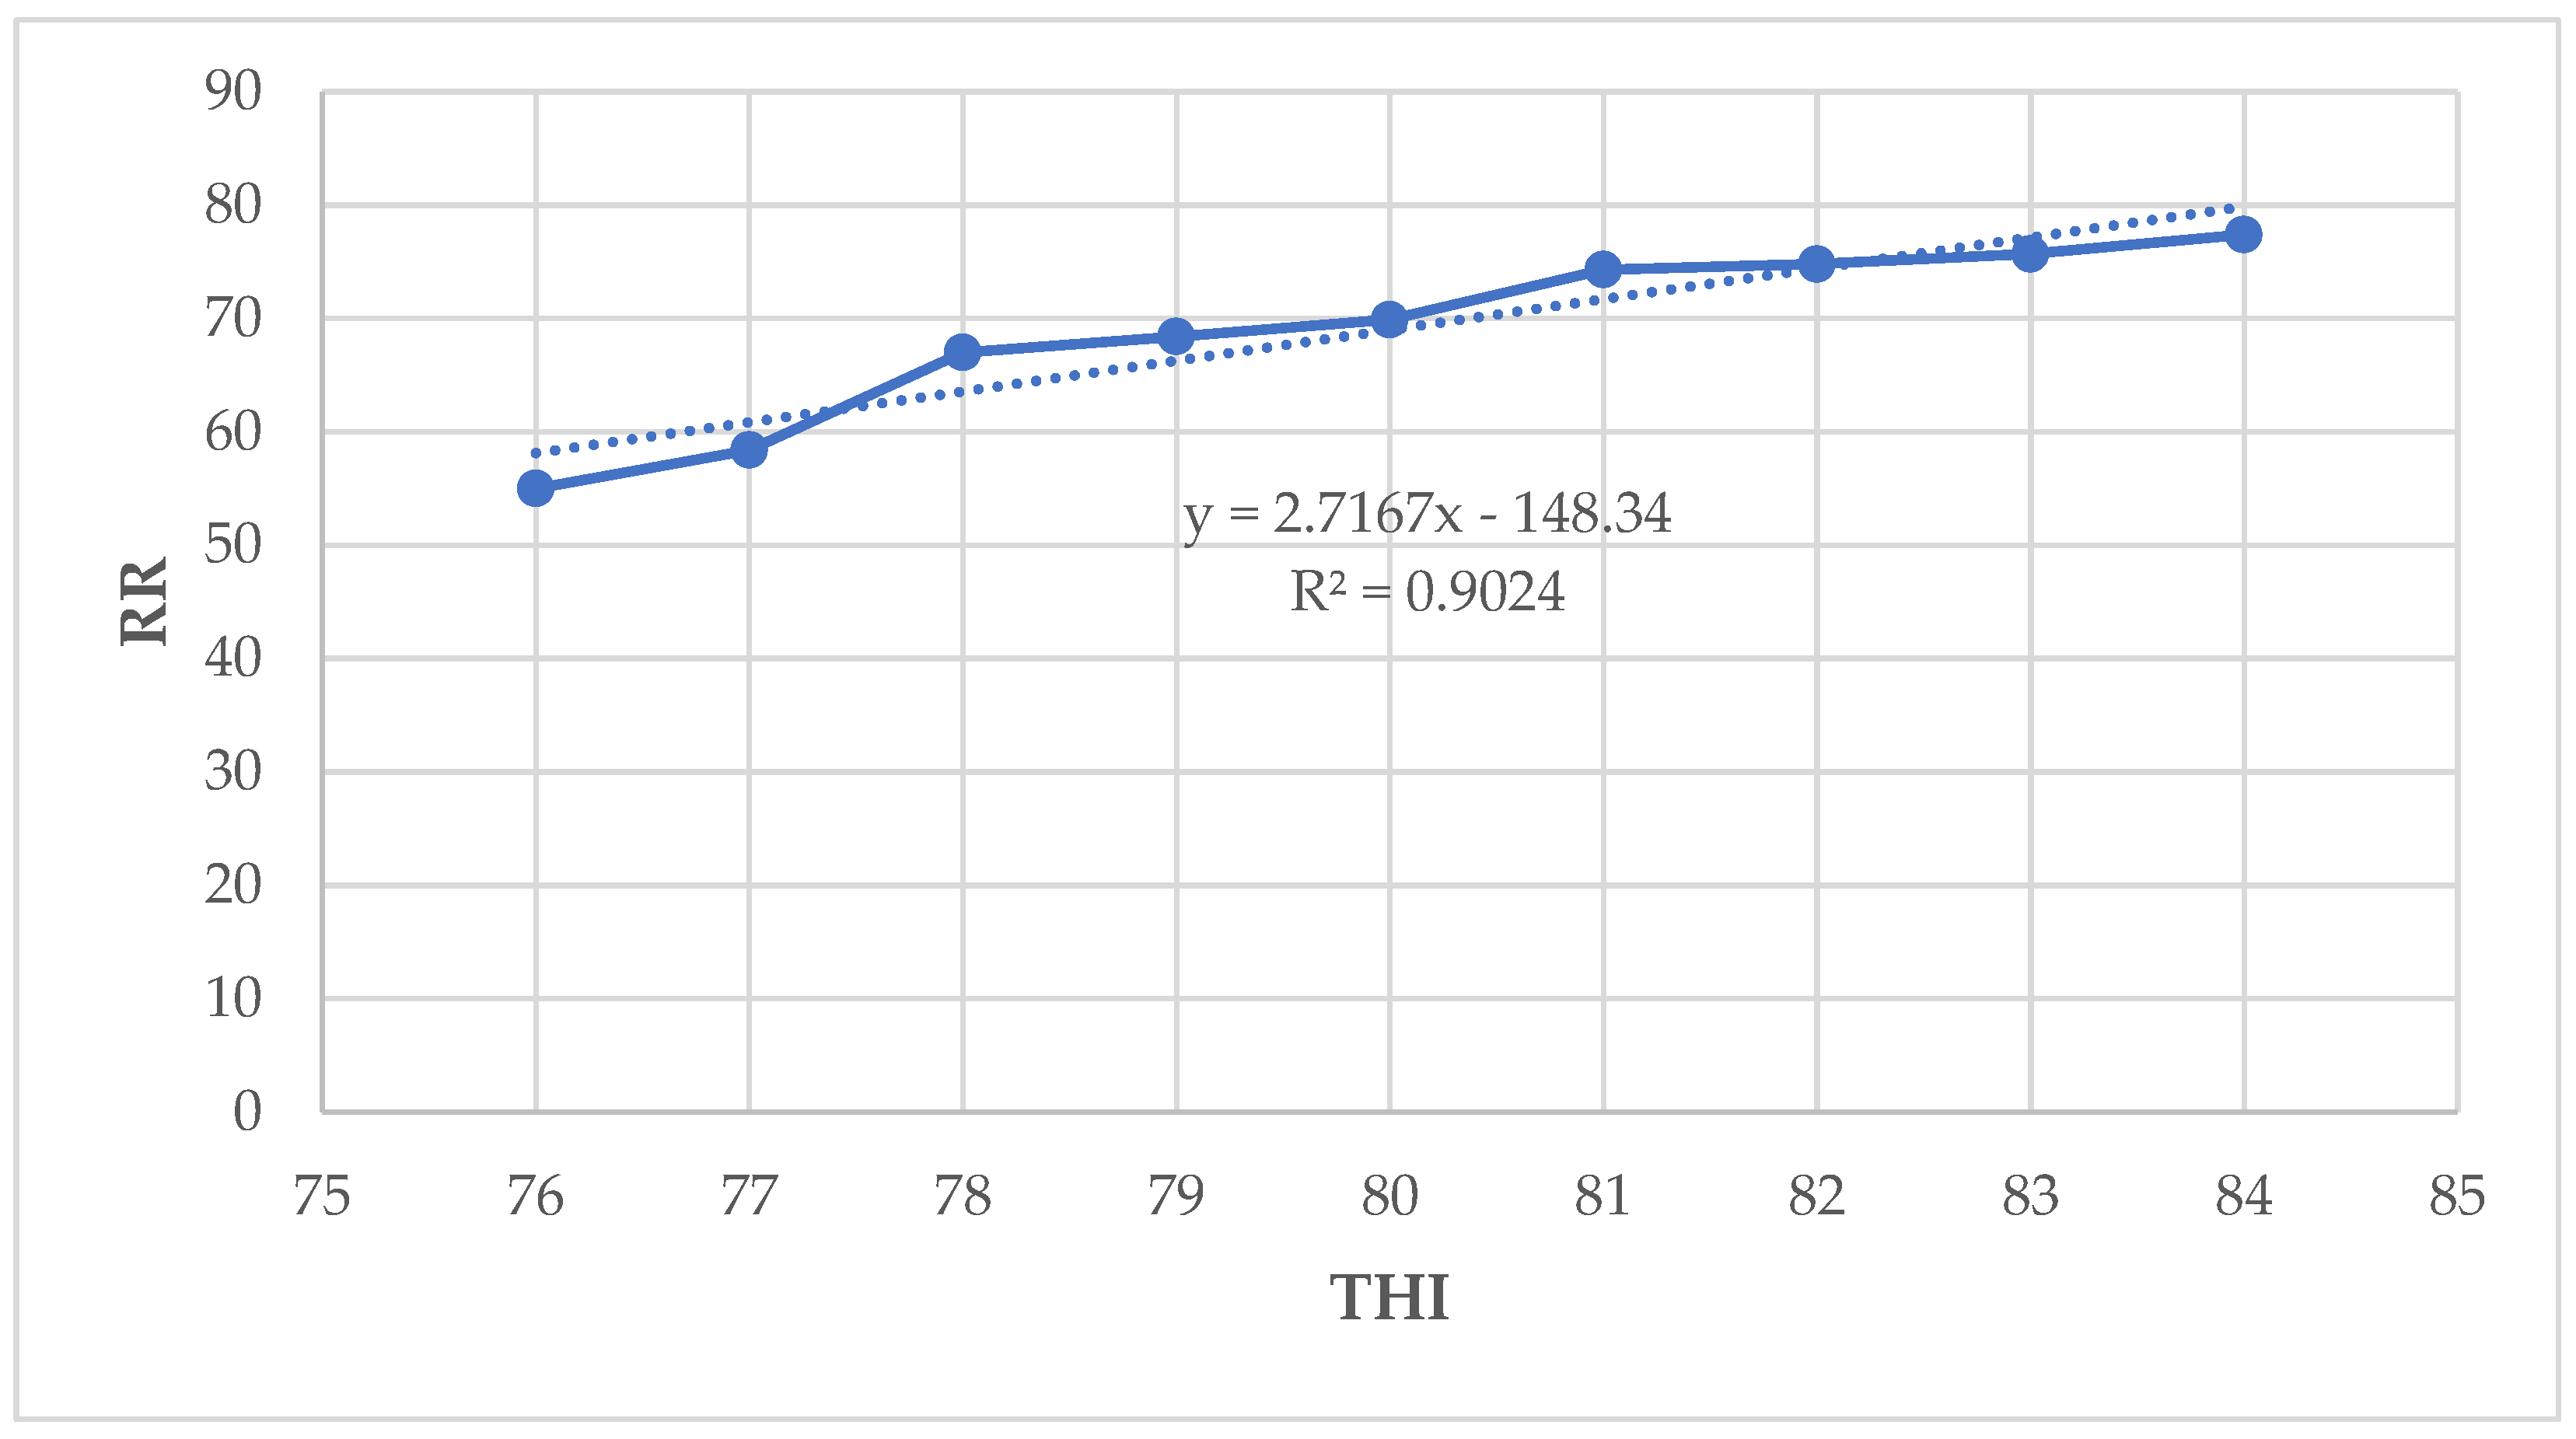
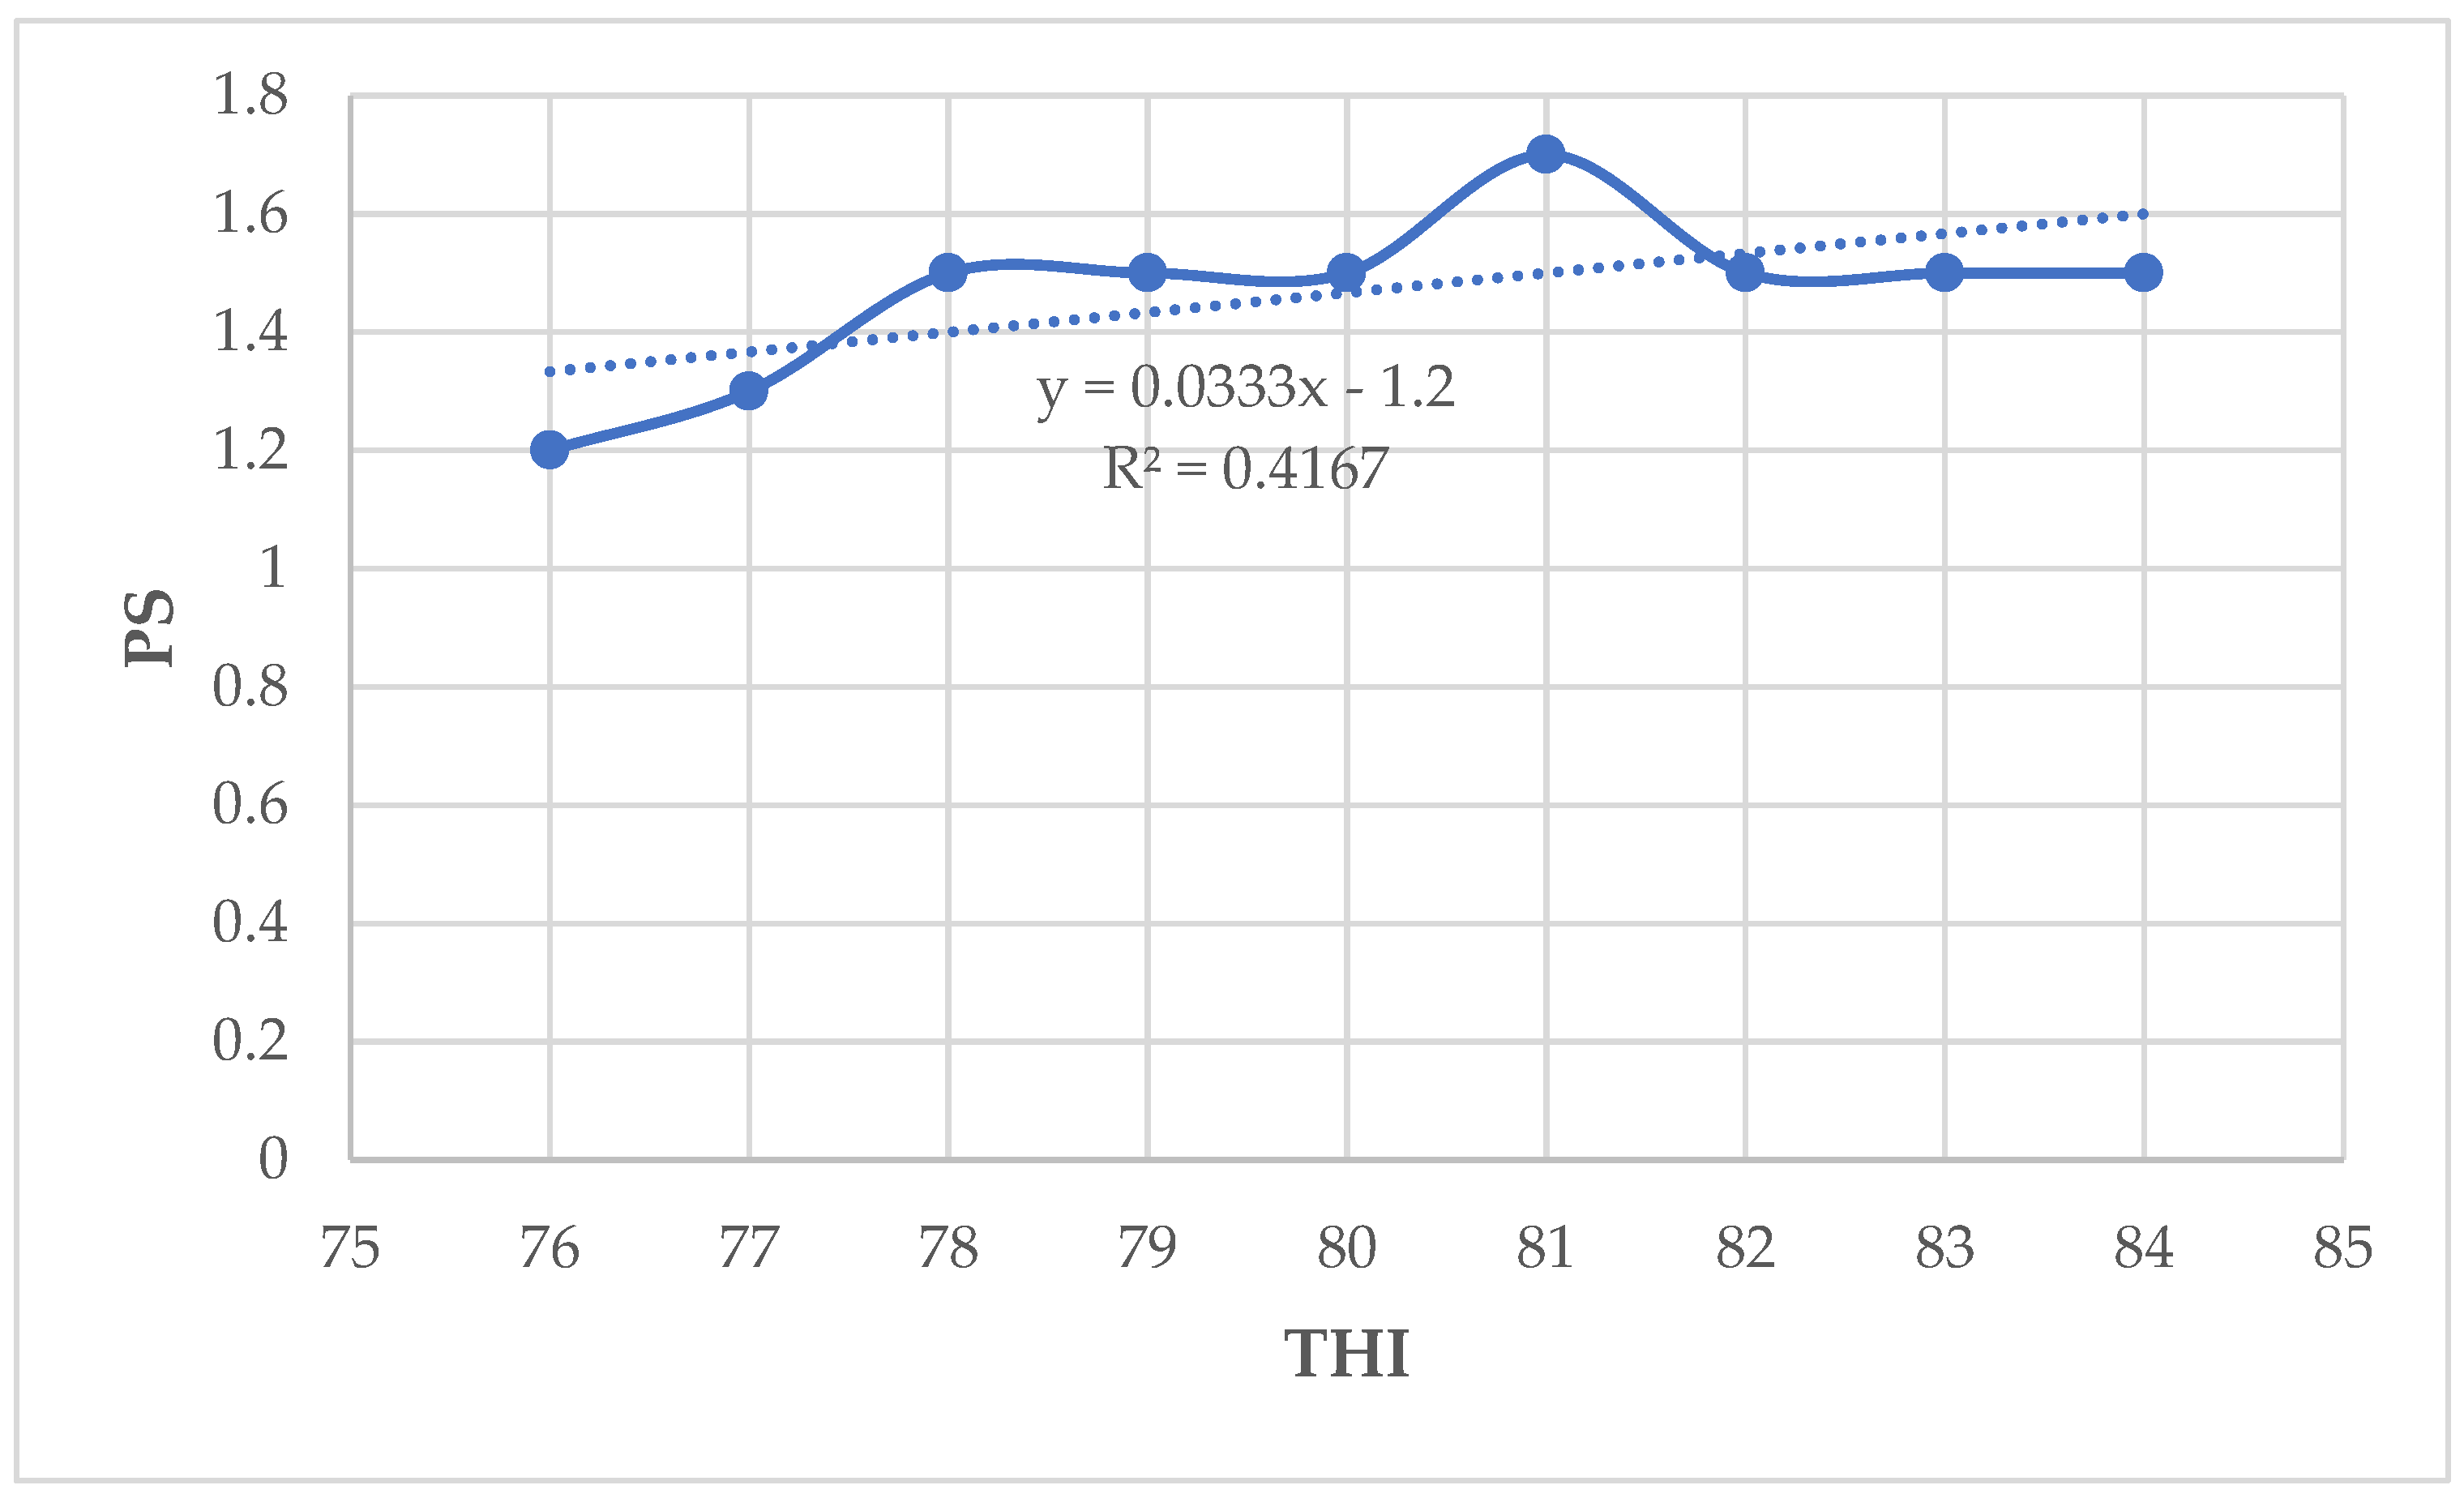
In the current study, the CBT (R2 = 0.93), RT (R2 = 0.64), RR (R2 = 0.90), and PS (R2 = 0.41) showed moderate to strong positive association with THI (P<0.05) (Figure 7, Figure 8, Figure 9 and Figure 10).

4. Discussion

Most dairy cattle kept in Tanzania are crosses of European dairy breeds (mostly Friesian and Ayrshire) with Tanzania Shorthorn zebu/Boran. Dairy cattle kept along the coast might experience heat stress since the coastal lowland has high temperatures and humidities with THI reaching above 77.29 in the hot season [50]. This study assessed the effects of THI on daily milk yield, milk composition and physiological parameters of Friesian crossbred cows kept at TALIRI, Tanga which is located at an altitude of 6 m above and 6 km from the Indian Ocean.
In this study, results show that the mean ambient temperature and THI values in the hot season (January – February) were higher than in the cool season (June – July). On the other hand, the mean relative humidity in the cool season was higher than in the hot season. Generally, the observed mean THI values were high in such a way that they can cause HS to the animals. Similar findings were reported by [30] in their study about HS effects on milk production parameters of Holstein and Jersey dairy cattle in South Korea. Some studies reported that the dairy cattle thermoneutral zone ranges between 5oC and 25oC, but can fall to the range at 0.5oC to 20oC and 60% to 80%RH, although this varies depending on production status, feed type, acclimatization level and climatic conditions [20,30]. [20] reported that when THI exceeds 72, dairy cattle begin to experience HS. In the present study, decline in milk yield and composition parameters were observed when THI values ranged from 77 to 84. In Rwanda, [38] reported THI values ranging from 63.3 to 84.6 with an average of 75.8 THI as HS threshold for milk yield decline. This is in agreement with the THI thresholds obtained in this study. In Florida (USA), [17] reported the THI values of above 68 as HS thresholds for dairy cattle. In India, [59] reported THI value of 72 - 75 as the most favorable for dairy cows in the tropical region of Bengaluru because of the maximum milk production obtained. In the smallholder farms of Tanzania, [16] reported a THI of 76 as HS threshold. The seasonal changes in THI thresholds and the associated variations in milk yield, milk composition, and physiological parameters observed in this study could be associated with variations in weather conditions over the months. These climatic variations lead to alterations in quality and quantity of diet provided to dairy cattle [16].

4.1. Heat Stress Effects on Milk Yield and Composition Parameters

The results in the present study indicate that milk yield and fat percentage increased slightly whereas milk protein, lactose, and solids–not–fat percentages decreased when THI values increased from 76 to 84. A slightly increase in milk yield as THI increased implies that there was very little influence of THI above threshold on the milk production [38]. These results are inconsistent with the findings by [54] in Thailand, who reported that milk yield declines when THI reach 76. In Australia,[55] reported that daily milk yield increased as THI was increasing up to a THI value of 65, and remained fairly constant until 85, and then decreased afterwards. This is in agreement with the findings of this study. In Brazil, [53] indicated that an increase in THI thresholds generally causes a decline in milk production parameters which is in contrast with the findings of this study. Under the Mediterranean climatic conditions of Tunisia, [10] reported a decline in milk fat percentage of 0.34% and 21% decline in milk yield when THI values increased from 68 to 78 for Holstein Friesian dairy cattle. In Rwanda, [38] reported a decrease in milk yield for Holstein crossbreds’ dairy cattle when THI thresholds were above 76, which is not in agreement with the findings of this study. The decline in milk yield traits during HS could be the results of reduction in feed intake and decreased nutrient uptake by the portal drained viscera of dairy cattle [10,16,40]. In this study, HS reduced milk yield and milk composition parameters when THI increased from moderate to high THI values for both HF50 and HF75 dairy cows. There was a higher decrease in milk composition parameters for HF75 than HF50 dairy cows when THI values increased from moderate to high THI thresholds, an indication that the later are relatively more heat tolerant than the HF75. In Brazil, [1] reported that Girolando-Holstein Friesian with 75% blood level (GH75) were less tolerant to heat compared with GH50 which is in agreement with the findings of this study.
In Germany, [28] reported milk fat and protein decline as THI increased from 60. [18] indicated that under HS conditions, the higher fat content in dairy cattle milk is caused by an increase in free fatty acids during negative energy balance whilst a decline in milk protein is due to a lower synthesis of casein formation enzymes in the mammary gland. In the study by [28] across Holstein Friesian dairy genotypes, milk protein, lactose, and solids-not-fat declined when THI changed from moderate to high THI. This is in agreement with the findings of this study. The findings of this study also partially agree with those reported by [12] who observed an increase in fat and protein percentages, but without increase in lactose percentage. This shows that HS decreases protein content of milk without affecting the fat percentages. Also, the results in the present study concur with results reported by [10] who found that HS reduced milk fat and protein percentages when season changed from spring to summer. Generally, HS effects on milk fat and protein percentages are largely non-consistent [12]. [46] reported a reduction in milk protein percentage of 0.13% during HS conditions. Moreover, individual animal differences and trait responses to HS are expected owing to animal-related factors like breed and physiological responses such as age, production status, feed intake, and animal behaviors [33]. The decline in milk protein percentage detected in this study is in agreement with the results reported by [10] and [46]. Milk protein concentration is determined by the energy absorption or the energy content of the diet and its noneffective supply causes a decline in milk protein percentages [28]. It is well recognized that HS decreases feed intake [18,60], but feed intake in animals grazing on pasture declines owing to feed shortage during hot weather conditions [38]. Dairy cattle in this study were freely grazing on pasture and dry matter intake from the pasture was not recorded. Therefore, the lower milk yield observed in this study was a result of reduced feed intake from pasture combined with physiological and metabolic effects of HS [28,38].
On the other hand, genotype, parity, and months of lactation also influenced milk yield and composition parameters. [12] reported that the higher percentage of protein and fat observed in the milk of heat-stressed dairy cattle could be the result of decline in milk production and subsequent increased concentration of protein and fat in addition to possibly greater non-protein nitrogen contents in the milk produced by dairy cattle under HS conditions. Furthermore, the results of the current study show that parity influenced milk yield and composition parameters, such that milk yield decreased from 2nd parity to 3rd parity, then slightly increased in the 4th parity. On the other hand, milk composition parameters increased from 2nd to 3rd parity, then decreased in the 4th parity. This could be due the differences in feeding rates as primiparous dairy cattle eat more slowly than multiparous ones during the peak lactation [36]. Additionally, [35] reported that high-producing dairy cattle such as multiparous dairy cattle show major heat sensitivity owing to increased intrinsic metabolic heat production compared to young lactating dairy cattle in the 2nd parity. In the study by [49], parity and lactation month had negative effect on milk yield, fat, protein, lactose, and solids – not – fat percentages which is in agreement with the findings of this study.
Regarding genotype and THI interaction, the findings showed different trends for milk yield and composition of HF50 and HF75 dairy cows when the THI values increased. There was a marked difference between HF50 and HF75 in milk yield at THI of 76 to 78. Milk yield declined and increased in HF75 and HF50 dairy cattle, respectively, when the THI values increased from moderate to high. Regarding milk composition parameters, HF50 showed high content of fat, protein, lactose, and solids – not – fat percentages than HF75. Nevertheless, fat % declined when THI changed from moderate to high THI values in both HF50 and HF75 whilst no reduction was observed for protein %. No large difference was observed for lactose percentage in both HF50 and HF75 when THI changed from low to high THI values. A large decline in solids – not – fat was observed in HF50 than in HF75 when THI changed from moderate to high THI values. These findings are in agreements with those reported by [53] who observed a greater decrease in milk production for HF75 than HF50 when THI values increased from 79.2 to 80.32. The magnitude of milk yield decline and alteration of milk composition parameters including fat, protein, lactose, and solids - not - fat percentages as a result of HS are influenced by various mechanisms at different lactation stages and the mammary gland of lactating dairy cattle respond differently to HS [40].
Parity and THI interaction influenced milk yield and composition such that milk yield decreased when THI increased both for the cows in the 2nd and 3rd parities. These findings concur with those reported by [52]. Dairy cows in the 3rd and 4th parity showed higher milk yield and composition compared to those in the 2nd parity, which indicates that multiparous dairy cattle are highly tolerant than primiparous dairy cows. In the study by [41], dairy cattle in all parities were stressed by HS and responded by showing a significant decline in milk protein percentages, this is inconsistent with the results of this study. [52] indicated that primiparous dairy cattle are lighter than multiparous ones, thus the ratio of surface area to volume is slightly higher, this predisposes them to heat loss. Moreover, limited studies have explored the relationship between lactation stages of dairy cattle and THI values [62]. In this study, it was observed that dairy cattle in 3rd month of lactation showed significant decline in milk yield compared to those in the 2nd month of lactation. However, the reverse was observed for fat, protein, lactose, and solids – not – fat percentages, whereby significant effects of HS was observed in terms of reduced milk composition traits for the cows in the 2nd month of lactation compared to those in the 3rd month of lactation.
Dairy cows in the 3rd month of lactation were highly affected by HS compared to those in the 2nd month of lactation, as they showed higher decline in milk yield when THI increased from low to high THI values. On the other hand, cows in the 2nd month of lactation showed higher decline in milk proteins, lactose, and solids-not fat percentages compared to those in the 3rd month of lactation as THI increased from low to high THI values. This is in agreement with the findings of [28] who reported that the major effects of HS on milk yield, fat, and protein percentages are identified in later lactation. Furthermore, the findings of the current study are supported by results from other studies, which reported that dairy cattle in early stages of lactation are highly affected by HS in terms of productivity [7,62]. In Australia, [40] observed a significant effect of stage of lactation on daily milk yield, fat and protein percentages, which is in agreement with the findings of this study. In a pasture - based system, [40] reported an increase in milk fat % and protein % by 3% and 2%, respectively, when THI changed from low to high THI. The reduction in milk fat, protein, lactose, and solids - not - fat percentages is mainly influenced by the adverse effects of hot weather conditions on the synthesis of these milk constituents in dairy cattle mammary gland [7]. There are substantial milk yield losses induced by HS in any stage of lactation of dairy cattle. Thus, cooling of dairy cattle when the THI thresholds range between 77 and 86 is necessary through the use of trees in the farms, shading, provision of drinking water, supplementation of concentrate during milking, among others to minimize the decline in milk yield observed in the afternoon and hot season. However, the different cooling approaches should be done with consideration of the production cost of the cooling technologies applied [61]. Under warm and humid conditions, dairy farmers could improve milk yield and avoid fluctuation in milk composition in different seasons through nutritional supplementation and manipulation of feeding practices. Furthermore, the provision of fans, sprinklers, shade, barns, and trees which enhance passive ventilation could improve body heat loss and increase the dry matter intake of cows and hence, improved dairy cattle milk composition [20,60,63].

4.2. Heat Stress Effects on Physiological Parameters

Studies have shown that the RR greater than 60 breaths/min indicates HS when dairy cattle use evapotranspiration as the key mechanism for losing body temperature [18]. In the present study, when THI values increased from 76 to 84, the cows responded by increasing the RR. Also, when THI values increased from 76 to 84, there was an increase of 0.4 oC for CBT and RT, and 11 breaths per min. Similar patterns of responses to HS were observed in the study conducted in Tunisia by [14]. In their study, HS altered RT, RR, and HR such that a daily increase of 1.2oC was observed when THI values increased from 55 to 78, while HR and RR increased by 3 beats per min and 35 breaths per min, respectively. The physiological responses to HS observed in this study are an adaptive mechanism initiated by dairy cattle in an attempt to restore their thermal balance [14]. The CBT of dairy cattle varies many times as it is a crucial tool for regulating body temperature and relies on the peripheral blood flow [29]. When dairy cattle want to reduce its body temperature, body heat is transported from the core of the body to the skin by blood, thus blood flow to the skin will rise, thereby increasing skin temperature [29].
The RT is considered to be a good indicator of deep CBT, although there are significant changes among various parts of core body at different scales of the day [29]. In this study, significantly higher CBT and RT were recorded when THI values were above 82 - 84. These results are in agreement with those reported by [18] in Brazil who found significant effect of THI on RT and RR. Also, the findings in this study are in agreement with [65] who reported that RT start to rise when ambient temperature reach above 20oC. In this study, the average RT increased by 0.4oC when THI thresholds ranged from 76 - 84. The RT was higher at 38.4oC for HF50 compared to HF75 at extreme THI values of 82 - 84, suggesting that HF50 were slightly less heat tolerant than HF75. However, other physiological parameters indicated that they were better tolerant to heat stress compared to HF75. All animals showed mild to moderate HS for all physiological parameters when THI ranged from 76 - 78 and 79 - 81. For instance, the high PS value observed at higher THI values and afternoon hours were comparable with first-phase panting and the point at which HS mitigation should be considered [31]. During HS, dairy cattle increase RR and PS, which increases in body fluid loss and affects dehydration and blood homeostasis [29].
In this study, the cows respired significantly faster and panted relatively more frequently at higher THI values. These results differ with those obtained by [14] who reported 63 breaths/min at THI of 80 for Holstein Friesian dairy cattle reared in the Mediterranean climate of Tunisia. The increased rate of RR and PS is an indication that these animals are losing heat as an attempt to maintain homeothermy [40]. Respiration rates increase when the ambient temperature surpasses dairy cattle thermoneutral zone, which typically ranges from -5oC to 25oC, and declines again below this thermoneutral zone [30]. The increase of RR in dairy cattle is used to disperse around 30% of body heat by respiratory vaporization. This respiratory vaporization and convection dissipate of body heat help dairy cattle to maintain its thermal balance [29]. The RR has been shown to be the first physiological response to increased ambient temperature for Holstein Friesian dairy cows in late stages of lactation reared in the Netherland [61,65].
In the present study, cows in the 3rd month of lactation indicated slightly increase in CBT, RT, RR, and PS compared to those in the 2nd month of lactation, an indication that this group of animals experience higher HS effects than their counterparts. These findings partially concur with those reported by [62], who found that stage of lactation significantly influences the thresholds for surface temperature maximum, but with less significant effect on surface temperature average. [62] also reported that dairy cattle in the 3rd month of lactation are more susceptible to increase in HS conditions than those in the 2nd month and 1st month of lactation and this is in agreement with the findings of the current study. The findings of this study are in partial agreement with those reported by [40] for lactating Holstein dairy cattle grazing during Australian summer in Melbourne. In their study, lactation stage had no significant effect on RR, PS, and ST, but affected (P≤0.05) average daily milk yield and milk solids. [61] indicated that some dairy cattle may transition from the previous stage of lactation to the next stage during the research period. This results into failure to detect the potential effect of the stage of lactation. Moreover, parity influences the physiological responses of dairy cattle to HS [61]. In this study, cows in the 3rd parity showed higher patterns of responses to HS with significant increase in CBT, RT, RR, and PS compared to those in the 2nd and 4th parity. These findings concur with those reported by [61]. In their study, they analyzed the effects of parity on RT and RR and found that dairy cattle in the 3rd parity had higher RR compared to dairy cattle in the 1st and 2nd parity. Our findings also concur with those reported by [14] that parity affects RT and RR.

4.3. Relationship between THI and Milk Yield and Composition Parameters

During HS conditions, dairy cattle exhibit several behavioral and physiological conditions that have negative effects on milk yield and composition parameters [41]. In this study, the THI showed low positive correlation with milk yield and fat percentage but was negatively correlated with protein, lactose, and solids – not – fat percentages. [9] reported a significant negative relationship between THI and milk yield, fat, protein, lactose, and solids – not - fat percentage which is in partial agreement with the findings of this study. The findings in this study are also in contrast with those reported by [10] who observed a negative relationship between milk yield and THI. These findings partially concur with those reported by [6] who fitted a linear model on large dataset of Italian Holstein dairy cattle milk yield records, and observed a significant negative relationship between extreme THI thresholds and milk production parameters. These findings also partially concur with those reported by [30] with a negative relationship between milk yield and THI for Holstein dairy cattle and a positive association between the later and milk yield for Jersey dairy cattle. A low positive correlation between THI and milk yield and fat percentage observed in this study implies that milk yield and fat tend to increase slightly with the rise of THI [9].
These results suggest that milk composition parameters are more sensitive than milk yield to the effects of HS [41]. At the Mediterranean climate of Italy, [7] reported a strong positive correlation between THI and fat % (r = 0.98) and protein % (r = 0.99) for a retrospective study on Holstein dairy cattle for data collected between 2003 and 2009. However, these findings are partially consistent with the results of this study. Furthermore, the findings of this study partially concur with those reported in China by [61], who observed a positive correlation between milk yield and THI values. In their study, they observed a positive correlation between milk yield and THI and a positive association between THI and milk fat %, milk protein %, and milk lactose.
4.4. Relationship between THI and Physiological Parameters

In this study, THI showed moderate to strong positive correlation with all the physiological parameters except the PS that showed low positive correlation with THI. Similar findings were observed by [40] who reported that all physiological parameters measured in their study were positively correlated with THI. [40] reported a moderate positive correlation between THI and RR, PS, CBT, which is in agreement with the findings of the present study. [14] also reported a positive correlation between RR, HR, and RT, an indication that these parameters are indicators of thermal stress and can be used to investigate the adverse effects of HS on lactating dairy cattle. These findings also concur with those reported by [29] in South Korea who found that THI had a strong correlation (r = 0.99) with the rumen surface temperature compared to RT, RR, and udder surface temperature in the Holstein cows and RR (r =0.97) compared with the RT, RST, and UST in Jersey cows. Similar findings were also reported in the study by [42]. [14] reported that the positive correlations between THI and physiological parameters indicate the sensitivity of those parameters as indicators of responsiveness to the environment. There have been limited studies concerning the relationship between THI or other climatic variables and physiological parameters of dairy cattle in sub-Saharan countries, making it difficult to compare the results of this study.

5. Conclusions

The results of this study show that daily milk yield and milk composition decline while physiological parameters (CBT, RT, RR and PS) increase at THI thresholds ranging between 79 and 84. The results revealed that milk yield and milk composition parameters (fat, protein, lactose and SNF percentages) increased slightly with raising THI for the THI thresholds of 76 – 78 and then significantly decreased when THI exceeded 82 - 84. The decline in daily milk yield and milk composition and the increase in physiological parameters were lower in the HF50 dairy crosses than in the HF75, implying that the HF50 are better heat tolerant compared to HF75 dairy cattle crosses. Thus, the HF50 dairy crosses are better suited to the warm and humid conditions of Tanga region, Tanzania. Similarly, Holstein Friesian dairy crosses in the 2nd parity showed better tolerance to HS than those in the 3rd parity. Moreover, dairy cattle in the 2nd month of lactation were highly tolerant to HS than those in the 3rd month of lactation. However, the study has demonstrated that both HF50 and HF75 Holstein Friesian crosses reared in the eastern coastal lowlands of Tanzania experience HS as it is indicated by reduction in milk yield and milk composition as well as increase in CBT, RT, RR, and PS when THI values ranged from 82 to 84. There were moderate to strong positive correlations between THI and physiological parameters. But there were very low positive correlations between THI and milk yield and fat percentage whilst protein, lactose, and solids – not – fat percentages were negatively correlated with THI. It is recommended that mitigation strategies such as providing shade, cooling technologies, planting trees in the pasture farm, providing clean water and concentrate feeds, and genetic development of heat-tolerant breeds need to be adopted and promoted in lowland warm and humid areas in Tanzania, to support sustainable dairy cattle farming under changing climatic conditions. Further studies with mathematical modelling describing the daily patterns and thresholds for THI can be useful to mitigate HS and provide alternative mitigation and production strategies.

Author Contributions

Conceptualizations, VH, ASN, ZCN, GM, and SWC; methodology, VH, ASN, ZCN, CC-ED, GM, RM, and SWC; formal analysis, VH, ASN, ZCN, CC-ED, GM, RM, and SWC; data curation, VH; writing-original draft preparation, VH; writing-review; editing and supervision, ASN, ZCN, CC-ED, GM, RM, and SWC. All authors have read and agreed to the published version of the manuscript.

Funding

This research was funded by the Partnership for Skills in Applied Sciences, Engineering, and Technology (PASET) through the Regional Scholarship and Innovation Fund (RSIF) awarded to VH to carry out doctoral studies at Sokoine University of Agriculture, Morogoro, Tanzania, and International Livestock Research Institute (ILRI, Nairobi, Kenya).

Institutional Review Board Statement

This study was approved by the institution ethics committee of Sokoine University of Agriculture (SUA), College of Agriculture guidelines (reference number: SUA/ADM/R.1/8/843). The study was conducted in accordance to the good scientific practices approved by SUA. The animals were restrained by the experienced veterinarians during data collection to minimize the discomfort.

Informed Consent Statement

Not applicable.

Data Availability Statement

Data available on request due to restrictions.

Acknowledgments

The authors acknowledge the assistance provided by staffs at SUA, ILRI, and SACIDS. We thank the staffs and veterinarians at TALIRI - Tanga and National artificial insemination center based in Arusha, Tanzania for their assistance during data collection and milk composition analyses. The funders had no role in the design of the study; in the collection, analyses, or interpretation of data; in the writing of the manuscript; or in the decision to publish the results. The findings and conclusions of this study are those of the authors and do not necessarily represent the views of the funders.

Conflicts of Interest

The authors declare no conflicts of interest.

References

  1. Alfonzo, M. E., Vinicius, M., Barbosa, G., Daltro, S., Stumpf, M. T., Dalcin, V. C., Kolling, G., Fischer, V., Mcmanus, C. M. Relationship between physical attributes and heat stress in dairy cattle from different genetic groups. Int. J. Biometeor. 2016, 60, 245–253. [CrossRef]
  2. Analyzer, M. Lactoscan mccw, 2009.
  3. Armstrong, D. V. Heat Stress Interaction with Shade and Cooling. J. Dairy Sci. 1994, 77(7), 2044–2050. [CrossRef]
  4. Baena, M. M., Costa, A. C., Vieira, G. R., Rocha, R. de F. B., Ribeiro, A. R. B., Ibelli, A. M. G., Meirelles, S. L. C. Heat tolerance responses in a Bos taurus cattle herd raised in a Brazilian climate. J.Therm. Biol. 2019, 81,162–169. [CrossRef]
  5. Baena, M. M., Tizioto, P. C., Meirelles, S. L. C., Regitano, L. C. de A. HSF1 and HSPA6 as functional candidate genes associated with heat tolerance in Angus cattle. Revis. Brasil. Zootec. 2018, 47. [CrossRef]
  6. Bernabucci, U., Biffani, S., Buggiotti, L., Vitali, A., Lacetera, N., Nardone, A. The effects of heat stress in Italian Holstein dairy cattle. J. Dairy Sci. 2014, 97(1), 471–486. [CrossRef]
  7. Bertocchi, L., Vitali, A., Lacetera, N., Nardone, A., Varisco, G., Bernabucci, U. Seasonal variations in the composition of Holstein cow’s milk and temperature-humidity index relationship. Animal, 2014, 8(4), 667–674. [CrossRef]
  8. Bohmanova, J., Misztal, I., Cole, J. B. Temperature-humidity indices as indicators of milk production losses due to heat stress. J. Dairy Sci. 2007, 90(4), 1947–1956. [CrossRef]
  9. Bokharaeian, M., Toghdory, A., Ghoorchi, T., Nejad, J. G., Iman, J. E. Quantitative Associations between Season,Month, and Temperature-Humidity Index with Milk Yield, Composition, Somatic Cell Counts, and Microbial Load: A Comprehensive Study across Ten Dairy Farms over an Annual Cycke Annual Cycle. Animals.2023, 13,3205. [CrossRef]
  10. Bouraoui, Rashid, Lahmar, M., Majdoub, A., Djemali, M., Belyea, R. The relationship of temperature-humidity index with milk production of dairy cows in a Mediterranean climate. Anim.Res. 2002, 51, 479–491. [CrossRef]
  11. Contreras-Jodar, A., Nayan, N. H., Hamzaoui, S., Caja, G.,Salama, A. A. K. Heat stress modifies the lactational performances and the urinary metabolomic profile related to gastrointestinal microbiota of dairy goats. PLoS ONE. 2019, 14(2),1–14. [CrossRef]
  12. Corazzin, M., Saccà, E., Lippe, G., Romanzin, A., Foletto, V., Da Borso, F., Piasentier, E. Effect of heat stress on 1dairy cow performance and on expression of protein metabolism genes in mammary cells. Animals. 2020, 10(11),1–13. [CrossRef]
  13. Da1do-Senn, B., Ouellet, V., Dahl, G. E., Laporta, J. Methods for assessing heat stress in preweaned dairy calves exposed to chronic heat stress or continuous cooling. J. Dairy Sci. 2020, 103(9), 8587–8600. [CrossRef]
  14. Djelailia, H., M’hamdi, N., Bouraoui, R., Najar, T. Effects of thermal stress on physiological state and hormone concentrations in holstein cows under arid climatic conditions. S. Afric. J. Anim. Sci. 2021, 51(4), 452–459. [CrossRef]
  15. Dong, J., Wang, D., Wang, T., Liu, Y., Qin, G., Zhen, Y., Li, S., Sun, Z., Chen, X., Zhang, X., Aschalew, N. D. The physiological dissimilarities of Holstein dairy cows with different milk yields. Veter. Medic. Sci. 2023, 9, 429–442. [CrossRef]
  16. Ekine-Dzivenu, C. C., Mrode, R., Oyieng, E., Komwihangilo, D., Lyatuu, E., Msuta, G., Ojango, J. M. K., Okeyo, A. M. Evaluating the impact of heat stress as measured by temperature-humidity index (THI) on test-day milk yield of small holder dairy cattle in a sub-Sahara African climate. Livest. Sci.2020, 242, 104314. [CrossRef]
  17. Fabris, T. F., Laporta, J., Skibiel, A. L., Corra, F. N., Senn, B. D., Wohlgemuth, S. E., Dahl, G. E. Effect of heat stress during early , late , and entire dry period on dairy cattle. J. Dairy Sci. 2019, 102(6), 5647–5656. [CrossRef]
  18. Garcia, A. B., Angeli, N., Machado, L., de Cardoso, F. C., Gonzalez, F. Relationships between heat stress and metabolic and milk parameters in dairy cows in southern Brazil. Trop. Anim. Heal. Prod. 2015, 47(5), 889–894. [CrossRef]
  19. Garner, J. B., Douglas, M. L., Williams, S. R. O., Wales, W. J., Marett, L. C., Nguyen, T. T. T., Reich, C. M., Hayes, B. J. (2016). Genomic selection improves heat tolerance in dairy cattle. Scient. Reports. 2016, 6, 1–9. [CrossRef]
  20. Habimana, V., Nguluma, A. S.; Nziku, Z. C.; Ekine-Dzivenu, C. C., Morota, G., Mrode, R.; Chenyambuga, S. W. Heat stress effects on milk yield traits and metabolites and mitigation strategies for dairy cattle breeds reared in tropical and sub-tropical countries. Front. Veter. Sci. 2023a, 10. [CrossRef]
  21. Habimana, V., Ekine-Dzivenu, C. C., Nguluma, A. S., Nziku, Z. C., Morota, G., Chenyambuga, S. W., Mrode, R. Genes and models for estimating genetic parameters for heat tolerance in dairy cattle. Front. Genet. 2023b, 14,1–13. [CrossRef]
  22. Islam, M. A., Lomax, S., Doughty, A. K., Islam, M. R., Clark, C. E. F. Automated monitoring of panting for feedlot cattle: Sensor system accuracy and individual variability. Animals. 2020, 10(9), 1–20. [CrossRef]
  23. Kibona, C. A., Yuejie, Z., Tian, L. Towards developing a beef meat export oriented policy in Tanzania: -Exploring the factors that influence beef meat exports-. Plos One. 2022, 17(6). [CrossRef]
  24. Kim, W. S., Lee, J. S., Jeon, S. W., Peng, D. Q., Kim, Y. S., Bae, M. H., Jo, Y. H., Lee, H. G. Correlation between blood, physiological and behavioral parameters in beef calves under heat stress. Asian-Austral. J. Anim. Sci. 2018, 31(6), 919–925. [CrossRef]
  25. Kimaro, E. G., Mor, S. M., Toribio, J. L. M. L. Climate change perception and impacts on cattle production in pastoral communities of northern Tanzania. Pastor.: Res. Policy Pract. 2018, 8(19), 1–16. [CrossRef]
  26. Kiyabo, S., Id, M., Hernandez-castro, L. E., Shirima, G. M., Mengele, J., Bwatota, S. F., Mark, B., Bronsvoort, D. C., Lyatuu, E. T., Komwihangilo, D. M., Anne, E., Cook, J. Seroepidemiology of Leptospira serovar Hardjo and associated risk factors in smallholder dairy cattle in Tanzania. PLOS Negl. Trop. Dis. 2023, 17(4),1–16. [CrossRef]
  27. Lallo, C. H. O., Cohen, J., Rankine, D., Taylor, M., Cambell, J., Stephenson, T. Characterizing heat stress on livestock using the temperature humidity index (THI)—prospects for a warmer Caribbean. Reg. Envir. Change, 2018, 18(8), 2329–2340. [CrossRef]
  28. Lambertz, C., Sanker, C., Gauly, M. Climatic effects on milk production traits and somatic cell score in lactating Holstein-Friesian cows in different housing systems. J. Dairy Sci. 2014, 97(1), 319–329. [CrossRef]
  29. Lim, D. H., Kim, T. Il, Park, S. M., Ki, K. S., Kim, Y. Evaluation of heat stress responses in Holstein and Jersey cows by analyzing physiological characteristics and milk production in Korea. J. Anim. Sci. Techn. 2021a, 63(4),872–883. [CrossRef]
  30. Lim, D. H., Mayakrishnan, V., Ki, K. S., Kim, Y., Kim, T. Il. The effect of seasonal thermal stress on milk production and milk compositions of Korean Holstein and Jersey cows. Anim. Biosci.. 2021b, 34(4), 567–574. [CrossRef]
  31. Mader, T. L., Davis, M. S., Brown-Brandl, T. Environmental factors influencing heat stress in feedlot cattle. J. Anim. Sci. 2006, 84(3), 712–719. [CrossRef]
  32. Mbuthia, J. M., Mayer, M., Reinsch, N. Modeling heat stress effects on dairy cattle milk production in a tropical environment using test-day records and random regression models. Animal. 2021, 15(8), 100222. [CrossRef]
  33. Mbuthia, Jackson M., Eggert, A., Reinsch, N. Cooling temperature humidity index-days as a heat load indicator for milk production traits. Front. Anim. Sci. 2022, 3,1–9. [CrossRef]
  34. Miyayo, S. F., Owili, P. O., Muga, M. A., Lin, T. H. Analysis of pneumonia occurrence in relation to climate change in Tanga, Tanzania. Inter. J. Envir.Res. Publ. Heal. 2021, 18(9). [CrossRef]
  35. Moore, S. S., Costa, A., Penasa, M., Callegaro, S., De Marchi, M.. How heat stress conditions affect milk yield, composition, and price in Italian Holstein herds. J. Dairy Sci. 2023, 106(6), 4042–4058. [CrossRef]
  36. Neave, H. W., Lomb, J., von Keyserlingk, M. A. G., Behnam-Shabahang, A., Weary, D. M. Parity differences in the behavior of transition dairy cows. J. Dairy Sci. 2017, 100(1), 548–561. [CrossRef]
  37. Nguyen, T. T. T., Bowman, P. J., Haile-Mariam, M., Pryce, J. E., Hayes, B. J. Genomic selection for tolerance to heat stress in Australian dairy cattle. J. Dairy Sci. 2016, 99(4), 2849–2862. [CrossRef]
  38. Niyonzima, Y. B., Strandberg, E., Hirwa, C. D., Manzi, M., Ntawubizi, M., Rydhmer, L. The effect of high temperature and humidity on milk yield in Ankole and crossbred cows. Trop. Anim. Heal.Prod. 2022, 54(2). [CrossRef]
  39. NRC. A guide to environmental research on animals (Washington, DC:National Academy of Sciences). 1971.
  40. Osei-Amponsah, R., Dunshea, F. R., Leury, B. J., Cheng, L., Cullen, B., Joy, A., Abhijith, A., Zhang, M. H., Chauhan, S. S. Heat stress impacts on lactating cows grazing australian summer pastures on an automatic robotic dairy. Animals. 2020, 10(5). [CrossRef]
  41. Ouellet, V., Cabrera, V. E., Fadul-Pacheco, L., Charbonneau. The relationship between the number of consecutive days with heat stress and milk production of Holstein dairy cows raised in a humid continental climate. J. Dairy Sci. 2019, 102(9), 8537–8545. [CrossRef]
  42. Ouellet, Véronique, Toledo, I. M., Dado-Senn, B., Dahl, G. E., Laporta, J. Critical Temperature-Humidity Index Thresholds for Dry Cows in a Subtropical Climate. Front. Anim. Sci. 2021, 2. [CrossRef]
  43. Ravagnolo, O., Misztal, I. Genetic component of heat stress in dairy cattle, parameter estimation. J. Dairy Sci. 2000, 83(9), 2126–2130. [CrossRef]
  44. Reis, N. S., Ferreira, I. C., Mazocco, L. A., Souza, A. C. B., Pinho, G. A. S., Neto, Á. M. d. F., Malaquias, J. V., Macena, F. A., Muller, A. G., Martins, C. F., Balbino, L. C., McManus, C. M. Shade modifies behavioral and physiological responses of low to medium production dairy cows at pasture in an integrated crop-livestock-forest system. Animals. 2021, 11(8). [CrossRef]
  45. Reyad, M. Al, Sarker, M. A. H., Uddin, M. E., Habib, R., Rashid, M. H. U. Effect of heat stress on milk production and its composition of Holstein Friesian crossbred dairy cows. Asian J. Med. Biol. Res. 2016, 2(2), 190–195. [CrossRef]
  46. Rhoads, M. L., Rhoads, R. P., VanBaale, M. J., Collier, R. J., Sanders, S. R., Weber, W. J., Crooker, B. A., Baumgard, L. H. Effects of heat stress and plane of nutrition on lactating Holstein cows: I. Production, metabolism, and aspects of circulating somatotropin. J. Dairy Sci. 2009, 92(5), 1986–1997. [CrossRef]
  47. Ringo, A. E., Nonga, H. E., Galon, E. M., Ji, S., Rizk, M. A., El-Sayed, S. A. E. S., Mohanta, U. K., Ma, Z., Chikufenji, B., Do, T. T., Xuan, X. Molecular Investigation of Tick-Borne Haemoparasites Isolated from Indigenous Zebu Cattle in the Tanga Region, Tanzania. Animals. 2022, 12(22). [CrossRef]
  48. Ripkey, C., Little, P. D., Dominguez-salas, P., Kinabo, J., Mwanri, A., Webb, A. Increased climate variability and sedentarization in Tanzania : Health and nutrition implications on pastoral communities of Mvomero and Handeni districts , Tanzania. Glob. Food Secur., 2021, 29. [CrossRef]
  49. Sabek, A., Li, C., Du, C., Nan, L., Ni, J., Elgazzar, E., Ma, Y., Salem, A. Z. M., Zhang, S. Effects of parity and days in milk on milk composition in correlation with β-hydroxybutyrate in tropic dairy cows. Trop. Anim. Heal. Prod. 2021, 53(2),4–11. [CrossRef]
  50. Shija, D. S., Mwai, O. A., Ojango, J. M. K., Komwihangilo, D. M., Bebe, B. O. Assessing Lactation Curve Characteristics of Dairy Cows Managed under Contrasting Husbandry Practices and Stressful Environments in Tanzania. World. 2022, 3(4), 1032–1052. [CrossRef]
  51. Smith, D. L., Smith, T., Rude, B. J., Ward, S. H. Short communication: Comparison of the effects of heat stress on milk and component yields and somatic cell score in Holstein and Jersey cows. J. Dairy Sci. 2013, 96(5), 3028–3033. [CrossRef]
  52. Song, J., Yu, Q., Wang, X., Wang, Y., Zhang, Y., Sun, Y. Relationship between microclimate and cow behavior and milk yield under low-temperature and high-humidity conditions. Front. Ecol. Evol. 2023, 11,1–10. [CrossRef]
  53. Stumpf, M. T., Kolling, G. J., Fischer, V., dos Santos Daltro, D., Alfonzo, E. P. M., Dalcin, V. C., Dias, L. T., da Silva, M. V. G. B., Peripolli, V., McManus, C. M. Elevated temperature-humidity index induces physiological, blood and milk alterations in Holstein cows in a more pronounced manner than in ½ and ¾ Holstein × Gir. J. Anim. Behav. Biomet. 2021, 9(4). [CrossRef]
  54. Sungkhapreecha, P., Chankitisakul, V., Duangjinda, M., Buaban, S., Boonkum, W. Determining Heat Stress Effects of Multiple Genetic Traits in Tropical Dairy Cattle Using Single-Step Genomic BLUP. Veter. Sci. 2022, 9(2),1–13. [CrossRef]
  55. Talukder, S., Qiu, D., Thomson, P. C., Cheng, L., Cullen, B. R. Impact of heat stress on dairy cow rumination , milking frequency , milk yield and quality in a pasture-based automatic milking system. Anim. Prod. Sci. 2023.doi.org/10.1071/AN22334.
  56. Tian, H., Zheng, N., Wang, W., Cheng, J., Li, S., Zhang, Y., Wang, J. Integrated metabolomics study of the milk of heat-stressed lactating dairy cows. Scientif. Reports. 2016, 6 1–10. [CrossRef]
  57. URT. Report of the ministry of livestock and fisheries. In United Republic of Tanzania. 2021, (4), 1.
  58. URT. Report of the ministry of livestock and fisheries. United Republic of Tanzania. 2023, (5), 2.
  59. Velayudhan, S. M., Brügemann, K., Sejian, V., Bhatta, R., Schlecht, E., Pinto, A., Yin, T., Reichenbach, M., König, S. Effects of Heat Stress across the Rural-Urban Interface on Phenotypic Trait Expressions of Dairy Cattle in a Tropical Savanna Region. Sustainability. 2022, 14(8). [CrossRef]
  60. West, J. W. Effects of heat-stress on production in dairy cattle. J. Dairy Sci. 2003, 86(6), 2131–2144. [CrossRef]
  61. Yan, G., Liu, K., Hao, Z., Shi, Z., Li, H. The effects of cow-related factors on rectal temperature, respiration rate, and temperature-humidity index thresholds for lactating cows exposed to heat stress. J. Therm. Biol. 2021a, 100,103041. [CrossRef]
  62. Yan, G., Shi, Z., Li, H. Critical temperature-humidity index thresholds based on surface temperature for lactating dairy cows in a temperate climate. Agric. 2021b, 11(10), 1–16. [CrossRef]
  63. Yang, L., Yang, Q., Yi, M., Pang, Z. H., Xiong, B. H. Effects of seasonal change and parity on raw milk composition and related indices in Chinese Holstein cows in northern China. J. Dairy Sci. 2013, 96(11), 6863–6869. [CrossRef]
  64. Yue, S., Ding, S., Zhou, J., Yang, C., Hu, X., Zhao, X., Wang, Z., Wang, L., Peng, Q., Xue, B. Metabolomics Approach Explore Diagnostic Biomarkers and Metabolic Changes in Heat-Stressed Dairy Cows. Animal. 2020, 10(1741).
  65. Zhou, M., Aarnink, A. J. A., Huynh, T. T. T., van Dixhoorn, I. D. E., Groot Koerkamp, P. W. G. Effects of increasing air temperature on physiological and productive responses of dairy cows at different relative humidity and air velocity levels. J. Dairy Sci. 2022, 105(2), 1701–1716. [CrossRef]
Figure 1. Average temperature and THIs variation across the months of the study period.
Preprints 108452 g001
Figure 2. Relationship between THI and milk yield (P< 0.05).
Preprints 108452 g002
Figure 3. Relationship between THI and fat percentage (P < 0.05).
Preprints 108452 g003
Figure 4. Relationship between THI and protein percentage (P < 0.05).
Preprints 108452 g004
Figure 5. Relationship between THI and lactose percentage (P < 0.05).
Preprints 108452 g005
Figure 6. Relationship between THI and solids - not – fat percentage (P < 0.05).
Preprints 108452 g006
Figure 7. Relationship between THI and CBT (P < 0.05).
Preprints 108452 g007
Figure 8. Relationship between THI and RT (P < 0.05).
Preprints 108452 g008
Figure 9. Relationship between THI and RR (P < 0.05).
Preprints 108452 g009
Figure 10. Relationship between THI and PS (P < 0.05).
Preprints 108452 g010
Table 1. Number of cows used in the study during the hot and cool seasons.
Item Hot season Cool season
Number of dairy cows 16 13
HF50 10 8
HF75 6 5
2nd parity 10 6
3rd parity 6 4
4th parity - 3
2nd month of lactation 11 10
3rd month of lactation 5 3
Note: HF50 = Holstein Friesian crosses with 50% blood level, HF75 = Holstein Friesian crosses with 75% blood level.
Table 2. Feed ingredients and chemical composition of the concentrate diet.
Item Amount (g/kg DM)
Ingredients -
Maize bran 750
Sunflower seed cake 195
Lucerne meal 25
Limestone 10
Kitchen salt 5
Josera/mineral mixture 15
Chemical composition of the mixed diet -
Crude protein 16.30
Crude fiber 10.07
Crude fat 27.8
Metabolizable energy (MJ/kg DM) 10.6
Ash 3.5
Table 3. Scale used for respiratory rate and panting score.
Panting score (PS) Breathing condition Respiration rate (RR) (breaths/min)
0 Normal panting-normal (difficult to see chest movement). Respiration rate less than/equal to ≤ 40 breaths/min
1 Slight panting-mouth closed; no drool or foam, easy to see chest movement. Respiration rate of 40–70 breaths/min
2 Fast panting-drool or foam present; no open mouth panting. Respiration rate of 70–120 breaths/min
2.5 Like panting score 2 but with occasional open mouth, tongue not extended. Respiration rate of 70–120 breaths/min.
3 Open mouth with some drooling; neck extended and head usually up. Respiration rate of 120–160 breaths/min.
3.5 Like panting score 3 but with tongue protruded slightly, occasionally fully extended for short periods with excessive drooling. Respiration rate of 120–160 breaths/min.
4 Open mouth with tongue fully extended for prolonged periods and excessive drooling; neck extended and head up. Respiration rate greater than 160 breaths/min and may be variable due to phase shift in respiration.
4.5 As for 4 but head held down; cattle ‘breath’ from flank; drooling may cease. Variable-RR may decrease.
* Panting scores were assigned based on visual observation of respiratory dynamic and behavior, not on the estimation of respiration rate. Source: [31].
Table 4. Environmental conditions during the experimental periods.
Parameters Season period
Hot Cool
Days for temperature and RH recording 118 122
Mean temperature (oC) 28.60 25.25
Minimum temperature (oC) 23.50 21.00
Maximum temperature (oC) 32.60 28.00
Mean relative humidity (RH%) 75.37 78.22
Minimum relative humidity (RH%) 58.00 60.00
Maximum relative humidity (RH%) 96.00 97.00
Mean daily THI 81 79
Minimum daily THI 78 76
Maximum daily THI 84 82
Table 5. Effect of THI, genotype, parity, and months of lactation on milk yield and milk composition parameters of crossbred dairy cattle.
Non-genetic parameters Milk yield and composition parameters
Milk (L/d) Fat% Protein% Lactose% SNF%
THI 76-78 2.25±0.03a 2.72±0.04a 3.17±0.02a 4.74±0.04a 8.62±0.07a
79-81 3.46±0.04b 2.64±0.05b 3.13±0.02a 4.69±0.04a 8.51±0.07a
82-84 3.51±0.04b 2.98±0.06c 3.06±0.03b 4.61± 0.03b 8.34±0.08b
P-value ˂0.05 ˂0.05 ˂0.05 <0.05 <0.05
Genotype HF50 3.03±0.04a 2.78±0.03a 3.16±0.02a 4.75±0.03a 8.62±0.06a
HF75 3.55±0.04b 2.72±0.04a 3.08±0.02b 4.61±0.03b 8.37±0.06b
P-value ˂0.05 ˂0.05 <0.05 <0.05 <0.05
Parity 2 3.41± 0.03a 2.75±0.04a 3.14±0.02a 4.70±0.03a 8.55±0.06a
3 3.09± 0.03b 2.75±0.04a 3.13±0.02a 4.68±0.04b 8.52±0.07a
4 3.71± 0.06c 2.69±0.04b 3.12±0.04a 4.67±0.07b 8.48±0.12b
P-value <0.05 ˂0.05 ˂0.05 ˂0.05 ˂0.05
Months of lactation 2 3.62± 0.03a 2.69±0.04a 3.09±0.02a 4.64±0.02a 8.41±0.06a
3 3.19± 0.04b 2.81± 0.05b 3.15±0.02b 4.73±0.04b 8.58±0.08b
P-value <0.05 <0.05 <0.05 <0.05 <0.05
Means on the same column are significantly different (P≤0.05); THI = Temperature - Humidity Index; HF50 = Holstein Friesian with 50% blood level; HF75 = Holstein Friesian with 75% blood level; milk yield; fat percentage, protein percentage; lactose percentage; SNF = solids - not - fat percentage.
Table 6. Effect of THI, genotype, parity, and months of lactation on physiological parameters of crossbred dairy cattle.
Non-genetic parameters Physiological parameters
CBT (oC) RT (oC) RR (breaths/min) PS
THI 76-78 35.16±0.03a 38.04±0.02a 59.74±0.30a 1.31±0.01a
79-81 35.32±0.01a 38.15±0.02b 69.79±0.34b 1.46±0.01b
82-84 36.24±0.01b 38.27±0.02b 72.78± 0.29c 1.46±0.01b
P-value ˂0.05 <0.05 ˂0.05 ˂0.05
Genotype HF50 35.57±0.02a 38.21±0.02a 64.95±0.28a 1.37±0.01a
HF75 35.57±0.02a 38.06±0.02b 63.34±0.28b 1.36±0.01b
P-value ˂0.05 ˂0.05 ˂0.05 ˂0.05
Parity 2 35.84±0.01a 38.10±0.06a 68.43±0.27a 1.37±0.02a
3 35.82±0.03a 38.30±0.03b 68.79± 0.30a 1.35±0.02b
4 35.56±0.01b 37.90±0.05a 65.09± 0.53c 1.33±0.04b
P-value <0.05 <0.05 <0.05 ˂0.05
Months of lactation 2 35.54±0.01a 38.07±0.02a 66.14±0.30a 1.34±0.01a
3 35.60±0.02b 38.19±0.03b 68.73±0.32b 1.36±0.02a
P-value <0.05 <0.05 <0.05 <0.05
Means on the same column are significantly different (P≤0.05); THI = Temperature - Humidity Index; HF50 = Holstein Friesian with 50% blood level; HF75 = Holstein Friesian with 75% blood level; CBT = core - body temperature; RT = rectal temperature RR = respiratory rate; PS = panting score.
Table 7. Effect of interaction of genotype and THI on milk yield, milk composition, and physiological parameters of dairy cattle.
Genotype HF50 HF75 P-value
THI Class 76-78 79-81 82-84 76-78 79-81 82-84
Milk yield (L/d) 2.68±0.08a 2.81±0.05a 3.58±0.04b 3.53±0.10b 3.68±0.05c 3.45±0.05b <0.05
Fat % 2.74±0.10a 2.86±0.06b 2.84±0.04b 2.53±0.12c 2.74±0.07a 2.83±0.05b <0.05
Protein % 3.26±0.05a 3.27±0.28a 3.11±0.02b 3.03±0.06c 3.08±0.04c 3.09±0.03c <0.05
Lactose % 4.89±0.08a 4.90±0.05a 4.67±0.03b 4.53±0.10c 4.61±0.06b 4.63±0.04b <0.05
SNF % 8.88±0.15a 8.92±0.10a 8.49±0.06b 8.25±0.19c 8.38±0.12b 8.42±0.08b <0.05
CBT (oC) 35.22±0.04a 35.34±0.02a 36.10±0.02b 35.23±0.05a 35.37±0.02a 36.14±0.02b <0.05
RT (oC) 38.07±0.06a 38.07±0.03a 38.20±0.03b 38.14±0.07c 38.11±0.03c 38.12±0.03c <0.05
RR (breaths/min) 55.51±0.70a 62.97±0.41b 72.72±0.40c 55.73±0.83a 62.29±0.43b 72.52±0.41c <0.05
PS 1.23± 0.04a 1.38± 0.02b 1.44± 0.02c 1.21± 0.04a 1.37± 0.02b 1.47± 0.02c <0.05
Means on the same row are significantly different (P≤0.05); THI = Temperature-Humidity Index; HF50 = Holstein Friesian with 50% blood level; HF75 = Holstein Friesian with 75% blood level; milk yield; fat percentage, protein percentage; lactose percentage; SNF = solids-not-fat percentage; CBT = core - body temperature (oC); RT = rectal temperature (oC); RR = respiratory rate (breaths/min); PS = panting score.
Table 8. Effect of parity and THI on milk yield, milk composition, and physiological parameters of dairy cattle.
Parity 2nd parity 3rd parity 4th parity P-value
THI 76-78 79-81 82-84 76-78 79-81 82-84 76-78 79-81 82-84
Milk 3.08±0.09a 3.38±0.05b 3.52±0.03c 2.84±0.12d 2.61±0.06d 3.34±0.04b 3.66±0.13c 3.58±0.06c 3.19±0.25b <0.05
Fat % 2.66±0.11a 2.83±0.07b 2.84±0.04b 2.65±0.14a 2.87±0.09b 2.86±0.05b 2.70±0.16c 2.70±0.10c 2.49±0.22a <0.05
Protein 3.24±0.06a 3.25±0.04a 3.09±0.02b 3.12±0.08c 3.20±0.05a 3.11±0.03c 3.08±0.09b 3.10±0.05c 3.28±0.12a <0.05
Lactose 4.87±0.10a 4.85±0.06a 4.64±0.03a 4.67±0.12b 4.80±0.08a 4.65±0.05b 4.61±0.14b 4.64±0.08b 4.92±0.19c <0.05
SNF % 8.84±0.17a 8.84±0.11a 8.44±0.22b 8.49±0.22b 8.71±0.14a 8.46±0.09b 8.39±0.24b 8.41±0.15b 8.94±0.35c <0.05
CBT (oC) 35.23±0.04a 35.41±0.02b 36.18±0.01c 35.29±0.06a 35.36±0.03b 36.19±0.02c 35.18±0.06c 35.27±0.03a 35.30±0.12b <0.05
RT (oC) 38.18±0.06a 38.17±0.03a 38.21±0.02b 38.06±0.08c 38.05±0.04c 38.22±0.03b 38.07±0.09c 38.01±0.04c 37.87±0.17d <0.05
RR 55.83±0.79a 63.28±0.45b 73.09±0.31c 56.31±0.97a 62.97±0.53b 74.04±0.36c 54.41±1.07a 61.44±0.56b 64.38±2.05b <0.05
PS 1.26±0.04a 1.40±0.02b 1.46±0.01b 1.19±0.05c 1.37±0.03d 1.48±0.02b 1.18±0.06c 1.36±0.03d 1.45±0.11b <0.05
Means on the same row are significantly different (P≤0.05); THI = Temperature-Humidity Index; Milk yield in liters per day; fat percentage, protein percentage; lactose percentage; SNF = solids - not - fat percentage; CBT = core-body temperature (0C); RT = rectal temperature (0C); RR = respiratory rate (breaths/min); PS = panting score.
Table 9. Effect of months of lactation and THI on milk yield, milk composition, and physiological parameters of dairy cattle.
Lactation month 2nd month of lactation 3rd month of lactation P-value
THI 76-78 79-81 82-84 76-78 79-81 82-84
Milk yield (L/d) 3.33±0.07a 3.38±0.04a 3.87±0.05b 2.98±0.13c 3.25± 0.07a 3.18± 0.06a <0.05
Fat % 2.62±0.08a 2.78±0.05b 2.78±0.03b 2.66±0.15a 2.79±0.10b 2.90±0.05c <0.05
Protein % 3.15±0.05a 3.19±0.03a 3.07±0.02b 3.18±0.09a 3.15±0.05a 3.14±0.03a <0.05
Lactose % 4.71±0.07a 4.77±0.04a 4.60±0.03b 4.75±0.14a 4.72±0.08a 4.72±0.05a <0.05
SNF % 8.57±0.13a 8.69±0.08b 8.36±0.06c 8.64±0.25b 8.55±0.15a 8.57±0.09a <0.05
CBT (oC) 35.15±0.03a 35.29±0.02a 36.03±0.02b 35.32±0.06a 35.40±0.03a 36.21±0.02b <0.05
RT (oC) 38.04±0.05a 38.03±0.03a 38.14±0.03b 38.20±0.09c 38.18±0.05b 38.17±0.03b <0.05
RR (breaths/min) 54.37±0.62a 61.34±0.37b 71.47±0.42c 56.51±1.10a 64.20±0.60b 73.66±0.41c <0.05
PS 1.21±0.03a 1.37±0.02b 1.44±0.02c 1.22±0.06a 1.37±0.03b 1.48±0.02c <0.05
Means on the same row are significantly different (P≤0.05); THI = Temperature-Humidity Index; Milk yield in liters per day; fat percentage, protein percentage; lactose percentage; SNF = solids-not-fat percentage; CBT = core-body temperature (0C); RT = rectal temperature (0C); RR = respiratory rate (breaths/min); PS = panting score.
Table 10. Pearson correlation coefficients between THI, and milk yield, and milk composition parameters.
Milk yield and composition parameters THI Fat % Prot % Lact %
Milk yield 0.24023*
Fat % 0.15598**
Prot % -0.15029** 0.19051*
Lact % -0.13537** 0.23410* 0.98623*
SNF % -0.14132** 0.22388* 0.99625* 0.98957*
*P <.0001; **P ≤0.05; THI = Temperature-Humidity Index; Milk yield in liters per day; fat percentage, protein percentage; lactose percentage; SNF = solids - not - fat percentage.
Table 11. Pearson correlation coefficients between THI and physiological parameters.
Physiological parameters THI CBT RT RR
CBT 0.67457*
RT 0.63497* 0.52908*
RR 0.63497* 0.72192* 0.66772*
PS 0.16427* 0.52930* 0.70487* 0.69245*
*P <0.0001; THI = Temperature-Humidity Index; CBT = core-body temperature (0C); RT = rectal temperature (0C); RR = respiratory rate (breaths/min); PS = panting score.
Disclaimer/Publisher’s Note: The statements, opinions and data contained in all publications are solely those of the individual author(s) and contributor(s) and not of MDPI and/or the editor(s). MDPI and/or the editor(s) disclaim responsibility for any injury to people or property resulting from any ideas, methods, instructions or products referred to in the content.
Copyright: This open access article is published under a Creative Commons CC BY 4.0 license, which permit the free download, distribution, and reuse, provided that the author and preprint are cited in any reuse.
Prerpints.org logo

Preprints.org is a free preprint server supported by MDPI in Basel, Switzerland.

Subscribe

© 2024 MDPI (Basel, Switzerland) unless otherwise stated