1. Introduction
Electric power systems (EPS) are experiencing continuous progress in their components, including generation, transmission, distribution, and demand. This advance aims to reduce operating costs and losses, guaranteeing the reliability and quality of the service. The transmission system serves the function of being the link between power generation and load. As the number of users increases, transmission networks become more complex, giving rise to terms such as overloaded or underloaded lines, discrepancies in voltage profiles, and increased active and reactive power flows. This increase leads to the generation of power losses and voltage drops [
1].
The losses in the EPS are defined as the difference between the power generated and the power consumed by the load. Losses occur due to heat dissipation in the lines, in the cores of the transformers, or due to different physical phenomena in the system’s elements while they are energized. We can consider the losses as energy losses at an instant and intervals, called energy losses. Losses can be classified as technical or non-technical; technical losses are produced by energy transport or transformation caused by the corona effect, joule effect, eddy currents, and hysteresis. Non-technical losses are reflected in the systems’ effectiveness and precision in the measurement equipment, according to the electrical company. The determination of losses in transmission and sub-transmission systems is carried out through power flow analysis, in which the results are obtained from the voltages and powers in the nodes of the system. To achieve this, it is essential to have detailed knowledge of all line parameters. In the case of transformers, it is necessary to have complete information on iron and copper losses. The energy losses in the lines and the transformers can be obtained using the load duration curve or the loss factor. The analysis of losses in the EPS needs to mitigate failures, and the best option is the optimal use of generation and transmission, dispensing reagents, and minimizing elements; through optimal power flows, adequate use can be achieved and ideal in the system [
2,
3,
4].
Several researchers suggest the integration of compensators in the nodes of the transmission system to reduce reactive power. These studies also address the optimal placement of SVC (Static Synchronous Compensator) to improve voltage stability and reduce drifts. These optimizations are achieved through techniques such as HPSO (Hybrid Particle Swarm Optimization), genetic algorithms (GA), bee colonies, and multi-criteria decision-making methods (MCDM), among others. Applying these methodologies not only contributes to the stability of the electrical system but also reduces generation costs and losses in the transmission system [
5,
6].
Implementing strategies in the topology of the transmission system can directly impact various aspects, such as voltage adjustments and control of line overloads. These adjustments and controls are crucial to optimize the system’s operation and directly apply to economic dispatch (DE). By efficiently managing the system’s topology, we seek to minimize the associated operating costs, thus contributing to a more efficient and economical operation in transmitting electrical energy [
4].
Current studies on optimal transmission line switching (OTS), also known as Optimal Transmission Switching, have significantly impacted the annual production of developed countries such as China and the United States. This trend is gaining momentum in Latin America, where new research collaborations are being established with countries that have seen notable progress in the field of electrical transmission [
7,
8]. Optimal transmission line switching (OTS) has made it possible to address direct solutions to the cost problem in DE [
4]. Therefore, the studies focused on different adaptation measures to mitigate the problems linked to the OTS, such as overloadability in the lines or generation, optimization of operating costs, the best switching option, response time, medium and high tests large scale in the SEP, identification of poorly conditioned systems, island formation, congestion relief, cascade failure blocking, among others [
8,
9,
10].
The OTS shows a security solution to the needs that arise from the increase in demand, so guaranteeing electrical energy has led to increased restrictions being proposed to cover new objectives based on reliability and quality. of the system [
11,
12]. Therefore, reconfiguring the system through its topology when there are different unforeseen contingencies reduces the losses reflected in the loads [
13,
14].
The mathematical models investigated support different analysis methods such as mixed integer linear optimization for DC flows, where reactive power or the different voltage effects are not considered, so their analysis time is reduced [
15,
16], while other methods with greater precision perform optimal AC flows with mixed integer nonlinear optimization, they increase their restrictions and their analysis time by taking into account all the parameters of the EPS [
17,
18]. On the other hand, there are methods in which hybrid models are integrated to reduce complexity and analysis response times for real systems at different scales and integrate non-conventional renewable energies (NCRE) [
19,
20].
The models above allow us to visualize the advantages and contributions of each one, so considering the losses in the system due to different contingencies entails analyzing all the topological variants that may exist, adapting mechanisms that face these uncertain scenarios, and thus finding the best one. solution to these problems [
21,
22].
Losses in transmission systems are varied, such as those found due to overload in the lines voltage deviations, among others [
23], so evaluate the losses in electrical power systems through corrective control of the system topology for the minimization of losses in transmission lines is the proposal of the article. This study presents a proposed approach using a mixed integer nonlinear programming (MINLP) method based on alternating current optimal power flow (AC-OPF). The evaluation will focus on losses in electrical power systems through corrective control of the system topology to identify an optimal solution to minimize losses in transmission lines.
2. Related Works
Corrective Control of System Topology for Loss Minimization in Transmission Lines allows for studying research trends. In addition, it will facilitate the identification of indicators that account for progress in this area, so carrying out a brief analysis of the scientific results will lead to the problem posed. Therefore, below are sections that detail work related to minimizing Losses in Transmission Lines Based on the Corrective Control of the System Topology.
2.1. Bibliometric Analysis
Bibliometric analysis helps identify various study approaches, exploring structures around a particular topic that indicate worldwide development trends. This analysis considers the different perspectives presented by the authors. Scientific publications can be categorized into specific areas, allowing the measurement of parameters such as the frequency of study in different countries, authors specialized in specific topics, institutions with the greatest impact in particular areas, global collaboration, recent research, as well as the period from which the topic of interest began to emerge, among other aspects. To obtain all the necessary information at a global level, it is essential to have tools that facilitate the collection of data from various global libraries [
24].
Research on transmission line optimization, based on corrective topology control, extracts information from two databases focusing on a specific topic, Optimal Transmission Switching (OTS). This research is visualized through various graphs generated by programs such as VosViewer and Biometrix, covering relevant fields of study and expanding research possibilities.
The main information found in the Scopus database dates back from the years 1973 to 2023; among the magazines and books, they add up to a total of 614 documents, an annual growth rate of 5.1 percent, the average age of the documents is 7.45, the average citations per document are 24.81, the references are 16790, the keywords (ID) in this database reach several 5061 and per author (DE) is 2173, the authors of the documents reach at several 1779, documents with a single author are 26, co-authors per document 3.84, international co-authors 24.14 and 613 validated and relevant articles.
The information found in WoS describes a period of scientific growth from the year 2000 to 2023; sources from magazines and books add up to a total of 1000 documents, an annual growth rate of 4.75 percent, authors who contribute to the database is 3138, authors of autonomous documents 34, international co-authorship of 29.4 percent, co-authors per document at an average of 3.89, author keywords (DE) reach several 4412, references used 25397, average age of the document 6.56 and average of citations per document 17.93.
The appearance of scientific works in the Scopus database dates back to 1973. However, it took five years before research in the field of switching in transmission lines began to increase. It was in 2003 that more notable growth began, continuing until 2005, when the number of articles published surpassed the double-digit mark. In 2009, scientific production in this domain reached a crucial point, exceeding 20 articles per year. Since then, significant growth in scientific research in this area has been evident, as by 2022, there will be approximately 78 articles published in the field.
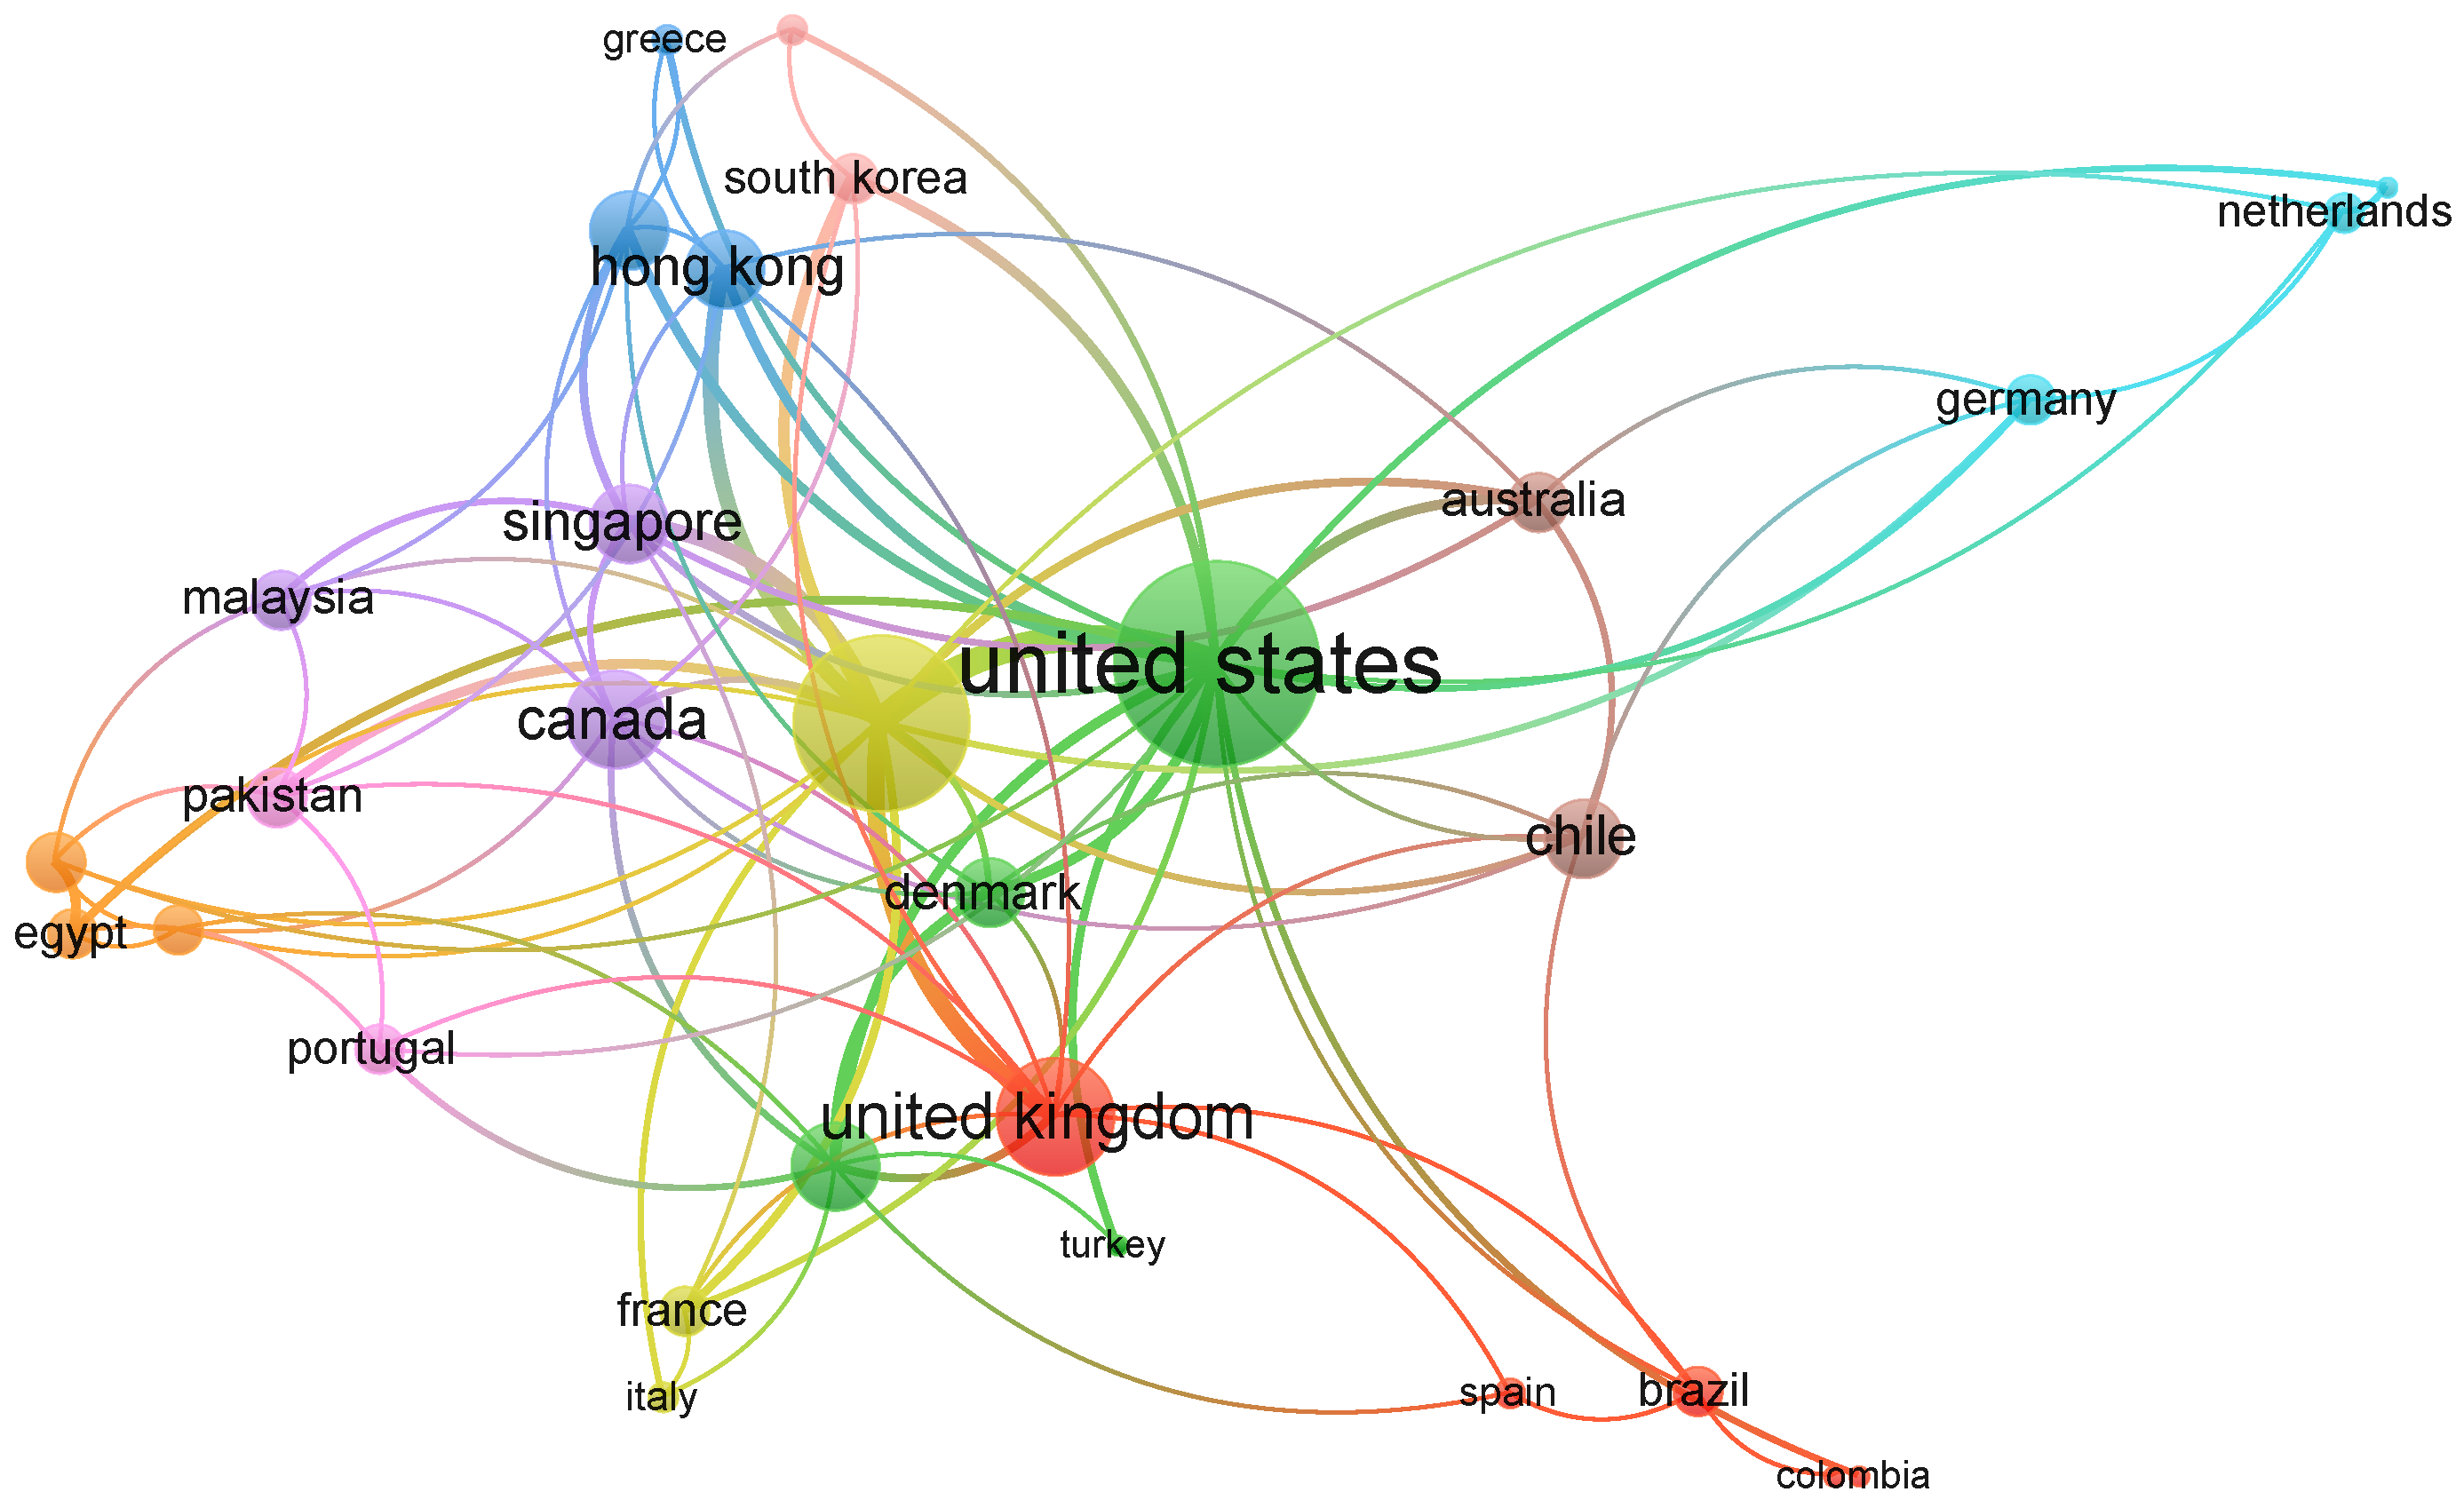
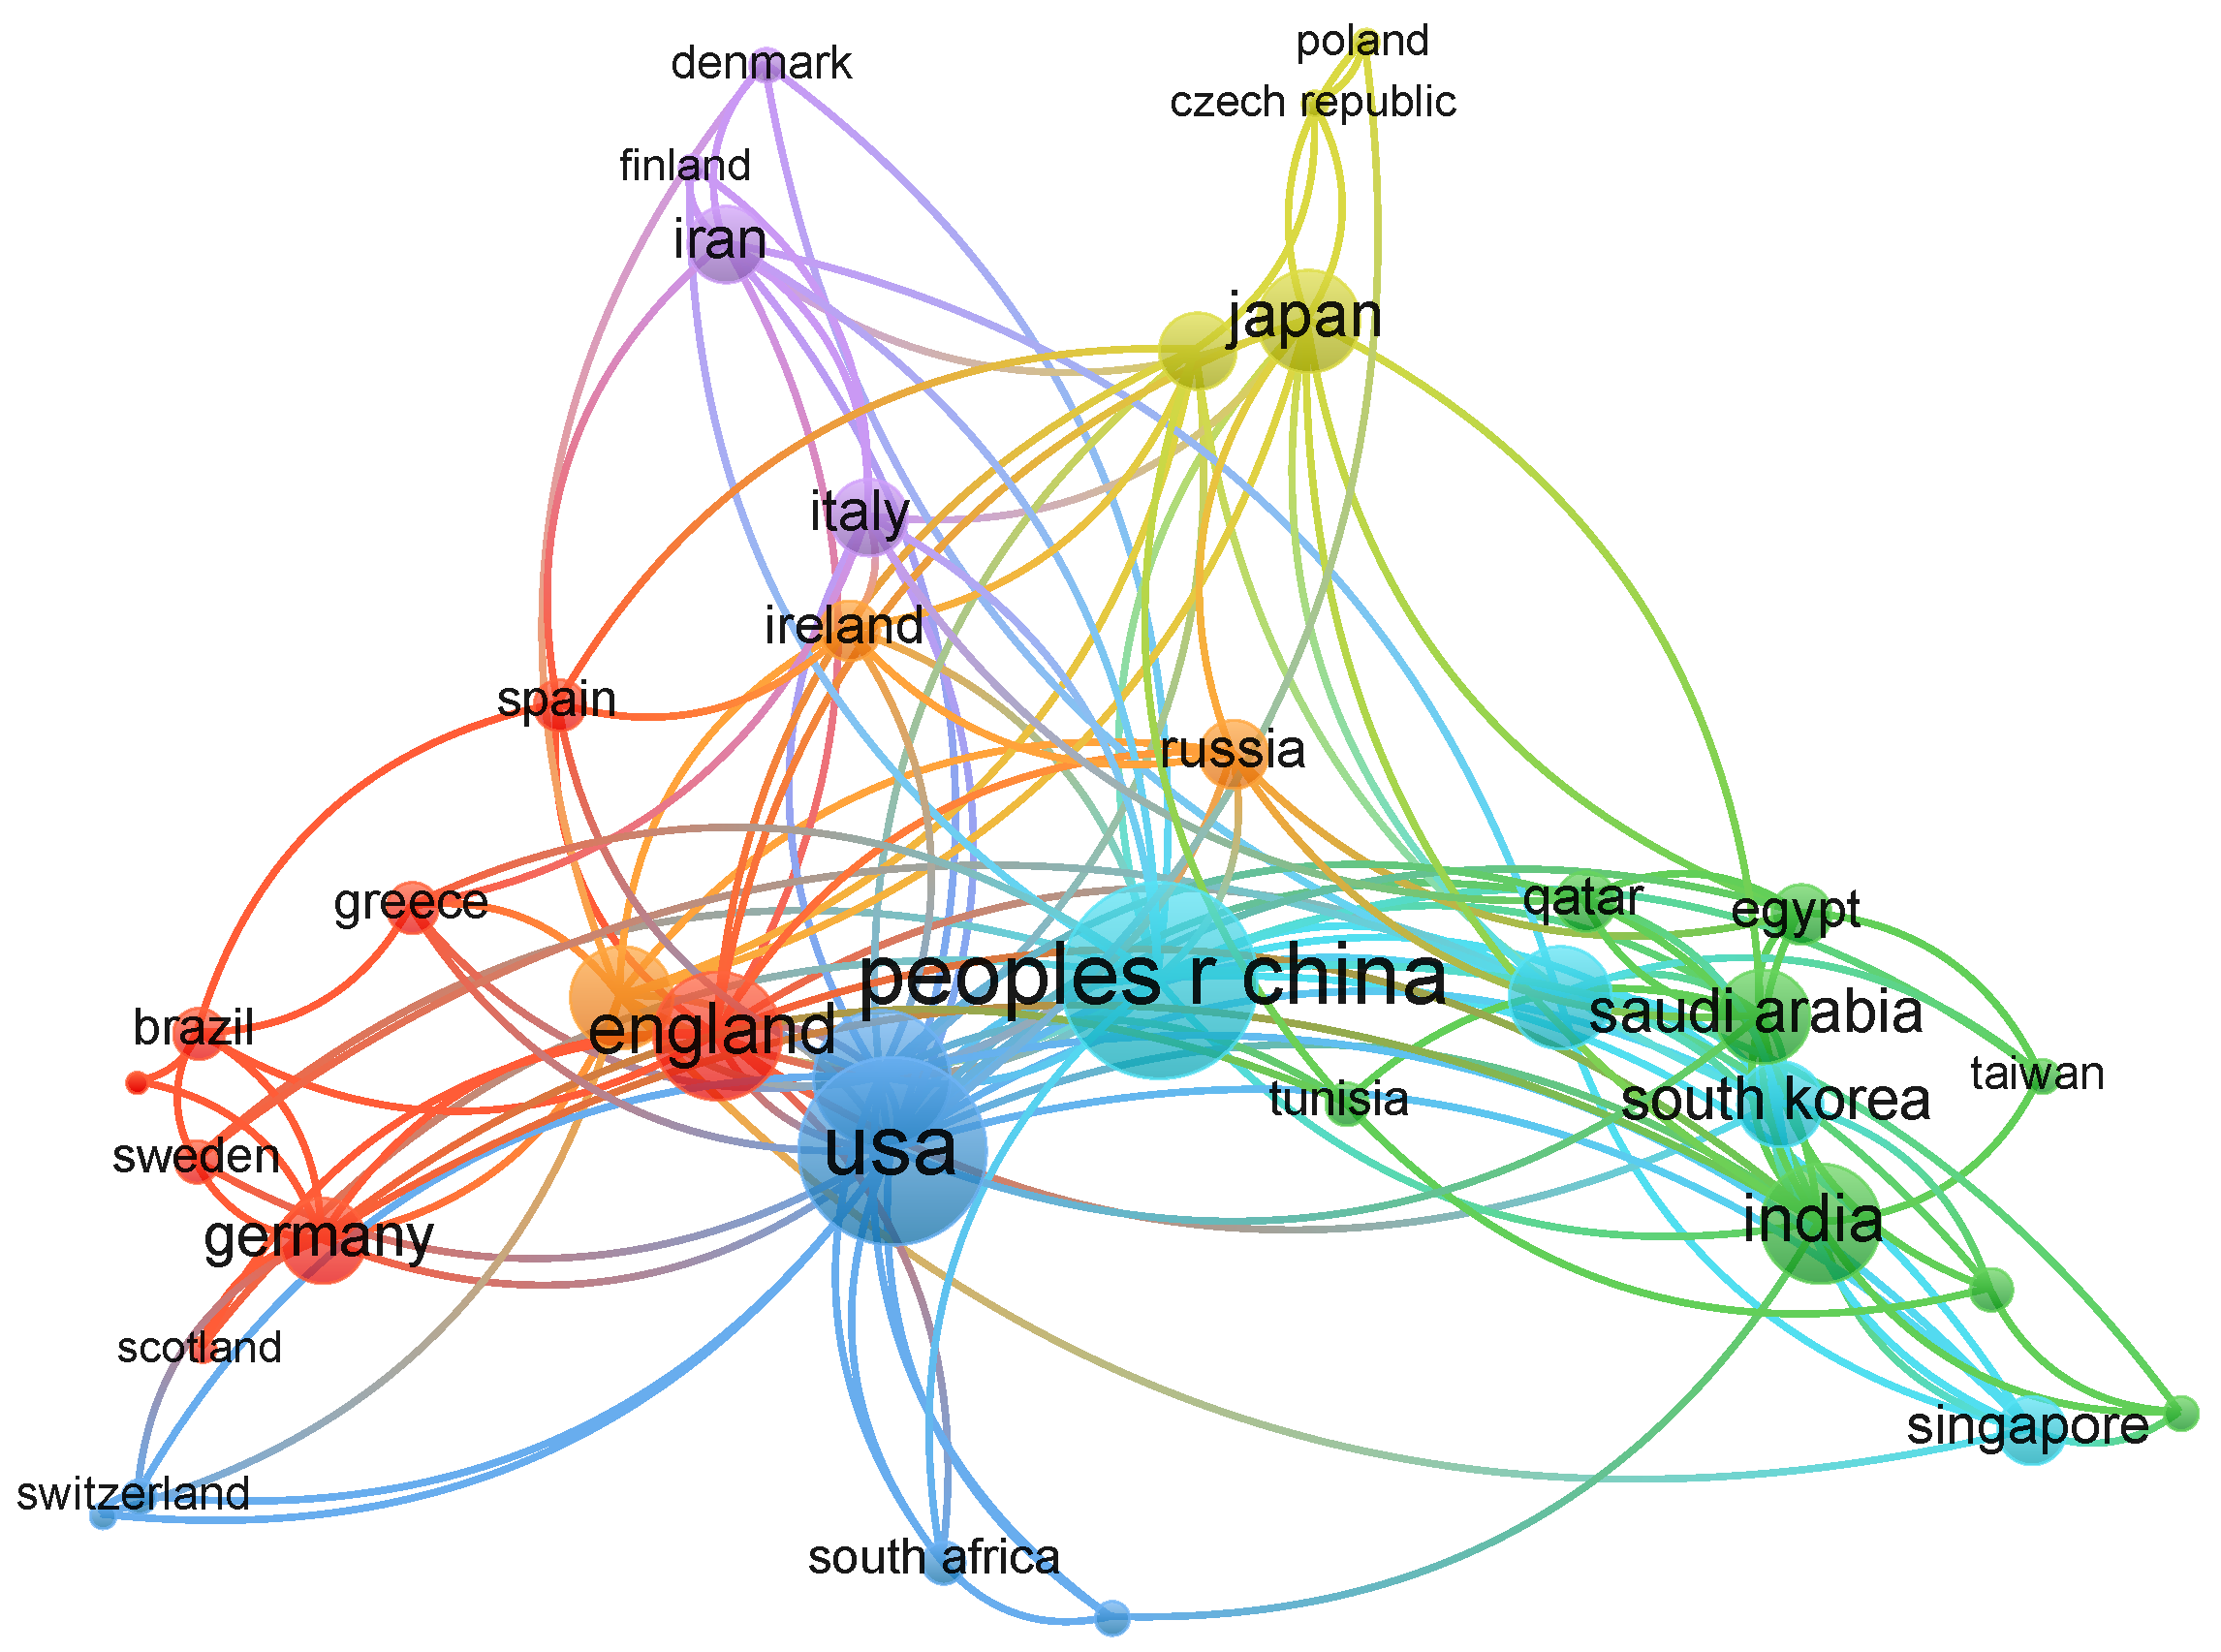
Below, we graphically present the countries that show greater emphasis in the study proposed in the Scopus and WoS databases; see
Figure 1 and
Figure 2, respectively. This allows us to identify the trend in the location where the community that researches transmission lines and their phenomena is mainly concentrated, especially when their original configuration is altered.
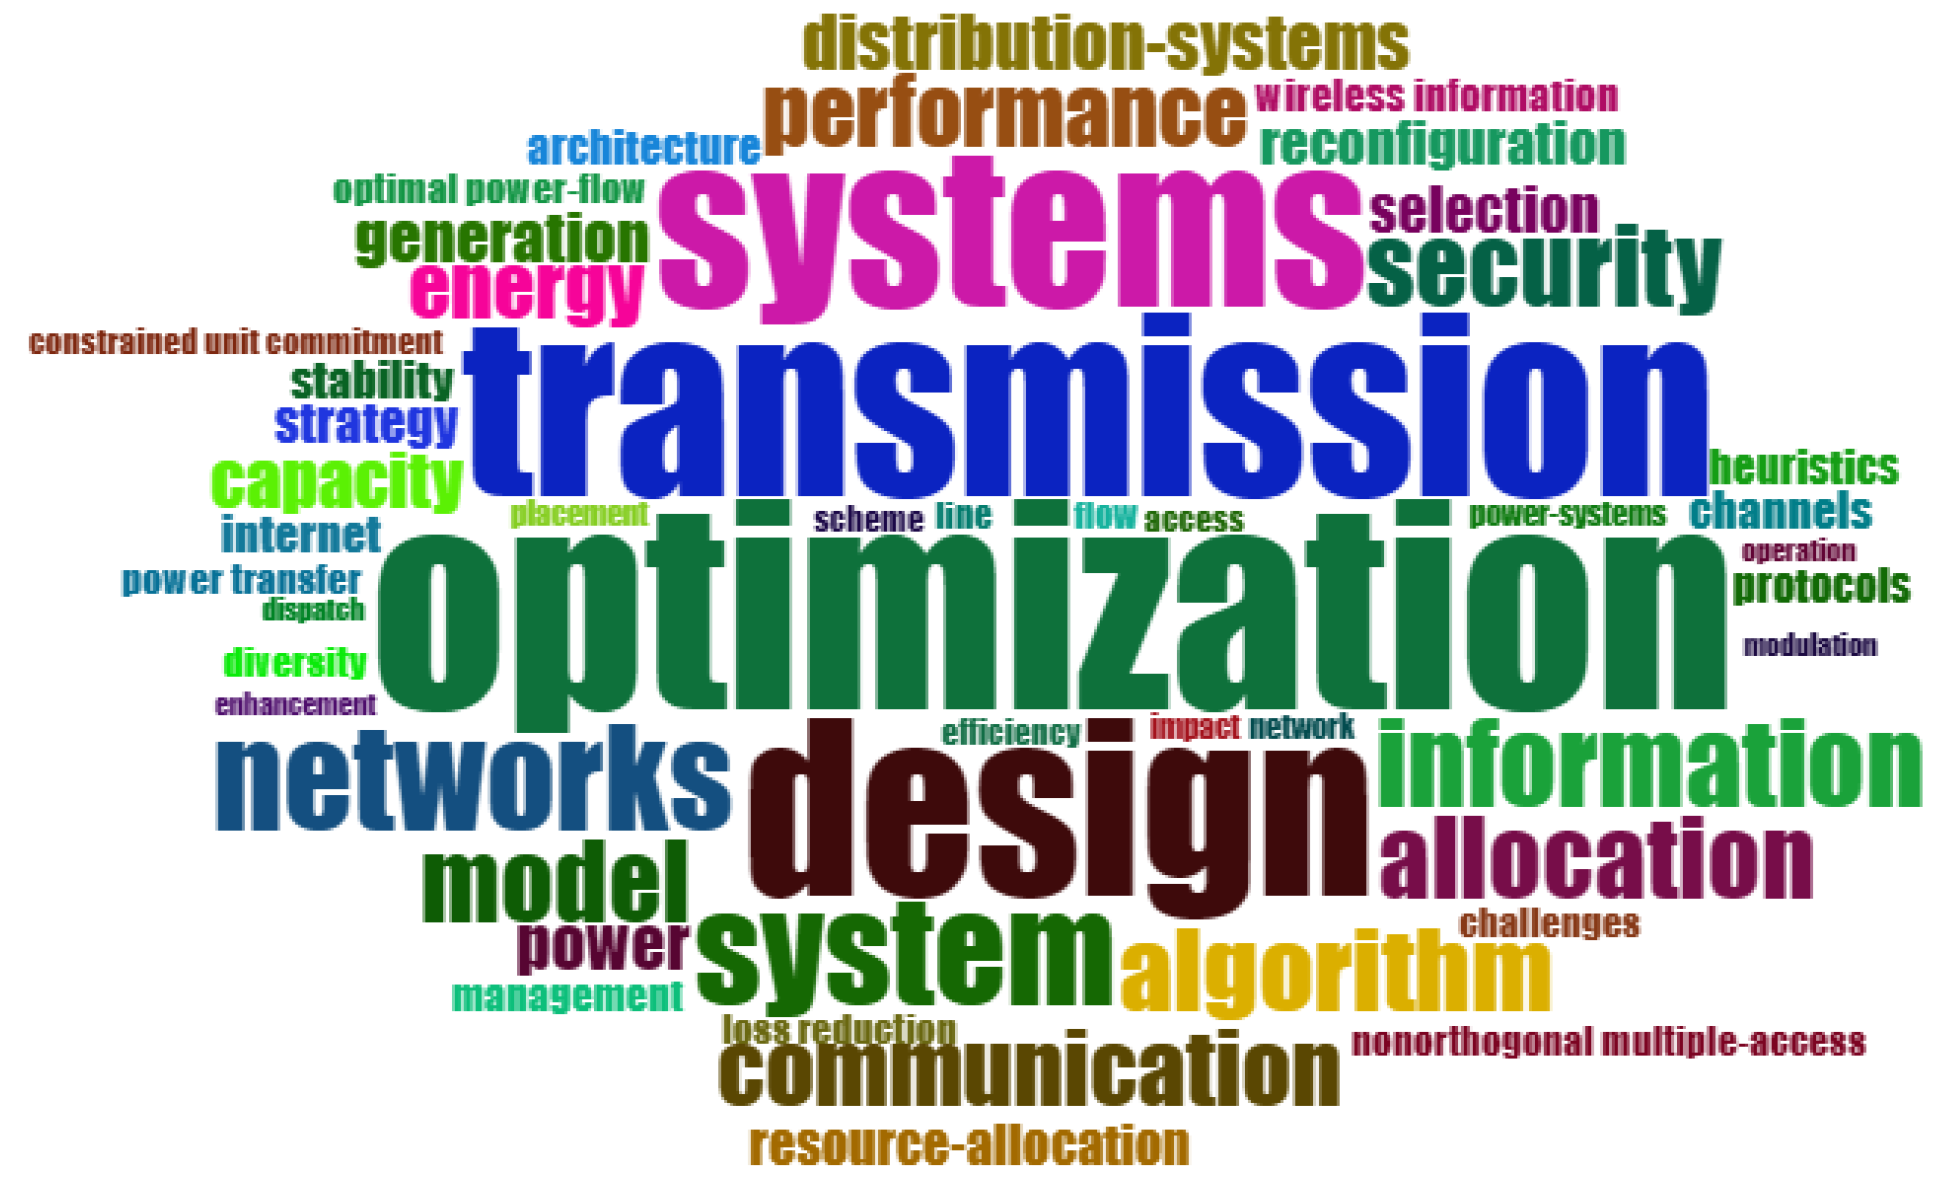
The most prominent keywords in the databases regarding the topic analyzed are optimization, transmission, design, system, networks, information, algorithm, assignment, and model. Each of these words reflects its frequency of appearance in the documents, varying between 37 and 94 mentions. The trends in the topics show changes in their frequency over time, with variable values in intervals of 50, 100, 150, or 200 until the year 2021. Among the most recurring topics are the transmission network, optimization, and network topology. Below is a graphic representation of the keywords used in the search in the databases examined (WOS-Scopus), extracted from the most relevant titles, abstracts, and sources. These keywords focus on describing the optimization approach in relation to the switching of transmission lines; see
Figure 3.
2.2. Optimal Transmission Line Switching (OTS)
The OTS describes the redistribution of power flows in the SEP, helping to decongest the system. Switching allows adaptation to various scenarios where power flow reconfigures significantly increase reliability. The OTS allows the system’s energy to be distributed, knowing that these modifications cause the system parameters to vary due to the disconnection of several elements that contributed to an original design. The OTS solves several problems; its purpose is to keep the EPS stable while isolating the failures or contingencies to which the system is exposed; it also helps the energy balance remain stable [
23].
By making the different modifications to the lines, congestion in the system is reduced, and its support is seen in the useful life of the electrical components [
4], with a reduction in operating costs and an increase in the capacity to operate at higher ranges than those established as the nominal range of the system. OTS is highlighted as a progressive solution to mitigate losses generated by contingencies while optimizing the efficiency of electrical networks by controlling short circuit currents and overloads. All of this is achieved without incurring additional costs in the [
25] operation.
The different models of the OTS from the same perspective are based on optimal power flows (FOP), whose objective is the analysis of active power (OPF-DC) where an efficient economic dispatch is anticipated that ensures the supply of demand, disregarding losses since it does not consider in its analysis the different effects of reactive power and voltage. But creating an impact on the study of loadability, voltage angles in transmission lines, and generation costs. Where their OTS objectives do not affect, leading to load shedding since the established technical limits are not violated. Different scenarios arise where losses are generated in the transmission lines, such as islands’ formation due to the topology variation [
4,
11,
26].
The OTS model proposes a DC power flow with control on switching in the EPS, aiming to minimize costs with transmission line switching, and considers different constraints that limit the power flow based on the connection state (
9) in the system (
2),(
3), and also considers the maximum and minimum susceptance. Equation (
4) establishes the power balance at the nodes, where the input power must equal the sum of the loads, taking into account the maximum or minimum generation capacity depending on the connection state (
5),(
6). Constraint (
7) limits the total number of switches in all transmission lines, considering the admittance (
8) [
27].
The OTS analyzed using a different approach aims to carry out a study that covers various variables, combining the optimal power flow (OPF), reactive losses (FOPAC), and the effects on voltage. Addressing the problem of optimal switching represents a significant challenge from a mathematical perspective, given that the analysis encompasses nonlinearities and is not convex, in addition to the fact that its variables can assume discrete values [
28]. Although diverse approaches provide optimal solutions in switching transmission lines to achieve economic dispatch, these solutions are not completely global; However, they contribute to mitigating the impacts of adverse events [
6,
28,
29].
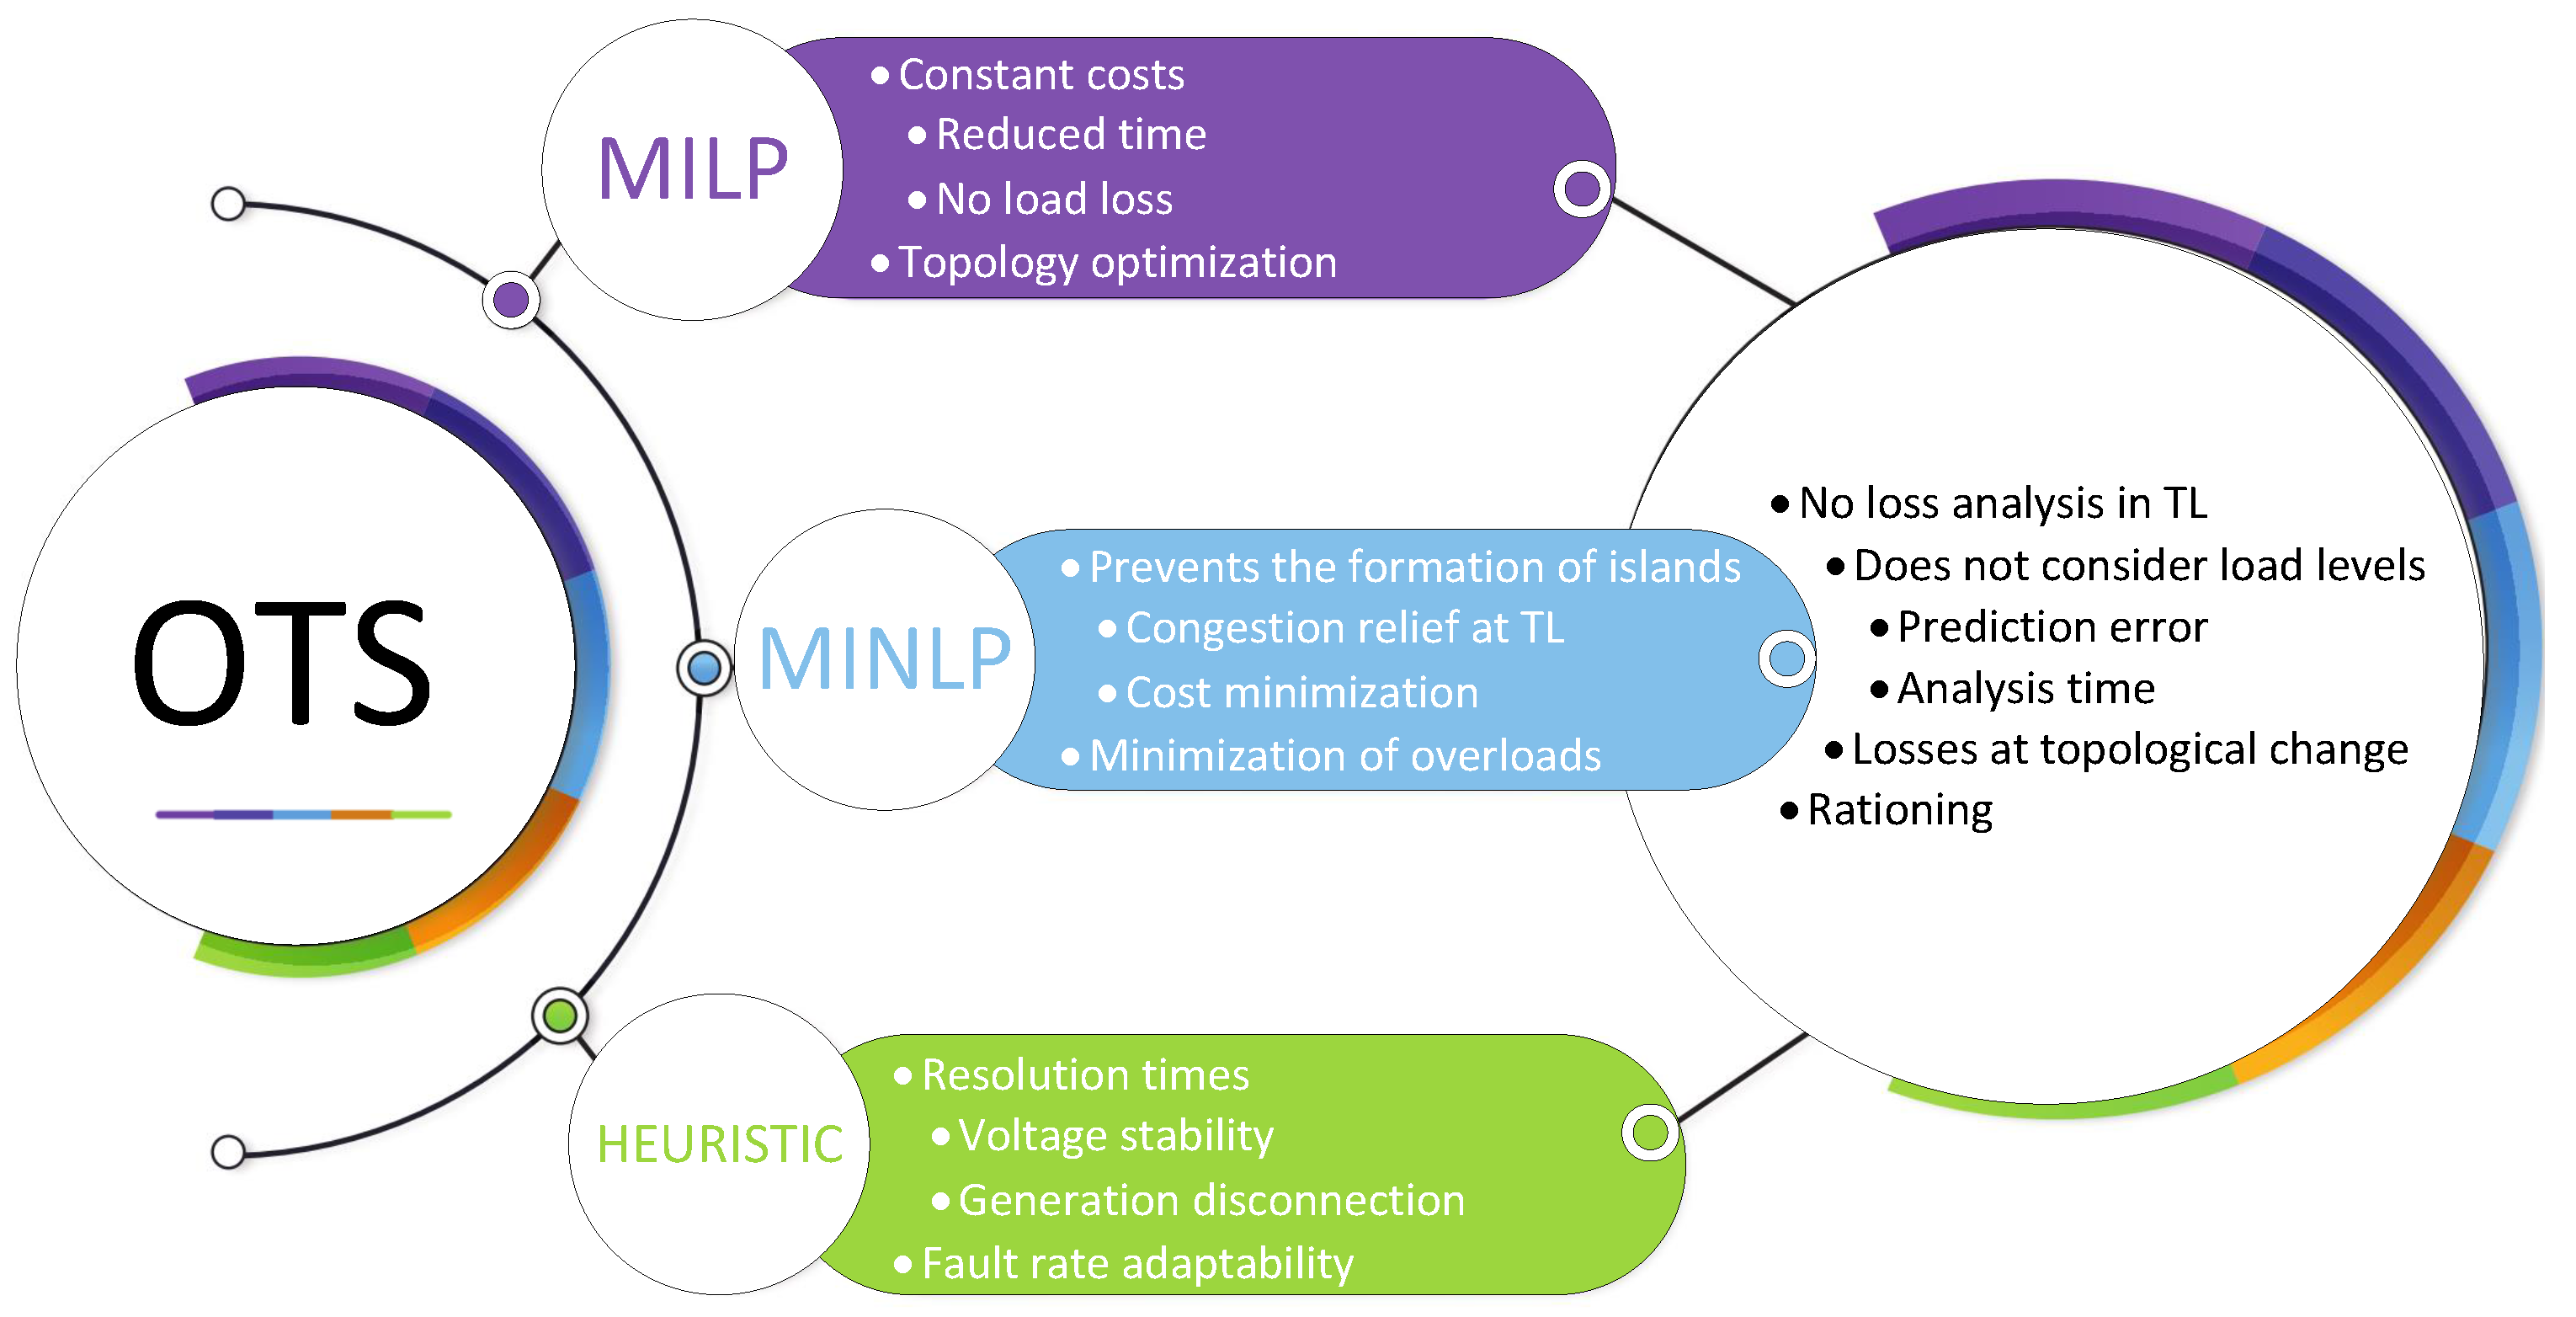
The various approaches used in the scientific community to carry out optimal switching on transmission lines within electrical power systems have proven capable of generating multiple solutions, which vary depending on the specific problem sought to be addressed. Furthermore, the complexity of this analysis process is influenced by the set of restrictions incorporated into the study objective. Therefore, below is a diagram that summarizes the different approaches developed to date in this area of research; see
Figure 4.
2.3. Optimum AC Power Flow
The analysis of power flows represents a fundamental stage in studying the Electrical Power System (EPS). Its central purpose is to evaluate the various operating conditions of a system, calculating the voltage magnitude and the corresponding angle for a specific load. This process involves considering numerous variables related to the network and generation. Through various types of analysis, strategies can be determined for planned expansion, operational planning, and real-time control of systems. Power flows are applied in operations and developing efficient designs with lower losses [
30].
Creating an effective model for the system requires a thorough understanding of the various parameters encompassing the entire system. In analyzing power flow, it is essential to consider the admittance matrix, which stores very important information about the impedances of the transmission lines. By incorporating this data into the model, a complete and accurate representation of the electrical system interactions is achieved, facilitating effective decision-making in the planning, operation, and control phases [
30].
When addressing the reduction of AC power flow (FOP-AC) losses, we focus on optimizing energy distribution in the electrical system to minimize losses during transmission as much as possible. This objective is achieved by adjusting critical variables in the system, such as transmission line configurations and power generation, to achieve more efficient operation and, consequently, reduce power losses. In loss minimization, advanced techniques such as mixed integer nonlinear programming (MINLP) and other optimization methods are used to determine ideal operating conditions that significantly reduce these losses. This approach seeks to improve the efficiency of the electrical system, reducing excess energy and optimizing its performance [
30].
The fundamental purpose of the Optimal Power Flow in Alternating Current (AC-OPF) approach is to minimize the costs associated with the operation of the Electrical Power System (EPS). This objective is defined through the objective function (
10), which is subject to critical constraints to ensure system balance. Constraints (
11) and (
12) establish the balanced relationship between the generated active and reactive power, the system flow, and the load. Additionally, equations (
13) and (
14) outline the power flow in the transmission lines in terms of active and reactive power. Furthermore, constraints (
15) and (
16) define the power limits for generators in terms of active and reactive power. Equation (
17) sets the voltage limits at each node, while (
18) establishes the angular difference limits (
19) in each branch.
The efficient capacity of transmission lines to transport electrical energy within acceptable operational parameters is reflected in constraint (
20). This constraint is crucial in defining the load limits to ensure efficient and operationally viable energy transport in the system [
12].
3. Problem and Methodology
One of the essential functions of the transmission system is to guarantee the continuous provision of electrical energy to end users. Achieving this objective and maintaining operation through transmission line switching (OTS) involves performing a comprehensive analysis that covers aspects such as voltage, frequency, power balance, and angles. This approach aims to minimize losses in transmission lines. Considering that various scenarios inevitably arise during and after the switching of transmission lines, such as increased power flow or overloaded lines, it is important to address the issue of system losses in these processes. Seeking solutions that analyze voltage levels, power flows, balance, and losses, specifically focusing on predefined parameters, will contribute to establishing stability limits [
4,
23].
Previous research has demonstrated changes in topologies through AC power flow analysis [
31], highlighting increased efficiency when considering actual system constraints, such as grid decongestion and prevention of islanding [
17]. By characterizing the scenarios of the new topology, the most vulnerable lines and those contributing to a reduction in losses can be identified. In this analysis, restructuring with corrective control can provide significant results for the transmission system [
23].
A method is proposed that will evaluate as an objective function the active power losses in the transmission lines in electrical power systems through corrective control of the topology to find an optimal solution for loss minimization. The objective function will be routed with active and reactive power balance restrictions, operability limits of voltage, power, angle, capacity, and connection status of the line. The proposed method will use the IEEE-14 bus system, where different application cases in the EPS will be evaluated, from a base case, such as optimal AC power flow, to cases of random contingencies.
3.1. Study Cases
In the first case study, the IEEE 14-bus model of an OPF-AC will be examined without considering the minimization of losses due to the switching of transmission lines, and the compensations of the original model will not be considered.
The second case study will analyze the same test model, but transmission line switching will be applied to minimize losses this time. The results obtained in the OPF-AC will also be analyzed.
In the third case study, the system will be evaluated under N-1 contingencies, which implies the system’s behavior when a transmission line is disconnected and how switching transmission lines will minimize losses.
Finally, as the fourth and last case, the IEEE 14-bus test system will be examined under random contingencies and, at the same time, how the OTS will mitigate the impact by reducing active power losses in the EPS transmission lines.
To solve the optimization problem for the minimization of active power losses with OTS, the GAMS software is used to verify the proposed methodology, where the data of the IEEE 14-bus system has been entered, such as the analysis conditions, the objective function, and the different restrictions. The data obtained in each results table is validated with the Digsilent software.
3.2. Proposed Methodology
The proposed methodology minimizes losses in the transmission lines (TL) through Optimal Transmission Switching (OTS). Therefore, we define that in the TL, active power is transferred from node
i to node
j (
23) and vice versa (
24), where the real part is the apparent power (
22) (PI model of the transfer lines). When an energy analysis is performed at the instant when node
i is in balance, and similarly, for node
j, the equation for minimizing losses in the transmission lines in the EPS is mathematically derived (
21) [
1].
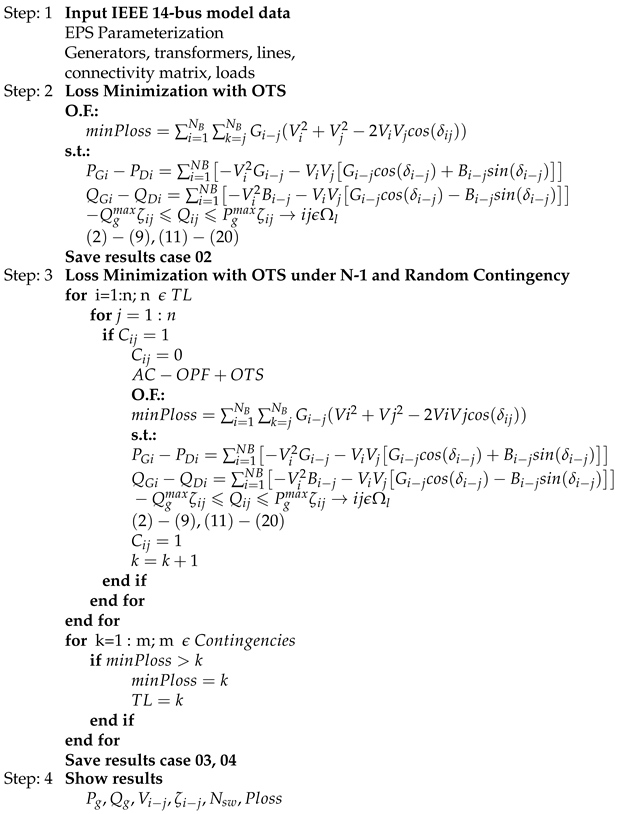
Algorithm 1 shows the process for changing the EPS topology considering OPF-AC in electrical systems after contingencies. Step 1 includes the input of the EPS connectivity variables and parameters, the main variables and parameters required are: characteristics of the generators, lines, transformers and loads. In Step 2, the behavior of the EPS after the application of the OTS based on OPF-AC is determined, minimizing the losses, with which the initial reconfiguration will be obtained, which will be the starting point for the application of the contingencies in Step 3, in which N-1 contingencies are generated randomly and it is identified if the system needs a new reconfiguration to minimize the losses and finally in Step 4 the results of the proposed model for each switching and contingency scenario are shown.
|
Algorithm 1 OTS with AC-OPF to minimize losses in TLs. |
 |
4. Analysis and Results
For data analysis, an Acer Aspire computer with an Intel(R) Core(TM) i5-8300H CPU @ 2.30GHz 2.30 GHz processor was used, with 16.0 GB of RAM and a 64-bit operating system installed. The optimization of loss minimization in transmission lines based on corrective control was carried out in the GAMS software version 27.3, where a DICOPT solver that uses MINLP was used. Additionally, to verify and validate each of the results obtained, it was simulated in Digsilent Power Factory version 2022 SP2.
4.1. EPS Reconfiguration
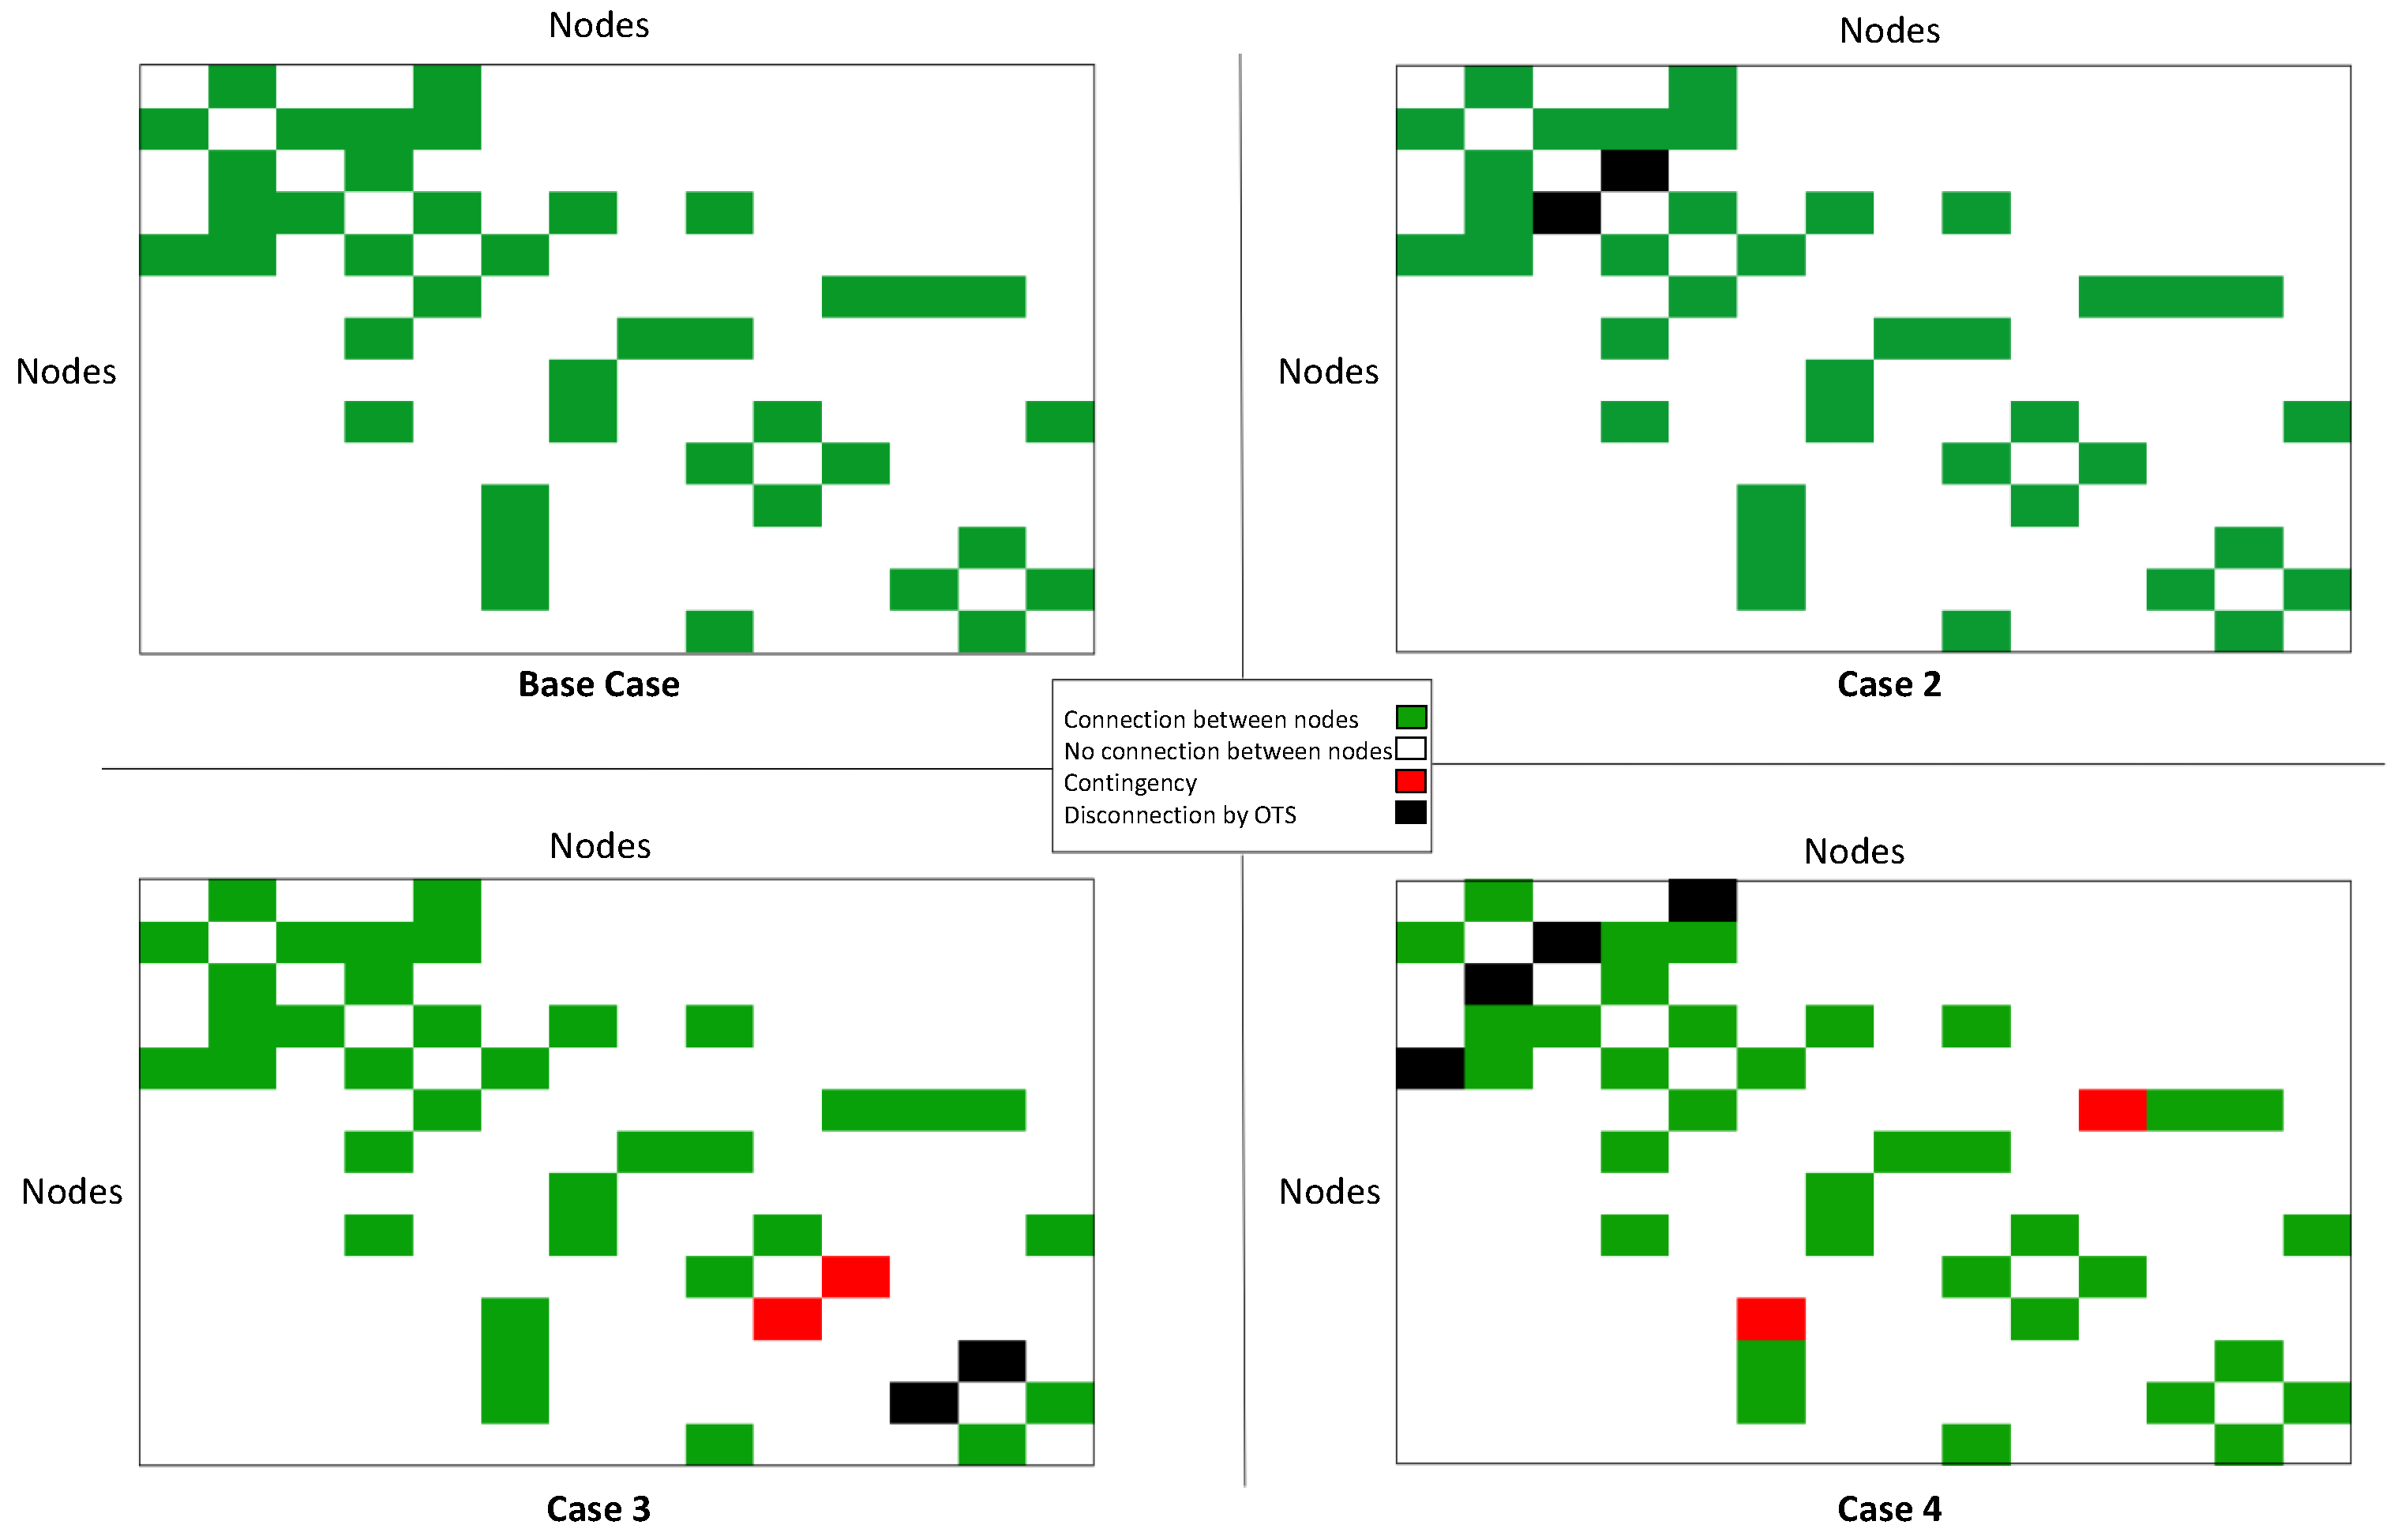
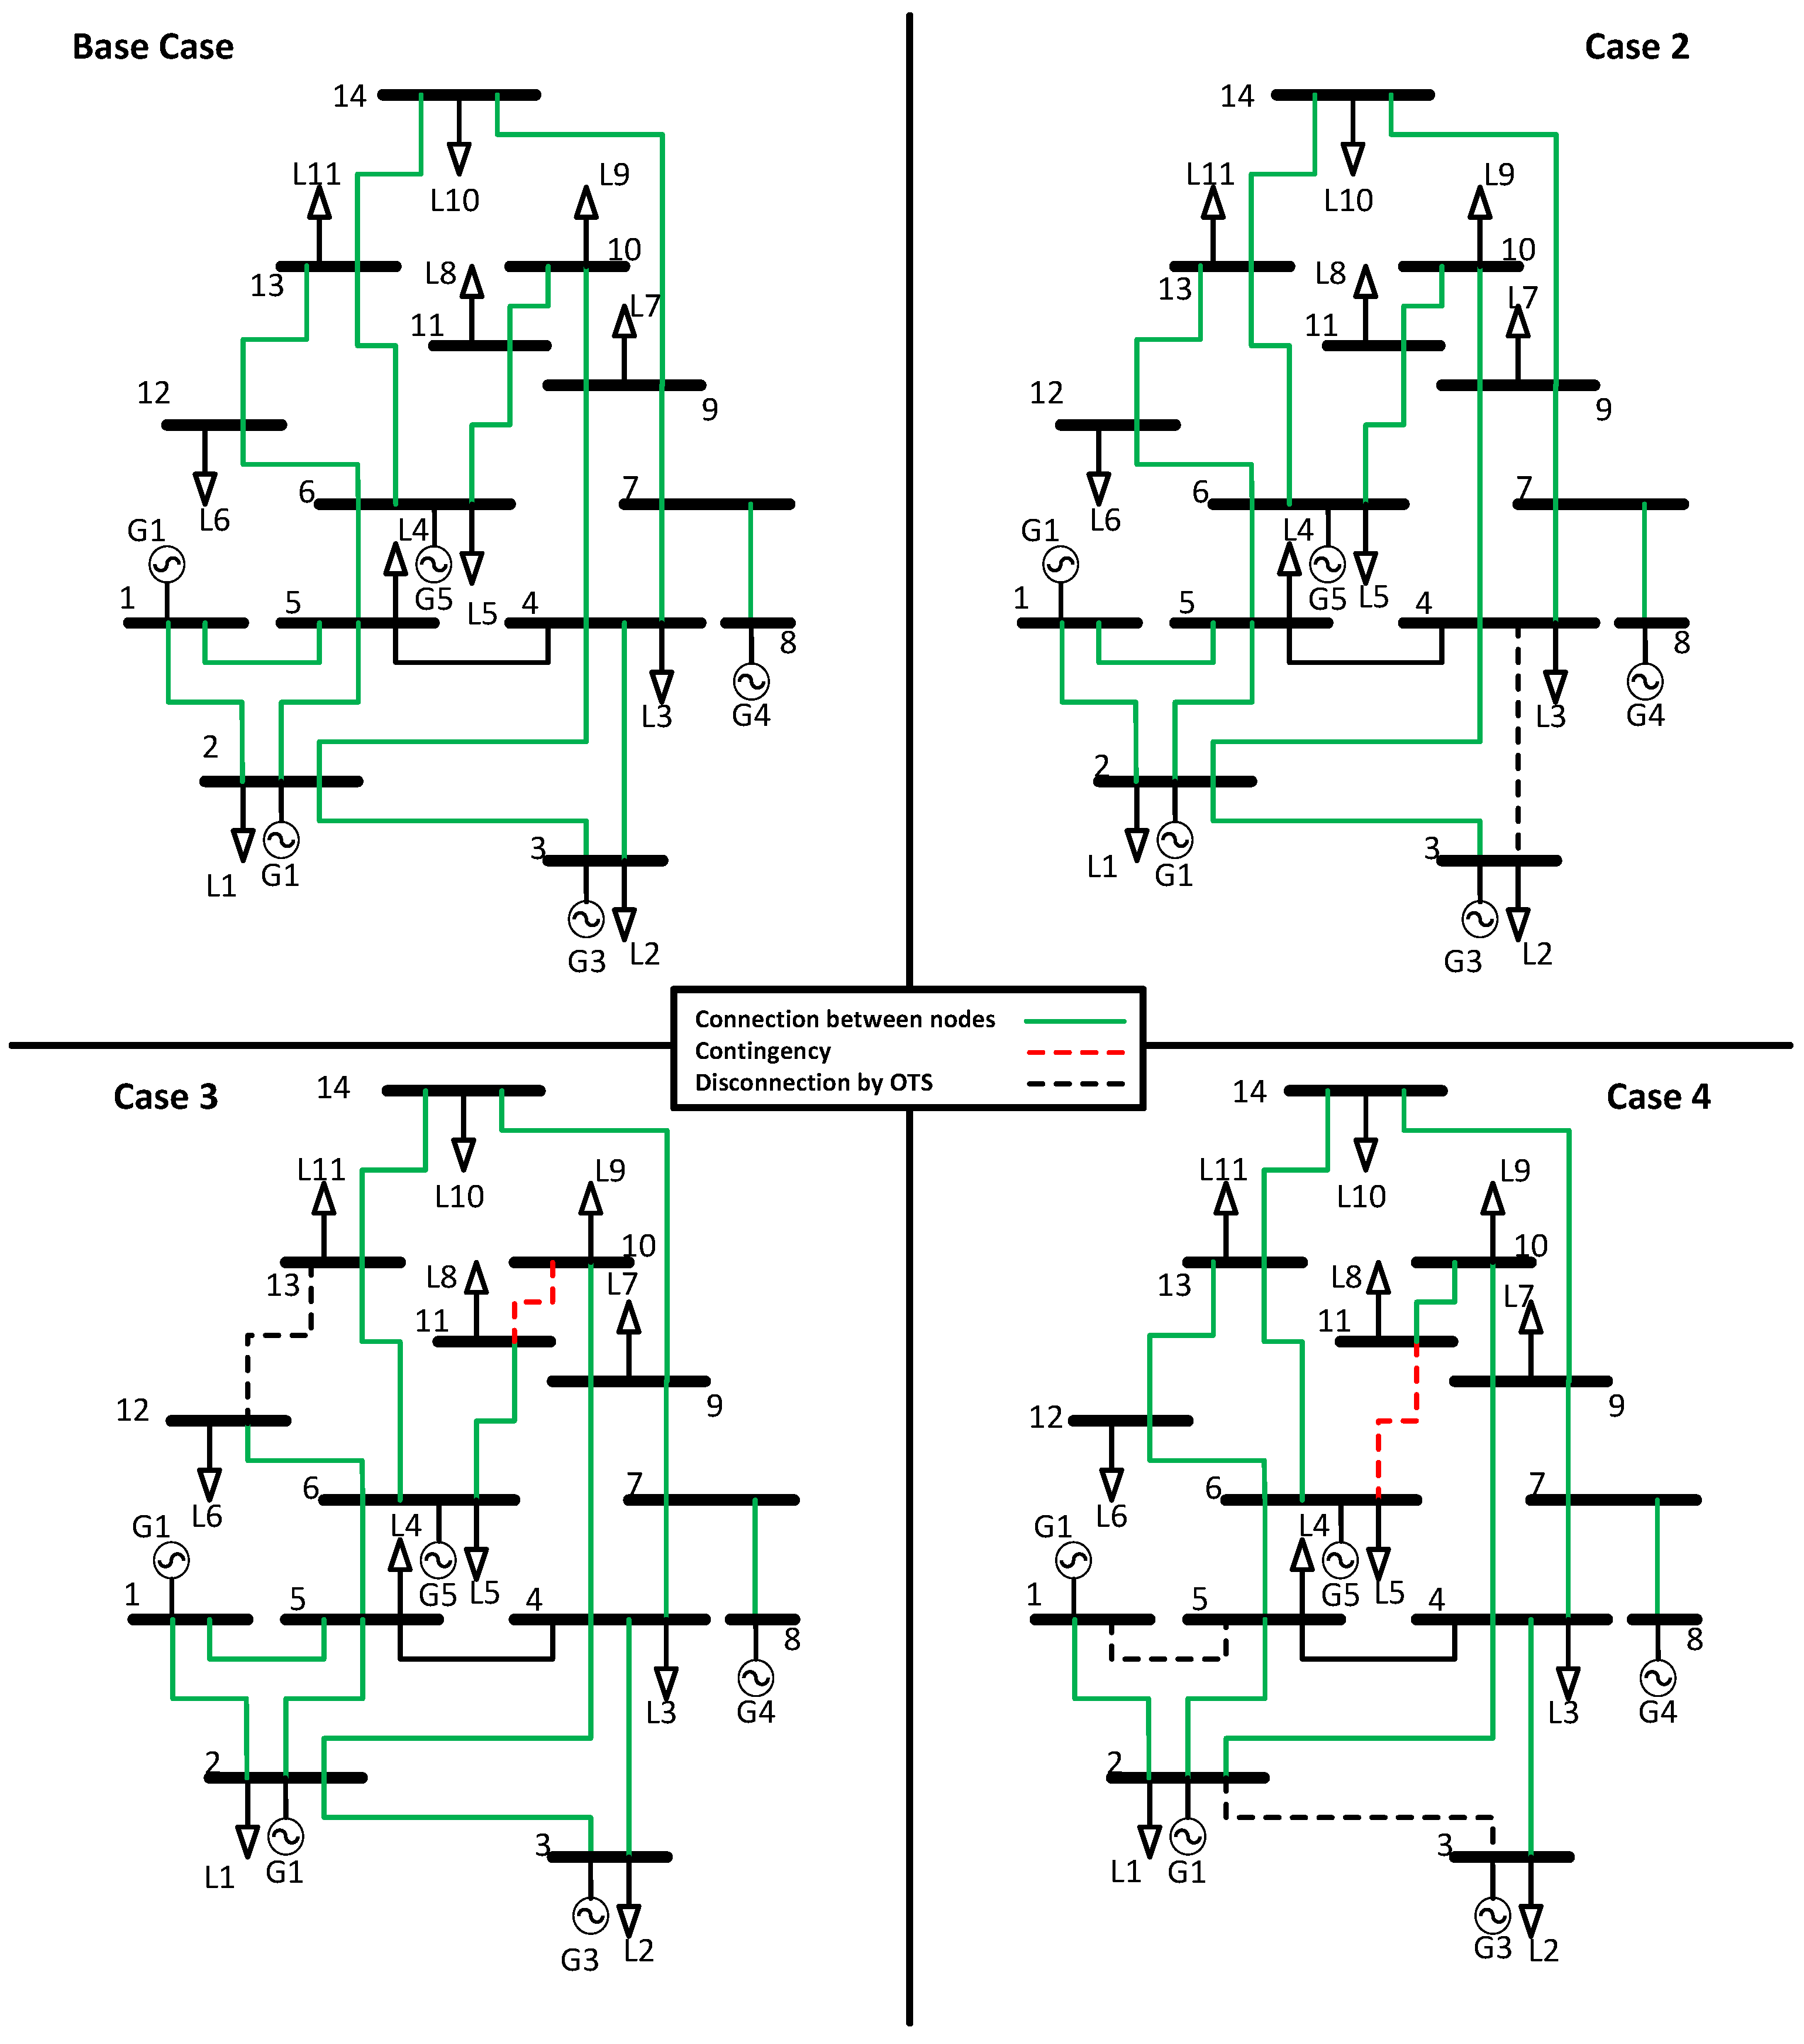
To begin the analysis of the results, the connection characteristics of the IEEE 14 BUS test system are detailed below. Its base case presents an AC power flow (OPF-AC) without line disconnection. The connection status of the EPS can be seen in figures (
Figure 5)–(
Figure 6); the connection status of the system is denoted with a visual detail; in this case, if there is a connection, it is green, and if there is no connection between bars, it is white.
In case 02, a loss minimization analysis in the transmission lines is described through OTS. The optimal solution is found by disconnecting line 3–4, represented in black in
Figure 5 and
Figure 6. Subsequently, an AC power flow (OPF-AC) is executed. In case 03, the system is evaluated by introducing the N-1 contingency, shown in red for line 10–11. After the OTS analysis, it is determined that the optimal disconnection to minimize losses is line 12–13, highlighted in black in
Figure 5 and
Figure 6, followed by the execution of an AC power flow (OPF-AC). In case 04, the system is tested with a random contingency that coincides with line 6–11, identified in red in
Figure 5 and
Figure 6. After performing the OTS analysis, it is determined that the most appropriate disconnections to minimize losses are lines 1–5 and 2–3, identified in black. Subsequently, an AC power flow (OPF-AC) is applied, as in all the case studies.
Once the study cases to be analyzed have been identified, the most significant magnitudes are evaluated in the IEEE 14-bus test system. These magnitudes are compared with the results obtained using the Digsilent Power Factory software to validate the developed algorithm. The information presented in the graphs is obtained from results generated by the GAMS software.
4.2. Voltage Profiles
The voltage profiles obtained in the 4 case studies conducted in the GAMS software are very similar to those obtained in the Digsilent software, as shown in the
Table 1. It is worth mentioning that the voltage magnitude has certain setting parameters within a range where the electrical system operates under stable conditions; for the angle, the limits are from 0.6 to -0.6 rad, while its magnitude is within a range of 0.9 to 1.1 [p.u.] [
1].
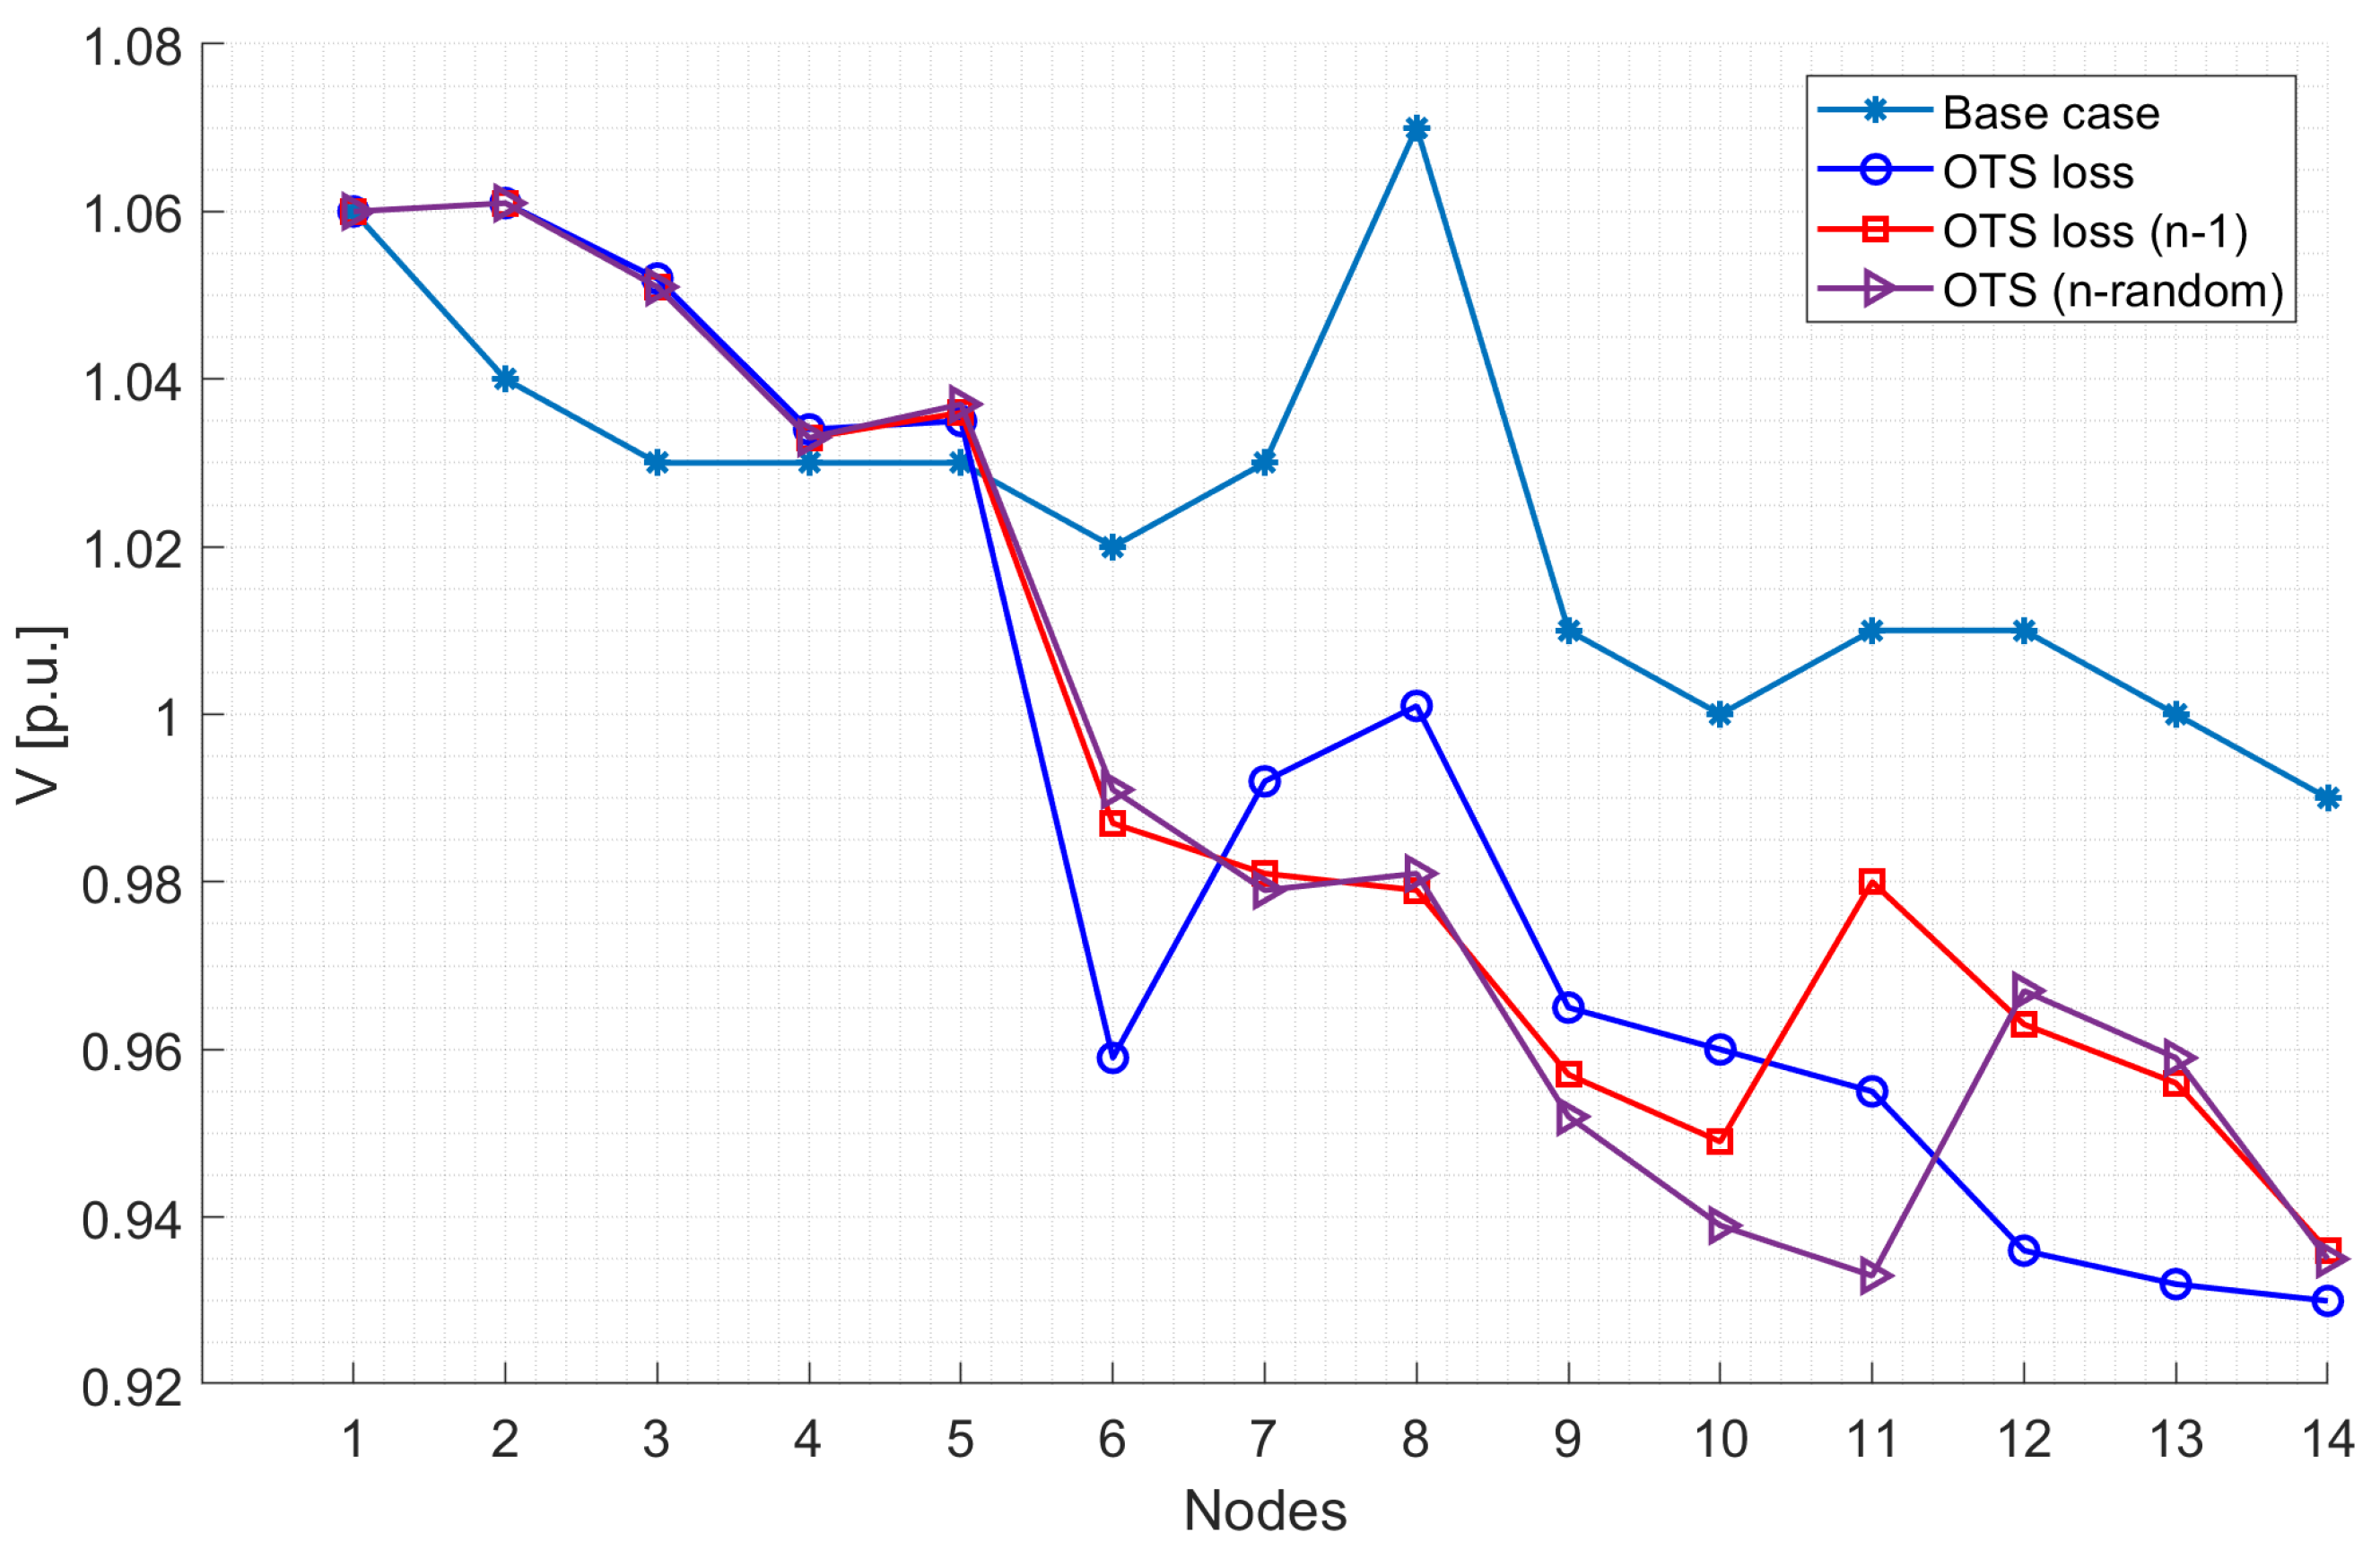
The voltage measurements at the buses of the evaluated electrical system in cases 02, 03, and 04, show higher levels than the base case. It is observed in
Figure 7 that at buses 6 to 14, the voltage levels are below those of the base case. These results are evaluated with the AC power flows. In cases 02, 03, and 04, a preliminary analysis is carried out considering the objective function (
21) for loss minimization in the transmission lines through OTS; additionally, N-1 and random contingencies are considered in cases 03 and 04.
The voltage magnitudes on each bus in cases 02, 03, and 04 maintain a similar behavior since they are under transmission line switching (OTS), where the connection or disconnection analysis defines an optimal solution. The voltages from bars 1 to 5 are very close in magnitude. It should be noted that due to the disconnection of lines, there is a decrease in voltage measurements in the bars where there is no generation.
4.3. Active Power
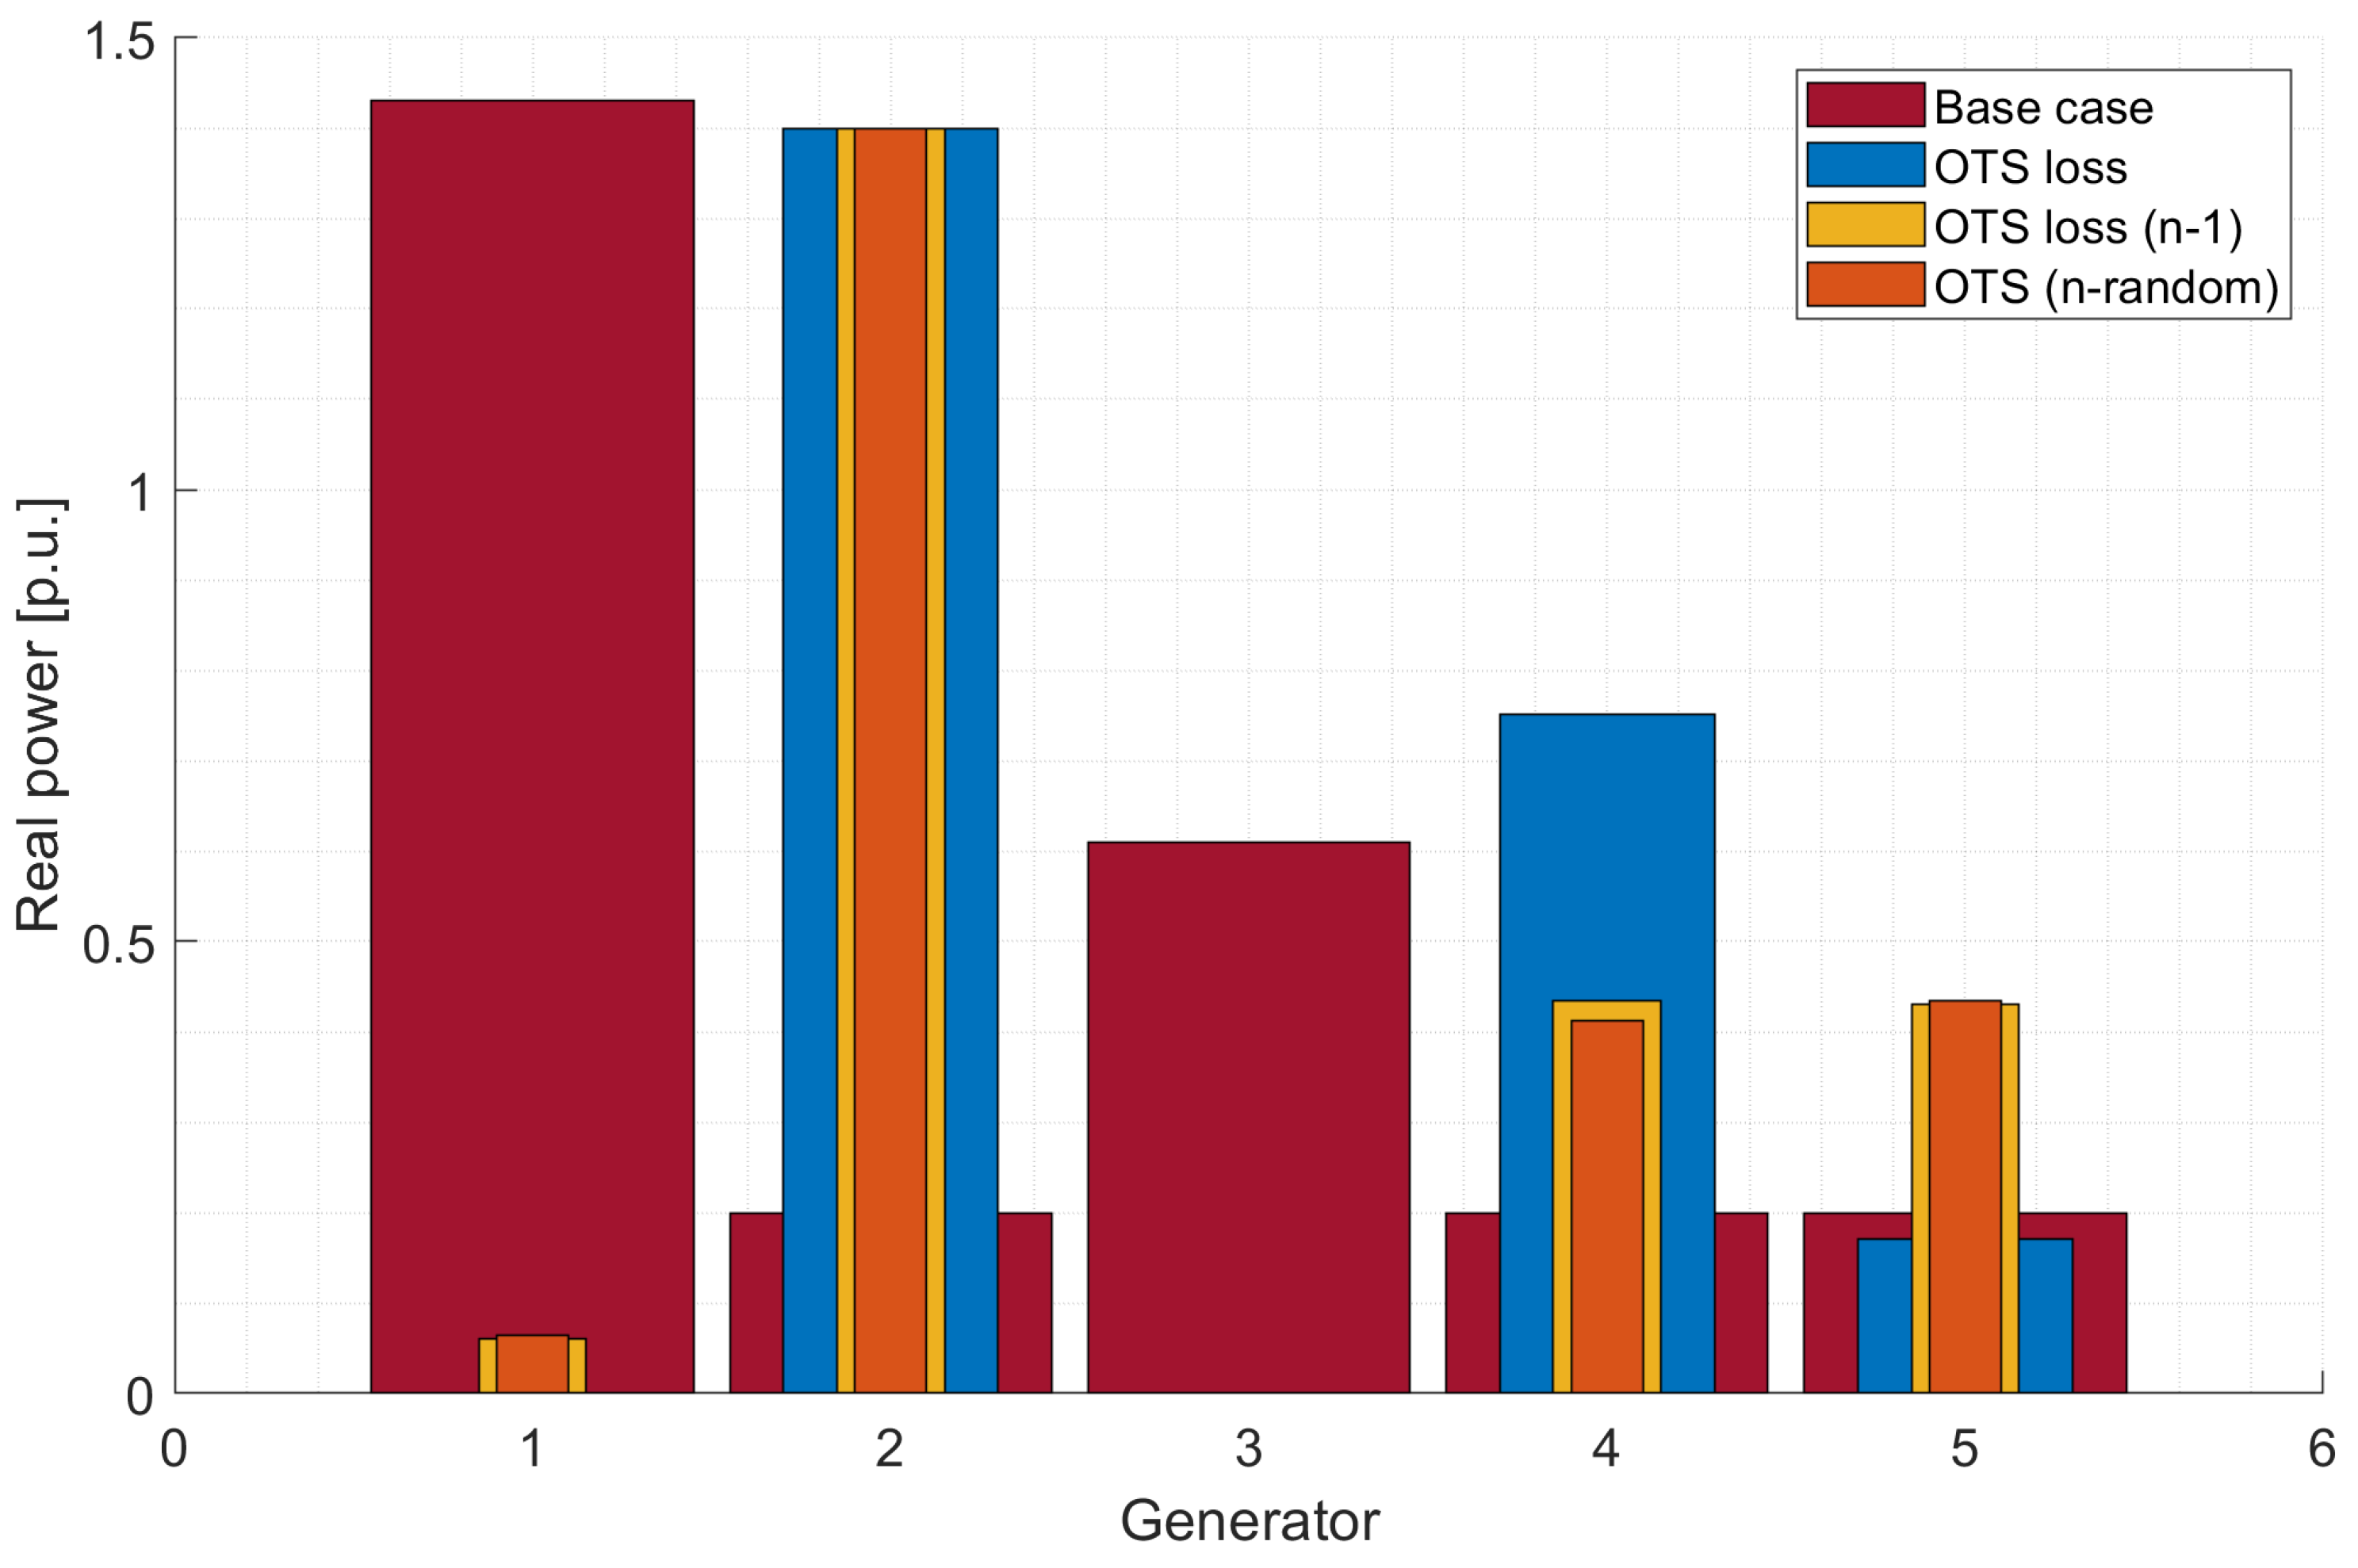
Table 2 presents the dispatch of each generator in the studied cases. Analyzing each generator, it can be noted that Generator 1 has a dispatch of 1.43 [p.u.], representing a significant difference compared to cases 02, 03, and 04 where OTS has already been implemented in the test system. In case 02, the power dispatch of Generator 1 is not necessary to meet the demand and maintain system balance.
Generator 2, when OTS is implemented in cases 02, 03, and 04, dispatches the most power, supplying 1.4 [p.u.] to the system, unlike the base case where it contributes 0.20 [p.u.]. Generator 3 only dispatches power in the base case, which is a notable point for analysis, as the disconnection of a line in the test system reduces losses, making the contribution of this unit unnecessary.
Generator 4 dispatches more power in case 02. Its dispatch is very similar in cases 03 and 04, while its power contribution is minimal in the base case.
Generator 5 dispatches more power in cases 03 and 04 compared to the base case and case 02.
Figure 8 presents a bar graph showing each case study’s active power results. It is highlighted that despite disconnections due to contingencies or application of the OTS, the system maintains a constant power dispatch. Therefore, a stable operation of the EPS is indicated by minimizing losses in the transmission lines.
4.4. Reactive Power
In the base case, Generator 01 does not dispatch reactive power. However, when OTS is implemented in cases 02, 03, and 04, it supplies reactive power to the EPS, reaching a value of 0.100 [p.u.]. Generator 02 dispatches 0.072 [p.u.] of reactive power in the base case, while in the cases where OTS is applied, this value significantly increases to 0.500 [p.u.]. On the other hand, Generator 03 maintains a similar level of reactive power dispatch in cases 02, 03, and 04, with a value of 0.195 [p.u.] in the base case. Regarding Generator 04, its reactive power dispatch varies compared to cases 02 and 03 due to the new topological configuration resulting from the optimization. Finally, Generator 05 shows different levels of reactive power dispatch in each case, depending on the best option for loss reduction.
Table 3.
Comparison of reactive power dispatch between GAMS and Power Factory.
Table 3.
Comparison of reactive power dispatch between GAMS and Power Factory.
| |
Base case |
|
Case 02 |
|
Case 03 |
|
Case 04 |
|
| G |
Gams |
PF |
Gams |
PF |
Gams |
PF |
Gams |
PF |
| 1 |
0.000 |
0.000 |
0.100 |
0.100 |
0.100 |
0.100 |
0.100 |
0.100 |
| 2 |
0.072 |
0.073 |
0.500 |
0.500 |
0.500 |
0.500 |
0.500 |
0.500 |
| 3 |
0.195 |
0.195 |
0.400 |
0.400 |
0.400 |
0.400 |
0.400 |
0.400 |
| 4 |
0.198 |
0.198 |
0.108 |
0.108 |
0.240 |
0.241 |
0.240 |
0.240 |
| 5 |
0.240 |
0.240 |
0.052 |
0.051 |
0.010 |
0.010 |
0.029 |
0.030 |
| TOTAL |
0.705 |
0.706 |
1.160 |
1.159 |
1.250 |
1.251 |
1.269 |
1.27 |
In
Figure 9, it can be seen that the reactive power dispatch in the system increases when the lines are disconnected in each of the proposed study cases. It is essential to highlight that in situations where more than two lines are disconnected due to contingencies, a greater dispatch of reactive power is observed, and this is due to the new topological configuration and its stable operation level to minimize losses. Analyzing the total reactive power for each case allows us to understand that disconnecting the transmission lines injects more reactive power into the system to reduce losses and keep the EPS operational.
4.5. Losses in Transmission Lines
Two scenarios were analyzed in the active power losses: where the OTS enters and where the optimization does not. The loss percentages for the same transmission line vary depending on its characteristics and the architecture it adopts with the switching. This occurs due to the load on the connected nodes, which varies due to the change in topology, the parallel susceptance of the lines, and the operating conditions in which the system adapts not to leave the established normal limits.
Base Case Losses
The active power losses in the transmission lines can be observed in
Table 4, which shows the values obtained from the GAMS and Digsilent Power Factory software. A minimal error difference in the results is observed, validating the method of the implemented algorithm. There is a significant percentage difference in losses between the base case and cases 02, 03, and 04, where OTS has already been implemented to minimize transmission line losses.
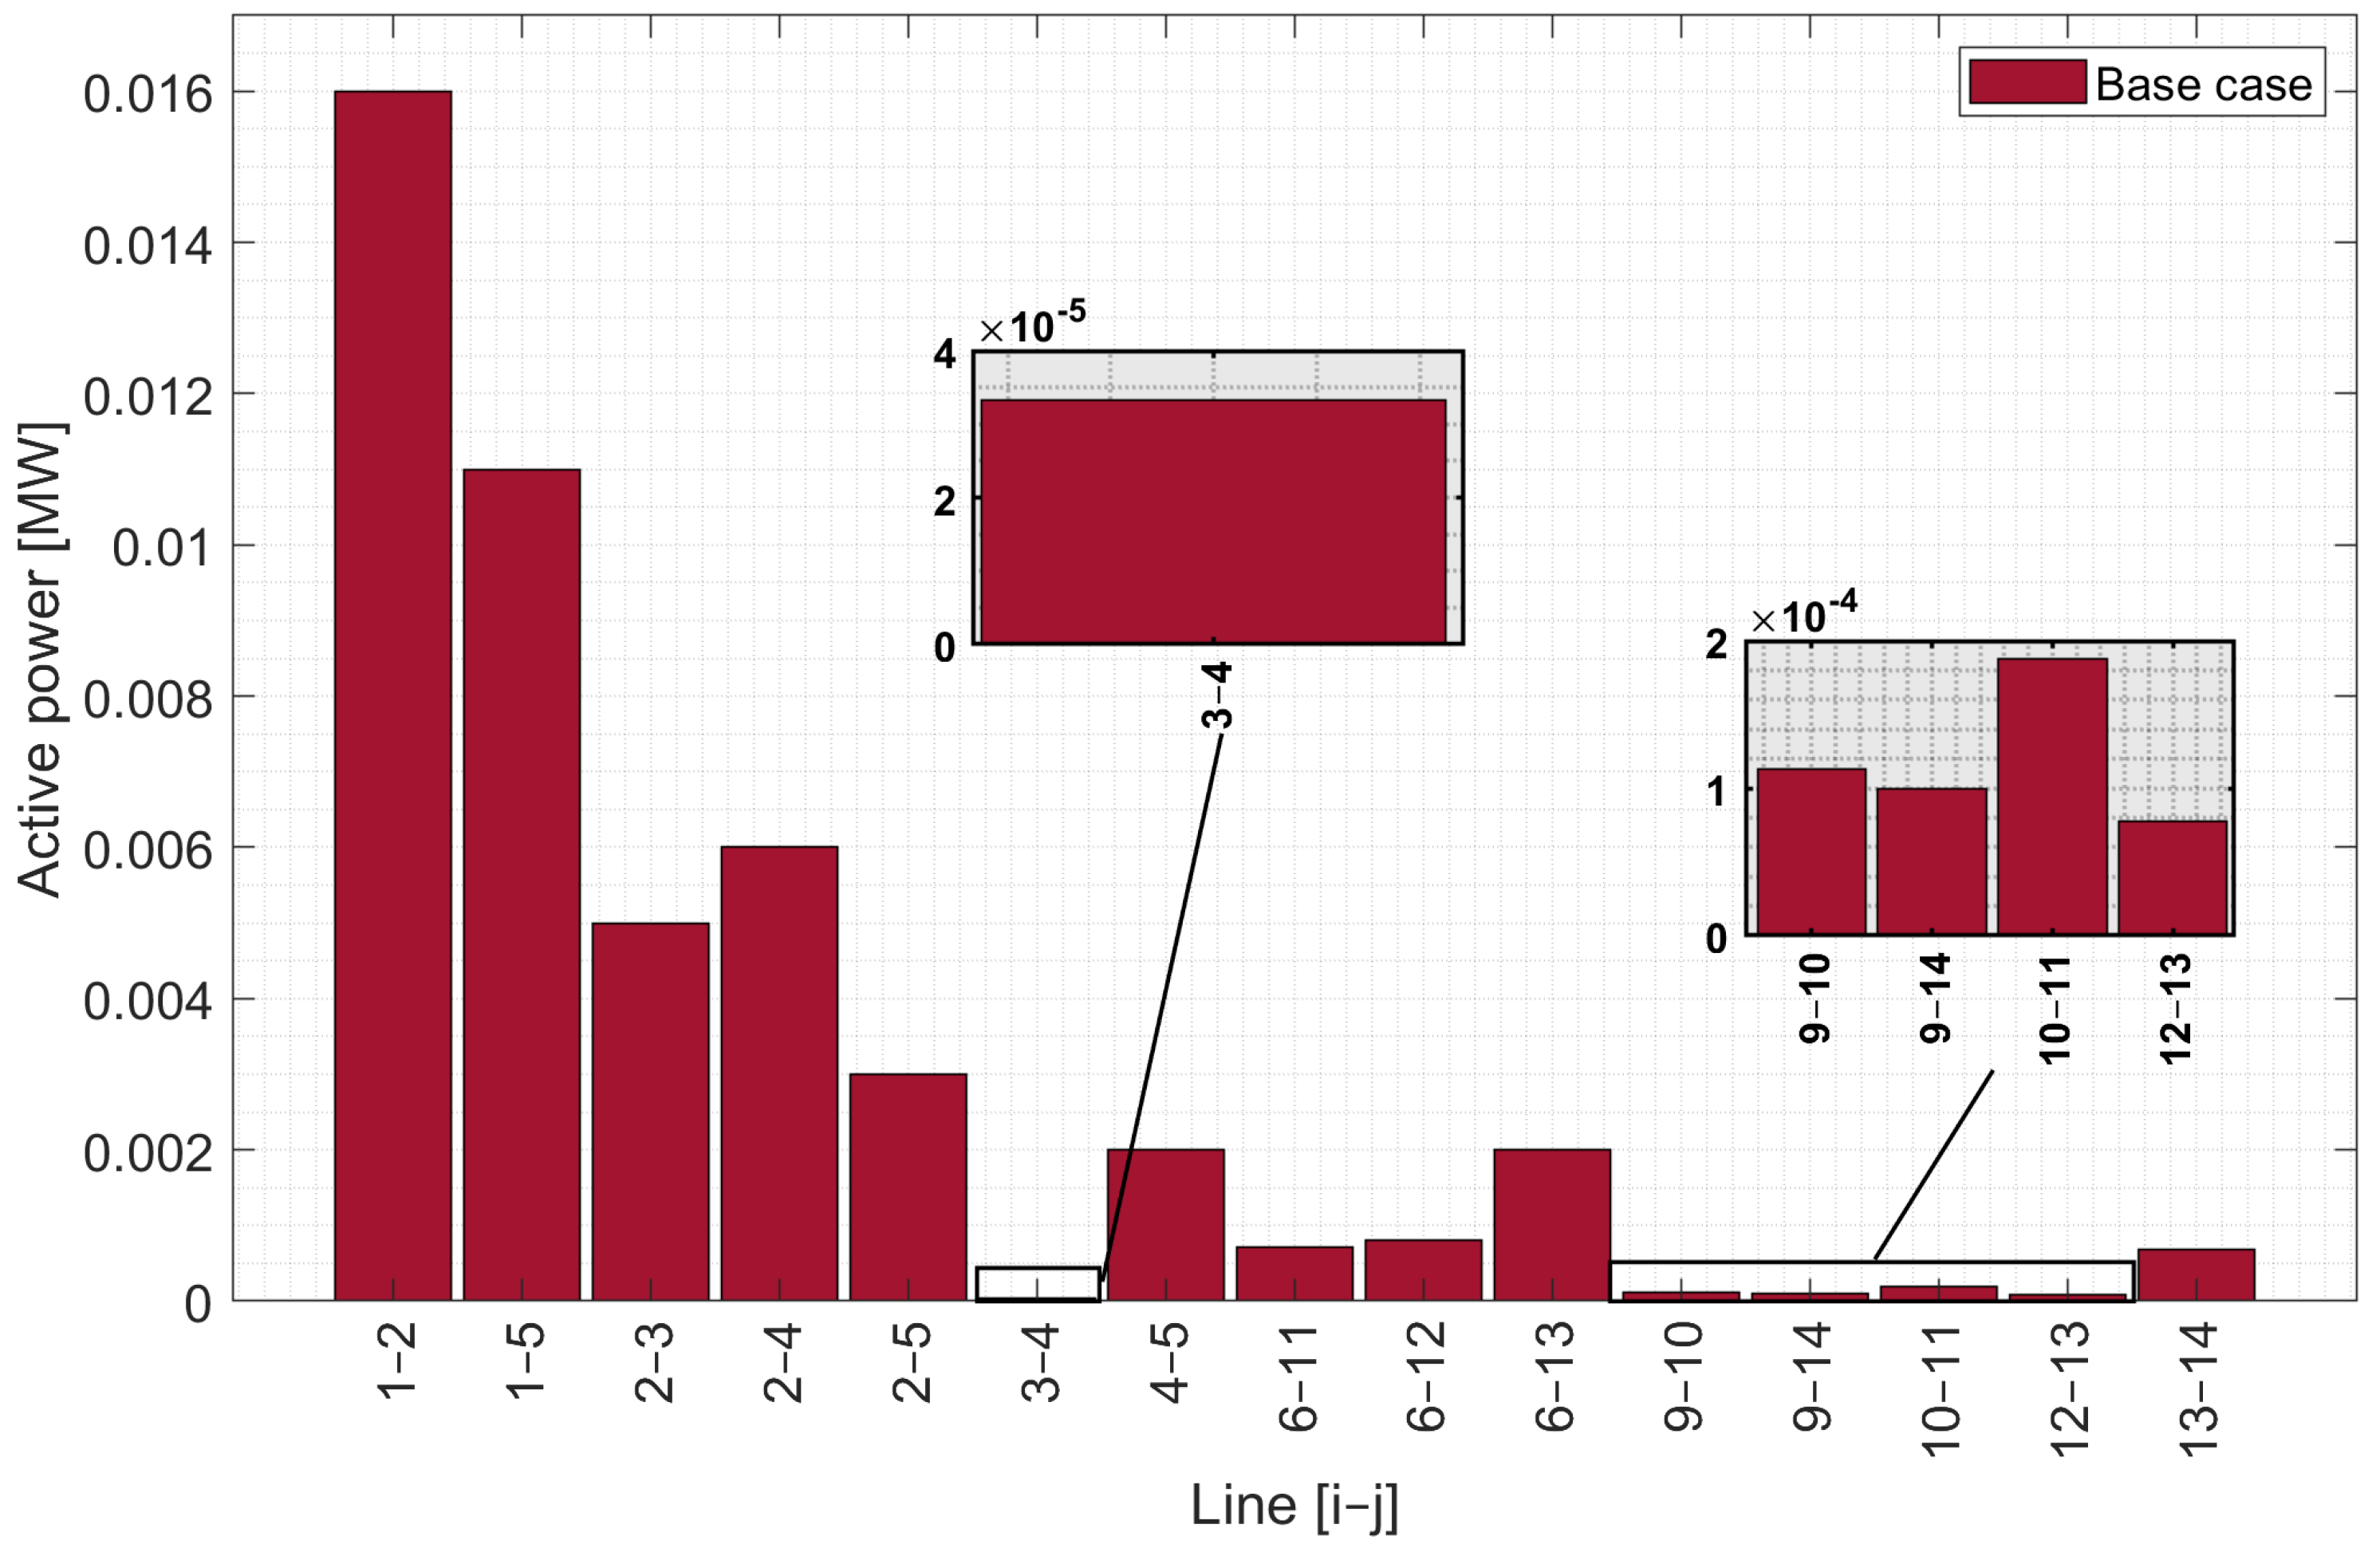
The active power losses in the base case, as shown in
Figure 10, indicate that lines (1–2), (1–5), (2–3), (2–4), and (2–5) present the highest losses compared to the other lines in the EPS. Considering that there is no disconnection of any transmission line, a reduction in losses can be observed in lines (6–12), (6–13), (9–10), (9–14), (10–11), (12–13), (6–11), (4–5), and (13–14). In line (3–4), the losses are lower compared to the rest of the lines in the first case study.
Losses for cases: 02, 03, and 04
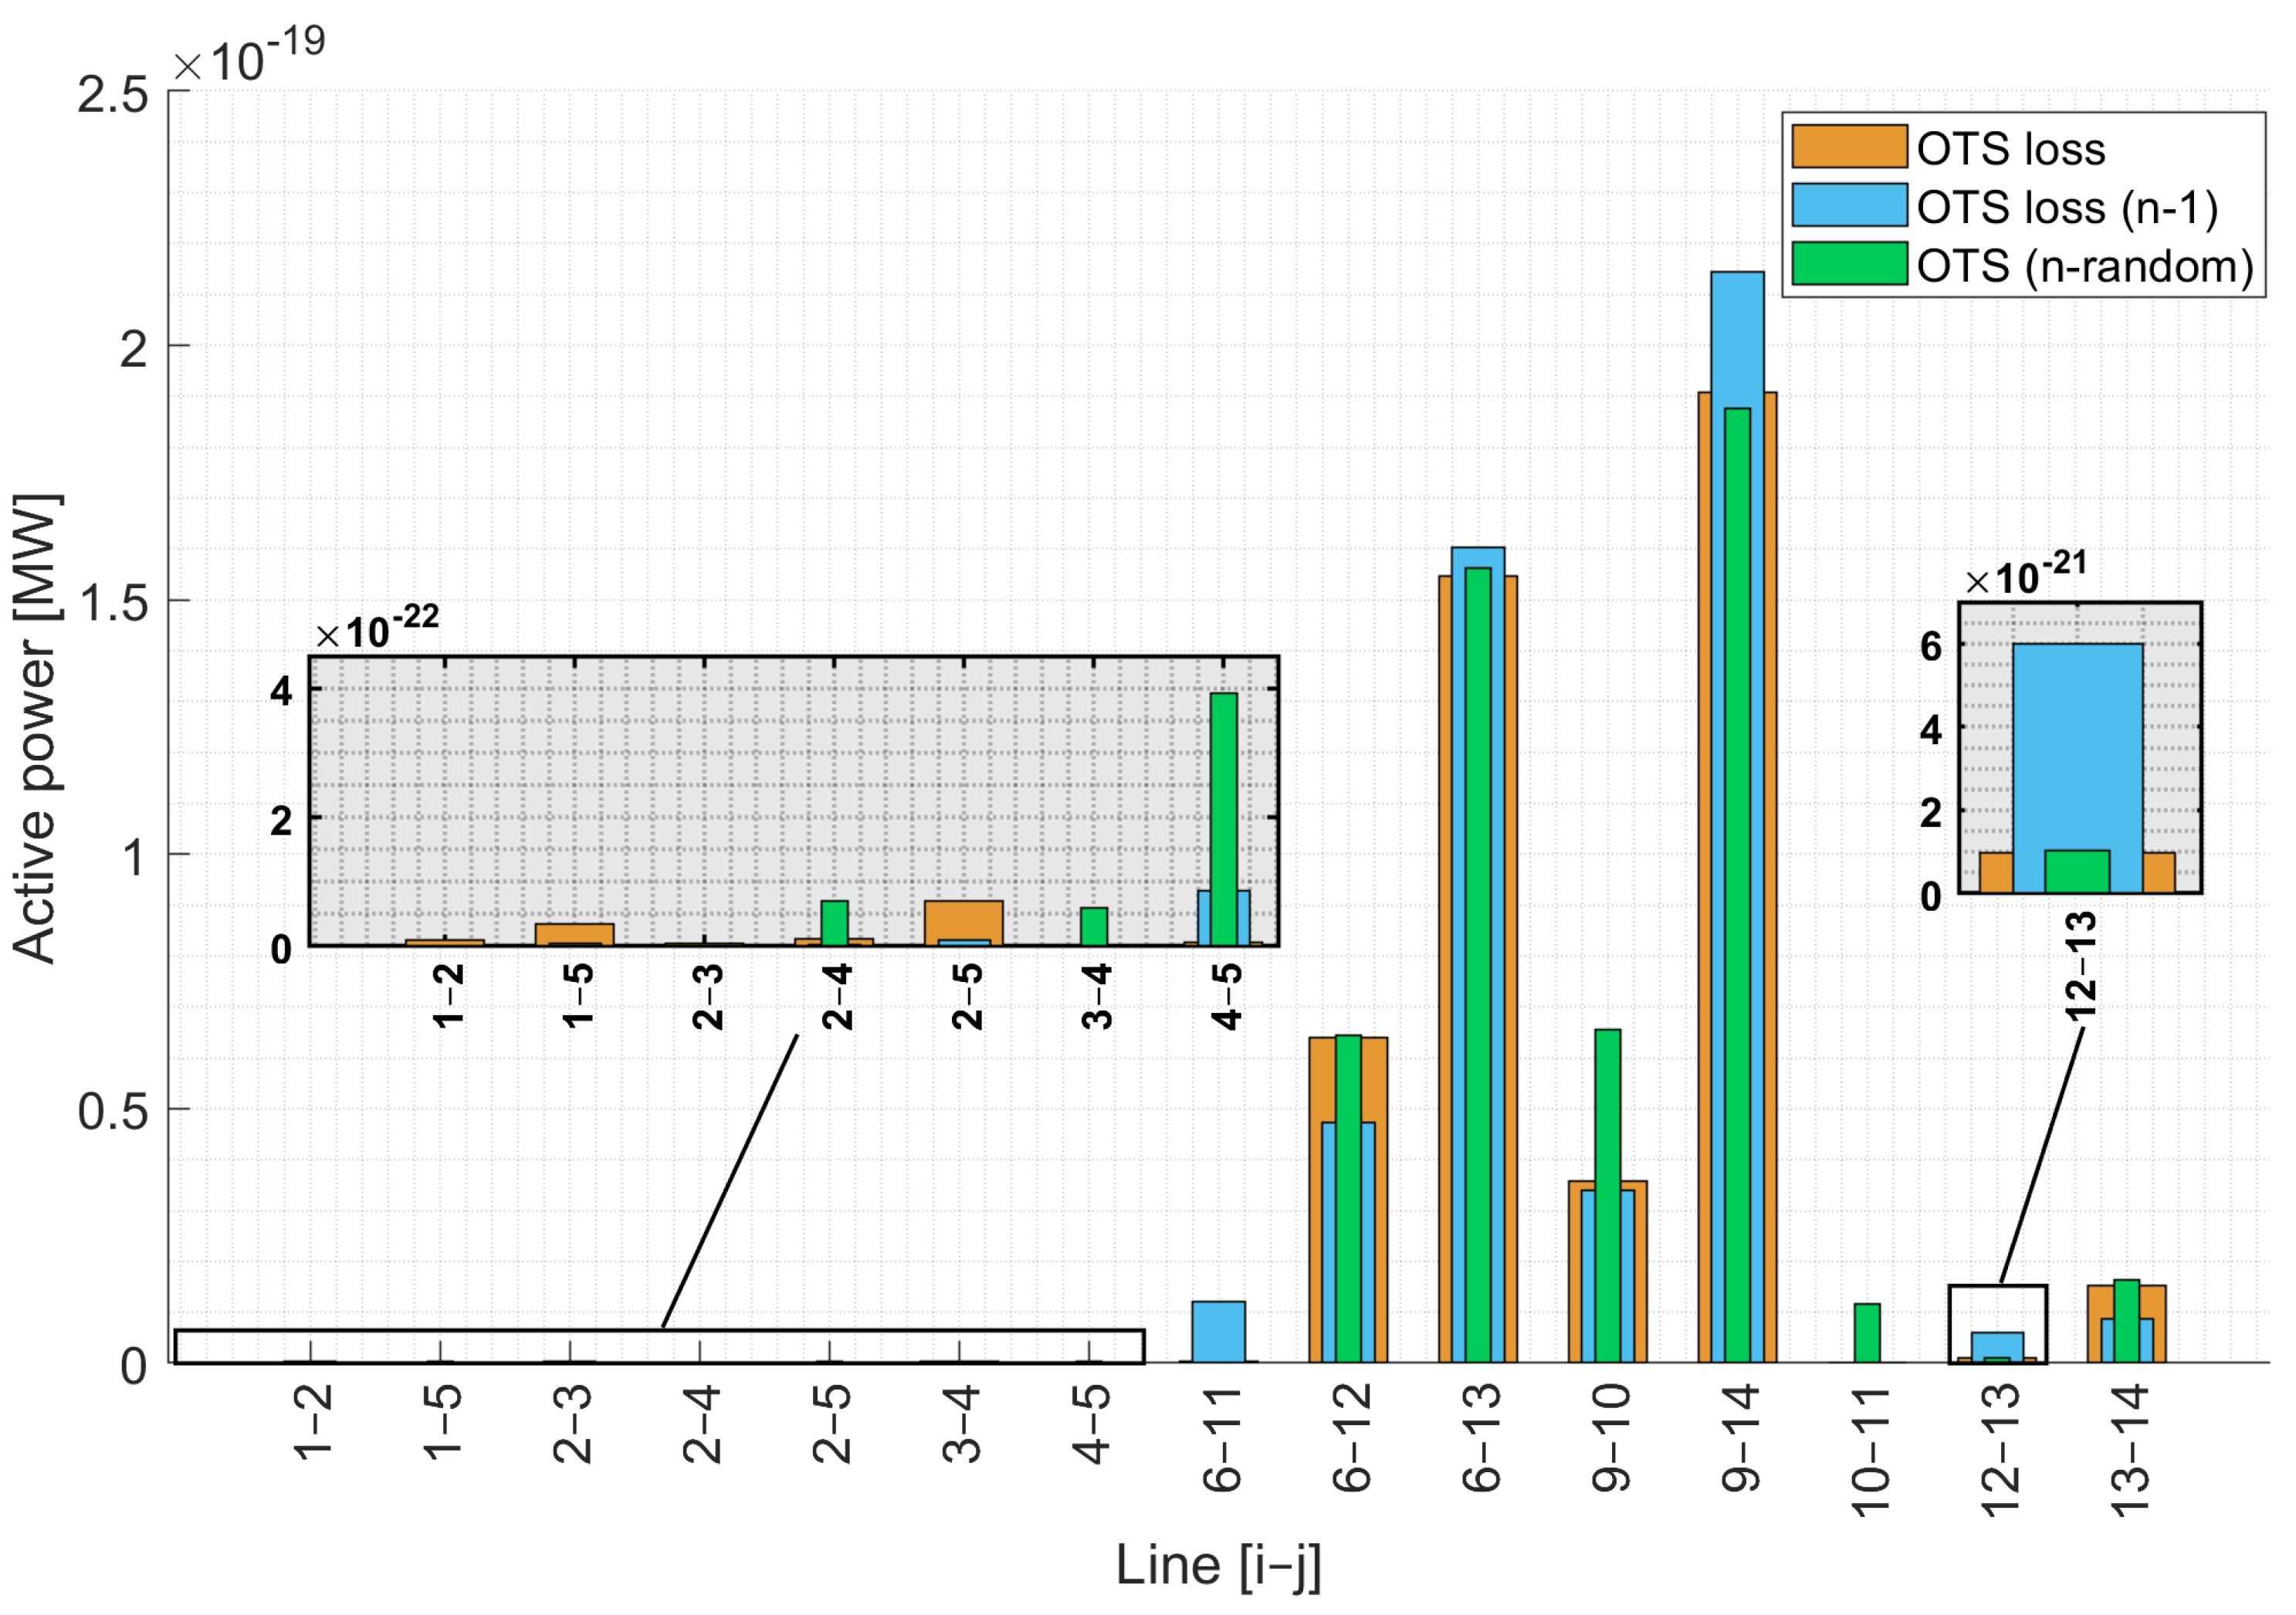
When analyzing these cases, it is important to consider that in case 02, the loss in line 3–4 is evaluated during OTS. Still, when executing the AC-OPF, that line is disconnected due to a modification in the system topology to minimize losses, as illustrated in
Figure 11. In case 03, the system is examined under the N-1 contingency, which involves the disconnection of line 10–11 before executing the OTS, as indicated in
Table 4. However, OTS proposes the disconnection of line 12–13 as the best option for the system, as observed in
Figure 5 and
Figure 6. In case 04, a random contingency occurs in the transmission lines, specifically in line 6–11, as detailed in
Table 4. Once the fault is identified, OTS is carried out, resulting in a reconfiguration of the EPS with lines 1–5 and 2–3 disconnected. Despite the modifications in the system configuration in all the analyzed cases, this test model continues to operate within the allowed levels.
The losses in cases 02, 03, and 04 show a notable reduction compared to the base case where OTS is not yet applied. It is observed in
Figure 11 that transmission lines (6–12), (6–13), (9–10), and (9–14) present the highest losses in the three cases studied with OTS. When analyzing the different cases, it is evident that losses are more pronounced during random contingencies. Regarding transmission lines (1–2), (1–5), (2–3), (2–4), (2–5), (3–4), and (4–5), it is observed that the losses are minimal when a change in the system topology is made through OTS, or rather, they have less impact.
When comparing the total losses obtained in GAMS with those calculated in Digsilent in
Table 4, the following error margins are observed. The base case has a difference of 0.0011 [p.u.]. In case 02, the difference is 1.68E-19 [p.u.]. In case 03, the difference is 4.40E-20 [p.u.], while in case 04, it is 4.30E-20 [p.u.]. These differences are minimal and acceptable in the study. It is important to emphasize that the optimal power flow performed in the Digsilent Power Factory software was based on the same parameter configuration used in the GAMS software, including generators, transformers, lines, and loads, thereby validating the method used for optimizing TL losses through transmission line switching (OTS).
4.6. Generation Costs
Table 5 presents the total generation costs for the test systems after implementing the OTS. A significant increase in total costs from the base case to the cases where OTS was applied is observed. This increase is progressive, with an increment of 6516.547 USD/H between case 01 and case 02, 6768.787 USD/H between case 01 and case 03, and 10188.192 USD/H between case 01 and case 04. These results indicate that the total costs of economic dispatch increase due to the modifications made to the EPS structure.
The results obtained from both the GAMS and Digsilent software show great proximity, indicating a minimal margin of error. In case 01, this margin is only 0.017 USD/H, while in case 02, it is 0.039 USD/H; in case 03, it is 0.062 USD/H, and in case 04, it is 0.003 USD/H. Although the transmission line losses are reduced, this benefit significantly increases generation costs compared to the base case where OTS was not applied.
5. Conclusions
The impact of OTS on the parameters in an AC-OPF was analyzed, considering that economic dispatch costs increase when TLs are taken out of service. Comparing the base case with cases 02, 03, and 04, total costs increase as active energy losses in the TLs are reduced. It should be noted that this occurs because the analysis prioritizes loss reduction over generation cost reduction. The study focuses on the transmission lines and their characteristics to minimize losses.
Reducing reactive power dispatch in the system does not necessarily equate to loss reduction. Reactive power in these proposed case studies helps maintain operational parameters within stable limits. Reaction dispatch is needed when the EPS architecture is modified to minimize transmission line losses. OTS must perform strategic dispatches that improve system efficiency and reduce losses by optimizing power flow. Reducing reactive power dispatch can affect voltage stability, potentially causing losses if voltage profiles fall below acceptable limits.
After examining
Table 4 and
Figure 11 from the proposed scenarios, a notable reduction in transmission line losses is observed. It is important to highlight that active power (
Table 2) remains almost constant in all cases, with a slight decrease of 0.32 [p.u.] compared to the scenario where OTS is not implemented. On the other hand, analyzing reactive power dispatch shows a significant value increase. From the base case to case 02, an increase of 0.455 [p.u.] is recorded, followed by an increase of 0.545 [p.u.] from the base case to case 03, and finally, an increase of 0.564 [p.u.] from the base case to case 04. These results indicate that as the number of contingencies increases, it is necessary to increase reactive power dispatch to mitigate losses and maintain the stability of the electrical system.
After the disconnection, the load on the nodes causes variations in operational conditions due to modifications in the EPS topology. The results shown in
Figure 11 confirm that loss values vary according to which line was disconnected and its proximity to others, with those closer lines experiencing higher loadability. These characteristics are evident only in cases where an analysis has previously been conducted using the OTS algorithm. It is verified that modifying the system topology can either increase or decrease transmission line losses. Therefore, OTS performs optimal analysis to establish minimal system impact, maintaining operations within permissible limits and achieving a 99% reduction in TL losses compared to the base case.
After evaluating the TL losses, using the base case as a starting point, it can be determined that each studied case exhibits corrective control in the system topology. These cases are not limited to those proposed in this study. The scenarios can be without contingencies or with contingencies, requiring the algorithm to find an optimal configuration that minimizes TL losses; the algorithm may also determine that the best topology is the initial one after the fault. The results confirm that the proposed algorithm effectively evaluates losses in electrical power systems (EPS) through corrective control of the system topology to minimize transmission line losses.
The results obtained with the algorithm in GAMS and verified with Digsilent Power Factory software conclude that the proposed algorithm in this study is reliable. There are no significant differences from reality, rather, it contributes to the study of optimal power dispatch with loss minimization in TL, applicable to any EPS that needs analysis.
Abbreviations
The following abbreviations are used in this manuscript:
| bg |
Generation production costs |
| i-j |
Transmission line connection status |
| Nsw |
Number of switched lines |
| Bi-j |
Susceptance between nodes i and j |
| Cg |
Generation production costs |
| Pg |
Total active power generated |
| PD |
Total active power consumed |
| Qg |
Total reactive power generated |
| QD |
Total reactive power consumed |
| Vi |
Voltage magnitude at node i |
| Vj |
Voltage magnitude at node j |
| Gi-j |
Conductance between nodes i and j |
| Bi-j |
Susceptance between nodes i and j |
| Pgimin |
Lower limit of active power |
| Pgimax |
Upper limit of active power |
| Qgimin |
Lower limit of reactive power |
| Qgimax |
Upper limit of reactive power |
| Vimin |
Lower limit of voltage |
| Vimax |
Upper limit of voltage |
| i |
Voltage angle at node i |
| j |
Voltage angle at node j |
| imin |
Lower voltage angle at node i |
| imax |
Upper voltage angle at node i |
| SIL |
Maximum power that can be transmitted on the
transmission line 1
|
References
- Villacrés, R.; Carrión, D. Optimizing Real and Reactive Power Dispatch Using a and Fuzzy Satisfaction. Energies 2023, 17. [Google Scholar] [CrossRef]
- Yuan, Y.; Zhang, H.; Cheng, H.; Wang, Z.; Zhang, J. Resilience-oriented Transmission Expansion Planning with Optimal Transmission Switching Under Typhoon Weather. CSEE Journal of Power and Energy 2022. [Google Scholar] [CrossRef]
- Chamba, A.; Barrera-Singaña, C.; Arcos, H. Optimal Reactive Power Dispatch in Electric Transmission Systems Using the Multi-Agent Model with Volt-VAR Control. Energies 2023, 16, 1–25. [Google Scholar] [CrossRef]
- Pinzon, S.; Carrión, D.; Inga, E. Optimal Transmission Switching Considering N-1 Contingencies on Power Transmission Lines. IEEE Latin America Transactions 2021, 19. [Google Scholar] [CrossRef]
- Kamarposhti, M.A.; Shokouhandeh, H.; Colak, I.; Band, S.S.; Eguchi, K. Optimal Location of FACTS Devices in Order to Simultaneously Improving Transmission Losses and Stability Margin Using Artificial Bee Colony Algorithm. IEEE Access 2021, 9, 125920–125929. [Google Scholar] [CrossRef]
- Aydin, F.; Gumus, B. Determining Optimal SVC Location for Voltage Stability Using Multi-Criteria Decision Making Based Solution: Analytic Hierarchy Process (AHP) Approach. IEEE Access 2021, 9, 143166–143180. [Google Scholar] [CrossRef]
- Leveringhaus, T.; Kluß, L.; Bekker, I.; Hofmann, L. Solving Combined Optimal Transmission Switching and Optimal Power Flow sequentially as convexificated Quadratically Constrained Quadratic Program. Electric Power Systems Research 2022, 212. [Google Scholar] [CrossRef]
- Dey, S.S.; Kocuk, B.; Redder, N. Node-based valid inequalities for the optimal transmission switching problem. Discrete Optimization 2022, 43. [Google Scholar] [CrossRef]
- Li, P.; Huang, X.; Qi, J.; Wei, H.; Bai, X. A Connectivity Constrained MILP Model for Optimal Transmission Switching. IEEE Transactions on Power Systems 2021, 36, 4820–4823. [Google Scholar] [CrossRef]
- Crozier, C.; Baker, K.; Toomey, B. Feasible region-based heuristics for optimal transmission switching. Sustainable Energy, Grids and Networks 2022, 30. [Google Scholar] [CrossRef]
- Meneses, M.; Nascimento, E.; MacEdo, L.H.; Romero, R. Transmission Network Expansion Planning Considering Line Switching. IEEE Access 2020, 8, 115148–115158. [Google Scholar] [CrossRef]
- Carrión, D.; Palacios, J.; Espinel, M.; González, J.W. Transmission Expansion Planning Considering Grid Topology Changes and N-1 Contingencies Criteria. Lecture Notes in Electrical Engineering. Springer Science and Business Media Deutschland GmbH, 2021, Vol. 762 LNEE, pp. 266–279. [CrossRef]
- Ahmed, R.; Nawaz, A.; Javid, Z.; Khan, M.Y.A.; Shah, A.A.; Valarezo, O.M. Optimal transmission switching based on probabilistic load flow in power system with large-scale renewable energy integration. Electrical Engineering 2022, 104, 883–898. [Google Scholar] [CrossRef]
- An, Q.; Wang, J.; Li, G.; Zhou, M. Role of optimal transmission switching in accommodating renewable energy in deep peak regulation-enabled power systems. Global Energy Interconnection 2020, 3, 577–584. [Google Scholar] [CrossRef]
- Ramirez-Burgueno, L.D.; Sang, Y.; Santiago, N. Improving the Computational Efficiency of Optimal Transmission Switching Problems. 2022 North American Power Symposium (NAPS). IEEE, 2022, pp. 1–6. [CrossRef]
- Han, T.; Hill, D.J.; Song, Y. Formulating Connectedness in Security-Constrained Optimal Transmission Switching Problems. IEEE Transactions on Power Systems 2022, 37, 4137–4140. [Google Scholar] [CrossRef]
- Mohseni-Bonab, S.M.; Kamwa, I.; Rabiee, A.; Chung, C.Y. Stochastic optimal transmission Switching: A novel approach to enhance power grid security margins through vulnerability mitigation under renewables uncertainties. Applied Energy 2022, 305. [Google Scholar] [CrossRef]
- Heidarifar, M.; Andrianesis, P.; Ruiz, P.; Caramanis, M.C.; Paschalidis, I.C. An optimal transmission line switching and bus splitting heuristic incorporating AC and N-1 contingency constraints. International Journal of Electrical Power and Energy Systems 2021, 133. [Google Scholar] [CrossRef]
- Flores, M.; MacEdo, L.H.; Romero, R. Alternative Mathematical Models for the Optimal Transmission Switching Problem. IEEE Systems Journal 2021, 15, 1245–1255. [Google Scholar] [CrossRef]
- Jiang, J.; Wu, H.; Li, W.; Dong, J.; Gu, X. Economic Dispatch for Interconnected Power Network Considering Optimal Transmission Switching. 18th International Conference on AC and DC Power Transmission (ACDC 2022), 2022. [CrossRef]
- Manansala, J.C.; Pacis, M.C. Determination of Optimal Topology for Transmission Networks with Distributed Generation using Optimal Transmission Switching (OTS). TENSYMP 2021 - 2021 IEEE Region 10 Symposium. Institute of Electrical and Electronics Engineers Inc., 2021. [CrossRef]
- Belanger, J.; Dessaint, L.A.; Kamwa, I. An Extended Optimal Transmission Switching Algorithm Adapted for Large Networks and Hydro-Electric Context. IEEE Access 2020, 8, 87762–87774. [Google Scholar] [CrossRef]
- Masache, P.; Carrión, D.; Cárdenas, J. Optimal transmission line switching to improve the reliability of the power system considering ac power flows. Energies 2021, 14, 1–17. [Google Scholar] [CrossRef]
- Halepoto, H.; Gong, T.; Noor, S.; Memon, H. Bibliometric Analysis of Artificial Intelligence in Textiles. MDPI 2022, 15, 1–14. [Google Scholar] [CrossRef] [PubMed]
- Hinneck, A.; Pozo, D. Optimal Transmission Switching: Improving Solver Performance Using Heuristics. IEEE Transactions on Power Systems 2023, 38, 3317–3330. [Google Scholar] [CrossRef]
- Brown, W.E.; Moreno-Centeno, E. Transmission-Line Switching for Load Shed Prevention via an Accelerated Linear Programming Approximation of AC Power Flows. IEEE Transactions on Power Systems 2020, 35, 2575–2585. [Google Scholar] [CrossRef]
- Soroudi, A. Power system optimization modeling in GAMS; 2017; pp. 1–295. [CrossRef]
- Lu, M.; Nagarajan, H.; Yamangil, E.; Bent, R.; Backhaus, S.; Barnes, A. Optimal Transmission Line Switching Under Geomagnetic Disturbances. IEEE Transactions on Power Systems 2018, 33, 2539–2550. [Google Scholar] [CrossRef]
- Yang, S.; Chen, W.; Zhang, X.; Jiang, Y. Blocking cascading failures with optimal corrective transmission switching considering available correction time. International Journal of Electrical Power and Energy Systems 2022, 141. [Google Scholar] [CrossRef]
- Moreno, E.A.; Hinojosa, V.H. Flujo Óptimo De Potencia Utilizando Algoritmos Evolutivos Programación En Digsilent. Revista Técnica "Energía" 2009, 5, 20–30. [Google Scholar] [CrossRef]
- Zhao, B.; Hu, Z.; Zhou, Q.; Zhang, H.; Song, Y. Optimal transmission switching to eliminate voltage violations during light-load periods using decomposition approach. Journal of Modern Power Systems and Clean Energy 2019, 7, 297–308. [Google Scholar] [CrossRef]
|
Disclaimer/Publisher’s Note: The statements, opinions and data contained in all publications are solely those of the individual author(s) and contributor(s) and not of MDPI and/or the editor(s). MDPI and/or the editor(s) disclaim responsibility for any injury to people or property resulting from any ideas, methods, instructions or products referred to in the content. |
© 2024 by the authors. Licensee MDPI, Basel, Switzerland. This article is an open access article distributed under the terms and conditions of the Creative Commons Attribution (CC BY) license (http://creativecommons.org/licenses/by/4.0/).

