Submitted:
05 June 2024
Posted:
07 June 2024
You are already at the latest version
Abstract
Keywords:
1. Introduction
2. Materials and Methods
2.1. Preparation
2.2. Analytical Methods
2.2.1. X-ray Diffraction (XRD)
2.2.2. IR Analysis
2.2.3. Raman Spectroscopy (RS)
2.2.4. Thermal Analysis (TA)
3. Results and Discussion
3.1. XRD Results
3.2. IR Spectroscopy
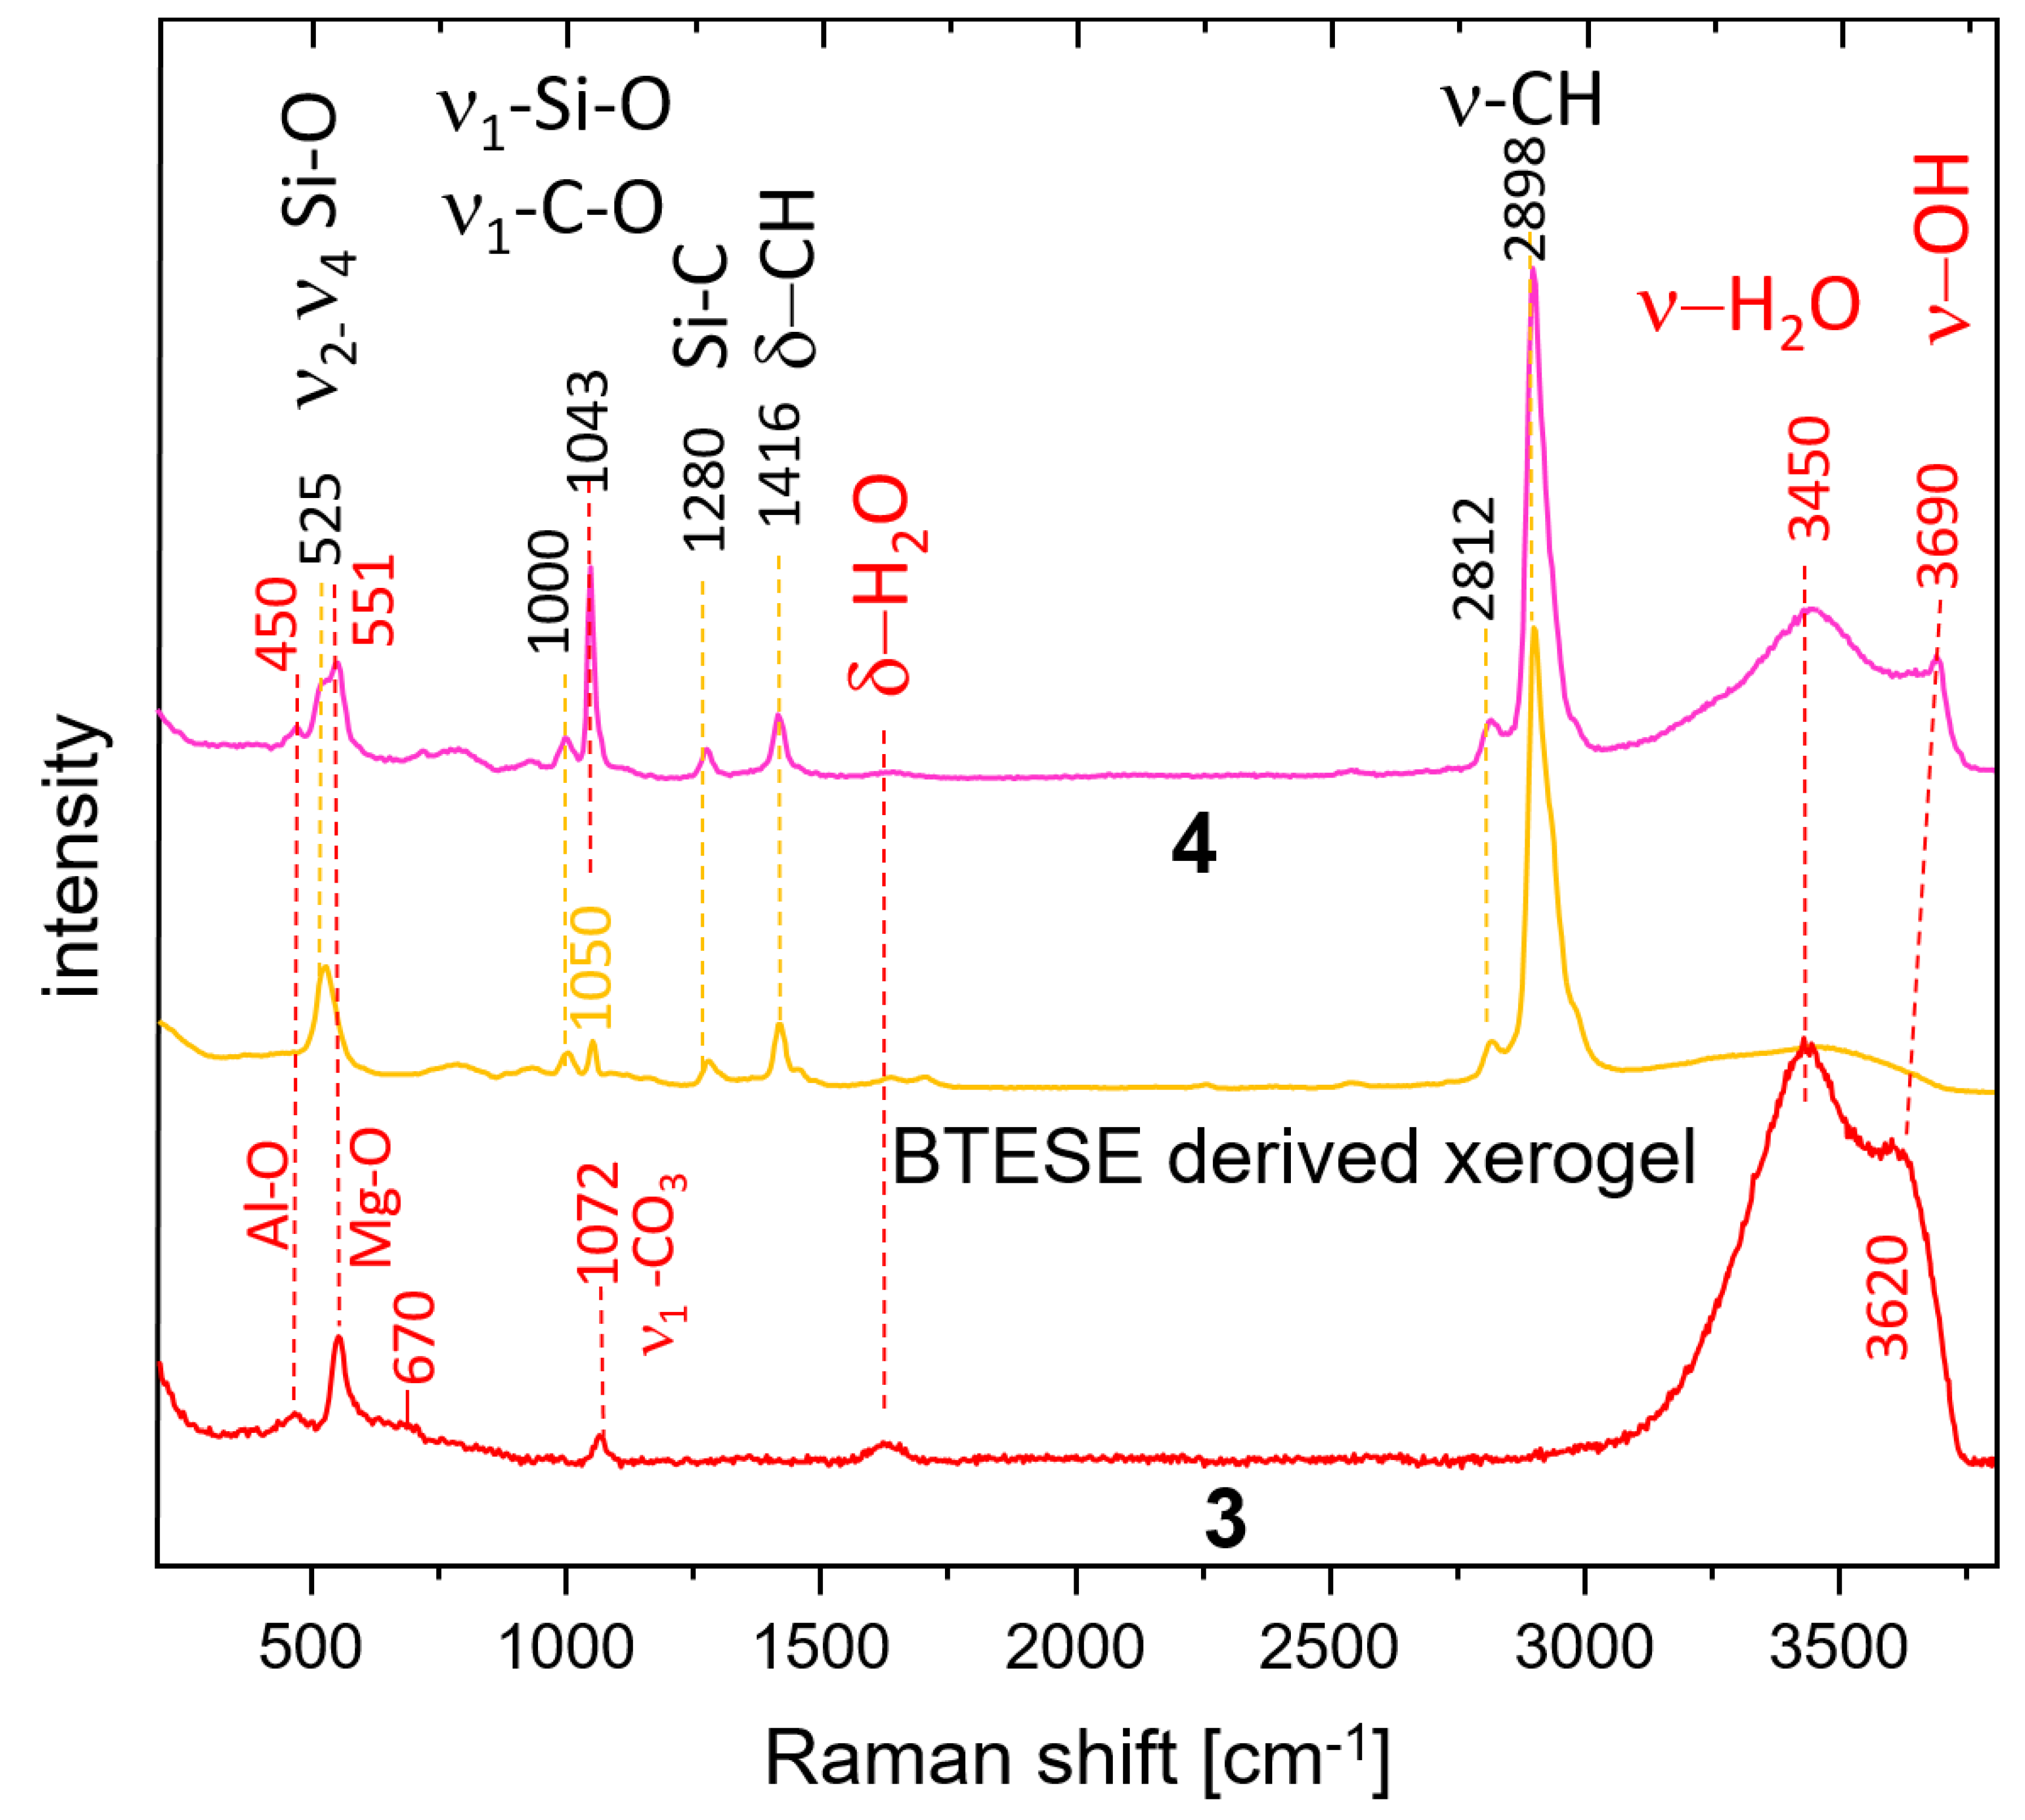
3.3. Raman Spectroscopy
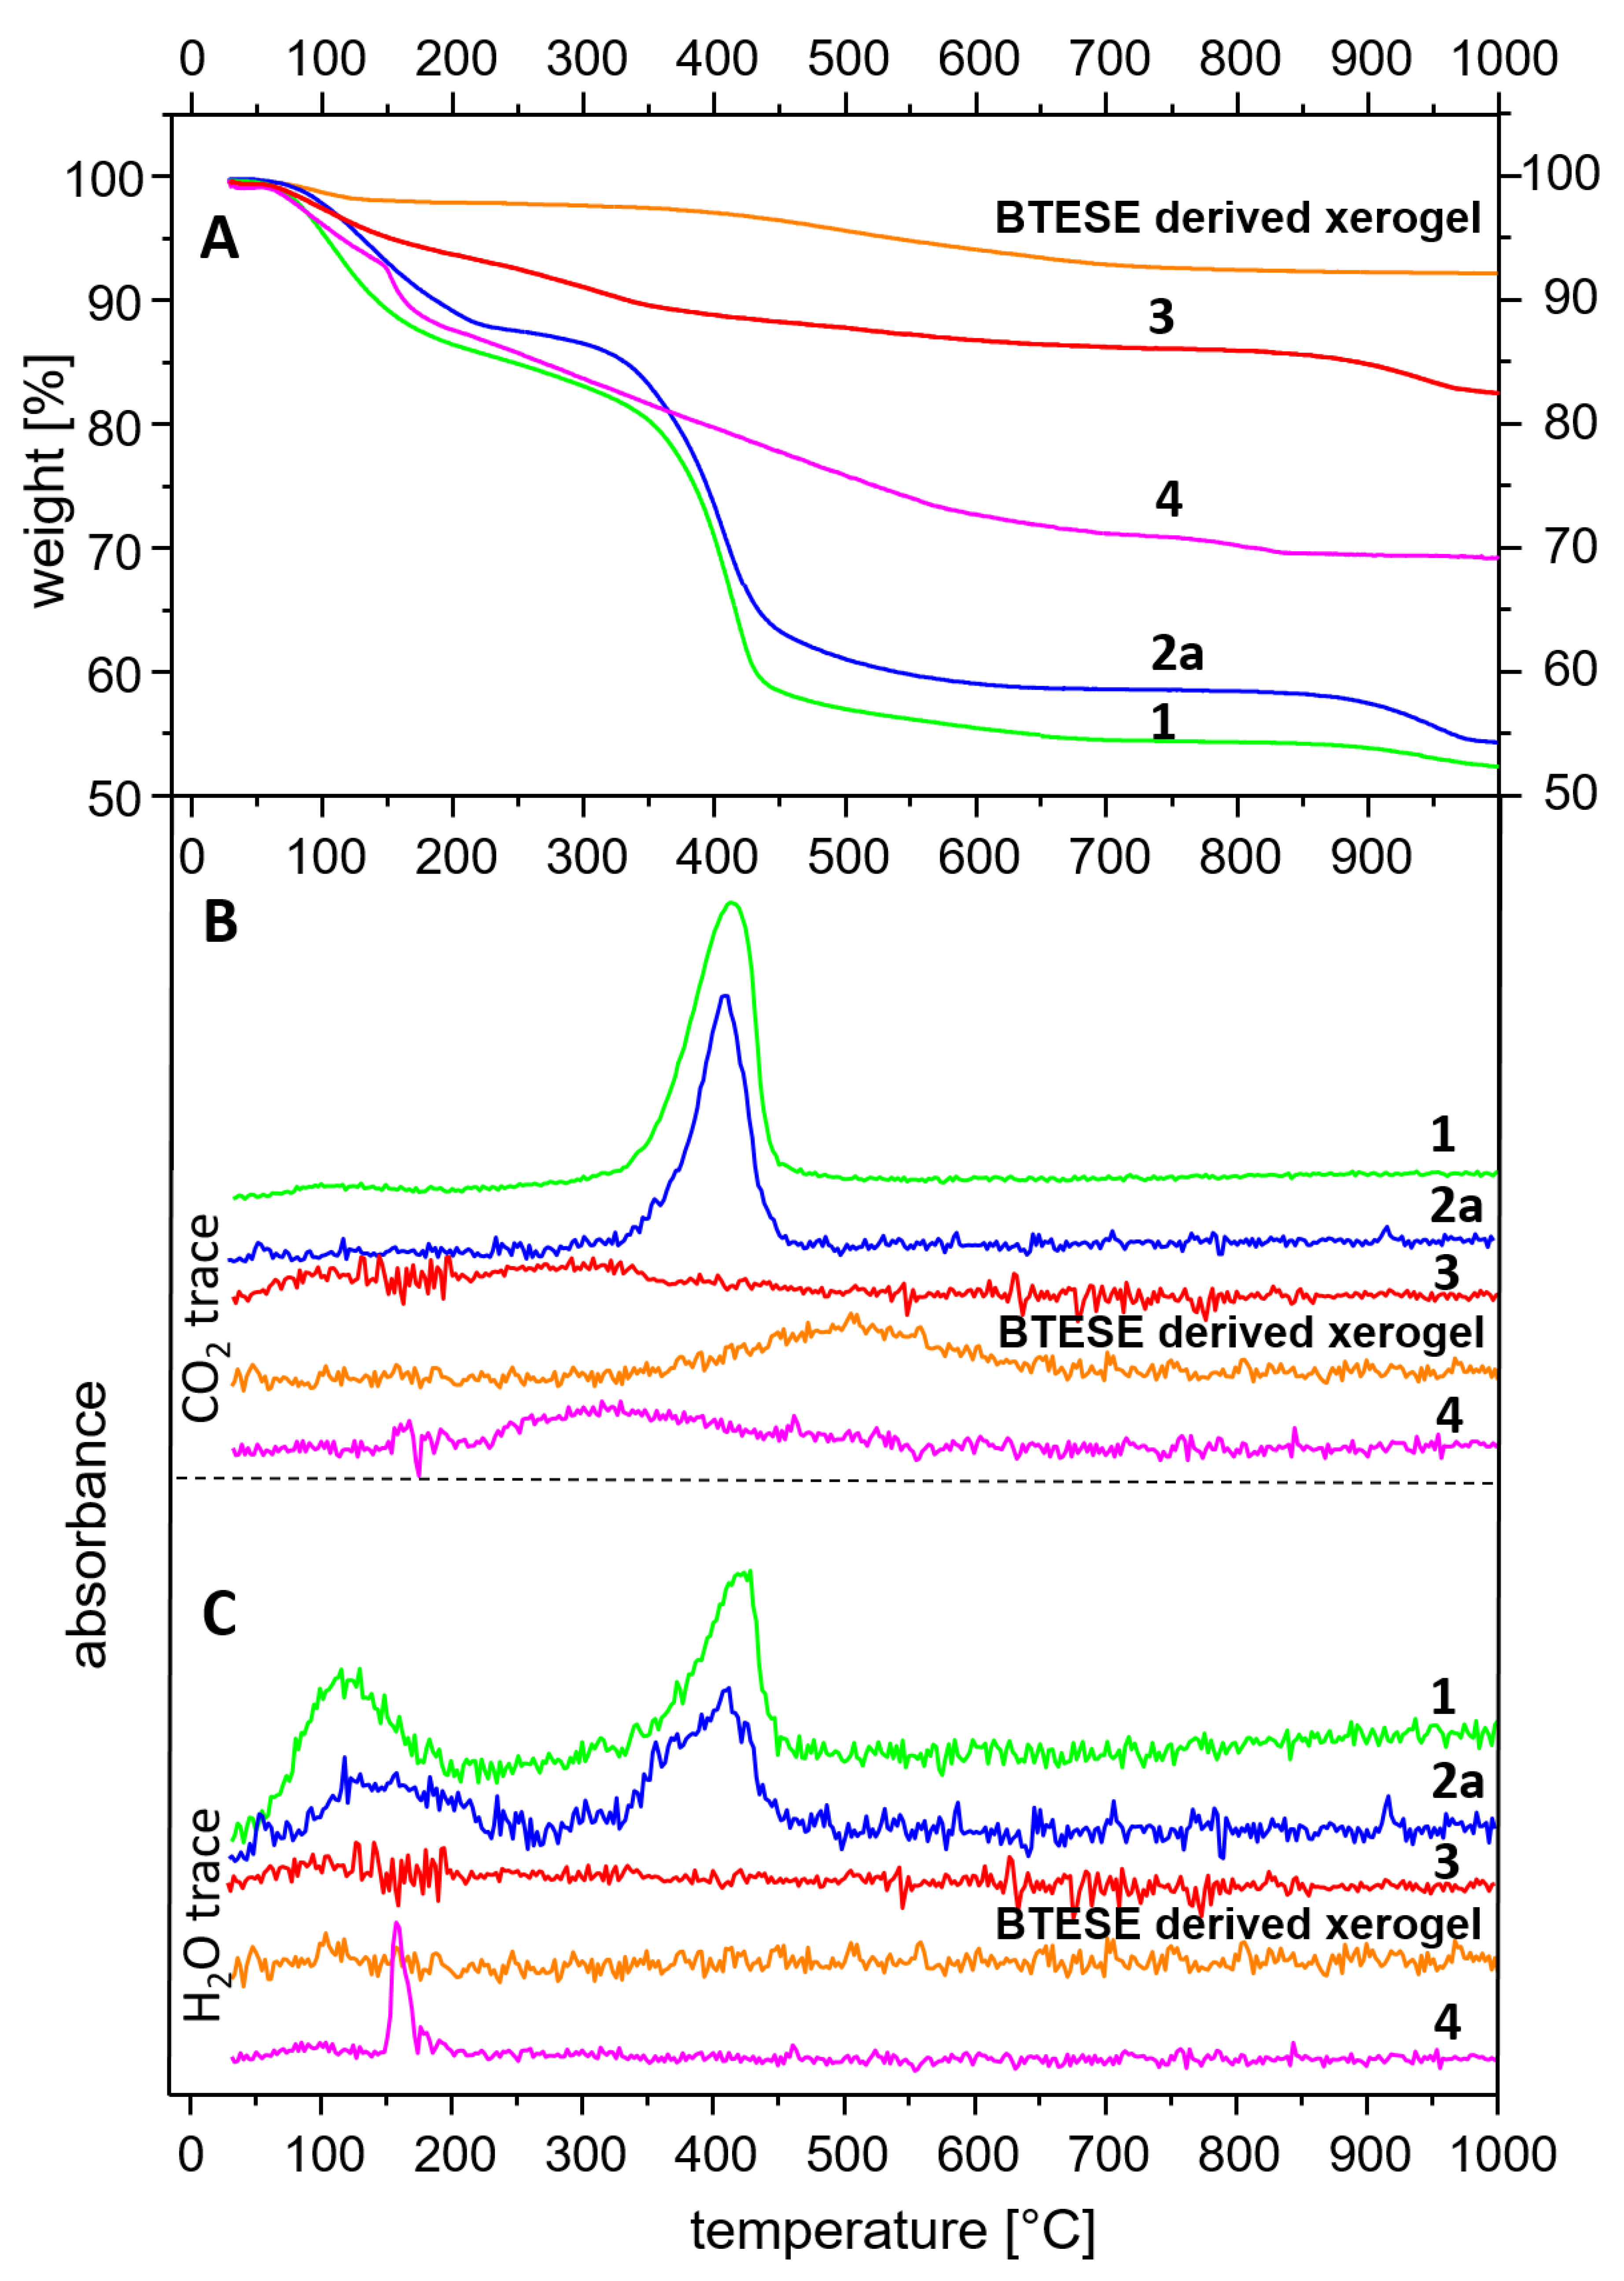
3.4. Thermal Analysis
4. Conclusions
Author Contributions
Funding
Institutional Review Board Statement
Data Availability Statement
Conflicts of Interest
References
- C. Hochstetter, Untersuchung über die Zusammensetzung einiger Mineralien. J. Prakt. Chem. 1842, 27, 375–378. [Google Scholar] [CrossRef]
- S.J. Mills, A.G. Christy, R.T. Schmitt, The creation of neotypes for hydrotalcite, Mineral. Mag. 2016, 80, 1023–1029. [CrossRef]
- R. Allmann, R. and H.P. Jepsen, Die Struktur des Hydrotalkits. Neues Jb. Miner. Monat., 1969, 544–551.
- M. Bellotto, B. Rebours, O. Clause, J. Lynch, D. Bazin, D. and E. Elkaim, A reexamination of hydrotalcite crystal chemistry. J. Phys. Chem., 1996, 100, 8527–8534. [CrossRef]
- E. Zhitova, S. Krivovichev, I. Pekov, H. Greenwell, Crystal chemistry of natural layered double hydroxides. 5. Single-crystal structure refinement of hydrotalcite, [Mg6Al2(OH)16](CO3)(H2O)4. Mineral. Mag., 2019, 83(2), 269-280. [CrossRef]
- D.G. Evans, R.C.T. Slade, Structural Aspects of Layered Double Hydroxides. In: Duan, X., Evans, D.G. (eds) Layered Double Hydroxides. Structure and Bonding, Springer, Berlin, Heidelberg, 2005; vol 119. [CrossRef]
- M.K. Ram Reddy, Z.P. Xu, G.Q. Lu, J.C. Diniz da Costa, Layered Double Hydroxides for CO2 Capture: Structure Evolution and Regeneration, Ind. Eng. Chem. Res., 2006, 45, 7504–7509. [CrossRef]
- M. León, E. Díaz, S. Bennici, A. Vega, S. Ordóñez, A. Auroux, Adsorption of CO2 on Hydrotalcite-Derived Mixed Oxides: Sorption Mechanisms and Consequences for Adsorption Irreversibility, Ind. Eng. Chem. Res., 2010, 49, 3663–3671. [CrossRef]
- Q. Wang, H.H. Tay, D.J.W. Ng, L. Chen, Y. Liu, J. Chang, Z. Zhong, J. Luo, A. Borgna, The effect of trivalent cations on the performance of Mg-M-CO3 layered double hydroxides for high-temperature CO2 capture, ChemSusChem, 2010, 3, 965–973. [CrossRef]
- M. Bublinski, CO2-Abtrennung aus Synthesegasen mit Hydrotalciten unter Hochtemperatur-Hochdruckbedingungen, Dissertation, University of Stuttgart, Germany, 2017. [CrossRef]
- M. Adachi-Pagano, C. Forano, J.-P. Besse, Delamination of layered double hydroxides by use of surfactants, Chem. Commun. 2000 91–92. [CrossRef]
- J. Xie, Z. Khalid, J.-M. Oh, Recent advances in the synthesis of layered double hydroxides nanosheets, B. Kor. Chem. Soc., 2022, 44 100–111. [CrossRef]
- V.K. Ameena Shirin, R. Sankar, A.P. Johnson, H.V. Gangadharappa, K. Pramod, Advanced drug delivery applications of layered double hydroxide, J. Control. Release, 2021, 330, 398–426. [CrossRef]
- N. Mao, C.H. Zhou, D.S. Tong, W.H. Yu, C.X. Cynthia Lin, Exfoliation of layered double hydroxide solids into functional nanosheets, Appl. Clay Sci., 2017, 144, 60–78. [CrossRef]
- T.W. Kim, M. Sahimi, T.T. Tsotsis, The Preparation and Characterization of Hydrotalcite Thin Films, Ind. Eng. Chem. Res., 2009, 48, 5794–5801. [CrossRef]
- N. Fajrina, N. Yusof, A.F. Ismail, J. Jaafar, F. Aziz, W. Salleh, N. Nordin, MgAl-CO3 layered double hydroxide as potential filler in substrate layer of composite membrane for enhanced carbon dioxide separation, J. Environ. Chem. Eng., 2021, 9, 106164. [CrossRef]
- N.-Y. Huang, C.-C. Wang, C.-Y. Chen, Ethylene vinyl acetate copolymer/Mg–Al-layered double hydroxide nanocomposite membranes applied in CO2 / N2 gas separation, Polym. Composite, 2021, 42, 4065–4072. [CrossRef]
- A.D. Wiheeb, S.W. Shakir, M.R. Othman, Synthesis and Characterization of Mesoporous Hydrotalcite-Alumina Membrane for Carbon Dioxide Enrichment, IOP Conf. Ser.: Mater. Sci. Eng., 2018, 454, 12107. [CrossRef]
- R.M. de Vos, H. Verweij, High-selectivity, high-flux silica membranes for gas separation, Science, 1998, 279, 1710–1711. [CrossRef]
- J.E. ten Elshof, Hybrid Materials for Molecular Sieves, in: L.C. Klein, M. Aparicio, A. Jitianu (Eds.), Handbook of sol-gel science and technology, Living Reference Work, Springer International Publishing, [Switzerland], 2016, pp. 1–27. [CrossRef]
- M. Kanezashi, R. Matsugasako, H. Tawarayama, H. Nagasawa, T. Tsuru, Pore size tuning of sol-gel-derived triethoxysilane (TRIES) membranes for gas separation, J. Membrane Sci., 2017, 524, 64–72. [CrossRef]
- T. van Gestel, F. Velterop, W.A. Meulenberg, Zirconia-supported hybrid organosilica microporous membranes for CO2 separation and pervaporation, Sep. Purif. Technol., 2021, 259, 118114. [CrossRef]
- H.L. Castricum, R. Kreiter, H.M. van Veen, D.H. Blank, J.F. Vente, J.E. ten Elshof, High-performance hybrid pervaporation membranes with superior hydrothermal and acid stability. J. Membr. Sci. 2008, 324, 111–118. [CrossRef]
- H.L. Castricum, G.G. Paradis, M.C. Mittelmeijer-Hazeleger, R. Kreiter, J.F. Vente, J.E. ten Elshof, Tailoring the separation behavior of hybrid organosilica membranes by adjusting the structure of the organic bridging group. Adv. Funct. Mater., 2011, 21, 2319-2329. [CrossRef]
- M. Kanezashi, K. Yada, T. Yoshioka, T. Tsuru, Design of silica networks for development of highly permeable hydrogen separation membranes with hydrothermal stability, J. Am. Chem. Soc., 2009, 131, 414-415. [CrossRef]
- N. Moriyama, H. Nagasawa, M. Kanezashi, I. Kenji, T.Tsuru, (2018) Bis(triethoxysilyl)ethane (BTESE)-derived silica membranes: pore formation mechanism and gas permeation properties, J Sol-Gel Sci. Technol., 2018, 86, 63–72. [CrossRef]
- I. Agirre, P.L. Arias, H.L. Castricum, M. Creatore, J.E. ten Elshof, G.G. Paradis, P.H.T. Ngamou, H.M. van Veen, J.F. Vente, (2014) Hybrid organosilica membranes and processes: status and outlook. Sep. Purif. Technol., 2014, 121, 2-12. [CrossRef]
- F. Leroux, M. Adachi-Pagano, M. Intissar, S. Chauvière, C. Forano, J.-P. Besse, Delamination and restacking of layered double hydroxides, J. Mater. Chem., 2001, 11, 105–112. [CrossRef]
- M. Piccinni, S. Bellani, G. Bianca, F. Bonaccorso, Nickel-Iron Layered Double Hydroxide Dispersions in Ethanol Stabilized byAcetate Anions, Inorg. Chem., 2022, 61, 4598–4608. [CrossRef]
- M. Othman, Z. Helwani, Martunus, W.J.N. Fernando, Synthetic hydrotalcites from different routes and their application as catalysts and gas adsorbents: a review, Appl. Organometal. Chem., 2009, 23, 335–346. [CrossRef]
- J.A. Gursky, S.D. Blough, C. Luna, C. Gomez, A.N. Luevano, E.A. Gardner, Particle-particle interactions between layered double hydroxide nanoparticles, J. Am. Chem. Soc., 2006, 128, 8376–8377. [CrossRef]
- E. Gardner, K.M. Huntoon, T.J. Pinnavaia, Direct Synthesis of Alkoxide-Intercalated Derivatives of Hydrocalcite-like Layered Double Hydroxides: Precursors for the Formation of Colloidal Layered Double Hydroxide Suspensions and Transparent Thin Films, Adv. Mater., 2001, 13, 1263. [CrossRef]
- D. Merz, O. Dregert, K. Garbev, P. Stemmermann, A reliable quantitative TA-FTIR method for cementitious material characterization. Proceedings of GEFTA-STK-joint Meeting on Thermal Analysis and Calorimetry. 2012; 53.
- J.T. Kloprogge, D. Wharton, L. Hickey and R.L. Frost, Infrared and Raman study of interlayer anions CO32−, NO3−, SO42− and ClO4− in Mg/Al-hydrotalcite. Am. Mineral., 2002, 87, 623–629. [CrossRef]
- R.L. Frost, H.J. Spratt and S.L. Palmer, Infrared and near-infrared spectroscopic study of synthetic hydrotalcites with variable divalent/trivalent cationic ratios. Spectrochim. Acta A, 2009, 72, 984–988. [CrossRef]
- M.J. Hernandez-Moreno, M.A. Ulibarri, J.L. Rendon, and C.J. Serna, IR characteristics of hydrotalcite-like compounds. Phys. Chem. Miner., 1985, 12, 34–38. [CrossRef]
- M. Mališová, M. Horňaček, J. Mikulec, P. Hudec,V. Jorik, FTIR study of hydrotalcite, Acta Chim. Slov., 2018, 11, 2/2, 147-166. [CrossRef]
- K. Coenen, F. Gallucci, B. Mezari, E. Hensen, M. van S. Annaland, An in-situ IR study on the adsorption of CO2 and H2O on hydrotalcites, J. CO2 Util., 2018, 24, 228-239. [CrossRef]
- A. Dawes, N.J. Mason, and H.J. Fraser, Using the C-O stretch to unravel the nature of hydrogen bonding in low-temperature solid methanol-water condensates. Phys. Chem. Chem. Phys. : PCCP, 2016, 18 2, 1245-1257. [CrossRef]
- E.K. Plyler, Infrared spectra of methanol, ethanol, and n-propanol, J. Res. Nat. Bur.Stand., 1952, 48, 281-286. [CrossRef]
- B. Rosales-Reina, G. Cruz-Quesada, N. Padilla-Postigo, M. Irigoyen-Razquin, E. Alonso-Martínez, M.V. López-Ramón, M. Espinal-Viguri, J.J. Garrido, Tunability of Hybrid Silica Xerogels: Surface Chemistry and Porous Texture Based on the Aromatic Precursor. Gels. 2023, 9(5), 382. [CrossRef]
- Y. Kim M.S. Hwang, H.J.Kim, J.Y.Kim, Y.Lee, Infrared spectroscopy study of low-dielectric-constant fluorine-incorporated and carbon-incorporated silicon oxide films, J. Appl. Phys., 2001,90, 3367–3370. [CrossRef]
- L. Meng, M. Kanezashi, J. Wang, T. Tsuru, Permeation properties of BTESE–TEOS organosilica membranes and application to O2/SO2 gas separation, J. Membrane Sci., 2015, 496, 211-218. [CrossRef]
- M.A. Wahab, II. Kim, C.Ha, Hybrid periodic mesoporous organosilica materials prepared from 1,2-bis (triethoxysilyl) ethane and (3-cyanopropyl) triethoxysilane, Micropor. Mesopor. Mat., 2004, 69, 19–27. [CrossRef]
- C.D. Keefe, E.A.L. Gillis, L. MacDonald, Improper Hydrogen-Bonding CH Center Dot Y Interactions in Binary Methanol Systems As Studied by FTIR and Raman Spectroscopy. J. Phys. Chem. A, 2009, 113, 2544−2550. [CrossRef]
- Yuanqin Yu, Yuxi Wang, Ke Lin, Naiyin Hu, Xiaoguo Zhou, Shilin Liu, Complete Raman spectral assignment of methanol in the C-H stretching region, J. Phys. Chem. A, 2013, 117 21, 4377-4384. [CrossRef]
- K. Ishikawa, N. Fujima, H. Komura; First-order Raman scattering in MgO microcrystals. J. Appl. Phys., 1985, 57, (3), 973–975. [CrossRef]
- S.P. Slotznick, S-H. Shim, In situ Raman spectroscopy measurements of MgAl2O4 spinel up to 1400 °C, Am. Mineral., 2008, 93, 2-3, 470-476. [CrossRef]
- J.T. Kloprogge, R.L. Frost, Infrared emission spectroscopic study of the thermal transformation of Mg-, Ni- and Co-hydrotalcite catalysts, Appl. Catal. A, 1999, 184, 1, 61-71. [CrossRef]
- M. Kazunori Matsui, S. Hisao, K. Michihisa, Raman Spectra of Silica Gel Prepared from Triethoxysilane and Tetraethoxysilane by the Sol-Gel Method, J. Ceram. Soc. Jpn, 1998, 106, 1233, 528-530. [CrossRef]
- E. Kanezaki, Effect of atomic ratio Mg/Al in layers of Mg and Al Layered double hydroxide on thermal stability of hydrotalcite-like layered structure by means of in situ high temperature powder X-ray diffraction. Mat. Res. Bull., 1998, 33, 773–778. [CrossRef]
- R.L. Frost, W. Martens, Z. Ding, and J.T. Kloprogge, DSC and high-resolution TG of synthesized hydrotalcites of Mg and Zn. J. Therm. Anal. Calorim., 2003, 71, 429–438. [CrossRef]
- X. Ke, S. A. Bernal, J. L. Provis, Uptake of chloride and carbonate by Mg-Al and Ca-Al layered double hydroxides in simulated pore solutions of alkali-activated slag cement, Cem. Concr. Res., 2017 100, 1-13. [CrossRef]
| XRD results | samples | ||||
|---|---|---|---|---|---|
| u.c.p. | 1 | 2a | 2b | 3 | 4 |
| a (Å) | 3.07(1) | 3.066(1) | 3.14(1) | 3.10(5) | 3.064(1) |
| c (Å) 3R | 25.25(1) | 23.683(2) | 23.557(2) | 24.22(1) | 24.25(1) |
| c (Å) 2H | 16.833(7) | 15.788(1) | 15.705(2) | 16.19(1) | 16.181(7) |
| crystal size (nm) | 1.6(1) | 10.6(2) | 8.42(7) | 3.2(1) | 3.4(1) |
Disclaimer/Publisher’s Note: The statements, opinions and data contained in all publications are solely those of the individual author(s) and contributor(s) and not of MDPI and/or the editor(s). MDPI and/or the editor(s) disclaim responsibility for any injury to people or property resulting from any ideas, methods, instructions or products referred to in the content. |
© 2024 by the authors. Licensee MDPI, Basel, Switzerland. This article is an open access article distributed under the terms and conditions of the Creative Commons Attribution (CC BY) license (http://creativecommons.org/licenses/by/4.0/).


