Preprint
Article

Patterns of Formation of Binary Cobalt-Magnesia Oxide Combustion Catalysts of Various Composition

Altmetrics

Downloads

79

Views

23

Comments

0

A peer-reviewed article of this preprint also exists.

Submitted:

06 June 2024

Posted:

07 June 2024

You are already at the latest version

Alerts
Abstract
In order to establish the formation patterns of the Co–Mg oxide system, samples with different Co:Mg ratios and heat treatment temperatures were synthesized and studied. Study of the sam-ples confirmed the phase transition of MgxCo2–xO4 spinels into corresponding solid solutions at 800–900 °C. The similarity of formation patterns for different compositions is shown. The rock-salt oxide in low-temperature samples is an anion-modified paracrystalline phase that forms a “true” solid solution only upon spinel decomposition. TPR profiles of decomposed Co3O4 spinel show surface Co3O4 peaks and a wide peak corresponding to well-crystallized CoO, while par-tial Co3O4 TPR up to 380 °C results in dispersed and amorphous CoO. High-temperature non-stoichiometric samples are poorly reduced, indicating their low oxygen reactivity. Spinel reoxidation after heat treatment to 1100 °C by calcination at 750 °C showed complete regenera-tion for MgCo2O4–Co3O4 samples and its absence in case of an excess of MgO relative to stoi-chiometry. Based on the data obtained, it can be concluded that the processes governing the formation of Co–Mg oxide systems are determined by both Co:Mg ratio and the heat treatment conditions, potentially providing the possibility of fine tuning for specific catalytic processes.
Keywords: 
Subject: Chemistry and Materials Science  -   Chemical Engineering

1. Introduction

In recent years, the problem of treating gas emissions of industrial enterprises and vehicles has become increasingly relevant, leading to the development and diversification of various technologies aimed at reducing pollution. Depending on the type of harmful components, the treatment methods can be based on absorption, adsorption, as well as catalytic and membrane technologies and their combinations [1,2]. Among them, post-combustion technologies using various liquid and solid sorbents for carbon dioxide capture have recently gained particular importance among capture and purification technologies [3,4]. However, attempts at their use with real flue gases from thermal devices such as power plant boilers have shown that sorbents deactivate rapidly in the presence of impurities such as CO, NOx, SO2 and residual CHx [5]. Due to this problem, one of the current trends in the development of emission reduction methods is the use of integrated technologies, including preliminary gas treatment, primarily by catalytic means, followed by CO2 capture [6,7]. For this reason, the development of effective, stable and cheap catalysts for gas treatment, in particular for CO and residual hydrocarbons combustion, is quite relevant.
Currently the most effective catalysts for combustion of organic compounds are systems based on noble metals such as Pt and Pd, deposited on a monolith ceramic or metal support [8,9,10]. However, high cost of noble metals drives the search for other catalytic systems with comparable efficiency and lower cost [9,10]. Among such systems multicomponent oxide systems possess the most potential, being characterized by simple preparation technologies, good thermal stability, regenerative ability and easy disposal after the end of service life. Oxides active in combustion reactions include Co3O4, CuO, Cr2O3, MnO2 and their combinations [10,11]. For instance, commercial manganese-alumina catalysts, proposed in the mid-90s, are characterized by lower activity than standard oxidation noble metal- or oxide-based catalysts, but are uniquely stable at temperatures of 900–1000 °C [12].
The search for active and stable oxide catalytic systems continues to this day, primarily through the study of binary and more complex combinations of transition and non-transition metal oxides [13,14,15]. Co3O4 is characterized by the highest activity values among different oxide catalysts for CO and hydrocarbons combustion reactions [11]. It is, as a rule, employed in supported systems such as Co3O4/Al2O3; however, when overheated, the active cobalt phase reacts with the support, forming low-active cobalt aluminate CoAl2O4 [10,14,15]. In this regard, the introduction of a third oxide component is commonly proposed, which, when overheated, binds alumina with itself, forming another aluminate and thus protecting the active cobalt phase from deactivation: as a rule, alkaline earth oxides are proposed for this purpose, primarily magnesia MgO [16,17,18]: It is known that Mg2+ and Co2+ ions are characterized by similar values of tetrahedral site preference energy in the aluminate spinels, determining their competitive nature in relation to spinel formation [19,20].
As part of a comprehensive study of the Co–Mg–Al oxide system, binary stoichiometric Co–Mg catalysts were previously studied in a wide range of heat treatment temperatures in order to establish the effect of magnesia on their structure and activity in the methane combustion reaction [21]. The results obtained indicate the complex nature of the processes of formation of the structure and phase composition in the Co–Mg-system, which has thus far been inconsistently described in the literature [16,18,22,23,24,25]. Also, an increased methane combustion activity of Co–Mg samples with a non-stoichiometric composition has been shown [21]. For this reason, the issues of active phases formation in Co–Mg systems of various compositions, both stoichiometric (Co3O4 and MgCo2O4) and non-stoichiometric, at different temperature conditions, are of particular relevance. This work is devoted to these issues.

2. Results

2.1. Phase Composition and Structure of Samples

The phase composition and structure of the prepared samples were studied by X-ray diffraction (XRD), Fourier-transform infrared spectroscopy (FTIR), scanning electron microscopy (SEM), and electron spin resonance (ESR) methods.
The results of X-ray phase analysis of the synthesized samples are summarized depending on the composition and heat treatment temperature in Figure 1.
The diffraction patterns (Figure 1) show reflections characteristic of the spinel phases Co3O4 (PDF 42–1467) or MgCo2O4 (PDF 2–1073, 81–671) and the rocksalt MgO (PDF 45–946) and CoO (PDF 48–1719) or their solid solution [15,21,25].
All samples, regardless of the Co:Mg ratio, show reflections of spinel phases in the low-temperature range (calcination temperatures 400–800 °C). On Co3O4-based samples in this range no other phases are observed, while magnesia-containing samples, in addition to intense reflections of spinel phases MgCo2O4 or Co3O4, are characterized by the presence of reflections from the rocksalt (Co, Mg)O solid solution phase, the intensity of which gradually increases with the heat treatment temperature.
In the high-temperature range (above 800–900 °C, which corresponds to the thermal decomposition of the Co–Mg spinel) [21,26], reflections of the rocksalt solid solution are predominantly observed for the Co–Mg samples, while pure Co3O4 contains CoO and Co3O4 phases. This phenomenon, caused by the rapid reoxidation of surface CoO species during quenching after heat treatment [21,27], is especially evident in the case of pure Co3O4 and indicates that the reoxidation of pure CoO proceeds more easily than that of the (Co, Mg)O solid solution.
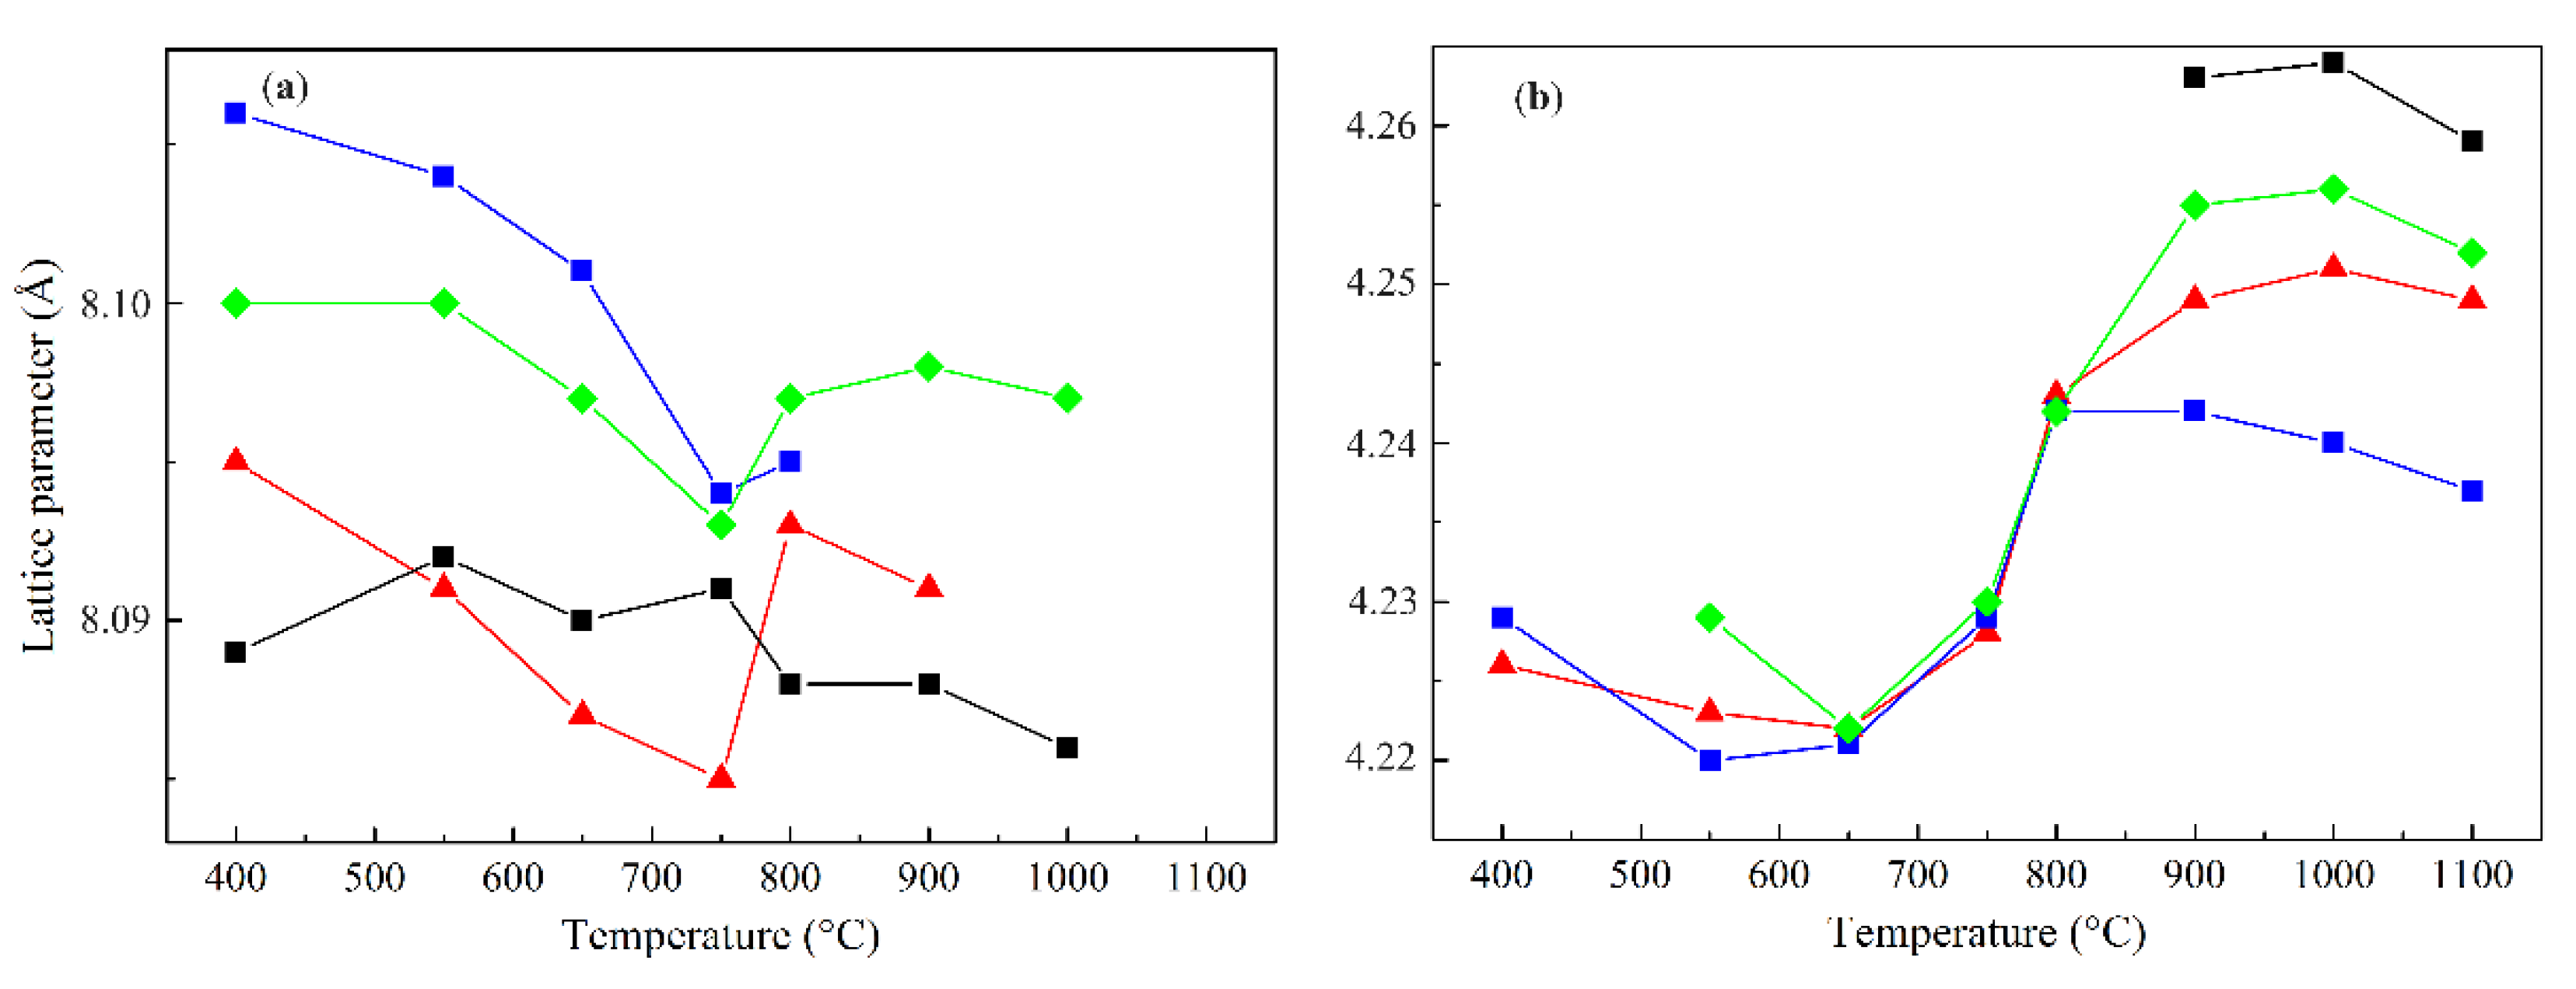
The averaged lattice parameter values of the spinel and rocksalt phases, calculated from the corresponding diffraction maxima, are presented in the Table 1 and in the Figure 2.
The temperature dependence of the lattice parameters of the spinel and rocksalt phases for different Co:Mg ratios is similar. For instance, the lattice parameter of Co3O4 in the low-temperature region is approximately constant and slightly higher than the theoretical value of 8.084 Å, probably due to the presence of defects and superstoichiometric oxygen in the lattice [28,29]. As the calcination temperature increases further, this value decreases and tends to the theoretical value.
In the case of Co–Mg spinels of various composition, in the low-temperature region, the lattice parameter value also gradually decreases with increasing heat treatment temperature, but at 750–800 °C it increases sharply and, if the spinel phase continues to be observed at higher temperatures, remains approximately constant (Figure 2). Stoichiometric cobalt-magnesia spinel (Co2Mg1) is characterized by a wide spread of lattice parameter values [21,22,23,30,31], presumably due to different degrees of spinel inversion, depending on the preparation method. Our data for the low-temperature Co2Mg1 samples give an average value of 8.089 Å [21], meaning a low degree of spinel inversion obtained by the nitrate salts decomposition. At the same time, non-stoichiometric Co1Mg1 and Co4Mg1 samples are characterized by higher lattice parameter values (8.100 and 8.097 Å, respectively), maintaining the qualitative trend of their variation on the calcination temperature. Presumably, this is explained by their non-stoichiometry, which leads to an increased lattice volume, as well as, probably, by partial inversion of the spinel phases.
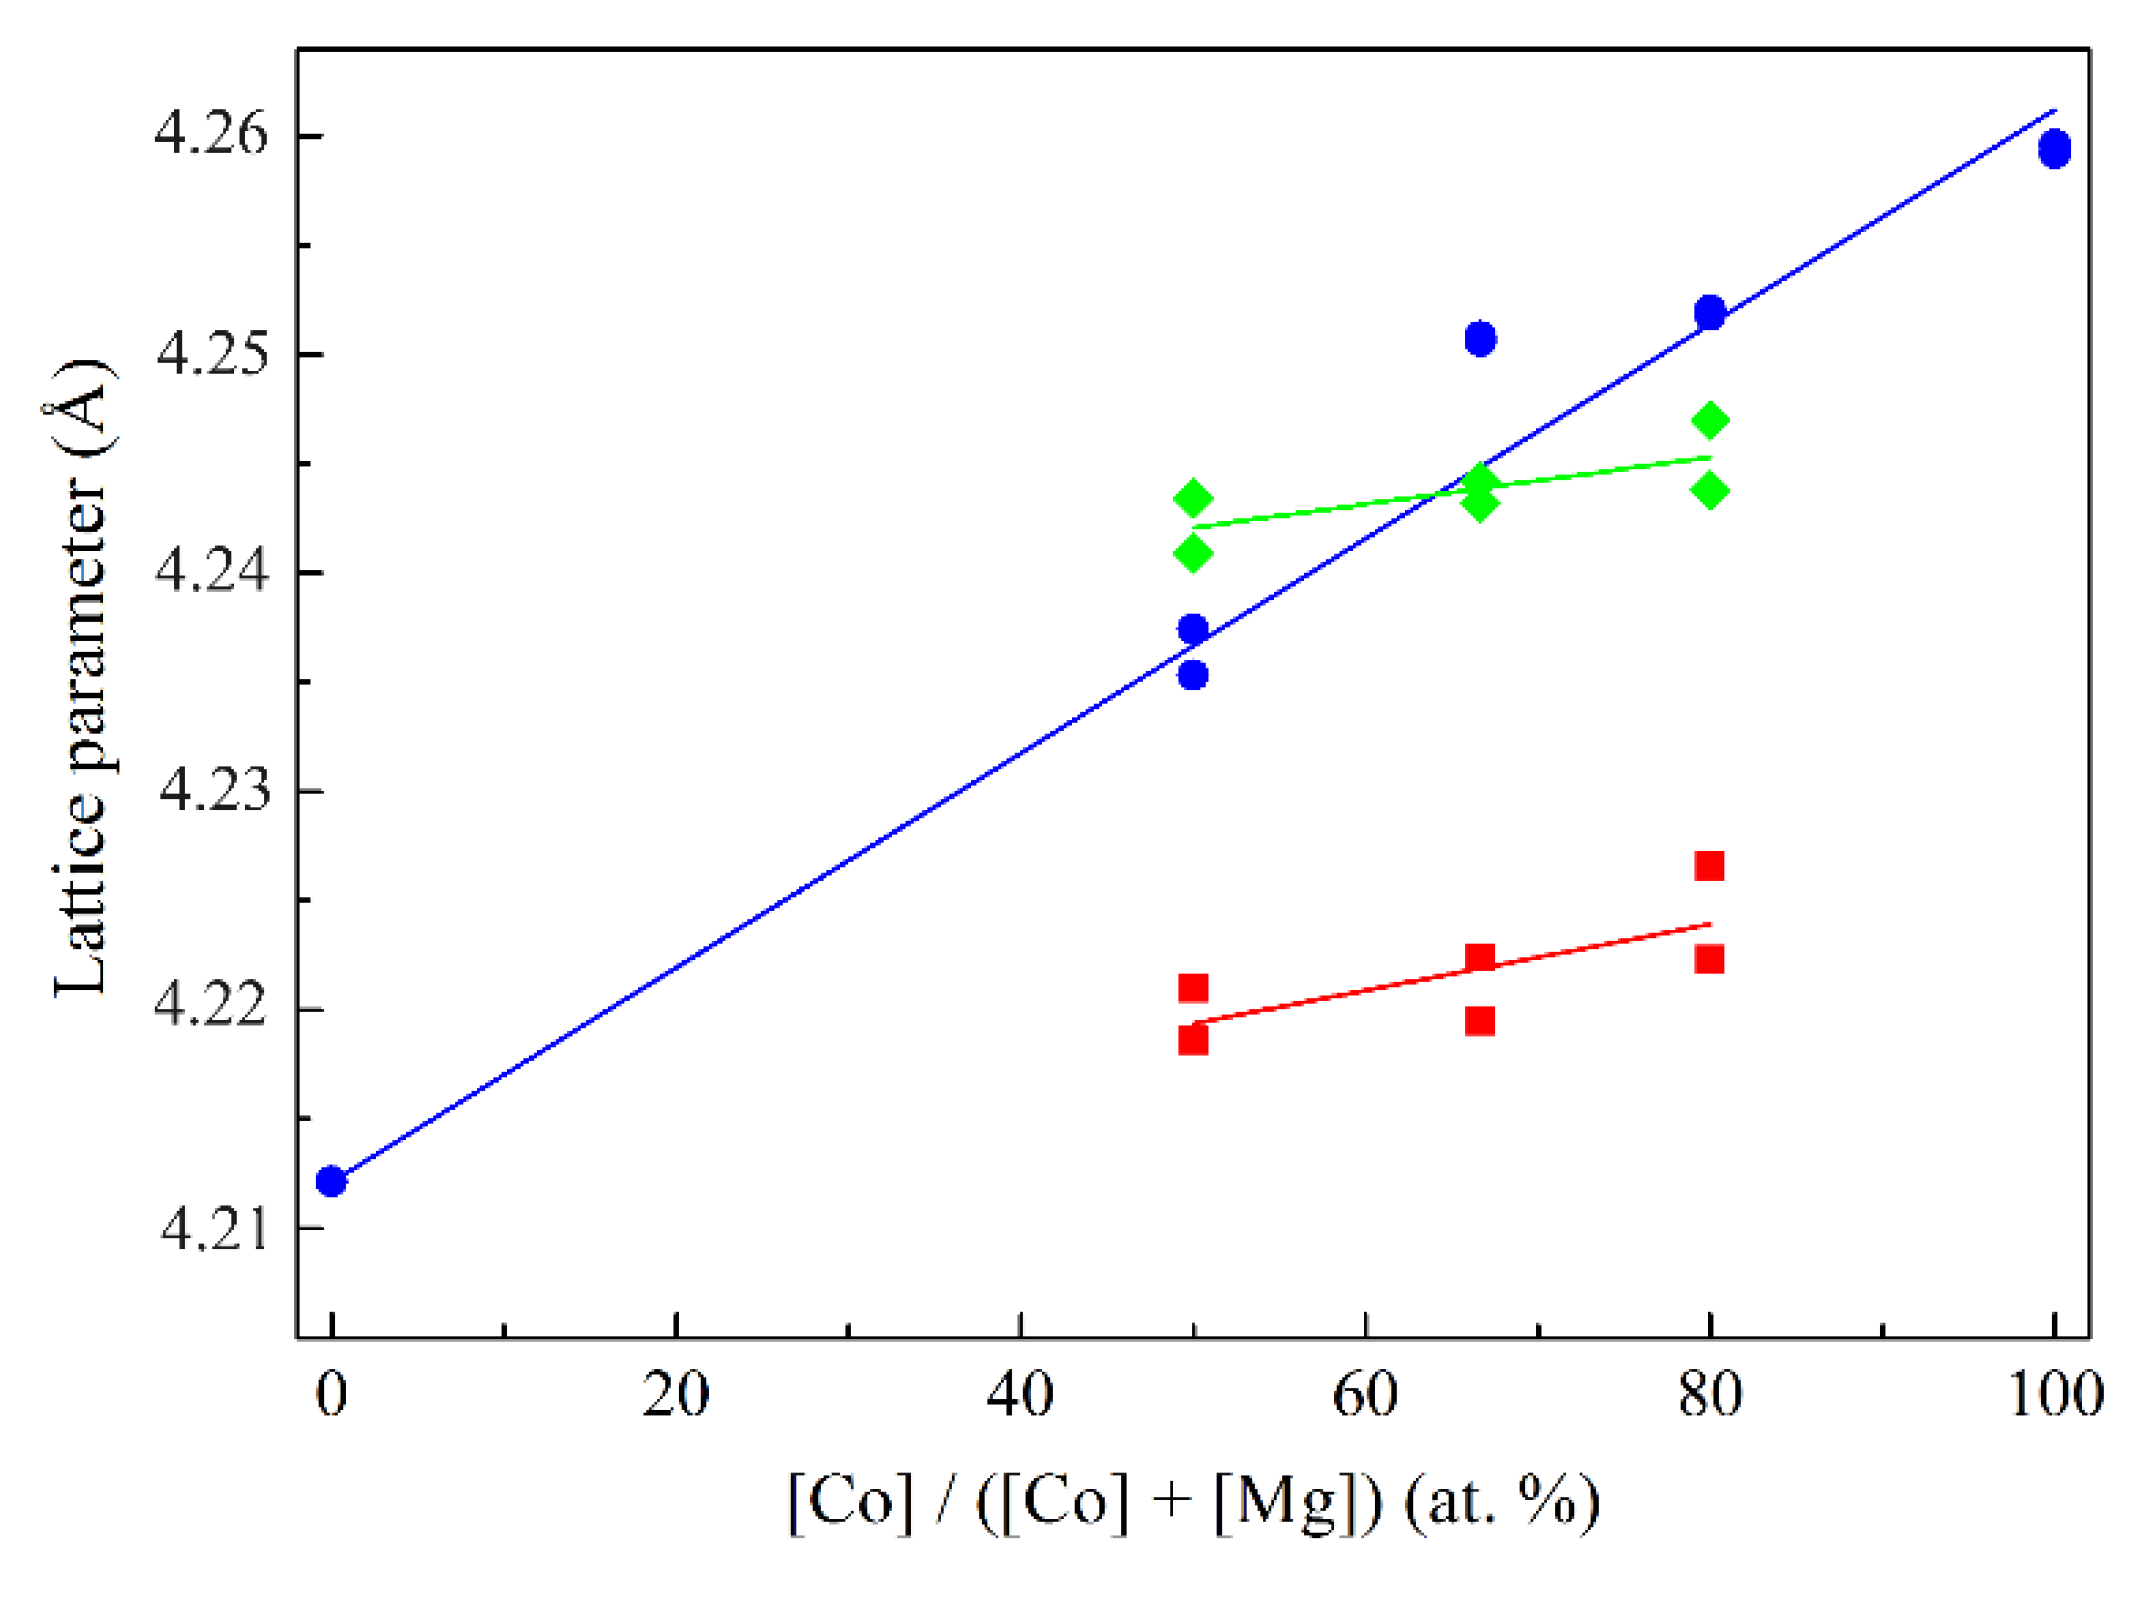
The lattice parameter values of the rocksalt phase in the low-temperature range depend little on the composition and are equal to 4.225 ± 0.005 Å. As the heat treatment temperature further increases, this value increases sharply and at 900 °C diverges for different compositions, increasing linearly with increasing cobalt content. The dependence of the lattice parameter on composition for selected calcination temperatures is shown in Figure 3.
As is known, the lattice parameter values of Co–Mg solid solution obey Vegard’s law [32,33,34]. Here, for high calcination temperatures this dependence is approximately true. The proximity of the lattice parameter values of the samples of different compositions at low temperatures is probably explained by the fact that under these conditions the rocksalt phase is predominantly comprised of magnesia, which is saturated with Co2+ only during the thermal decomposition of the spinel, forming a solid solution with a composition corresponding to the initial cobalt loading. The higher value of the lattice parameter of low-temperature MgO relative to the theoretical value (4.2112 Å) is confirmed in [35] and is explained by the paracrystalline structure of anion-modified low-temperature oxide systems [36]; this phenomenon can also be explained by the presence of microstresses and strain in the structure [28,29]. The characteristic decrease of the lattice parameter values of both the spinel phase in the 400–750 °C range and the rocksalt phase formed during spinel thermal decomposition in the 900–1100 °C range is presumably explained by the stress relaxation together with decomposition of anionic residues in the phase structure.
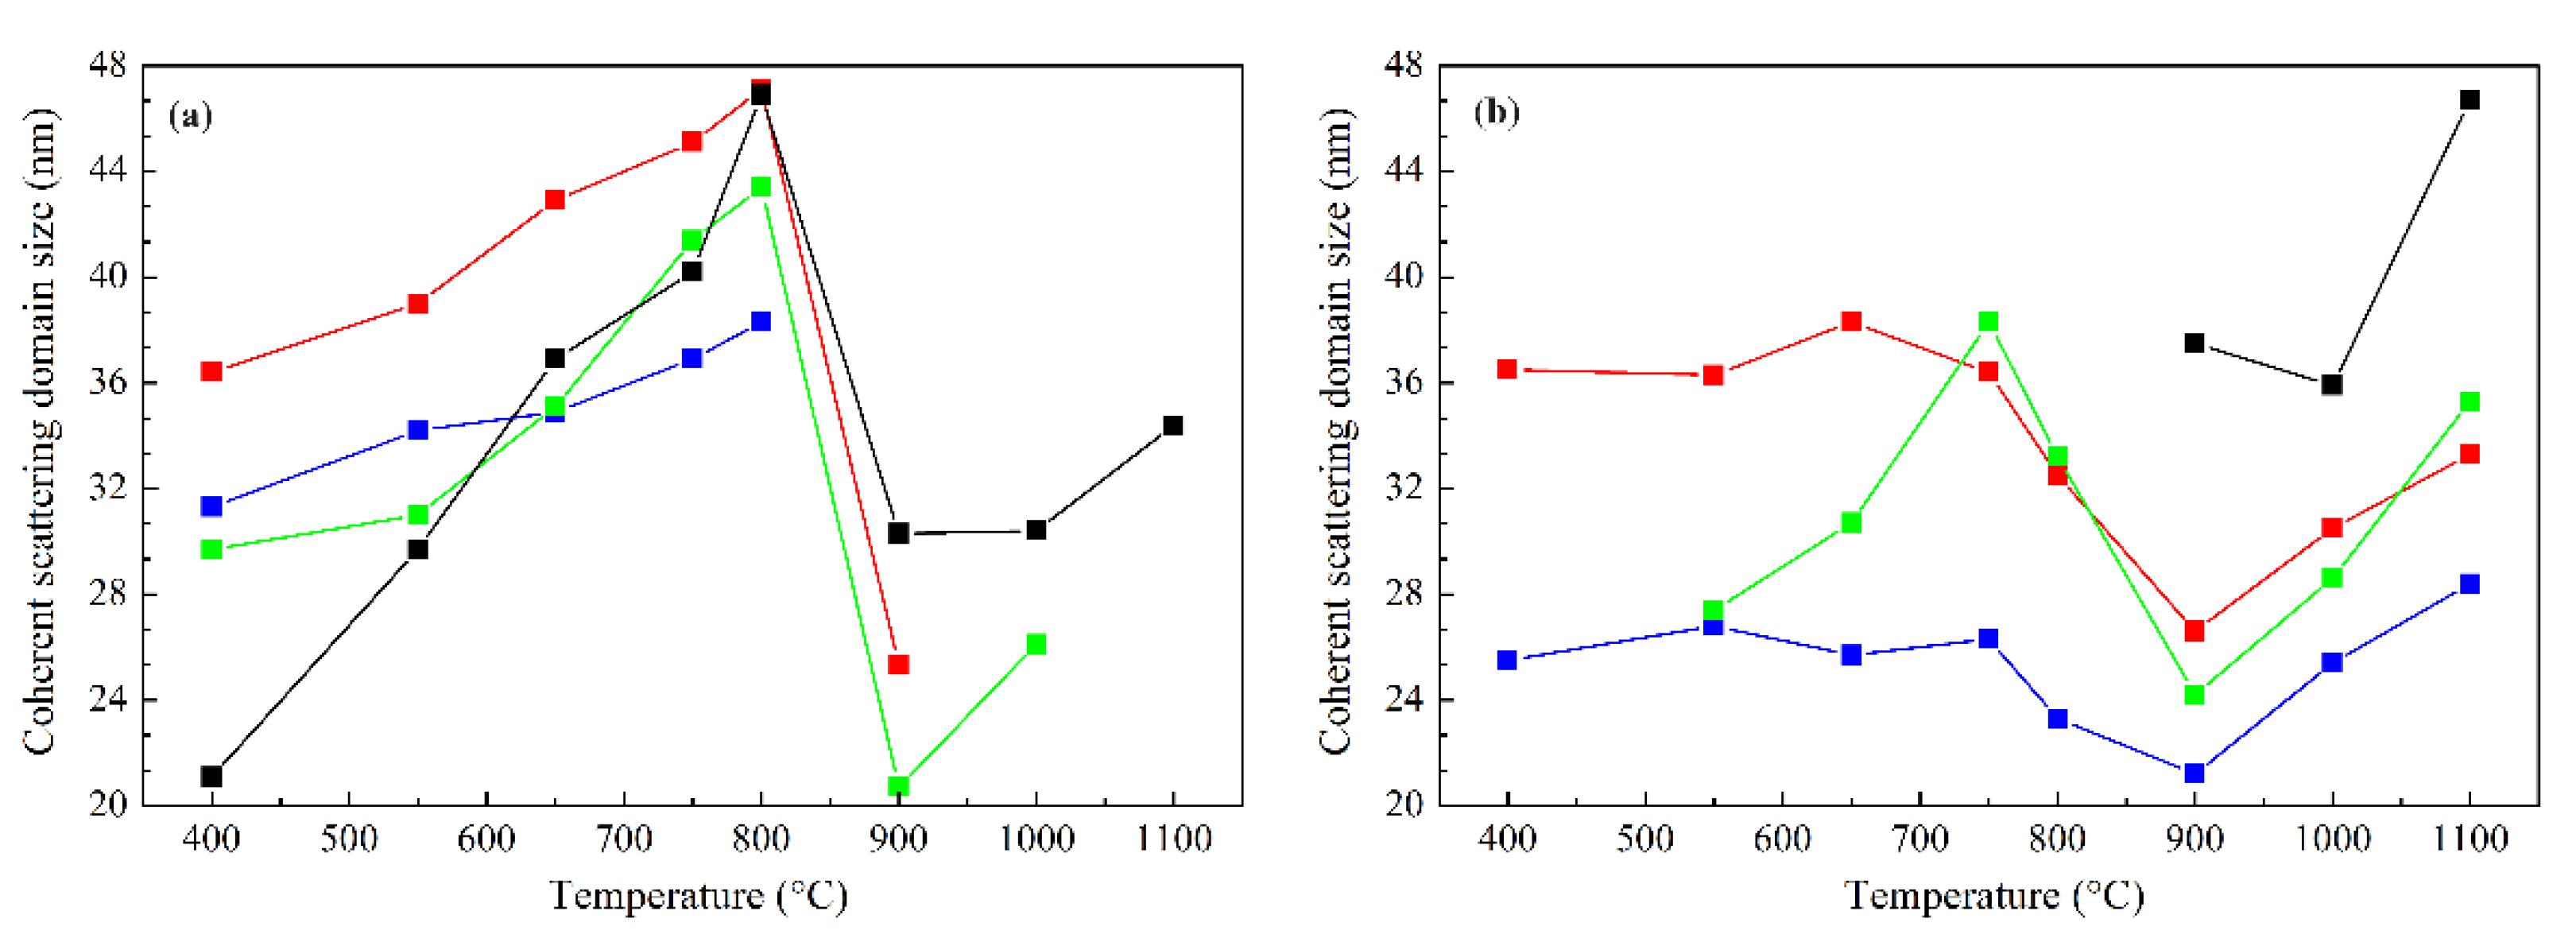
In order to determine the influence of the Co:Mg ratio and heat treatment temperature on the crystallite sizes of the phases under study, the average values of the coherent scattering domains (c.s.d.) were calculated from the X-ray diffraction data, presented in Figure 4.
The calculations show that, in the case of crystallites of the spinel phase at low calcination temperatures, a gradual particles enlargement is observed, associated with an increase in their crystallinity, while at 900 °C the particle sizes of spinel crystallites sharply decrease due to the formation of a solid solution from spinel, with the small size of the spinel phase at higher temperatures referring to surface species reoxidized during quenching. Rocksalt phase particles retain approximately constant size values up to the decomposition temperature, where they also decrease, presumably due to a change in the composition of the rocksalt phase of the solid solution, and at higher temperatures particle growth occurs due to their sintering.
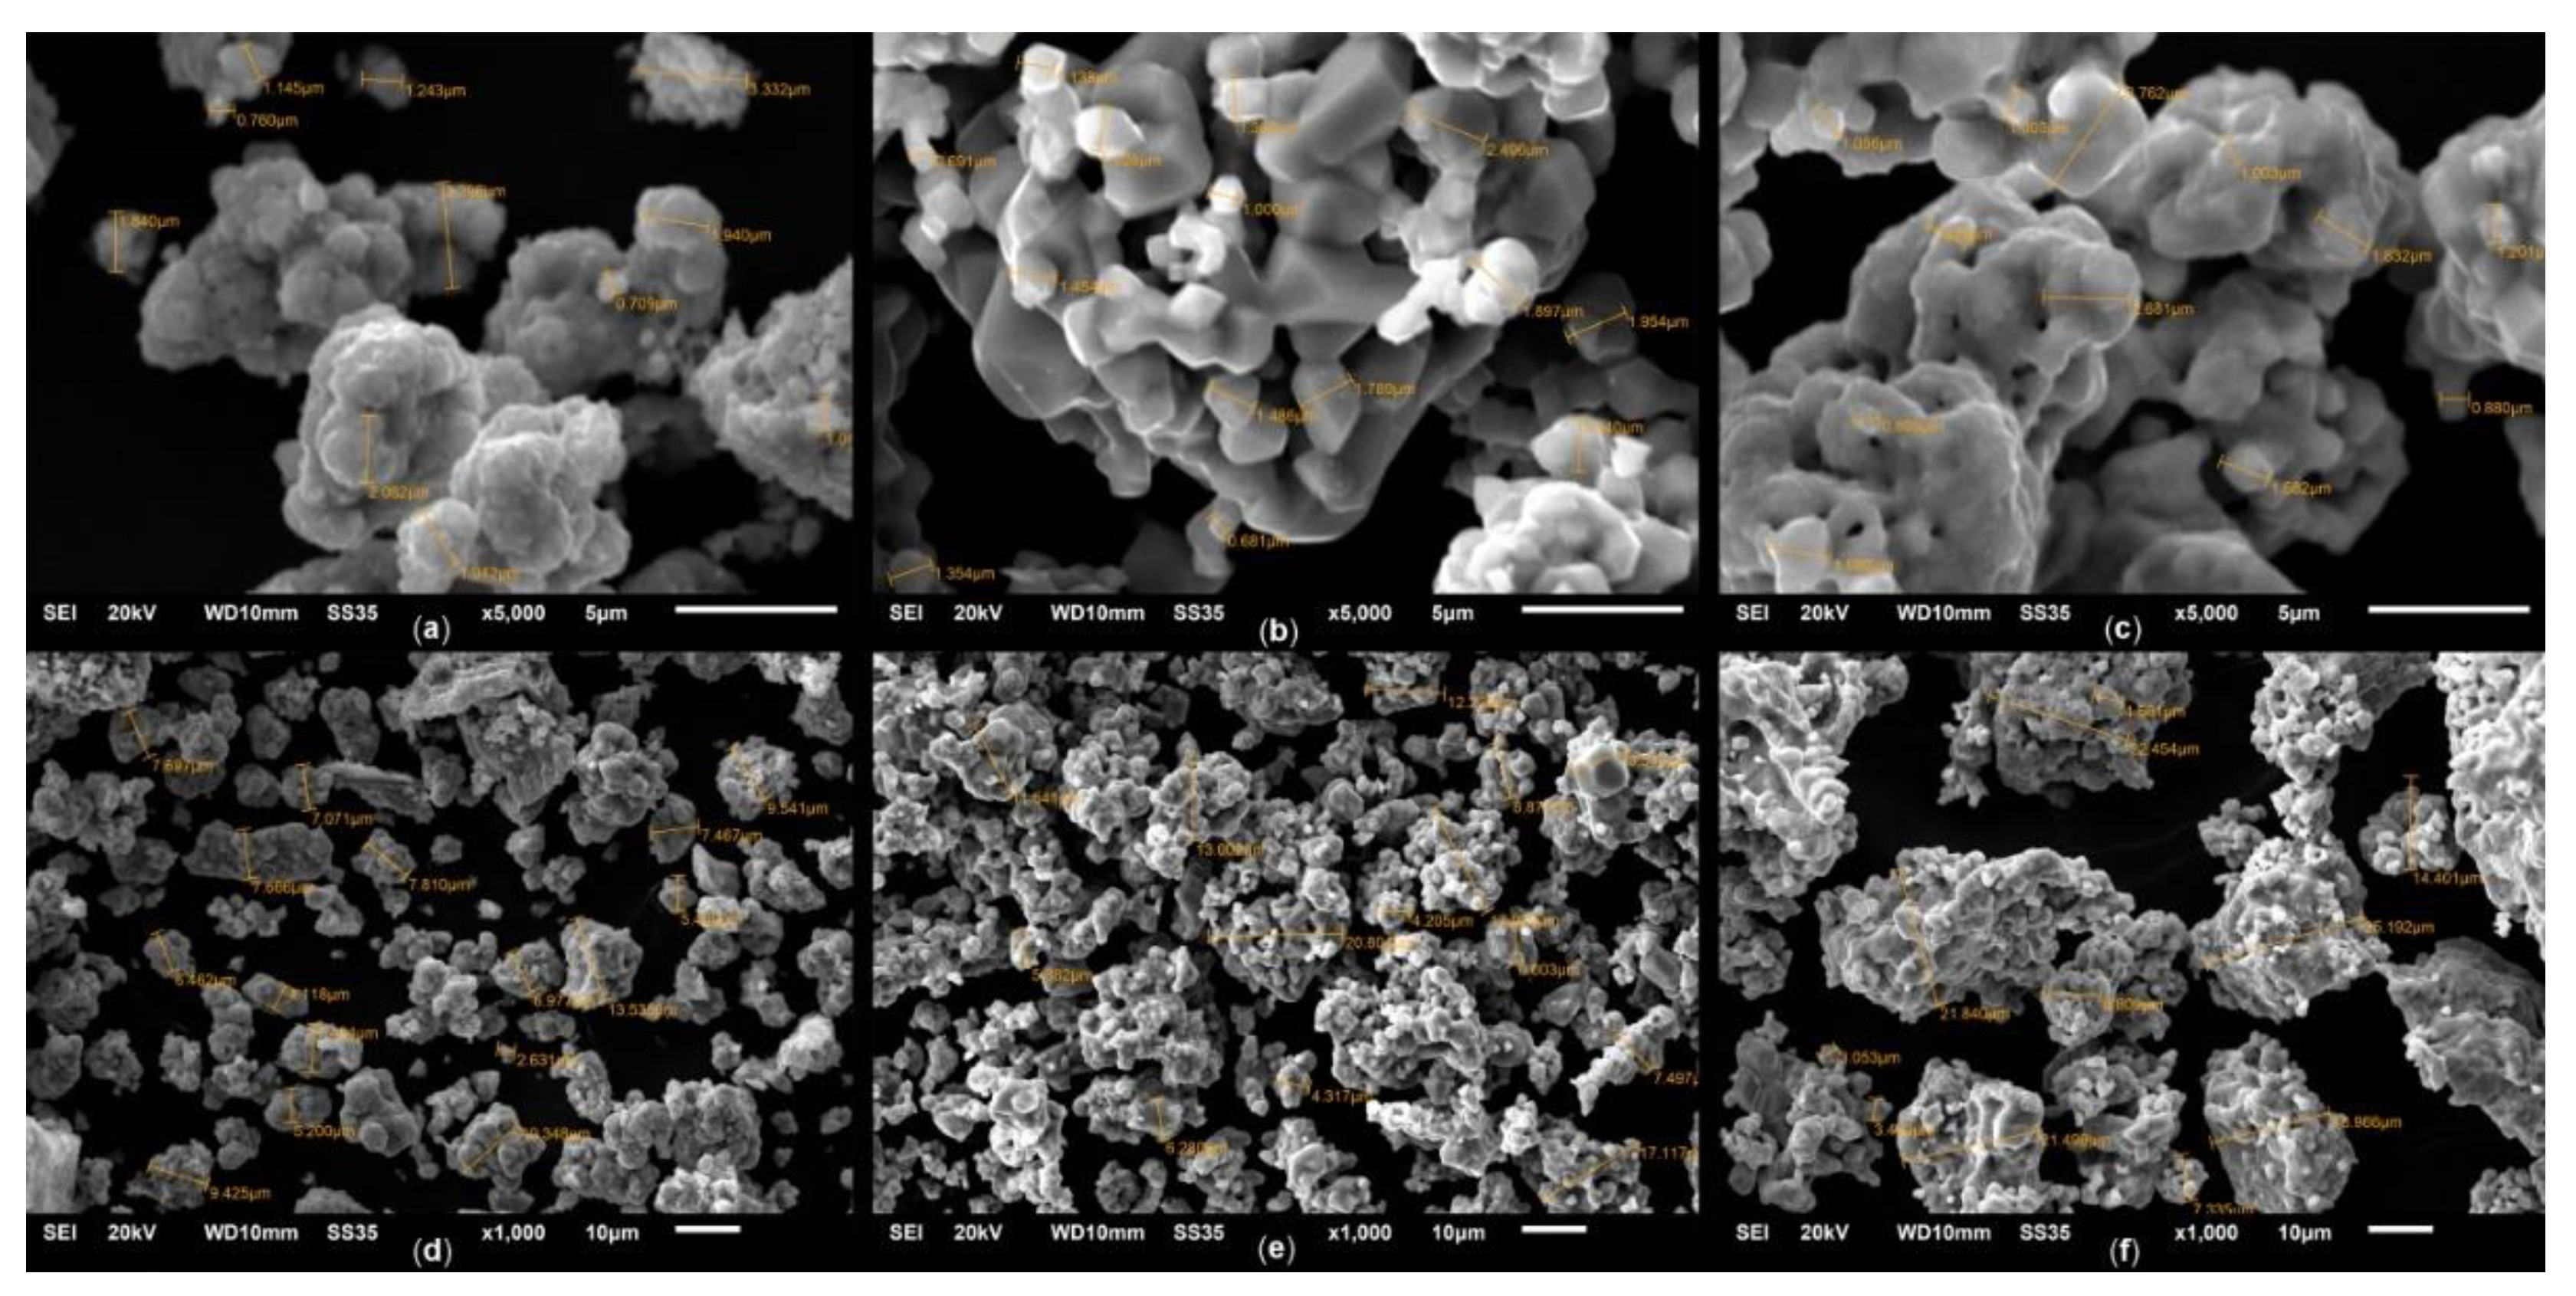
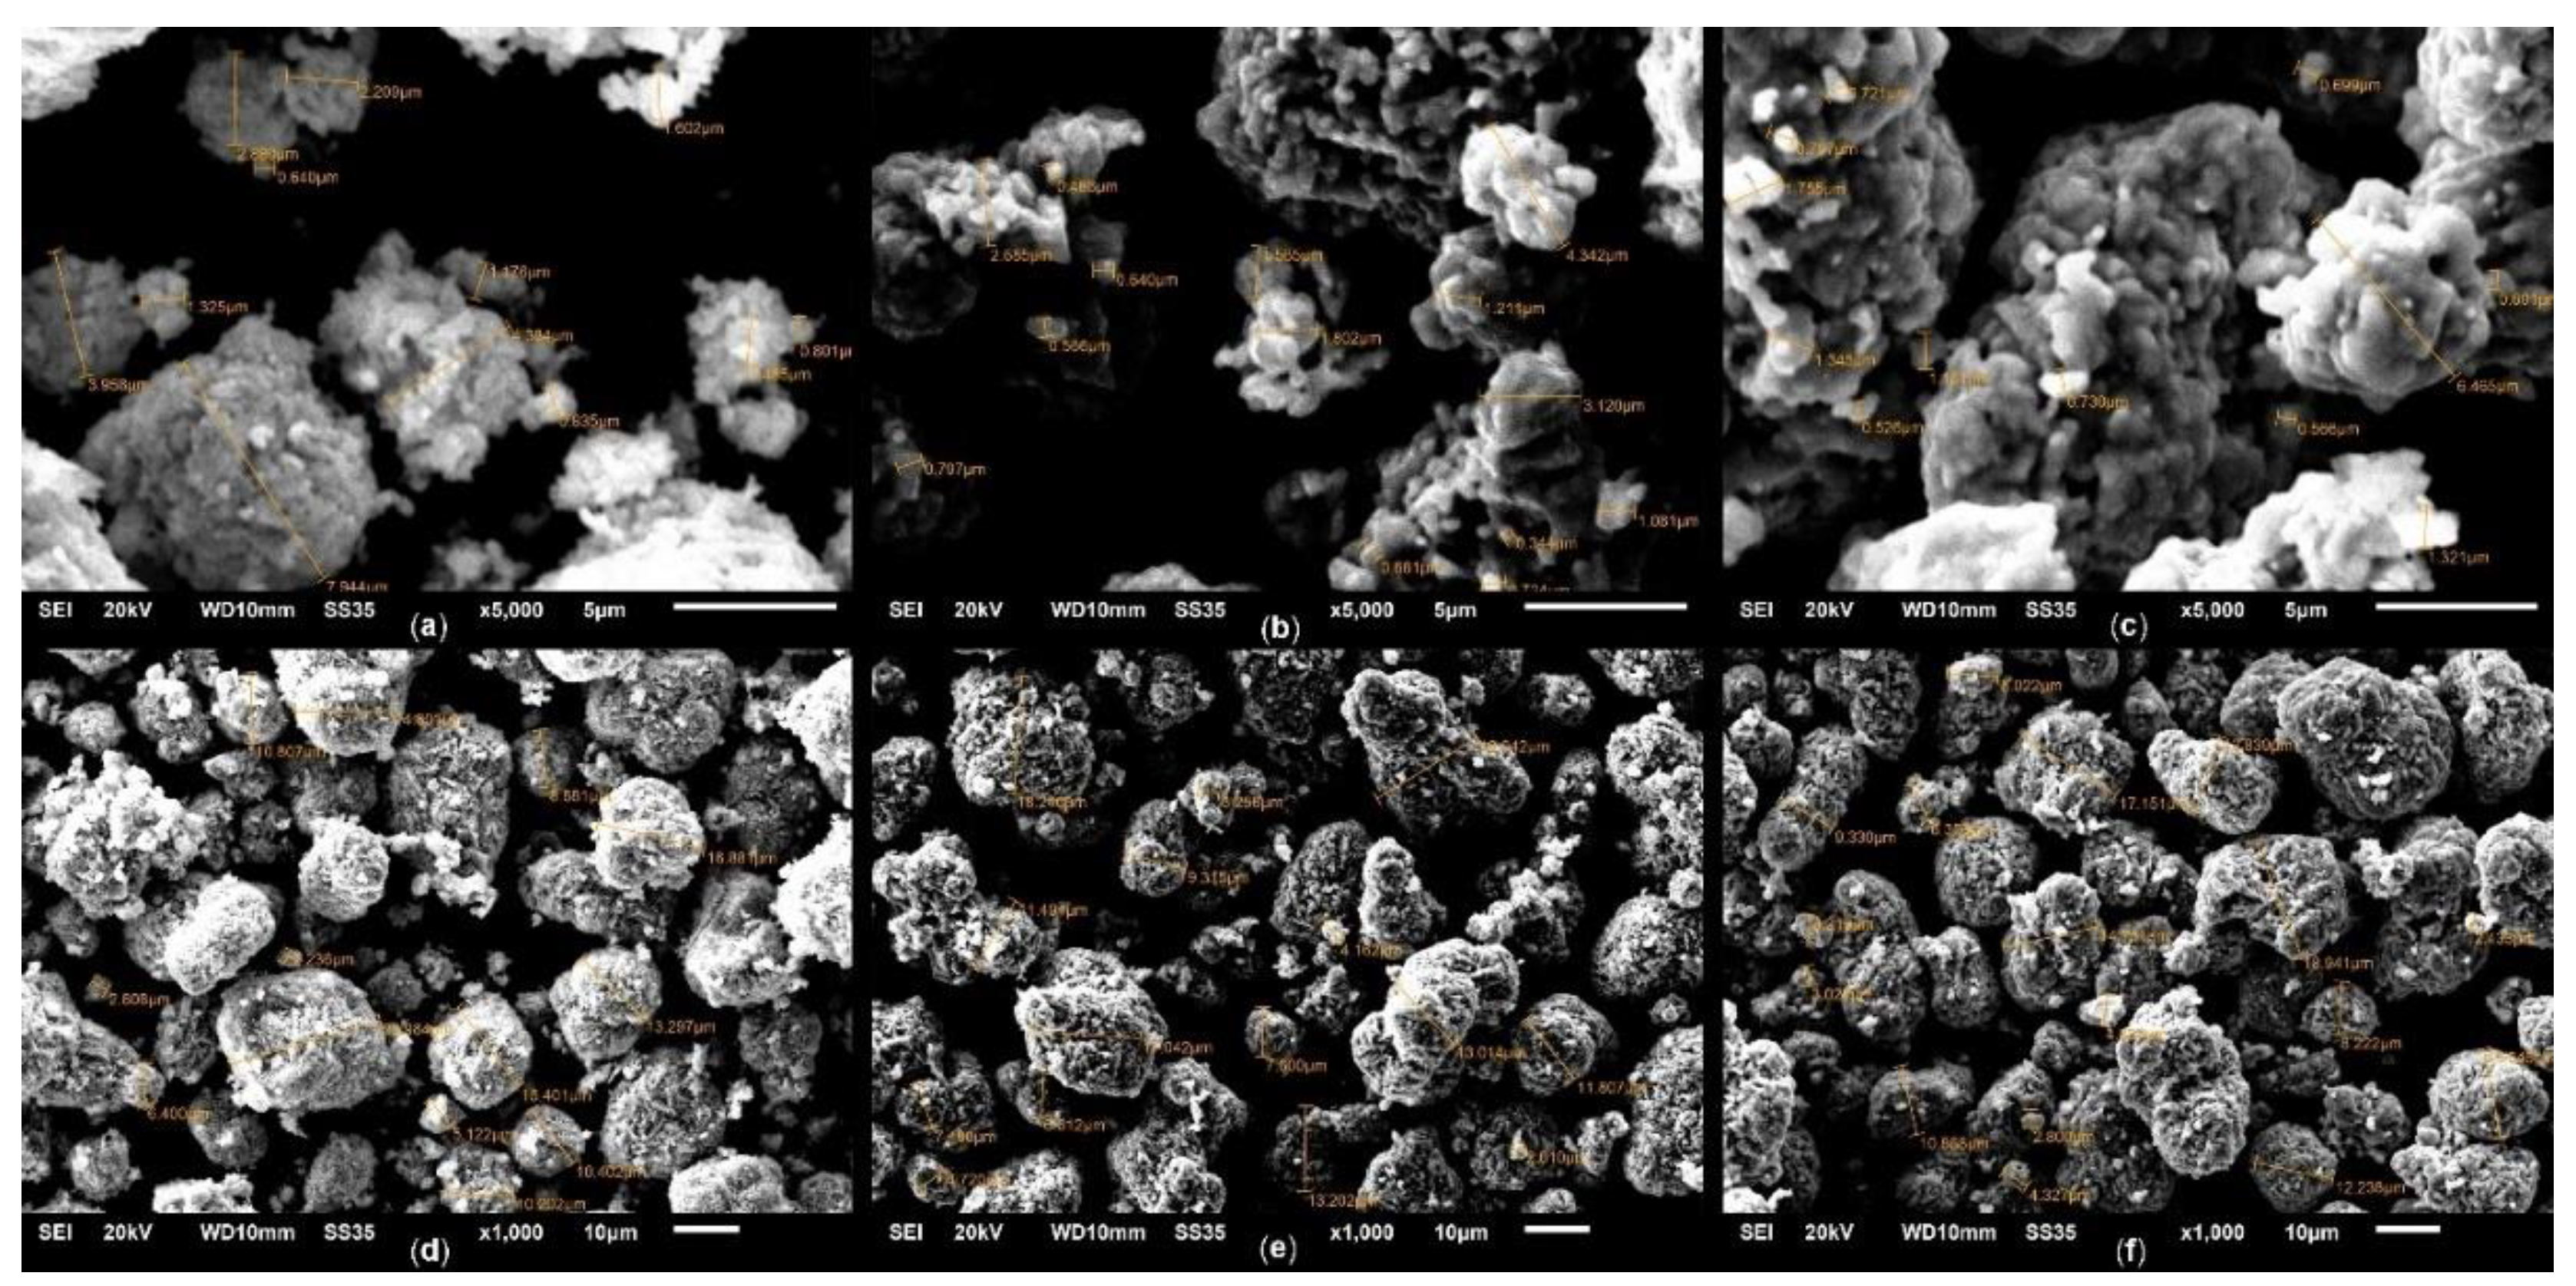
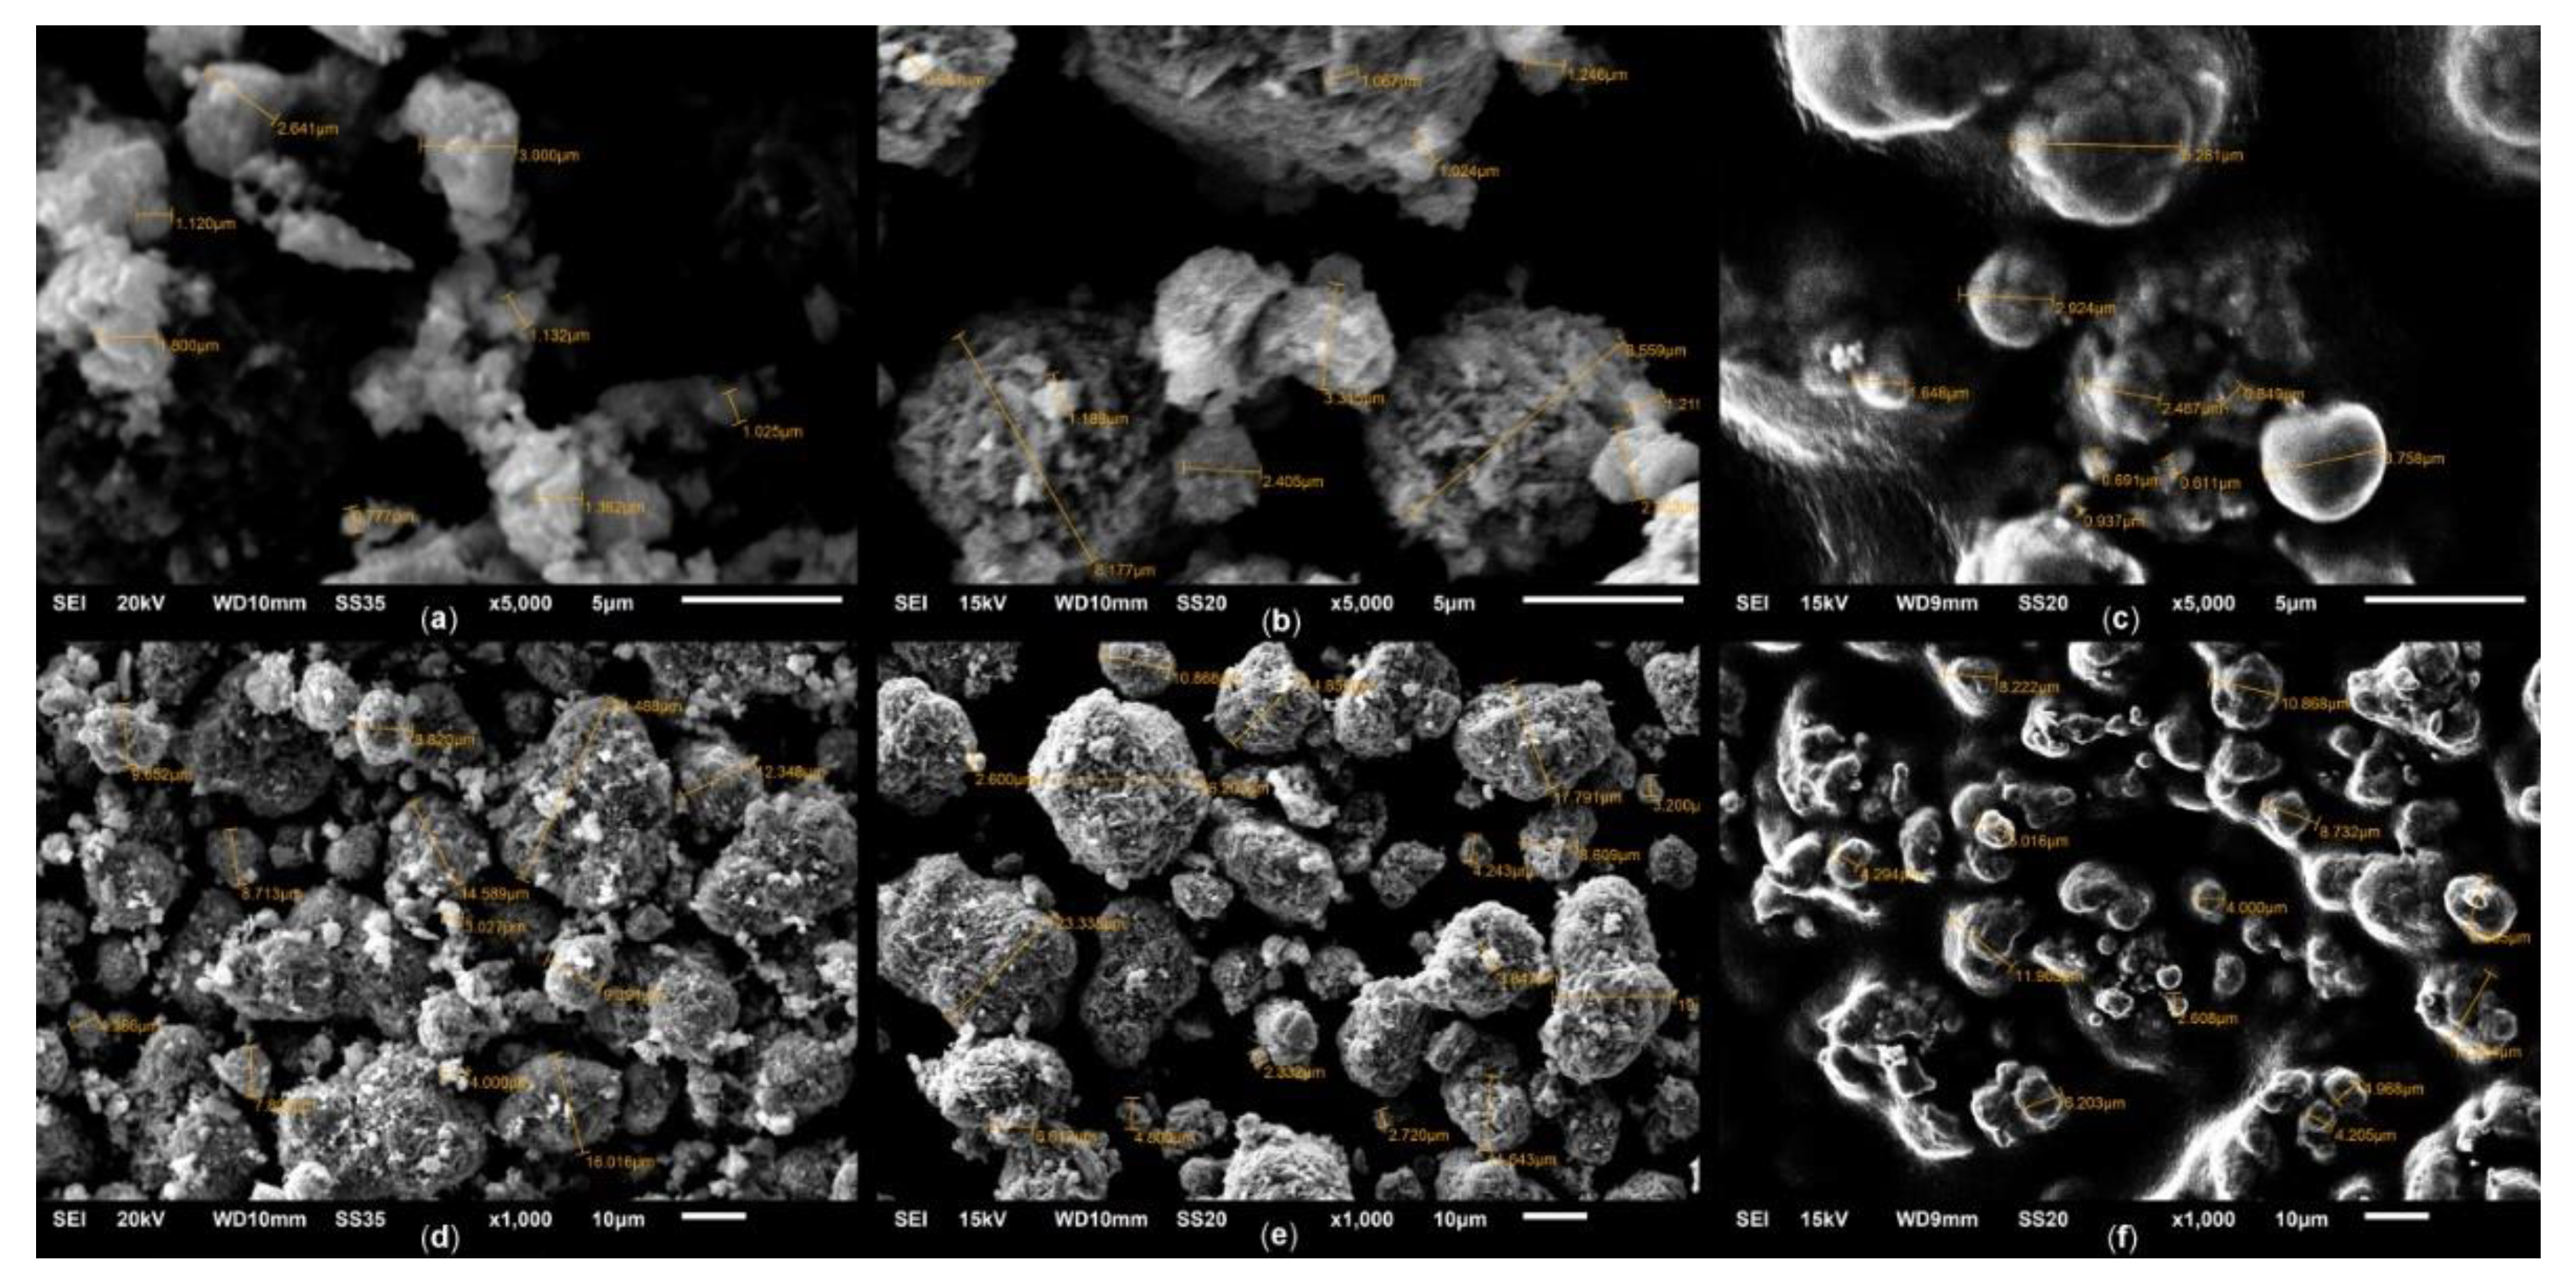
The sizes and morphology of the sample particles were also studied by scanning electron microscopy. Typical micrographs of spinel and solid solution are shown in Figure 5 and 6.
According to SEM data, the initial spinel phase (Figure 5 (a), (d)) is comprised of poorly crystallized irregular plate-type particles with sizes of 0.7–2.0 μm, connected into aggregates with sizes up to 10–15 μm. The rocksalt solid solution formed during heat treatment is comprised of faceted octahedral crystallites with sizes ranging from 0.5 μm, which are also prone to aggregation into structures up to 20 μm in size (Figure 5 (b), (e)). This is consistent with previously obtained data on the structure of particles in the Co2Mg1 system [21]. Reoxidation of the solid solution has little effect on the size of the crystallites, but reduces their crystallization, making the latter more similar to spinel particles (Figure 5 (c), (f)).
It is significant that, in contrast to Co–Mg samples, in the case of Co3O4, secondary aggregates of spinel and rocksalt phases are formed by particles of much smaller sizes (Figure 6 (a), (d)), presumably due to the absence of magnesia. As Co3O4 transforms into CoO, the secondary aggregates' sizes do not change, although the primary particles become larger and more faceted, but do not reach the sizes characteristic of Co–Mg samples (Figure 6 (b), (e)).
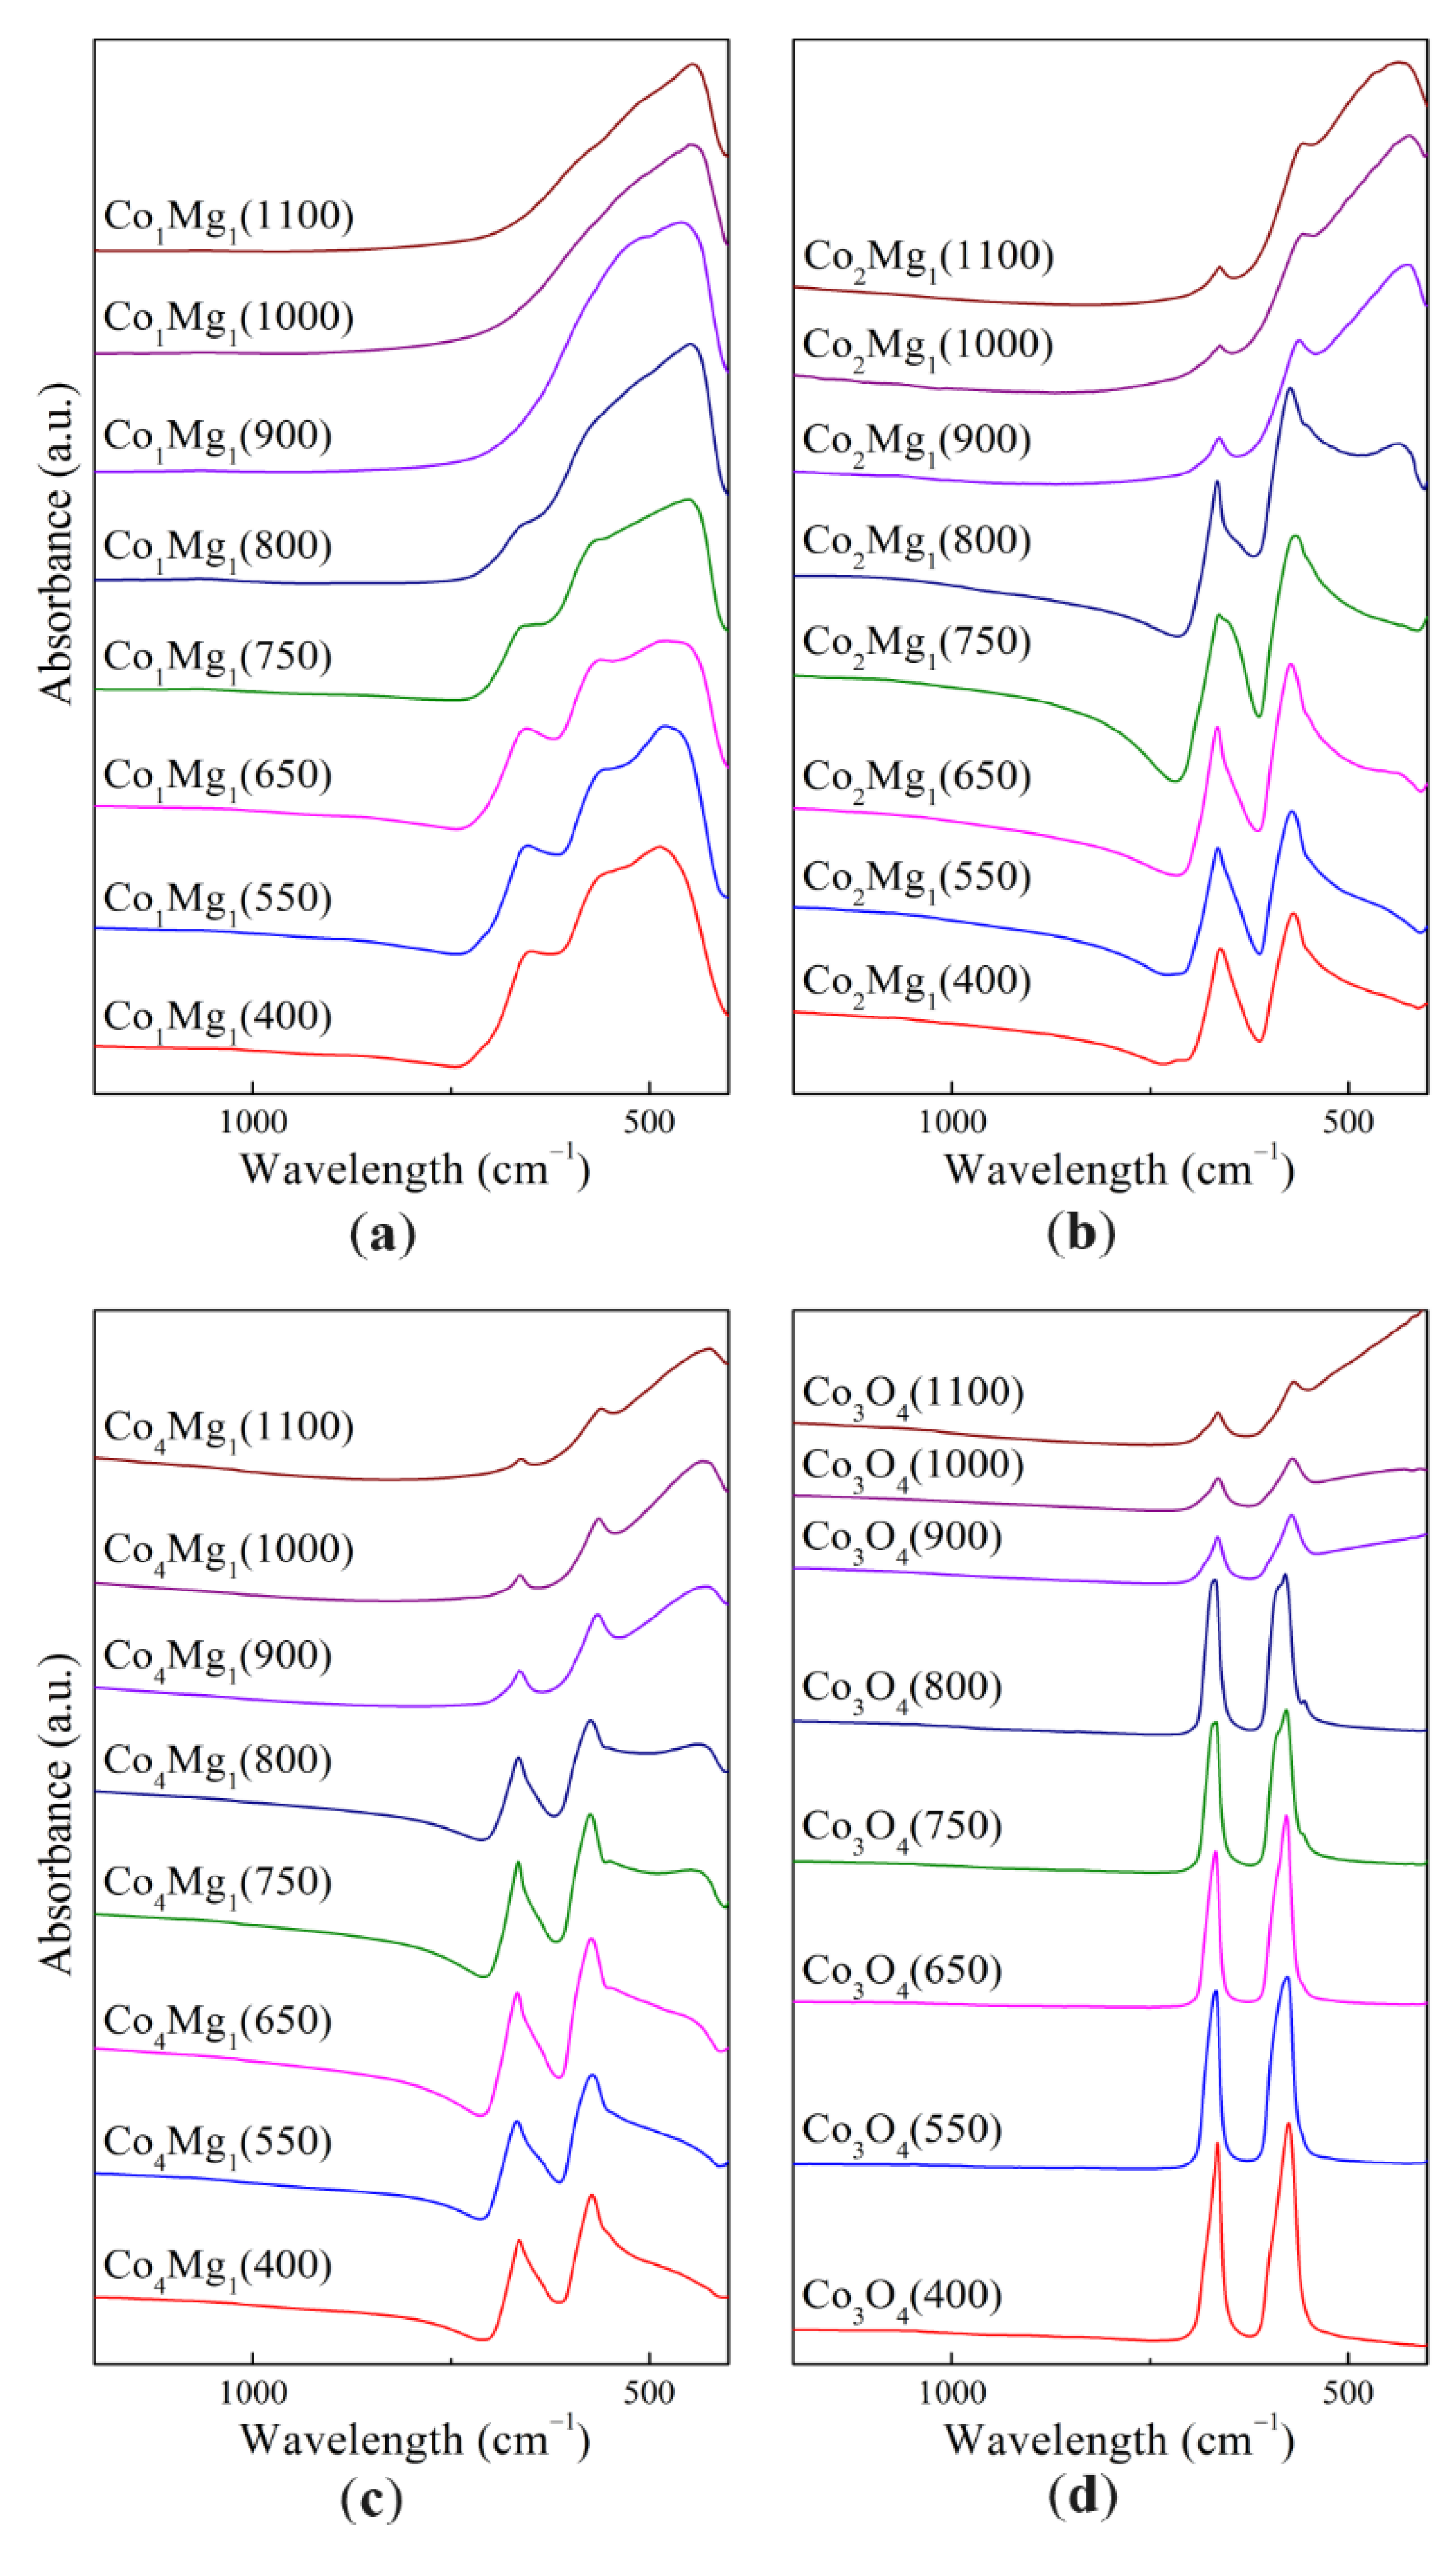
The results of the study of the samples' structure using Fourier-transform infrared spectroscopy (FTIR) are presented in the Figure 7 and in the Table 2.
In the case of pure Co3O4 (Figure 7), in the range corresponding to the Me–O stretching vibrations, two intense absorption bands (a.b.) are observed at 665 and 575 cm–1. These bands (ν1 and ν2 Me–O, respectively) are commonly associated with vibrations of bonds between cations in octahedral sites (O–B3) in the case of ν1, and with vibrations of bonds between cations in tetrahedral and octahedral sites (A–B–O3) in the case of ν2 [37,38]. As shown in [39], the IR spectrum of the AB2O4 cubic spinel is characterized by four a.b. (ν1, ν2, ν3, ν4), where ν3 and ν4 are typically in the far range of the spectrum. For the spinel Co3O4, the a.b. values of 672, 590, 392 and 220 cm–1 are given, further confirmed by similar values of 667, 580 and 385 cm–1 in [27,37].
As the heat treatment temperature increased, splitting of the ν2 band at 575 cm–1 was observed, with formation of a shoulder 555–557 cm–1 that at higher temperatures becomes an individual band, and another shoulder at 587–589 cm–1. As is known, generally the IR spectrum consists of longitudinal and transverse bands (LO and TO respectively). In the case of thin films, the spectrum consists predominantly of TO a.b., while for powders with a given particle size distribution, LO a.b. are more pronounced, with the LO/TO intensity ratio decreasing as the mean particle size increases [40]. In this regard, the appearance of shoulders at 575 cm–1 with increasing calcination temperature is explained by the sintering of Co3O4 particles. Preservation of spinel a.b. at heat treatment temperatures of 900 °C and higher is associated with CoO reoxidation during quenching [27]; in this case, a shift of a.b. positions is observed to 664 and 568–571 cm–1.
There is a distinct lack of IR studies of the CoO phase and its characteristic a.b., with the exception of [37], which gives a value of 507 cm–1 not confirmed by our data. Due to large CoO absorption in the IR range, the majority of known IR spectra of CoO were recorded not by transmission, but rather by reflection. According to [41,42], the main CoO a.b. is observed in the far region of the spectrum (a.b. at 375 cm–1). Our data show a shoulder of a broad peak with a rise from approx. 610 cm–1, qualitatively confirming the literature data.
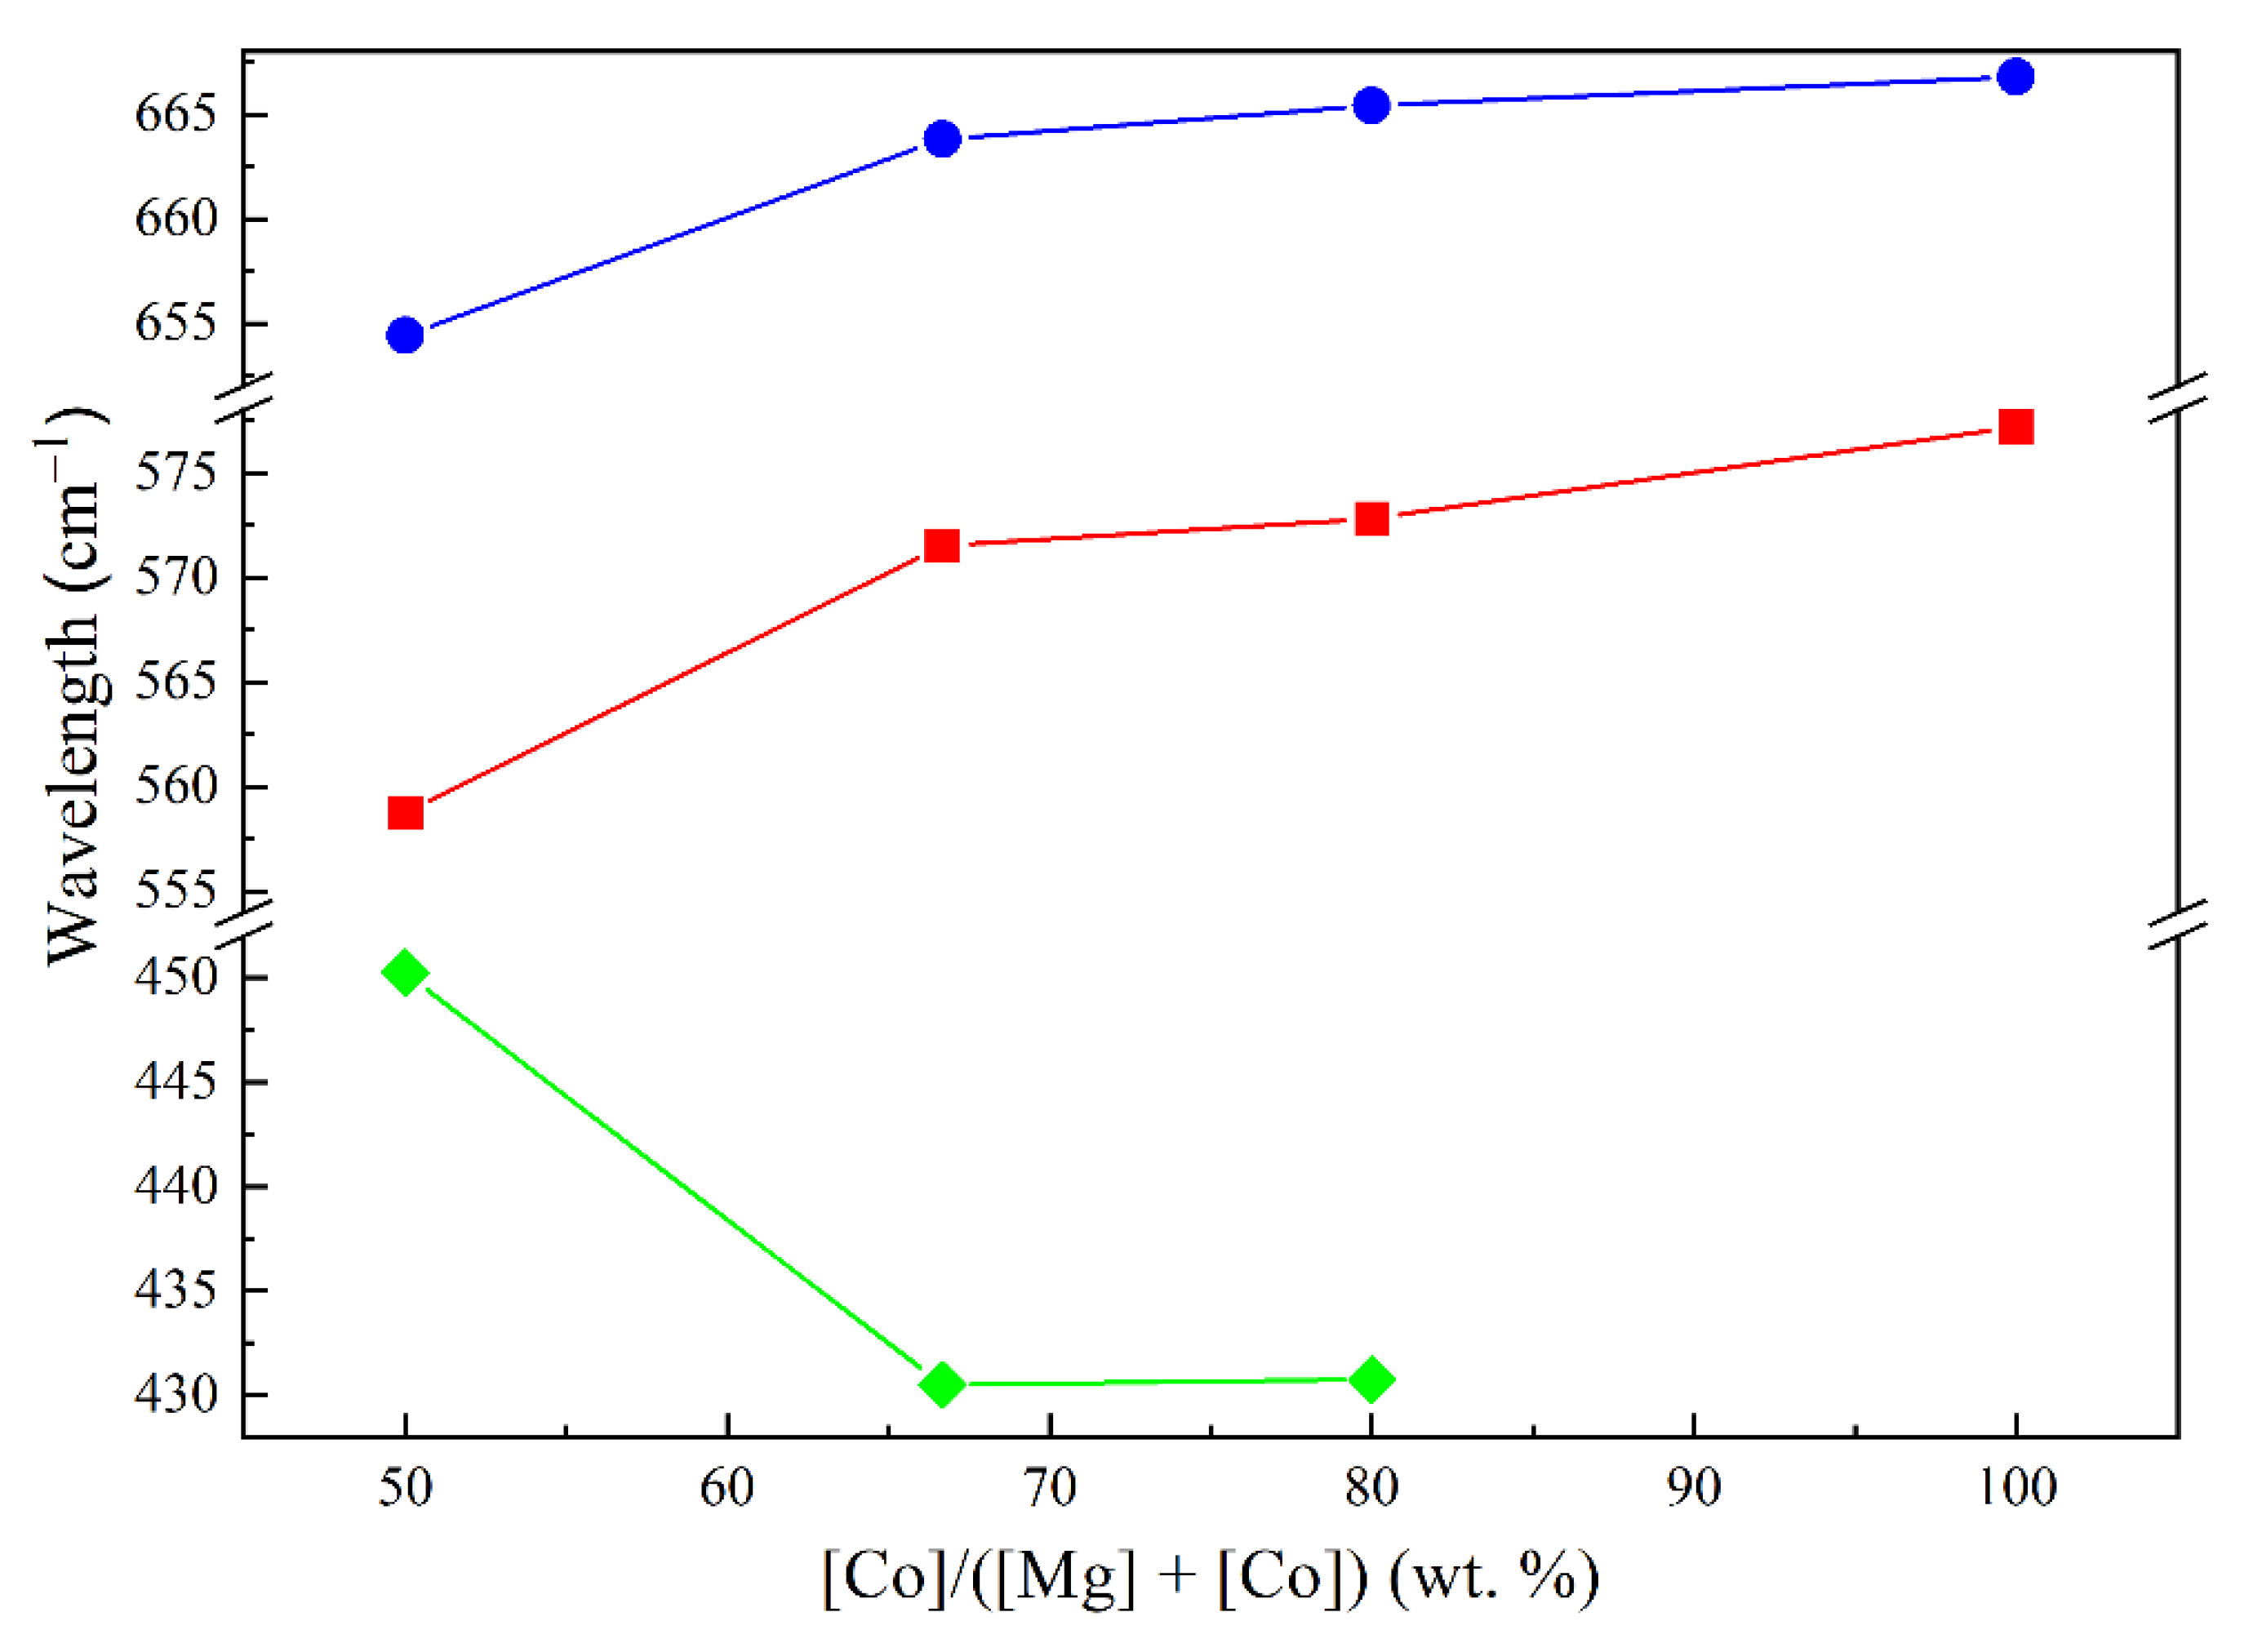
The IR spectra of Co–Mg samples show similar spinel a.b. (Figure 7). Changes in characteristic a.b. positions are presented in Figure 8.
An increase in the magnesia content significantly changes the shape of the IR spectrum: the spinel a.b. 660–670 and 560–575 cm–1 broaden, while a wide a.b. at 420–430 cm–1 appears due to stretching vibrations of the Me–O bond in the MgO or (Co, Mg)O solid solution phase [21]. As the magnesia content increases, this a.b. shifts from to 445–460 cm–1. Spinel a.b. also shift with increase of magnesia content: in the range of Co:Mg ratios from 2:1 and higher, corresponding to the Co3O4–MgCo2O4 system, this change occurs to a smaller extent, while excess MgO leads to a more significant a.b. shift. Similarly, in the case of samples calcined at 900–1100 °C, in the range of Co:Mg from 2:1 and higher, the position of the Me–O a.b. corresponding to the solid solution formed during spinel thermal decomposition remains virtually unchanged, but a further increase of magnesia content leads to a strong shift to shorter wavelength values.
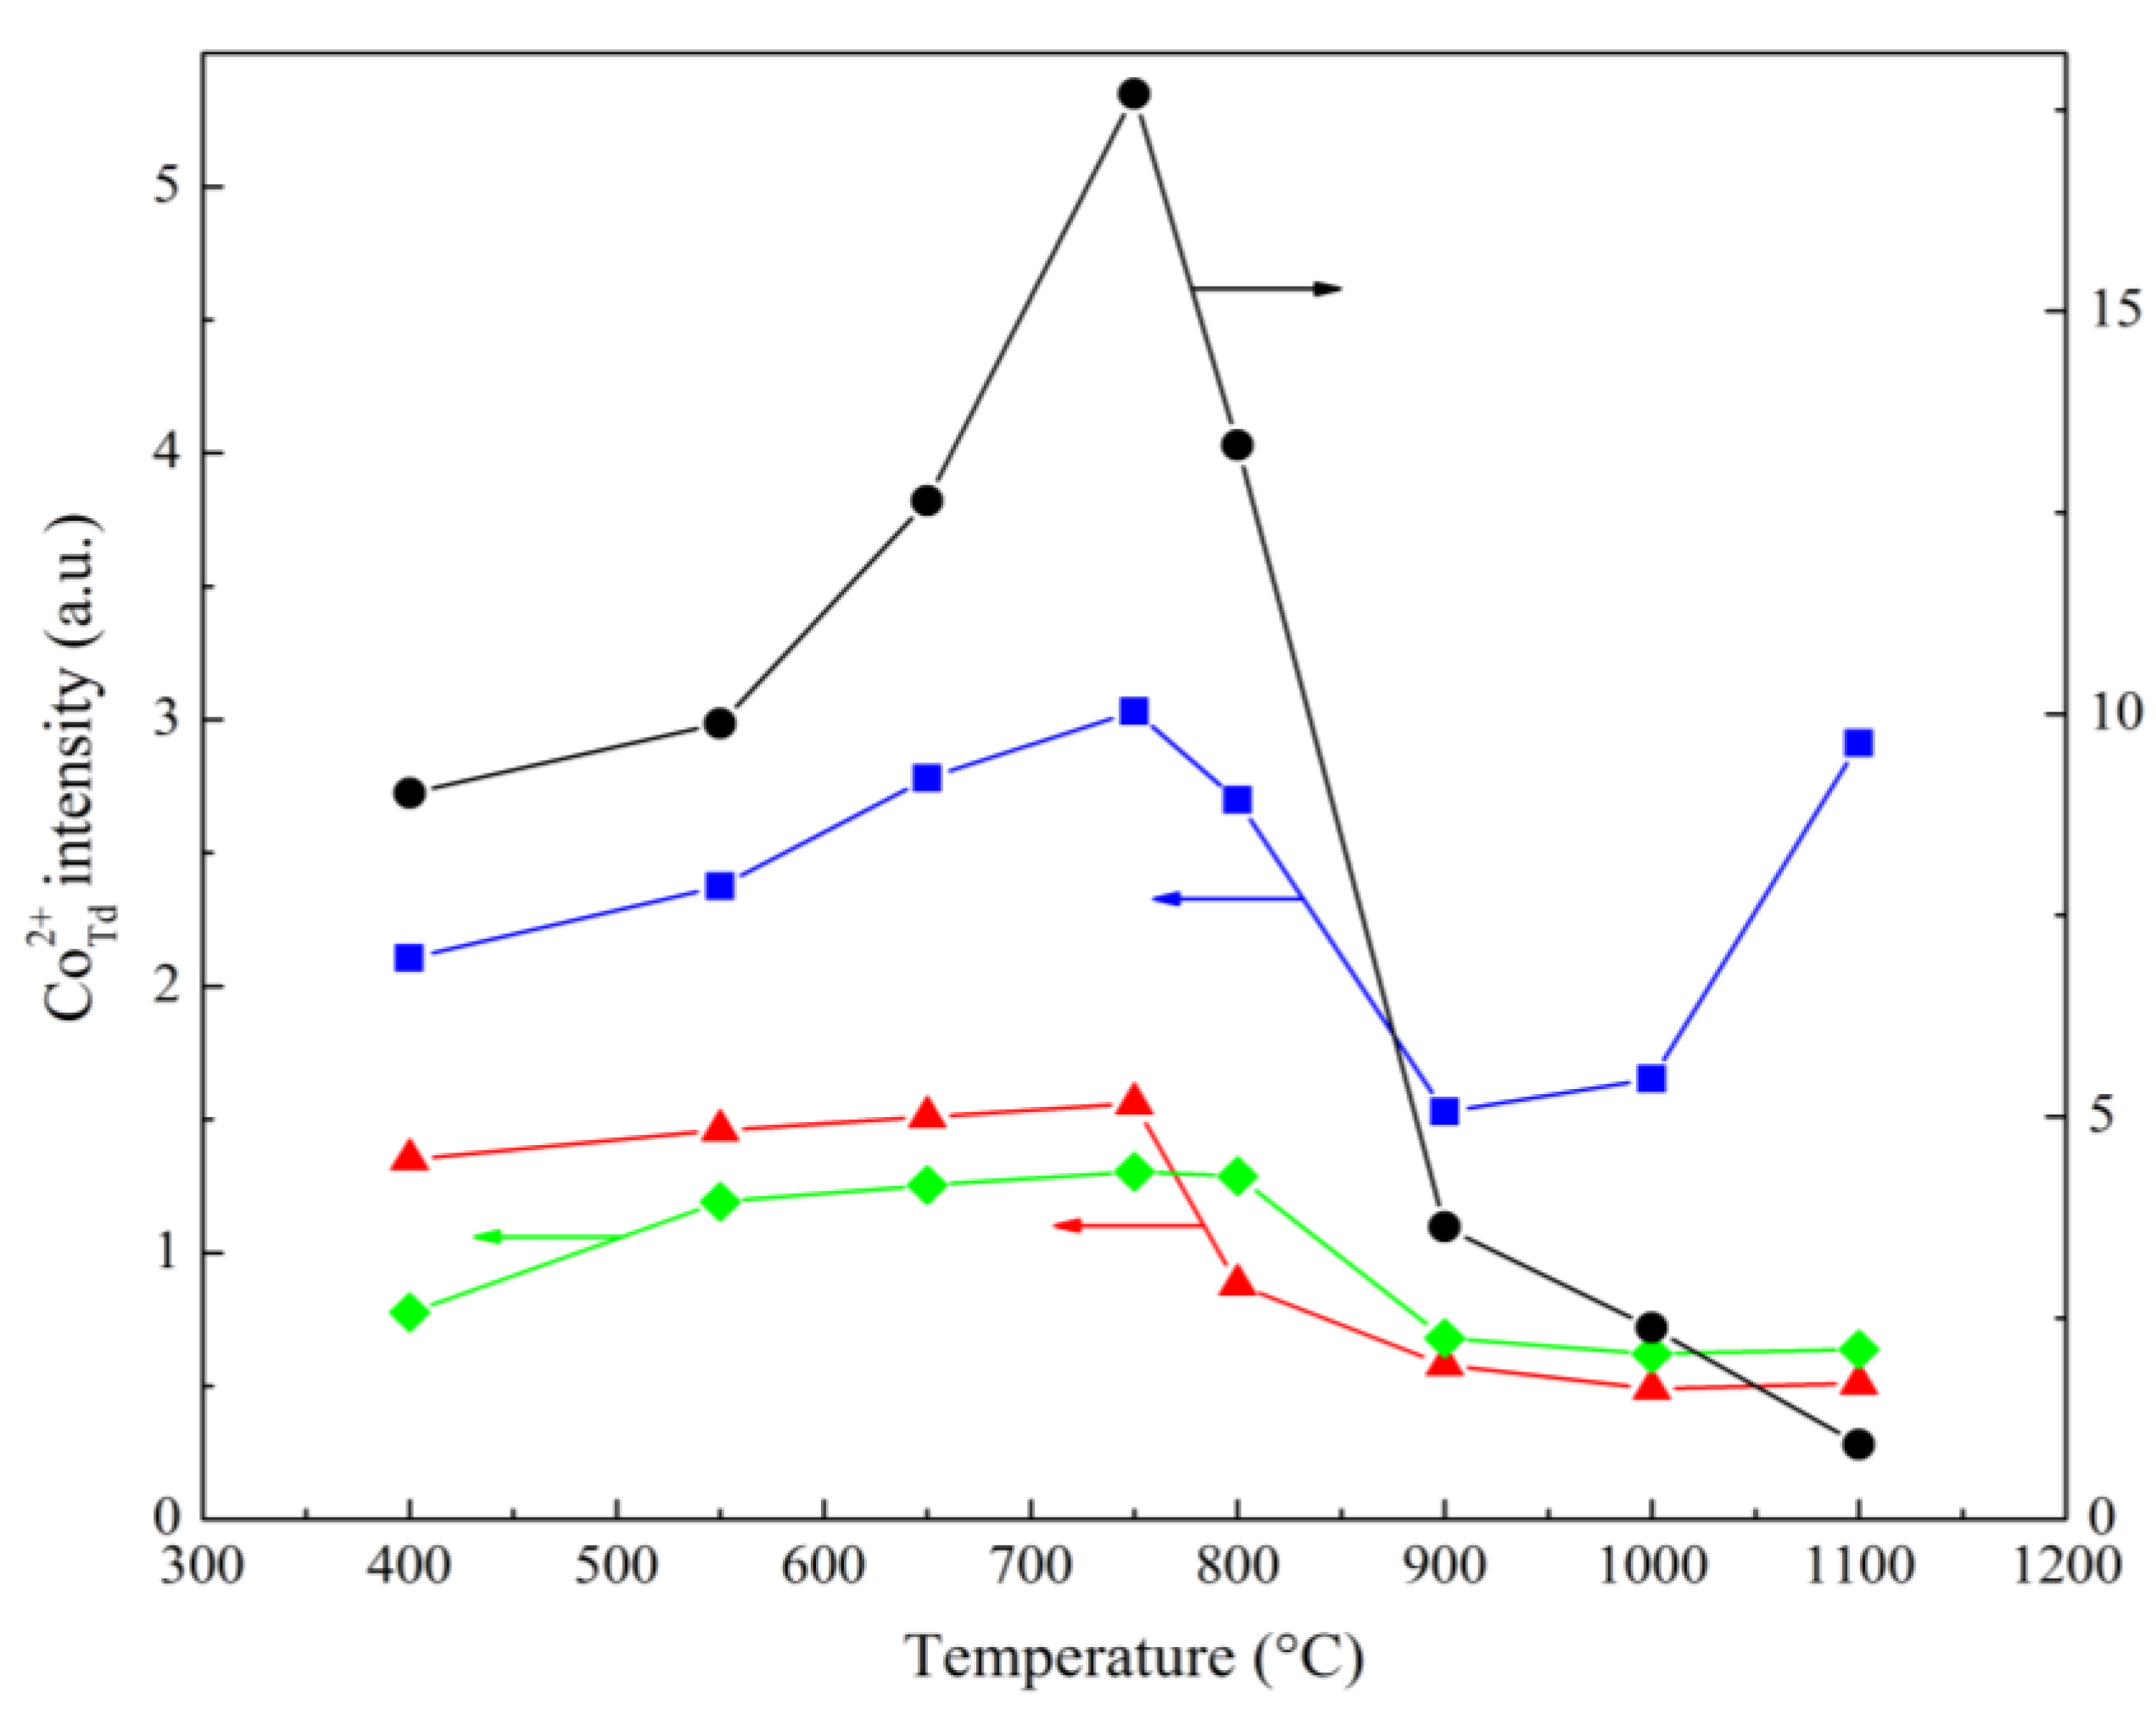
To study the state of Co cations, the electron spin resonance (ESR) method was used. The results of the study are presented in Table 3 and Figure 9.
Co2+ ions at tetrahedral sites of the Co3O4 structure are paramagnetic and thus give a wide isotropic singlet in the ESR spectrum with g = 2.25 [38,43,44]. The structure of both normal and inverse MgCo2O4 spinel does not contain paramagnetic Co2+ ions and thus gives no ESR signal. However, in a CoO–MgO solid solution, Co2+ ions occupying octahedral vacancies give a signal with g = 4.23–4.28, though observed only at –153 °C or lower due to strong broadening related to the Jahn–Teller effect [45,46,47]. Thus, the presence of an ESR signal from Co2+Td may indicate the presence of Co3O4 species in the samples. This ESR signal can only be observed for isolated ions, because at higher concentrations, spin-spin interaction causes signal quenching, complicating the estimation of their absolute concentration. This may explain why, according to the ESR data of Co–Mg samples (Figure 9), with increasing Co content the mean intensity decreases, increasing only in the case of Co3O4 samples, which is probably due to the complete absence of magnesia.
The change in signal intensity with increase of the calcination temperature allows to assess the influence of the latter. At lower temperatures (up to 750 °C), an increase in signal intensity is observed in all samples, with a sharp decrease at 800–900 °C. This behavior is typical for the thermal decomposition of both Co3O4 and MgCo2O4. The small residual signal in the range above 1000 °C is due to partial CoO reoxidation of Co3O4 after quenching. The abnormally high signal intensity of high-temperature Co1Mg1 samples may be caused by the higher cobalt dispersion and the preferred formation of Co3O4 rather than MgCo2O4 spinel during reoxidation.

2.2. Oxygen Reactivity of the Samples

It is known that surface and lattice oxygen play a special role in the structure of deep oxidation catalysts [21]. Oxides such as Co3O4 catalyze combustion of hydrocarbons, especially methane, on active centers involving lattice oxygen [9,10,11], while CO oxidation on oxides proceeds according to both Langmuir–Hinshelwood and Mars–van Krevelen mechanisms involving surface and lattice oxygen, respectively [48,49]. In this regard, samples were studied using temperature-programmed reduction (TPR) and temperature-programmed desorption (TPD).
Figure 10 shows the TPR profiles of the synthesized samples for different heat treatment temperatures.
The Сo3О4 TPR profiles consist of two peaks: a narrow low-temperature peak and a wider one with a flat top. The first peak corresponds to the reduction of Co3+ to Co2+, the second – Co2+ to Co0 [24,25,37,49,50,51]. These peaks remain in up to calcination temperature of 800 °C, slowly merging and drifting to higher temperatures as the calcination temperature increases. This is explained by gradual sintering of Сo3О4 crystallites (Figure 4) and the strengthening of diffusion inhibition. As shown earlier, Co3O4 is also present at higher temperatures as reoxidized Co3+ surface species with smaller particle sizes compared to the initial spinel crystallites, which presumably correspond to small low-temperature peaks, compressed due to the removal of diffusion inhibition.
The characteristic flat-top shape of the second peak, corresponding to Co2+ → Co0, is due to a complex set of reactions occurring during the reduction of CoO, discussed in detail by Rabee et al. [50]. According to these authors, initially reduction proceeds to the stoichiometric mixture (CoO + Co0), which is then completely reduced to Co0. Based on the analysis of TPR profiles, the authors suggest that during this second stage of CoO reduction, Co0 with a small amount of Co5O charged clusters is formed. This conclusion is based on the presence of a shoulder at approx. 820 °C, and is not otherwise substantiated. In the case of our samples, such a shoulder appears on the TPR profiles at 650 °C and higher (Figure 10), increasing in area as the calcination temperature increases. From 900 °C onward, this shoulder turns into a wide triangular peak with Tmax = 783–802 °C, similar to the peak described in [37] and corresponding to the reduction of well-crystallized CoO (with crystallite sizes more than 36 nm, Figure 4).
In order to study in detail the reduction of the spinel phase, TPR with stopping at certain temperatures was carried out. Figure 11 and Figure 12 present the results of the SEM and XRD study of samples obtained with partial and complete reduction.
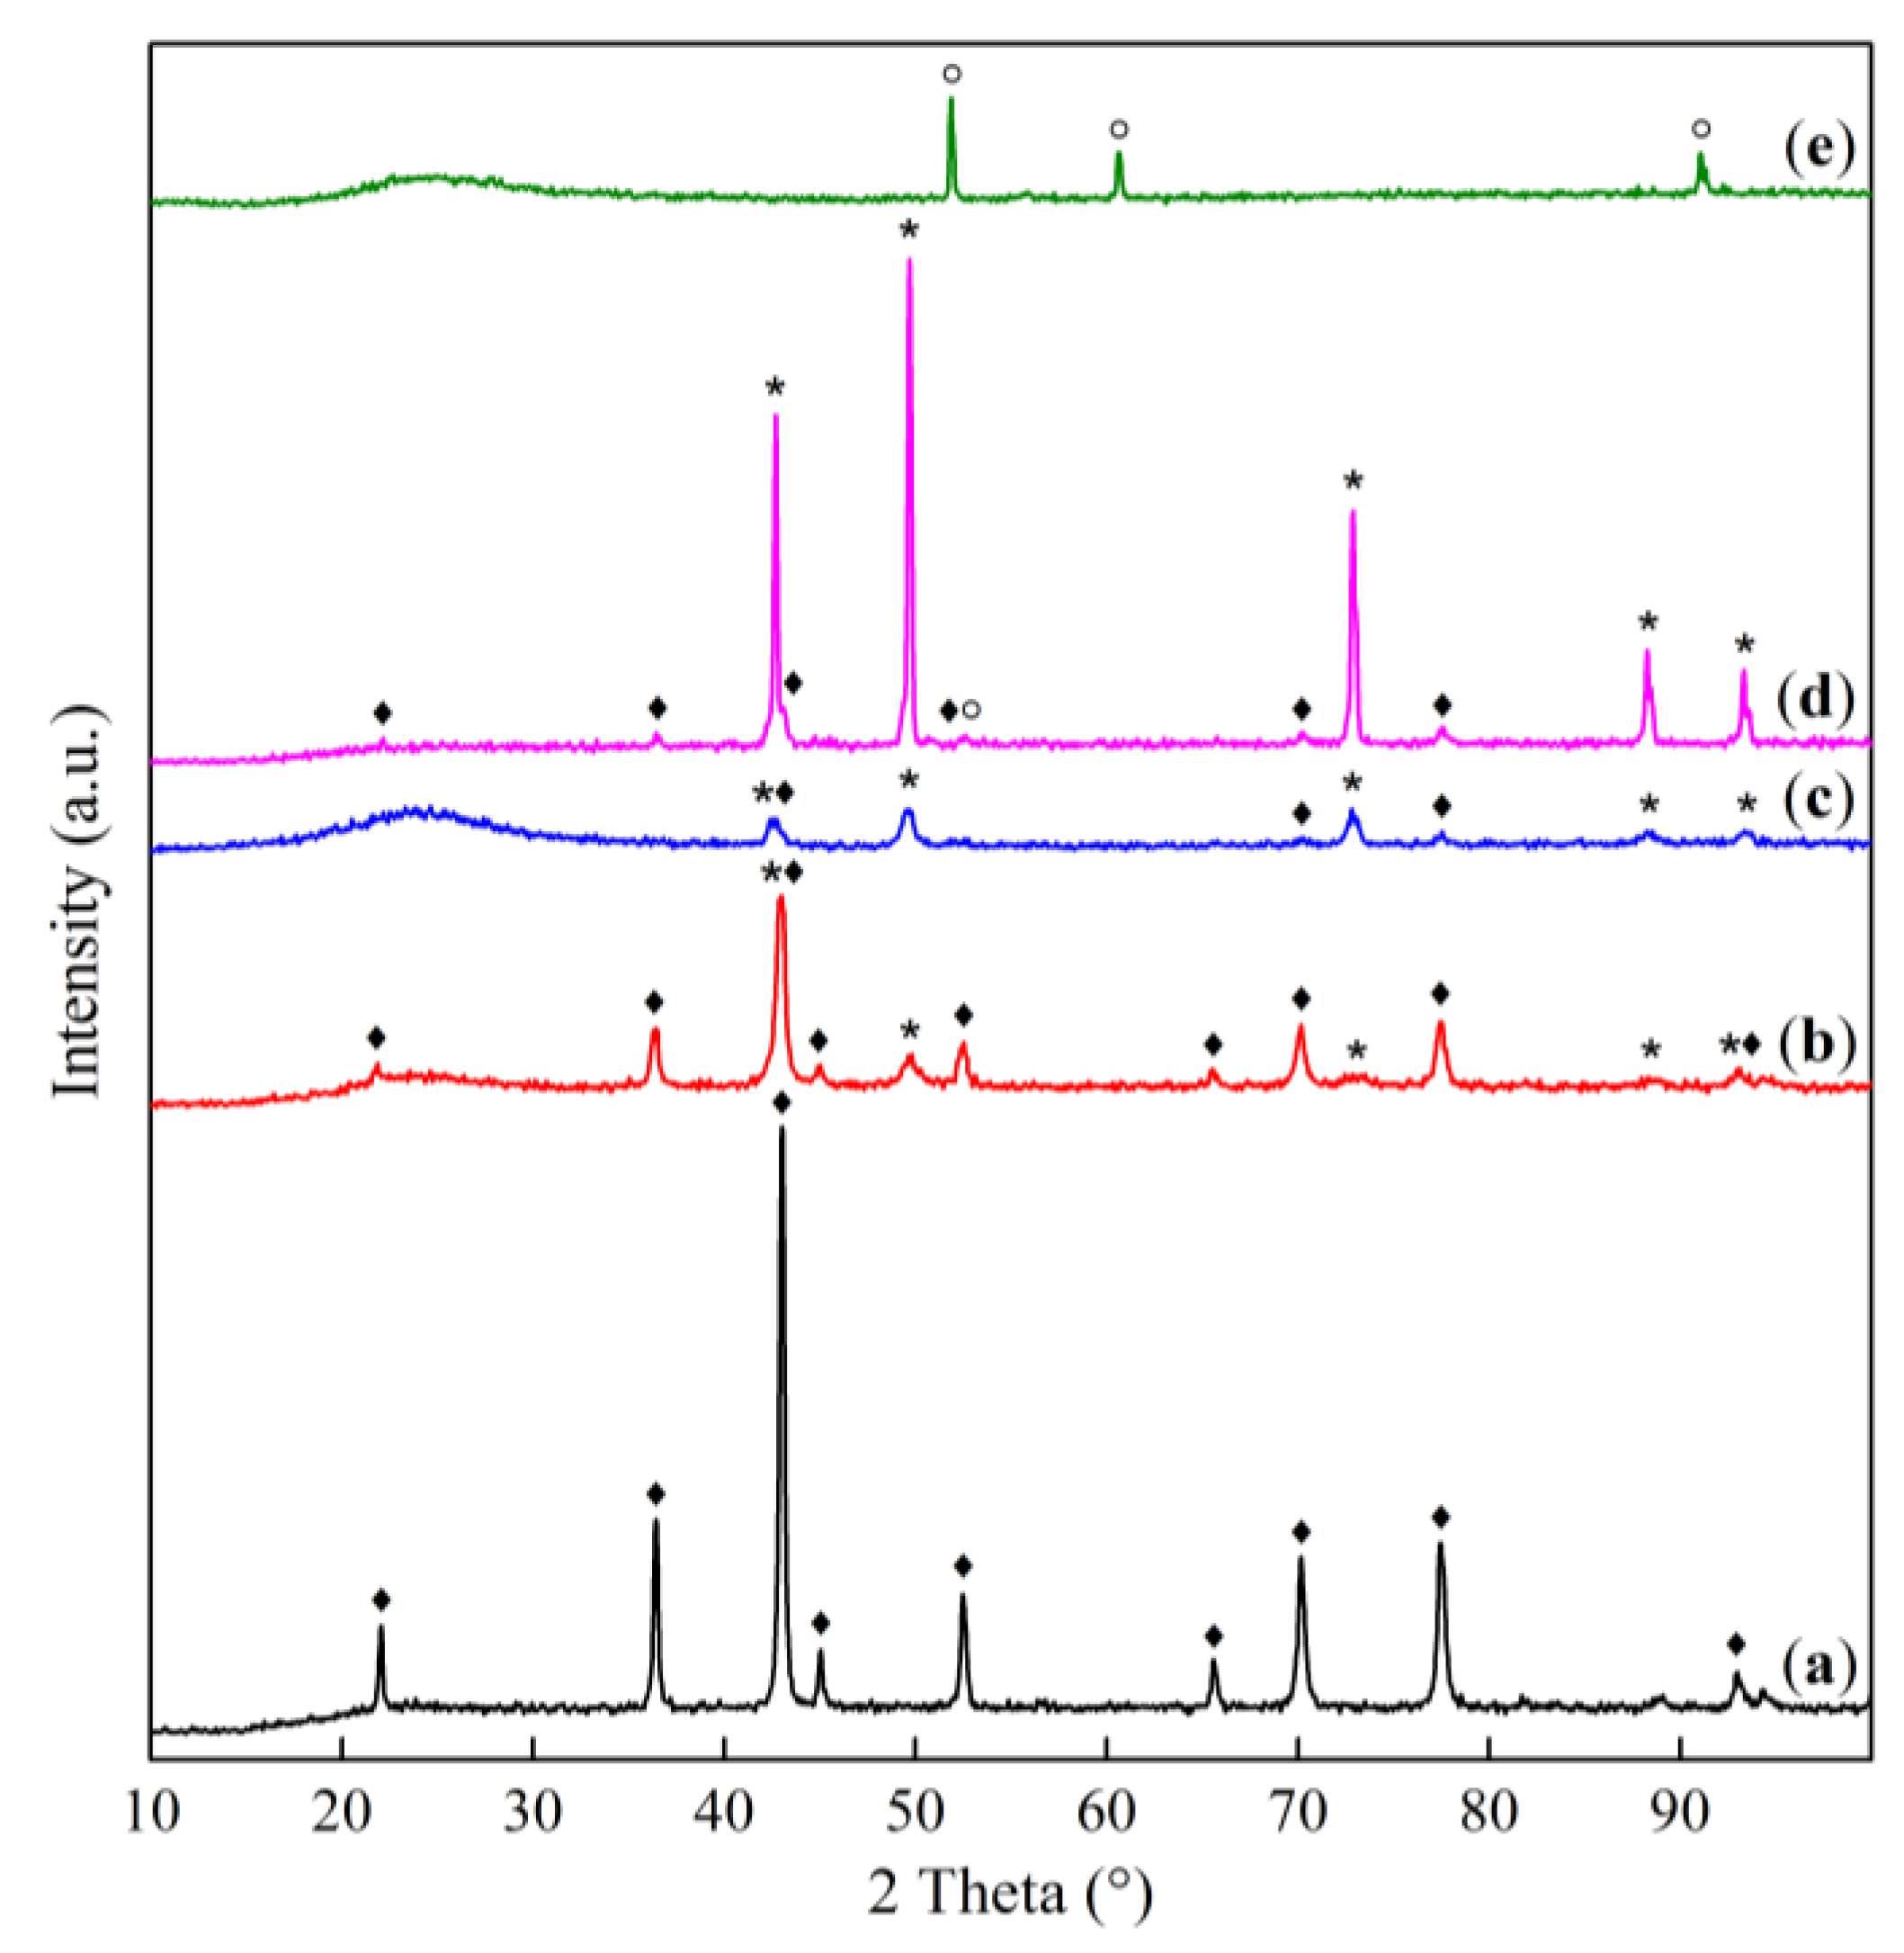
During Co3O4 TPR up to 430 °C (an intermediate temperature between two reduction peaks) SEM micrographs show no significant changes in the aggregates sizes, however, their surface is shown to become more porous (Figure 11 (b), (e)). This effect is due to the rapid decomposition of Co3O4 structure during reduction accompanied by the release of a gas product and preservation of the initial aggregate framework. XRD patterns show a wide halo corresponding to the X-ray amorphous phase appears, with partial amorphization observed even at 380 °C (Figure 12 (b), (c)). This is further supported by the results of calculations of the c.s.d. sizes of CoO phase in these samples, which give the value of 12 nm for both reduction temperatures, showcasing the difference between CoO formed during reduction and during heat treatment (Figure 12 (d)), noted in [21].
After TPR up to 1100 °C, with oxygen corresponding to the second TPR peak removed, large grains corresponding to metallic cobalt are visible in SEM micrographs (Figure 11 (c), (f)), however, XRD patterns also show a characteristic halo, indicating a low degree of Co0 crystallization. Analysis of SEM micrographs suggests that the surface of these large grains contains small (0.2–1.0 μm) nuclei of the Co0 phase, presumably giving reflections in the diffraction pattern (according to calculations, mean c.s.d. size of Co0 is 44 nm).
TPR profiles of cobalt-magnesia samples are similar to those of Co3O4 in the low-temperature range (Figure 10), however, their first peak maxima are shifted to higher values by 30–50 °C, while their second peak becomes wider, which is confirmed by the literature [16,18,24,25]. In this range, as the calcination temperature increases, there is a tendency for the second peak to narrow, especially in the pre-calcination range of 750–800 °C. For all sample compositions, the limiting temperature for the presence of spinel TPR peaks is 800 °C.
The high-temperature profiles closest to each other in shape are those corresponding to the stoichiometric spinels Co3O4 and MgCo2O4, with a clearly defined single peak of CoO or (Co, Mg)O solid solution, with the solid solution reduction temperature shifting to 1014–1076 °C, similar to [16].
The reduction of Co1Mg1 sample calcined at 800 °C gives a single peak with Tmax = 452 °C corresponding to the Co3+ → Co2+ transition. This indicates a decrease in the thermal stability of spinel structures when they are diluted with magnesia exceeding the MgCo2O4 stoichiometry. However, high-temperature Co1Mg1 samples are characterized by a very wide range of solid solution reduction with maxima above 1100 °C, i.e., the (Co, Mg)O phase formed under these conditions is extremely stable (Figure 10). In this regard, the behavior of high-temperature Co4Mg1 is unexpected, with their TPR profiles showing a separate peak with Tmax = 758–806 °C from CoO after Co3O4 thermal decomposition and a further wide peak with Tmax > 1100 °C. That is, in contrast to stoichiometric spinels Co2Mg1 and Co3O4, in the case of non-stoichiometric samples the characteristic reduction peak of the rocksalt phase is not observed. At the same time, high-temperature samples of different compositions show a noticeable decrease in the intensity of the reoxidized Co3O4 reduction peaks with increasing magnesia content.
The observed patterns of formation and decomposition during heat treatment and reduction can be partly explained by different rates of decomposition of cobalt and magnesium nitrate salts. According to thermal analysis data, cobalt nitrate has a lower decomposition temperature range (up to 300 °C) than magnesium nitrate (up to 450 °C) [52], and thus the initial formation of Co–Mg spinel occurs during the reaction of cobalt oxide crystal nuclei with magnesium salts. Such a process allows the formation of an amorphous oxide phase, which, as the heating temperature increases, gradually forms a well-crystallized spinel. Its restructuring requires a fairly high temperature, consistent with TPR data for low-temperature Co–Mg samples (up to 650 °C), where its anion-modified, paracrystalline structure is preserved, and only above this temperature the lattice begins to rearrange, transforming into a “true” spinel. The full transformation into the spinel phase under these conditions is impossible due to its decomposition at 800–900 °C with the transition of spinel phases into the rocksalt solid solution and the loss of lattice oxygen of the spinel.
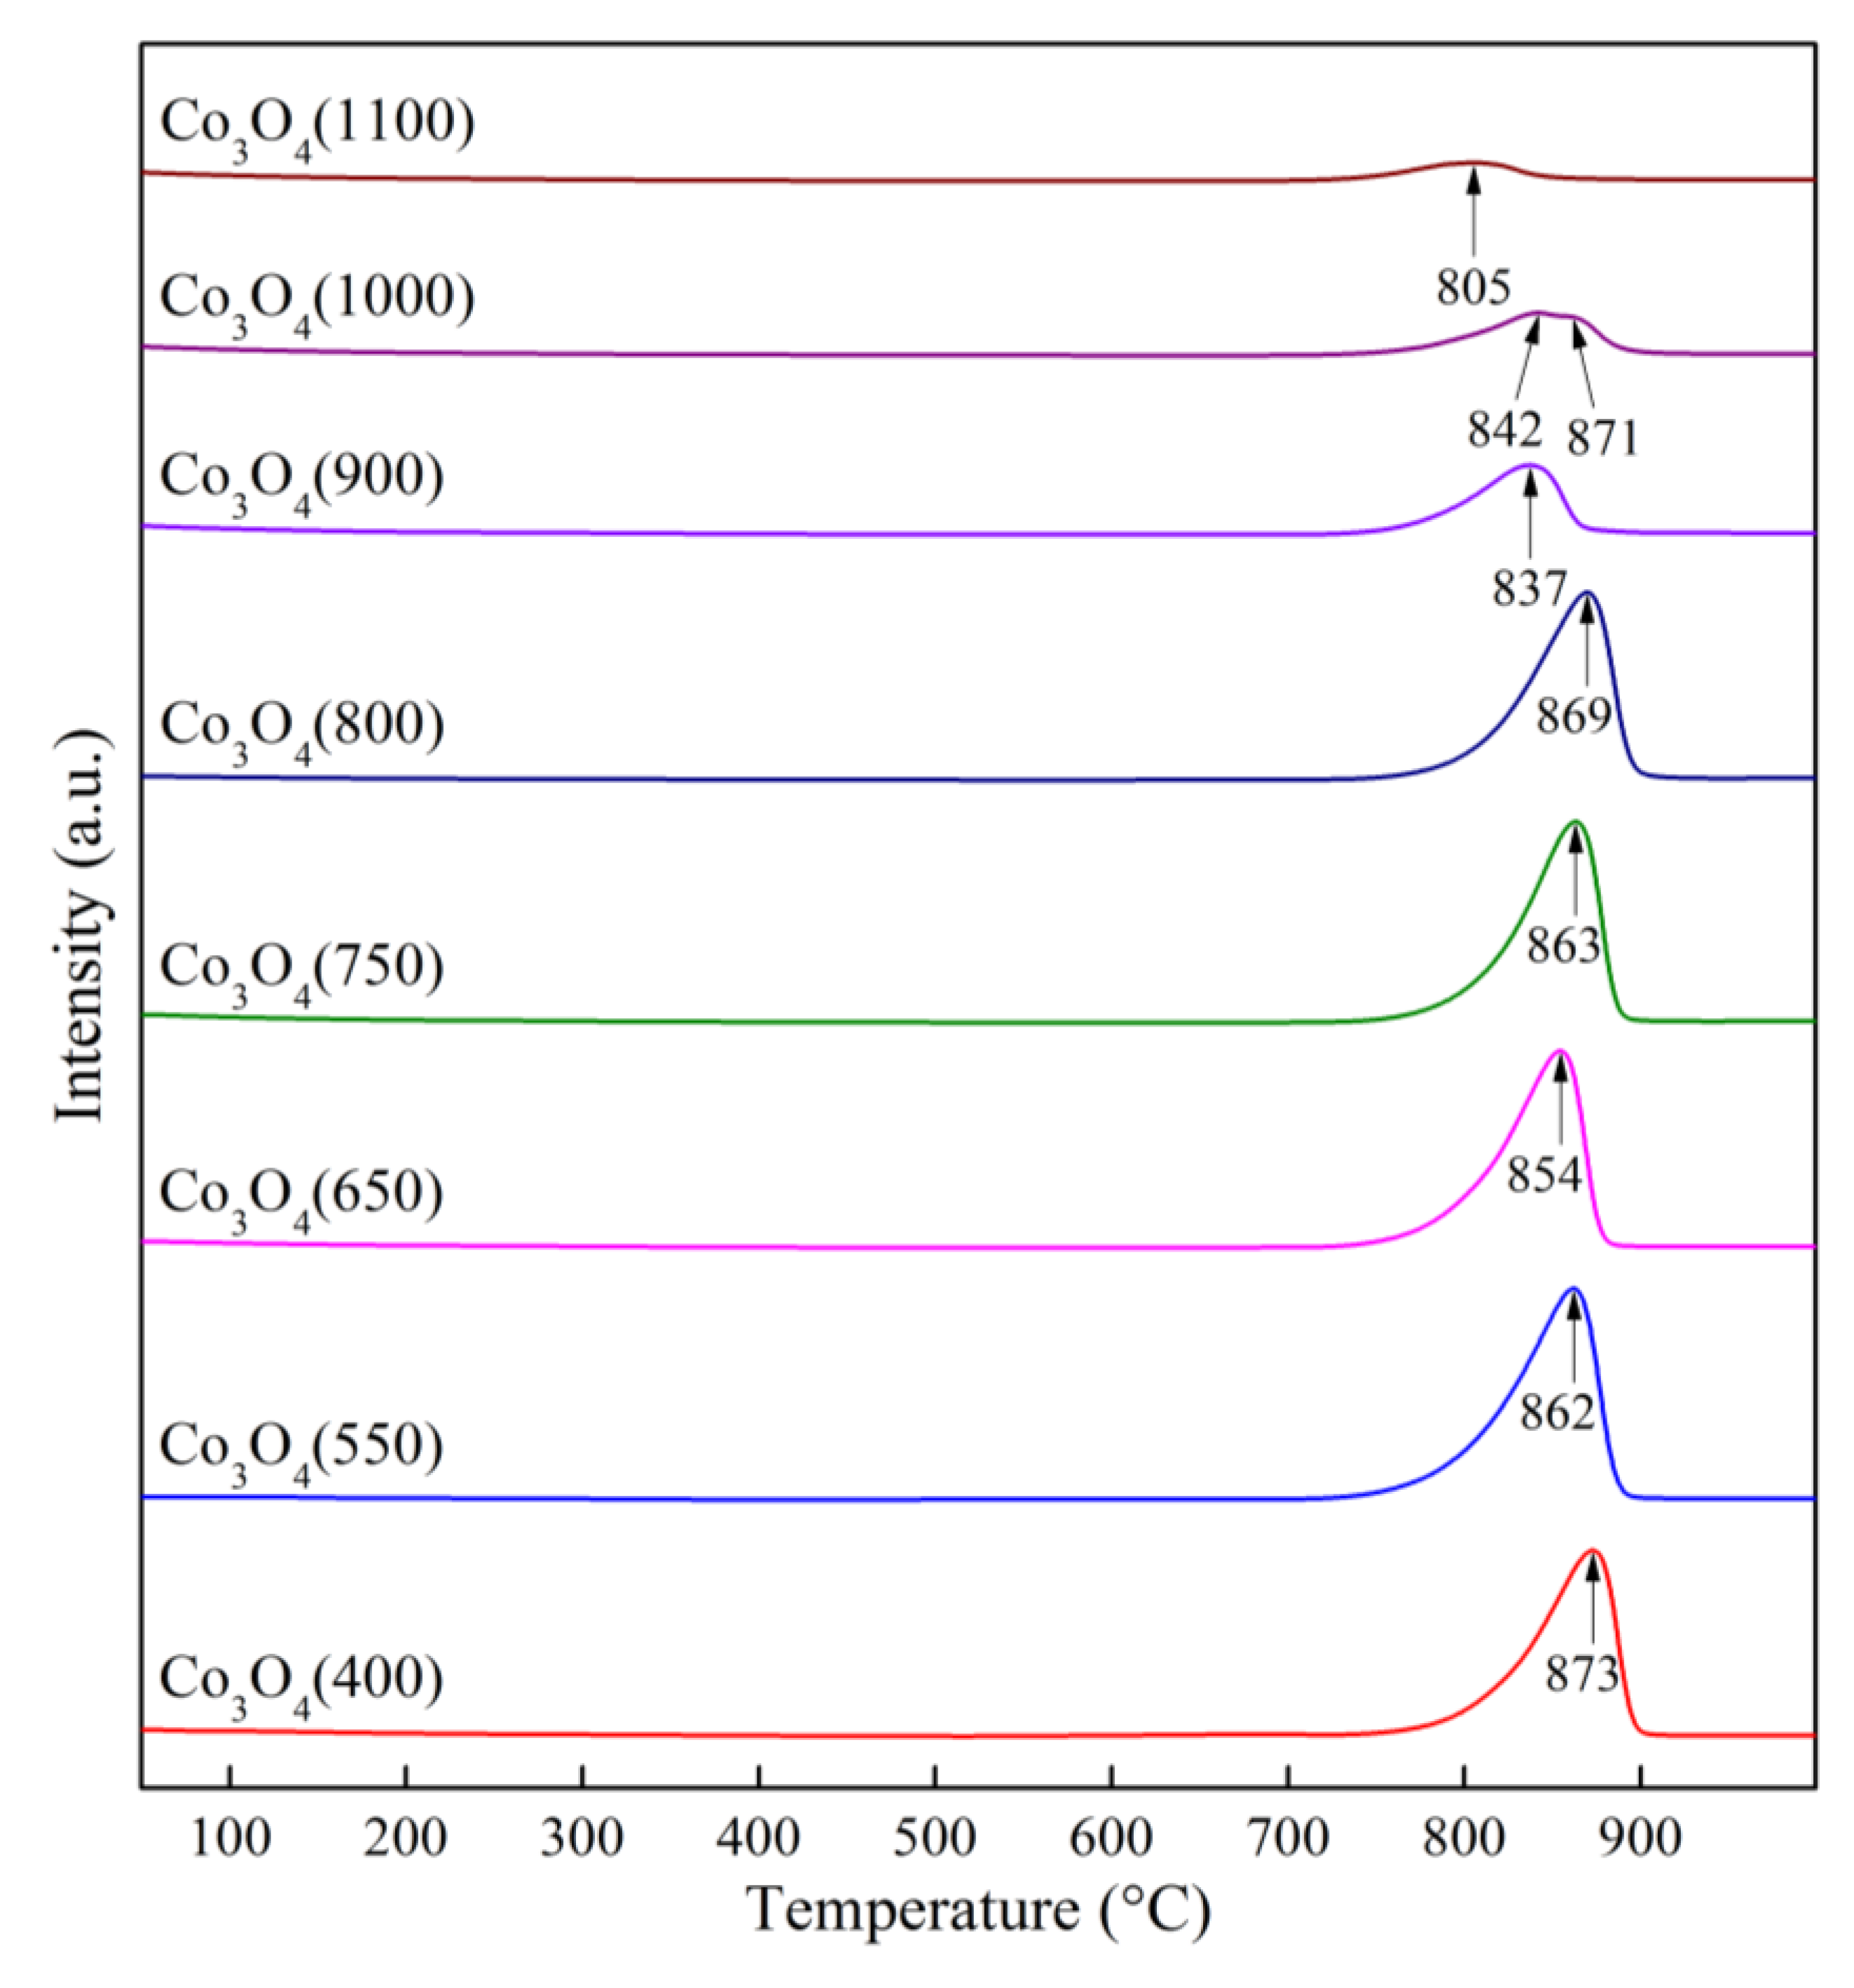
To clarify the process of this process, the temperature-programmed desorption (TPD) method was employed. TPD profiles of Co3O4 samples calcined at different temperatures are presented in Figure 13, while data on oxygen evolution are given in Table 4.
From the data shown in Figure 13 and Table 4, it follows that the release of oxygen occurs predominantly in three regions: 150–300, 600–700 and 700–900 °C. The most oxygen is released in the 3rd region, corresponding to Co3O4 decomposition with CoO formation, compared to the 1st and 2nd regions, corresponding to the desorption of superstoichiometric oxygen of different nature. The 2nd region is observed for low-temperature samples, and starting from 650 °C it becomes a shoulder and is not observed further. The oxygen release in the 700–900 °C range for low calcination temperatures is characterized by small fluctuations in peak temperatures (854–873 °C) and released oxygen volumes (2075–2092 μmol/g). No oxygen evolution is observed at temperatures above 900 °C, which theoretically should indicate the absence of peaks after calcination at 900 °C and above. However, as shown earlier, reoxidation and partial regeneration occur during the sample quenching [27], with the resulting surface spinel formed on the surface of rocksalt phase (Figure 11). The amount of oxygen released from the surface spinel gradually decreases with increasing calcination temperature. This is explained by sintering of the samples, reducing the possibility of reoxidation, further confirmed by the shift of TPD peaks to lower temperatures with increasing calcination temperature.

2.3. Regeneration Ability of Samples

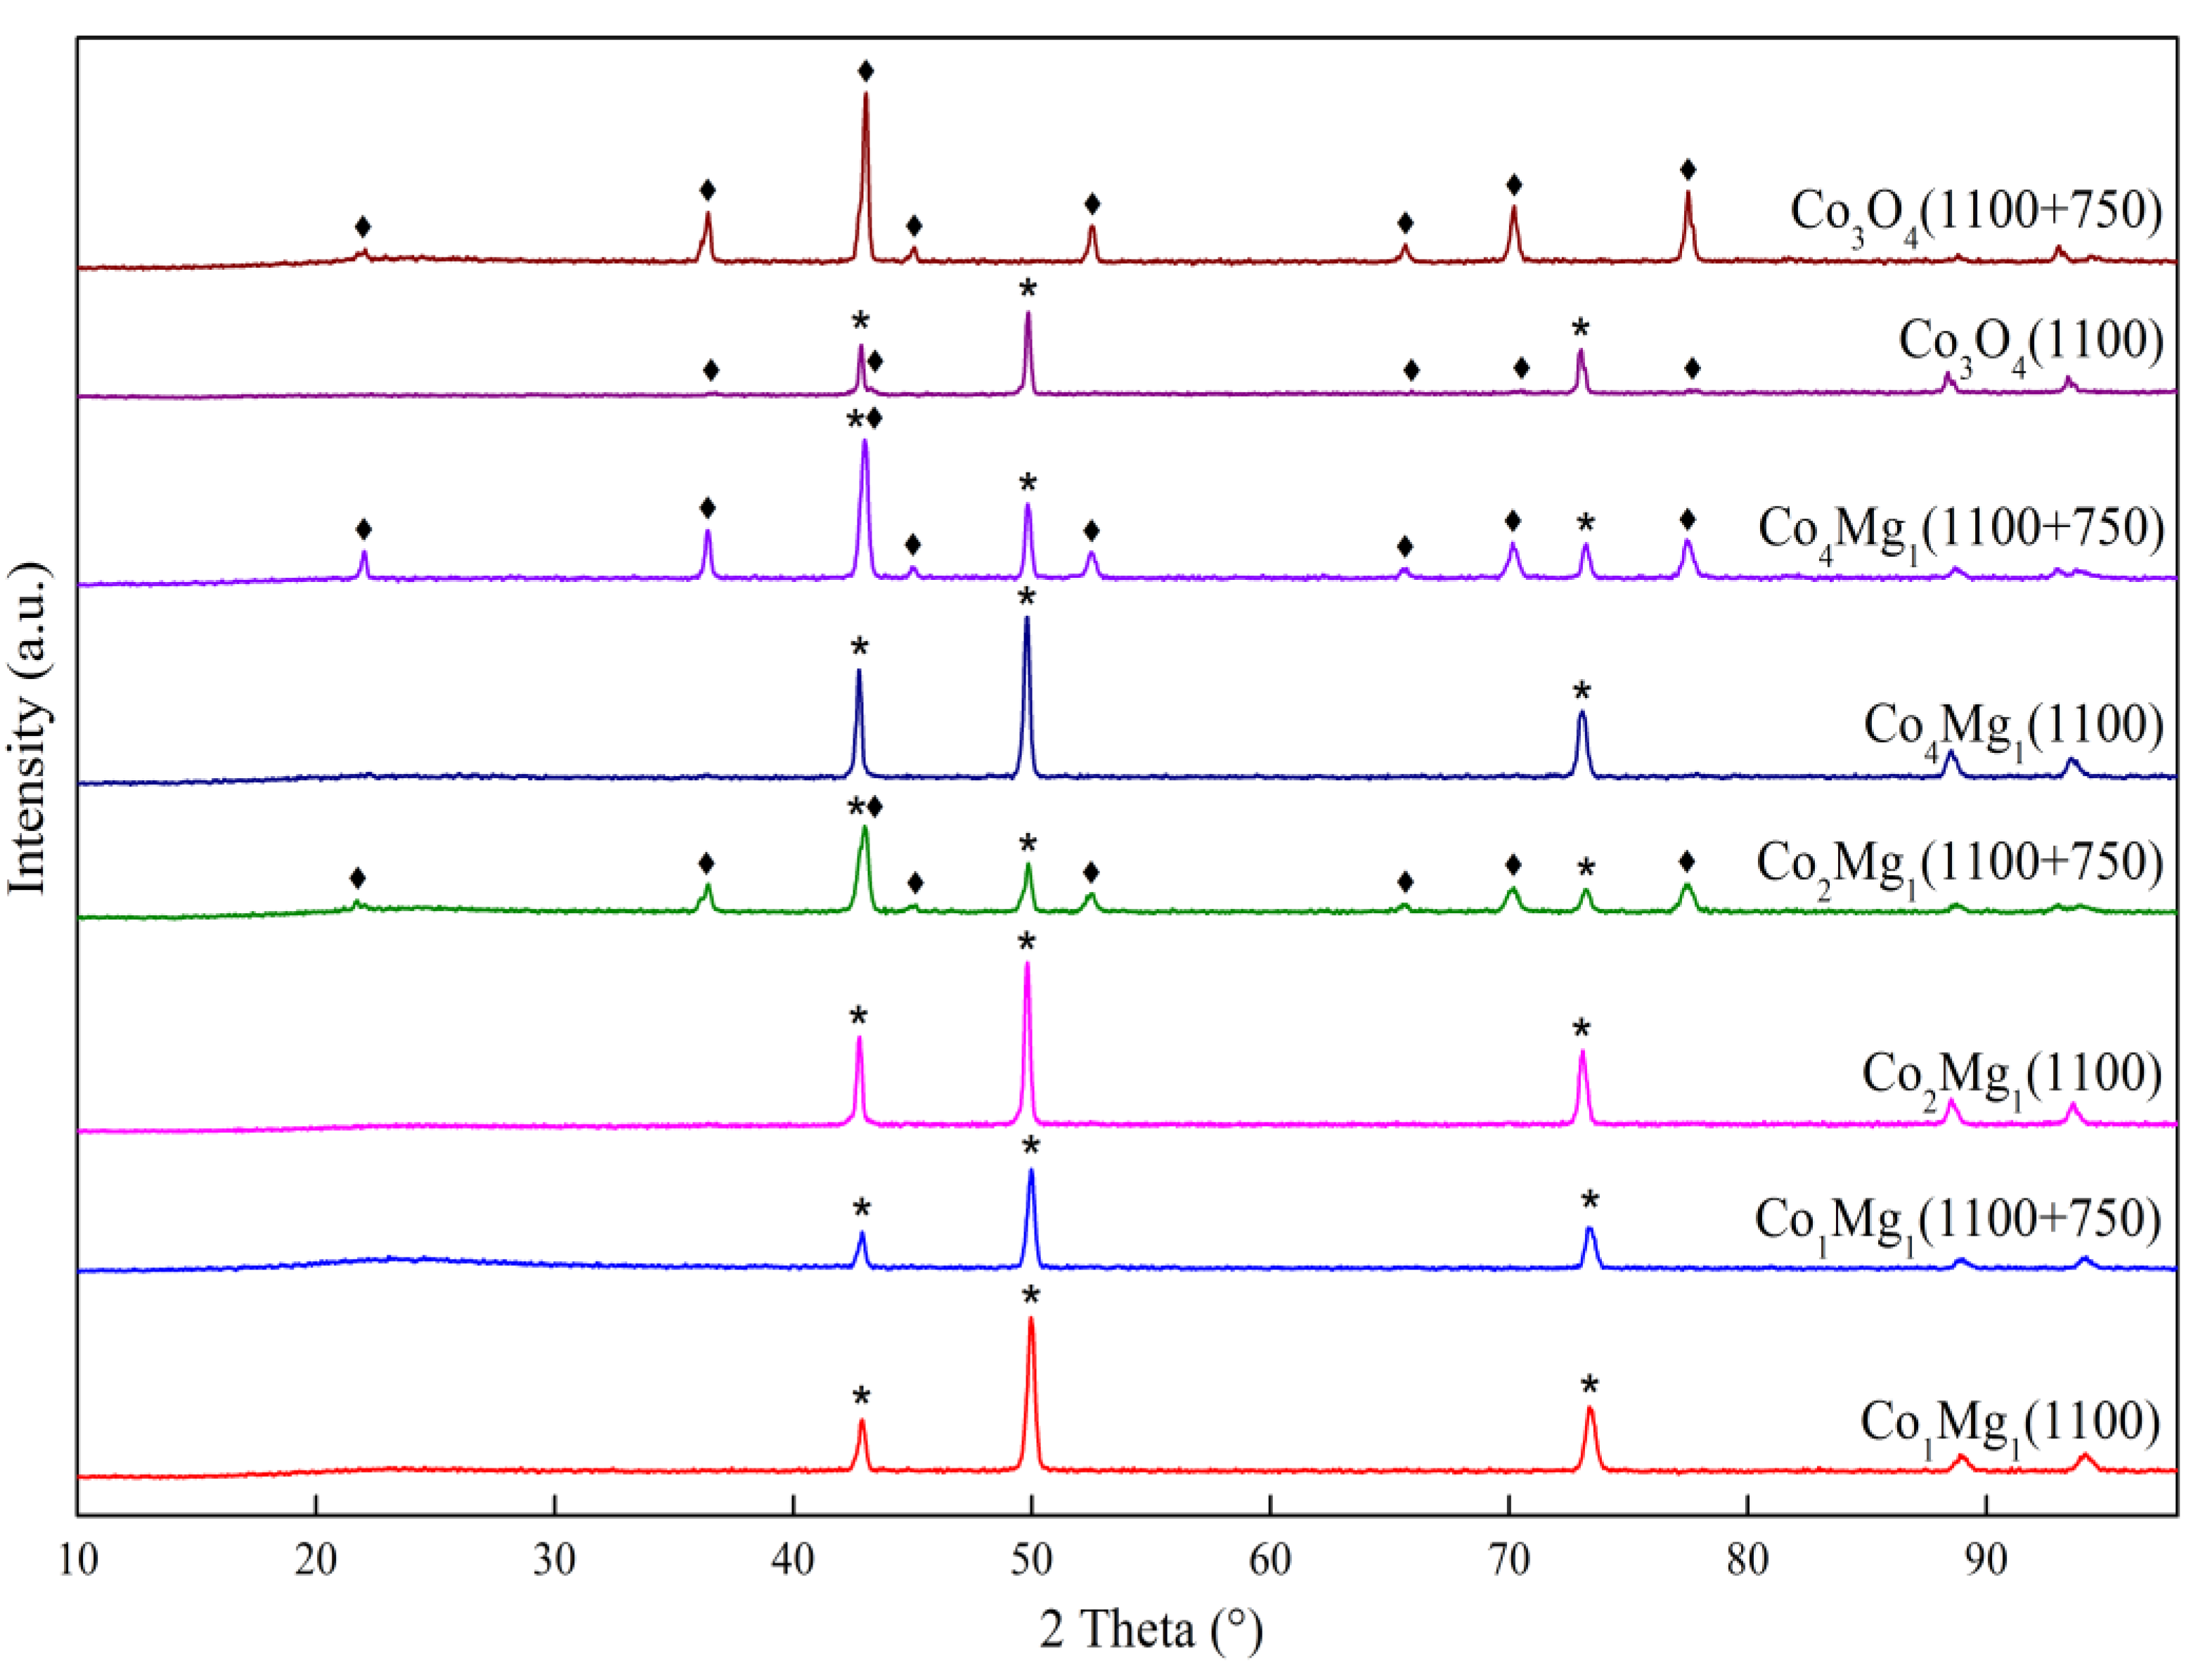
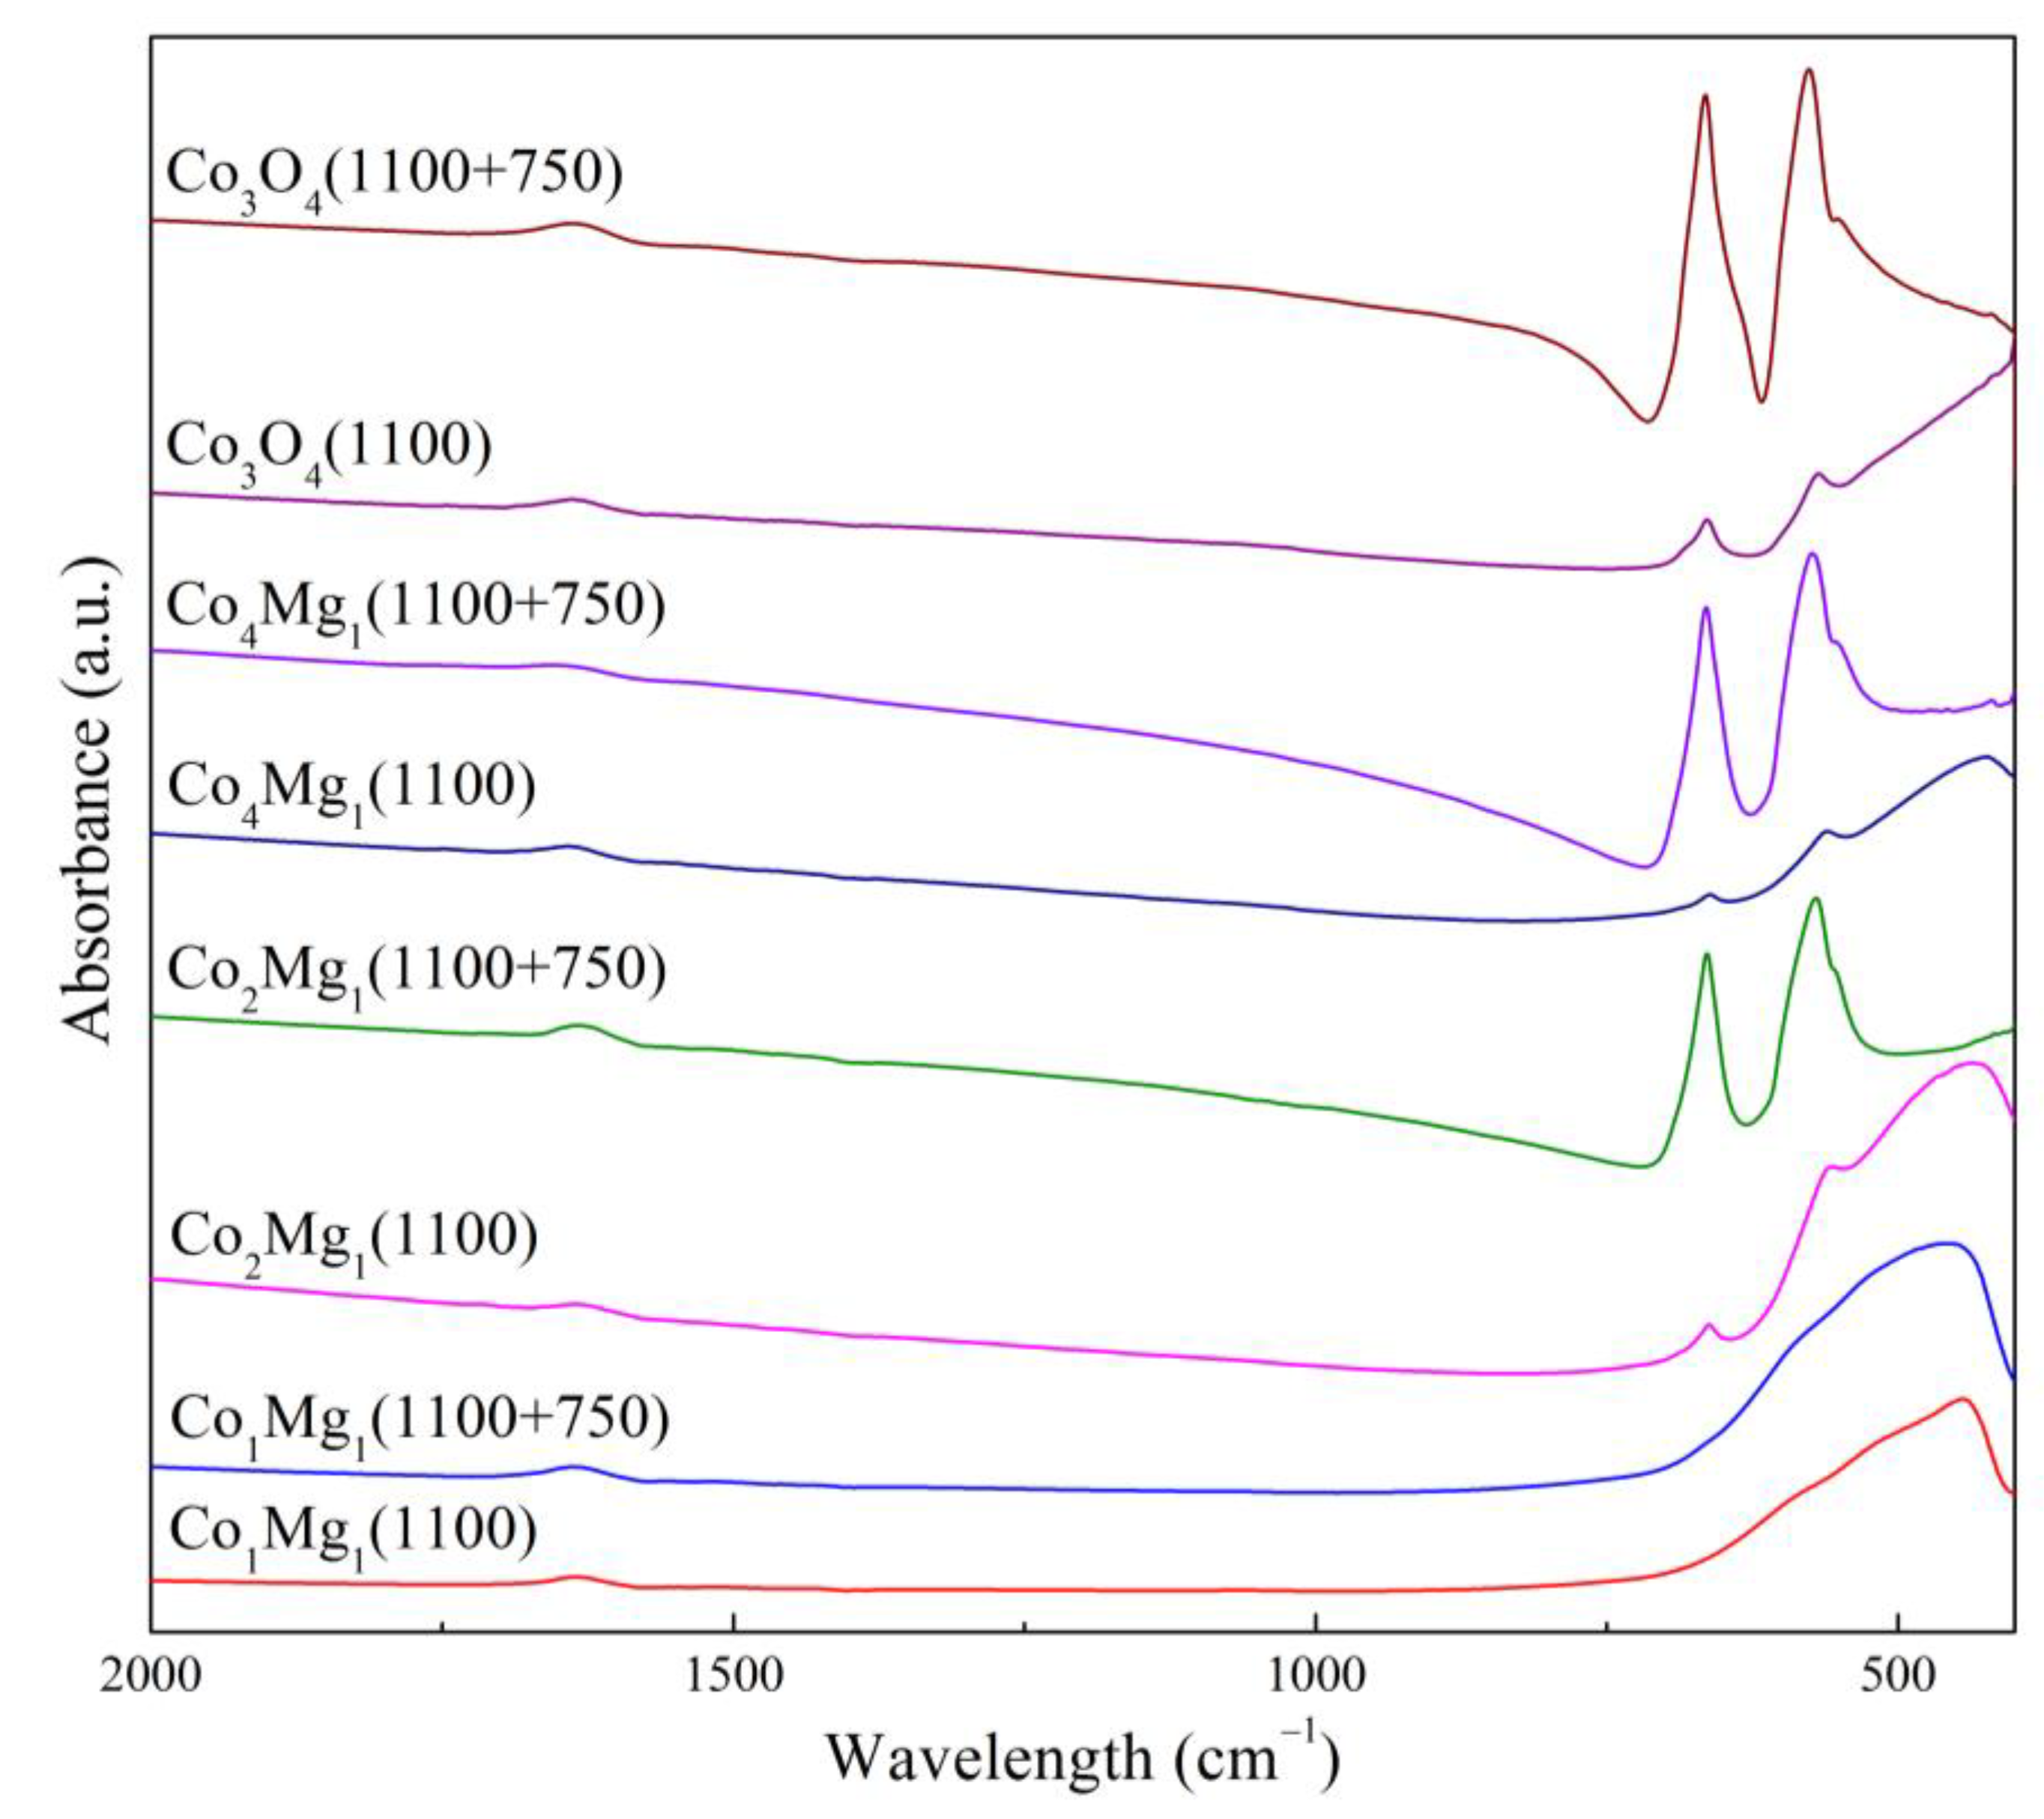
One of the key characteristics of catalytic systems is their ability to regenerate after exposure to high temperatures. In this regard, one of the objectives of this work was to assess the possibility of regeneration of the spinel phases after high-temperature heat treatment. Samples calcined at 1100 °C were subjected to additional heat treatment at a temperature of 750 °C (below the point of spinel thermal decomposition) for 2 h. Changes in the structure and phase composition of the samples after reoxidation were studied by XRD, FTIR and TPR methods (Figure 14, Figure 15 and Figure 16).
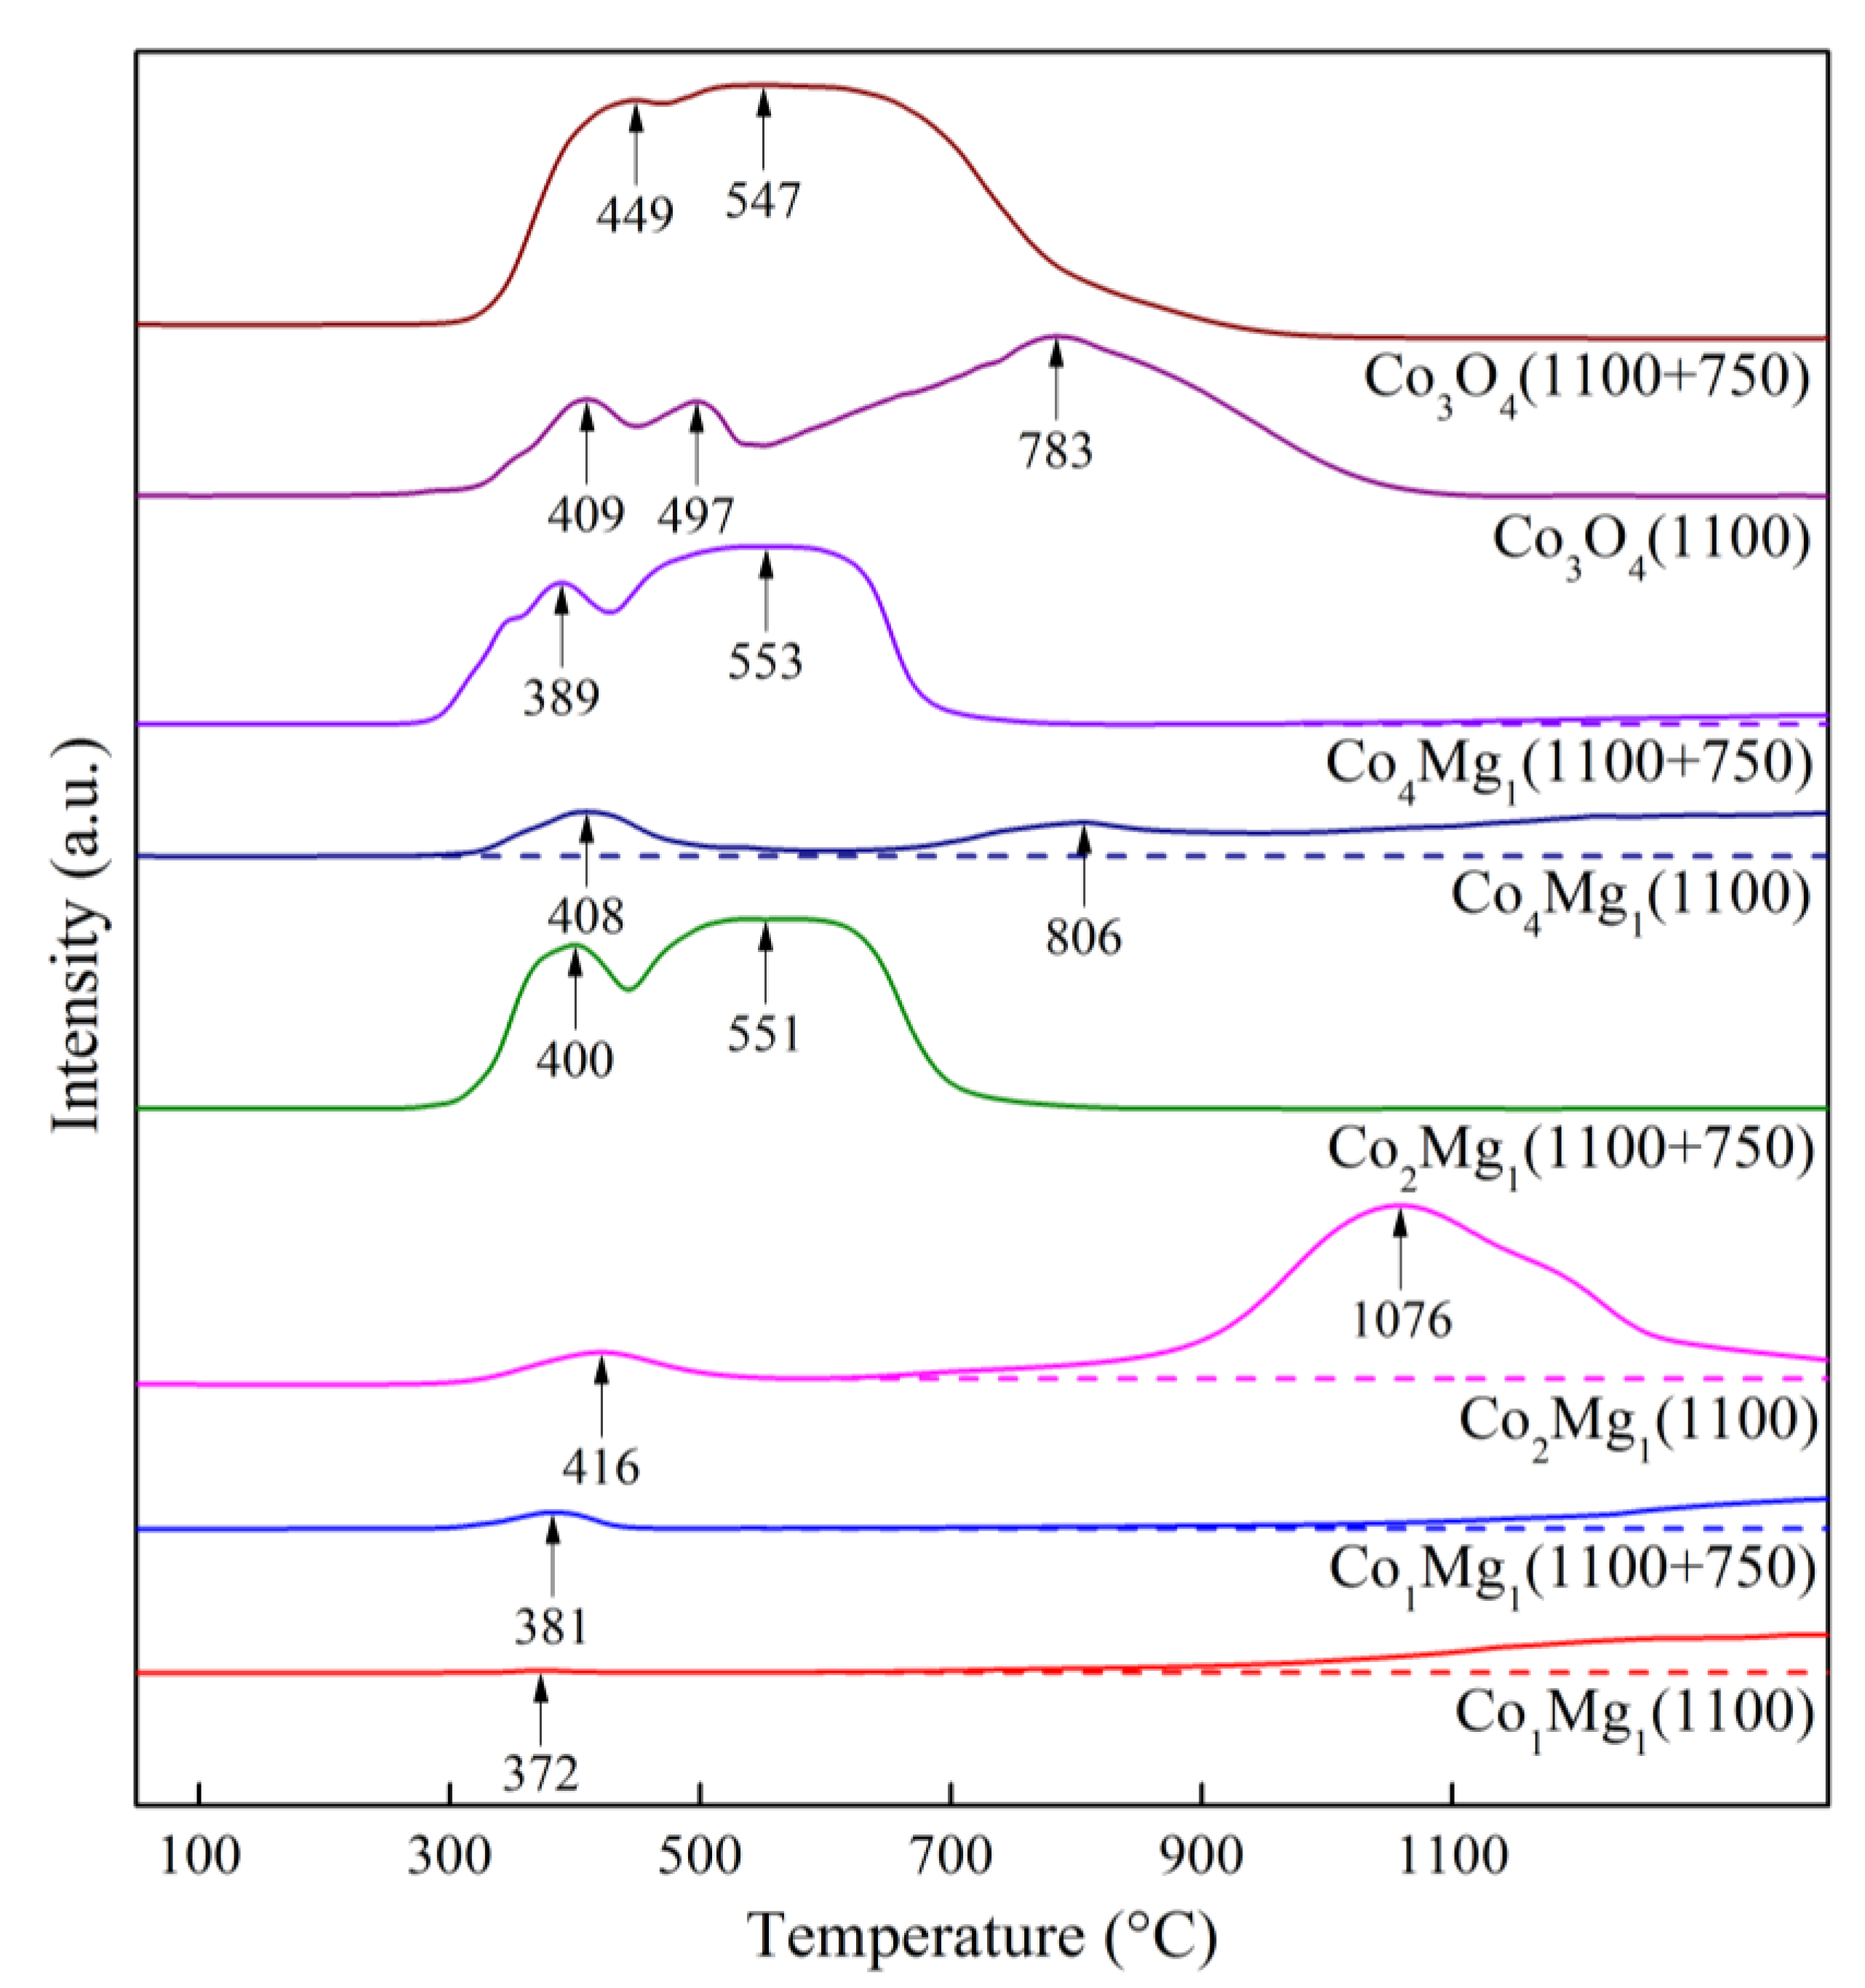
As follows from XRD data for Co3O4 (Figure 14), after the reoxidation of pre-calcined samples, only Co3O4 reflections are observed, while CoO reflections disappear completely; similarly, after reoxidation, spinel a.b. increase is observed in the IR spectra (Figure 15) simultaneously with the disappearance of the shoulder in the 400–600 cm–1 range characteristic of CoO. TPR profile (Figure 16) shows an almost complete disappearance of the peak at 783 °C, while smaller peaks at 409 and 497 °C are transformed into a “classical” Co3O4 profile with Tmax = 449 and 547 °C, similar to samples calcined at 750 °C (Figure 10). These data together with SEM data (Figure 6 (c), (e)) indicate an almost complete regeneration of the spinel Co3O4 structure.
With the introduction of magnesia, the regeneration process slows down in proportion to the increase in magnesia content. This effect is especially pronounced when adding magnesia beyond the stoichiometry of MgCo2O4 spined, that is, in Co1Mg1 samples (Figure 14, Figure 15 and Figure 16). Regeneration of the Co1Mg1 sample is significantly hampered, which is reflected in the XRD patterns of the reoxidized sample as an increase in the halo in the 2θ range of 20–30° and a slight decrease in the intensities of the rocksalt phase reflections, as well as a small peak at the TPR profile with a maximum at 381 °C and a decrease of the wide high-temperature peak.
The TPR profiles of reoxidized Co2Mg1 and Co4Mg1 samples (Figure 16) repeat the profiles of corresponding samples not subjected to high-temperature treatment (Figure 10). IR spectra also show the intensification of spinel a.b. with their positions unchanged (Figure 15), however, a Me-O shoulder near 400 cm–1 remains. XRD data similarly shows reflections of the rocksalt solid solution phase together with the regenerated spinel (Figure 14). The above makes it possible to assert that, in contrast to Co3O4, 2-hour reoxidation of Co–Mg solid solutions formed during MgxCo2–xO4 spinel decomposition does not lead to complete structure regeneration, but, nevertheless, occurs quite deeply. At the same time, excess magnesia above MgCo2O4 stoichiometry significantly slows down the regeneration rate.

3. Materials and Methods

3.1. Preparation of Samples

Cobalt and cobalt-magnesia oxide samples were synthesized by thermal decomposition of nitrate salts. In the case of Co3O4, cobalt nitrate powder (Co(NO3)2·6H2O, ≥ 98%, Sigma–Aldrich) was used; in the case of Co–Mg samples, a mixture of cobalt and magnesium nitrate powders (Mg(NO3)2·6H2O, 99%, Sigma–Aldrich) were used in the molar ratios Co:Mg = 1:1; 2:1; 4:1 for samples of the Co1Mg1, Co2Mg1, Co4Mg1 series respectively. The powder mixture was dissolved in distilled water, with the solution subjected to evaporation on a heated magnetic stirrer with constant stirring; the stirrer was heated with a gradual increase in temperature from 100 to 180 °C for 8 h. After removing most of the water from the solution, the resulting dry product was transferred to a muffle furnace and subjected to heat treatment at 275 °C for 15 h. The resulting precipitate was crushed and then calcined at various temperatures. Heat treatment was carried out in a muffle furnace with a heating rate of 10 °/min and then kept at a given temperature for 1 h. After the end of heat treatment, the sample was quickly removed from the furnace and quenched to room temperature in air. The samples were designated CoxMg1 (T) in the case of Co–Mg-samples and Co3O4 (T) in the case of Co-samples, where T is the sample calcination temperature.
Additionally, the samples calcined at 1100 °C were subjected to further heat treatment at 750 °C for 2 h. The samples obtained in this way were designated CoxMg1 (1100+750) or Co3O4 (1100+750).

3.2. Study of Samples

In order to study the structure of the samples, the of X-ray diffraction (XRD), scanning electron microscopy (SEM), Fourier-transform infrared spectroscopy (FTIR), electron spin resonance (ESR), temperature-programmed reduction by hydrogen (H2-TPR), and temperature-programmed oxygen desorption (TPD) methods were employed.
The X-ray diffraction study was carried out on a DRON-4-07 powder diffractometer (Burevestnik, Saint-Petersburg, Russia), Co Kα radiation, Ni filter. Shooting step 0.02°, shooting range 10–90°. The values of the lattice parameters were determined from the positions of the diffraction maxima. The average sizes of coherent scattering domains (c.s.d.) were determined in accordance with the Scherrer formula [37]:
d = 0.9 λ B cos θ   ,
where d is the c.s.d. mean size (nm); λ = 0,1789 is the wavelength (nm), B is the full peak width at half maximum (rad), θ is the diffraction angle (°).
The structure of the samples was studied by SEM method using a low-vacuum scanning electron microscope JSM-6610LV (JEOL, Tokyo, Japan).
The FTIR study was carried out on a Nicolet iS5 FTIR spectrometer (Thermo Fisher Scientific, Milan, Italy) at room temperature in the range of 4000–400 cm−1. The samples were pressed into KBr pellets.
The ESR study was conducted on a JES–ME–3X spectrometer (JEOL, Tokyo, Japan), 3 cm wavelength. The spectra were recorded at room temperature. The g-factor values of the samples were determined relative to the DPPH standard.
Temperature-programmed reduction by hydrogen (H2-TPR) and temperature-programmed oxygen desorption (TPD) were carried out on a self-made installation with analysis of the gas flow on a Chromatek-Kristall 5000 chromatograph (Chromatek, Yoshkar-Ola, Russia) with a catharometer detector. The samples were reduced with a gas mixture of 5% H2 in Ar, desorption was carried out in a He flow. The flow rate was 30 cm3/min. Heating was carried out in linear mode at a rate of 10 °/min up to 1100 °C and followed by thermostatting at this temperature for 40 min. Сo3O4 (550) sample was studied in detail by TPR with stopping at different temperatures and cooling to room temperature in a flow of H2–Ar mixture.

4. Conclusions

As part of a comprehensive study of the Co–Mg–Al oxide system, samples of the Co–Mg binary oxide system were studied in order to establish its formation patterns in different temperature conditions. It was found that the characteristic phase transition of MgxCo2–xO4 spinels into the corresponding (Co, Mg)O solid solutions at 800–900 °C is observed over the entire studied range of Co:Mg ratios. Study of the behavior of lattice parameters and mean particle sizes of these phases showed the similarity of their formation patterns, particularly, in the case of the spinel phase a gradual improvement of its lattice structure up to the decomposition temperature is observed. It was shown that the rocksalt phase present in low-temperature Co–Mg samples is an anion-modified paracrystalline oxide that depends little on the initial Co:Mg ratio and only upon spinel decomposition forms a “true” solid solution that obeys Vegard’s law. Spinel thermal decomposition is accompanied by a decrease in the mean particle size of both phases for all Co:Mg ratios. In the case of Co3O4, spinel decomposition does not lead to its complete disappearance due to the formation of a surface spinel species due to samples quenching.
TPR study of the samples confirmed the literature data on the reduction profiles of Co3O4 and Co–Mg spinel. High-temperature Co3O4 TPR profiles showcase peaks corresponding to surface Co3O4 as well as a wide peak with Tmax = 780–800 °C corresponding to crystallized CoO (32 nm). At the same time, partial TPR of Co3O4 up to 380 °C showed the presence of well-dispersed amorphous CoO (12 nm).
It was shown that non-stoichiometric Co–Mg samples calcined at high temperatures are noticeably less susceptible to reduction compared to stoichiometric samples, which indicates their low oxygen reactivity.
A study of the spinel regeneration process after high-temperature heat treatment up to 1100 °C by calcination at a lower temperature (750 °C) showed complete regeneration of the spinel phase within 2 h for samples of the MgCo2O4–Co3O4 system; in case of an excess of MgO relative to stoichiometry, this process is hindered.
To summarize, it can be concluded that complex processes occur in Co–Mg oxide systems that depend both on Co:Mg ratio and on heat treatment conditions, potentially providing the possibility of their fine-tuning to specific catalytic processes by varying the above parameters.

Author Contributions

Conceptualization, A.S. and I.T.; methodology, A.B. and S.T.; software, B.Kh.; validation, T.B., B.Kh. and A.S.; formal analysis, K.R. and Y.N.; investigation, Ma.Zh. and I.T.; data curation, S.T. and T.B.; writing—original draft preparation, I.T.; writing—review and editing, A.S., A.B. and S.T.; visualization, T.B., A.K.; supervision, Mu.Zh. and R.T.; project administration, A.Kh.; funding acquisition, A.K. and A.L. All authors have read and agreed to the published version of the manuscript.

Funding

This research was funded by Science Committee of the Ministry of Science and Higher Education of the Republic of Kazakhstan, grant number BR21882241.

Data Availability Statement

The data presented in this study are available upon request from the corresponding author.

Acknowledgments

The authors are especially grateful to the staff of the laboratory of physical and chemical research methods.

Conflicts of Interest

The authors declare no conflicts of interest. The funders had no role in the design of the study; in the collection, analyses, or interpretation of data; in the writing of the manuscript; or in the decision to publish the results.

References

  1. Larki, I.; Zahedi, A.; Asadi, M.; Forootan, M.M.; Farajollahi, M.; Ahmadi, R.; Ahmadi, A. Mitigation approaches and techniques for combustion power plants flue gas emissions: A comprehensive review. Sci. Total Environ. 2023, 903, 166108. [Google Scholar] [CrossRef]
  2. Yalcin, S.; Konukman, A.E.Ş.; Midilli, A. A perspective on fossil fuel-based flue gas emission reduction technologies. Greenhouse Gases 2020, 10, 664–677. [Google Scholar] [CrossRef]
  3. Fu, L.R.Z.; Si, W.; Ma, Q.; Huang, W.; Liao, K.; Huang, Z.; Wang, Y.; Li, J.; Xu, P. Research progress on CO2 capture and utilization technology. J. CO2 Util. 2022, 66, 102260. [Google Scholar] [CrossRef]
  4. Madejski, P.; Chmiel, K.; Subramanian, N.; Kuś, T. Methods and techniques for CO2 capture: Review of potential solutions and applications in modern energy technologies. Energies 2022, 15, 887. [Google Scholar] [CrossRef]
  5. Zhang, J.; Xiao, P.; Li, G.; Webley, P.A. Effect of flue gas impurities on CO2 capture performance from flue gas at coal-fired power stations by vacuum swing adsorption. Energy Procedia 2009, 1, 1115–1122. [Google Scholar] [CrossRef]
  6. Majchrzak-Kucęba, I.; Wawrzyńczak, D.; Zdeb, J.; Smółka, W.; Zajchowski, A. Treatment of flue gas in a CO2 capture pilot plant for a commercial CFB boiler. Energies 2021, 2021 14, 2458. [Google Scholar] [CrossRef]
  7. Abbas, Z.; Mezher, T.; Abu-Zahra, M.R.M. CO2 purification. I. Purification requirement review and the selection of impurities deep removal technologies. Int. J. Greenhouse Gas Control 2013, 16, 324–334. [Google Scholar] [CrossRef]
  8. Kim, H.S.; Kim. H.J.; Kim. J.H.; Kim, J.H.; Kang, S.H.; Ryu, J.H.; Park, N.K.; Yun, D.S.; Bae, J.W. Noble-metal-based catalytic oxidation technology trends for volatile organic compound (VOC) removal. Catalysts 2022, 12, 63. [Google Scholar] [CrossRef]
  9. Feng, X.; Jiang, L.; Li, D.; Tian, S.; Zhu, X.; Wang, H.; He, C.; Li, K. Progress and key challenges in catalytic combustion of lean methane. J. Energy Chem. 2022, 75, 173–215. [Google Scholar] [CrossRef]
  10. Tang, Z.; Zhang, T.; Luo, D.; Wang, Y.; Hu, Z.; Yang, R.T. Catalytic combustion of methane: From mechanism and materials properties to catalytic performance. ACS Catal. 2022, 12, 13457–13474. [Google Scholar] [CrossRef]
  11. Golodets, G.I. Heterogenous catalytic reactions involving molecular oxygen. Stud. Sur. Sci. Catal. 1983, 15, 437–469. [Google Scholar]
  12. Tsyrul'nikov, P.G. Thermal activation effect on catalytic systems MnOx/Al2O3 for deep oxidation of hydrocarbons. Russ. J. Gen. Chem. 2007, 77, 2328–2336. [Google Scholar] [CrossRef]
  13. Wang, Q.; Peng, Y.; Fu, J.; Kyzas, G.Z.; Billah, S.M.R.; An, S. Synthesis, characterization, and catalytic evaluation of Co3O4/γ-Al2O3 as methane combustion catalysts: Significance of Co species and the redox cycle. Appl. Catal, B 2015, 168, 42–50. [Google Scholar] [CrossRef]
  14. Choya, A.; de Rivas, B.; Gutiérrez-Ortiz, J.I.; López-Fonseca, R. Comparative study of strategies for enhancing the performance of Co3O4/Al2O3 catalysts for lean methane combustion. Catalysts 2020, 10, 757. [Google Scholar] [CrossRef]
  15. Massenova, A.; Kalykberdiyev, M.; Sass, A.; Kenzin, N.; Ussenov, A.; Baiken, A.; Rakhmetova, K. Catalytic technologies for solving environmental problems in the production of fuels and motor transport in Kazakhstan. Catalysts 2020, 10, 1197. [Google Scholar] [CrossRef]
  16. Wang, H.Y.; Ruckenstein, E. Partial oxidation of methane to synthesis gas over alkaline earth metal oxide supported cobalt catalysts. J. Catal. 2001, 199, 309–317. [Google Scholar] [CrossRef]
  17. Choya, A.; de Rivas, B.; González-Velasco, J.R.; Gutiérrez-Ortiz, J.I.; López-Fonseca, R. On the beneficial effect of MgO promoter on the performance of Co3O4/Al2O3 catalysts for combustion of dilute methane. Appl. Catal., A 2019, 582, 117099. [Google Scholar] [CrossRef]
  18. Zhao, L.; Ji, S.; Yin, F.; Lu, Z.; Liu, H.; Li, C. Catalytic combustion of methane over Co1–xMgxO/Al2O3/FeCrAl monolithic catalysts. J. Nat. Gas. Chem. 2006, 15, 287–296. [Google Scholar] [CrossRef]
  19. Navrotsky, A.; Kleppa, O.J. The thermodynamics of cation distributions in simple spinels. J. Inorg. Nucl. Chem. 1967, 29, 2701–2714. [Google Scholar] [CrossRef]
  20. Kiselev, V.F.; Krylov, O.V. Adsorption and Catalysis on Transition Metals and Their Oxides; Springer–Verlag: Berlin, Germany, 1989; p. 445. ISBN 978-3-642-73887-6. [Google Scholar]
  21. Zhylkybek, M.; Khussain, B.; Sass, A.; Torlopov, I.; Baizhumanova, T.; Tungatarova, S.; Brodskiy, A.; Xanthopoulou, G.; Rakhmetova, K.; Sarsenova, R.; Kassymkan, K.; Aubakirov, Y. Cobalt–magnesium oxide catalysts for deep oxidation of hydrocarbons. Catalysts 2024, 14, 136. [Google Scholar] [CrossRef]
  22. Yagi, S.; Ichikawa, Y.; Yamada, I.; Doi, T.; Ichitsubo, T.; Matsubara, E. Synthesis of binary magnesium-transition metal oxides via inverse co-precipitation. Jap. J. Appl. Phys. 2013, 52, 025501. [Google Scholar] [CrossRef]
  23. Syeda, A.F.; Khan, M.N. Spin state of cobalt and electrical transport in MgCo2O4 system. J. Supercond. Nov. Magn. 2018, 31, 3545–3551. [Google Scholar] [CrossRef]
  24. Zigla, A.A.; Kox, T.; Mevoa, D.; Assaouka, H.T.; Nsangou, I.N.; Daawe, D.M.; Kenmoe, S.; Kouotou, P.M. Magnesium-modified Co3O4 catalyst with remarkable performance for toluene low temperature deep oxidation. Catalysts 2022, 12, 411. [Google Scholar] [CrossRef]
  25. Veselov, G.B.; Stoyanovskii, V.O.; Cherepanova, S.V.; Vedyagin, A.A. Sol–gel prepared Co–Mg–O oxide systems: Redox behavior, thermal stability and catalytic performance in CO oxidation. React. Kinet., Mech. Catal. 2023, 136, 233–250. [Google Scholar] [CrossRef]
  26. Robin, J. Recherches sur la constitution et la stabilité de quelques solutions solides a base d’oxyde de cobalt. Annales de Chimie, 12e série 1955, 10, 389–412. [Google Scholar]
  27. Busca, G.; Guidetti, R.; Lorenzelli, V. Fourier-transform infrared study of the surface properties of cobalt oxides. J. Chem. Soc., Faraday Trans. 1990, 86, 989–994. [Google Scholar] [CrossRef]
  28. Casas-Cabanas, M.; Binotto, G.; Larcher, D.; Lecup, A.; Giordani, V.; Tarascon, J.M. Defect chemistry and catalytic activity of nanosized Co3O4. Chem. Mater. 2009, 21, 1939–1947. [Google Scholar] [CrossRef]
  29. Raveau, B.; Seikh, M. Cobalt Oxides: From Crystal Chemistry to Physics; Wiley–VCH: Weinheim, Germany, 2012; p. 333. ISBN 978-3-527-64552-7. [Google Scholar]
  30. Peshev, P.; Toshev, A.; Gyurov, G. Preparation of high-dispersity MCo2O4 (M = Mg, Ni, Zn) spinels by thermal dissociation of coprecipitated oxalates. Mater. Res. Bull. 1989, 24, 33–40. [Google Scholar] [CrossRef]
  31. Krezhov, K.; Konstantinov, P. On the cationic distribution in MgxCo3–xO4 spinels. J. Phys. Condens. Matter. 1992, 4, L543–L548. [Google Scholar] [CrossRef]
  32. Aukrust, E.; Muan, A. Activities of components in oxide solid solutions: the systems CoO–MgO, CoO–MnO, and CoO–FeO at 1200 °C. Trans. Metall. Soc. AIME 1963, 227, 1378–1380. [Google Scholar]
  33. Cimino, A.; Lo Jacono, M.; Porta, P.; Valigi, M. Structural and magnetic investigations of oxide solid solutions. IV. Cobalt oxide in magnesium oxide. Z. Phys. Chem.: Neue Folge 1970, 70, 166–178. [Google Scholar] [CrossRef]
  34. Hagan, A.P.; Lofthouse, M.G.; Stone, F.S.; Trevethan, M.A. High surface area oxide solid solution catalyst. Stud. Surf. Sci. Catal. 1979, 3, 417–438. [Google Scholar]
  35. Ketchik, S.V.; Plyasova, L.M.; Chigrina, V.A.; Minyukova, T.P.; Yurieva, T.M. Phase transformation in the cupric magnesium oxide system. React. Kinet. Catal. Lett. 1980, 14, 135–140. [Google Scholar] [CrossRef]
  36. Litvak, G.S.; Minyukova, T.P.; Demeshkina, M.P.; Plyasova, L.M.; Yurieva, T.M. Physico-chemical studies of the temperature range for the formation of anion-modified oxides. React. Kinet. Catal. Lett. 1986, 31, 403–408. [Google Scholar] [CrossRef]
  37. Tang, C.W.; Wang, C.B.; Chien, S.H. Characterization of cobalt oxides studied by FT-IR, Raman, TPR and TG-MS. Thermoch. Acta 2008, 473, 68–73. [Google Scholar] [CrossRef]
  38. Nayak, S.; Dasari, K.; Joshi, D.C.; Pramanik, P.; Palai, R.; Sathe, V.; Chauhan, R.N.; Tiwari, N.; Thota, S. Spectroscopic studies of Co2TiO4 and Co3O4 two-phase composites. Phys. Status Solidi B 2016, 253, 2270–2282. [Google Scholar]
  39. Preudhomme, J.; Tarte, P. Infrared studies of spinels. III: The normal II–III spinels. Spectrochim. Acta, Part A 1971, 27, 1817–1835. [Google Scholar] [CrossRef]
  40. Li, Y.; Qiu, W.; Qin, F.; Fang, H.; Hadjiev, V.G.; Litvinov, D.; Bao, J. Identification of cobalt oxides with Raman scattering and Fourier transform infrared spectroscopy. J. Phys. Chem. C 2016, 120, 4511–4516. [Google Scholar] [CrossRef]
  41. Gielisse, P.J.; Plendl, J.N.; Mansur, L.C.; Marshall, R.; Mitra, S.S.; Mykolajewycz, R.; Smakula, A. Infrared properties of NiO and CoO and their mixed crystals. J. Appl. Phys. 1965, 36, 2446–2450. [Google Scholar] [CrossRef]
  42. Kant, C.; Rudolf, T.; Schrettle, F.; Mayr, F.; Deisenhofer, J.; Lunkenheimer, P.; Eremin, M.V.; Loidl, A. Optical spectroscopy in CoO: Phononic, electric, and magnetic excitation spectrum within the charge-transfer gap. Phys. Rev. B 2008, 78, 245103. [Google Scholar] [CrossRef]
  43. Angelov, S.; Zhecheva, E.; Stoyanova, R.; Atanasov, M. Bulk defects in Co3O4, pure and slightly doped with lithium, revealed by EPR of the tetrahedral Co2+ ions. J. Phys. Chem. Solids 1990, 51, 1157–1161. [Google Scholar] [CrossRef]
  44. Dutta, P.; Seehra, M.S.; Thota, S.; Kumar, J. A comparative study of the magnetic properties of bulk and nanocrystalline Co3O4. J. Phys. Condens. Matter 2008, 20, 015218. [Google Scholar] [CrossRef]
  45. Dyrek, K.; Sojka, Z. Coordination and dispersion of Co2+ ions in CoO–MgO solid solutions. J. Chem. Soc., Faraday Trans. 1 1982, 78, 3177–3185. [Google Scholar] [CrossRef]
  46. Gazzoli, D.; Occhiuzzi. M.; Cimino. A.; Cordischi, D.; Minelli, G.; Pinzari, F. XPS and EPR study of high and low surface area CoO-MgO solid solutions: Surface composition and Co2+ ion dispersion. J. Chem. Soc., Faraday Trans. 1996, 92, 4567–4574. [Google Scholar] [CrossRef]
  47. Querini, C.A.; Ulla, M.A.; Requejo, F.; Soria, J.; Sedrán, U.A.; Miró, E.E. Catalytic combustion of diesel soot particles. Activity and characterization of Co/MgO and Co, K/MgO catalysts. Appl. Catal., B, 1998, 15, P. 5-19.
  48. Zasada, F.; Janas, J.; Piskorz, W.; Gorczynska, M.; Sojka, Z. Total oxidation of lean methane over cobalt spinel nanocubes controlled by the self-adjusted redox state of the catalyst: experimental and theoretical account for interplay between the Langmuir–Hinshelwood and Mars–van Krevelen mechanisms. ACS Catal. 2017, 7, 2853–2867. [Google Scholar] [CrossRef]
  49. Mekhemer, G.A.; Rabee, A.I.; Gaid, C.B.; Zaki, M.I. Cobalt oxide-catalyzed CO oxidation under steady-state conditions: influence of the metal oxidation state. Colloids Surf., A 2023, 663, 130992. [Google Scholar] [CrossRef]
  50. Rabee, A.I.; Gaid, C.B.; Mekhemer, G.A.; Zaki, M.I. Combined TPR, XRD, and FTIR studies on the reduction behavior of Co3O4. Mater. Chem. Phys. 2022, 289, 126367. [Google Scholar] [CrossRef]
  51. Bulavchenko, O.A.; Cherepanova, S.V.; Malakhov, V.V.; Dovlitova, L.S.; Ishchenko, A.V.; Tsybulya, S.V. In situ XRD study of nanocrystalline cobalt oxide reduction. Kinet. Catal. 2009, 50, 192–198. [Google Scholar] [CrossRef]
  52. Atlas of Thermoanalytical Curves; ed. G. Liptay; Akadémiai Kiadó: Budapest, Hungary, 1974; Volume 3, p. 160. ISBN 963-05-0216-X.
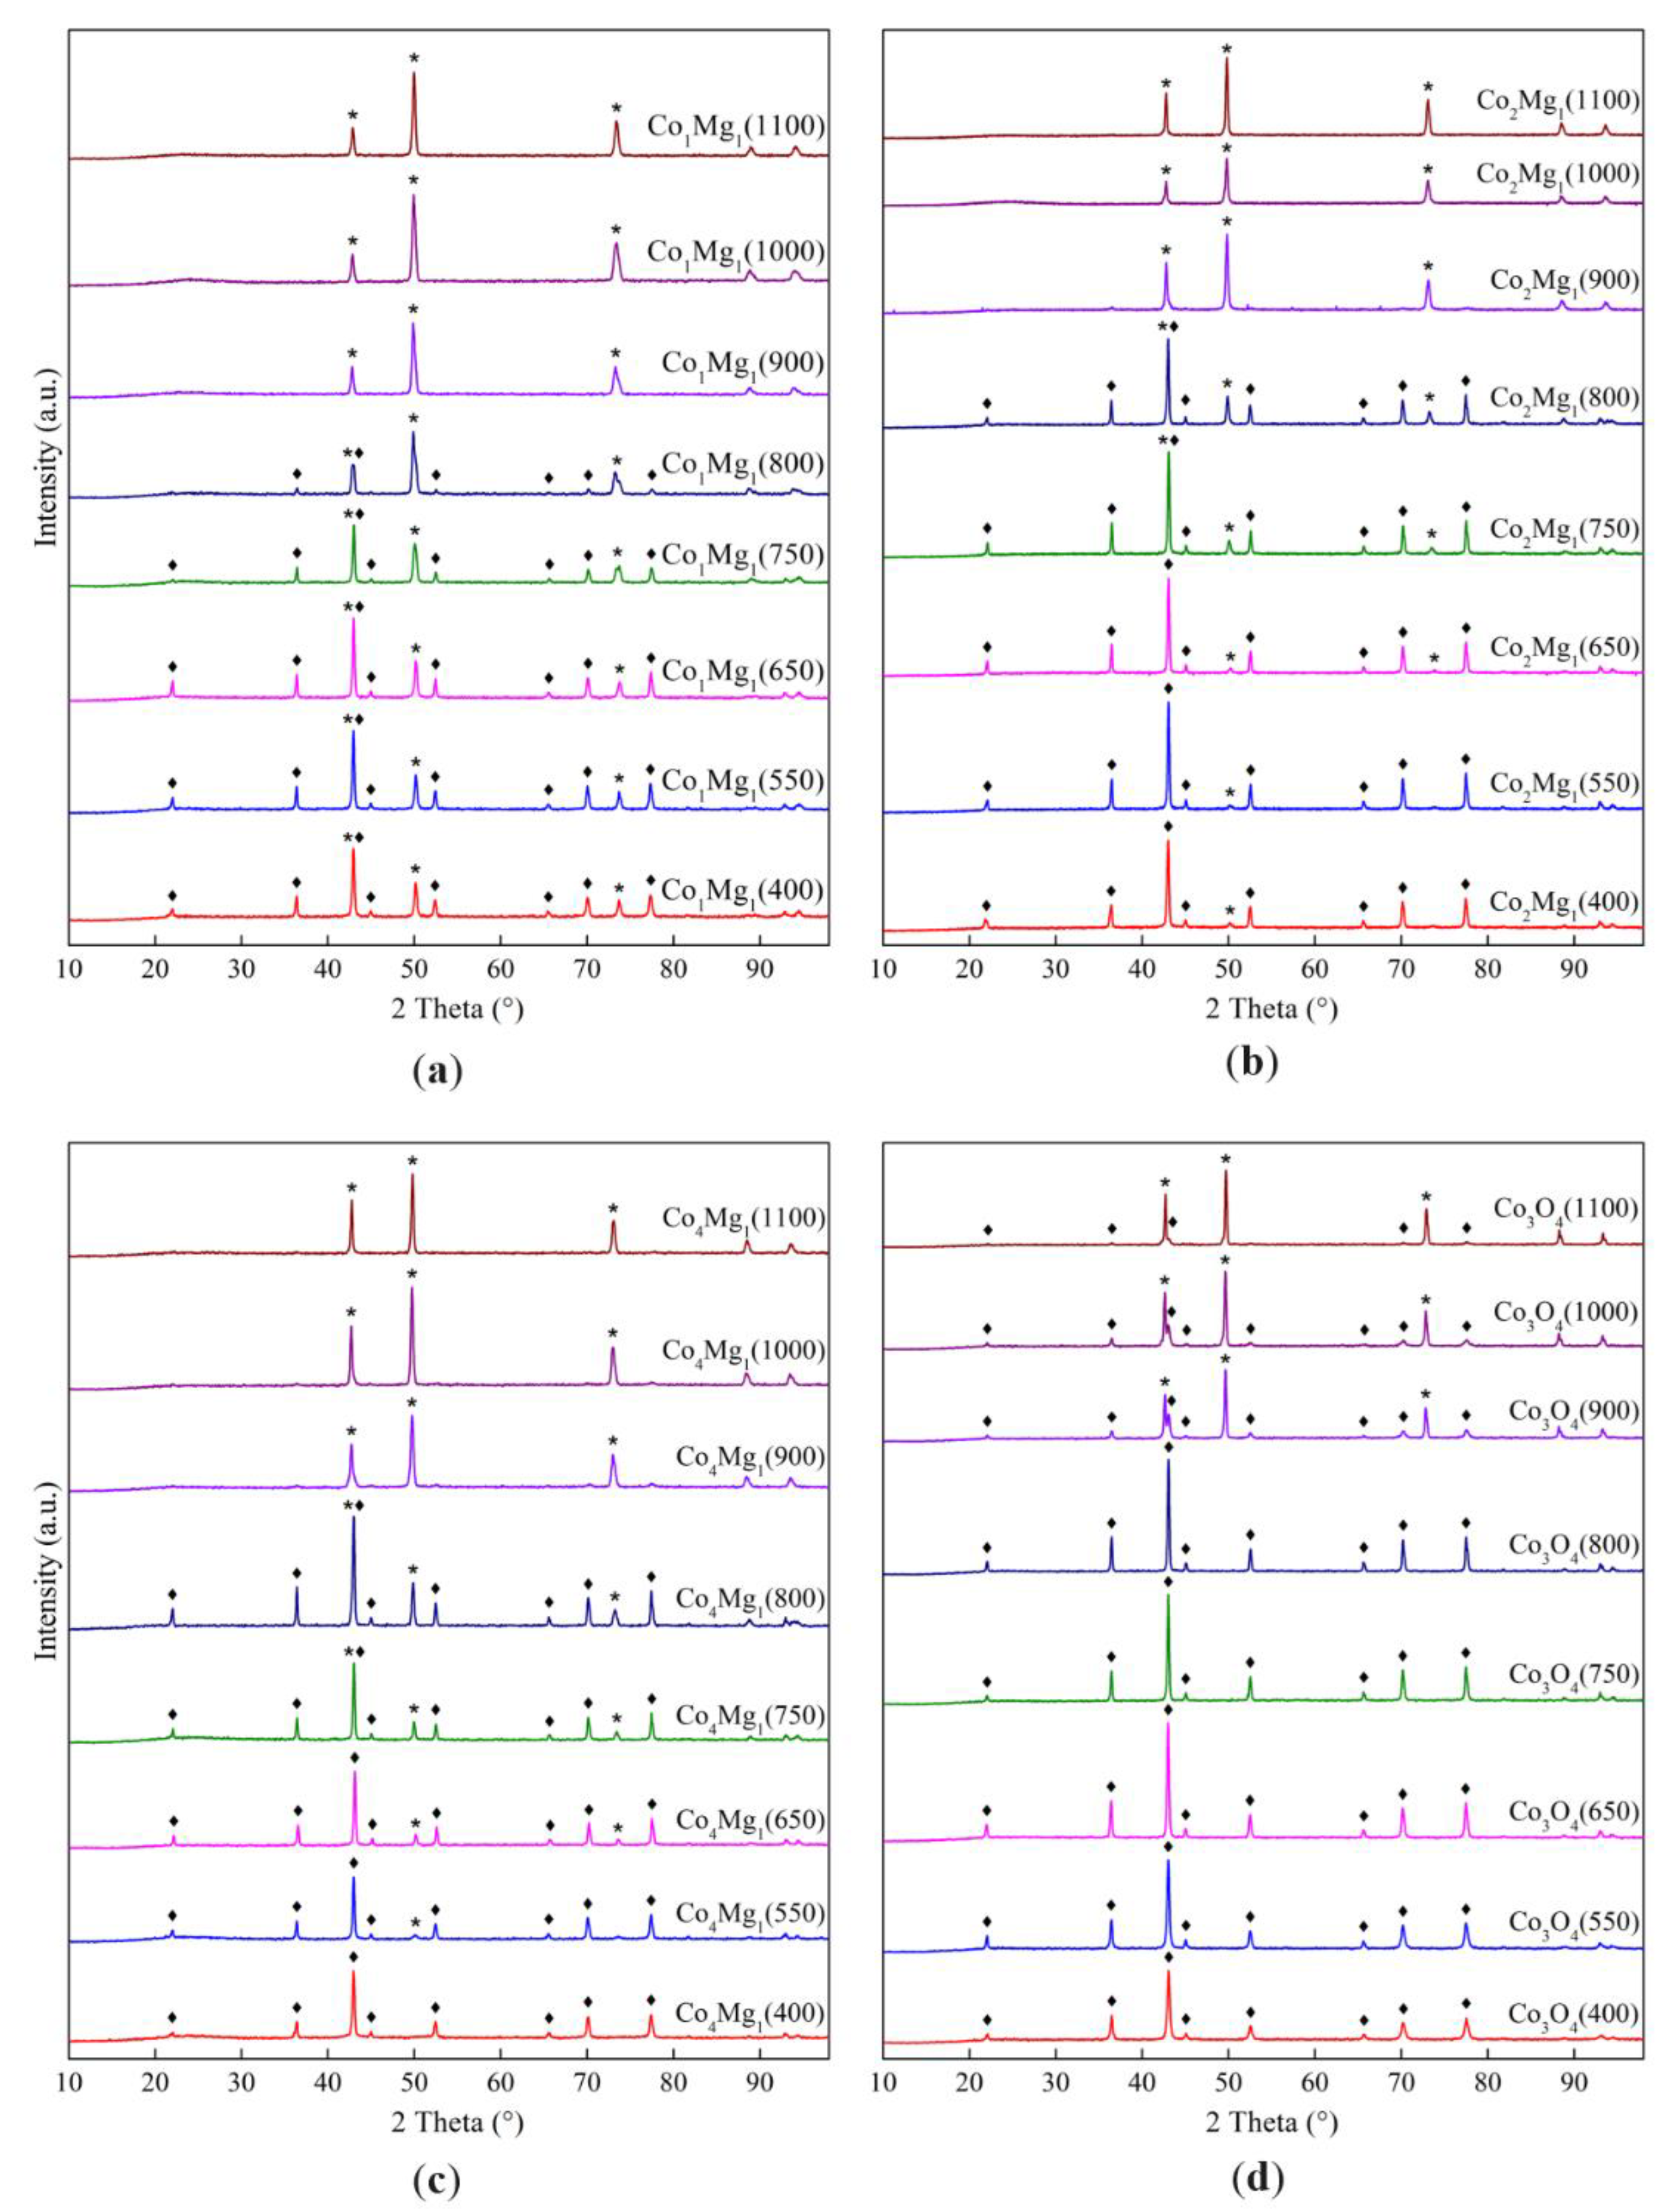
Figure 1. X-ray diffraction patterns of samples with different ratios of Co and Mg, calcined at different temperatures: (a) Co1Mg1 series, (b) Co2Mg1 series, (c) Co4Mg1 series, (d) Co3O4 series; ♦ – MgCo2O4 or Co3O4 spinel, * – (Co, Mg)O).
Preprints 108530 g001
Figure 2. Average lattice parameters of spinel (a) and rocksalt (b) phases of Co–Mg samples as function of temperature: Preprints 108530 i001– Co1Mg1, Preprints 108530 i002– Co2Mg1, Preprints 108530 i003– Co4Mg1, Preprints 108530 i004– Co3O4.
Preprints 108530 g002
Figure 3. Lattice parameter values of the rocksalt phase calculated from the diffraction maxima of 2.12 and 1.50 Å as function of the composition of samples: Preprints 108530 i002– calcined at 550 °С, Preprints 108530 i003– calcined at 800 °С, Preprints 108530 i001– calcined at 1100 °С.
Preprints 108530 g003
Figure 4. Average values of c.s.d. of the spinel (a) and rocksalt phases (b) of Co–Mg samples as functions of the heat treatment temperature: Preprints 108530 i001– Co1Mg1, Preprints 108530 i002– Co2Mg1, Preprints 108530 i003– Co4Mg1, Preprints 108530 i004– Co3O4.
Preprints 108530 g004
Figure 5. SEM microphotographs of the Co4Mg1 samples: (a), (d) – Co4Mg1 (750); (b), (e) – Co4Mg1 (1100); (c), (f) – Co4Mg1 (1100+750); (a), (b), (c) – magnification 5000; (d), (e), (f) – magnification 1000).
Preprints 108530 g005
Figure 6. SEM microphotographs of the Co3O4 samples: (a), (d) – Co3O4 (750); (b), (e) – Co3O4 (1100); (c), (f) – Co3O4 (1100+750); (a), (b), (c) – magnification 5000; (d), (e), (f) – magnification 1000).
Preprints 108530 g006
Figure 7. IR spectra of Co3O4 and Co–Mg samples with different Co:Mg ratio, calcined at different temperatures: (a) Co1Mg1 series, (b) Co2Mg1 series, (c) Co4Mg1 series, (d) Co3O4 series.
Preprints 108530 g007
Figure 8. The average position of the key a.b. as function of the composition of samples: Preprints 108530 i001– ν1 a.b. of samples calcined at 400–800 °C, Preprints 108530 i002– ν2 a.b. of samples calcined at 400–800 °C, Preprints 108530 i003– Mg–O a.b. of samples calcined at 900–1100 °C.
Preprints 108530 g008
Figure 9. Relative the ESR signal intensity of Сo2+Td ions as function of the of heat treatment temperature of the samples of various compositions: Preprints 108530 i001– Co1Mg1, Preprints 108530 i002– Co2Mg1, Preprints 108530 i003– Co4Mg1, Preprints 108530 i004– Co3O4.
Preprints 108530 g009
Figure 10. TPR profiles of synthesized samples at different heat treatment temperatures: (a) Co1Mg1 series, (b) Co2Mg1 series, (c) Co4Mg1 series, (d) Co3O4 series.
Preprints 108530 g010
Figure 11. SEM microphotographs of Co3O4: (a), (d) – before TPR; (b), (e) – after TPR to 430 °С; (c), (f) – after TPR to 1100 °С; (a), (b), (c) – magnification 5000; (d), (e), (f) – magnification 1000).
Preprints 108530 g011
Figure 12. Diffraction patterns of Co3O4 calcined at 550 °С: (a) original, (b) after TPR to 380 °С, (c) after TPR to 380 °С, (d) after TPD to 1100 °С, (e) after TPR to 1100 °С; ♦ – Co3O4, * – CoO, ○ – β-Co0.
Preprints 108530 g012
Figure 13. Thermal desorption profiles of Co3O4 samples at different heat treatment temperatures.
Preprints 108530 g013
Figure 14. Diffraction patterns of Co3O4 и Co–Mg samples calcined at 1100 °С before and after reoxidation at 750 °С.
Preprints 108530 g014
Figure 15. FTIR-spectra of Co3O4 и Co–Mg samples calcined at 1100 °С before and after reoxidation at 750 °С.
Preprints 108530 g015
Figure 16. TPR profiles of Co3O4 и Co–Mg samples calcined at 1100 °С before and after reoxidation at 750 °С.
Preprints 108530 g016
Table 1. Lattice parameters of Co–Mg phases for samples calcined at different temperatures.
Sample Lattice parameter (Å)
Co1Mg1 Co2Mg1 Co4Mg1 Co3O4
Co-Mg(400) 8.106 / 4.229 8.095 / 4.226 8.100 / – 8.089 / –
Co-Mg(550) 8.104 / 4.220 8.091 / 4.223 8.100 / 4.229 8.092 / –
Co-Mg(650) 8.101 / 4.221 8.087 / 4.222 8.097 / 4.222 8.090 / –
Co-Mg(750) 8.094 / 4.229 8.085 / 4.228 8.093 / 4.230 8.091 / –
Co-Mg(800) 8.095 / 4.242 8.093 / 4.243 8.097 / 4.242 8.088 / –
Co-Mg(900) – / 4.242 8.091 / 4.249 8.098 / 4.255 8.088 / 4.263
Co-Mg(1000) – / 4.240 – / 4.251 8.097 / 4.256 8.086 / 4.264
Co-Mg(1100) – / 4.237 – / 4.249 – / 4.252 8.076 / 4.259
Table 2. Absorption bands (a.b.) positions on the IR spectra of Co3O4 and Co–Mg samples with different Co:Mg ratio, calcined at different temperatures.
Temperature (oC) a.b. Co1Mg1 (cm–1) a.b. Co2Mg1 (cm–1) a.b. Co4Mg1 (cm–1) a.b. Co3O4 (cm–1)
400 486, (553), 649 569, 661, (712) (553), 572, 664 575, 665
550 479, 555, 653 571, 665 (548), 572, 667 576, 667
650 478, 562, 655 (437), 573, 665 550, 573, 666 (558), 578, 667
750 449, (565), 658 (431), 567, (652), 663 448, 550, 574, 665 (557), 578, (589), 667, (670)
800 449, (657) 436, (552), 573, (643), 665 439, (550), 573, 665 555, 579, (587), 668
900 460, (504) 426, 562, 663 428, 565, 664 571, 664
1000 447 424, 557, 662 433, 564, 663 570, 664
1100 445 436, 557, 662 423, 561, 661 568, 664
Table 3. Relative ESR signal of the samples as function on the Co:Mg ratio and heat treatment temperature.
Heat treatment temperature (°C) Ratio of signal and reference intensities at a given Co:Mg ratio
Co1Mg1 Co2Mg1 Co4Mg1 Co3O4
400 2.11 1.35 0.77 9.02
550 2.37 1.46 1.19 9.88
650 2.78 1.51 1.25 12.64
750 3.03 1.56 1.31 17.70
800 2.70 0.88 1.29 13.34
900 1.53 0.58 0.68 3.63
1000 1.65 0.49 0.62 2.38
1100 2.91 0.51 0.64 0.93
Table 4. Thermal desorption characteristics of Co3O4 samples at different heat treatment temperatures.
Sample Desorption peak temperature (°C) Volume of O2 released in the temperature range (μmol/g)
1 2 3 1 2 3
Co3O4(400) 197 680 873 3.711 32.14 2074.69
Co3O4(550) 201 667 862 1.325 2.76 2073.68
Co3O4(650) 257 657 854 0.802 0.90 2047.98
Co3O4(750) 254 863 0.758 2092.33
Co3O4(800) 270 869 0.979 2076.39
Co3O4(900) 284 837 0.629 801.73
Co3O4(1000) 273 842, 871 0.139 634.01
Co3O4(1100) 263 805 0.115 240.26
Disclaimer/Publisher’s Note: The statements, opinions and data contained in all publications are solely those of the individual author(s) and contributor(s) and not of MDPI and/or the editor(s). MDPI and/or the editor(s) disclaim responsibility for any injury to people or property resulting from any ideas, methods, instructions or products referred to in the content.
Copyright: This open access article is published under a Creative Commons CC BY 4.0 license, which permit the free download, distribution, and reuse, provided that the author and preprint are cited in any reuse.
Prerpints.org logo

Preprints.org is a free preprint server supported by MDPI in Basel, Switzerland.

Subscribe

© 2024 MDPI (Basel, Switzerland) unless otherwise stated