Submitted:
05 June 2024
Posted:
07 June 2024
You are already at the latest version
Abstract

Keywords:
1. Introduction
- ·
- method of resonant mechanical spectroscopy – excitation in samples of cyclic elastic deformation with an amplitude of ~10-7, caused by short segments of dislocation strings (dislocation relaxers), which oscillate with amplitudes on the order of the lattice parameter;
- ·
- method of active deformation, when used, significant plastic deformations of ~3·10-1 are achieved, caused by the translational movement of extended dislocations over macroscopic distances.
2. Materials and Methods of Research
3. Experimental Results
3.1. Acoustic Properties
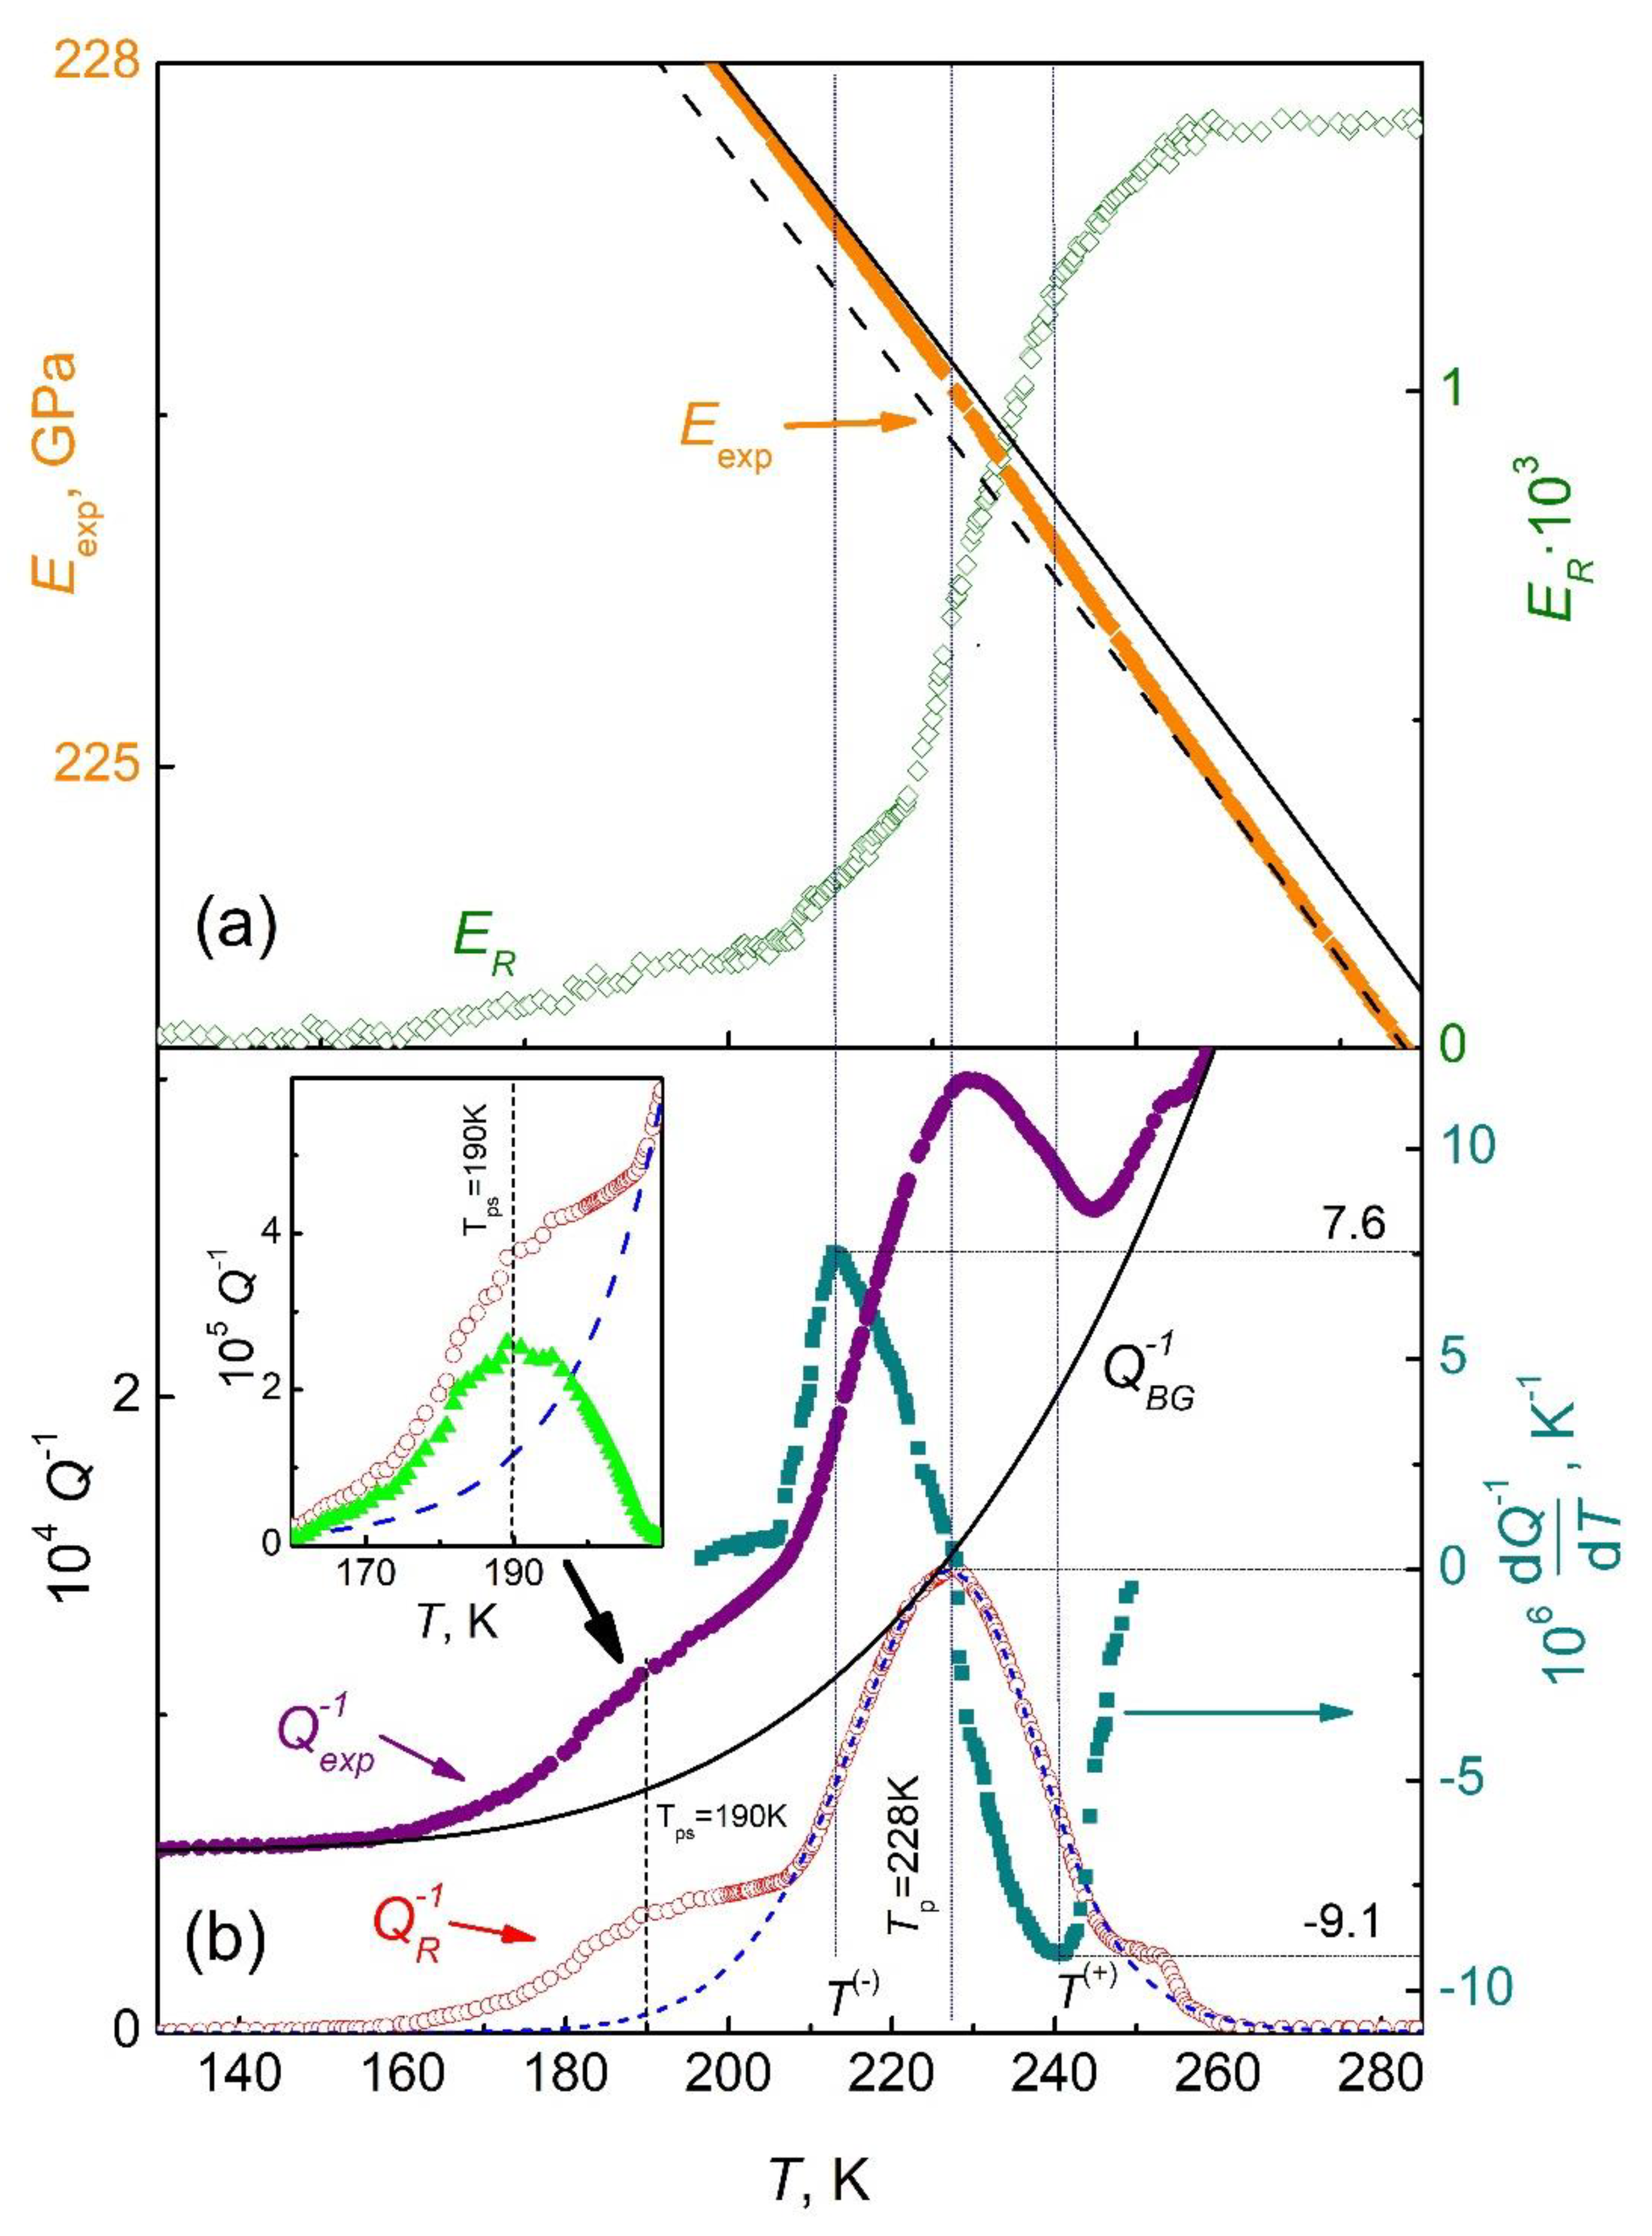
| А1 | А2 | ||||||
| 3.34·103 s-1 | 236 GPa | 3.5·10-4 K-1 | 160 К | 0.33 GPa | 6·10-5 | 0.3 | 0.16 eV |

| (a) | ||||||||||||
| 228 K | 213 K | 242 K | 1.5·10-4 | 7.6·10-6 K-1 | -9.1·10-6 K-1 | 0.83 | ||||||
| (b) | ||||||||||||
| 190 K | 182.6 K | 202.0 K | 2.64·10-5 | 3.1·10-6 K-1 | -2.5·10-6 K-1 | 1.24 | ||||||
3.2. Mechanical Properties
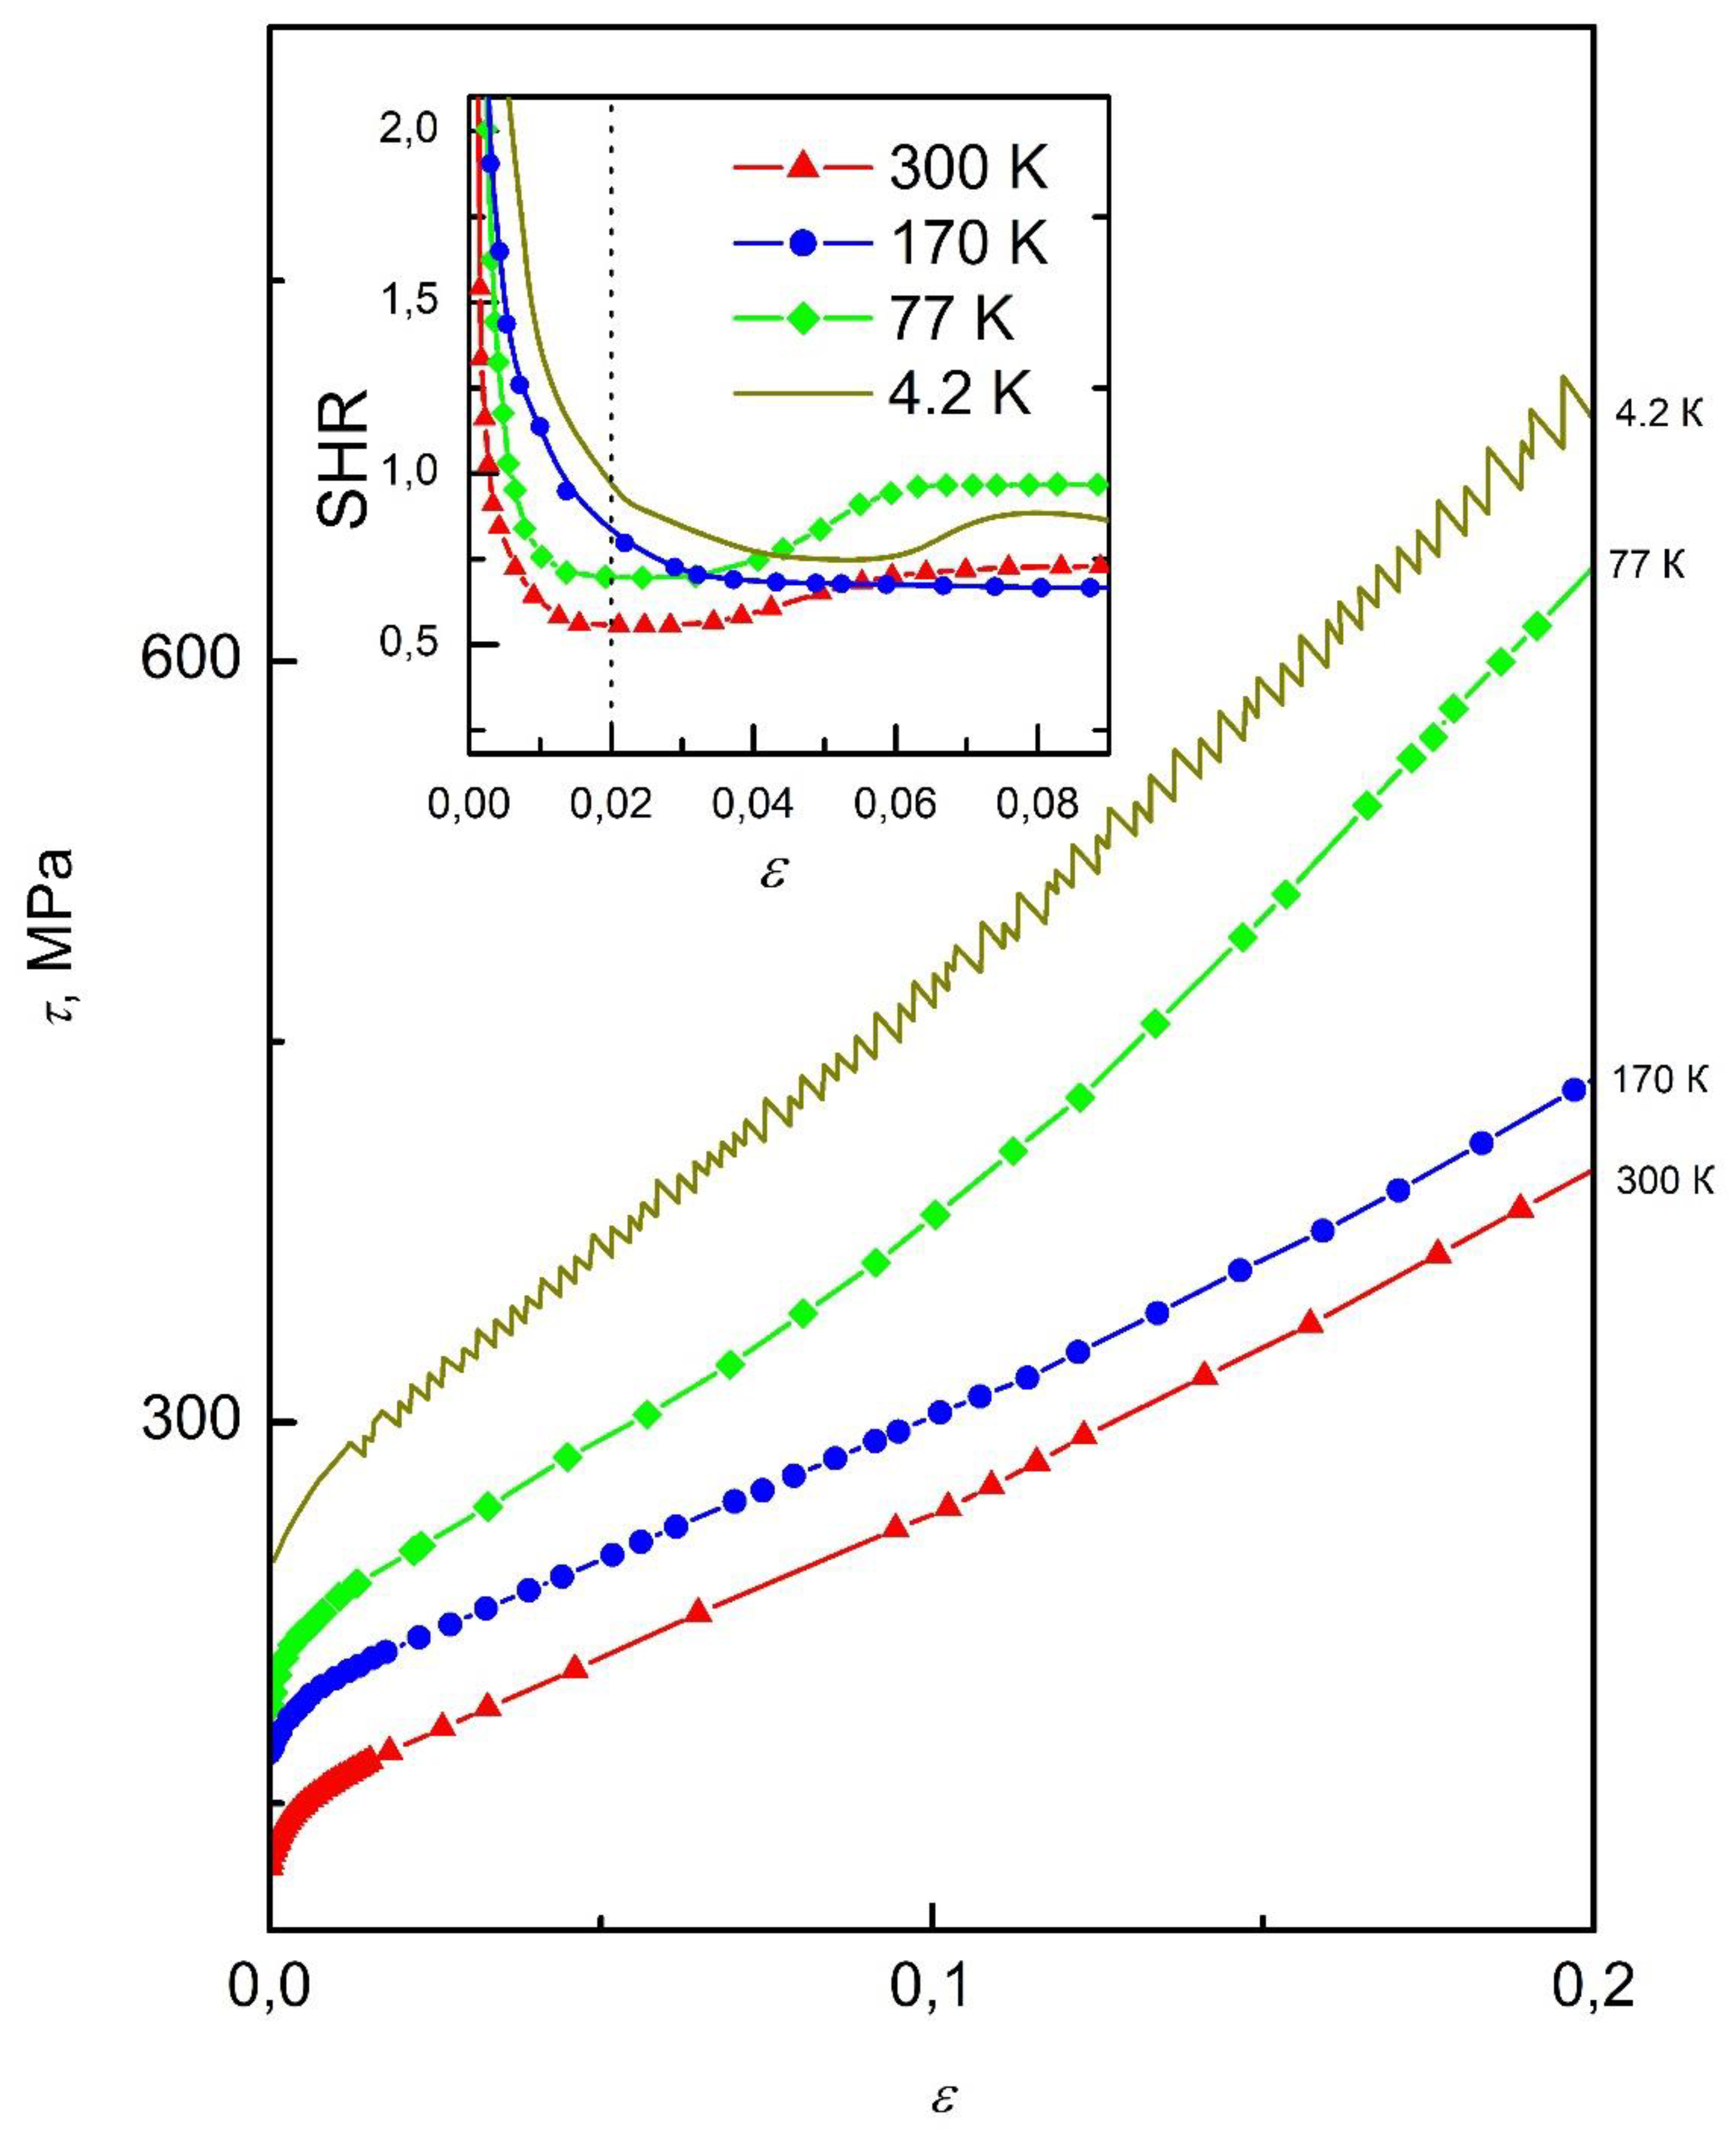
4. Low Temperature Dislocation Processes in HEA Al0.5CoCrCuFeNi
4.1. Models of Dislocation Relaxers
4.2. Thermal Activation and Statistical Analysis of the Dislocation Contribution to Acoustic Relaxation
- for Seeger relaxers
- for Koiwa-Hasiguti relaxers
- in [24] it is shown that these processes correspond to different values of the ratio of the peak height to the step height on the temperature-frequency dependences of the contributions of these relaxation processes to the internal friction and dynamic elasticity of materials:
- in [28] it was established that the parameter determined by relation (7) does not depend on temperature and , and its frequency dependence is described by monotonic functions , while:
4.3. Dislocation Mechanism of the Internal Friction Peak (Analogue of the Hasiguti Peak)
4.4. Dislocation Mechanism of Internal Friction Peak (Analogue of Bordoni Peak)
4.5. Dislocation Processes of Low-Temperature Plastic Deformation
4.6. Low-Temperature Plasticity of the Studied Alloy
5. Conclusion
- ·
- the most important types of dislocation defects in the lattice structure of the alloy;
- ·
- types of barriers that prevent the movement of dislocation lines (strings);
- ·
- adequate mechanisms of thermally activated movement of various elements of dislocation strings through barriers under conditions of moderate and deep cooling;
- ·
- quantitative estimates for the most important characteristics of dislocations and their interaction with barriers.
References
- Yeh, J.; Chen, S.; Lin, S.; Gan, J.; Chin, T.; Shun, T.; Tsau, C.; Chang, S. Nanostructured High-Entropy Alloys with Multiple Principal Elements: Novel Alloy Design Concepts and Outcomes Adv. Eng. Mater. 2004, 6, 299–303. [Google Scholar] [CrossRef]
- Cantor, B.; Chang, I.T.H.; Knight, P.; Vincent, A.J.B. Microstructural development in equi-atomic multicomponent alloys Mater. Sci. Eng. A 2004, 375-377, 213-218. [CrossRef]
- Cantor, B. Multicomponent high-entropy Cantor alloys. Prog. Mater. Sci. 2021, 120, 100754. [Google Scholar] [CrossRef]
- Kao, Y.F.; Chen, T.J.; Chen, S.K.; Yeh, J.W. Microstructure and mechanical property of as-cast, homogenized and deformed AlxCoCrFeNi (0 ≤ x ≤ 2) high-entropy alloys. J. Alloys Compd. 2009, 488, 57–64. [Google Scholar] [CrossRef]
- Tabachnikova, E.D.; Podolskiy, A.V.; Laktionova, M.O.; Bereznaia, N.A.; Tikhonovsky, M.A.; Tortika, A.S. Mechanical properties of the CoCrFeNiMnVx high entropy alloys in temperature range 4.2–300 K. J. Alloys Compd. 2017, 698, 501–509. [Google Scholar] [CrossRef]
- Gludovatz, B.; Ritchie, R.O. Fracture properties of high-entropy alloys. MRS Bulletin 2022, 47, 176–185. [Google Scholar] [CrossRef]
- Chen, S.; Oh, H.S.; Gludovatz, B.; Kim, S.J.; Park, E.S.; Zhang, Z.; Ritchie, R.O.; Yu, Q. Real-time observations of TRIP-induced ultrahigh strain hardening in a dual-phase CrMnFeCoNi high-entropy alloy. Nat. Commun. 2020, 11, 826. [Google Scholar] [CrossRef]
- Pogrebnjak, A.D.; Yakushchenko, I.V.; Bagdasaryan, A.A.; Bondar, O.V.; Krause-Rehberg, R.; Abadias, G.; Chartier, P.; Oyoshi, K.; Takeda, Y.; Beresnev, V.M.; Sobol, O.V. Microstructure, physical and chemical properties of nanostructured (Ti–Hf–Zr–V–Nb) N coatings under different deposition conditions. Mater. Chem. Phys, 2014, 147, 1079–1091. [Google Scholar] [CrossRef]
- Laktionova, M.A.; Tabchnikova, E.D.; Tang, Z.; Liaw, P.K. Mechanical properties of the high-entropy alloy Al0.5CoCrCuFeNi at temperatures of 4.2–300 K. Low Temp. Phys. 2013, 39, 630–632. [Google Scholar] [CrossRef]
- Moon, J.; Tabachnikova, E.; Shumilin, S.; Hryhorova, T.; Estrin, Y.; Brechtl, J.; Liaw, P.; Wang, W.; Dahmen, K.A.; Kim, H.S. Unraveling the discontinuous plastic flow of a Co-Cr-Fe-Ni-Mo multiprincipal-element alloy at deep cryogenic temperatures. Phys. Rev. Materials. 2021, 5, 083601. [Google Scholar] [CrossRef]
- Heczel, A.; Kawasaki, M.; Lábár, J.L.; Jang, J.-il; Langdon, T.G.; Gubicza. Defect structure and hardness in nanocrystalline CoCrFeMnNi high-entropy alloy processed by high-pressure torsion. Alloys Compd. 2017, 711, 143–154. [Google Scholar] [CrossRef]
- Naeem, M.; He, H.; Zhang, F.; Huang, H.; Harjo, S.; Kawasaki, T.; Wang, B.; Lan, S.; Wu, Z.; Wang, F.; Wu, Y.; Lu, Z.; Zhang, Z.; Liu, C.T.; Wang, X.-L. Cooperative deformation in high-entropy alloys at ultralow temperatures Sci. Adv. 2020, 6, eaax4002. [Google Scholar] [CrossRef]
- Tabachnikova, E.; Hryhorova, T.; Shumilin, S.; Semerenko, Y.; Huang, Y.; Langdon, T. Cryo-severe plastic deformation, microstructures and properties of metallic nanomaterials at low temperatures. Mater Trans. 2023, 64, 1806–1819. [Google Scholar] [CrossRef]
- Liu, X.; Ding, H.; Huang, Y.; Bai, X.; Zhang, Q.; Zhang, H.; Langdon, T.G.; Cui, J. Evidence for a phase transition in an AlCrFe2Ni2 high entropy alloy processed by high-pressure torsion. J. Alloys Compd. 2021, 867, 159063. [Google Scholar] [CrossRef]
- Levenets, A.V.; Rusakova, H.V.; Fomenko, L.S.; Huang, Y.; Kolodiy, I.V.; Vasilenko, R.L.; Tabachnikova, E.D.; Tikhonovsky, M.A.; Langdon, T.G. Structure and low-temperature micromechanical properties of as-cast and SPD-processed high-entropy Co25–xCr25Fe25Ni25Cx alloys. Low Temp. Phys. 2022, 48, 560–569. [Google Scholar] [CrossRef]
- Lee, D.H.; Choi, I.C.; Seok, M.Y.; He, J.; Lu, Z.; Suh, J.-Y.; Kawasaki, M.; Langdon, T.G.; Jang, J.-il. Nanomechanical behavior and structural stability of a nanocrystalline CoCrFeNiMn high-entropy alloy processed by high-pressure torsion J. Mater. Res. 2015, 30, 2804–2815. [Google Scholar] [CrossRef]
- Moon, J.; Qi, Y.; Tabachnikova, E.; Estrin, Yu.; Choi, W.-Mi.; Joo, S.-H.; Lee, B.-J.; Podolskiy, A.; Tikhonovsky, M.; Kim, H.S. Microstructure and Mechanical Properties of High-Entropy Alloy Co20Cr26Fe20Mn20Ni14 Processed by High-Pressure Torsion at 77 K and 300 K. Sci. Rep. 2018, 8, 11074. [Google Scholar] [CrossRef]
- Tirunilai, A.S.; Hanemann, T.; Reinhart, C.; Tschan, V.; Weiss, K.-P.; Laplanche, G.; Freudenberger, J. Comparison of cryogenic deformation of the concentrated solid solutions CoCrFeMnNi, CoCrNi and CoNi. Mater. Sci. Eng. A. 2020, 783, 139290. [Google Scholar] [CrossRef]
- Rusakova, A.V.; Fomenko, L.S.; Smirnov, S.N.; Podolskiy, A.V.; Shapovalov, Y.O.; Tabachnikova, E.D.; Tikhonovsky, M.A.; Levenets, A.V.; Zehetbauer, M.J.; Schafler, E. Low temperature micromechanical properties of nanocrystalline CoCrFeNiMn high entropy alloy. Mater. Sci. Eng. A 2021, 828, 142116. [Google Scholar] [CrossRef]
- Podolskiy, A.V.; Schafler, E.; Tabachnikova, E.D.; Tikhonovsky, M.A.; Zehetbauer, M.J. Thermally activated deformation of nanocrystalline and coarse grained CoCrFeNiMn high entropy alloy in the temperature range 4. 2–350 K Low Temp. Phys. 2018, 44, 976–982. [Google Scholar] [CrossRef]
- Tabachnikova, E.D.; Laktionova, M.A.; Semerenko, Yu.A.; Shumilin, S.E.; Podolskiy, A.V.; Tikhonovsky, M.A.; Miskuf, J.; Csach, K. Mechanical properties of the high-entropy alloy Al0.5CoCrCuFeNi in various structural states at temperatures of 0.5–300 K. Low Temp. Phys. 2017, 43, 1108–1118. [Google Scholar] [CrossRef]
- Semerenko, Yu.A.; Natsik, V.D. Low temperature peak of internal friction in high entropy Al0.5CoCrCuFeNi alloy. Low Temp. Phys. 2020, 46, 78–86. [Google Scholar] [CrossRef]
- Pickering, E.J.; Stone, H.J.; Jones, N.G. Fine-scale precipitation in the high-entropy alloy Al0.5CrFeCoNiCu. Mat. Sci. Eng. A 2015, 645, 65–71. [Google Scholar] [CrossRef]
- Natsik, V.D.; Semerenko, Yu.A. Dislocation mechanisms of low-temperature acoustic relaxation in iron. Low Temp. Phys. 2019, 45, 551–567. [Google Scholar] [CrossRef]
- Varshni, Y.P. Temperature Dependence of the Elastic Constants. Phys. Rev. B2 1970, 3952. [Google Scholar] [CrossRef]
- Girifalco, L.A. Statistical Physics of Materials; Wiley: New York, NY, 1973; p. 362. [Google Scholar]
- Schoeck, G.; Bisogni, E.; Shyne, J. The activation energy of high temperature internal friction. Acta Metall. 1964, 12, 1466–1468. [Google Scholar] [CrossRef]
- Natsik, V.D.; Semerenko, Yu.A. Dislocation mechanisms of low-temperature internal friction in nanostructured materials. Low Temp. Phys. 2016, 42, 138–148. [Google Scholar] [CrossRef]
- Asgari, S.; El-Danaf, E.; Kalidindi, S.R.; Doherty, R.D. Strain hardening regimes and microstructural evolution during large strain compression of low stacking fault energy fcc alloys that form deformation twins. Metall. Mater. Trans. A 1997, 28, 1781–1795. [Google Scholar] [CrossRef]
- Evans, A.; Rawlings, R. The thermally activated deformation of crystalline materials. Physica Status Solidi, 1969, 34, 9–31. [Google Scholar] [CrossRef]
- Niblett, D.H. Bordoni Peak in Face-Centered Cubic Metals. In Ed.: Mason, W.P. Physical Acoustics: Principles and Methods. Volume III, Part A. The Effect of Imperfections; Academic Press: New York, NY, 1966; p. 428. [Google Scholar]
- Chambers, R. Dislocation relaxations in Base-Centered Cubic Transition Metals. In Ed.: Mason, W.P. Physical Acoustics, Volume III, Part A; Academic Press: New York, NY, 1964; p. 428. [Google Scholar]
- Bordoni, P.G. Elastic and anelastic behavior of some metals at very low temperatures. Journ. Acoust. Soc. Amer. 1954, 26, 495–502. [Google Scholar] [CrossRef]
- Postnikov, V.S. Internal Friction in Metals and Alloys, 1st ed.; Springer: New York, NY, 1967; p. 226. [Google Scholar]
- Seeger, A. On the theory of the low-temperature internal friction peak observed in metals. Phyl. Mag. 1956, 1, 651–662. [Google Scholar] [CrossRef]
- Seeger, A.; Schiller, P. Kinks in Dislocation Lines and theit Effects on the Internal Friction in Crystals. In Ed.: Mason, W.P. Physical Acoustics, Volume III, Part A; Academic Press: New York, NY, 1964; p. 428. [Google Scholar]
- Seeger, A.; Wüthrich, C. Dislocation relaxation processes in body-centred cubic metals. Nuovo Cimento B, 1976, 33, 38–75. [Google Scholar] [CrossRef]
- Friedel, J. Dislocations; Pergamon Press: Oxford, 1964; p. 491. [Google Scholar]
- Anderson, P.M.; Hirth, J.P.; Lothe, J. Theory of Dislocations, 3rd ed.; Cambridge University Press: Cambridge, 2017; p. 699. [Google Scholar]
- Koiwa, M.; Hasiguti, R.R. A theory of internal friction peak due to thermal unpinning of dislocations and its application to P1 peak in copper. Acta Met. 1965, 13, 1219–1230. [Google Scholar] [CrossRef]
- Fitzgerald, S.P. Kink pair production and dislocation motion. Sci. Rep. 2016, 6, 39708. [Google Scholar] [CrossRef] [PubMed]
- Utt, D.; Lee, S.; Xing, Y.; Jeong, H.; Stukowski, A.; Oh, S.H.; Dehm, G.; Albe, K. The origin of jerky dislocation motion in high-entropy alloys. Nat. Commun. 2022, 13, 4777. [Google Scholar] [CrossRef] [PubMed]
- Pustovalov, V.V.; Fomenko, V.S. Plastic deformation of crystals at low temperatures. Naukova Dumka; Kiev 2012; p. 356.
- Moskalenko, V.A.; Natsik, V.D.; Kovaleva, V.N. The role of Peierls relief in the low-temperature plasticity of pure α-Ti. Low Temp. Phys. 2005, 31, 907–914. [Google Scholar] [CrossRef]
- Kocks, U.F.; Argon, A.S.; Ashby, M.F. Thermodynamics and Kinetics of Slip, 1st ed.; Progress in Materials Science; Pergamon Press: Oxford, 1975; p. 288. [Google Scholar]
- Schwarz, B.; Isaac, R.D.; Granato, A.V. Dislocation Inertial Effects in the Plastic Deformation of Dilute Alloys of Lead and Copper. Phys. Rew. Lett. 1977, 38, 554–557. [Google Scholar] [CrossRef]
- Isaev, N.V.; Natsik, V.D.; Pustovalov, V.V.; Fomenko, V.S.; Shumilin, S.E. Low-temperature plasticity of Pb–Bi alloys: the role of thermal activation and inertial effects. Low Temp. Phys. 1998, 24, 593–601. [Google Scholar] [CrossRef]
- Schwarz, B.; Labusch, R.J. Dynamic simulation of solution hardening. J. Appl. Phys. 1978, 49, 5174–5187. [Google Scholar] [CrossRef]
- Bulatov, O.S.; Klochko, V.S.; Korniyets, A.V.; Kolodiy, I.V.; Kondratov, O.O.; Tikhonovska, T.M. Low temperature elastic properties of Al0.5CoCrCuFeNi high-entropy alloy. Funct. Mater. 2021, 28, 492–496. [Google Scholar] [CrossRef]
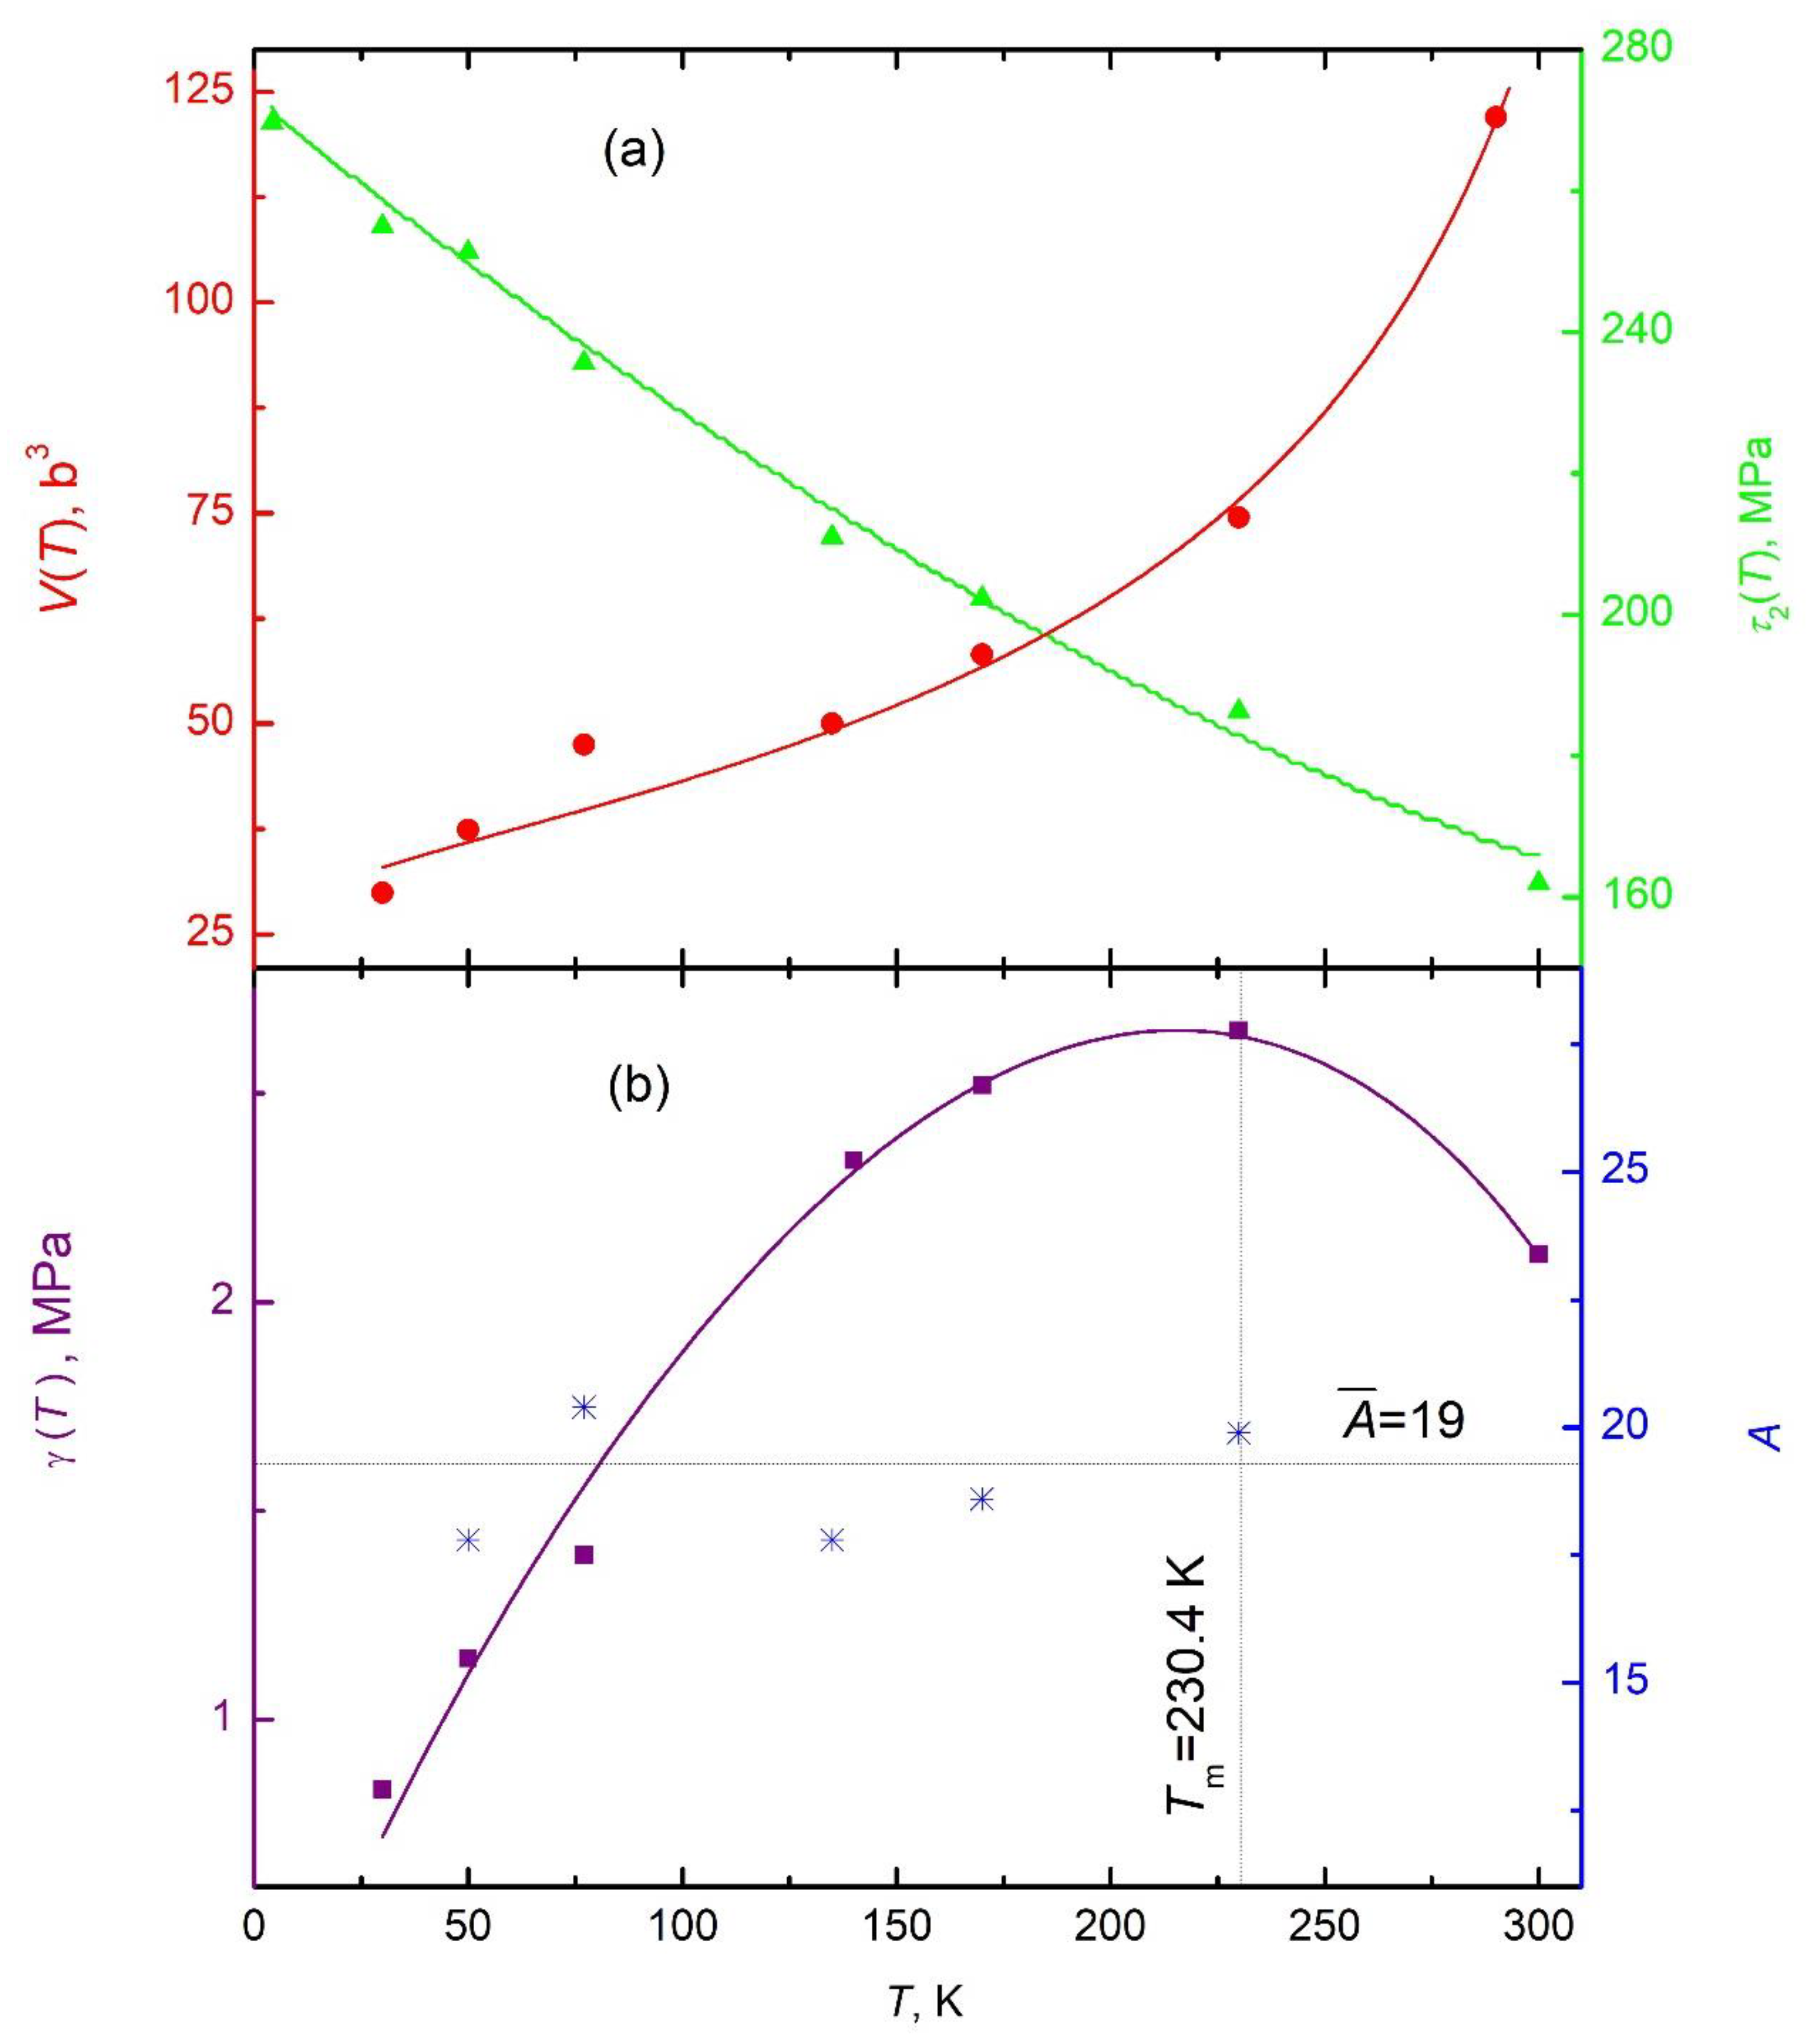

| 2·10-13 s | 0.43 eV | 0.01 eV | 4·10-4 | 4·10-11 s | 0.07eV | 0.01 eV | 1·10-4 |
| , МPа | , МPа | , eV | , K | |||
| 0.6 | 1.1 | 170 | 104 | 0.65 | 400 | 19 |
Disclaimer/Publisher’s Note: The statements, opinions and data contained in all publications are solely those of the individual author(s) and contributor(s) and not of MDPI and/or the editor(s). MDPI and/or the editor(s) disclaim responsibility for any injury to people or property resulting from any ideas, methods, instructions or products referred to in the content. |
© 2024 by the authors. Licensee MDPI, Basel, Switzerland. This article is an open access article distributed under the terms and conditions of the Creative Commons Attribution (CC BY) license (https://creativecommons.org/licenses/by/4.0/).


