1. Introduction
Mitochondria, as essential energy-supplying organelles, has played the crucial roles in many cellular processes, including central metabolism, signal transduction, and cell apoptosis [
1]. In cellular systems, mitochondrial viscosity was regarded as a crucial parameter for assessing mitochondrial function, because it was closely associated with the mitochondrial respiratory state [
2]. Nevertheless, the high level of mitochondrial viscosity would cause mitochondrial swelling and cellular dysfunction, thereby inducing atherosclerosis, diabetes, cell malignancy, and even cancer [
3,
4]. Meanwhile, hypochlorite (ClO
−), as a highly reactive oxygen species (ROS), was mainly produced in mitochondria by the peroxidation of hydrogen peroxide (H
2O
2) with chloride ion (Cl−) under the catalysis of myeloperoxidase (MPO) [
5]. Mitochondrial ClO
− played the key roles in fighting against external pathogens and regulating the redox homeostasis [
6]. However, the excessive ClO
− level could lead to oxidative stress and DNA damage, which would cause some inflammatory diseases, cystic fibrosis, diabetes, and neurodegenerative disease [
7,
8]. It was worth noting that during the oxidative stress stimulation, the diffusion of ClO
− was closely related to the cellular viscosity [
8]. Therefore, the simultaneous detection of ClO
− and viscosity in mitochondria will be particularly useful for the corresponding biological research and the disease clinical diagnosis.
Fluorescence imaging technology has became a powerful tool for biological system monitoring, mainly due to the advantages of simple operation, high spatiotemporal resolution, and noninvasive detection [
9]. At present, numerous fluorescent probes have been reported for the independent detection of ClO
− [
10,
11,
12,
13,
14,
15,
16,
17] (
Table S1), or viscosity [
18,
19,
20,
21,
22,
23,
24] (
Table S2). However, many of these probes were severely hydrophobic, as a result, required to use a large amount of toxic organic co-solvents [
10,
11,
13,
14,
16,
17]. Meanwhile, some probes lacked the mitochondrial-targeting function [
10,
11,
12,
13,
16,
17,
18,
19,
21,
23], and needed a long response time (several minutes) [
10,
12,
15,
16,
17]. Obviously, the above problems would seriously hinder the biological applicability of these reported probes. Furthermore, the fluorescent probes for the simultaneous detection of ClO
− and viscosity have been rarely reported [
25,
26,
27,
28] (
Table S3). For difunctional fluorescent probes, they could shorten detection time, reduce tool synthesis costs, and simplify testing procedures. More importantly, the difunctional fluorescent probes were able to effectively avoid the fluorescence interference caused by the combination of two different probes in the complex physiological environments [
29]. Unfortunately, the reported difunctional probes for ClO
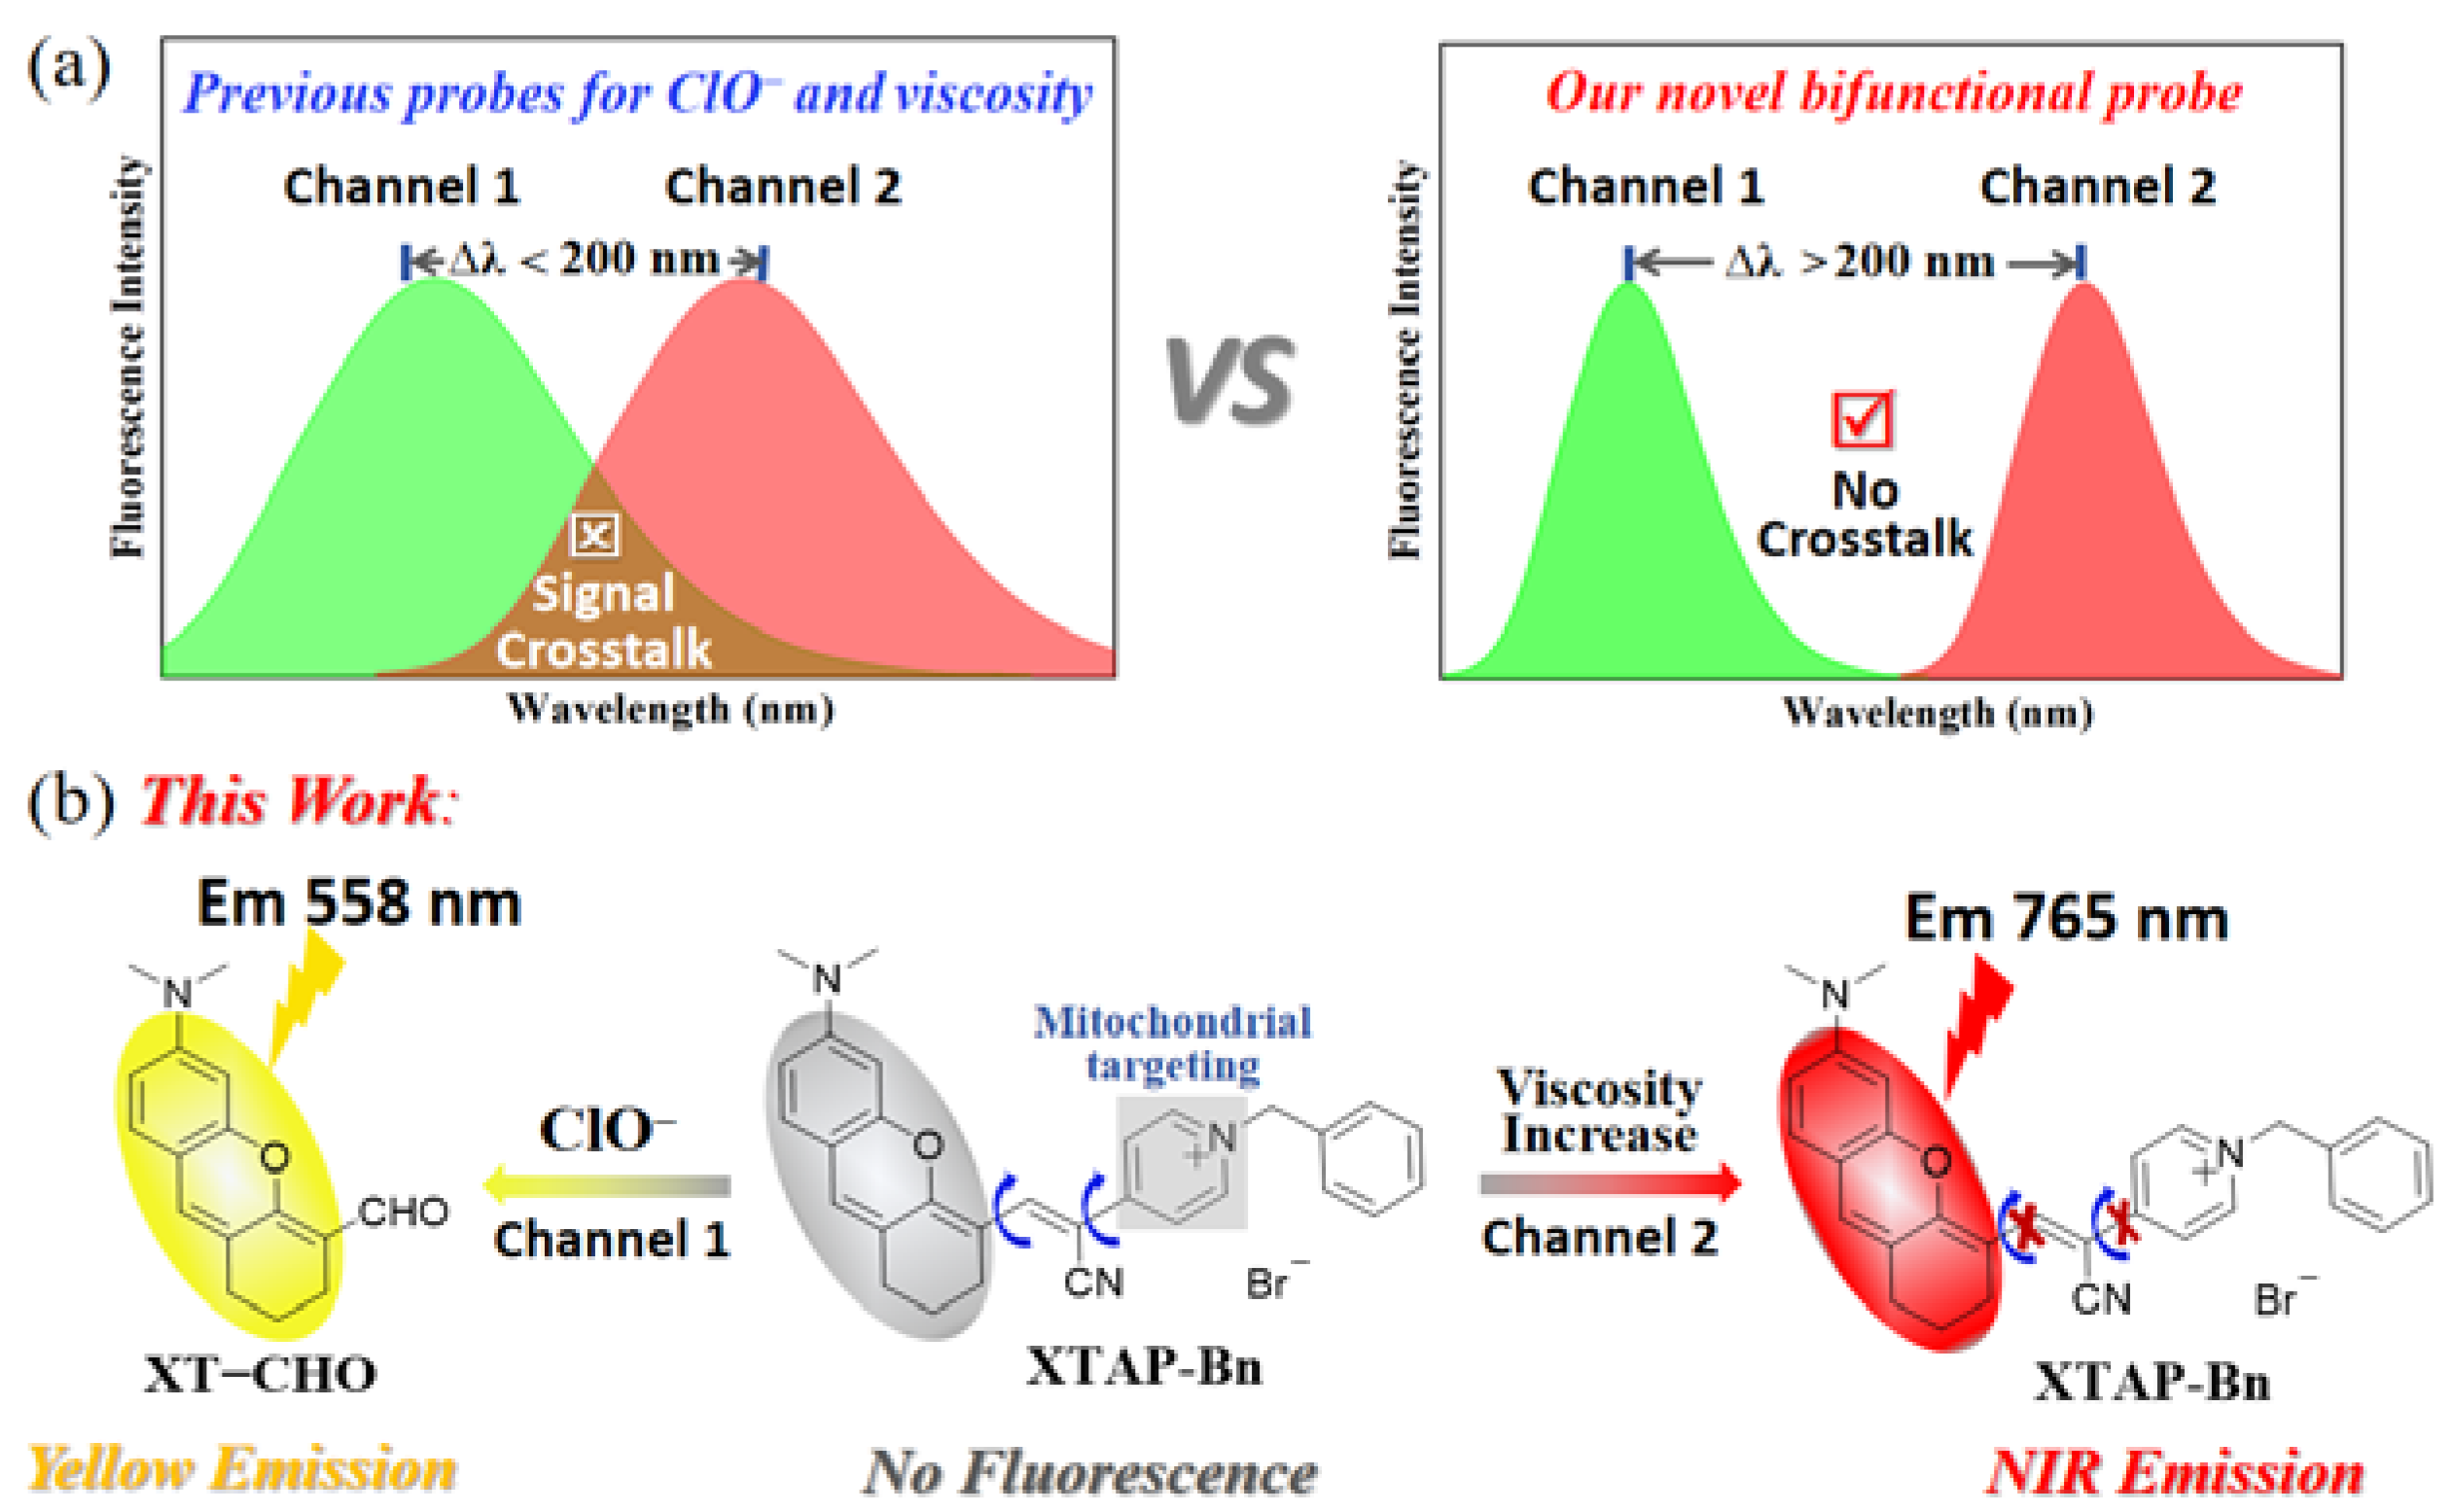
− and viscosity generally suffered from the problem of signal crosstalk during the detection due to the insufficient difference of emission wavelength, which would result in the false positive signals and erroneous judgment (
Scheme 1a). To overcome signal crosstalk, the fluorescence wavelength difference (Δλ) between two channels of an ideal difunctional probes should be larger than 200 nm, which was twice the half width of regular fluorescence peak [
30]. Taken together, it is of great significance to explore a water-soluble fluorescent probe for the fast and simultaneous detection of ClO
− and viscosity in mitochondria without signal crosstalk.
Herein, we have explored a novel difunctional fluorescent probe
XTAP−
Bn, which could monitor ClO
− and viscosity at two emission channels without signal crosstalk (
Scheme 1b). Probe
XTAP−
Bn was designed based a typical D−π−A structure, in which the C=C bond (π linker) bridged the xanthene (
XT) skeleton (electron donor, D) and the acrylonitrile-pyridinium (
AP) moiety (electron acceptor, A). For
XTAP−
Bn, its D-π-A structure provided the intramolecular rotors, which caused the fluorescence quenching in PBS buffer. While increasing viscosity, the intramolecular rotation of
XTAP−
Bn was inhibited, thereby resulting in a bright NIR emission (λem = 765 nm). Meanwhile, the C=C bond of
XTAP−
Bn could be specifically oxidized by ClO
−, which produced the fluorophore
XT−
CHO and released an intense yellow emission (λ
em = 558 nm). Given the huge wavelength gap (Δλ = 207 nm),
XTAP−
Bn could effectively eliminate the signal crosstalk during the simultaneous detection of ClO
− and viscosity. In addition, probe
XTAP−
Bn responded to ClO
− rapidly (within 12 s), selectively, and exhibited high sensitivity to viscosity. Owing to the excellent mitochondria-targeting ability,
XTAP−
Bn could simultaneously detect ClO
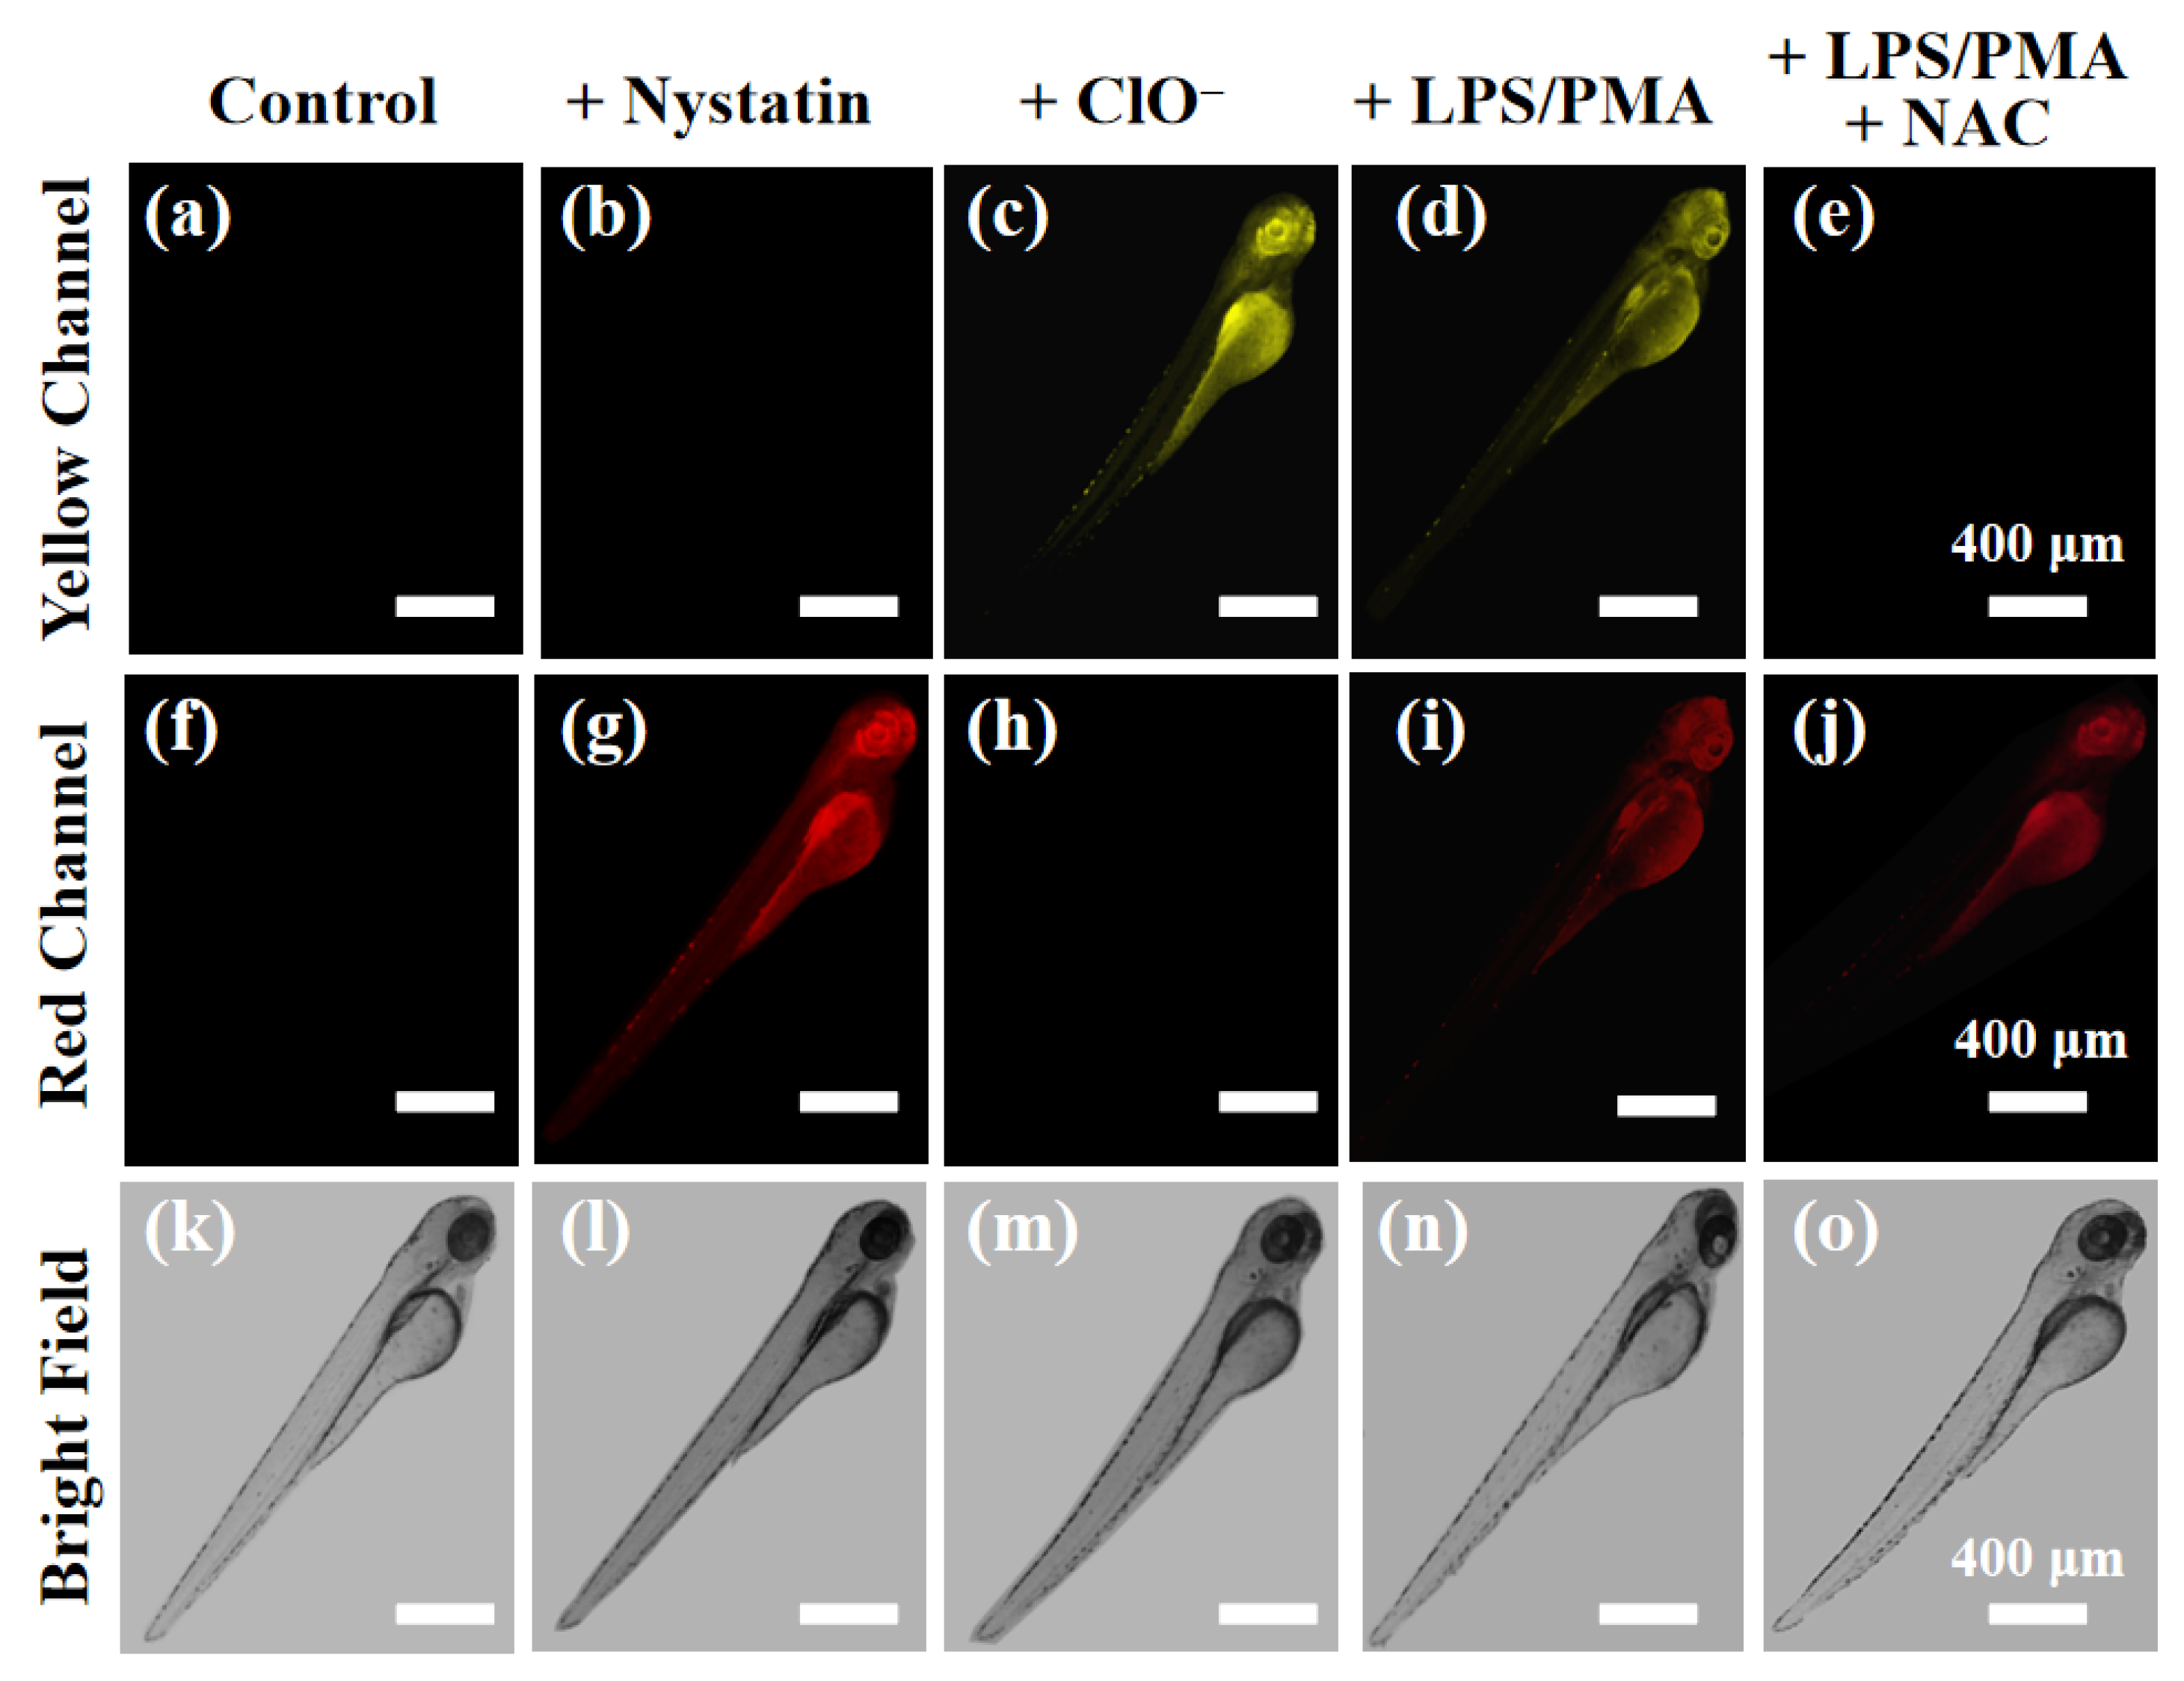
− and viscosity in mitochondria of living cells. More importantly, probe
XTAP−
Bn was successfully employed to monitor the dynamic change of ClO
− and viscosity levels in zebrafish, indicating its excellent applicability in
vivo.
3. Materials and Methods
3.1. Materials and Instruments
Unless otherwise stated, all chemicals were purchased from commercial suppliers and used without further purification. Double-distilled water and chromatographic solvents were used for fluorescence tests. The preparation of various active oxygen species (ROS), some biomolecules, and some common anions was described as follows: (a) ONOO–: The stirred solution of NaNO2 (0.6 M, 10 mL) and H2O2 (0.7 M, 10 mL) in deionized H2O was added HCl (0.6 M, 10 mL) at 0 oC, immediately followed by the rapid addition of NaOH (1.5 M, 20 mL). Excess hydrogen peroxide was removed by MnO2. The concentration of ONOO– was determined by UV analysis with the extinction coefficient at 302 nm (ε= 1670 M−1 cm−1), and solution was stored at -20 oC for use; (b) •OH: To a solution of H2O2 (10.0 mM, 1.0 mL) in PBS (10 mM, pH 7.4) was added FeSO4 solution (10.0 mM, 0.1 mL) at room temperature to get the 1 mM stock solution; (c) 1O2: The solution of NaMoO4 (10 mM) and H2O2 (10 mM) was prepared in PBS (10 mM, pH = 7.4) respectively, and mixed the equal aliquots of these solutions to afford the 5 mM stock solution of 1O2; (d) H2O2, Cys (cysteine), GSH (glutathione), Hcy (Homocysteine), and the sodium salts of ClO−, CO32−, H2PO4− , S2− , SO32− were purchased directly from the company, and then diluted with PBS (10 mM, pH = 7.4) to make the 10 mM stock solutions.
For the instruments, a Bruker AV-400 spectrometer was employed to record 1H NMR and 13C NMR spectra. High-resolution mass spectra (HRMS) were obtained with a Thermo Scientific Q Exactive type mass spectrometer. Melting points were taken on with SGW X-4 instrument (Shanghai, China). Elemental Analysis was performed by Elementar Vario EL instrument (Germany). Absorption spectra were determined on TU-1901 UV−vis spectrometer. Fluorescence spectra were collected by Hitachi F-4500 fluorescence spectrometer. The fluorescence images of living cells and zebrafish larva were conducted by Zeiss LSMS880 confocal laser scanning microscope (Germany).
3.2. Synthesis of Compound XTAP
Compound
XT−
CHO was firstly synthesized according to the reported method [
31]. After that, compound
XT−
CHO (1.02 g, 4.00 mmol) and 4-pyridineacetonitrile (0.54 g, 4.80 mmol) were dissolved in 16 mL ethanol, and then 1 mL piperidine was added into the solution. This mixture was reacted at 70 ℃ for 10 h under N
2 atmosphere. After cooling to room temperature, the mixture was concentrated using rotary evaporators, and the remaining solid was purified by column chromatography (DCM/CH
3OH as eluent, v/v = 8:1). The final product
XTAP was obtained as a dark red solid (0.98 g, 69% yield). m.p. 186.8-188.2 °C.
1H NMR (400 MHz, DMSO-
d6):
δ (ppm) 8.58-8.59 (m, 2H, Pyridyl H), 8.23 (s, 1H, vinyl H), 7.57 (d,
J = 4.8 Hz, 2H, Pyridyl H), 7.16 (d,
J = 8.8 Hz, 1H, -ArH), 6.88 (s, 1H, -ArH), 6.71 (s, 1H, -ArH), 6.54-6.57 (m, 1H, -ArH), 3.00 (m, 6H, -(CH
3)
2), 2.89 (t,
J = 5.6 Hz, 2H, -CH
2), 2.53-2.59 (m, 2H, -CH
2), 1.75 (t,
J = 5.6 Hz, 2H, -CH
2);
13C NMR (100 MHz, DMSO-
d6):
δ (ppm) 155.94, 153.94, 150.17, 150.12, 143.41, 138.06, 128.12, 127.51, 123.22, 118.81, 110.54, 108.71, 107.79,97.72, 44.58, 29.82, 25.63, 22.02. HRMS (ESI
+, m/z): Calcd for C
23H
21N
3O [M+H]
+, 356.17629; found, 356.17624. Elemental analysis calcd (%) for C
23H
21N
3O: C, 77.72; H, 5.96; O, 4.50; N, 11.82. Found: C, 77.45; H, 5.28; O, 4.88; N, 12.38.
3.3. Synthesis of Probe XTAP−Bn
Compound XTAP (0.71 g, 2.00 mmol) and (bromomethyl)benzene (0.51 g, 3.00 mmol) were dissolved in 6 mL dry ethanol, and the mixture was then refluxed under N2 atmosphere overnight. After cooling to room temperature, the mixture was concentrated using rotary evaporators, and the obtained residue was then purified using a neutral aluminum oxide column (DCM/CH3OH as eluent, v/v = 10:1). The final product XTAP−Bn was obtained as a dark purple solid (0.78 g, 74% yield). m.p. 221.6-222.4 °C. 1H NMR (400 MHz, DMSO-d6): δ (ppm) 8.72 (d, J = 6.4 Hz, 2H, Pyridyl H), 8.43 (s, 1H, vinyl H), 7.98 (d, J = 6.8 Hz, 2H, Pyridyl H), 7.41-7.50 (m, 7H, -ArH), 6.96 (s, 1H, -ArH), 6.82-6.84 (m, 1H, -ArH), 5.64 (s, 2H, -CH2), 3.09 (s, 6H, -(CH3)2), 2.92-2.94 (m, 2H, -CH2), 2.66-2.75 (m, 2H, -CH2), 1.82-1.84 (m, 2H, -CH2); 13C NMR (100 MHz, DMSO-d6): δ (ppm) 162.04, 155.07, 153.18, 151.19, 142.74, 139.01, 136.18, 135.05, 129.20, 125.59, 121.52, 119.08, 111.93, 111.30, 110.77, 99.51, 97.12, 67.40, 46.08, 28.53, 25.80, 20.53. HRMS (ESI+, m/z): calcd for C30H28N3O [M-Br]+ 446.22269, found 446.22267. Elemental analysis calcd (%) for C30H28BrN3O: C, 68.44; H, 5.36; N, 7.98; O, 3.04. Found: C, 69.10; H, 4.88; N, 7.72; O, 2.86.
3.4. Optical Study
For viscosity response, probe
XTAP−
Bn (5 μL, 3 mM in DMSO) was added into 3.0 mL of different viscosity solutions (water/glycerol mixtures with different volume ratios), and the spectra were tested at 20 °C after shaking well. For ClO
− detection, the stock solutions of probe
XTAP−
Bn (5 μM) were prepared in PBS buffer (10 mM, pH 7.4), and the stock solutions of various ROS (ONOO
–, •OH,
1O
2, H
2O
2), some biomolecules (cysteine, Homocysteine, glutathione) and some common anions (CO
32−, H
2PO
4−, S
2−, SO
32−) were prepared as shown in
Section 3.3. Unless otherwise stated, all the spectra were recorded at 30 °C for 15 s after treating with any analyte.
3.5. Calculation of the Detection Limit
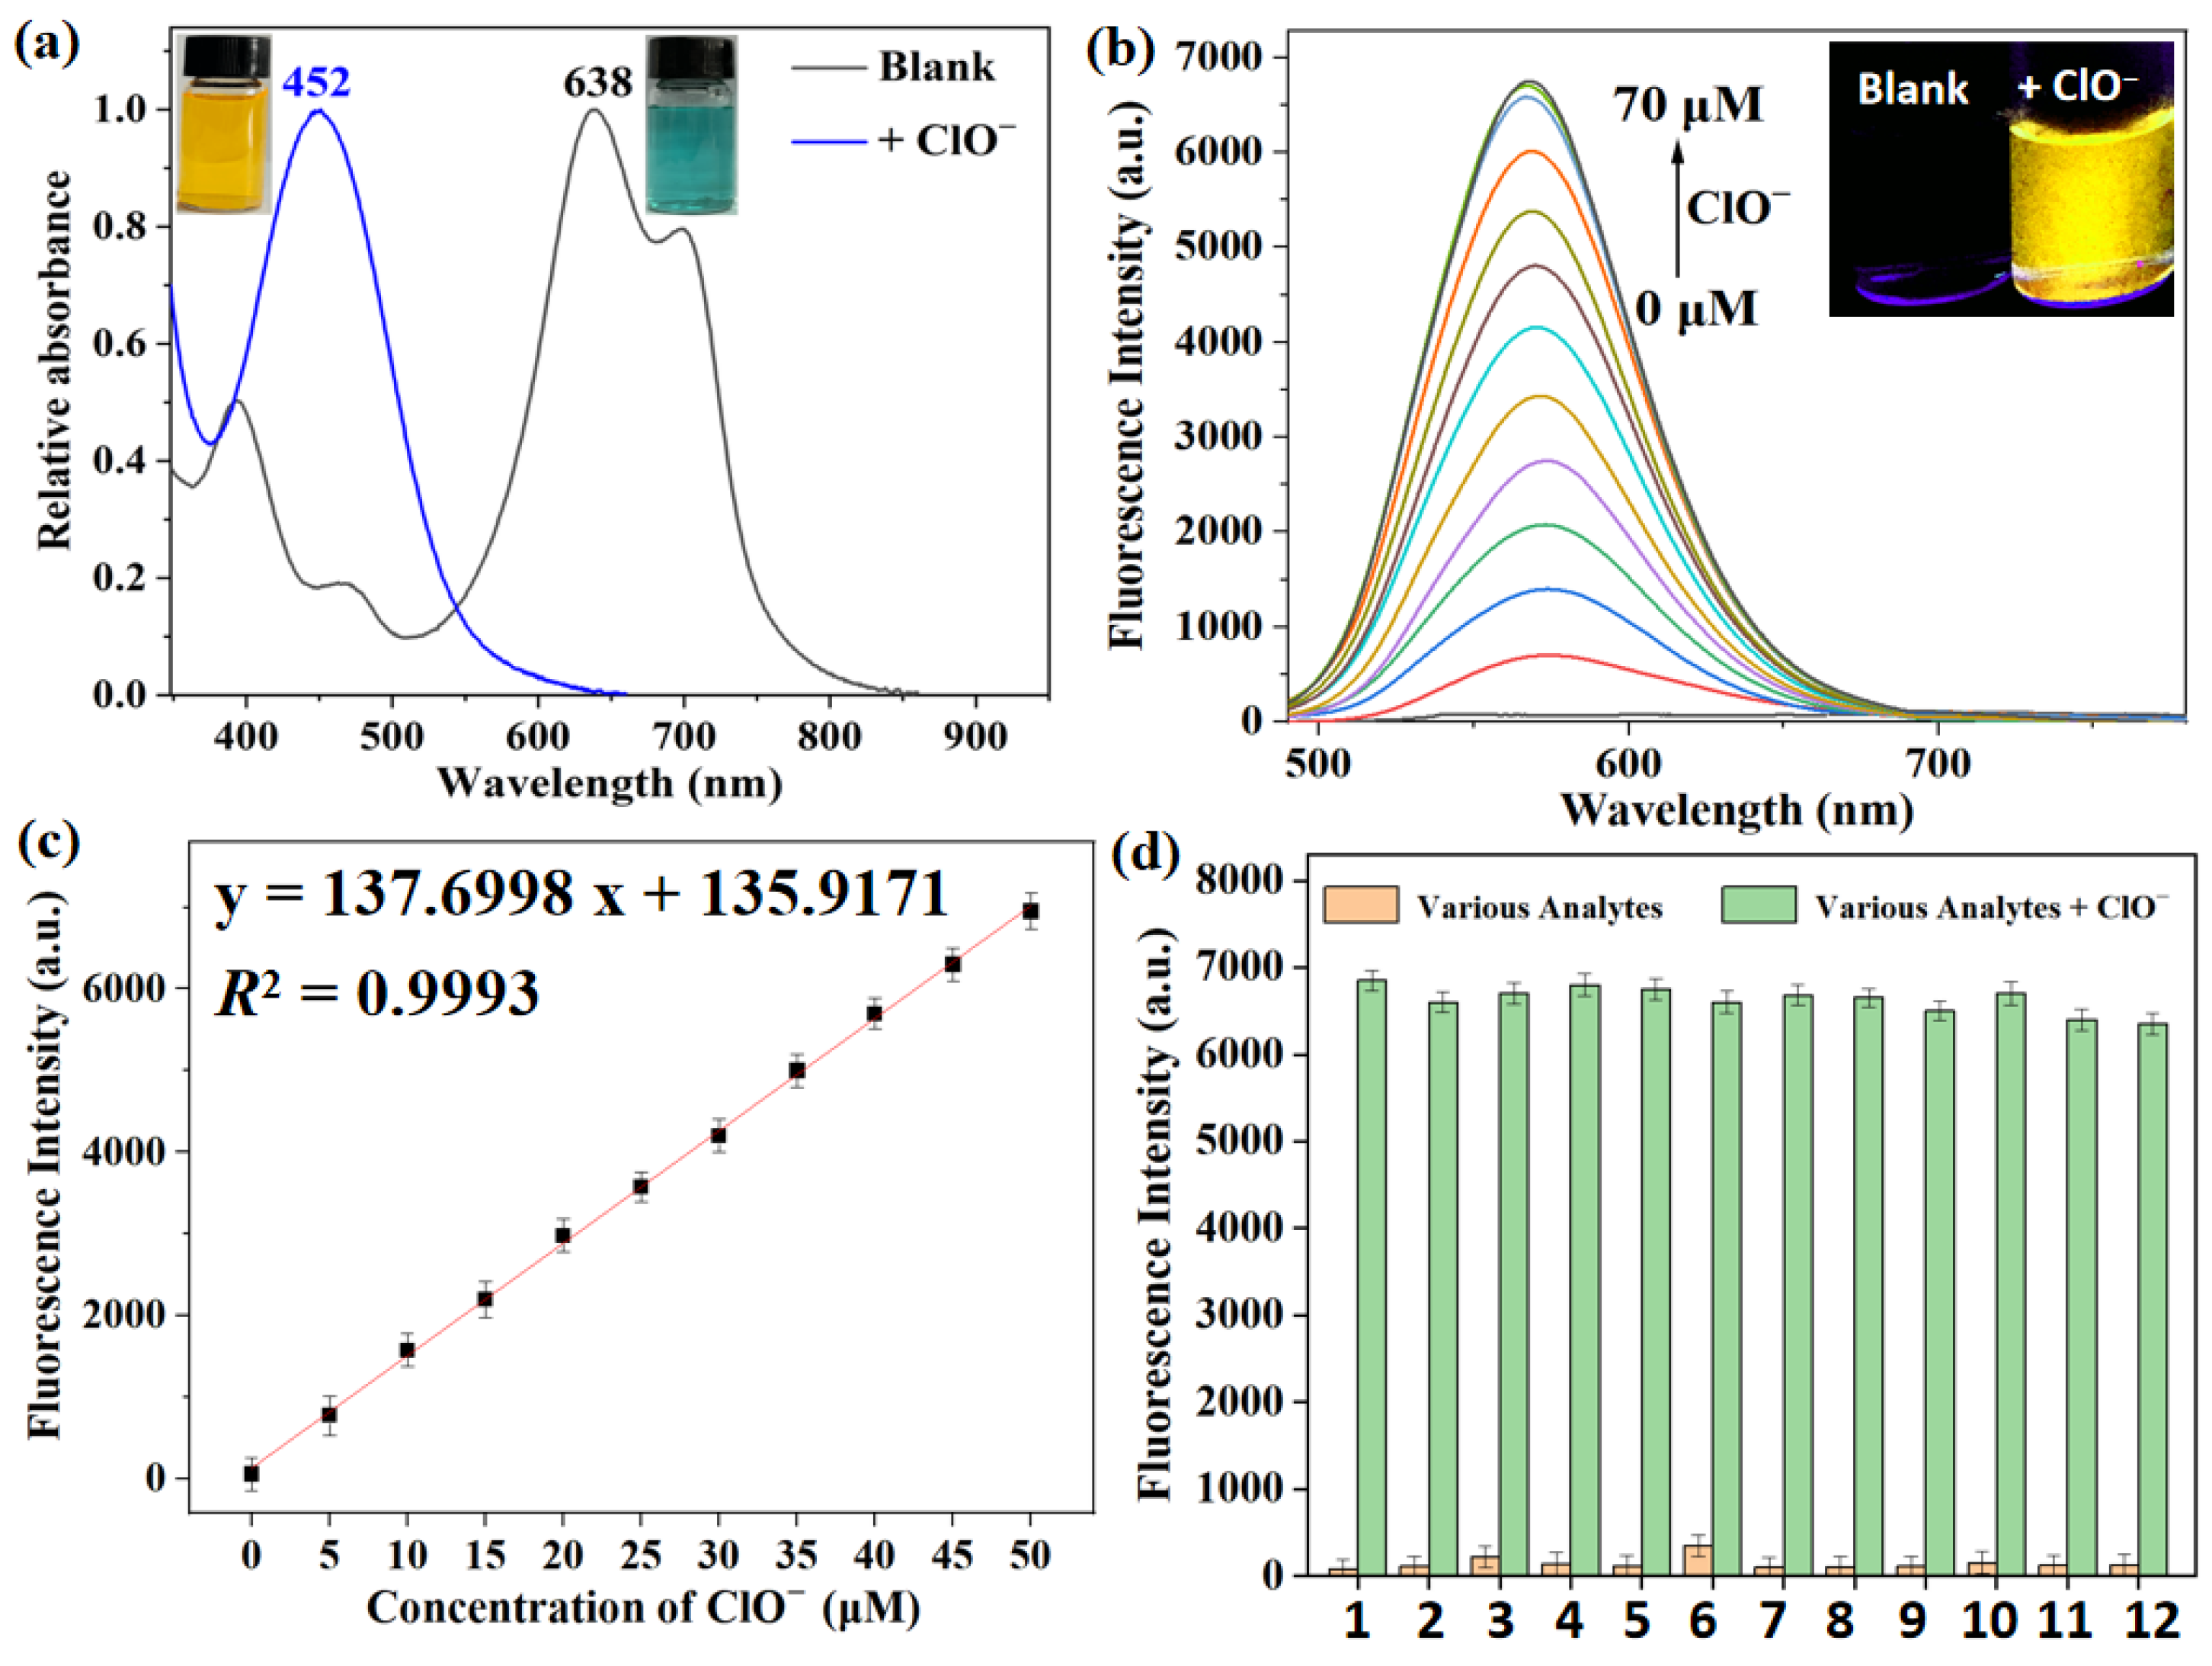
The detection limit (DL) of probe XTAP−Bn toward ClO− was calculated by following equation: DL = 3σ/k. Where σ was the standard deviation of fluorescence intensity for blank solution, which was measured for eight times. k represented the slope of the linear calibration plot between the fluorescence intensity and ClO− concentration. According to the linear equation:y = 137.6998x + 135.9171, DL = 18 nM.
3.6. Theoretical Calculations
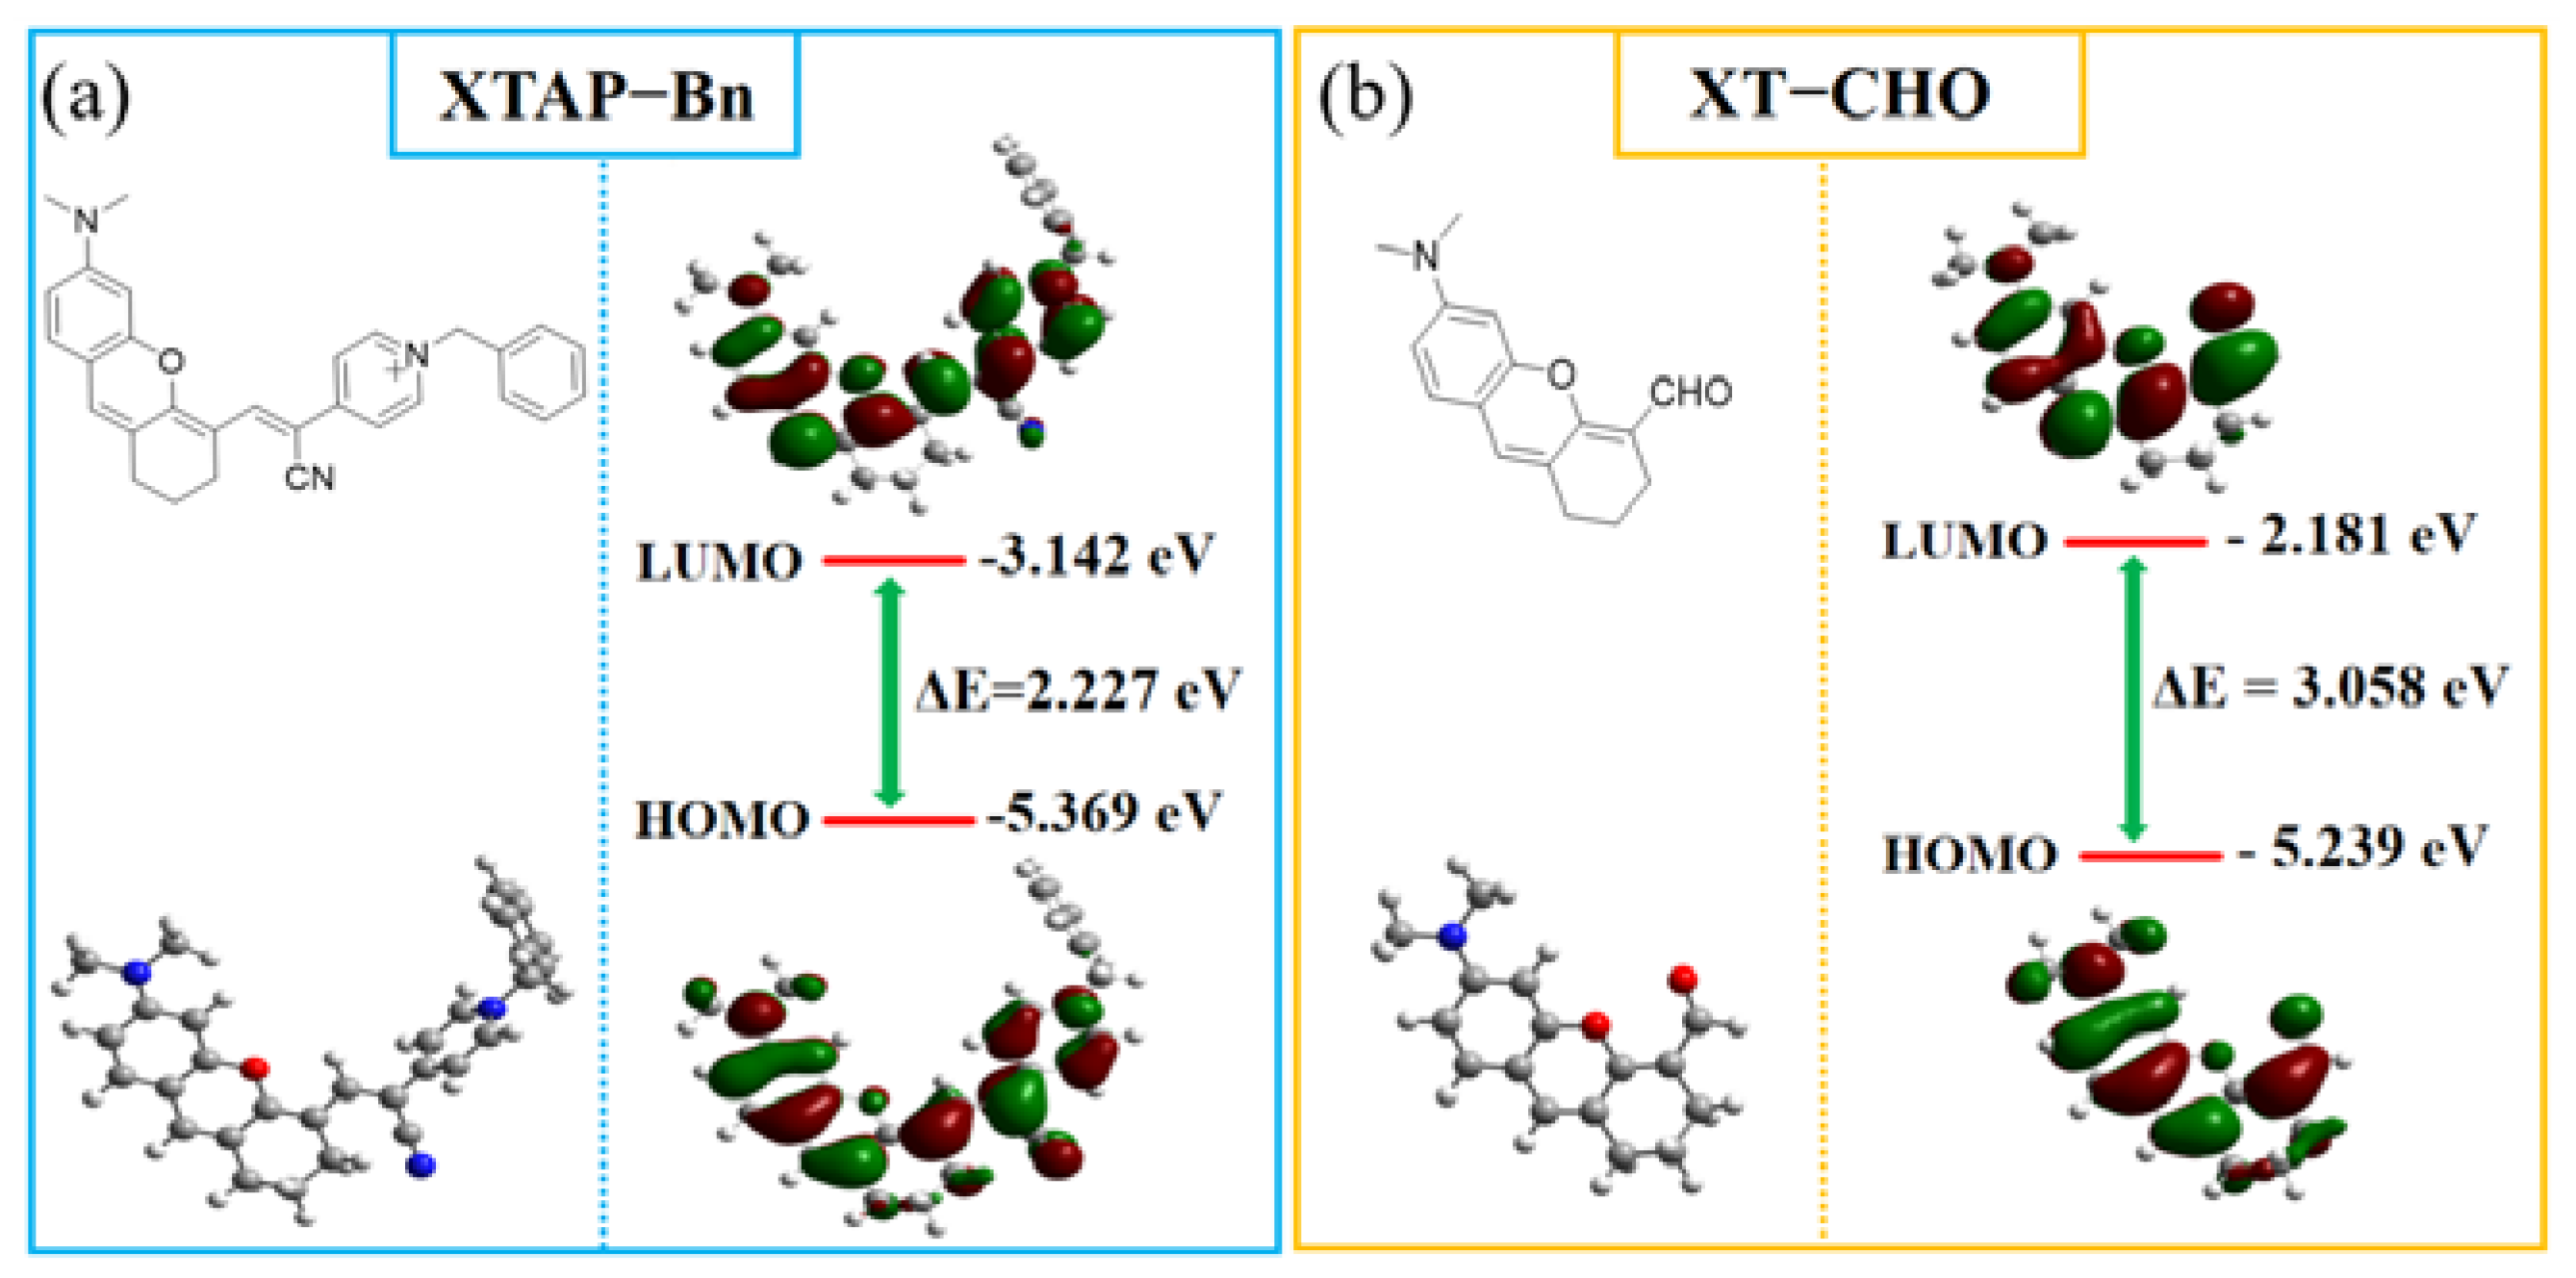
All density functional theory (DFT) calculations were performed with Gaussian 09 program. The ground state (S0) geometries of probe XTAP−Bn and compound XT−CHO were optimized by DFT calculations with B3LYP/6-31G(d) basis set. Moreover, their singlet excited state (S1) geometries were optimized by time-dependent DFT (TDDFT) approaches with the same function program.
3.7. Acytotoxicity Assay
The cytotoxicity was evaluated by MTT assay. HeLa cells were purchased from Wuhan Mingde Biotechnology Co., LTD, and were incubated in Dulbecco’s modified Eagle medium containing 10% fetal bovine serum, and then the cells were kept at 37 °C under the condition of 5% CO2 for 24 h. After that, the cells were incubated with various concentrations of probe XTAP−Bn (5, 10, 15, 20, 25 μM) for 10 h. After washing with PBS, 3-(4,5-dimethylthiazol-2-yl)-2,5-diphenyltetrazolium bromide (MTT) was added and the medium was incubated at 37 °C for 4h. Finally, the absorbance was read at 490 nm using an ELISA reader (Varioskan Flash). The percentage of cell viability was calculated relative to control wells designated as 100% viable cells.
3.8. Living Cell Imaging
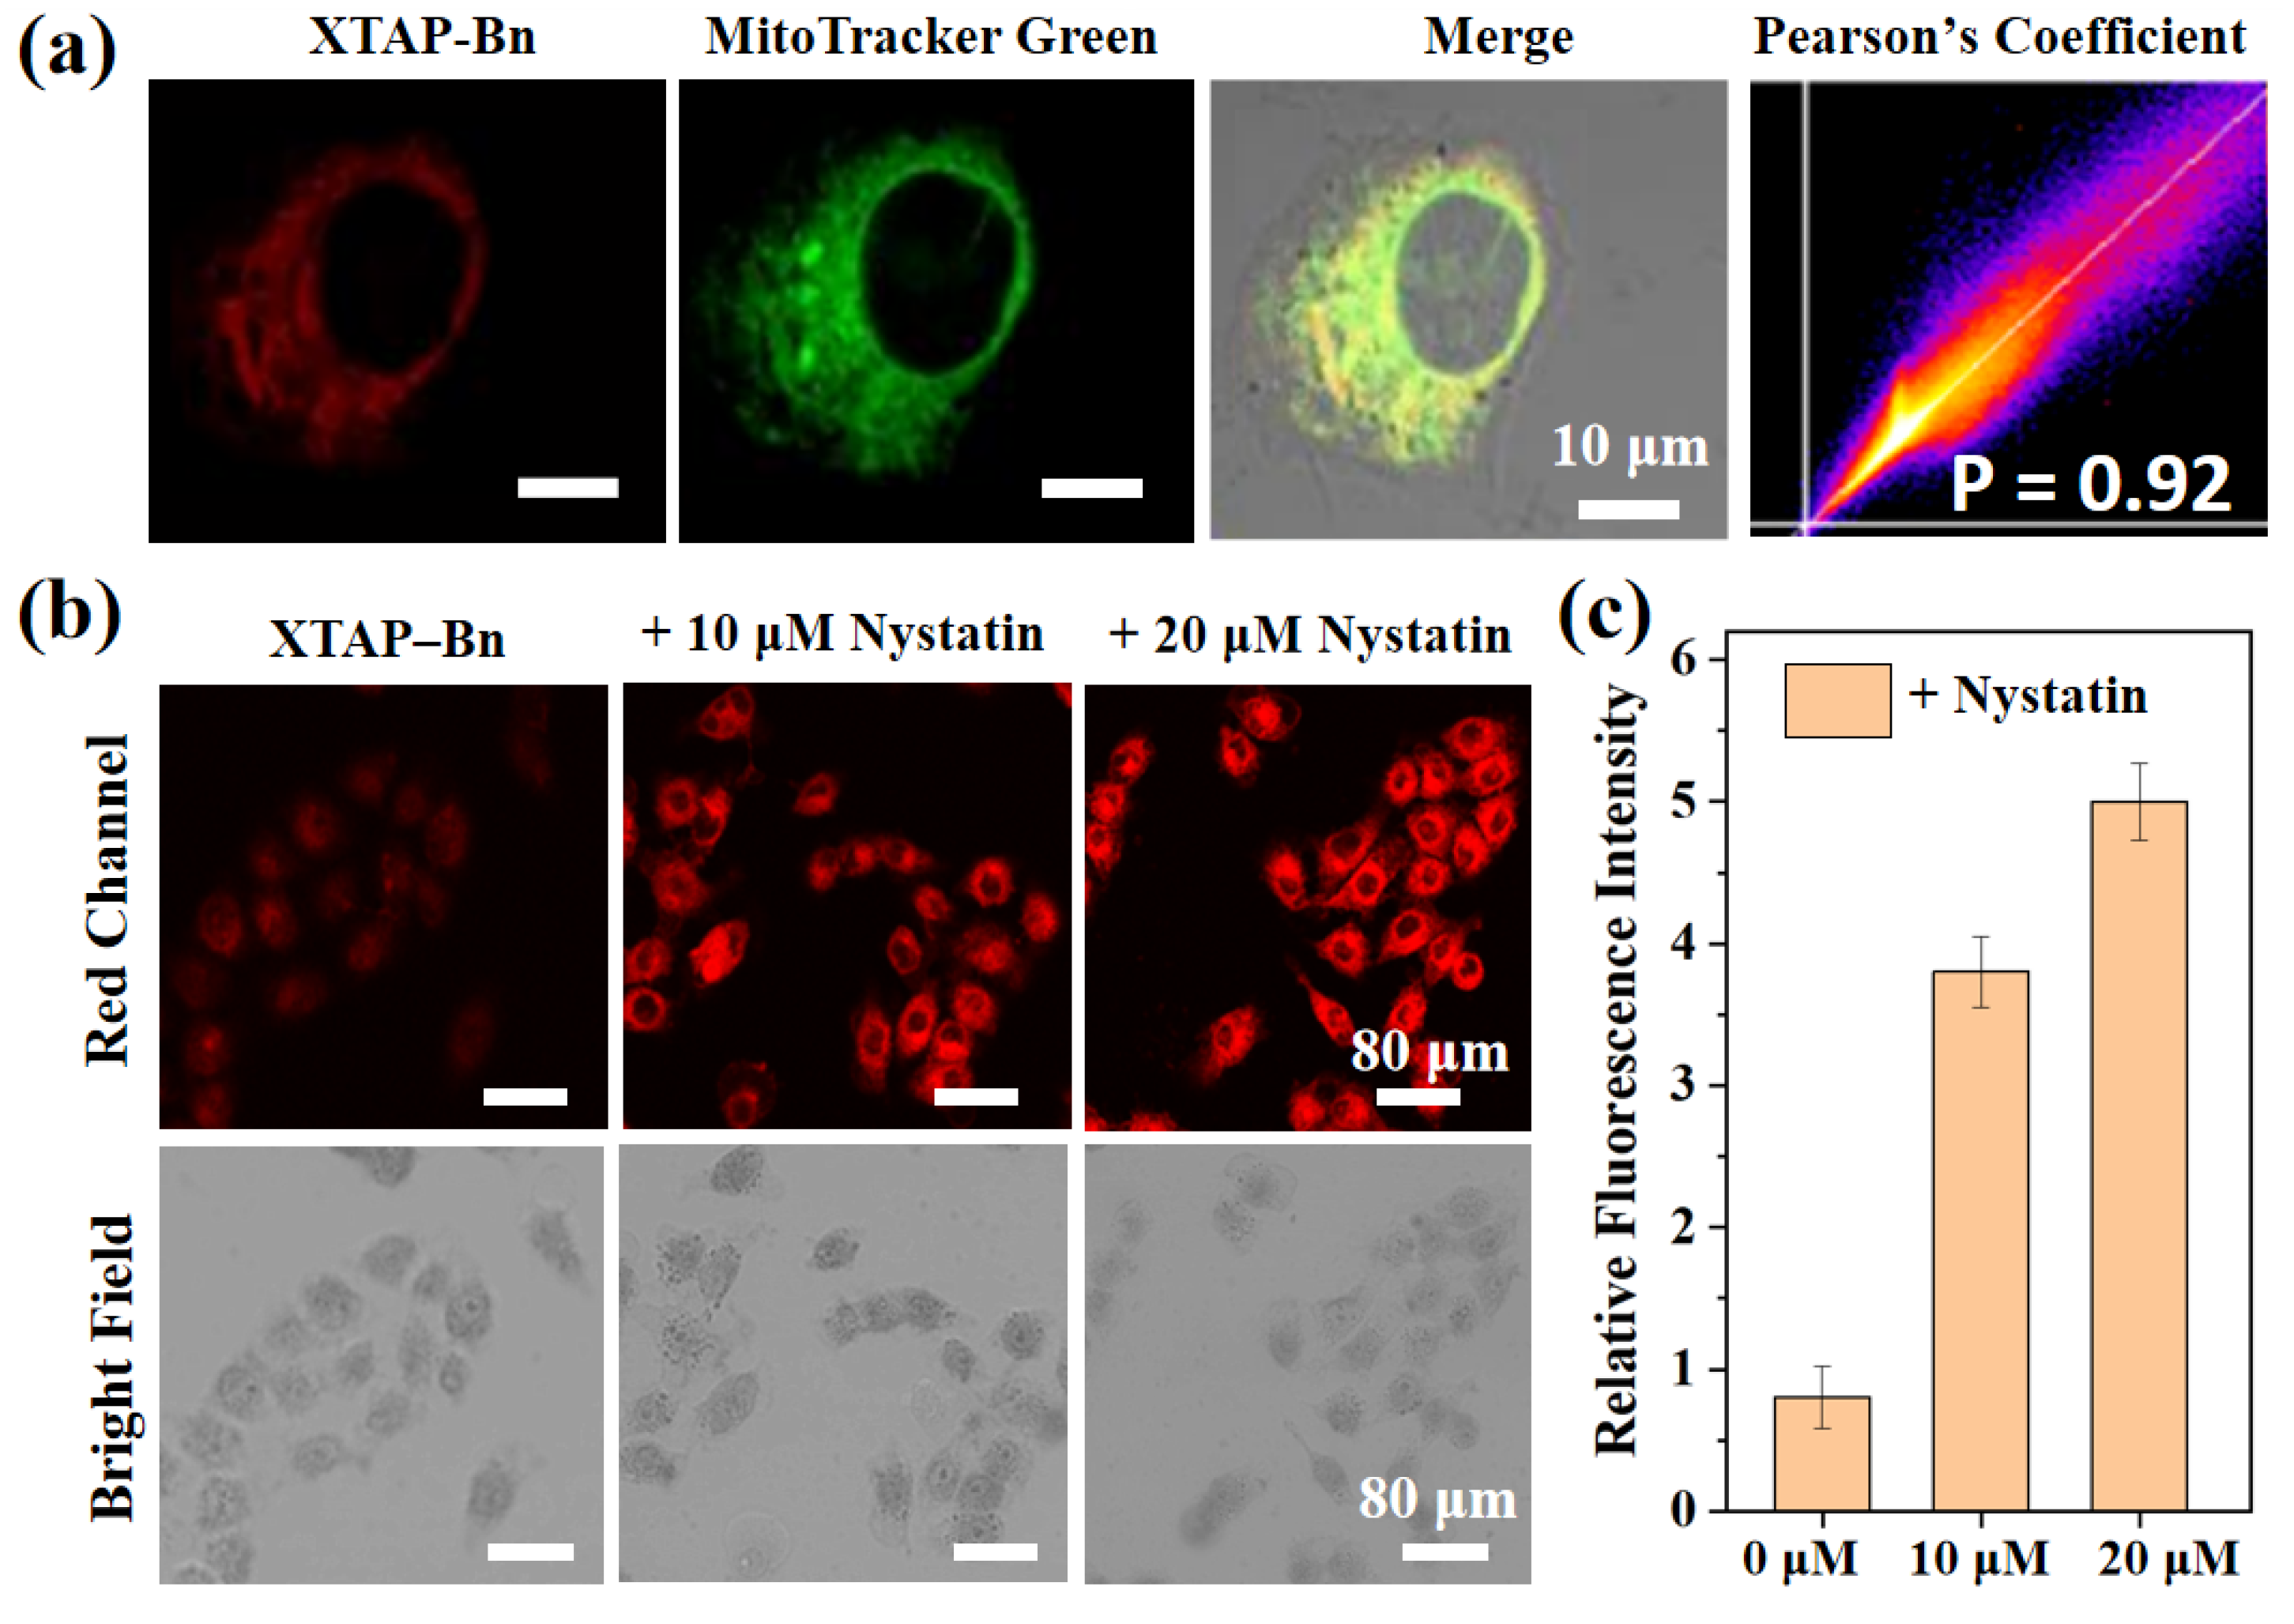
All HeLa cells were purchased from Wuhan Mingde Biotechnology Co., LTD. For mitochondria targeting study, HeLa cells were firstly cultivated with probe XTAP−Bn (5 μM) at 37 °C for 30 min in Dulbecco’s Modifed Eagle’s Medium medium containing 10% fetal bovine serum. Afterward, PBS was added for washing three times, and then commercial Mito-Tracker Green and (4 μM) was used to stain the mitochondria. At last, the fluorescence image was completed by a confocal laser scanning microscope. Green Channel: λex = 488 nm; λem =500–550 nm. Red Channel: λex = 633 nm; λem =700–790 nm.
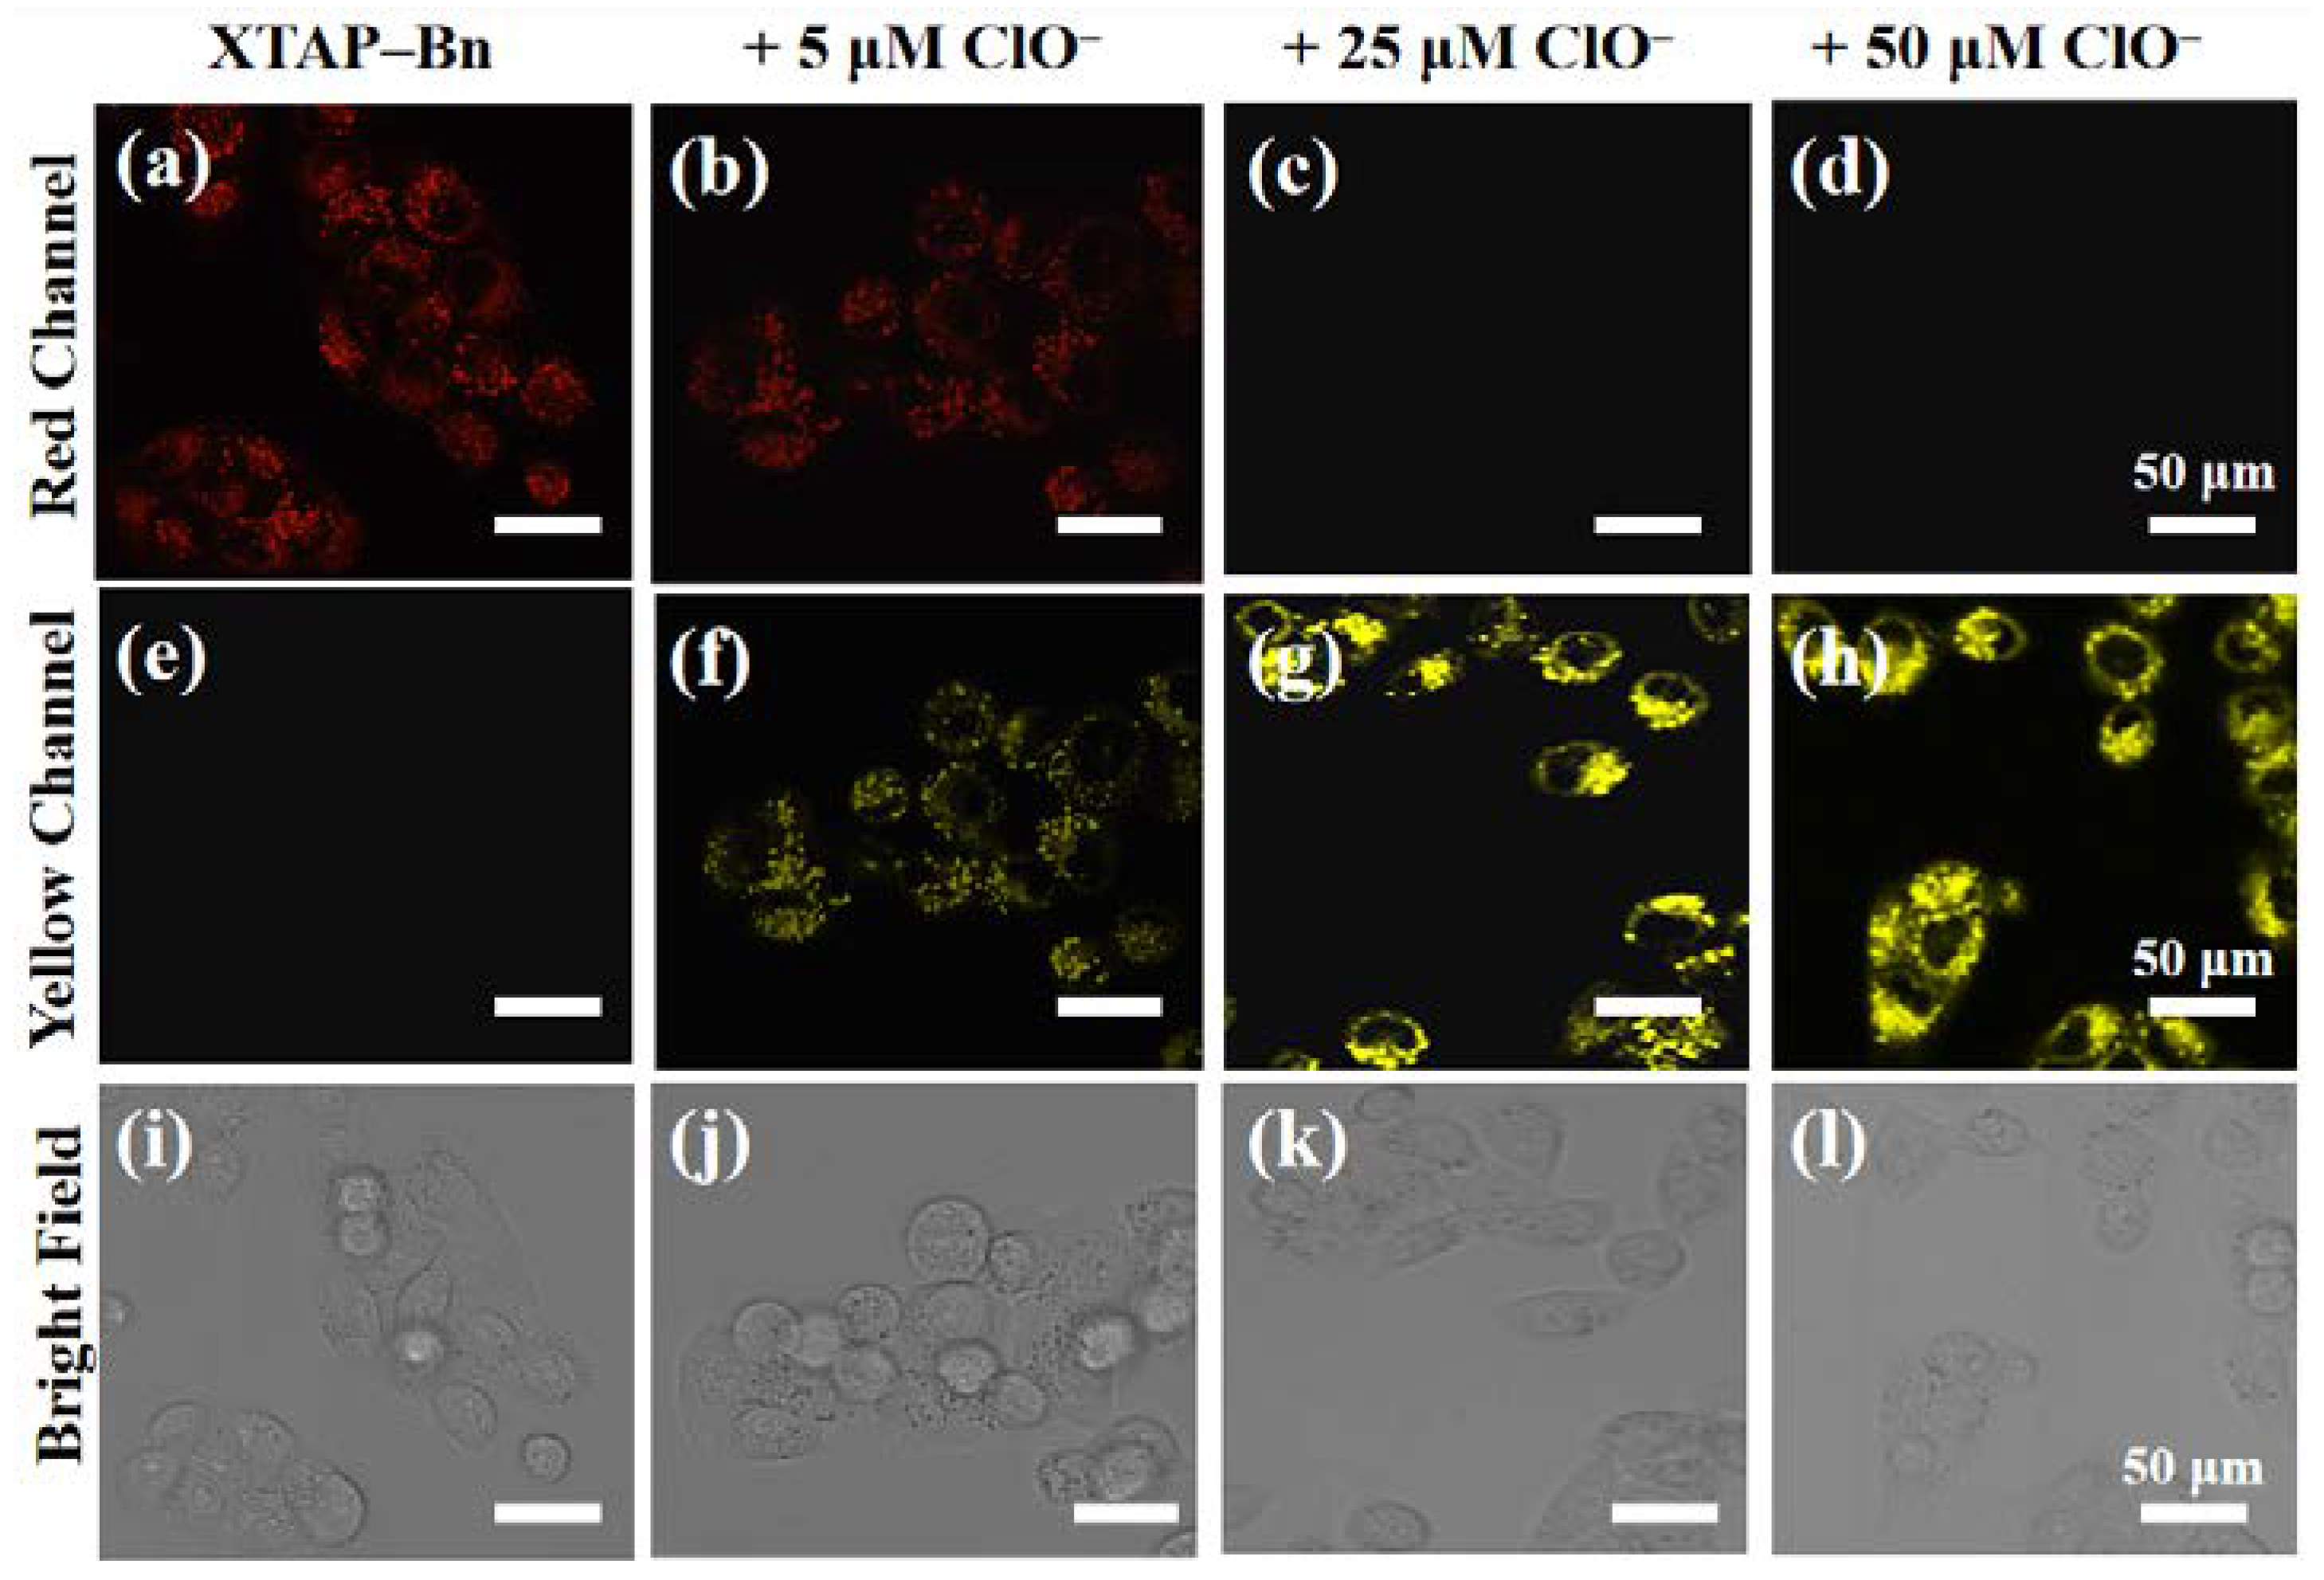
For cellular viscosity imaging, HeLa cells were firstly treated with the different concentration of nystatin (0 μM, 10 μM, 20 μM) for 45 min, respectively, and then incubated with XTAP−Bn (5 μM) at 37 °C for another 30 min. After PBS washing, the image was taken by a confocal fluorescence microscopy (λex = 633 nm, λem = 700−790 nm). For cellular ClO− imaging, HeLa cells were firstly stained with XTAP−Bn (5 μM) for 30 min, and then incubated with different concentration of NaClO (0 μM, 5 μM, 25 μM, and 50 μM) at 37 °C for 1 h, respectively. After PBS washing, the image was taken by a confocal fluorescence microscopy (λex = 458 nm, λem = 520 nm−590 nm).
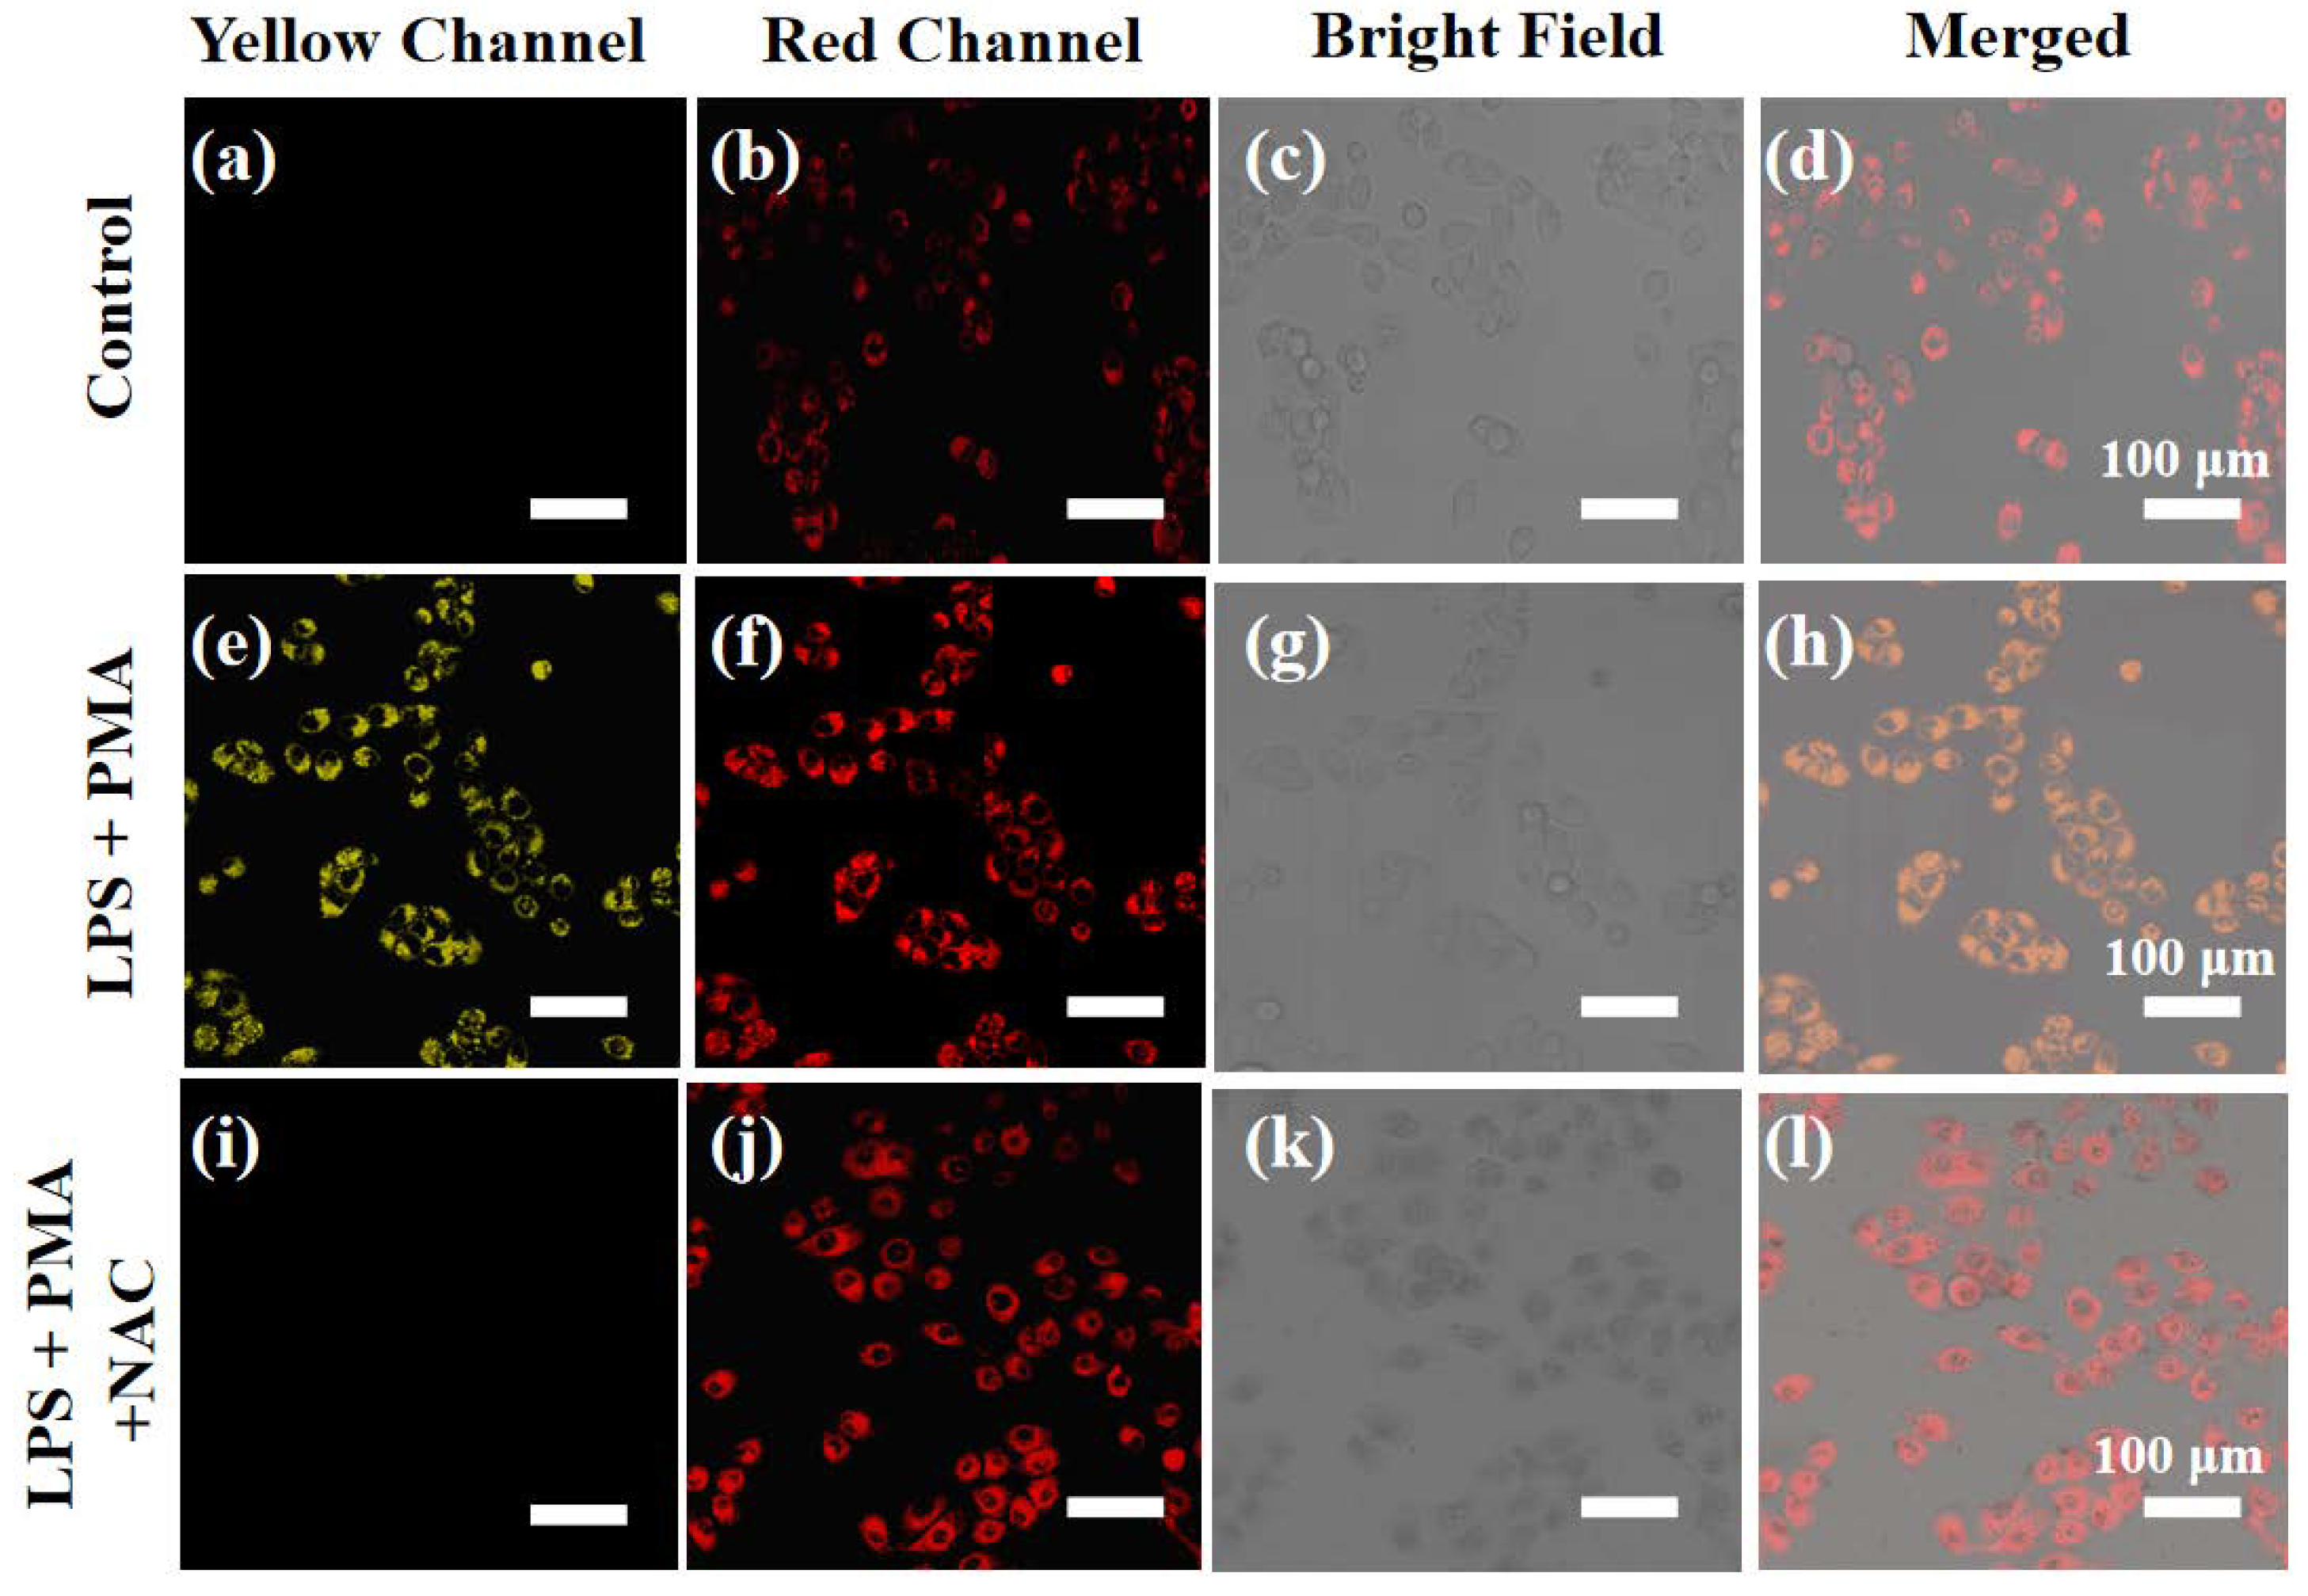
For endogenous ClO− and viscosity imaging, HeLa cells were divided into three groups. In a control group, the cells were only stained with probe XTAP−Bn (5 μM) at 37 °C for 30 min . In the second group, the cells were firstly treated with 300 ng/mL lipopolysaccharide (LPS) and 300 ng/mL N-acetylcysteine (PMA) for 45 min, and then incubated with XTAP−Bn (5 μM) at 37 °C for another 30 min . In the last group, the cells were treated with 300 ng/mL LPS and 300 ng/mL PMA for 45 min, 50 μM N-acetylcysteine (NAC) for 45 min, and then with XTAP−Bn (5 μM) at 37 °C for another 30 min. After PBS washing, the image was taken by a confocal fluorescence microscopy. Yellow channel: λex = 458 nm, λem = 520 nm−590 nm; Red channel: λex = 633 nm; λem =700–790 nm.
3.9. Zebrafish Imaging
Zebrafish embryos were purchased from Shanghai FishBio Co., Ltd. (Shanghai, China). Larval zebrafish (4 days old) were used for imaging, and they were divided into five groups. In a control group, zebrafish were only cultured with probe XTAP−Bn (5 μM) at 37 ℃ for 1 h. In the second group, zebrafish were grown with nystatin (20 μM) for 2 h, and then stained with XTAP−Bn (5 μM) at 37 ℃ for another 1 h. In the third group, zebrafish were stained with XTAP−Bn (5 μM) for 1 h, and then incubated with NaClO (50 μM) at 37 ℃ for another 1 h. In the fourth group, zebrafish were were firstly treated with 300 ng/mL lipopolysaccharide (LPS) and 300 ng/mL N-acetylcysteine (PMA) for 4 h, and then stained with XTAP−Bn (5 μM) at 37 °C for another 1 h. In the last group, zebrafish were firstly treated with 300 ng/mL LPS and 300 ng/mL PMA for 4 h, and then cultivated with 50 μM N-acetylcysteine (NAC) for 4 h, finally stained with XTAP−Bn (5 μM) at 37 °C for another 1 h. All zebrafish were washed three times with embryo media, and then transferred to a confocal fluorescence microscopy for imaging. Yellow channel: λex = 458 nm, λem = 520 nm−590 nm; Red channel: λex = 633 nm; λem =700–790 nm.
Scheme 1.
(a) The illustration of dual-response fluorescent probe with signal crosstalk and without signal crosstalk. (b) The proposed mechanism of probe XTAP−Bn toward ClO− and viscosity.
Scheme 1.
(a) The illustration of dual-response fluorescent probe with signal crosstalk and without signal crosstalk. (b) The proposed mechanism of probe XTAP−Bn toward ClO− and viscosity.
Scheme 2.
The synthetic route of probe XTAP−Bn.
Scheme 2.
The synthetic route of probe XTAP−Bn.
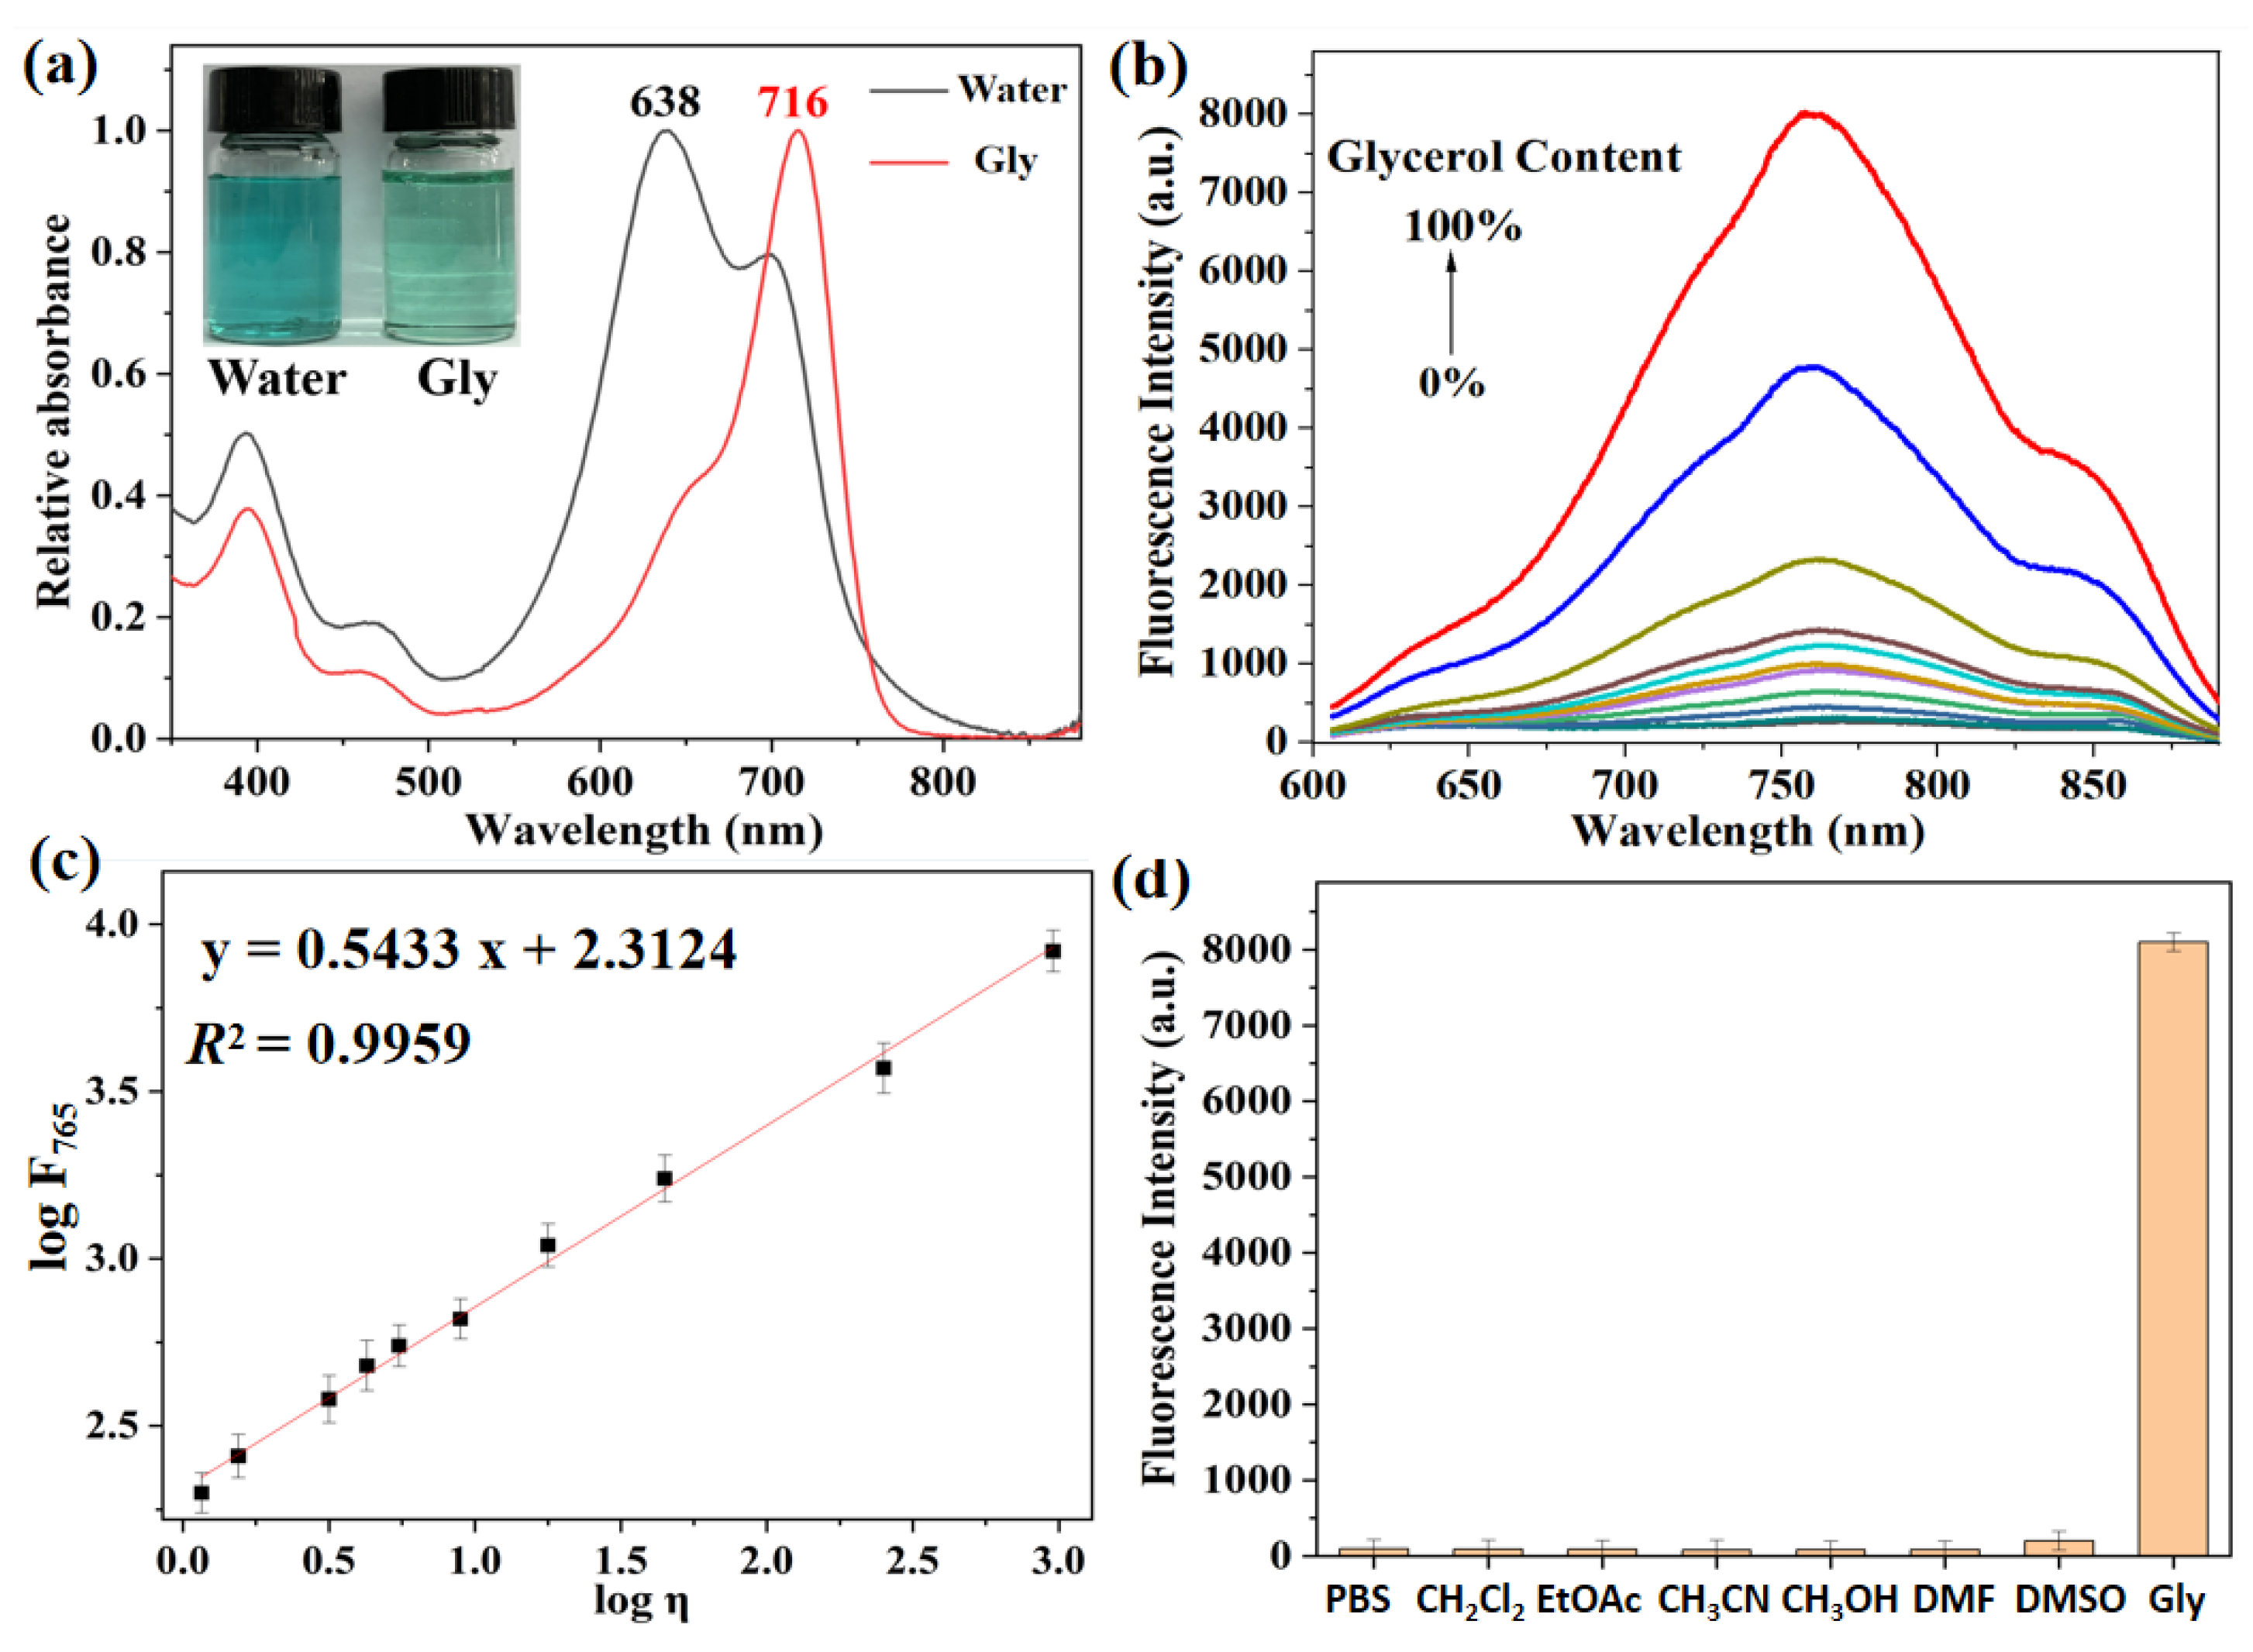
Figure 1.
(a) Absorption spectra of XTAP−Bn (5 μM) in water and glycerol, respectively. Insert: the corresponding photos taken under sunlight. (b) Fluorescence spectra of XTAP−Bn (5 μM) in different ratios of a water−glycerol mixture (glycerol from 0 to 100%). λex = 620 nm (c) Linear relationship between logF765 and logη in the water−glycerol mixture. (d) Fluorescence intensity of XTAP−Bn (5 μM) at 765 nm in different solvents. Excitation was at the maximum absorption wavelength of each one.
Figure 2.
(a) Absorption spectra of XTAP−Bn (5 μM) in PBS buffer without and with ClO− (70 μM). Insert: the corresponding photos taken under sunlight. (b) Fluorescence spectra of XTAP−Bn (5 μM) in PBS buffer after treating with different concentration of ClO−, λex = 482 nm. Insert: the corresponding photos taken under 365 nm light irradiation. (c) Linear fitting graph of fluorescence intensity at 558 nm with ClO− concentrations from 0 μM to 50 μM. (d) The fluorescence intensity of XTAP−Bn (5 μM) at 558 nm in the presence of various analytes (100 μM) without and with ClO− (50 μM). 1: Blank; 2: ONOO–; 3: •OH; 4: 1O2; 5: H2O2; 6: Cys; 7: Hcy; 8: GSH; 9: CO32−; 10: H2PO4−; 11: S2−; 12: SO32−. λex = 482 nm, error bars are ± SD (n = 3).
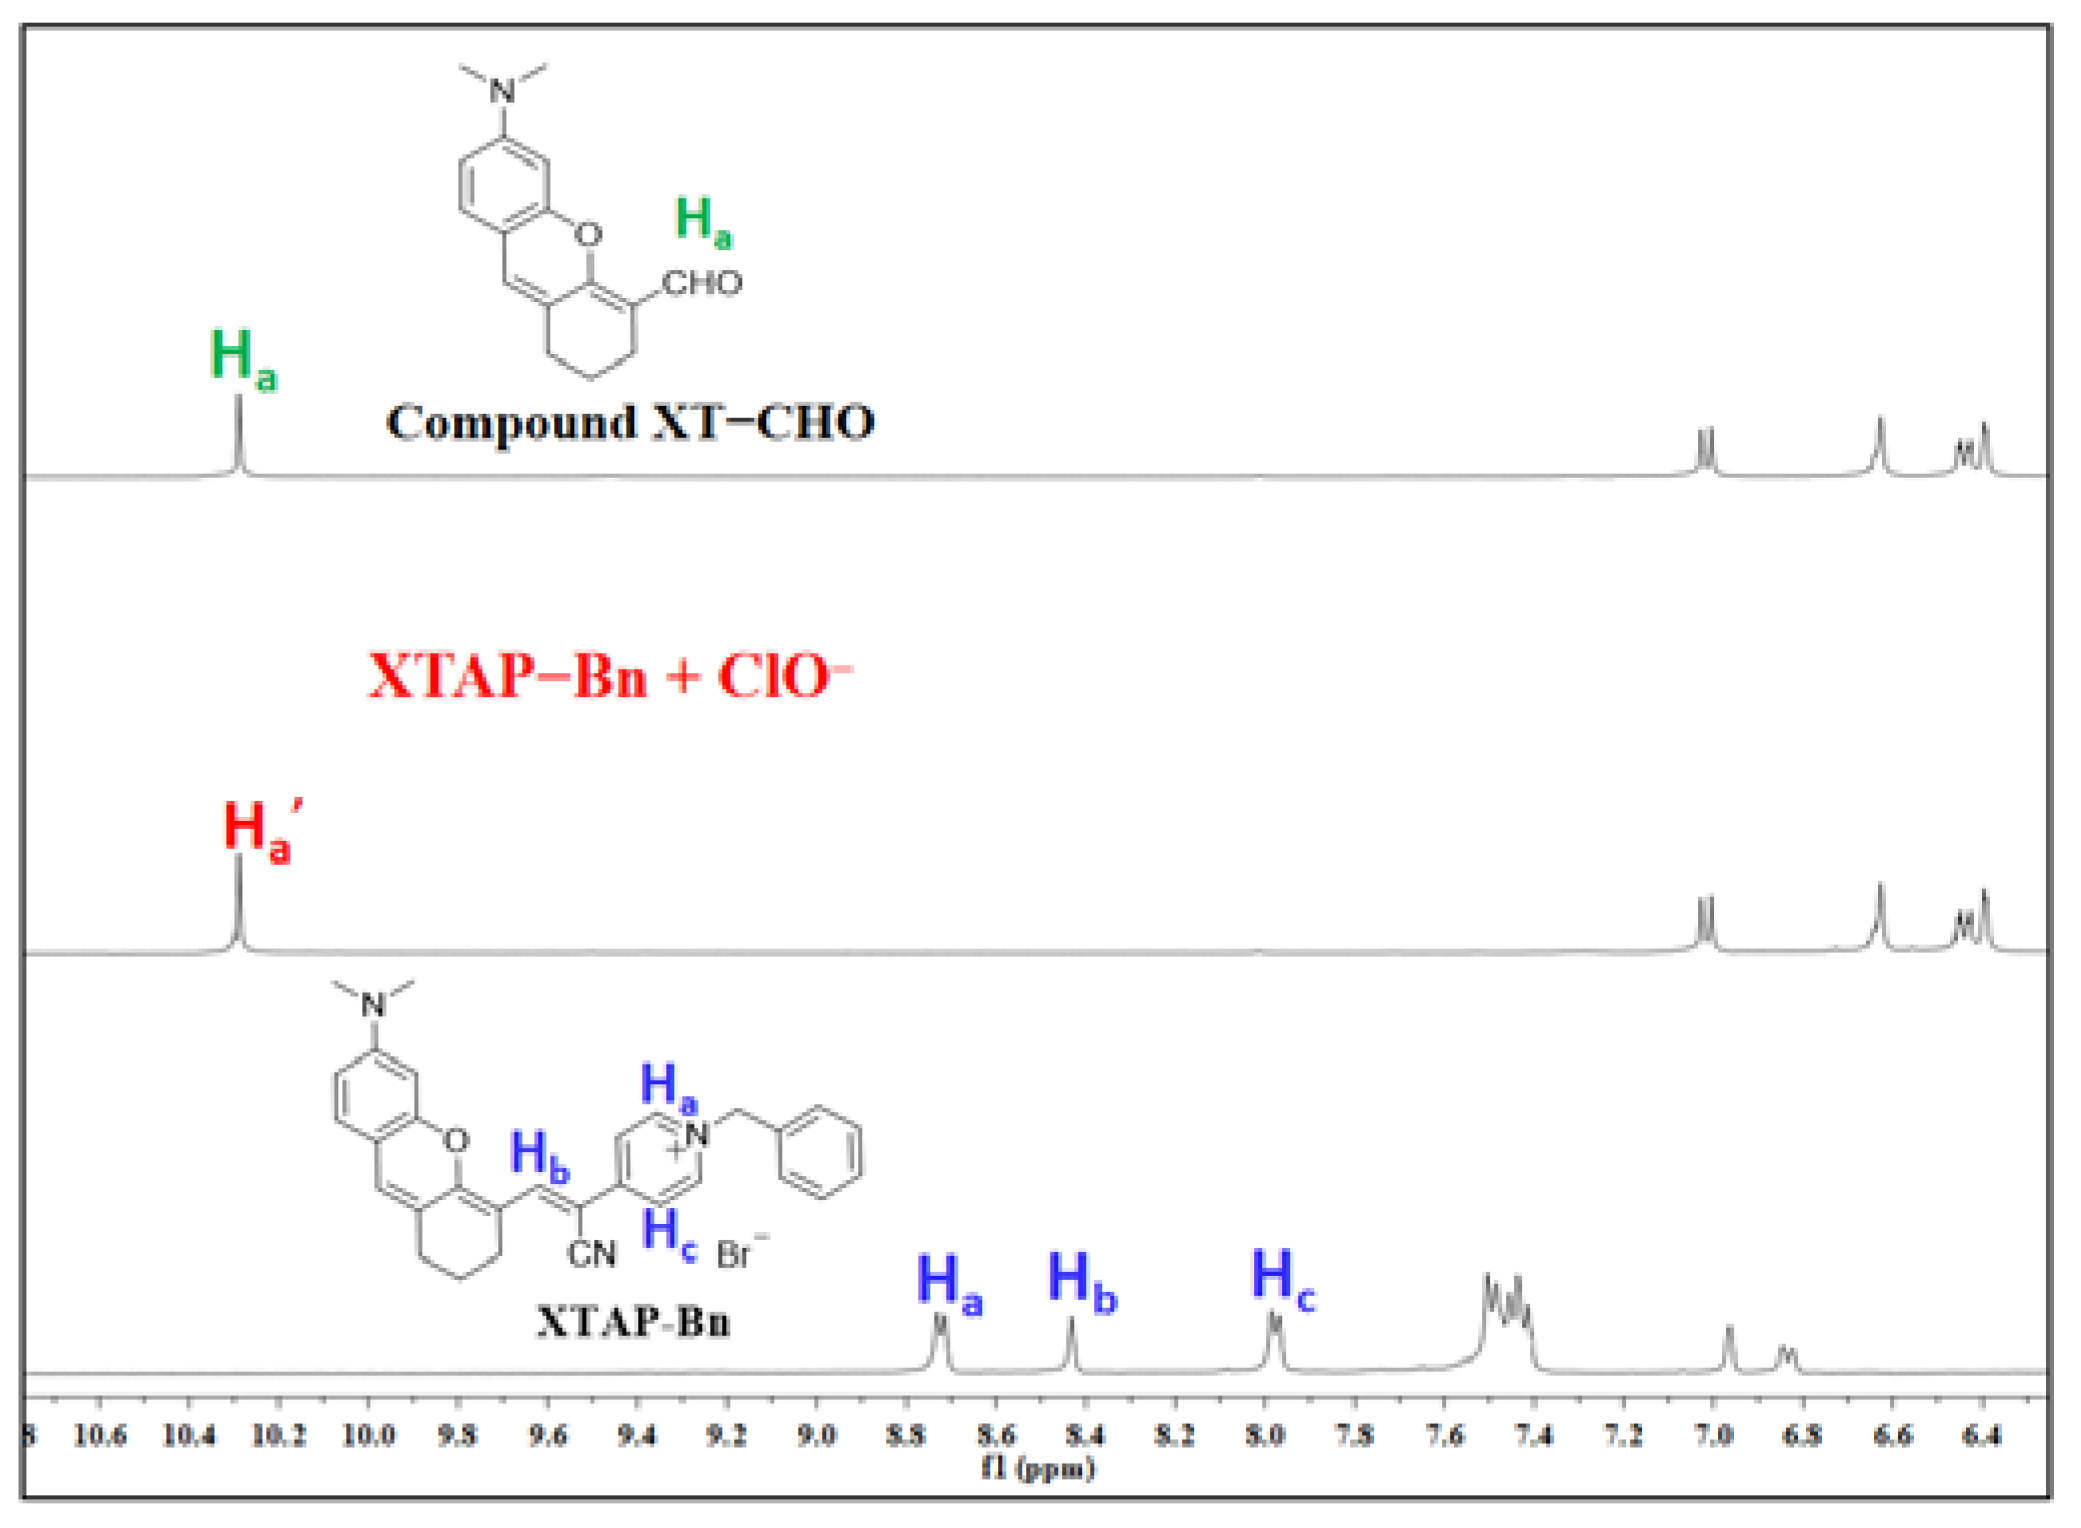
Figure 3.
1H NMR spectra of compound XT−CHO, probe XTAP−Bn, and the isolated product of XTAP−Bn + ClO− conducted in DMSO-d6.
Figure 3.
1H NMR spectra of compound XT−CHO, probe XTAP−Bn, and the isolated product of XTAP−Bn + ClO− conducted in DMSO-d6.
Figure 4.
Energy-minimized structures and HOMO/LUMO of probe XTAP−Bn and compound XT−CHO by DFT calculations.
Figure 4.
Energy-minimized structures and HOMO/LUMO of probe XTAP−Bn and compound XT−CHO by DFT calculations.
Figure 5.
(a) Confocal fluorescence image of HeLa cells stained with probe XTAP−Bn (red channel), commercial dye Mito-Tracker Green (green channel), overlap image and Pearson correlation coefficient. Green Channel: λex = 488 nm; λem =500–550 nm. Red Channel: λex = 633 nm; λem =700–790 nm. (b) Confocal imaging of viscosity in living HeLa cells. HeLa cells were pretreated with different concentration of nystatin (0 μM, 10 μM, 20 μM) at 37 ℃ for 45 min, and then incubated with XTAP−Bn (5 μM) at 37 ℃ for another 30 min. λex = 633 nm; λem =700–790 nm (c) Relative intensities of cell imaging. Error bars are ± SD (n = 3).
Figure 6.
Confocal imaging of ClO− in living HeLa cells. HeLa cells were stained with XTAP−Bn (5 μM) only (a, e, i), with 5 μM ClO− (b, f, j), with 25 μM ClO− (c, g, k), and with 50 μM ClO− (d, h, l), respectively. Red Channel: λex = 633 nm; λem =700–790 nm. Yellow Channel: λex = 458 nm, λem = 520 nm−590 nm.
Figure 7.
The simultaneous imaging of endogenous ClO− and viscosity in HeLa cells. (a−d) Cells were stained with XTAP−Bn (5 μM) for 30 min as a control. (e−h) Cells were incubated with LPS (300 ng/mL) and PMA (300 ng/mL) for 45 min, and then stained with XTAP−Bn (5 μM) for another 30 min. (i−l) Cells were incubated with LPS (300 ng/mL) and PMA (300 ng/mL) for 45 min, then NAC (50 μM) for 45 min, and finally stained with XTAP−Bn (5 μM) for another 30 min. Yellow Channel: λex = 458 nm, λem = 520 nm−590 nm; Red Channel: λex = 633 nm; λem =700–790 nm.
Figure 8.
Imaging the dynamic change of ClO− and viscosity levels in living zebrafish. Cells were stained with XTAP−Bn (5 μM) only as a control (a, f, k), and with 20 μM nystatin (b, g, l), with 50 μM ClO− (c, h, m), with LPS (300 ng/mL) and PMA (300 ng/mL) (d, i, n), with LPS (300 ng/mL), PMA (300 ng/mL) and NAC (50 μM) (e, j, o), respectively. Yellow Channel: λex = 458 nm, λem = 520 nm−590 nm; Red Channel: λex = 633 nm; λem =700–790 nm.

