1. Introduction
Epirubicin (4′-epidoxorubicin) belongs to the class of anthracyclines, which are very effective drugs in the treatment of various types of cancers, both in mono- and combined therapy. Side effects of epirubicin include nausea, hair-loss, myelosuppression, anemia and the most important, cardiotoxicity [
1]. Due to various factors, such as inter-individual variability, age, concomitant diseases and co-administered drugs, epirubicin standard dosing (per body weight) might generate serum toxic effects. Quantitation methods usually use LC with fluorescence detection [
2,
3,
4], ultraviolet detection [
5,
6], electrochemical detection [
7] and tandem mass spectrometry (MS/MS) [
8,
9,
10].
Olaparib is a potent inhibitor of poly (ADP-ribose) polymerase (PARP), approved by European Medicines Agency (EMA) in 2014 for treatment of ovarian cancer [
11]. Pharmacokinetic data of this class of drugs (regarding uptake, metabolism, elimination) reveal large differences between subjects. Most of quantification techniques that papers present use LC-MS/MS [
12,
13], a very sensitive and specific technique, but with high-cost instrumentation. An LC method with diode array detection (DAD) was also validated by Daumar et al. [
14] for intracellular level estimation of olaparib in cancer cells.
The last drug molecule involved in our study, ribociclib, is part of cyclin-dependent kinases (CDKs) inhibitors family, which also includes palbociclib, milciclib and abemaciclib. Some LC-MS/MS methods have been used in different clinical studies, which also reveal inter-individual differences in plasma/serum concentrations [
15,
16,
17,
18,
19]. Besides the fact that they are expensive and laborious approaches, the methods are not fully validated; some of them only present the calibration curves as validation data [
16,
17].
Considering data presented above, especially the pharmacokinetic variability of the three anticancer compounds, the need of a simple and reliable analytical method for simultaneous quantitation of epirubicin, olaparib and ribociclib would be expected. The aim of our research was to provide a LC-MS method which could be further used in Therapeutic Drug Monitoring (TDM). Oasis PRiME HLB® cartridges were used for serum sample preparation in Solid Phase Extraction (SPE) procedure. Proteins and phospholipids could generate serious problems when large quantities are injected in LC columns. Therefore, when developing this method, an important target was to adjust the cleaning procedure, which is reflected in less problems that may occur in LC-MS interface. MS parameters were also assessed, obtaining the best signal-to-noise ratio for all compounds. The method was fully validated according to International Council of Harmonization (ICH) guideline M10 on bioanalytical method validation and study sample analysis.
2. Results
2.1. Validation Data
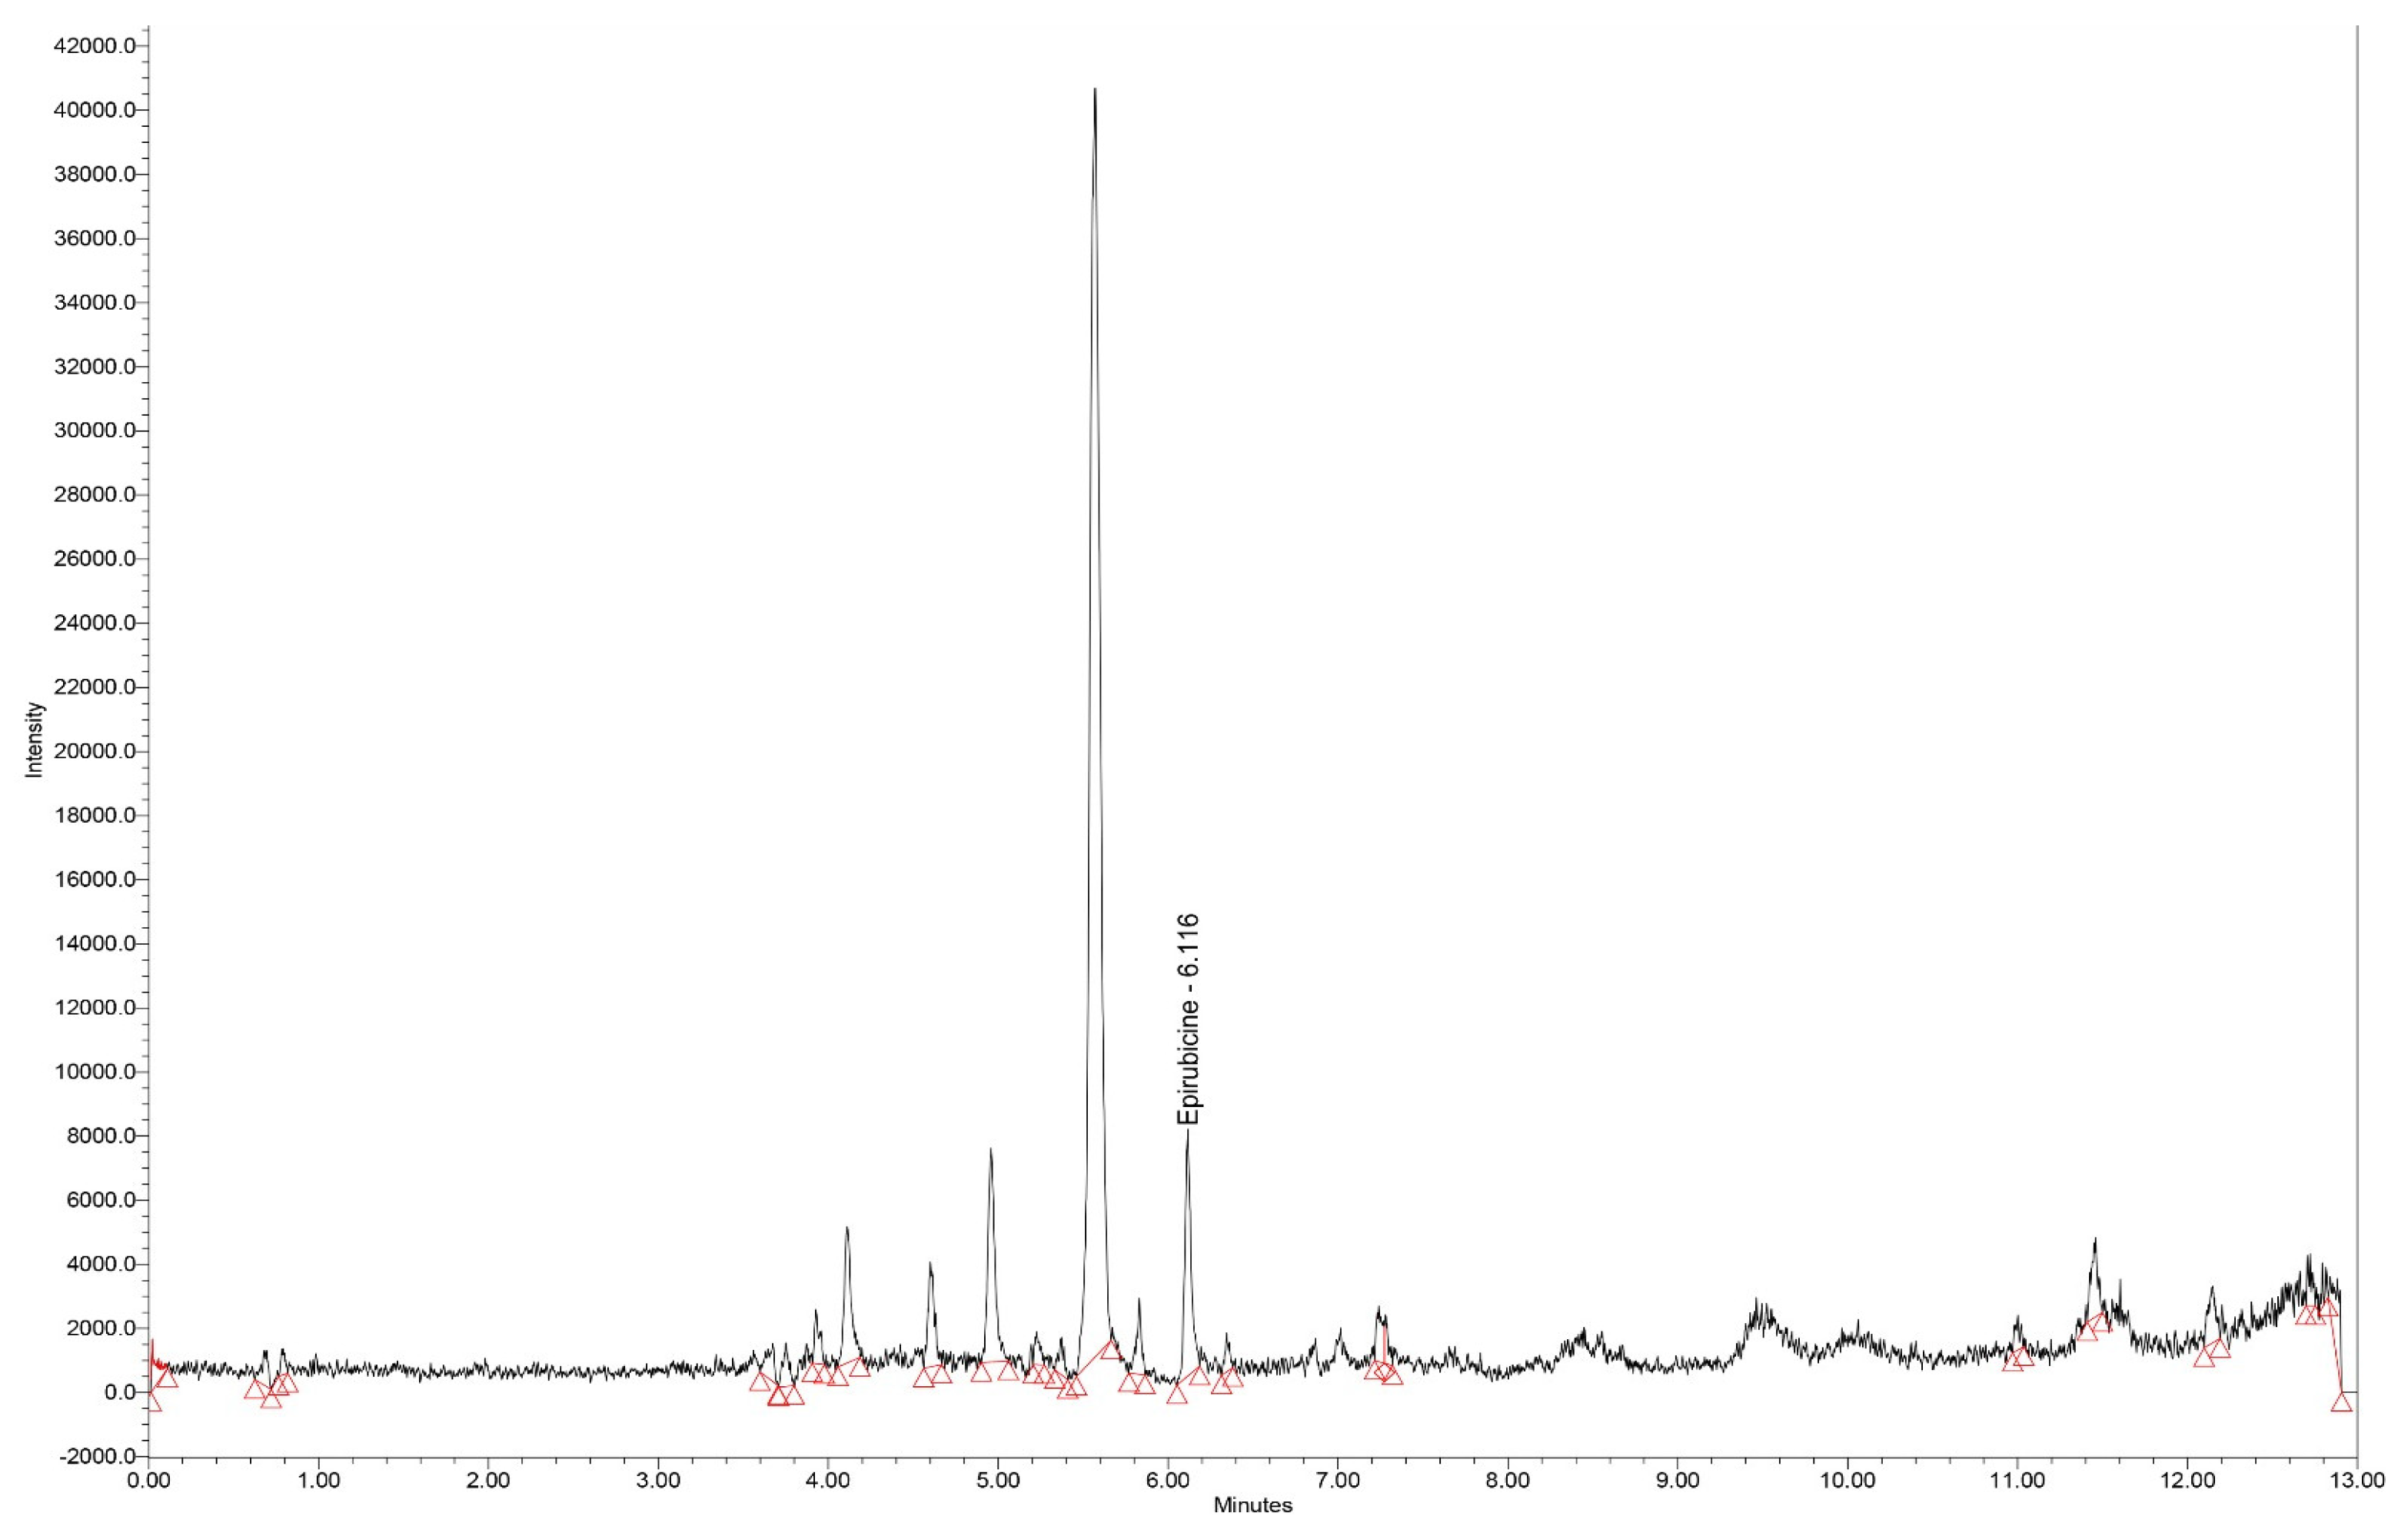
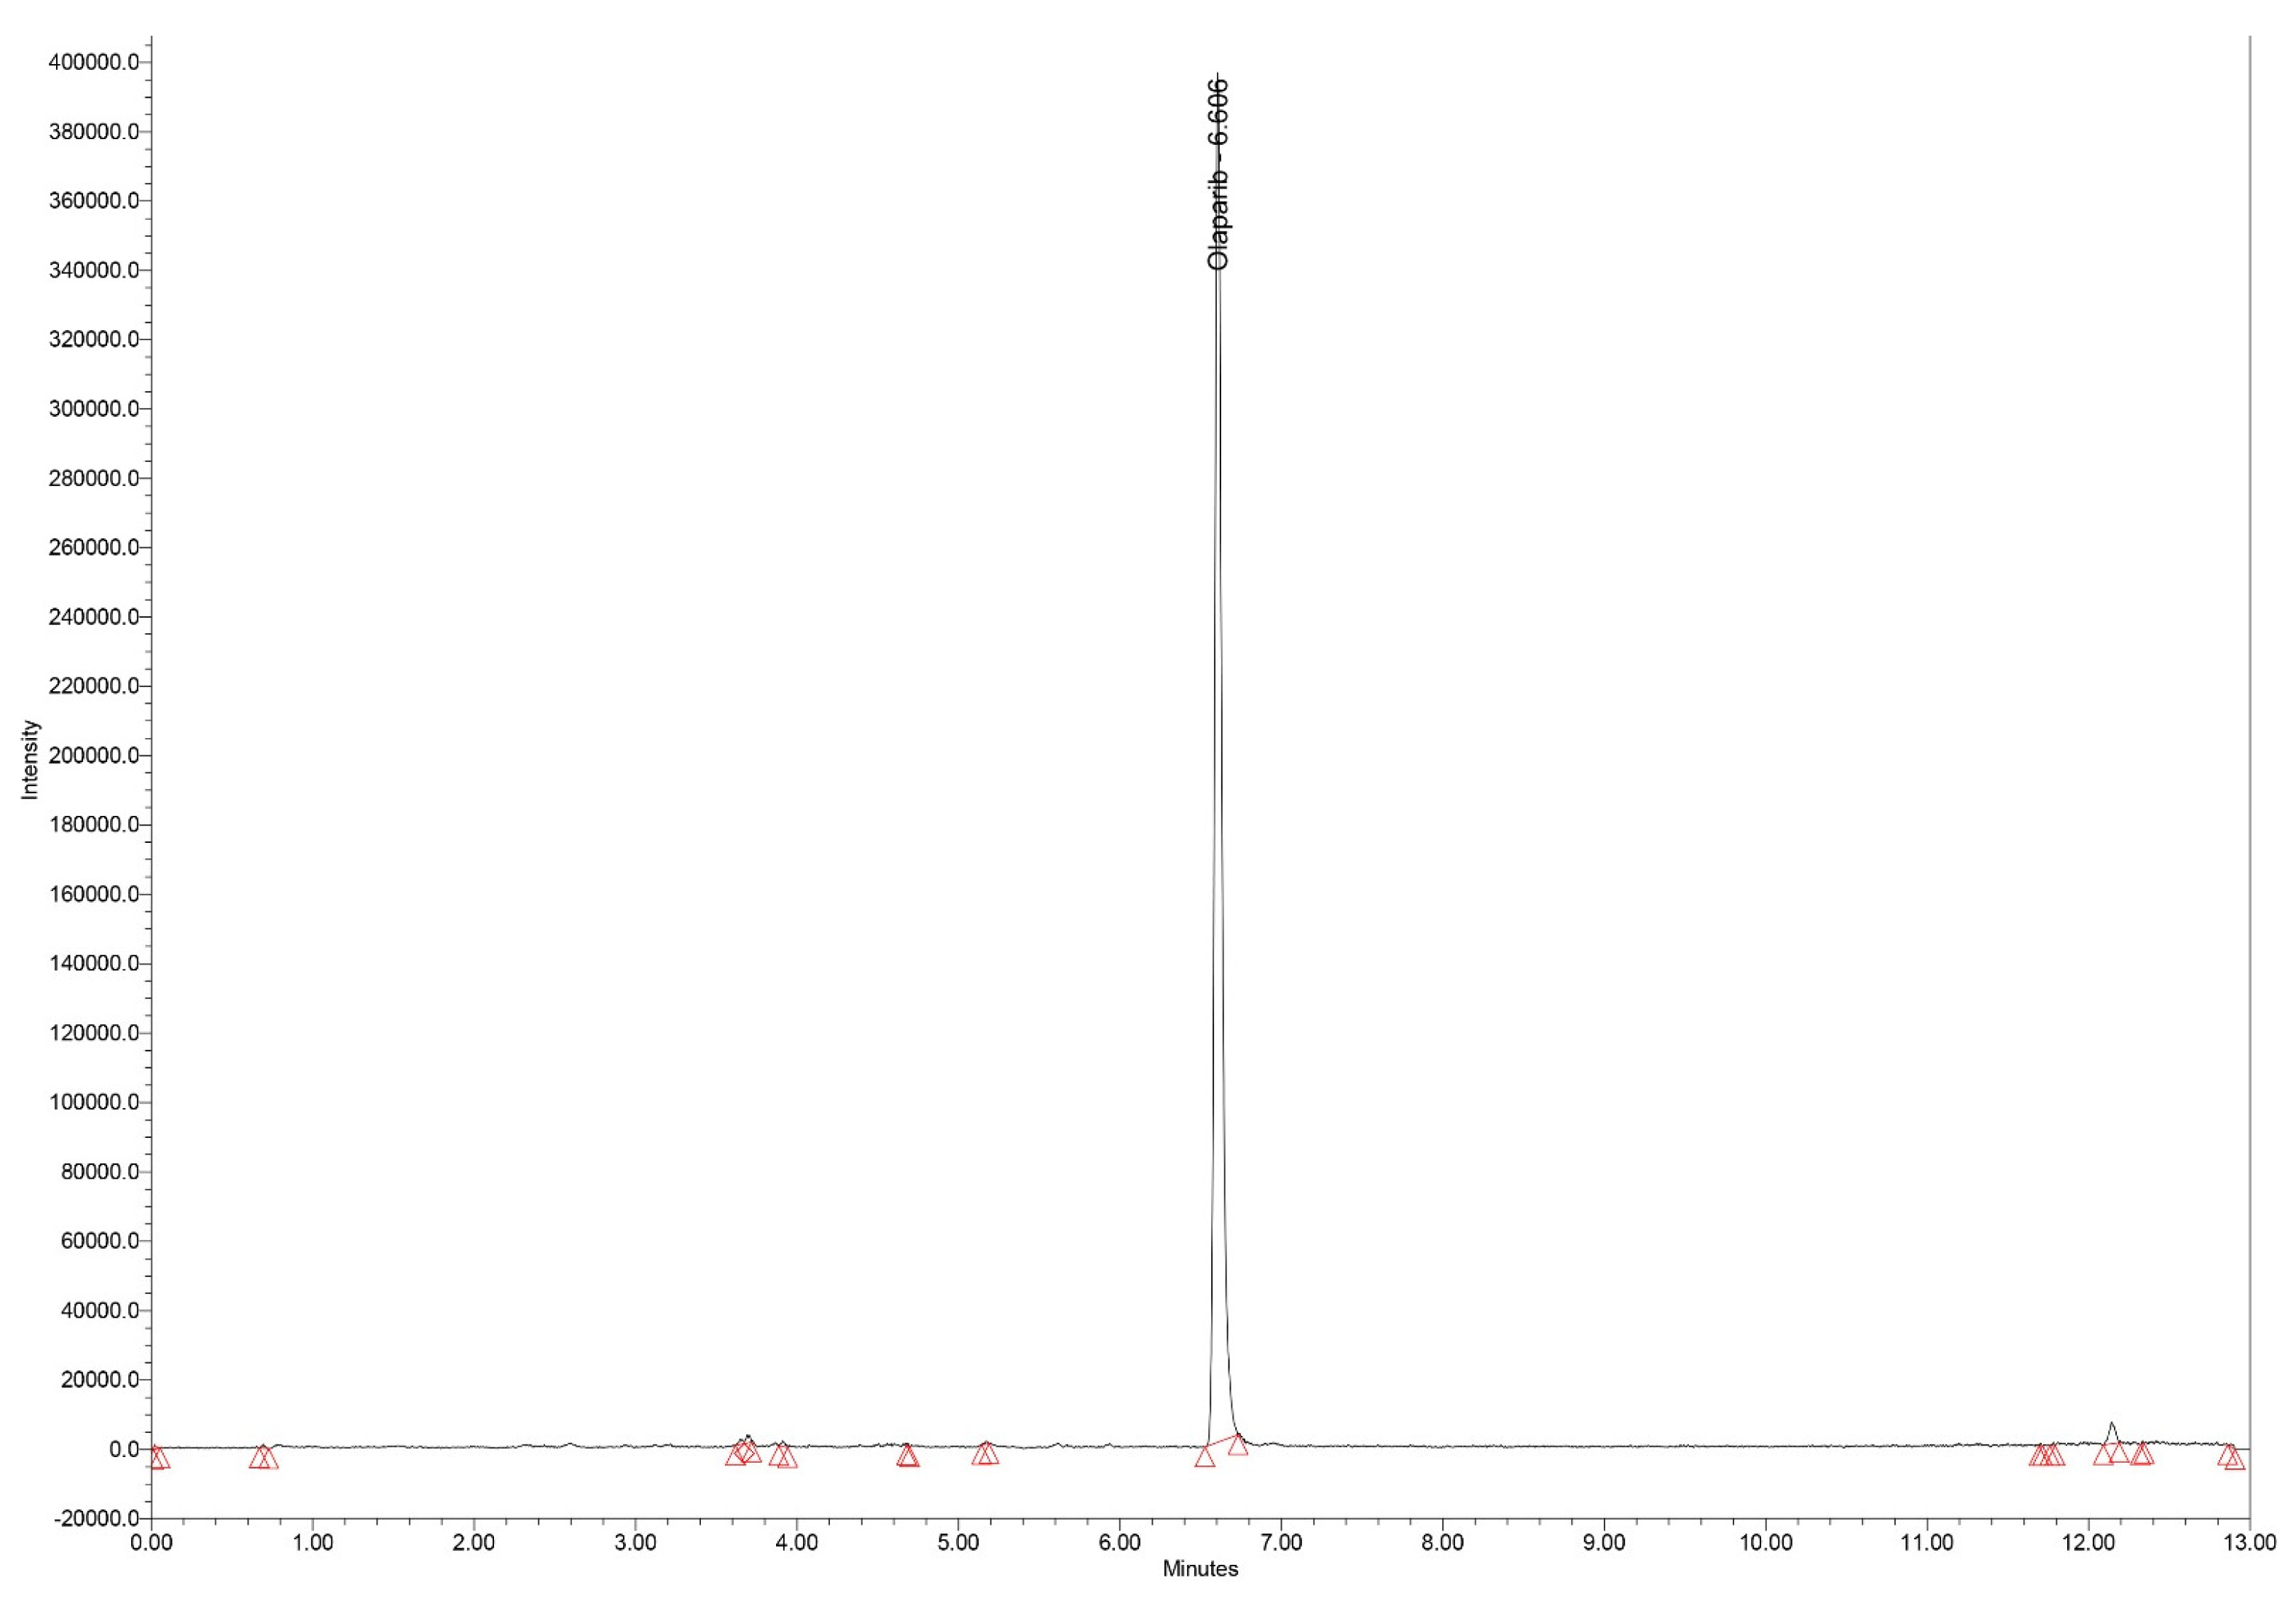
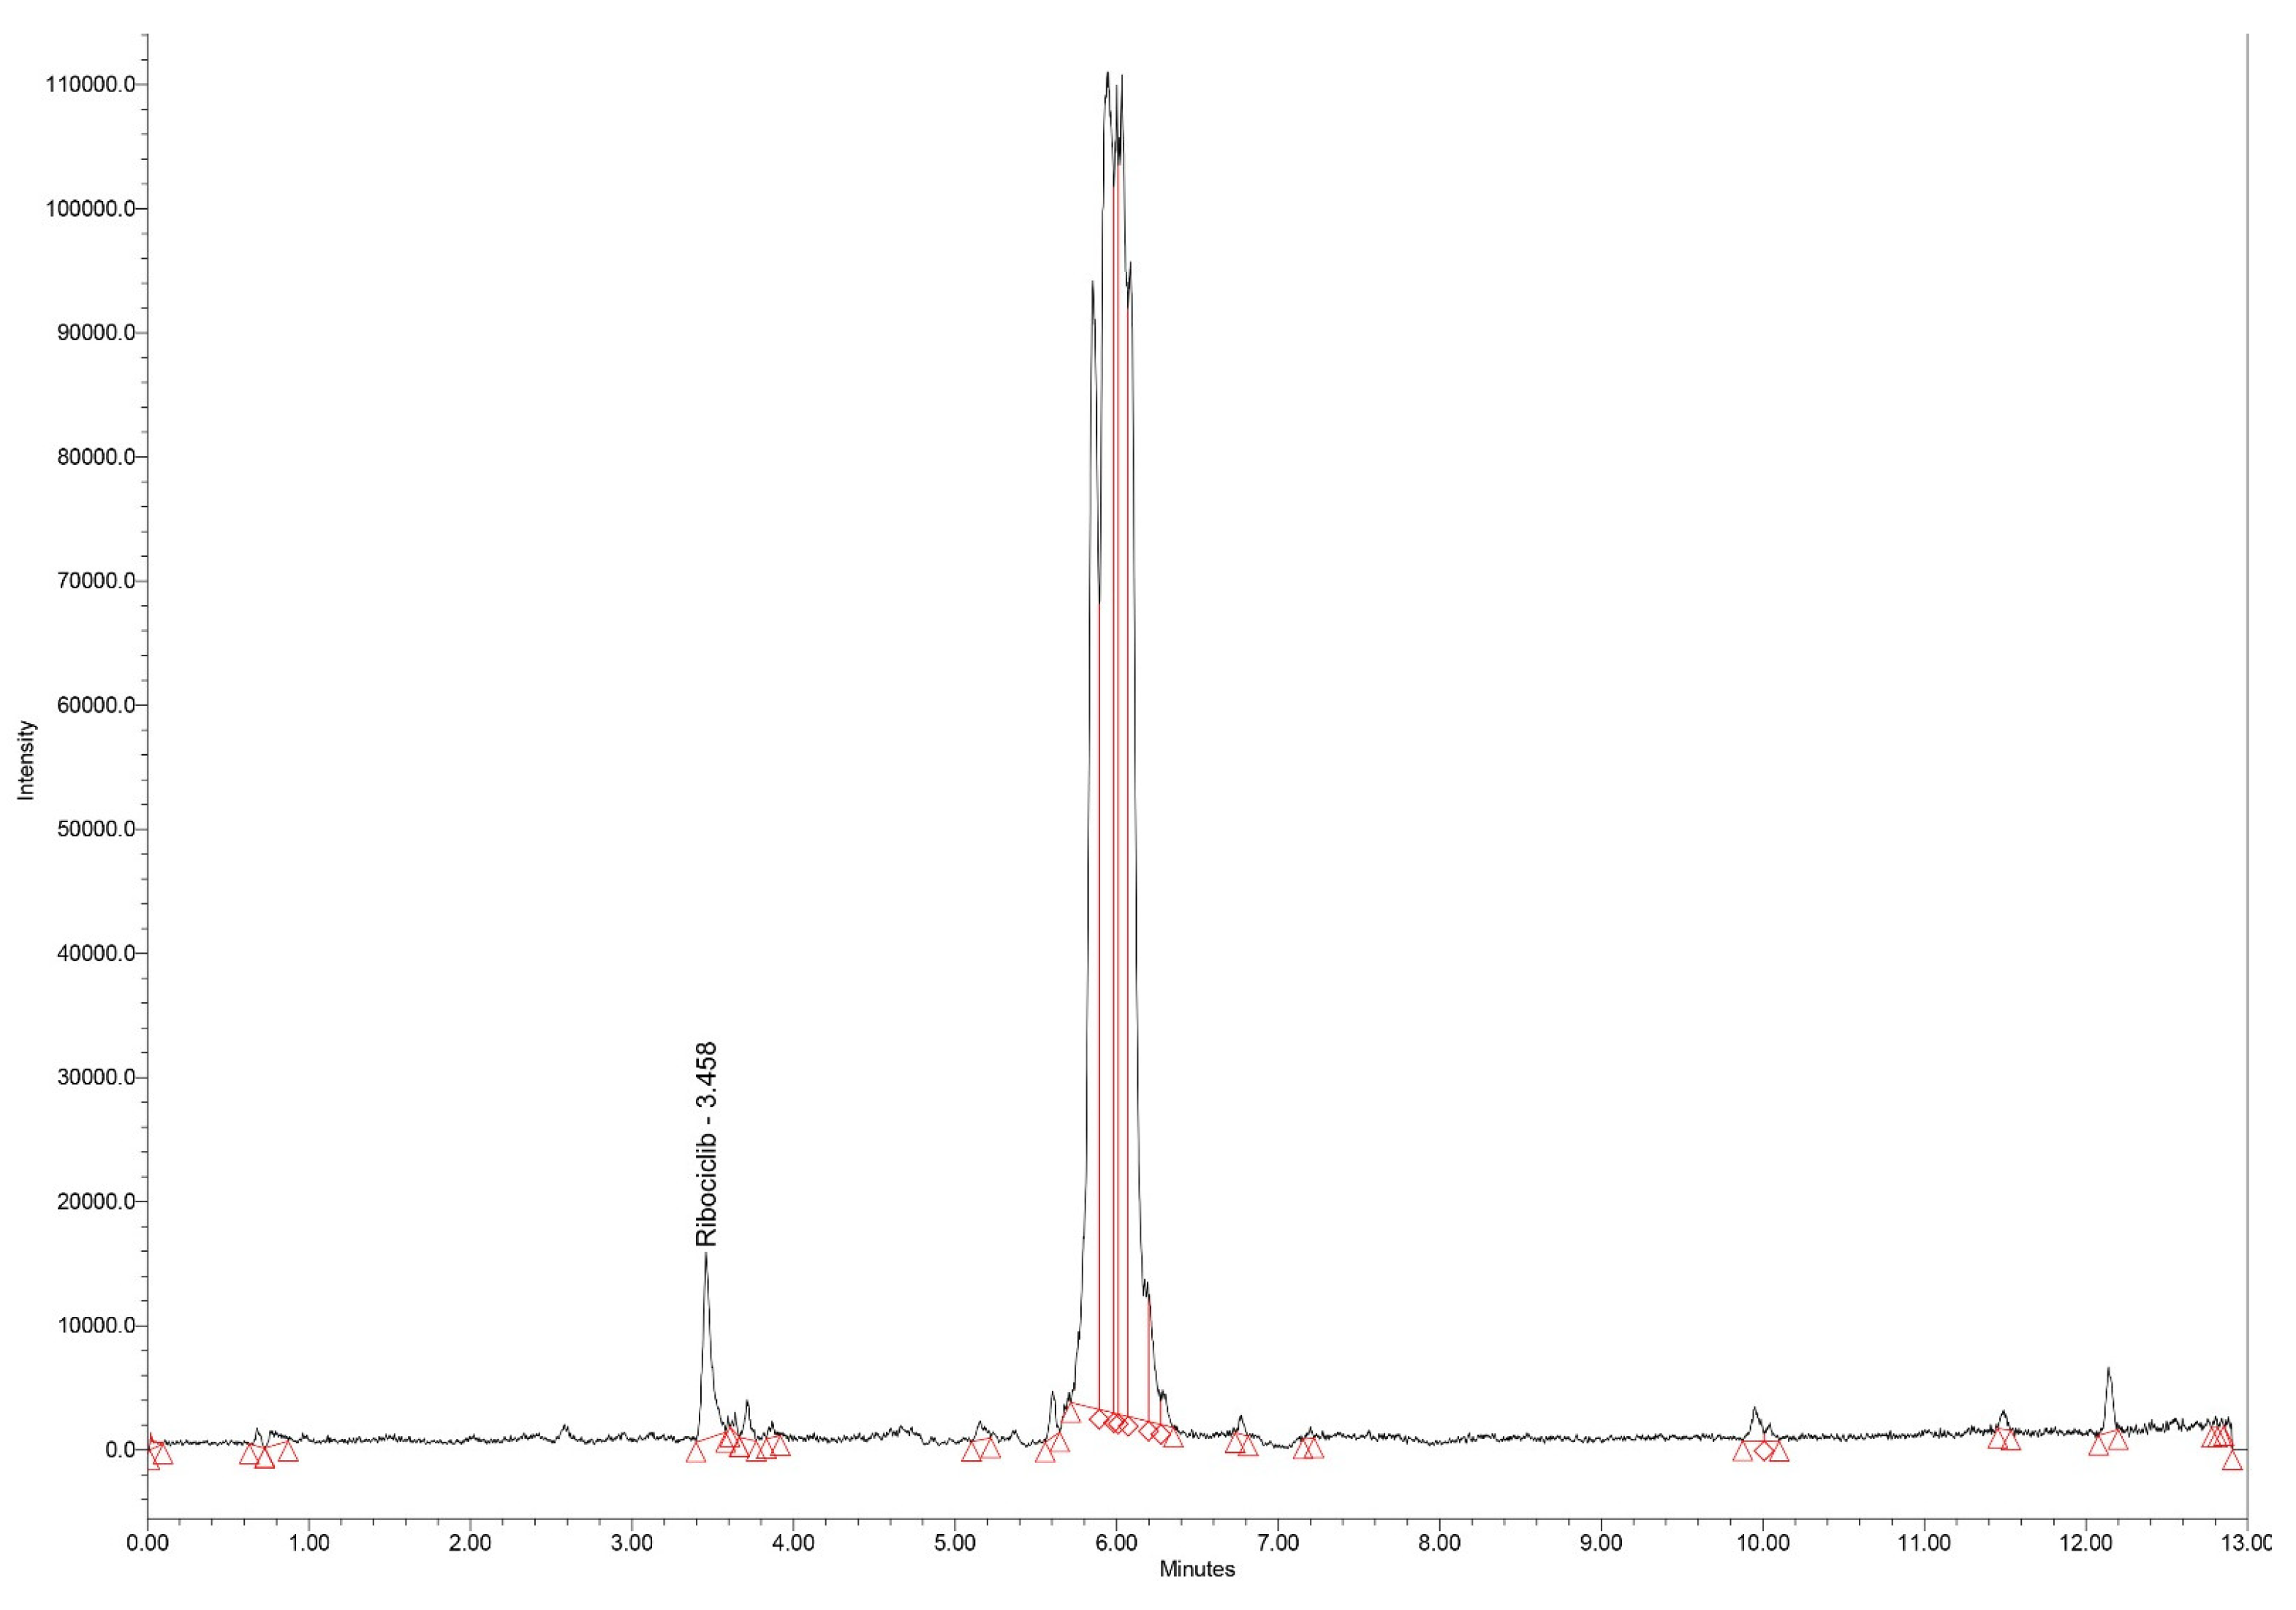
Typical chromatograms of standard samples in SIR mode, for all analytes, with elution times of 6.11, 6.60 and 3.45 min for epirubicin, olaparib and ribociclib, respectively are presented in
Figure 1-3. Identification of all peaks were made by spiking the extracts with corresponding standards before final injection in the analytical column. Selectivity was also investigated. After evaluation of 6 individual sources of serum, peak areas of blank samples were compared with peak areas of spiked samples at Lower Limit of Quantitation (LLOQ) levels of the analytes. No significant increase attributable to unknown compounds in serum was observed. Interference was less than 7% at the LLOQ of each analyte at specified retention times and
m/
z values (544 and 435).
Figure 1.
Chromatogram (SIR mode – m/z 544) for the extract of epirubicin standard serum (50 ng/mL).
Figure 1.
Chromatogram (SIR mode – m/z 544) for the extract of epirubicin standard serum (50 ng/mL).
Figure 2.
Chromatogram (SIR mode – m/z 435) for the extract of spiked olaparib standard serum (1000 ng/mL).
Figure 2.
Chromatogram (SIR mode – m/z 435) for the extract of spiked olaparib standard serum (1000 ng/mL).
Figure 3.
Chromatogram (SIR mode – m/z 435) for the extract of spiked ribociclib standard serum (2000 ng/mL).
Figure 3.
Chromatogram (SIR mode – m/z 435) for the extract of spiked ribociclib standard serum (2000 ng/mL).
Having the same molecular weight, the large chromatographic resolution of olaparib and ribociclib (elution times of 6.60 and 3.45 min, respectively) is important for the specificity of the method.
Evaluation of matrix effect on 3 replicates of low and high Quality Control (QC) samples provided from 6 different serum sources revealed accuracy in the ±15% segment and precision less than 15%.
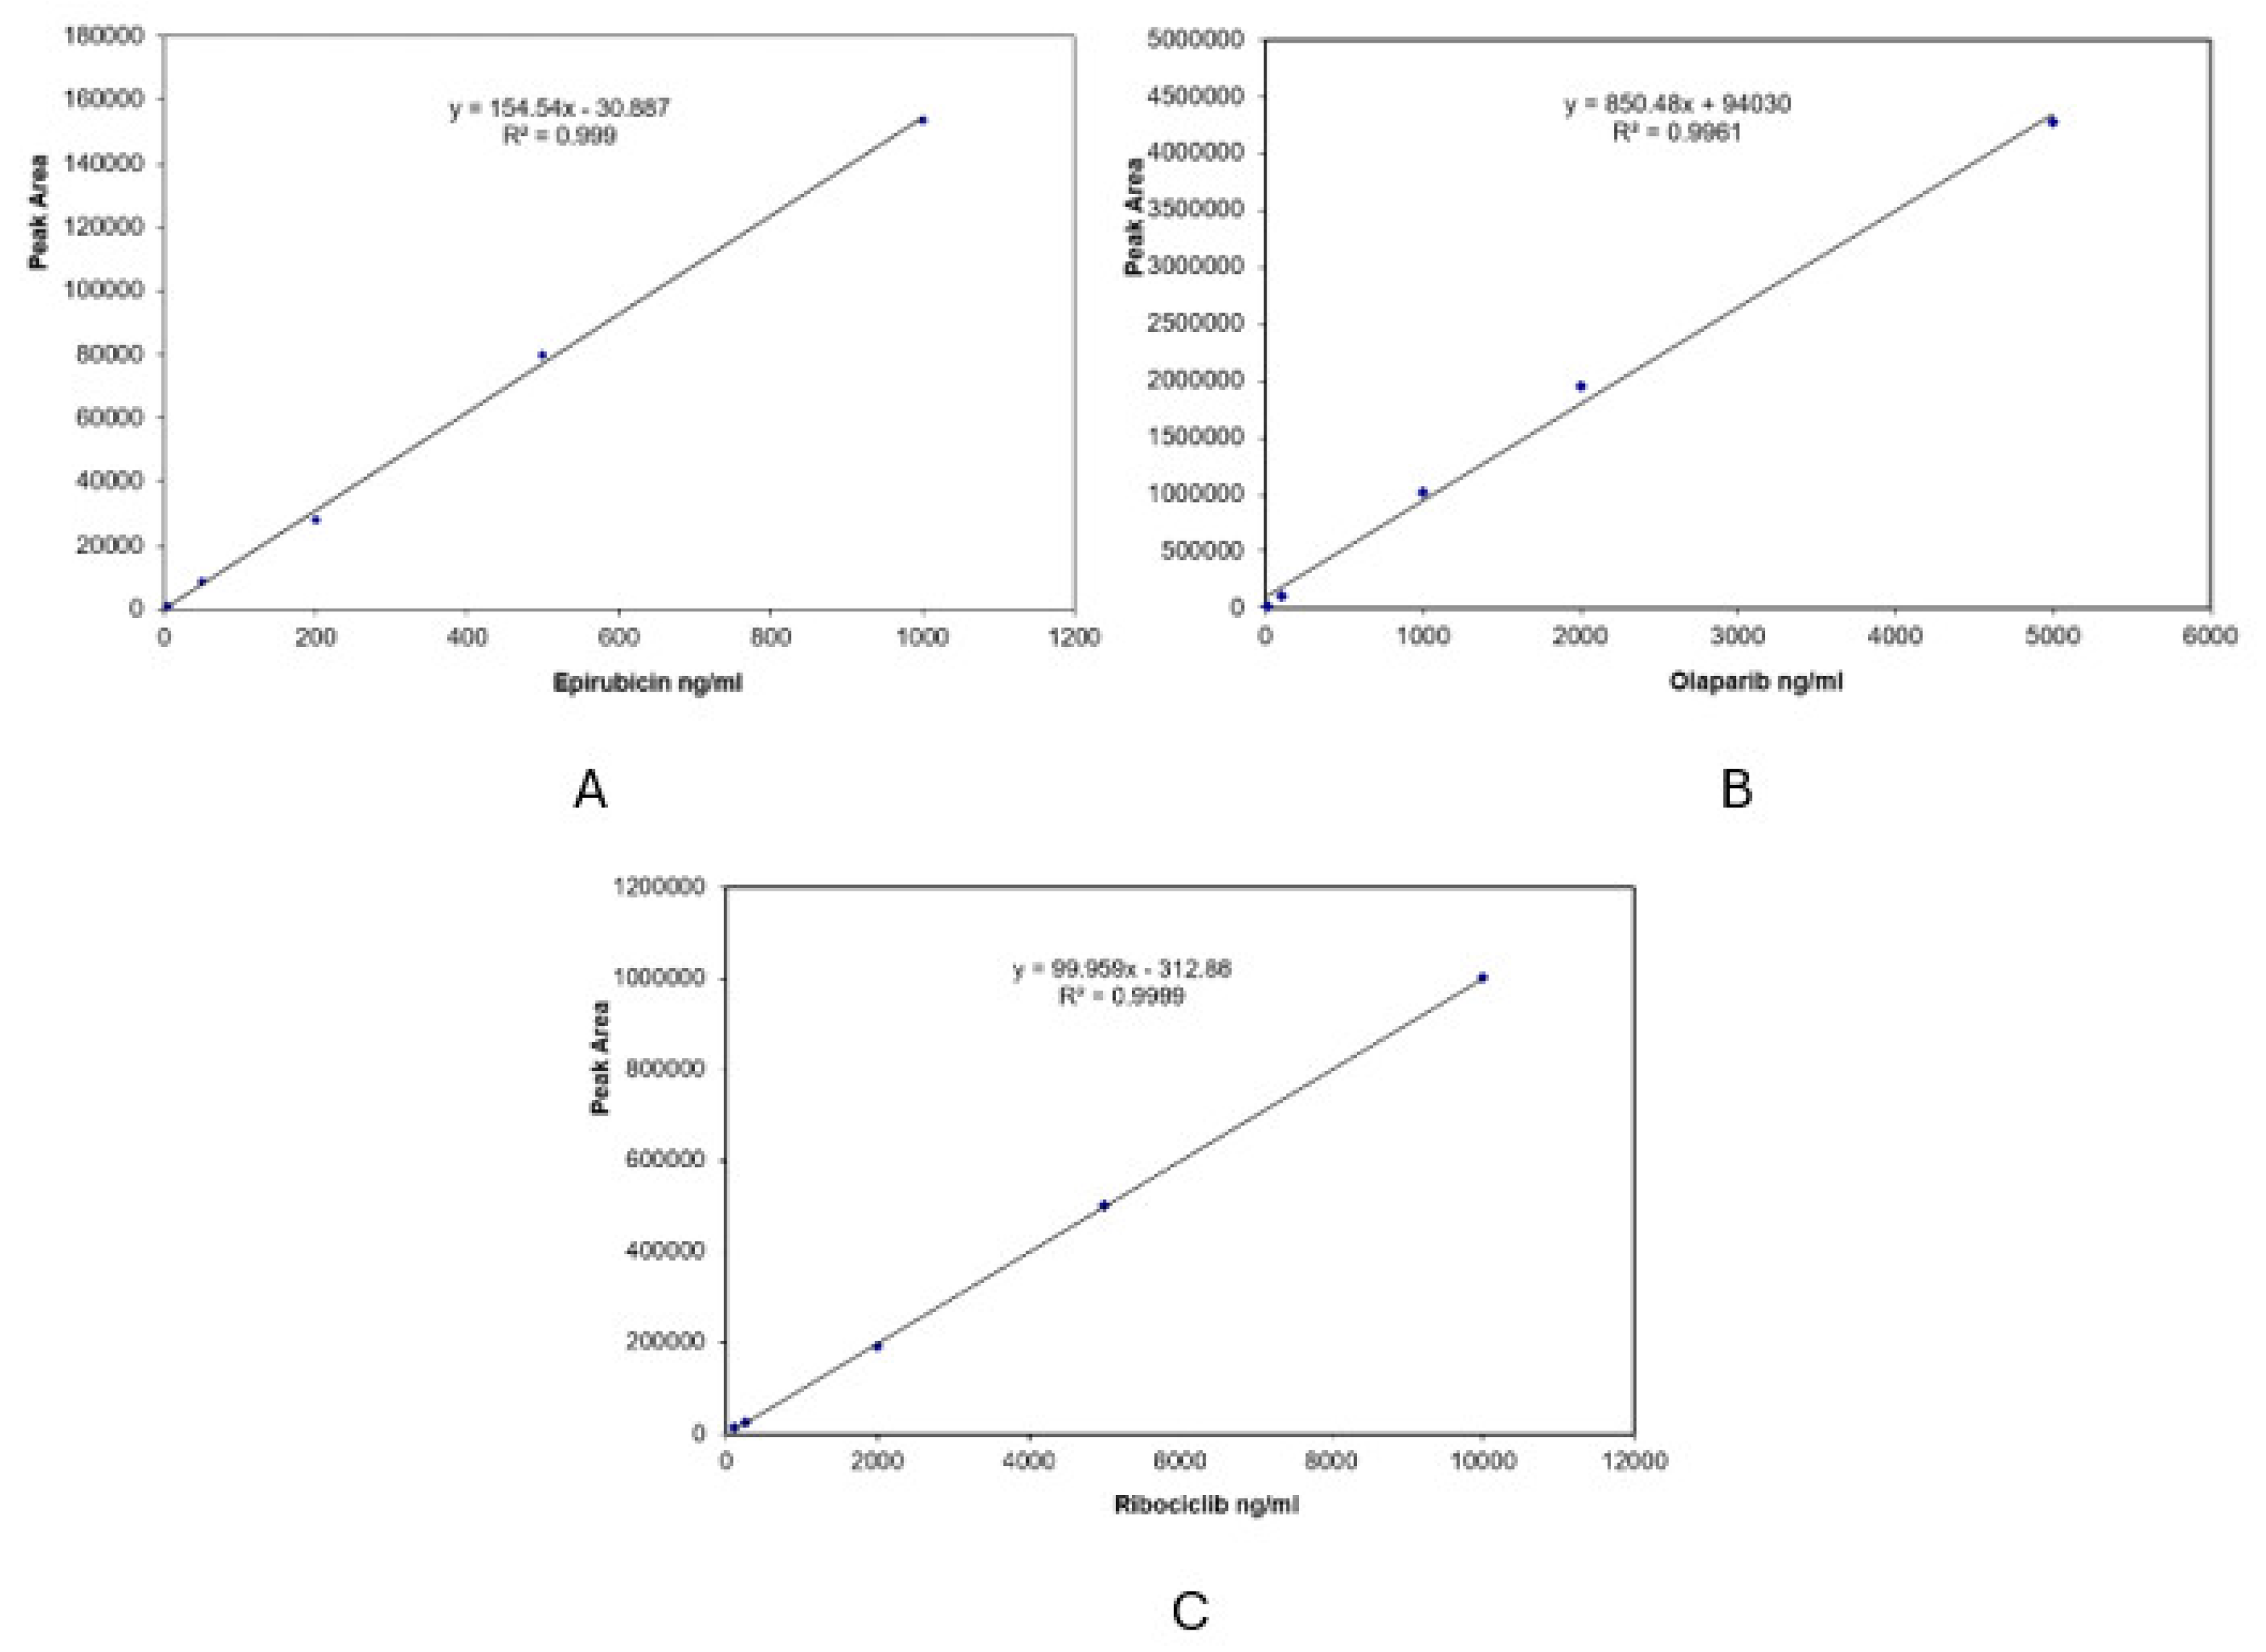
Results for calibration curves (CCs) are presented in
Figure 4. The ordinate axis indicates detector response, represented by the peak area of each analyte; X axis presents nominal serum concentration level. Regression equations with correlation coefficients show the linear response in the selected concentration range.
Figure 4.
Calibration curves, linear regression equations, and correlation coefficients for epirubicin (A), olaparib (B) and ribociclib (C).
Figure 4.
Calibration curves, linear regression equations, and correlation coefficients for epirubicin (A), olaparib (B) and ribociclib (C).
Regarding extraction recovery, results for all molecules and target standard concentrations were more than 84%. Carry-over data were all below 10%. LLOQs were 5, 10 and 100 ng/mL for epirubicin, olaparib and ribociclib, respectively. Stability tests results in the matrix (human serum) are presented in
Table 1. Long-term, freeze–thaw, and room temperature stability were larger than 95% in all cases.
Results for accuracy and precision are represented in
Table 2. Intra- and inter-day precision data were between 4.32 and 8.56%. Accuracy was in the 95-109.20% range.
2.2. Concentration Levels in Real Serum Samples
Linear regression equations presented in
Figure 4 were used to calculate concentration levels of epirubicin, olaparib and ribociclib in real serum patients. Epirubicin levels at 2 hours post-dose, for three different patients were 124.70, 210.50 and 220.13 ng/mL, respectively. For other three patients, calculated values for olaparib serum levels at 10 hours post-dose were 1322.91, 2991.34 and 2764.20 ng/mL. The only sample available for ribociclib revealed a concentration of 547.13 ng/mL, 2 hours post-dose.
3. Discussion
Pre-treatment of blood serum represents an important step when processing a biological sample. Within the development of an analytical method, the assessment of sample preparation process can increase sensitivity and selectivity. The most used method is simple protein precipitation, usually using an organic solvent, which produces a supernatant with low compatibility with all types of MS detectors. Liquid-liquid extraction (LLE) is used less nowadays because it is tedious and generates large quantities of residual solvents. Considering all the facts previously presented, after proper research in the literature, we concluded that sample preparation by SPE using Oasis PRiME® HLB cartridges (Waters, Bucharest, Romania) is the best choice. These cartridges contain a water-wettable hydrophilic polymer which makes them capable of interactions with slightly polar compounds. The method in this case is based on a very simple working protocol. By skipping the conditioning and equilibration steps, solvent consumption is reduced and also time analysis is significantly decreased. The producer of these cartridges recommends a simple “three step clean-up” protocol which can be slightly modified according to the characteristics of the target analytes within the sample. First step, is represented by applying of an aliquot (100 µL) of sample, using a positive pressure to the cartridge when the analytes are adsorbed to sorbent surface; the second step is the washing procedure which involves 500 µL solution containing 5% methanol and 95% HPLC water. Finally, the elution is performed by the addition of 500 µL methanol. Manufacturer working protocol proposes the use of acetonitrile in elution step but, in our case, this solvent is not recommended due to low solubility of our analytes, especially CDK inhibitor ribociclib in this solvent. Our preliminary findings revealed around 40% extraction recovery when acetonitrile was used as elution solvent. This final sample extract was obtained by eliminating a large amount of proteins and phospholipids in the washing step with the solution containing 95% aqueous phase, so interference with serum matrix compounds is diminished. Concentration of the final extract solution was needed to enhance sensitivity of the method. Eluting solution was first evaporated in a gentle stream of nitrogen, then redissolved in 50 µL aliquot of mobile phase (initial gradient), generating an additional 10-fold increase in compounds concentration.
Investigation of HPLC parameters was also performed. CORTECS C18 chromatographic column (Waters, Bucharest, Romania) was the choice for separation of the analytes. Regarding the mobile phase, a gradient elution of acetonitrile/formic acid 0.1% aqueous solution produced a proper separation of the three compounds related to the matrix components. Different buffer solutions were tested as mobile phases, but they did not provide better peak shapes or significant modification of retention times. Mobile phase flow rate was set to 0.6 mL/min. Column compartment and autosampler temperatures were adjusted to 30˚C and 20˚C respectively, to obtain best resolution and peak shapes.
Regarding MS conditions, parameters were optimized considering the above mentioned mobile phase. The acidic mobile phase favors positive ionization in mass spectrometry, so positive ionization mode was used. In all MS detection methods, the main goal is to generate the best signal for the analytes of interest. Consequently, both capillary and cone voltage were assessed. In order to achieve the necessary compromise for all analytes, values were set to 0.8 kV for capillary and 25 V for cone voltage.
Data regarding stability tests were all larger than 95% and did not reveal degradation of the analytes, which could occur during stock or sample preparation. Calibration curves were linear with correlation coefficients larger than 0.996). Data for precision (as RSD) was less than 10% (even for LLOQ standards). Accuracy data were in the range 95–109.20% to spiked levels.
This validated method was used for finding of serum drugs levels on real patients. The samples were collected 2 hours after the daily dose for epirubicin and ribociclib and 10 hours for olaparib.
The interindividual variability of epirubicin, olaparib and ribociclib was also stated in other papers [
2,
4,
7,
13,
19]. Variability represents the outcome of complex factors, consisting in intestinal absorption and/or catabolism rates, depending on the izo-enzymes of cytochrome P450, simultaneous intake of food or other drugs (inhibition or induction supported by enzymes) and patient’s adherence to the treatment. Serum levels for real samples were all in the concentration range of each calibration curve, respectively. The large interindividual variability of serum levels for epirubicin, olaparib and ribociclib, especially due to pharmacokinetics, makes TDM appropriate for individual dose adjustment.
4. Materials and Methods
4.1. Materials
Epirubicin and olaparib were provided from Sigma-Aldrich (Taufkirchen, Germany). Ribociclib came from Selleck Chemicals (Houston, USA). Formic acid and LC-MS analytical grade solvents (acetonitrile, water, methanol) were purchased from Merck (Bucharest, Romania). Oasis PRiME HLB
® SPE cartridges were provided from Waters (Romania). Blood Transfusion Center (Craiova, Romania) supplied blank serum samples used in method validation procedures.
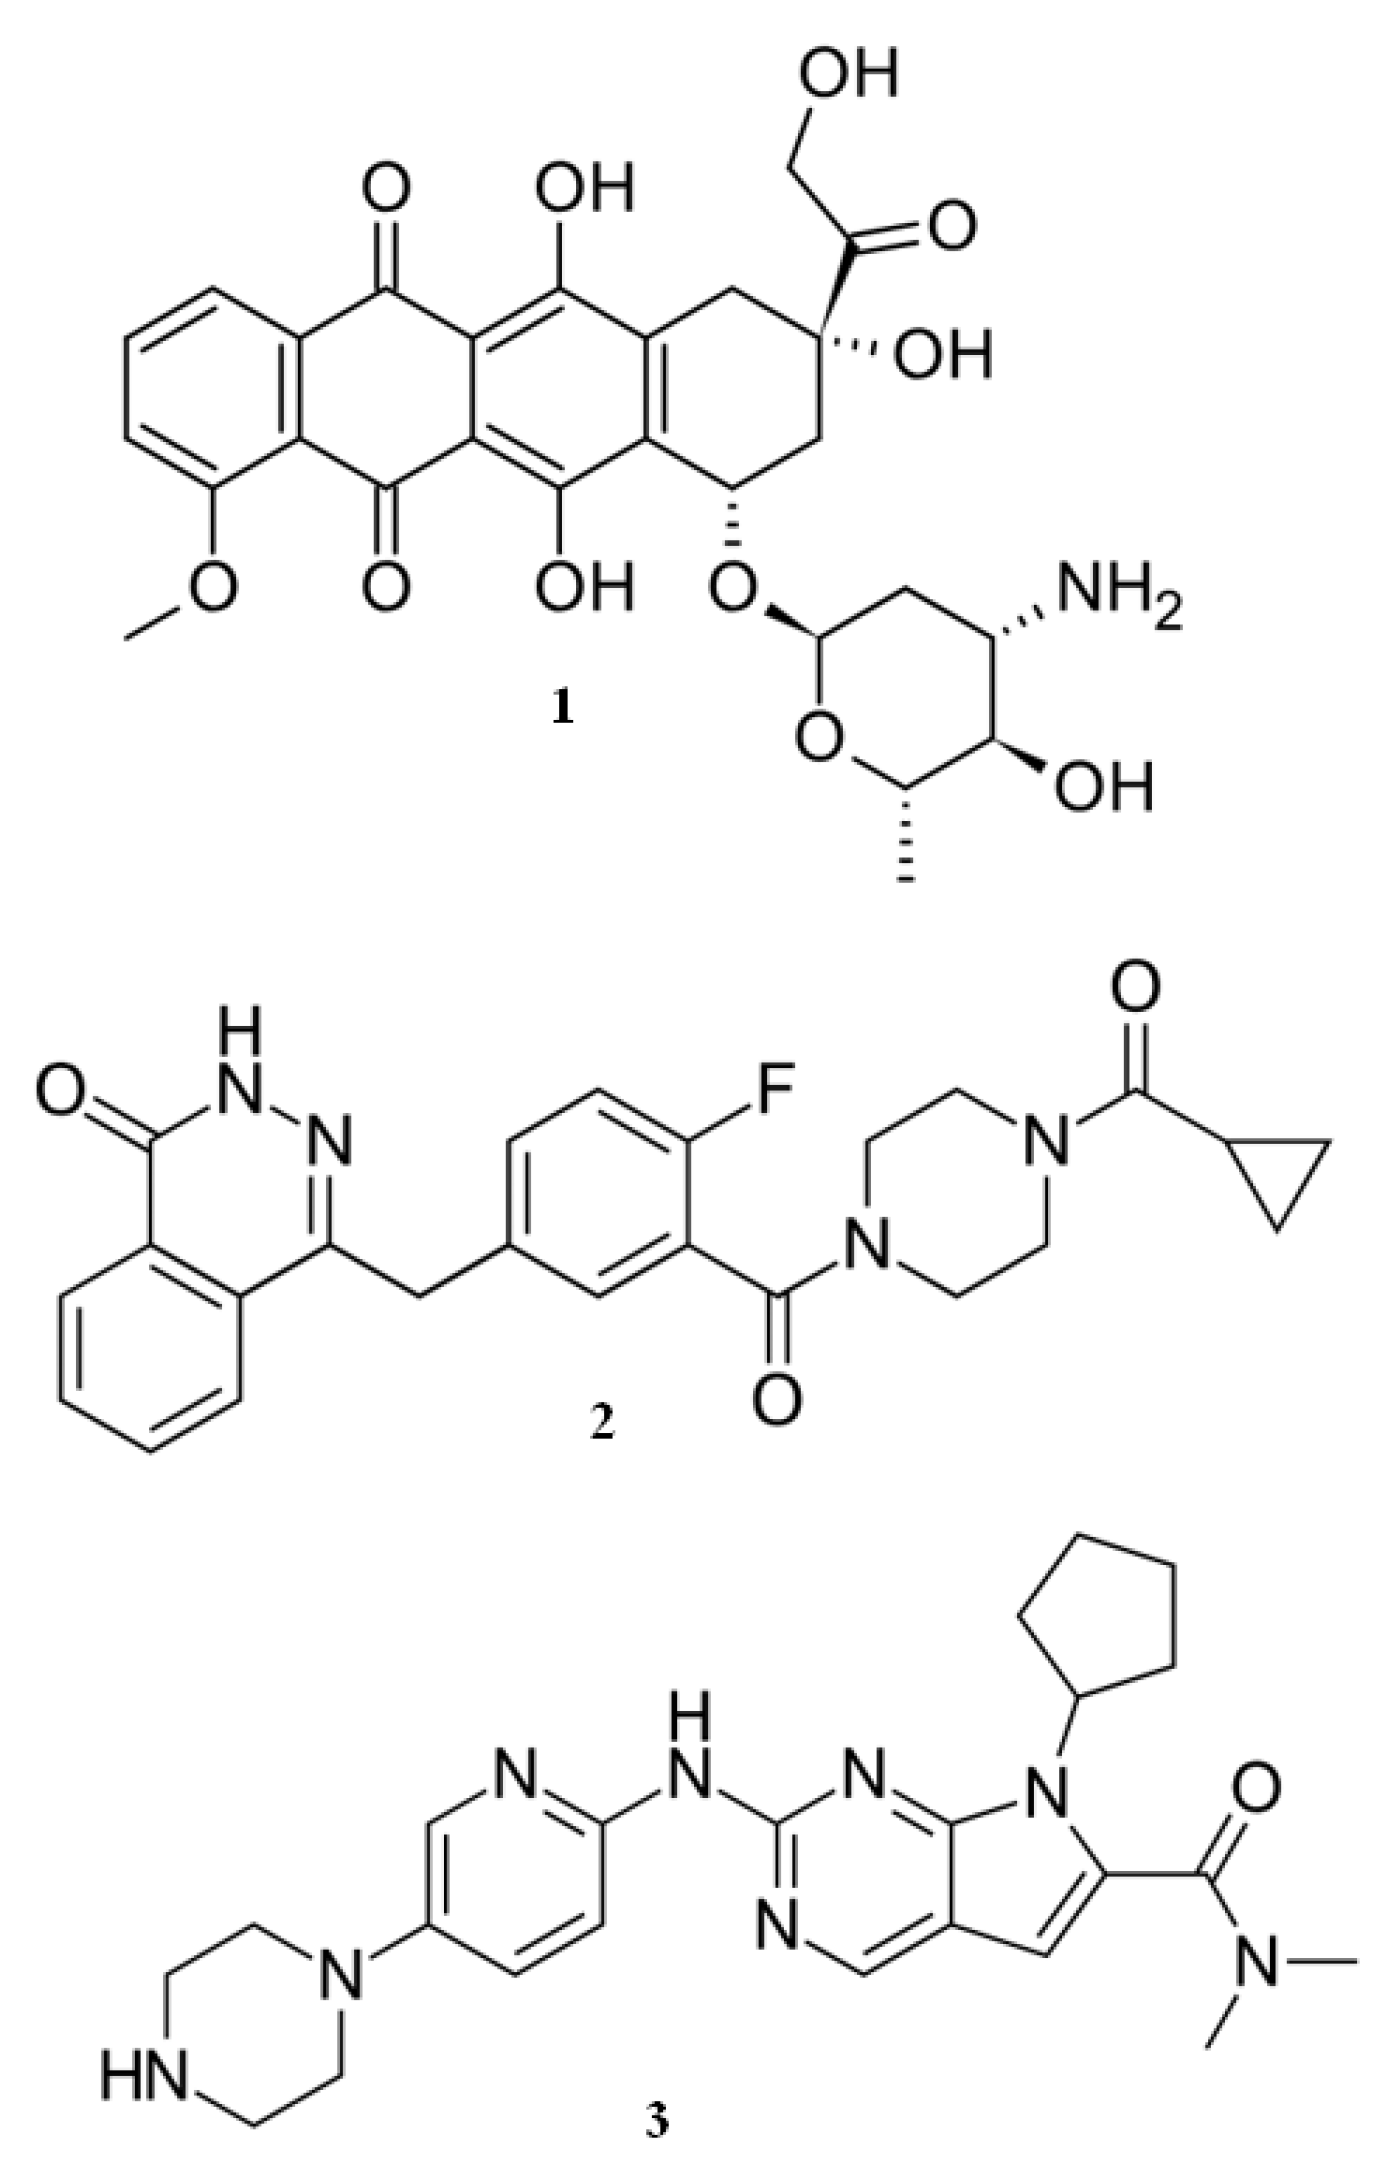
Figure 5 presents the structures of epirubicin, olaparib and ribociclib.
4.2. Methods
4.2.1. HPLC-MS Instruments and Optimized Conditions
Chromatographic analysis implied a Waters (Milford, USA) Arc System and detection was performed by coupling with an ACQUITY QDa Waters mass detector. Waters CORTECS C18 analytical column (4.6 × 50 mm, 2.7 μm particle size) was employed for sample components separation. Two solvent tanks were prepared: solvent A - containing acetonitrile with 0.1% formic acid and solvent B – 0.1% formic acid aqueous solution. A gradient elution was performed: 0-1 min - 10% solvent A and 90% B; then, between 1–10 min, eluent B was increased to 50% and to 70% in 10–12 min time range; solvent B was decreased back to 10% between 12-13 min. Temperature for column compartment was adjusted at 30°C. Final re-dissolved extracts were placed in the autosampler and kept at 20°C while waiting for the analysis. Best mobile phase flow rate was found to be 0.6 mL/min. A 5 μL aliquot was injected in the LC column.
The QDa mass detector mechanism is based on electrospray ionization (ESI) of molecules. Parameters adjustment implied capillary voltage, which was set to 0.8 kV, cone voltage with a value of 25 V. Mass spectra were recorded in positive ion mode (ESI+) in the 100–600 m/z range for epirubicin and 100–500 for olaparib and ribociclib. Quantitative analysis was assessed in SIR mode using protonated molecular ions at m/z 544 in case of epirubicin and m/z 435 for the other two compounds. Method settings and data processing was controlled using EmPower 3 software.
4.2.2. Preparation of Standard Solutions
Methanol was used as solvent for preparing standard solutions. Separate stock solutions for each analyte were prepared, by weighing appropriate amounts of standard substances, to get the concentration of 1 mg/mL. Stock solutions were mixed to obtain adequate working solutions by dilution with methanol, to obtain final solutions to be added to blank serum and also to perform validation data. Each level working solution contains a mix of the three analytes in the next concentrations: 0.05, 0.50, 2, 5 and 10 µg/mL for epirubicin; 0.10, 1, 10, 20 and 50 µg/mL for olaparib; 1, 2.50, 20, 50 and 100 µg/mL for ribociclib. Standard solutions were re-prepared every 30 days, if necessary.
4.2.3. Sample Preparation Procedure for Serum Standards and Samples
First, a volume of 10 µL mixed working solution (concentrations presented above) was evaporated with nitrogen in a 2 mL conical ampoule to eliminate methanol and the residue was diluted in 100 µL blank serum. Then, the sample obtained was added to Oasis PRiME HLB SPE cartridges by using overpressure with a syringe. 500 µL aqueous solution with 5% methanol was used in the washing step. Elution step consisted of 500 µL methanol. Resulting solution was evaporated to dryness in nitrogen stream and an aliquot of 50 µL solution consisting of the initial composition of the mobile phase: acetonitrile/formic acid (0.1%), 10:90 (v/v) (10% organic phase) was added. Reconstituted solution was placed in the autosampler. 5 µL were injected in the chromatographic column.
4.2.4. Validation Data
Investigations regarding validation parameters were assessed according to International Council for Harmonisation (ICH) guidelines. Determining selectivity was performed on 6 different individual serum sources, non-lipaemic and non-haemolysed, by comparing responses of interfering compounds with responses of spiked analytes at LLOQ levels. Interfering molecules should not represent more than 20% of the LLOQ peak signal.
Matrix effect is due to the unidentified compounds in serum samples which can modify the signal response. Investigation was performed on 3 replicates of lowest and highest points of the CC, provided from 5 different sources. Accuracy should be in 85-115% range and precision no more than 15%.
Classic calibration curves were traced by plotting the peak areas against the concentration of each analyte with the linear model. Five calibration levels were prepared and also five injections were made for each level. Finding LLOQ corresponds to the criteria that accuracy would be no larger than ±20%. For higher levels, ±15% accuracy would be admitted.
Extraction recovery was calculated as the percentage ratio between peak area of the analyte processed according to SPE procedure and peak area of the same analyte, in the same concentration but directly introduced in LC system. At least 80% values would be acceptable.
ICH Guidelines states that stability of analytes in the matrix must be investigated. Long-term stability was carried out by keeping samples for 30 days at −20°C (n=5); freeze–thaw stability of the analytes in serum was evaluated by performing three freeze-thaw cycles (n = 5). Room temperature stability (at 20°C) was assessed for 12 h (n = 5) to investigate possible decomposition of analytes during SPE procedure or by staying in autosampler, waiting for injection in LC column.
Accuracy and precision were evaluated for all five CC levels of each analyte. A ±15% value, both for accuracy and precision is mandatory for all concentration levels and a maximum of ±20% is accepted for LLOQ level (n=5). To avoid bias problems, working solutions were prepared from different stock solutions.
Carry-over effect is mandatory within MS detection methods. It was determined by analyzing a blank serum sample after the injection of the analytes in the highest level of the CC. Peak areas resulted for all blank samples should not exceed 20% compared to LLOQ peak areas. To avoid further interferences, autosampler needle injection was cleaned-up (ten times) with the initial percentage ratio of the mobile phase after if previously, high concentration levels of the analytes were injected.
4.2.5. Serum Samples Quantification
Patients have written the informed consent about acquisition of blood. The method was applied to real serum samples; epirubicin blood samples were collected 2h post-dose from three patients treated with 145 mg epirubicin (Epirubicină Teva, 2mg/mL); samples for olaparib were collected 10 h post-administration of a 300 mg dose, from three patients undergoing treatment with Lynparza® 150 mg ribociclib was determined in the serum obtained from one patient treated with a 600 mg dose, two hours after up-taking the drug (Kisqali® 200 mg). In all cases, 2 mL venous blood was collected into a vacutainer which was then centrifuged at 10,000 rpm for 5 min. When serum was not immediately analyzed, samples were frozen at −20°C. Before analysis, frozen samples were thawed at 20°C and extracted like sample preparation procedure states.
5. Conclusions
A validated chromatographic method with simple MS detection was developed for quantification of three different class anti-cancer molecules in human serum. 100 µL human serum was necessary for sample preparation. The SPE technique produced proper “sample clean-up” with low chromatographic base-line “noise” and, therefore, high sensitivity for all compounds. Epirubicin, olaparib and ribociclib concentrations were determined in the serum of seven patients up-taking the drugs. Innovation of this approach is represented by the three steps SPE procedure, but also the simple MS detection, accessible to regular clinics. Full validation makes this method appropriate for quantification of the analytes in human serum.
Author Contributions
Project administration, O.C. and M.D.E.P.; conceptualization, M.D.E.P., D.M.C., and C.-V.M.; methodology, O.C., C.-V.M. and A.B.; formal analysis, J.N., S.-D.N. and A.M.G..; investigation, C.V.M., A.B. and M.D.E.P.; writing—original draft preparation, C.-V.M. and M.D.E.P.; writing—review and editing, O.C., S.-D.N. and C.-V.M.; supervision, J.N. and D.M.C.; resources, S.-D.N. All authors have read and agreed to the published version of the manuscript.
Funding
The Article Processing Charges were funded by the University of Medicine and Pharmacy of Craiova, Romania.
Institutional Review Board Statement
The study was conducted in accordance with the Declaration of Helsinki.
Informed Consent Statement
Informed consent was obtained from the patients involved in our study. Informed consent has also been obtained from all subjects which agreed to publish this paper.
Data Availability Statement
Not applicable.
Conflicts of Interest
The authors declare no conflicts of interest.
References
- Yamaguchi, N.; Fujii, T.; Aoi, S.; Kozuch, S.P.; Hortobagyi, G.N.; Blum, R.H. Comparison of cardiac events associated with liposomal doxorubicin, epirubicin and doxorubicin in breast cancer: a Bayesian network meta-analysis. Eur. J. Cancer. 2015, 51, 2314–2320. [Google Scholar] [CrossRef] [PubMed]
- Maudens, K.E.; Stove, C.P.; Cocquyt, V.F.J.; Denys, H.; Lambert, W.E. Development and validation of a liquid chromatographic method for the simultaneous determination of four anthracyclines and their respective 13-S-dihydro metabolites in plasma and saliva. J. Chromatogr. B. Analyt. Technol. Biomed. Life Sci. 2009, 877, 3907–3915. [Google Scholar] [CrossRef] [PubMed]
- Shin, D.H.; Park, S.H.; Kwon, O.S.; Park, C.W.; Han, K.; Chung, Y.B. Validation of high-performance liqid chromatography method to determine epirubicin and its pharmacokinetics after intravenous bolus administration in rats. J. Pharm. Investig. 2013, 43, 243–249. [Google Scholar] [CrossRef]
- Treder, N.; Maliszewska, O.; Olędzka, I.; Kowalski, P.; Miękus, N.; Bączek, T.; Bień, E.; Krawczyk, M.A.; Adamkiewicz-Drożynska, E. Development and validation of a high-performance liquid chromatographic method with a fluorescence detector for the analysis of epirubicin in human urine and plasma, and its application in drug monitoring. J. Chromatogr. B. 2020, 1136, 121910. [Google Scholar] [CrossRef] [PubMed]
- Li, R.; Dong, L.; Huang, J. Hydrophilic interaction chromatographic determination of epirubicin in human plasma using solid phase extraction for sample clean-up. J. Liq. Chromatogr. Relat. Technol. 2007, 30, 2409–2418. [Google Scholar] [CrossRef]
- Bermingham, S.; O’Connor, R.; Regan, F.; McMahon, G.P. Simultaneous determination of anthracyclines and taxanes in human serum using online sample extraction coupled to high performance liquid chromatography with UV detection. J. Sep. Sci. 2010, 33, 1571–1579. [Google Scholar] [CrossRef] [PubMed]
- Ricciarello, R.; Pichini, S.; Pacifici, R.; Altieri, I; Pellegrini, M.; Fattorossi, A.; Zuccaro, P. ; Fattorossi, A.; Zuccaro, P. Simultaneous determination of epirubicin, doxorubicin and their principal metabolites in human plasma by high-performance liquid chromatography and electrochemical detection. J. Chromatogr. B. 1998, 707, 219–225. [Google Scholar] [CrossRef] [PubMed]
- Sottani, C.; Leoni, E.; Porro, B.; Montagna, B; Amatu, A.; Sottetetti, F.; Quaretti, P.; Poggi, G.; Minoia, C. Validation of an LC–MS/MS method for the determination of epirubicin in human serum of patients undergoing Drug Eluting Microsphere-Transarterial Chemoembolization (DEM-TACE). J. Chromatogr. B. Anal. Technol. Biomed. Life Sci. 2009, 877, 3543–3548. [Google Scholar] [CrossRef] [PubMed]
- Sottani, C.; Rinaldi, P.; Leoni, E.; Poggi, G; Minoia, A.D.; Minoia, C.M. Simultaneous determination of cyclophosphamide, ifosfamide, doxorubicin, epirubicin and daunorubicin in human urine using high-performance liquid chromatography/electrospray ionization tandem mass spectrometry: bioanalytical method validation. Rapid. Commun. Mass Spectrom. 2008, 22, 2645–2659. [Google Scholar] [CrossRef] [PubMed]
- Fabrizi, G.; Fioretti, M.; Mainero Rocca, L. Dispersive solid-phase extraction procedure coupled to UPLC-ESI-MS/MS analysis for the simultaneous determination of thirteen cytotoxic drugs in human urine. Biomed. Chromatogr. 2016, 30, 1297–1308. [Google Scholar] [CrossRef] [PubMed]
- Deeks, E.D. Olaparib: first global approval. Drugs 2015, 75, 231–240. [Google Scholar] [CrossRef] [PubMed]
- Durmus, S.; Sparidans, R.W.; Van Esch, A.; Wagenaar, E.; Beijnen, J.H.; Schinkel, A.H. Breast cancer resistance protein (BCRP/ABCG2) and P-glycoprotein (P-GP/ABCB1) restrict oral availability and brain accumulation of the PARP inhibitor rucaparib (AG-014699). Pharm. Res. 2015, 32, 37–46. [Google Scholar] [CrossRef] [PubMed]
- Sparidans, R.W.; Durmus, S.; Schinkel, A.H.; Schellens, J.H.; Beijnen, J.H. Liquid chromatography-tandem mass spectrometric assay for the PARP inhibitor rucaparib in plasma. J. Pharm. Biomed. Anal. 2014, 88, 626–629. [Google Scholar] [CrossRef] [PubMed]
- Daumar, P.; Dufour, R.; Dubois, C.; Penault-Llorca, F.; Bamdad, M.; Mounetou, E. Development and validation of a high-performance liquid chromatography method for the quantitation of intracellular PARP inhibitor Olaparib in cancer cells. J. Pharm. Biomed. Anal. 2018, 152, 74–80. [Google Scholar] [CrossRef] [PubMed]
- Brasca, M.G.; Amboldi, N.; Ballinari, D.; Cameron, A.; Casale, E.; Cervi, G.; Colombo, M.; Colotta, F.; Croci, V; D’Alessio, R. et al. Identification of N,1,4,4-Tetramethyl-8-{[4-(4-methylpiperazin-1-yl)phenyl]amino}-4,5-dihydro-1H-pyrazolo [4,3-h]quinazoline-3-carboxamide (PHA-848125), a Potent, Orally Available Cyclin Dependent Kinase Inhibitor. J. Med. Chem. 2009, 52, 5152–5163. [Google Scholar] [CrossRef] [PubMed]
- Albanese, C.; Alzani, R.; Amboldi, N.; Avanzi, N.; Ballinari, D.; Brasca, M.G.; Festuccia, C.; Fiorentini, F.; Locatelli, G.; Pastori, W.; et al. Dual Targeting of CDK and Tropomyosin Receptor Kinase Families by the Oral Inhibitor PHA-848125, an Agent with Broad-Spectrum Antitumor Efficacy. Mol. Cancer Ther. 2010, 9, 2243–2254. [Google Scholar] [CrossRef] [PubMed]
- Weiss, G.J.; Hidalgo, M.; Borad, M.J.; Laheru, D.; Tibes, R.; Ramanathan, R.K.; Blaydorn, L.; Jameson, G.; Jimeno, A.; Isaacs, J.D.; et al. Phase I study of the safety, tolerability and pharmacokinetics of PHA-848125AC, a dual tropomyosin receptor kinase A and cyclin-dependent kinase inhibitor, in patients with advanced solid malignancies. Invest. New Drugs 2012, 30, 2334–2343. [Google Scholar] [CrossRef] [PubMed]
- Aspeslagh, S.; Shailubhai, K.; Bahleda, R.; Gazzah, A.; Varga, A.; Hollebecque, A.; Massard, C.; Spreafico, A.; Reni, M.; Soria, J.C. Phase I dose-escalation study of milciclib in combination with gemcitabine in patients with refractory solid tumors. Cancer Chemother. Pharmacol. 2017, 79, 1257–1265. [Google Scholar] [CrossRef] [PubMed]
- Martínez-Chávez, A.; Tibben, M.M.; Broeders, J.; Rosing, H.; Schinkel, A.H.; Beijnen, J.H. Development and validation of an LC-MS/MS method for the quantitative analysis of milciclib in human and mouse plasma, mouse tissue homogenates and tissue culture medium. J. Pharm. Biomed. Anal. 2020, 190, 113516. [Google Scholar] [CrossRef] [PubMed]
|
Disclaimer/Publisher’s Note: The statements, opinions and data contained in all publications are solely those of the individual author(s) and contributor(s) and not of MDPI and/or the editor(s). MDPI and/or the editor(s) disclaim responsibility for any injury to people or property resulting from any ideas, methods, instructions or products referred to in the content. |
© 2024 by the authors. Licensee MDPI, Basel, Switzerland. This article is an open access article distributed under the terms and conditions of the Creative Commons Attribution (CC BY) license (http://creativecommons.org/licenses/by/4.0/).
